Article

Synthesis of Porous Lithium Ion Sieve with High Purity for Li+ Adsorption

School of Metallurgy and Environment, Central South University, Changsha 410083, China
*
Author to whom correspondence should be addressed.
Materials 2025, 18(10), 2373; https://doi.org/10.3390/ma18102373
Submission received: 17 April 2025 / Revised: 15 May 2025 / Accepted: 16 May 2025 / Published: 20 May 2025

Abstract

:
With the depletion of solid lithium ore, extracting lithium from salt lake brine has become a critical focus for future endeavors. A four-step method was used to synthesize high-purity H1.6Mn1.6O4 for extracting Li+. Porous cubic Mn2O3 was hydrothermally synthesized with carbon spheres and surfactants as templates. Then, it was converted to LiMnO2 by calcining with Li2CO3. After roasting and acid pickling, H1.6Mn1.6O4 was successfully synthesized. The impacts of calcination temperature, Li/Mn molar ratio and glucose addition on LiMnO2 composition, loss percentage of dissolved Mn in precursor, and the adsorption characteristics of the lithium ion sieve were studied. Glucose inhibited the formation of LiMn2O4 and promoted the formation of pure LiMnO2. The resulting precursor without impurities showed porous structure. After acid pickling, H1.6Mn1.6O4 showed a high-adsorption performance and excellent cycle performance. After five cycles, adsorption capacity remained above 30 mg/g, and the loss percentage of dissolved Mn stabilized at about 1%. The Li+–H+ exchange conformed to pseudo-second-order adsorption dynamics and the Langmuir adsorption isotherm equation, indicating that the adsorption process can be classified as monolayer chemical adsorption.

1. Introduction

As lithium battery and new energy industries experience rapid growth [1,2,3,4], the demand for lithium in China and the world has soared [5,6,7,8]. The lithium resource in China is generally categorized into solid lithium ore and liquid brine [9,10,11]. Notably, approximately 80% of the total lithium reserve is found in salt lakes [12,13,14]. Due to the exhaustion of solid lithium ore, the extraction and recovery of lithium from salt lake brine has attracted significant attention. At present, several methods are used to separate and extract lithium, including membrane separation [15,16], solvent extraction [17,18,19], and adsorption methods [20,21,22]. Among these, the adsorption method stands out as an ideal and prospective approach due to its excellent separation effect, environmental sustainability, and economic advantages [14]. Compared with other adsorbents, the Mn-based adsorbent has high selectivity for lithium and superior adsorption properties. It typically includes various kinds of lithium ion sieves, such as HMn2O4 [23], H4Mn5O12 [24], and H1.6Mn1.6O4 [25,26]. H1.6Mn1.6O4 is synthesized by roasting LiMnO2 to obtain the precursor Li1.6Mn1.6O4 and then replacing Li+ with H+, resulting in the ion exchange to adsorb Li+ and exhibiting the maximum lithium adsorption capacity. Chitrakar [27] developed and utilized a H1.6Mn1.6O4 adsorbent for recovering lithium from seawater in the initial stages. Hayashi [28] synthesized a H1.6Mn1.6O4 rod with an adsorption capacity of 5.6 mmol g−1. And researchers have also explored the Li+ extraction mechanism [29,30,31]. However, the composition of LiMnO2 and the morphology of Li1.6Mn1.6O4 have great effect on the performance of H1.6Mn1.6O4 [25]. The presence of a small amount of Mn3+ in the precursor could lead to an unstable spinel structure and deterioration in cycling performance due to disproportionation during acid pickling [32].
Adsorbents characterized by numerous different pores structures promote effective adsorption because they expose additional adsorption sites for ion exchange [33]. And the distribution of appropriate pore sizes can effectively reduce the diffusion pathway for Li+, thereby enhancing the overall adsorption performance. Simultaneously, the Mn-based lithium ion sieve with porous structure has a relatively large specific surface area, which is conducive to facilitating Li+ migration and improving the adsorption rate [34,35]. Xu [36] synthesized a lithium ion sieve using attapulgite with a large surface area, which provided an adsorption capacity of 29.18 mg/g. Finally, porous structures feature a large gas channel, which is beneficial to oxygen diffusion and provides thorough contact with the bulk of crystal LiMnO2. As a result, LiMnO2 can be completely oxidized to obtain high-purity Li1.6Mn1.6O4 with traces of Mn3+ [23,25].
In this study, porous Mn2O3 was firstly synthesized by template method. Then, Mn2O3, Li2CO3, and glucose were calcined by carbothermal reduction-assisted solid-phase method [37] to obtain pure LiMnO2. Finally, LiMnO2 was converted to the precursor through roasting, and then, the lithium ion sieve was synthesized after acid pickling.

2. Materials and Methods

2.1. Materials

The reagents C6H12O6, Li2CO3, HCl, and C2H5OH were from Sinopharm Group Chemical Reagent Co., Ltd. (Shanghai, China). The reagents Mn(CH3COO)2, polyvinylpyrrolidone (PVP), and CO(NH2)2 were supplied by Aladdin Industrial Co., Ltd. (Shanghai, China). These were all AR reagents. The salt lake brine was from Lop Nor Lake in the Xinjiang Uygur Autonomous Region of China.

2.2. Methods

2.2.1. Synthesis of Porous Cubic Mn2O3

Firstly, carbon sphere [38] was prepared by hydrothermal treatment of 1 mol/L glucose solution at 200 °C for 24 h. The porous Mn2O3 was synthesized according to the method of Shao Y [39]. Urea CO(NH2)2 as precipitant and Mn(CH3COO)2 as manganese salt were used to hydrothermally synthesize MnCO3/C composites with carbon spheres and surfactant PVP (PVP is a nonionic polymer compound) as templates. Next, 2 g carbon spheres and 10 g PVP were dispersed into water and stirred for 12 h. Then, CO(NH2)2 and Mn(CH3COO)2 were added according to a molar ratio of manganese salt to precipitant of 1:40. After vigorous stirring, the suspension was transferred to an autoclave and hydrothermally reacted at 90 °C for 12 h. MnCO3/C composites were obtained after filtering, washing, and drying. Finally, MnCO3/C was transformed into porous Mn2O3 by calcining at 600 °C for 6 h in a muffle furnace [34].

2.2.2. Synthesis of LiMnO2 and Precursor Li1.6Mn1.6O4

Li2CO3, porous Mn2O3, 5% (equivalent to the mass of Mn2O3) of glucose, and an appropriate amount of anhydrous ethanol were thoroughly ground to fully and evenly mix them. Then, the mixture was calcined in a closed tube furnace with nitrogen blowing at 750 °C for 6 h to obtain LiMnO2. Finally, LiMnO2 was roasted at 450 °C for 6 h to synthesize the precursor Li1.6Mn1.6O4 [40].

2.2.3. Synthesis of Lithium Ion Sieve

A small quantity of Li1.6Mn1.6O4 was added to 0.5 mol/L hydrochloric acid solution. The Mn-based lithium ion sieve was successfully synthesized after acid pickling at 30 °C for 4 h.

2.2.4. Adsorption and Cycling Performance

The lithium ion sieve was put into a certain volume of brine and stirred to facilitate Li+ adsorption. Adsorption capacity (Q) was calculated by following Equation (1):
Q = V ( C 0 C 1 ) m ,
where Q represents the Li+ adsorption capacity of H1.6Mn1.6O4 (mg·g−1); C0 and C1 represent the concentration of Li+ in solution before adsorption and after adsorption, respectively (mg·L−1); V represents the volume of salt lake brine (L); m represents the mass of H1.6Mn1.6O4 (g).
The loss percentage of dissolved Mn (RMn) in acid pickling was calculated by Equation (2):
R Mn = C Mn V m s W ,
where RMn represents the loss percentage of dissolved Mn (%); CMn represents the concentration of Mn2+ in filtrate after acid pickling (mg·L−1); V represents the volume of hydrochloric acid (L); ms represents the mass of the precursor (g); W represents the mass fraction of Mn in the precursor (%).
The acid pickling and adsorption of Li+ were repeated for several times, and then, the cycling performance was determined. In each acid pickling process, the precursor Li1.6Mn1.6O4 was put into 0.5 mol/L hydrochloric acid solution for delithiation. After filtering, washing, and drying, H1.6Mn1.6O4 was transferred into salt lake brine at 30 °C for 24 h to adsorb Li+. These above operations were considered as one complete cycle. After this process, the concentrations of Mn and Li were measured to calculate the loss percentage of dissolved Mn and adsorption capacity in every cycle using Equation (1) and Equation (2), respectively.

2.2.5. Evaluation of Adsorption Selectivity

The adsorption selectivity of H1.6Mn1.6O4 is a crucial indicator under competitive conditions, particularly in the presence of co-existing ions such as Na+ and Mg2+. A small amount of H1.6Mn1.6O4 was put into brine for adsorption. Subsequently, the concentrations of mental ions were measured to calculate the adsorption capacity and distribution coefficient (Kd) as follows:
K d = ( C 0 C 1 ) V m C 1 ,
where Kd represents the distribution coefficient of different ions (mL·g−1); C0 and C1 represent the concentration of ions in solution before adsorption and after adsorption, respectively (mg·L−1); V represents the volume of salt lake brine (L); m represents the mass of H1.6Mn1.6O4 (g);

2.2.6. Evaluation of Adsorption Kinetics

A small amount of H1.6Mn1.6O4 was put into brine at room temperature for certain time and sampled at regular interval to measure the concentration of Li+ for calculating adsorption capacity. The H+–Li+ exchange process was simulated using pseudo-first-order and pseudo-second-order dynamics models and the intraparticle diffusion model, respectively.
The equations of three adsorption kinetics are as follows:
lg ( Q e Q t ) = lg Q e t k 1 2.303 ,
t Q t = 1 k 2 Q e 2 + 1 Q e t ,
and   Q t = K i t 0.5 + C
where Qt represents the adsorption capacity of H1.6Mn1.6O4 at given time (mg·g−1); Qe represents the adsorption capacity of H1.6Mn1.6O4 at equilibrium (mg·g−1); t represents adsorption time (h); k1, k2, and Ki represent the adsorption kinetic rates, respectively; C is the intercept.

2.2.7. Determination of Adsorption Isotherm

A small amount of H1.6Mn1.6O4 was put into LiCl solutions with different concentrations at room temperature for 24 h to adsorb Li+. The adsorption isotherm was simulated using Langmuir and Freundlich models, respectively.
The equations of the two models are as follows:
C e Q e = 1 K L Q m + C e Q m
and   lg Q e = 1 n lg C e + lg K F ,
where Ce represents the Li+ equilibrium concentration (mg·L−1); Qe represents the adsorption capacity of H1.6Mn1.6O4 at equilibrium (mg·g−1); Qm represents the theoretical maximum adsorption capacity of H1.6Mn1.6O4 (mg·g−1); KL and KF represent the adsorption isothermal constants, respectively.

2.2.8. Analysis and Characterization

The concentrations of ions were quantified after acid pickling and adsorption using inductively coupled plasma spectrometer (ICP, Thermo Fisher Scientific, Waltham, MA, USA). Phase composition was analyzed using X-ray diffractometer (XRD, PANalytical B.V., Almelo, The Netherlands). The morphology of the precursor was characterized using scanning electron microscope (SEM, JEOL, Tokyo, Japan).

3. Results

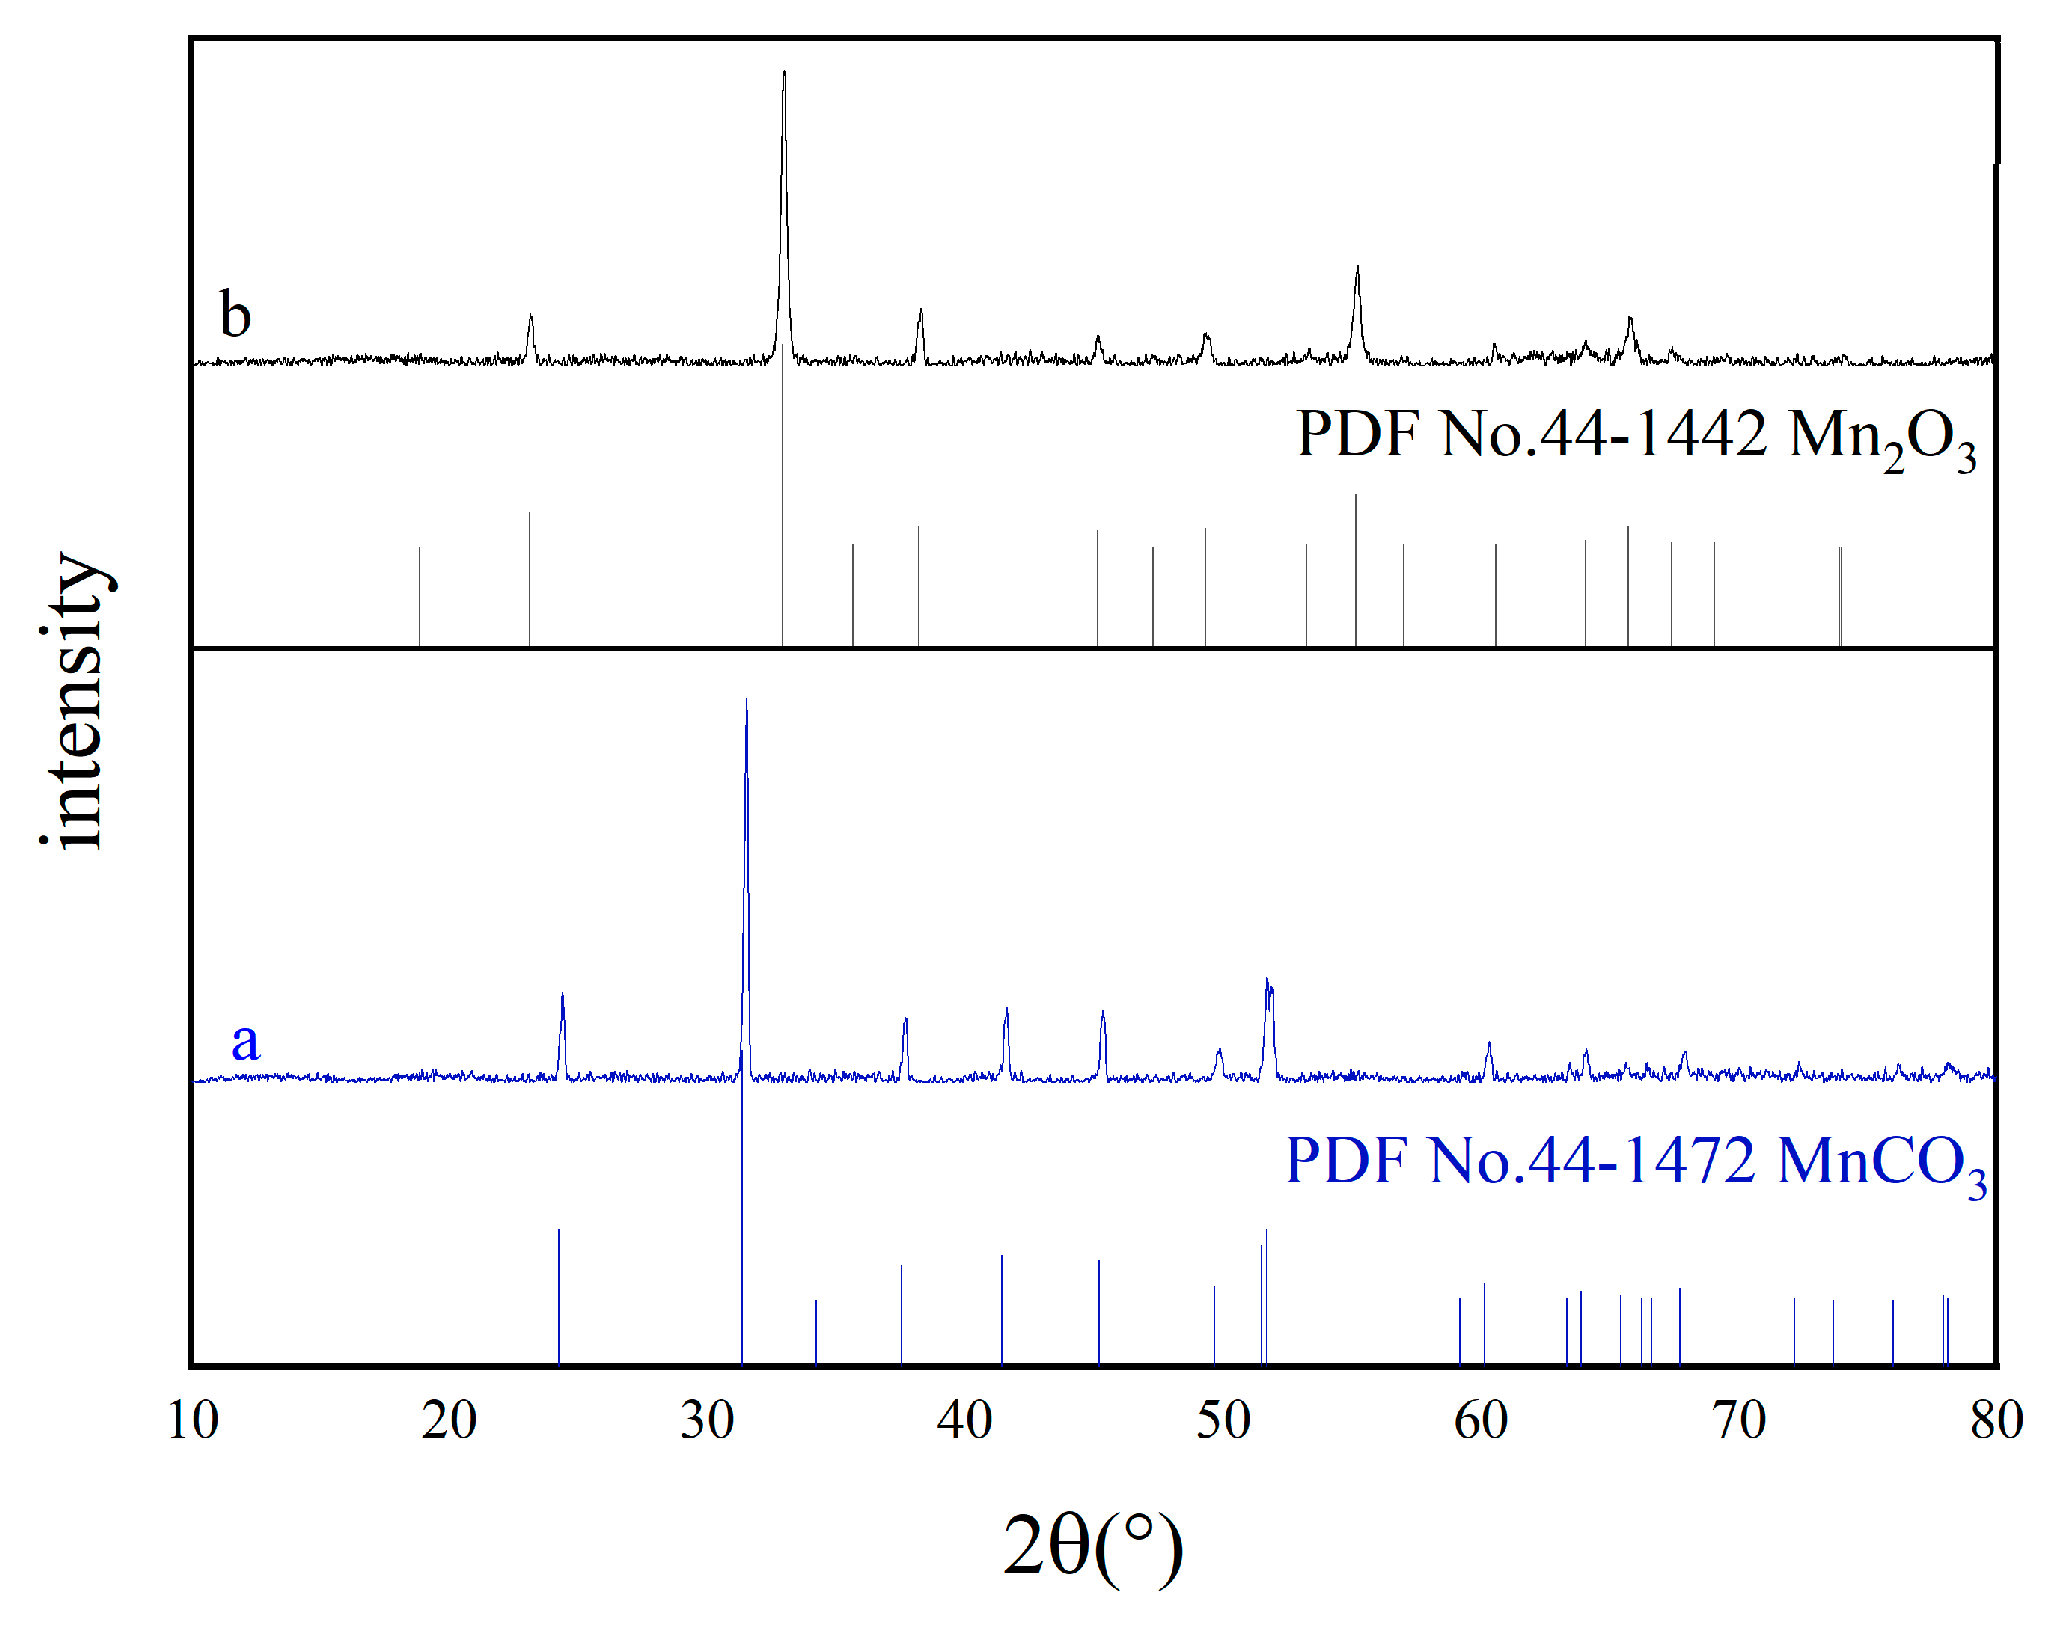
3.1. Properties of Porous Mn2O3

XRD patterns of MnCO3/C and Mn2O3 are presented in Figure 1. Its diffraction peak is very sharp in Figure 1a, which is consistent with MnCO3(PDF NO. 44-1472). There are no carbon and other impurity diffraction peaks. This indicates the synthesized MnCO3 has good crystallinity and purity. The calcined Mn2O3 also shows sharp peaks identified with cubic α-Mn2O3(PDF NO. 24-0508), meaning that it is highly crystalline and pure.
Figure 2 illustrates the morphologies of carbon spheres and cubic Mn2O3. According to the SEM image presented in Figure 2a, it can be observed that carbon spheres are intact and have uniform size ranging from 800 nm to 1.5 μm. From Figure 2b, Mn2O3 maintains a complete cubic shape with size around 6–8 μm. However, there are numerous spherical concaves on the particle surface, and the dimensions of these concaves are similar to those of carbon spheres. It can be inferred that these concaves were formed during the calcining process of carbon spheres. Additionally, as shown in the partially enlarged image (Figure 2c), the Mn2O3 cubic structure has some interconnected channels with a width of more than 20 nm. These channels may result from both the decomposition of MnCO3 and the oxidation of carbon spheres during calcination [41]. The release of CO2 contributes to the channel formation. Furthermore, PVP as a soft template also releases CO2 during this process [42], leading to the formation of more gaps on the surface of the Mn2O3 cubic structure.

3.2. Synthesis of LiMnO2

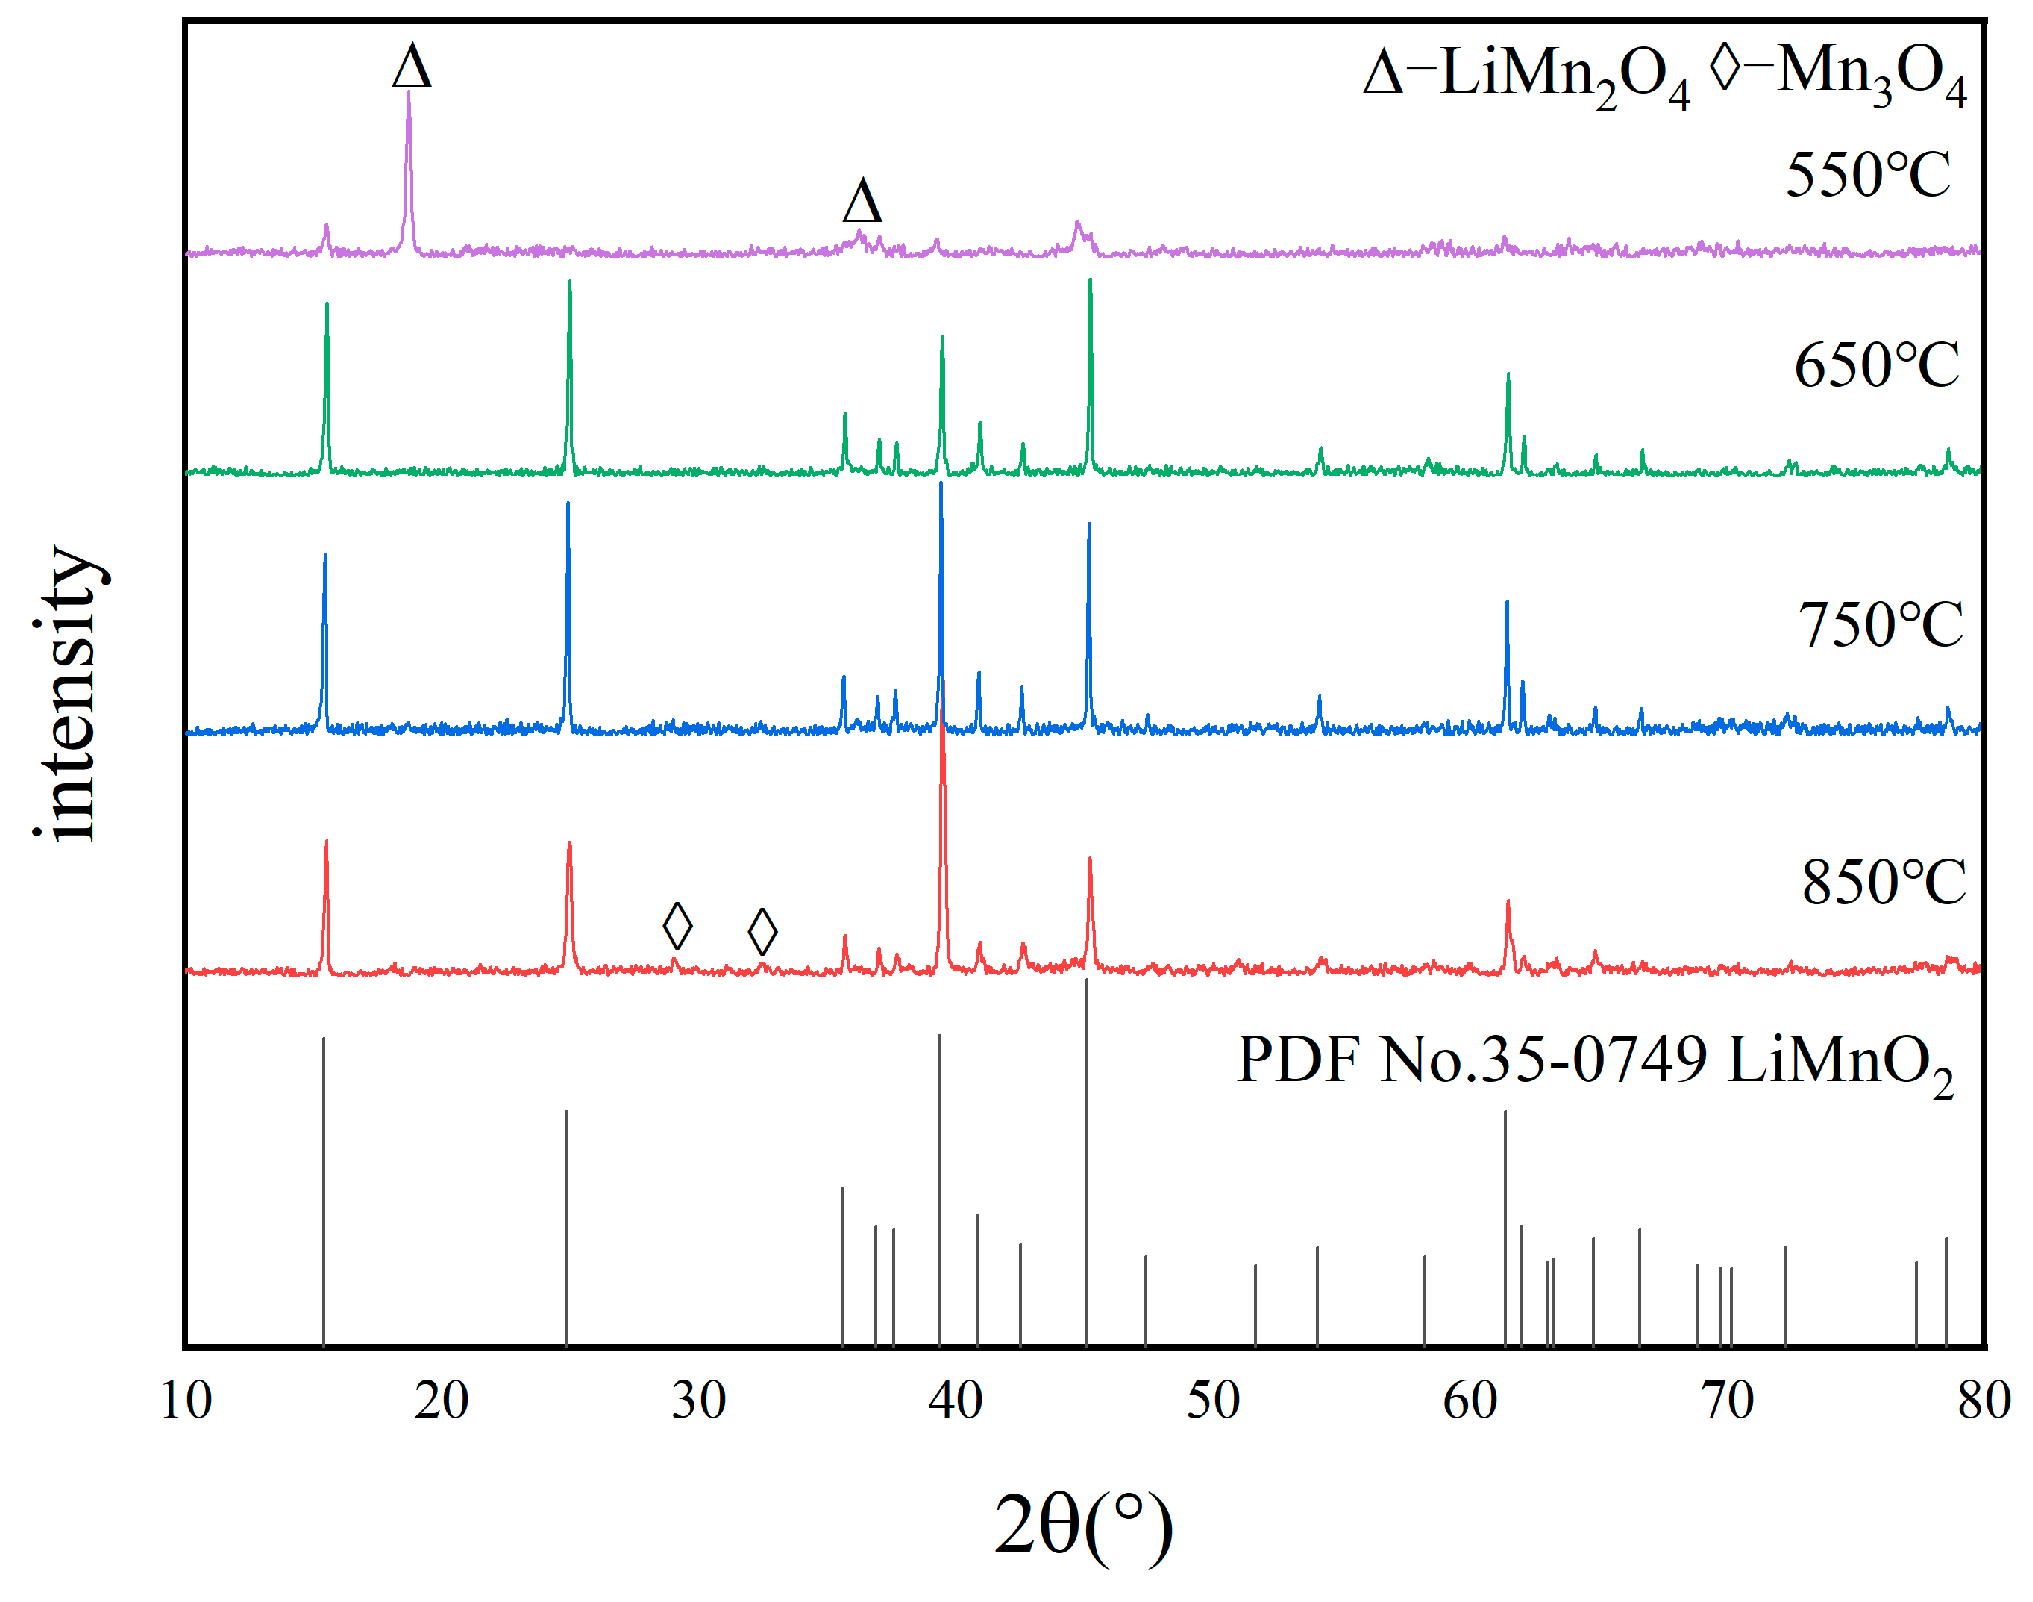
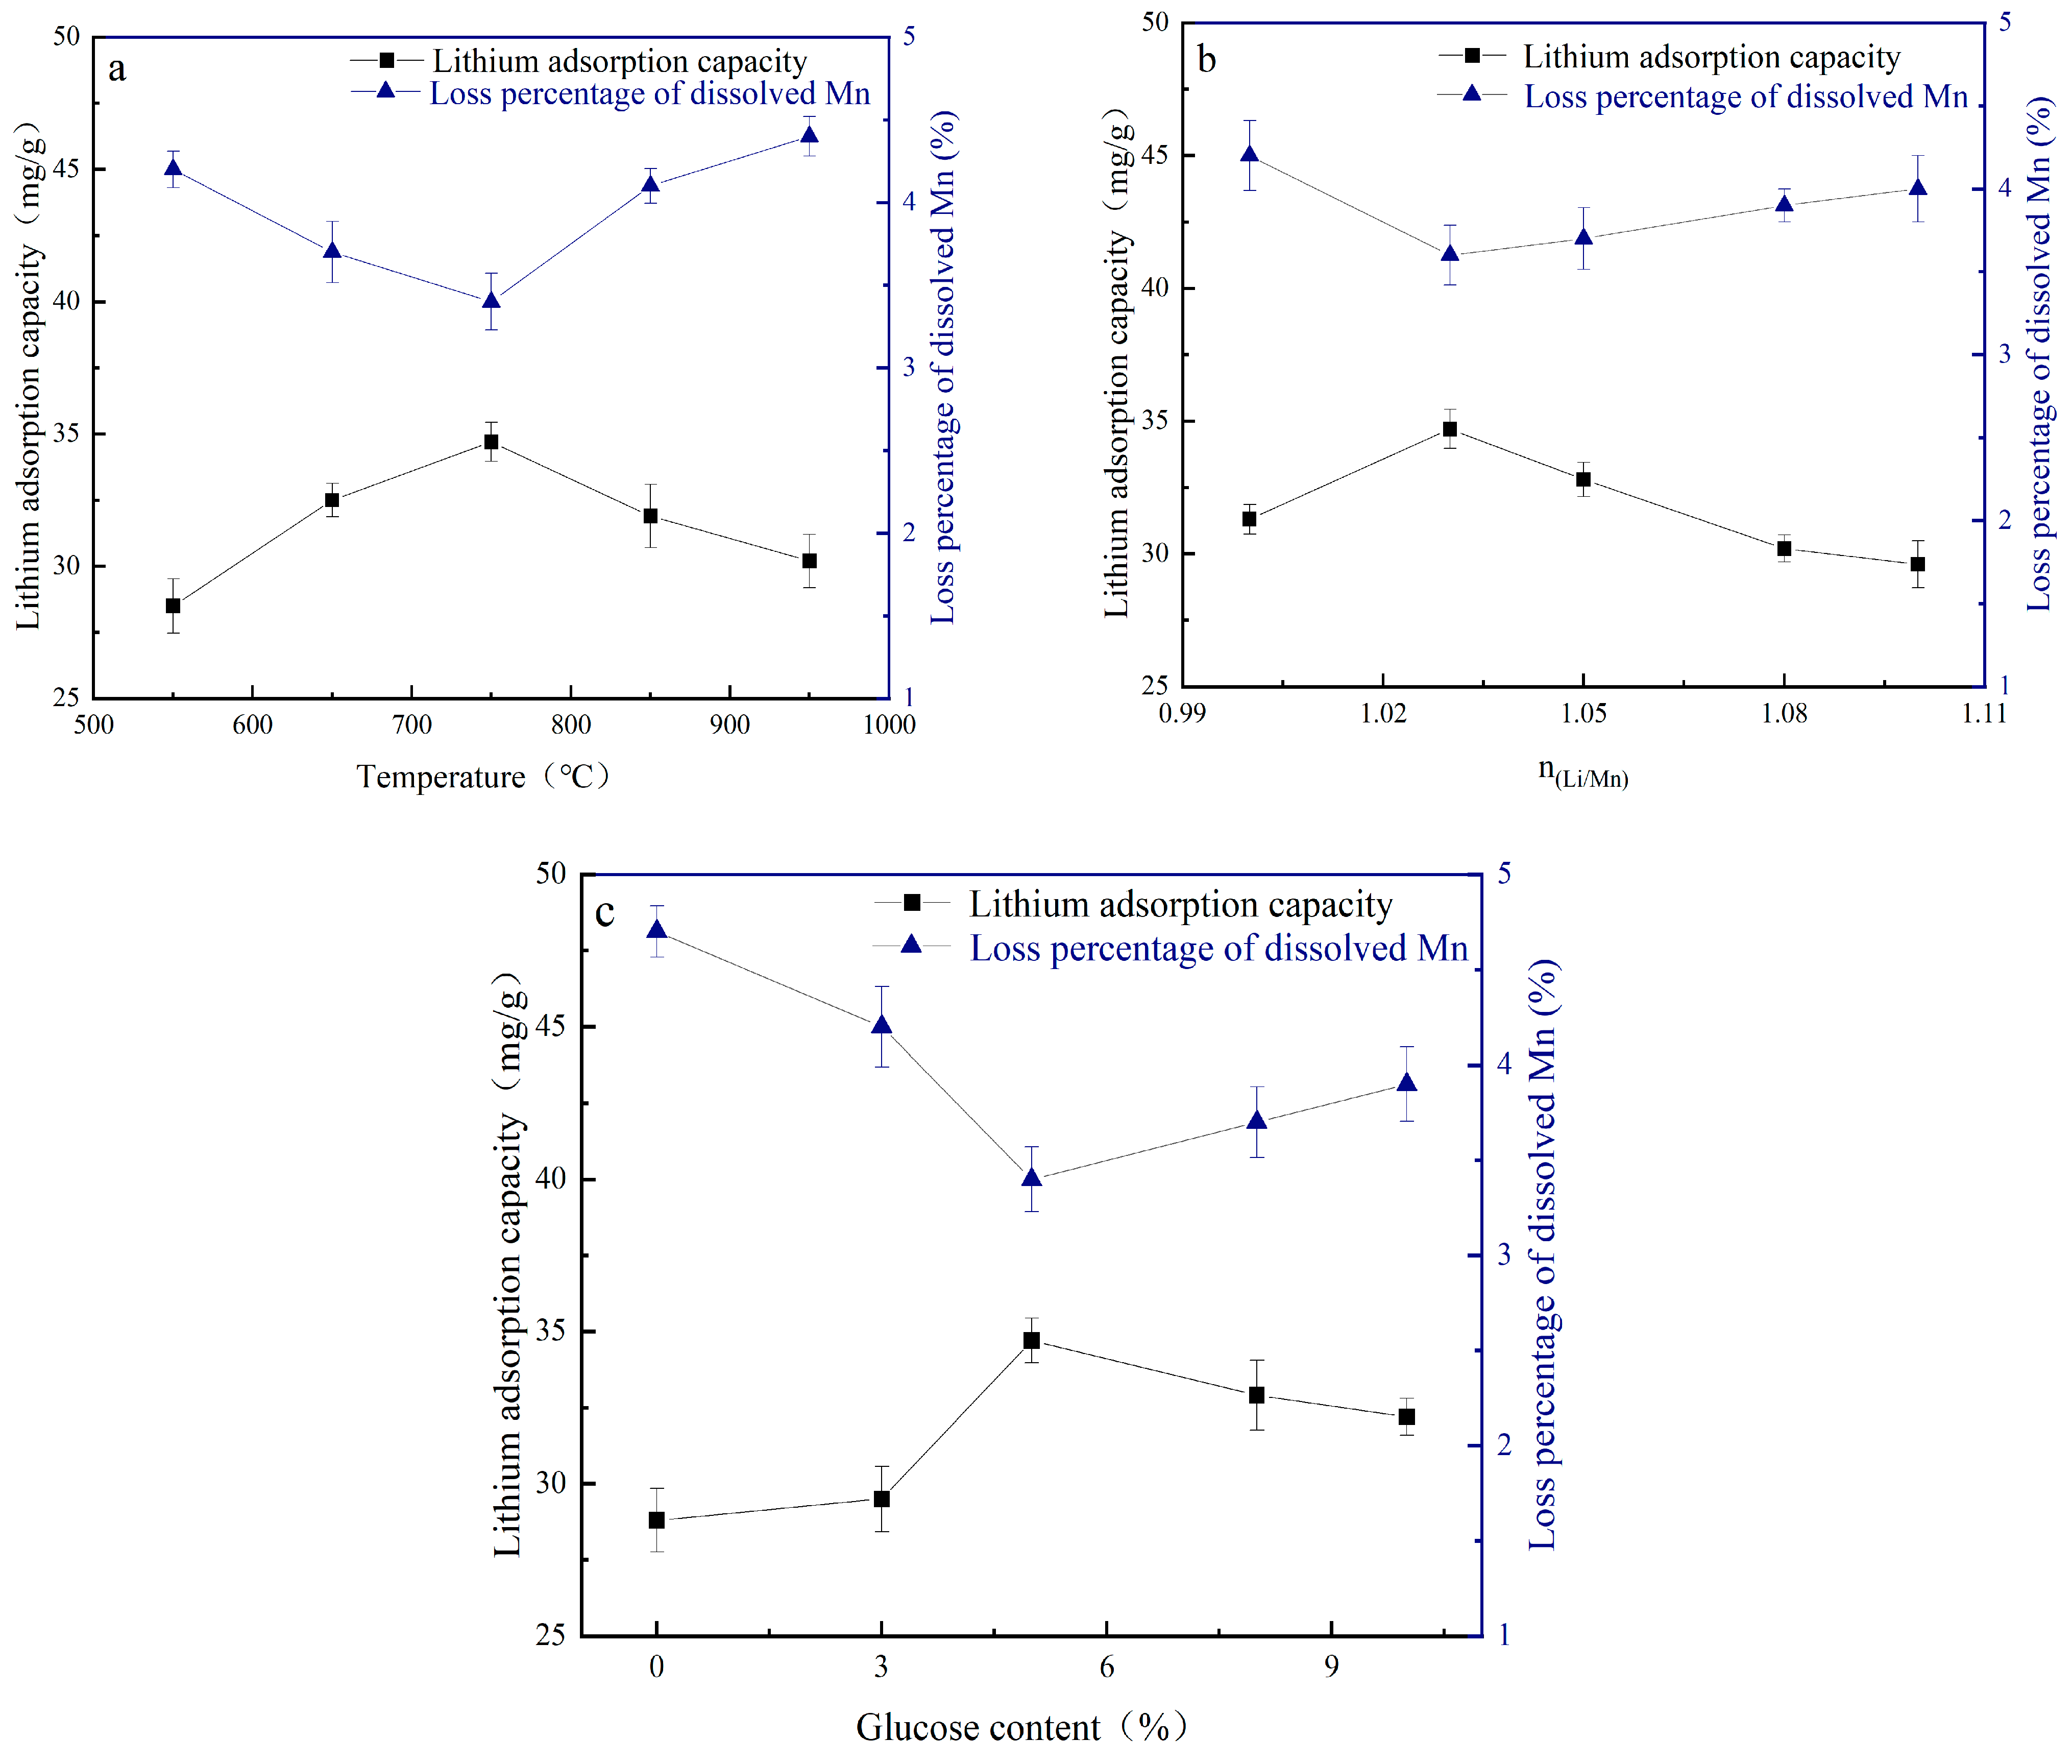
3.2.1. Optimization of Calcination Temperature

Figure 3 presents XRD patterns of samples obtained at various calcination temperatures. As shown, a pure phase of LiMnO2 was obtained at 650 °C and 750 °C. However, only a small amount of LiMnO2 was produced at 550 °C, with the majority being LiMn2O4. The diffraction peaks of LiMnO2 are weak, and crystallization is incomplete at 550 °C. The intensity and purity of diffraction peaks also increases when the calcination temperature rises, facilitating the formation of a pure product. At a temperature of 850 °C, a small amount of Mn3O4 impurity appears, which results from the decomposition of Mn2O3.

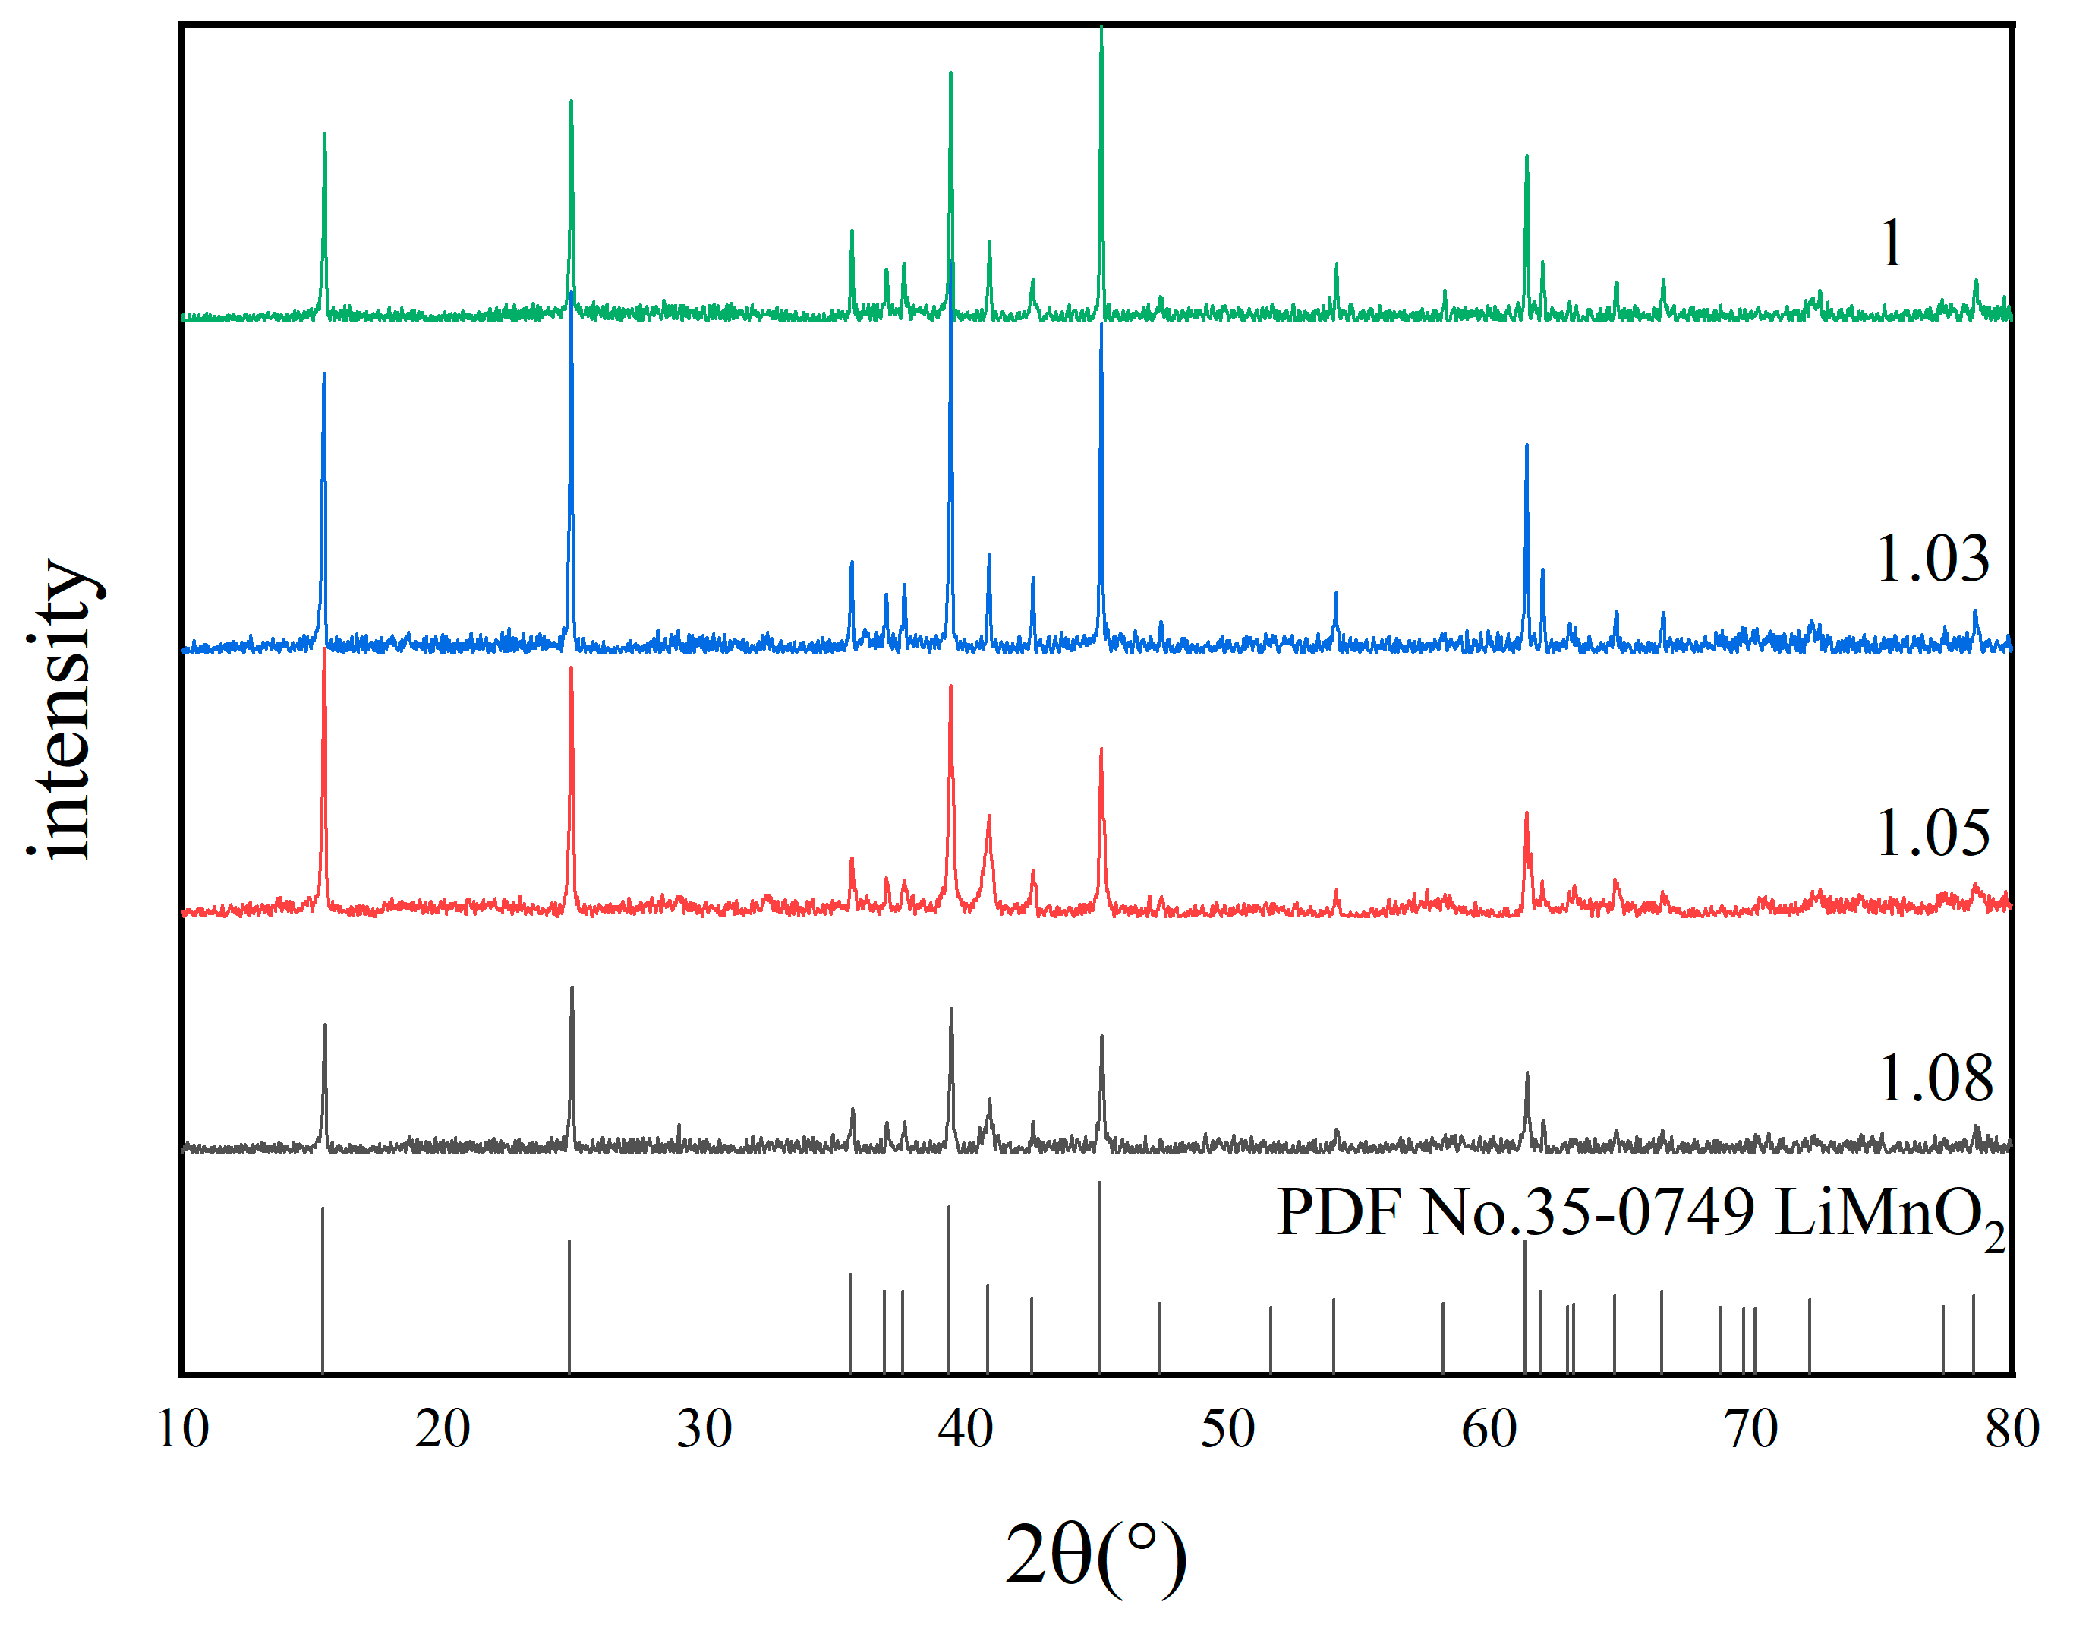
3.2.2. Optimization of Molar Ratio of Lithium to Manganese

Figure 4 illustrates the XRD patterns of samples synthesized at various molar ratios of lithium to manganese (Li/Mn). It can be observed from Figure 4 that pure LiMnO2 can be successfully obtained no matter what the Li/Mn ratio is. But as the Li/Mn ratio reaches 1.03, the resulting diffraction peaks are sharper compared to those with other ratios, and the crystallization is also more complete. When the Li/Mn ratio is 1.05 and 1.08, the intensity of the LiMnO2 diffraction peak is weaker compared to that observed at a Li/Mn ratio of 1.03. An excessive Li/Mn ratio results in a large amount of Li+ entering into the structure, even affecting the transition element layer [32]. This impacts the structural integrity of LiMnO2, resulting in poor crystallinity and a mixing phenomenon of cations within the precursor [43]. From an economic perspective, a Li/Mn ratio of 1.03 represents an optimal choice.

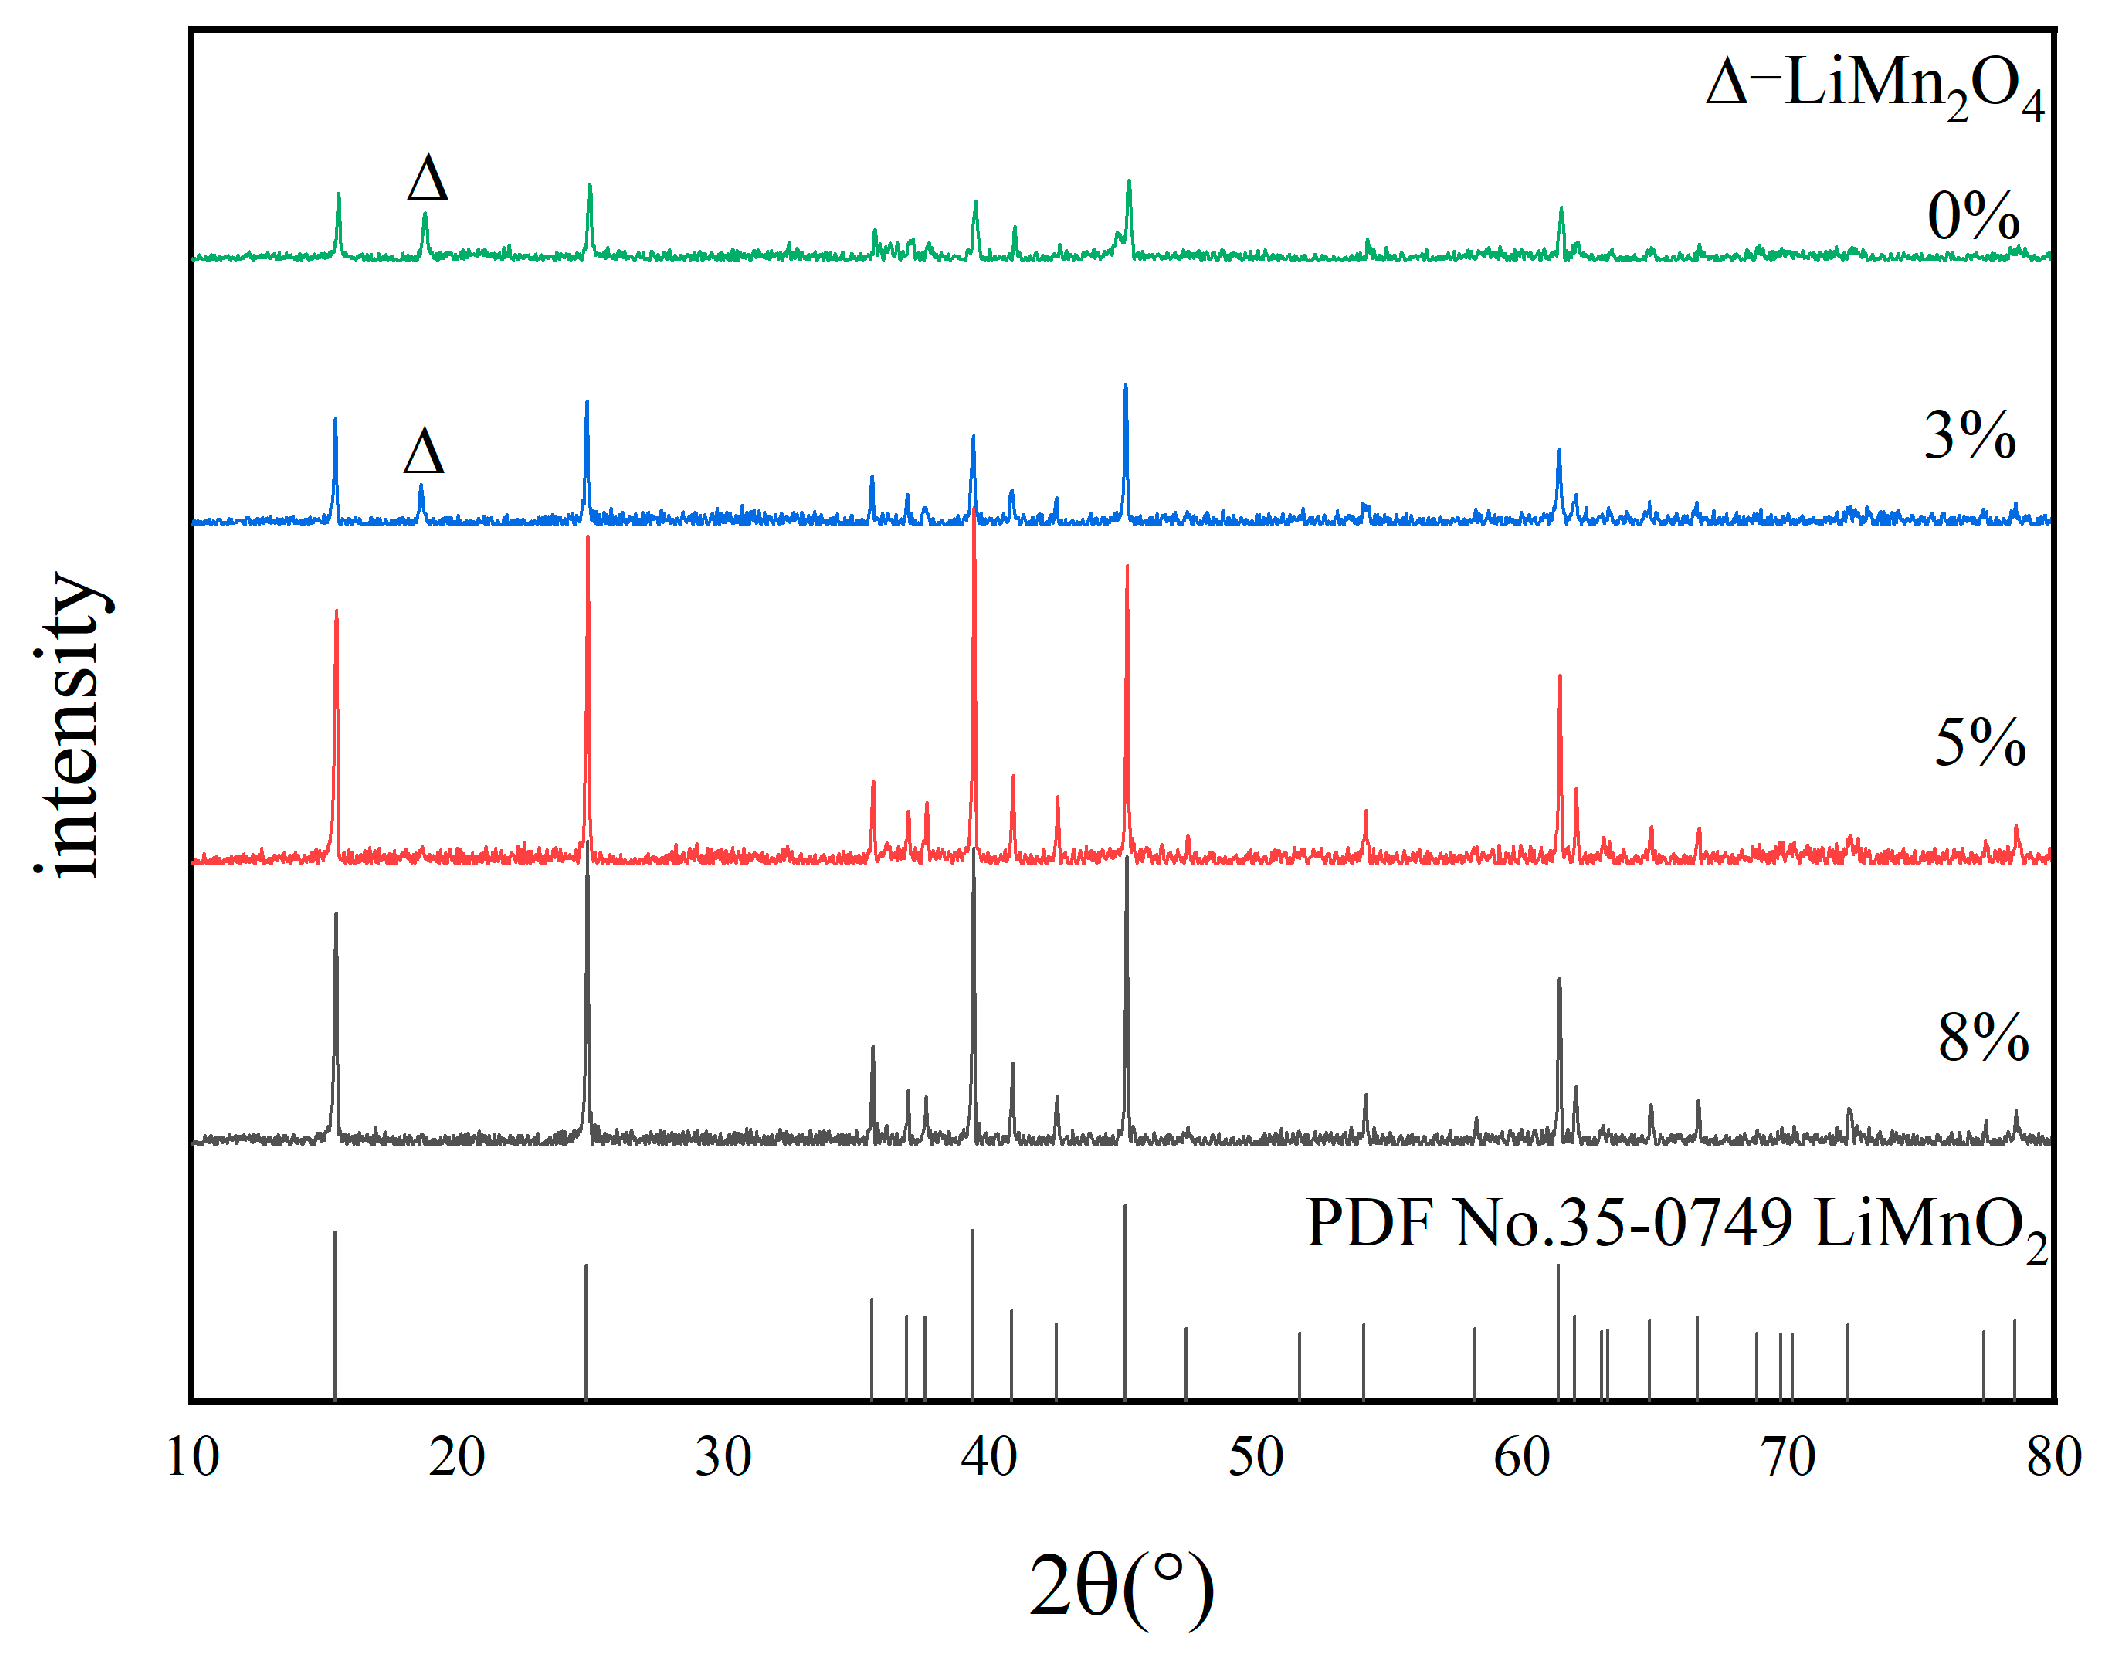
3.2.3. Optimization of Glucose Content

Figure 5 presents the XRD patterns of LiMnO2 synthesized with various amount of glucose (relative to Mn). As shown in Figure 5, the intensity of impurity peaks is weaker, and the LiMnO2 main peak becomes sharper with the increase in glucose content. LiMn2O4 impurity peaks are observed for the blank and 3% glucose. In contrast, pure LiMnO2 can be obtained when the glucose content exceeds 5%. Glucose does not affect the composition of subsequent products. The presence of LiMn2O4 impurity primarily arises from the decomposition of a portion of Mn2O3 during the high-temperature synthesis process of LiMnO2, leading to small quantities of Mn3O4 and O2 [37]. This part of Mn3O4 and O2 subsequently reacts with lithium to form LiMn2O4. Simultaneity, excess O2 when glucose is insufficient may also oxidize a minor amount of LiMnO2 into LiMn2O4. The relevant chemical equations are shown in (9) and (10):
6 Mn 2 O 3 = 4 Mn 3 O 4 + O 2
and   8 Mn 3 O 4   +   5 O 2   =   6 Li 2 CO 3   =   12 LiMn 2 O 4 + 6 CO 2
In the high-temperature solid-phase reaction process, the decomposition of Mn2O3 is unavoidable. Therefore, altering process parameters, such as the calcination temperature or the molar ratio of Li/Mn, does not completely eliminate the impurity of LiMn2O4. Impurities in LiMnO2 can lead to impure composition during the synthesis of the precursor Li1.6Mn1.6O4. This adversely affects the structure and purity of the lithium ion sieve, resulting in a decreased adsorption capacity and an increased Mn dissolution loss percentage. Although HMn2O4 has a certain adsorption capacity, its adsorption properties are inferior to those of H1.6Mn1.6O4. Therefore, the presence of impurities in LiMnO2 may result in an unsatisfactory adsorption performance of the subsequently formed lithium ion sieve. Yu [44] also confirmed the view by analyzing the obvious positive correlation between the adsorption density of Li and the content of H4Mn5O12. So, the addition of glucose is essential. Firstly, glucose can directly consume O2 within the reaction environment, thereby protecting LiMnO2 from oxidation. Secondly, glucose can reduce partial impurities back into LiMnO2. Thus, two functions synergistically contribute to synthesizing pure LiMnO2. Glucose acts as a reducing agent to protect LiMnO2 from oxidation and does not remain within the adsorbent after synthesis. Consequently, high-purity LiMnO2 can be synthesized through carbothermal reduction-assisted solid-phase reactions.

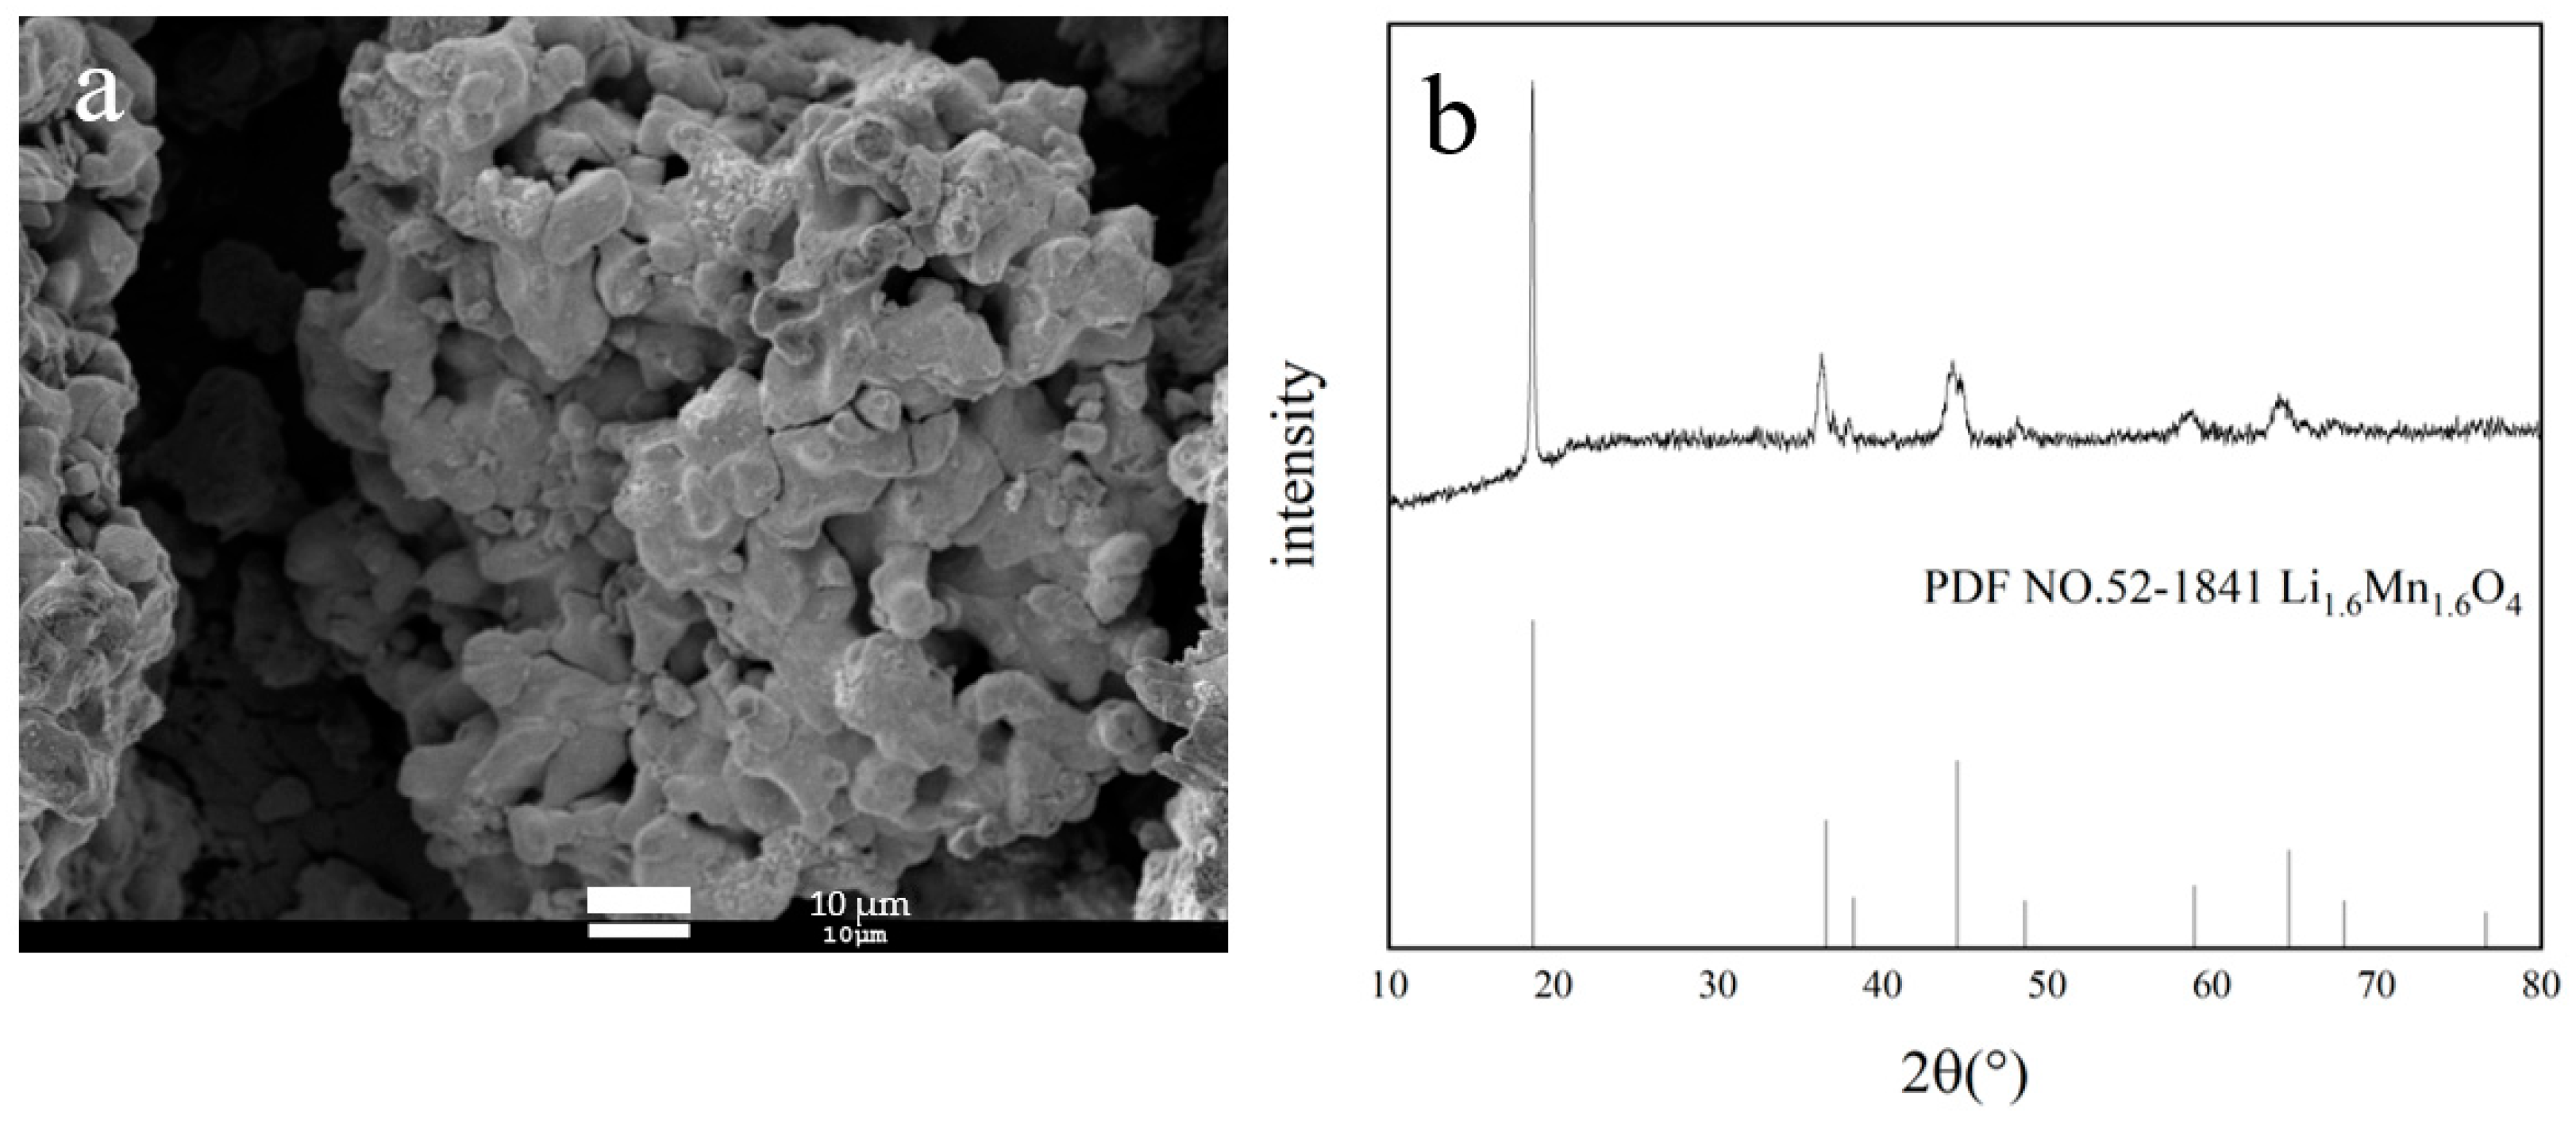
3.3. Characterization of Li1.6Mn1.6O4

According to the above results, the optimal synthetic conditions are as follows: calcination temperature of 750 °C, molar ratio of Li/Mn of 1.03, and addition of glucose at 5%. Li1.6Mn1.6O4 can be obtained by roasting LiMnO2 at 450 °C for 6 h. Figure 6 illustrates the SEM image and XRD pattern of Li1.6Mn1.6O4. As shown in Figure 6a, the particles of Li1.6Mn1.6O4 aggregate into cubic structures with obvious gaps. Some gaps conjunct together and even form holes. The features may facilitate the formation of suitable channels that allow for the free movement of Li+ in and out without destroying the spinel structure [45]. The structural framework closely resembles cubic Mn2O3 (Figure 2b). Furthermore, as presented in Figure 6b, the diffraction peak is consistent with Li1.6Mn1.6O4(PDF NO.52-1841), indicating that the product is composed of Li1.6Mn1.6O4 monophase with cubic crystal structure.

4. Discussion

4.1. Adsorption Performance of H1.6Mn1.6O4

Figure 7 shows the loss percentage of dissolved Mn of the precursor by roasting LiMnO2 and the adsorption capacity for Li+ at various calcination temperatures, molar ratios of Li/Mn, and glucose contents. In Figure 7a, H1.6Mn1.6O4 shows a maximum adsorption performance of about 34.7 mg/g and a minimum Mn dissolution loss of about 3.4% at 750 °C. The change of the Mn dissolution loss percentage with calcination temperature is due to the fact that a low calcination temperature leads to LiMn2O4 formation and a high temperature to Mn3O4, as shown in Figure 3. Those two species contain Mn3+ and cause a disproportion reaction in hydrochloric acid, resulting in the formation of Mn4+ and Mn2+. The release of Mn2+ into solution leads to a relatively high percentage of Mn dissolution loss. Figure 7b shows the Li/Mn ratio has a small effect on the adsorption performance and loss percentage of dissolved Mn, and this response is consistent with the result in Figure 4. However, the adsorption performance and loss percentage of dissolved Mn have great dependence on the glucose content. When it is less than 5%, a high glucose content is beneficial for improving the adsorption capacity and structure stability, as shown in Figure 7c. Further increasing the glucose content has no obvious effect compared with 5% glucose. At same time, it can be observed that the lithium ion sieve obtained by roasting LiMnO2 without impurities and acid pickling has a higher adsorption capacity and lower loss percentage of dissolved Mn than that obtained by roasting LiMnO2 containing impurities and acid pickling. These results indicate that the composition of LiMnO2 has a great difference from the performance of the Mn-based lithium ion sieve [25].
Table 1 describes the performance of other solid-phase synthetic non-porous lithium ion sieves. Compared to the references, the Li+ adsorption capacity is improved. This enhancement can be attributed to the porous cubic structure of H1.6Mn1.6O4 particles. A porous structure is conducive to Li+ migration and exchange, leading to a higher adsorption capacity [46]. Li [47] also confirmed the view by synthesizing 3D macroporous–mesoporous H4Ti5O12 and porous H4Ti5O12. They found higher Li+ adsorption capacity compared with nonporous H4Ti5O12 because of the highly interconnected porous channel.

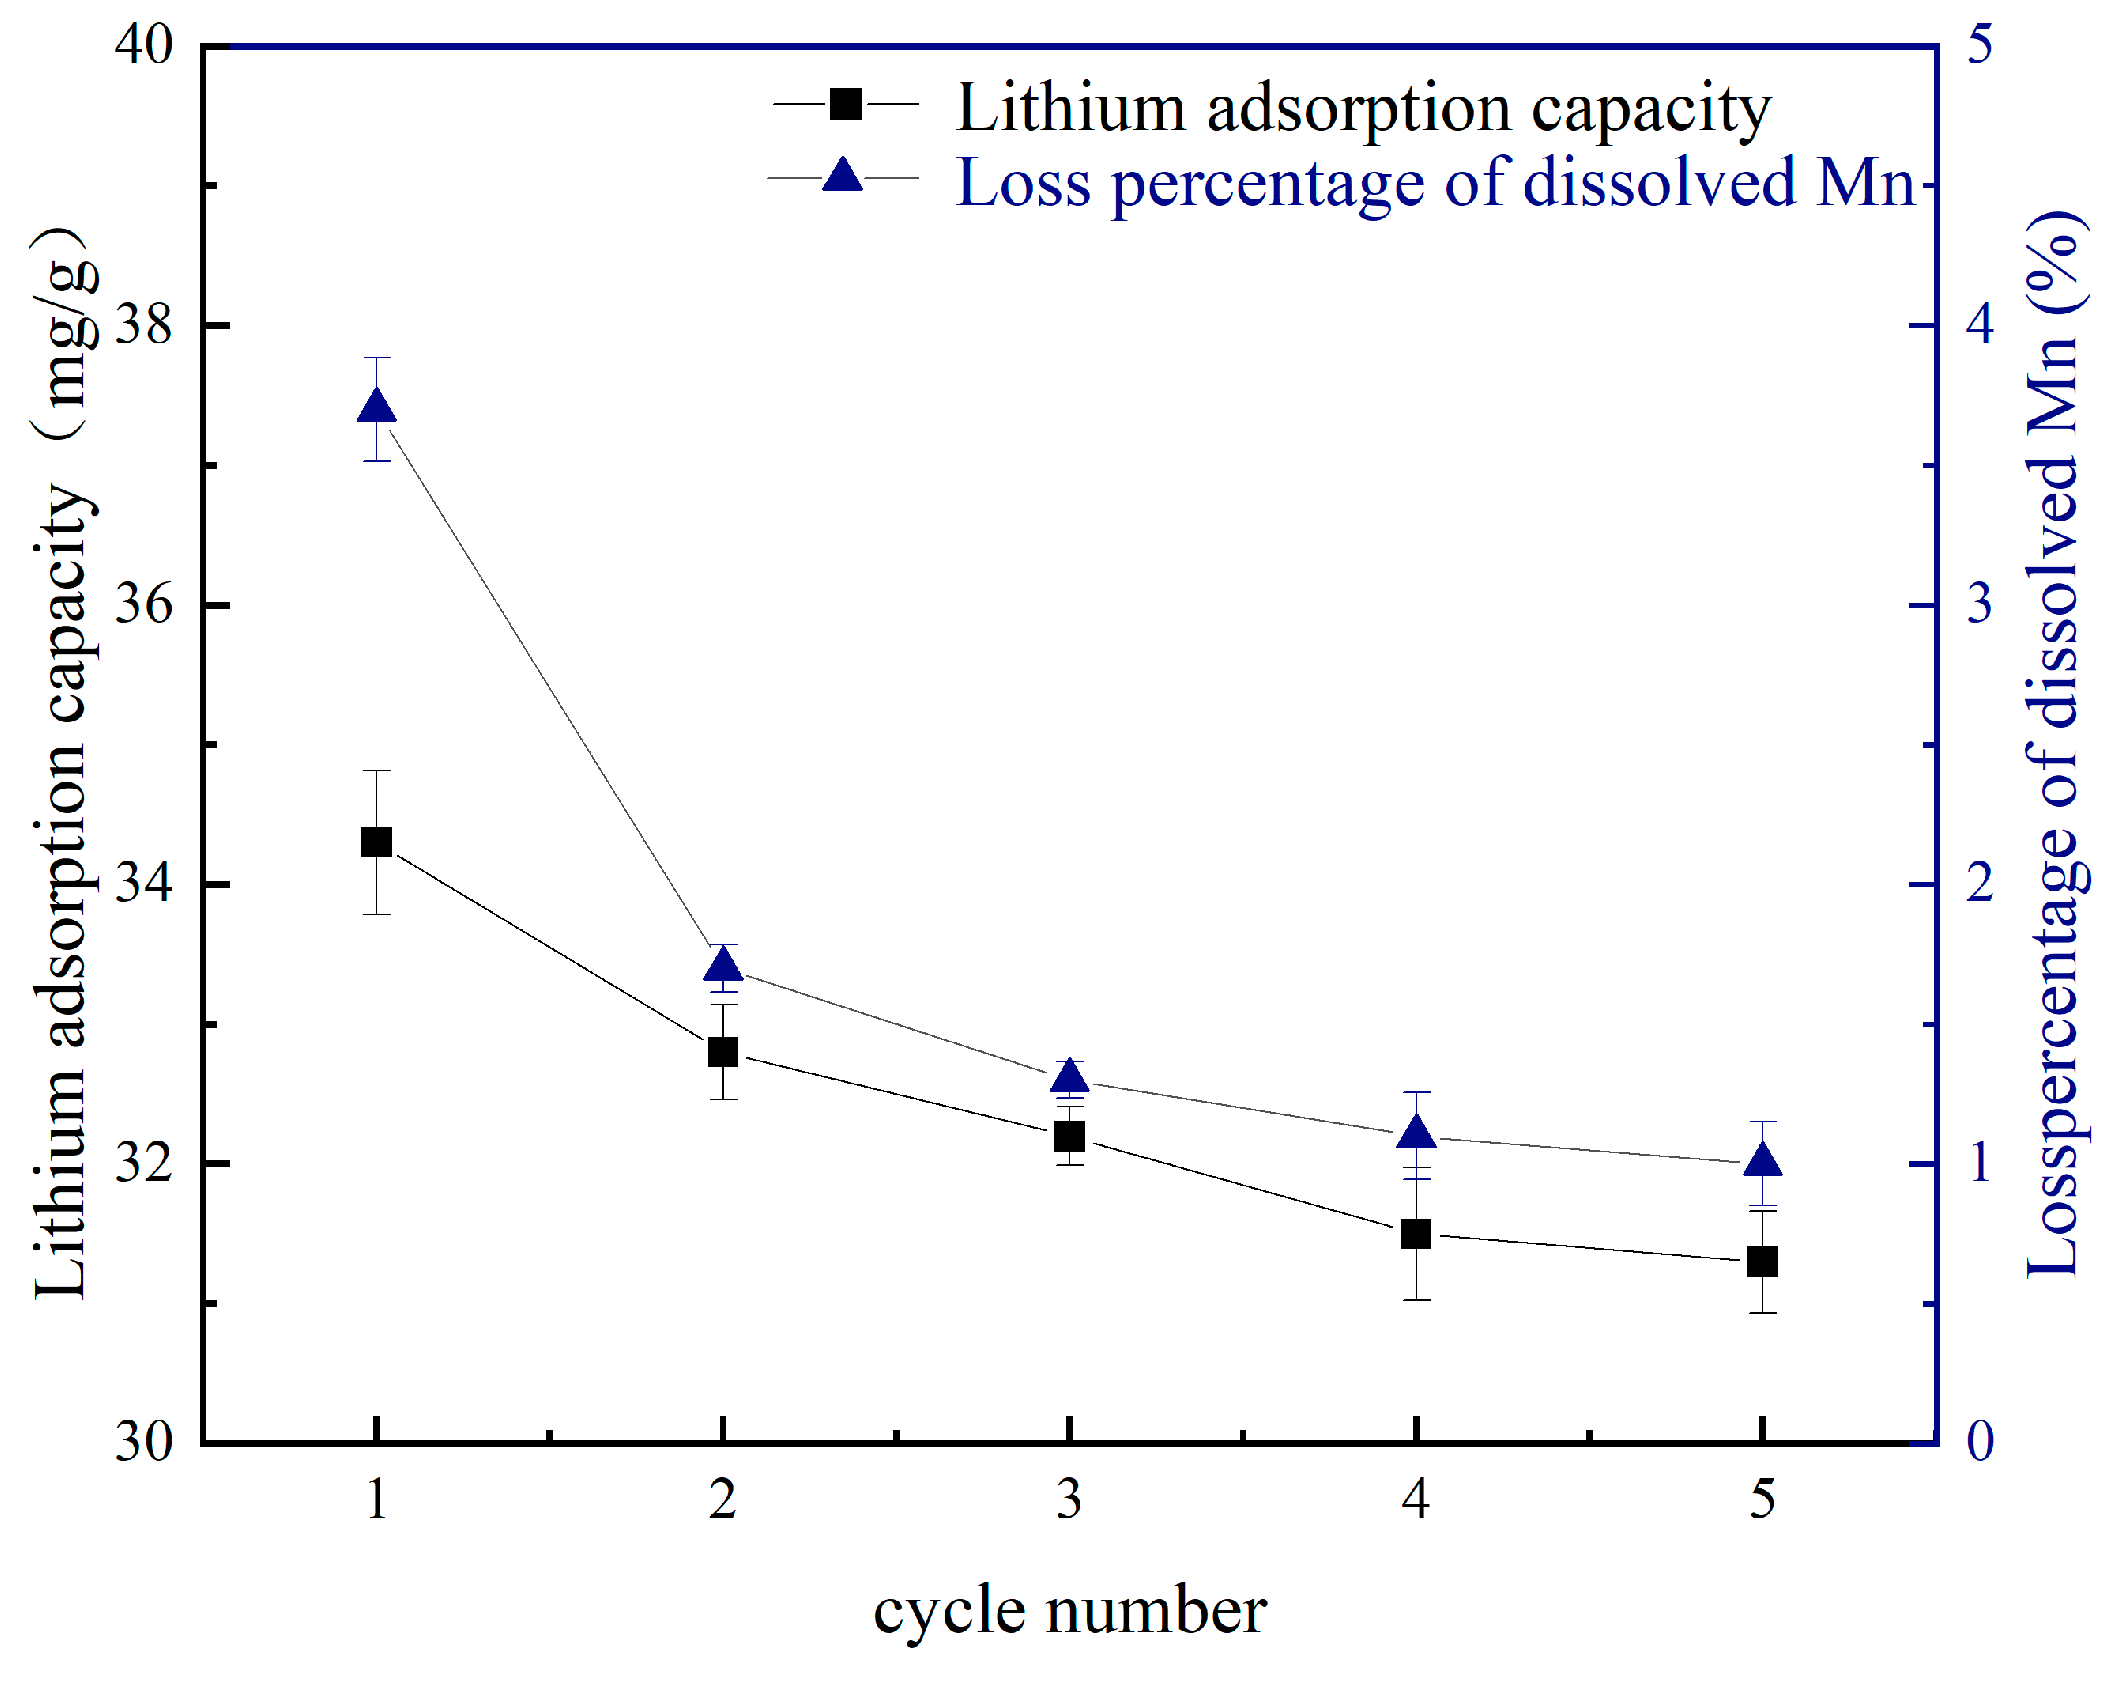
4.2. Cycling Performance

The loss percentage of dissolved Mn during acid pickling and Li+ adsorption capacity were determined over multiple cycles. The results are illustrated in Figure 8. During the initial three cycles, the loss of dissolved Mn is due to the Mn3+ disproportion reaction in hydrochloric acid [51]. After three cycles, nearly all Mn3+ was dissolved, and the percentage of Mn dissolution loss presented a constant value approximately 1%. This stability can be attributed to the formation of high-purity precursor Li1.6Mn1.6O4 following the roasting of LiMnO2 without impurities. Figure 8 also demonstrates that the lithium adsorption capacity decreases as the number of cycles increases. This reduction can be attributed to the H+–Li+ ion exchange process during the acid pickling, where H+ possesses smaller ionic radius compared to Li+ [52]. During the adsorption process, this exchange between Li+ and H+ inevitably leads to a contraction of the crystal structure. Consequently, this phenomenon hinders both diffusion and embedding of Li+ into the crystal lattice, ultimately leading to a decreased lithium adsorption capacity. After five cycles, the adsorption capacity remained more than 30 mg/g, and recovery rate was about 85%. The resulting lithium ion sieve therefore exhibits high stability during cycling.

4.3. Adsorption Selectivity

The existence of various ions in salt lake brine has a significant impact on the Li+ adsorption effect of the lithium ion sieve. Figure 9 demonstrates the adsorption capacity of H1.6Mn1.6O4 for Li+, Mg2+, K+, and Na+. H1.6Mn1.6O4 has the highest adsorption capacity for Li+ compared to Mg2+, K+, and Na+, and the distribution coefficient of Li+ is much larger than that of other ions. These results indicate the synthesized lithium ion sieve exhibits exceptional selectivity for Li+.

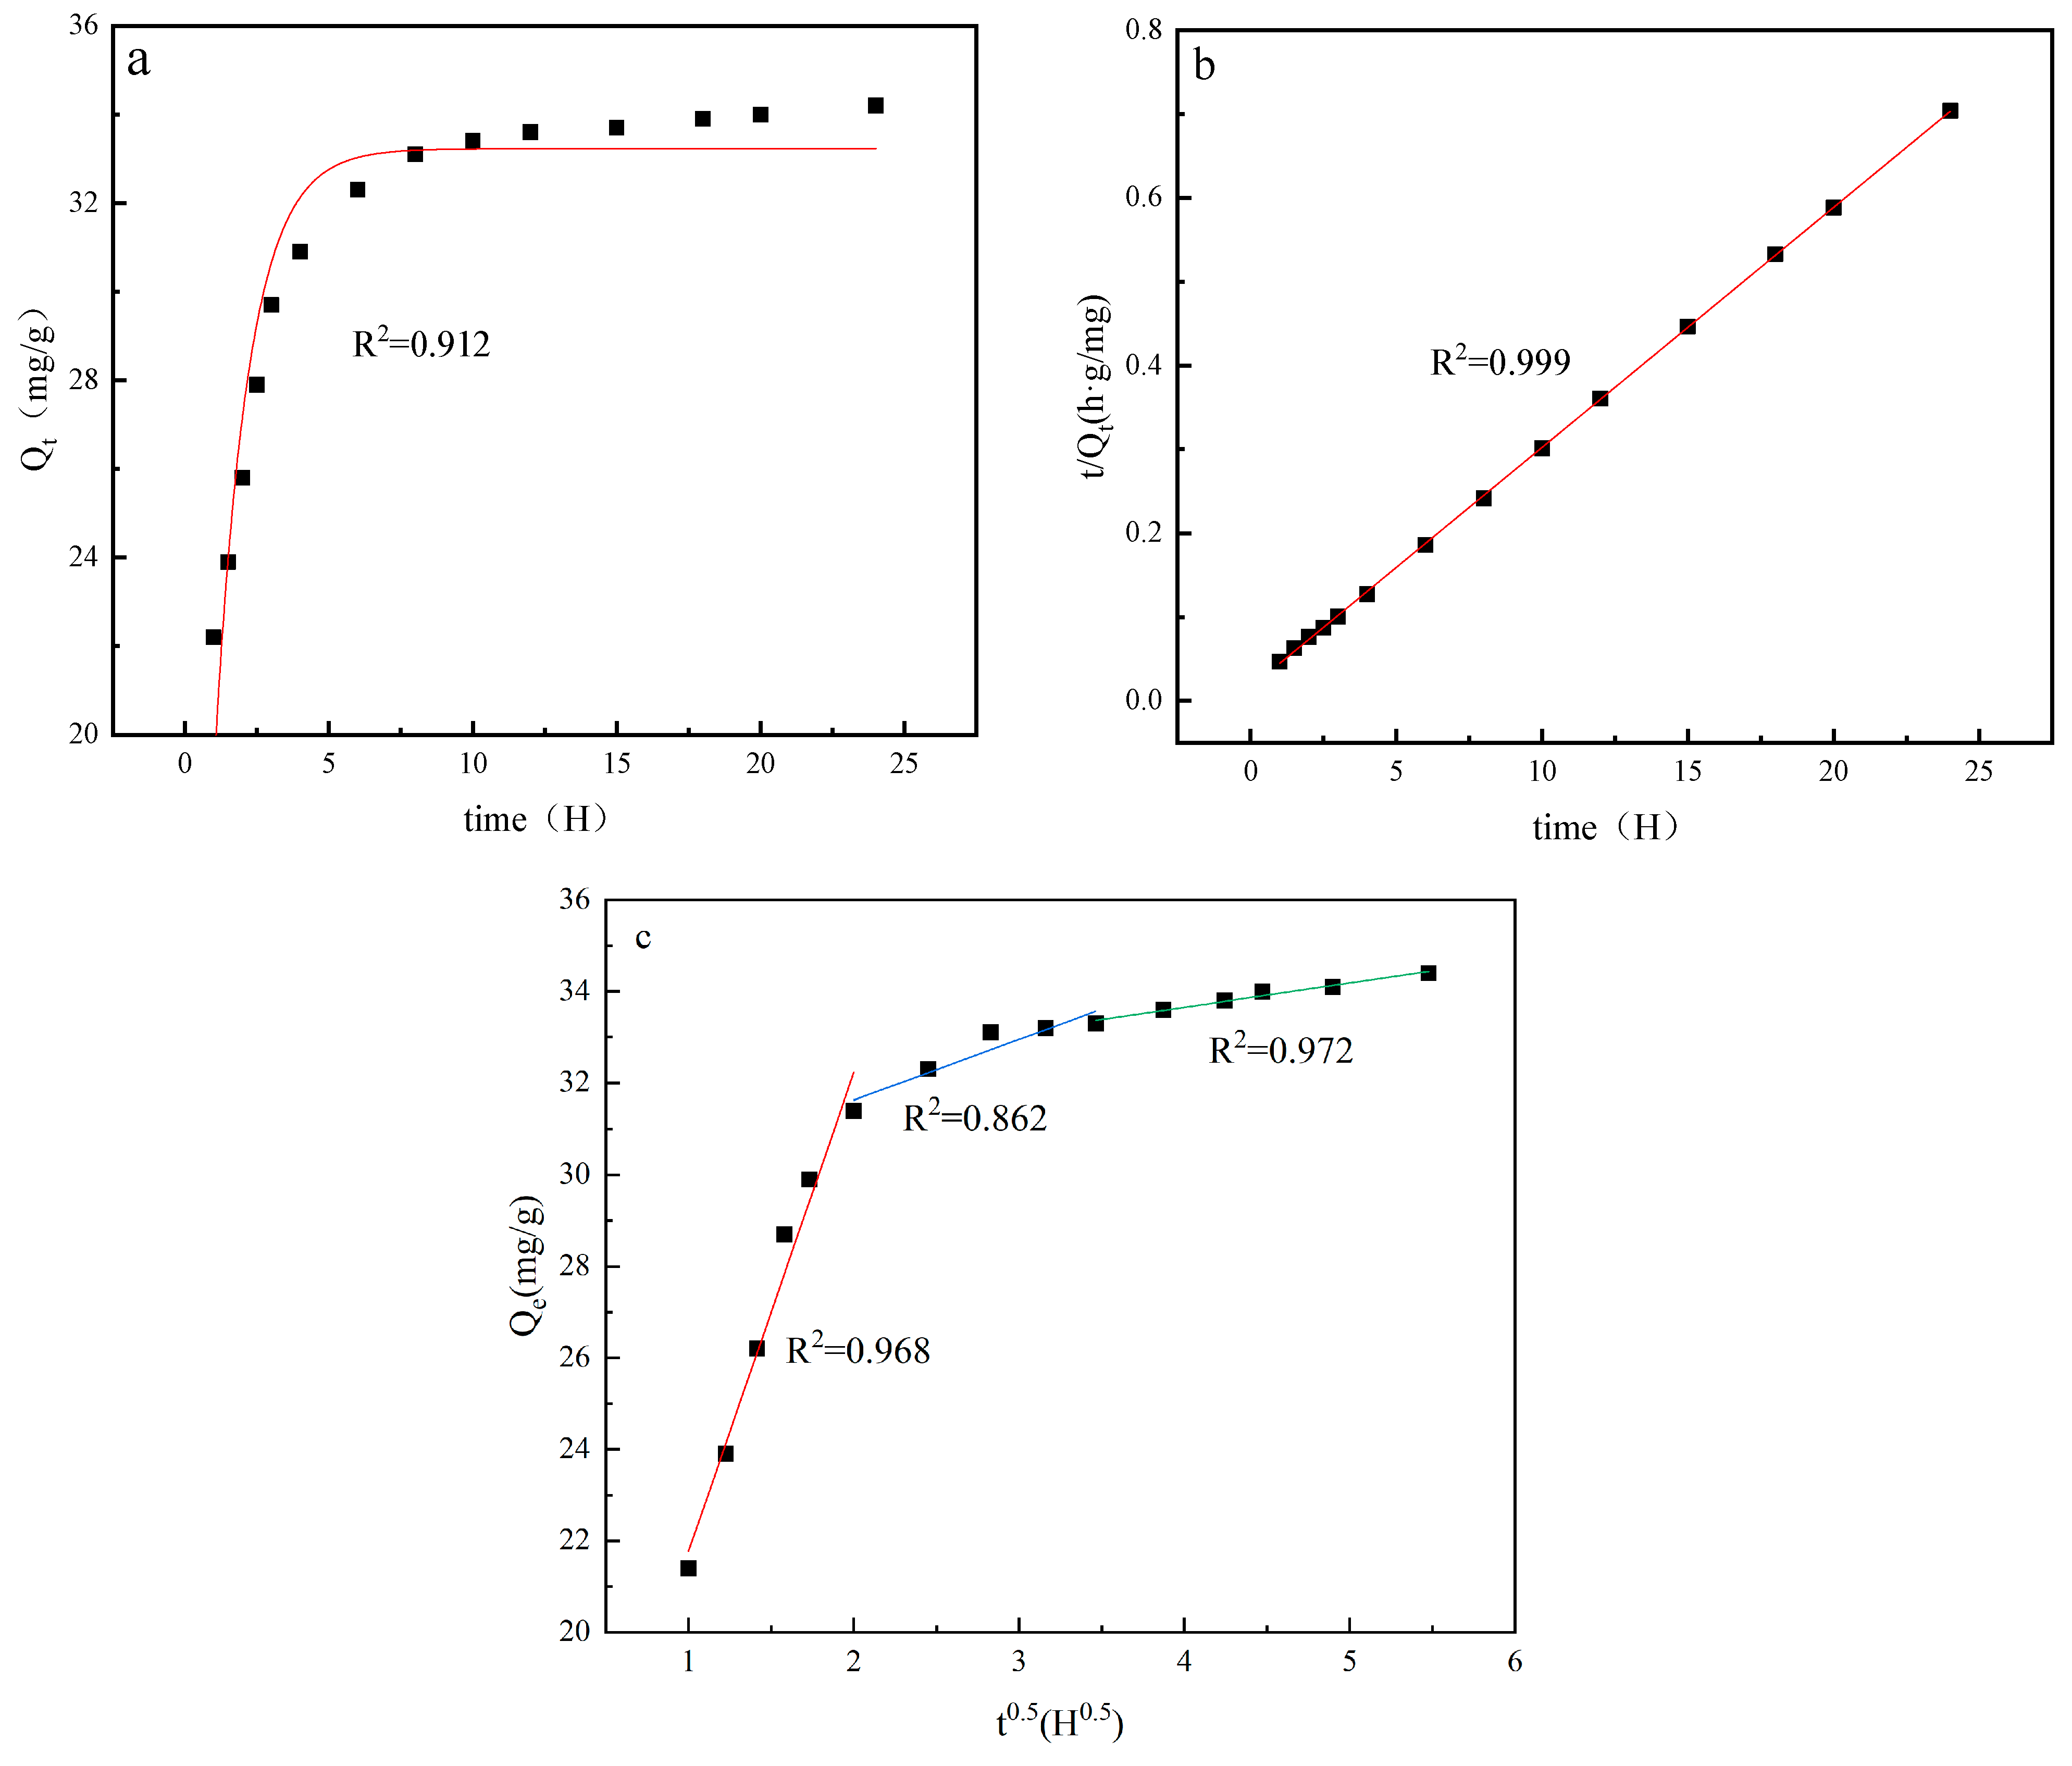
4.4. Adsorption Kinetics

The variation in adsorption capacity over time is illustrated in Figure 10. As shown, adsorption capacity progressively enhances over time. The initial adsorption rate is notably rapid during the first stage but subsequently slows down. This is due to the fact that there are numerous lithium vacancies exhibiting a memory effect within the spinel structure after acid pickling. Additionally, a significant concentration gradient of Li+ between brine and the interior of ion sieve is beneficial for Li+ to enter into the crystal lattice and cause exchange with H+ [53]. However, H+ in H1.6Mn1.6O4 enters into the solution as time goes by, leading to an increase in the concentration of H+. Simultaneously, as Li+ is adsorbed into the ion sieve, there is a decline in the Li+ concentration in brine. These factors hinder both the Li+–H+ exchange and overall adsorption processes. Thus, the initial rate of adsorption is fast, while the subsequent adsorption rate gradually becomes gentle.
Figure 11 illustrates three kinetic models for adsorption process of lithium ion sieve. Using the pseudo-first-order adsorption dynamics model gives a linear correlation coefficient of about only 0.912. However, the linear correlation coefficient increases significantly to 0.999, and the adsorption constant K is 0.051 based on the pseudo-second-order adsorption dynamics model. Figure 11c shows that the resulting straight lines do not pass through the origin, and the correlation coefficients are lower that of the pseudo-second-order kinetic model. These results show the process of ion exchange between Li+ and H+ is not consistent with the pseudo-first-order dynamics model and intraparticle diffusion model but closely conforms to the pseudo-second-order adsorption dynamics model. These findings suggest the adsorption process of the lithium ion sieve is primarily controlled by chemical adsorption.

4.5. Adsorption Isotherm

Figure 12 presents the adsorption isotherm of the lithium ion sieve and the fitting results with Langmuir and Freundlich models. With the increase in Li+ concentration in the solution, the adsorption capacity of H1.6Mn1.6O4 also correspondingly increases. The correlation coefficient based on the Langmuir equation is 0.999, while that of the Freundlich model is just 0.927. The results indicate that the adsorption process of H1.6Mn1.6O4 belongs to monolayer adsorption.

5. Conclusions

Porous Mn2O3 was hydrothermally synthesized and calcined with Li2CO3, using a carbothermal reduction-assisted solid-phase method to obtain LiMnO2. Subsequently, a lithium ion sieve was synthesized after roasting LiMnO2 and acid pickling. The optimum synthesis conditions of LiMnO2 are as follows: calcination temperature of 750 °C, Li/Mn of 1.03, and addition of 5% glucose. The carbothermal reduction method protects manganese from oxidation and yields high-purity LiMnO2. The resulting Mn-based lithium ion sieve has an adsorption capacity of 35 mg/g. After five cycles, the dissolution percentage of Mn is stable at approximately 1%. Simultaneously, the adsorption capacity remains above 30 mg/g, demonstrating excellent cycling performance and structural stability.

Author Contributions

Validation, Y.H. and J.Z.; investigation, R.Y. and J.Z.; data curation, Y.H. and J.Z.; writing—original draft preparation, J.Z.; writing—review and editing, X.Y. and R.Y.; supervision, X.Y.; project administration, X.Y. All authors have read and agreed to the published version of the manuscript.

Funding

This research was funded by the National Natural Science Foundation of China, grant number 51574286, and China Postdoctoral Science Foundation, grant number 2016M592448.

Institutional Review Board Statement

Not applicable.

Informed Consent Statement

Not applicable.

Data Availability Statement

The original contributions presented in this study are included in the article. Further inquiries can be directed to the corresponding author.

Conflicts of Interest

The authors declare no conflicts of interest.

References

  1. Chen, Z.; Zhou, H.; Jia, S. Resource benefit evaluation of lithium recovery from new-energy vehicle batteries. Sustainability 2025, 17, 2922. [Google Scholar] [CrossRef]
  2. Gu, T.; Zhang, G.; Wang, Z.; Liu, L.; Zhang, L.; Wang, W.; Huang, Y.; Dan, Y.; Zhao, P.; He, Y.; et al. Review: The formation, characteristics, and resource utilization of lithium slag. Constr. Build. Mater. 2024, 432, 136648. [Google Scholar] [CrossRef]
  3. Liu, M.; Li, H.; Chi, H.; Chen, S.; Wang, H.; Wang, C.; Ma, X.; Zhu, Z.; Li, F. A review on lithium extraction by electrochemical electrode deionization technology. J. Solid. State Electrochem. 2025, 29, 1577–1592. [Google Scholar] [CrossRef]
  4. Zhang, Q.; Huang, Z.; Liu, B.; Ma, T. Sustainable lithium supply for electric vehicle development in China towards carbon neutrality. Energy 2025, 320, 1135243. [Google Scholar] [CrossRef]
  5. Wang, Y.; Yang, X.; Gao, L.; Wu, Y.; Chen, Y. Towards high adsorption performance and cycling stability for spinel lithium ion-sieve H1.6Mn1.6O4 by coating Li2ZrO3 and doping Zr. Colloids Surf. A 2022, 638, 128238. [Google Scholar] [CrossRef]
  6. Zheng, L.; Chen, G.; Wen, B.; Bao, W. Analysis of lithium demand for electric vehicles from supply and demand perspectives under China’s carbon peak and neutrality goals. Waste Manag. 2025, 202, 114822. [Google Scholar] [CrossRef]
  7. Sun, X.; Ouyang, M.; Hao, H. Surging lithium price will not impede the electric vehicle boom. Joule 2022, 6, 1738–1742. [Google Scholar] [CrossRef]
  8. Vega-Muratalla, V.O.; Ramírez-Márquez, C.; Lira-Barragán, L.F.; Ponce-Ortega, J.M. Review of lithium as a strategic resource for electric vehicle battery production: Availability, extraction, and future prospects. Resources 2024, 13, 148. [Google Scholar] [CrossRef]
  9. Zhang, L.; Zhang, T.; Lv, S.; Song, S.; Galván, H.; Quintana, M.; Zhao, Y. Adsorbents for lithium extraction from salt lake brine with high magnesium/lithium ratio: From structure-performance relationship to industrial applications. Desalination 2024, 597, 117480. [Google Scholar] [CrossRef]
  10. Liu, Y.; Ma, B.; Lü, Y.; Wang, C.; Chen, Y. A review of lithium extraction from natural resources. Int. J. Miner. Metall. Mater. 2023, 30, 209–224. [Google Scholar] [CrossRef]
  11. Yuan, H.; Li, M.; Cui, L.; Wang, L.; Cheng, F. Electrochemical extraction technologies of lithium: Development and challenges. Desalination 2025, 598, 118416. [Google Scholar] [CrossRef]
  12. He, M.-Y.; Luo, C.G.; Yang, H.J.; Kong, F.C.; Li, Y.L.; Deng, L.; Zhang, X.Y.; Yang, K.Y. Sources and a proposal for comprehensive exploitation of lithium brine deposits in the Qaidam Basin on the northern Tibetan Plateau, China: Evidence from Li isotopes. Ore Geol. Rev. 2020, 117, 103277. [Google Scholar] [CrossRef]
  13. Yu, H.; Naidu, G.; Zhang, C.; Wang, C.; Razmjou, A.; Han, D.; He, T.; Shon, H. Metal-based adsorbents for lithium recovery from aqueous resources. Desalination 2022, 539, 115951. [Google Scholar] [CrossRef]
  14. Zhu, R.; Wang, S.; Srinivasakannan, C.; Li, S.; Yin, S.; Zhang, L.; Jiang, X.; Zhou, G.; Zhang, N. Lithium extraction from salt lake brines with high magnesium/lithium ratio: A review. Environ. Chem. Lett. 2023, 21, 1611–1626. [Google Scholar] [CrossRef]
  15. Yang, Y.; Bi, S.; Wang, F.; Pan, X.; Yang, T.; Hu, S.; Tang, S.; Jia, Q. Solid membrane-based aqueous lithium extraction and adsorption: Advances, challenges, and prospects. Chem. Eng. J. 2025, 510, 161749. [Google Scholar] [CrossRef]
  16. Sun, S.-Y.; Nie, X.Y.; Huang, J.; Yu, J.G. Molecular simulation of diffusion behavior of counterions within polyelectrolyte membranes used in electrodialysis. J. Membr. Sci. 2020, 595, 117528. [Google Scholar] [CrossRef]
  17. Hu, Y.; Su, H.; Zhu, Z.; Pang, Q. Environmentally benign techniques of lithium extraction from salt lakes: A review. Environ. Chem. Let. 2024, 22, 105–120. [Google Scholar] [CrossRef]
  18. Su, H.; Li, Z.; Zhang, J.; Liu, W.; Zhu, Z.; Wang, L.; Qi, T. Combining selective extraction and easy stripping of lithium using a ternary synergistic solvent extraction system through regulation of Fe3+ Coordination. ACS Sustain. Chem. Eng. 2020, 8, 1971–1979. [Google Scholar] [CrossRef]
  19. Zhang, J.; Hui, S.; Liu, W.; Wang, L.; Zhu, Z.; Qi, T. A new process to produce battery grade lithium carbonate from salt lake brines by purification, synergistic solvent extraction and carbon dioxide stripping. Hydrometallurgy 2023, 215, 105991. [Google Scholar] [CrossRef]
  20. Ye, S.; Yang, C.; Sun, Y.; Guo, C.; Wang, J.; Chen, Y.; Zhong, C.; Qiu, T. Application and mechanism of lithium-ion sieves in the recovery of lithium-containing wastewater: A review. Water Air Soil. Pollut. 2024, 235, 272. [Google Scholar] [CrossRef]
  21. Jiang, H.; Yang, Y.; Sun, S.; Yu, J. Adsorption of lithium ions on lithium-aluminum hydroxides: Equilibrium and kinetics. Can. J. Chem. Eng. 2020, 98, 544–555. [Google Scholar] [CrossRef]
  22. Fu, Y.Y.; Yang, X.Y.; Huang, H.Q.; Wang, Y.Y.; Li, J.S. Role of process parameters on phase purity of o-LiMnO2 and synthesis of L1.6Mn1.6O4 as lithium ion-sieve. Chin. J. Inorg. Chem. 2020, 36, 536–546. [Google Scholar] [CrossRef]
  23. Wang, Q.; Yao, M.; Zhu, A.; Wang, Q.; Wu, H.; Zhang, Y. Semi-metallic superionic layers suppressing voltage fading of Li-rich layered oxide towards superior-stable Li-ion batteries. Angew. Chem. Int. Ed. 2023, 62, 202309049. [Google Scholar] [CrossRef]
  24. Qiu, Z.; Wang, M.; Chen, Y.; Zhang, T.; Yang, D.; Qiu, F. Li4Mn5O12 doped cellulose acetate membrane with low Mn loss and high stability for enhancing lithium extraction from seawater. Desalination 2021, 506, 115003. [Google Scholar] [CrossRef]
  25. Bao, L.; Tang, W.; Sun, S. Semi-wet synthesis of high-performance Li1.6Mn1.6O4 for selective lithium extraction from Salt Lakes Brine. Desalination 2024, 584, 117730. [Google Scholar] [CrossRef]
  26. Qian, F.; Zhao, B.; Guo, M.; Li, J.; Liu, Z.; Wu, Z. K-gradient doping to stabilize the spinel structure of Li1.6Mn1.6O4 for Li+ recovery. Dalton Trans. 2020, 49, 10939–10948. [Google Scholar] [CrossRef]
  27. Chitrakar, R.; Kanoh, H.; Miyai, Y.; Ooi, K. A new type of manganese oxide (MnO2·0.5H2O) derivedfrom Li1.6Mn1.6O4 and its lithium ion-sieve properties. Chem. Mater. 2000, 12, 3151–3157. [Google Scholar] [CrossRef]
  28. Hayashi, F.; Kurokawa, S.; Shiiba, H.; Wagata, H.; Wagata, H.; Yubbuta, K.; Oishi, S.; Nishikiori, H.; Teshima, K. Exceptional flux growth and chemical transformation of metastable orthorhombic LiMnO2 cuboids into hierarchically-structured porous H1.6Mn1.6O4 rods as Li ion sieves. Crys. Growth Des. 2016, 16, 6178–6185. [Google Scholar] [CrossRef]
  29. Ariza, M.; Jones, D.; Rozière, J.; Chitrakar, R.; Ooi, K. Probing the local structure and the role of protons in lithium sorption processes of a new lithium-rich manganese oxide. Chem. Mater. 2006, 18, 1885–1890. [Google Scholar] [CrossRef]
  30. Tang, W.; Kanoh, H.; Ooi, K. Lithium ion extraction from orthorhombic LiMnO2 in ammonium peroxodisulfate solutions. J. Solid. State Chem. 1999, 142, 19–28. [Google Scholar] [CrossRef]
  31. Feng, Q.; Kanoh, H.; Ooi, K. Manganese oxide porous crystals. J. Mater. Chem. 1999, 9, 319–333. [Google Scholar] [CrossRef]
  32. Liu, Q.; Zhang, L.; Liu, X.; Zhong, Z.; Deng, W.; Yang, P. The preparation path, adsorption characteristics and manganese dissolution loss mechanism of manganese-based ion-sieve MnO2·0.5H2O for liquid phase lithium resource recovery. J. Environ. Chem. Eng. 2025, 13, 115154. [Google Scholar] [CrossRef]
  33. Li, X.; Tao, B.; Jia, Q.; Guo, R. Preparation and adsorption performance of multi-morphology H1.6Mn1.6O4 for lithium extraction. Chin. J. Chem. Eng. 2021, 34, 68–76. [Google Scholar] [CrossRef]
  34. Xu, N.; Liu, J.; Han, L.; Feng, B.; Li, Y.; Yang, Y.; Bian, S. Preparation, modification and adsorption properties of spinel-type H1.6Mn1.6O4 lithium-ion sieves with spiny nanotube morphology. J. Mater. Sci. 2023, 58, 4707–4725. [Google Scholar] [CrossRef]
  35. Li, H.; Qin, J.; Zhao, K.; Guo, Y.; Tong, B.; Samadiy, M.; Alimov, U.; Deng, T. Novel lithium ion-sieve spinning fiber composite of PVDF-HMO for lithium recovery from geothermal water. J. Clean. Prod. 2024, 434, 139997. [Google Scholar] [CrossRef]
  36. Xu, J.; Chen, P. Preparation and characterization of lithium-ion sieve with attapulgite. Desalination 2024, 571, 117111. [Google Scholar] [CrossRef]
  37. Li, X. Preparation and Properties of Bifunctional Layered Lithium Manganate Pre-Lithiation Agent. Master’s Thesis, Central South University, Changsha, China, 1 June 2023. [Google Scholar]
  38. Sun, X.M.; Li, Y.D. Colloidal carbon spheres and their core/shell structures with noble-metal nanoparticles. Angew. Chem. Int. Ed. 2004, 43, 597–601. [Google Scholar] [CrossRef]
  39. Shao, Y.; Ren, B.; Jiang, H.; Zhou, B.; Lv, L.; Ren, J.; Dong, L.; Li, J.; Liu, Z. Dual-porosity Mn2O3 cubes for highly efficient dye adsorption. J. Hazard. Mater. 2017, 333, 222–231. [Google Scholar] [CrossRef]
  40. Karshyga, Z.; Yersaiynova, A.; Yessengaziyev, A.; Orynbayev, B.; Kvyatkovskaya, M.; Silachyov, I. Synthesis of manganese oxide sorbent for the extraction of lithium from hydromineral raw materials. Materials 2023, 16, 7548. [Google Scholar] [CrossRef]
  41. Liu, R.; Zhao, S.; Zhang, M.; Feng, F.; Shen, Q. High interfacial lithium storage capability of hollow porous Mn2O3 nanostructures obtained from carbonate precursors. Chem. Commun. 2015, 51, 5728–5731. [Google Scholar] [CrossRef]
  42. Li, X.; Wang, Z.; Zhang, H.; Zhang, W.; Jiang, J.; Guo, R. An ion-sieve-tailored biomimetic porous nanofiber as an efficient adsorbent for extraction of lithium from brine. New J. Chem. 2023, 47, 4187–4191. [Google Scholar] [CrossRef]
  43. Tabuchi, M.; Nabeshima, Y.; Takeuchi, T.; Kageyama, H.; Tatsumi, T.; Akimoto, J.; Shibuya, H.; Imaizumi, J. Synthesis and electrochemical characterization of Fe and Ni substituted Li2MnO3-an effective means to use Fe for constructing “Co-free” Li2MnO3 based positive electrode material. J. Power Sources 2011, 196, 3611–3622. [Google Scholar] [CrossRef]
  44. Yu, Q.; Morioka, E.; Sasaki, K. Characterization of lithium ion sieve derived from biogenic Mn oxide. Microporous Mesoporous Mat. 2013, 179, 122–127. [Google Scholar] [CrossRef]
  45. Chen, L.; Xu, X.; Song, J.; Zhu, X.; Qi, Z. Microwave assisted hydrothermal synthesis of MnO2·0.5H2O ion-sieve for lithium ion selective adsorption. Sep. Sci. Technol. 2016, 51, 874–882. [Google Scholar] [CrossRef]
  46. Yin, R.; Zhao, Z.; Xu, W.; He, L. LiMn2O4 submicronization: Shorten Li diffusion pathway for enhancing electrochemical lithium extraction and cycle performance. Sep. Purif. Technol. 2025, 359, 130394. [Google Scholar] [CrossRef]
  47. Li, N.; Gan, K.; Lu, D.; Zhang, J.; Wang, L. Preparation of three-dimensional macroporous-mesoporous lithium ion sieve with high Li+ adsorption capacity. Res. Chem. Intermed. 2018, 44, 1105–1117. [Google Scholar] [CrossRef]
  48. Wang, C.; Zhai, Y.; Wang, X.; Zeng, M. Preparation and characterization of lithium λ-MnO2 ion-sieves. Front. Chem. Sci. Eng. 2014, 8, 471–477. [Google Scholar] [CrossRef]
  49. Ozgur, C. Preparation and characterization of LiMn2O4 ion-sieve with high Li+ adsorption rate by ultrasonic spray pyrolysis. Solid. State Ionics 2010, 181, 1425–1428. [Google Scholar] [CrossRef]
  50. Zhang, G.; Zhang, J.; Zhou, Y.; Qi, G.; Zeng, J.; Sun, Y.; Shen, Y.; Li, X.; Ren, X.; Dong, S.; et al. Practical synthesis of manganese oxide MnO2·0.5H2O for an advanced and applicable lithium ion-sieve. J. Solid. State Chem. 2021, 293, 121768. [Google Scholar] [CrossRef]
  51. Zhang, J.; Chen, T.; Ma, L.; Hai, C.; Sun, Y.; Dong, S.; He, X.; Xu, Q.; Chen, J.; Su, H.; et al. Factors affecting the efficiency of electrochemical lithium extraction: A systematic review from materials to processes technology. Desalination 2025, 602, 118570. [Google Scholar] [CrossRef]
  52. Liu, Q.; Dong, J.; Yu, Y. Preparation of layered lithium ion-sieve by solid-phase method and their lithium extraction performance. Desalin Water Treat. 2024, 319, 100547. [Google Scholar] [CrossRef]
  53. Song, L.; Liu, M.; Nian, M.; Yang, G. Preparation of HMn2O4 lithium-ion sieves with low manganese dissolution loss for improved cycling stability. RSC Adv. 2024, 14, 19795–19805. [Google Scholar] [CrossRef]
Figure 1. XRD patterns of (a) MnCO3/C and (b) Mn2O3.
Materials 18 02373 g001
Figure 2. SEM images of (a) carbon spheres, (b) cubic Mn2O3, (c) and the partial enlargement.
Materials 18 02373 g002
Figure 3. XRD patterns of samples at different calcination temperatures.
Materials 18 02373 g003
Figure 4. XRD patterns of samples with different Li/Mn ratios.
Materials 18 02373 g004
Figure 5. XRD patterns of samples with different glucose amounts.
Materials 18 02373 g005
Figure 6. (a) SEM image and (b) XRD pattern of Li1.6Mn1.6O4.
Materials 18 02373 g006
Figure 7. The loss percentage of dissolved Mn and corresponding adsorption capacity at different (a) calcination temperatures, (b) molar ratios of Li/Mn, and (c) glucose contents.
Materials 18 02373 g007
Figure 8. Loss percentage of dissolved Mn and corresponding adsorption capacity of precursors during circulation.
Materials 18 02373 g008
Figure 9. Adsorption capacity for various ions.
Materials 18 02373 g009
Figure 10. The variation in adsorption capacity over time.
Materials 18 02373 g010
Figure 11. Fitting results of (a) pseudo-first-order dynamics, (b) pseudo-second-order dynamics, and (c) intraparticle diffusion model.
Materials 18 02373 g011
Figure 12. Adsorption isotherm and fitting results of the (a) Langmuir and (b) Freundlich equations.
Materials 18 02373 g012
Table 1. Performance of other solid-phase synthetic non-porous lithium ion sieves.
PrecursorAdsorption Capacity (mg/g)Loss Percentage of Dissolved Mn (%)Cite
LiMn2O430.925[48]
LiMn2O432.8-[49]
Li1.6Mn1.6O429.41.62[50]
Li1.6Mn1.6O434.73.4This article
Disclaimer/Publisher’s Note: The statements, opinions and data contained in all publications are solely those of the individual author(s) and contributor(s) and not of MDPI and/or the editor(s). MDPI and/or the editor(s) disclaim responsibility for any injury to people or property resulting from any ideas, methods, instructions or products referred to in the content.

