
Microscopic Distribution of Quaternary Ammonium Salt Organic Modifiers in the Interlayer Space of Montmorillonite: Molecular Simulation Study

Abstract
1. Introduction
2. Computational Details
2.1. Computational Method
2.2. Molecular Models
2.3. Molecular Dynamics Simulations
3. Results and Discussion
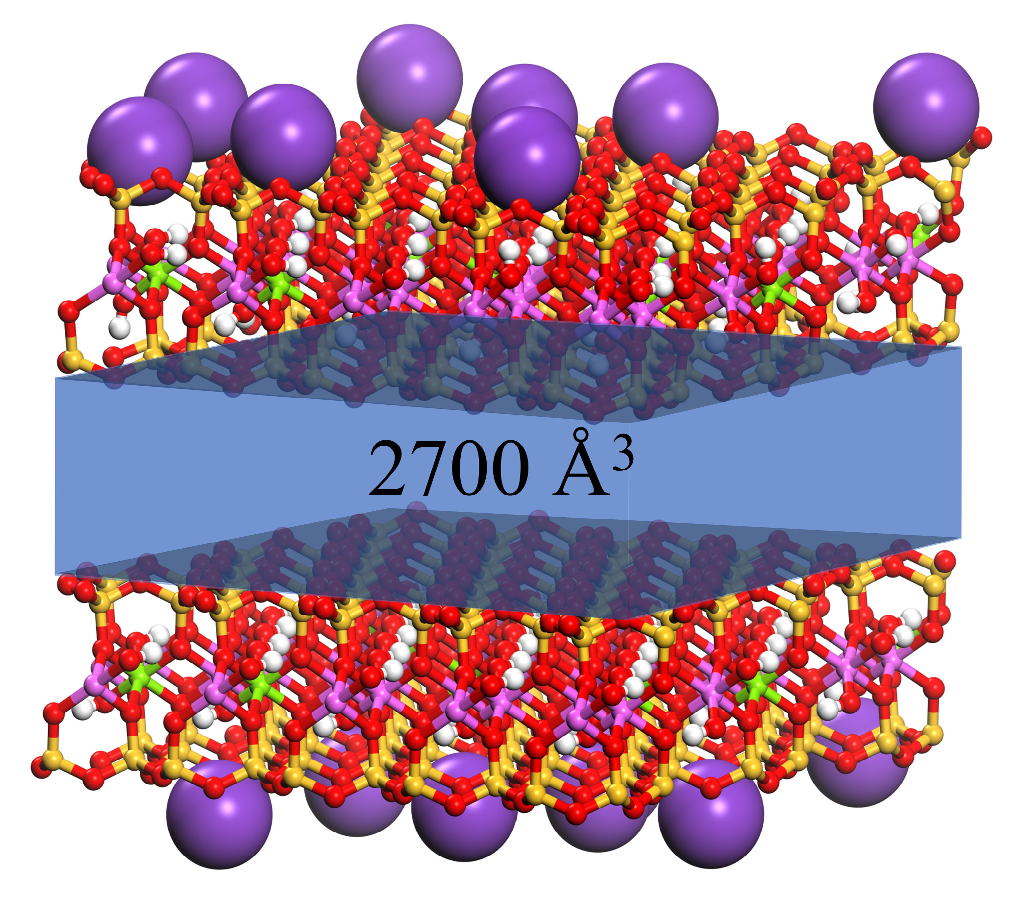
3.1. Stability of the Model
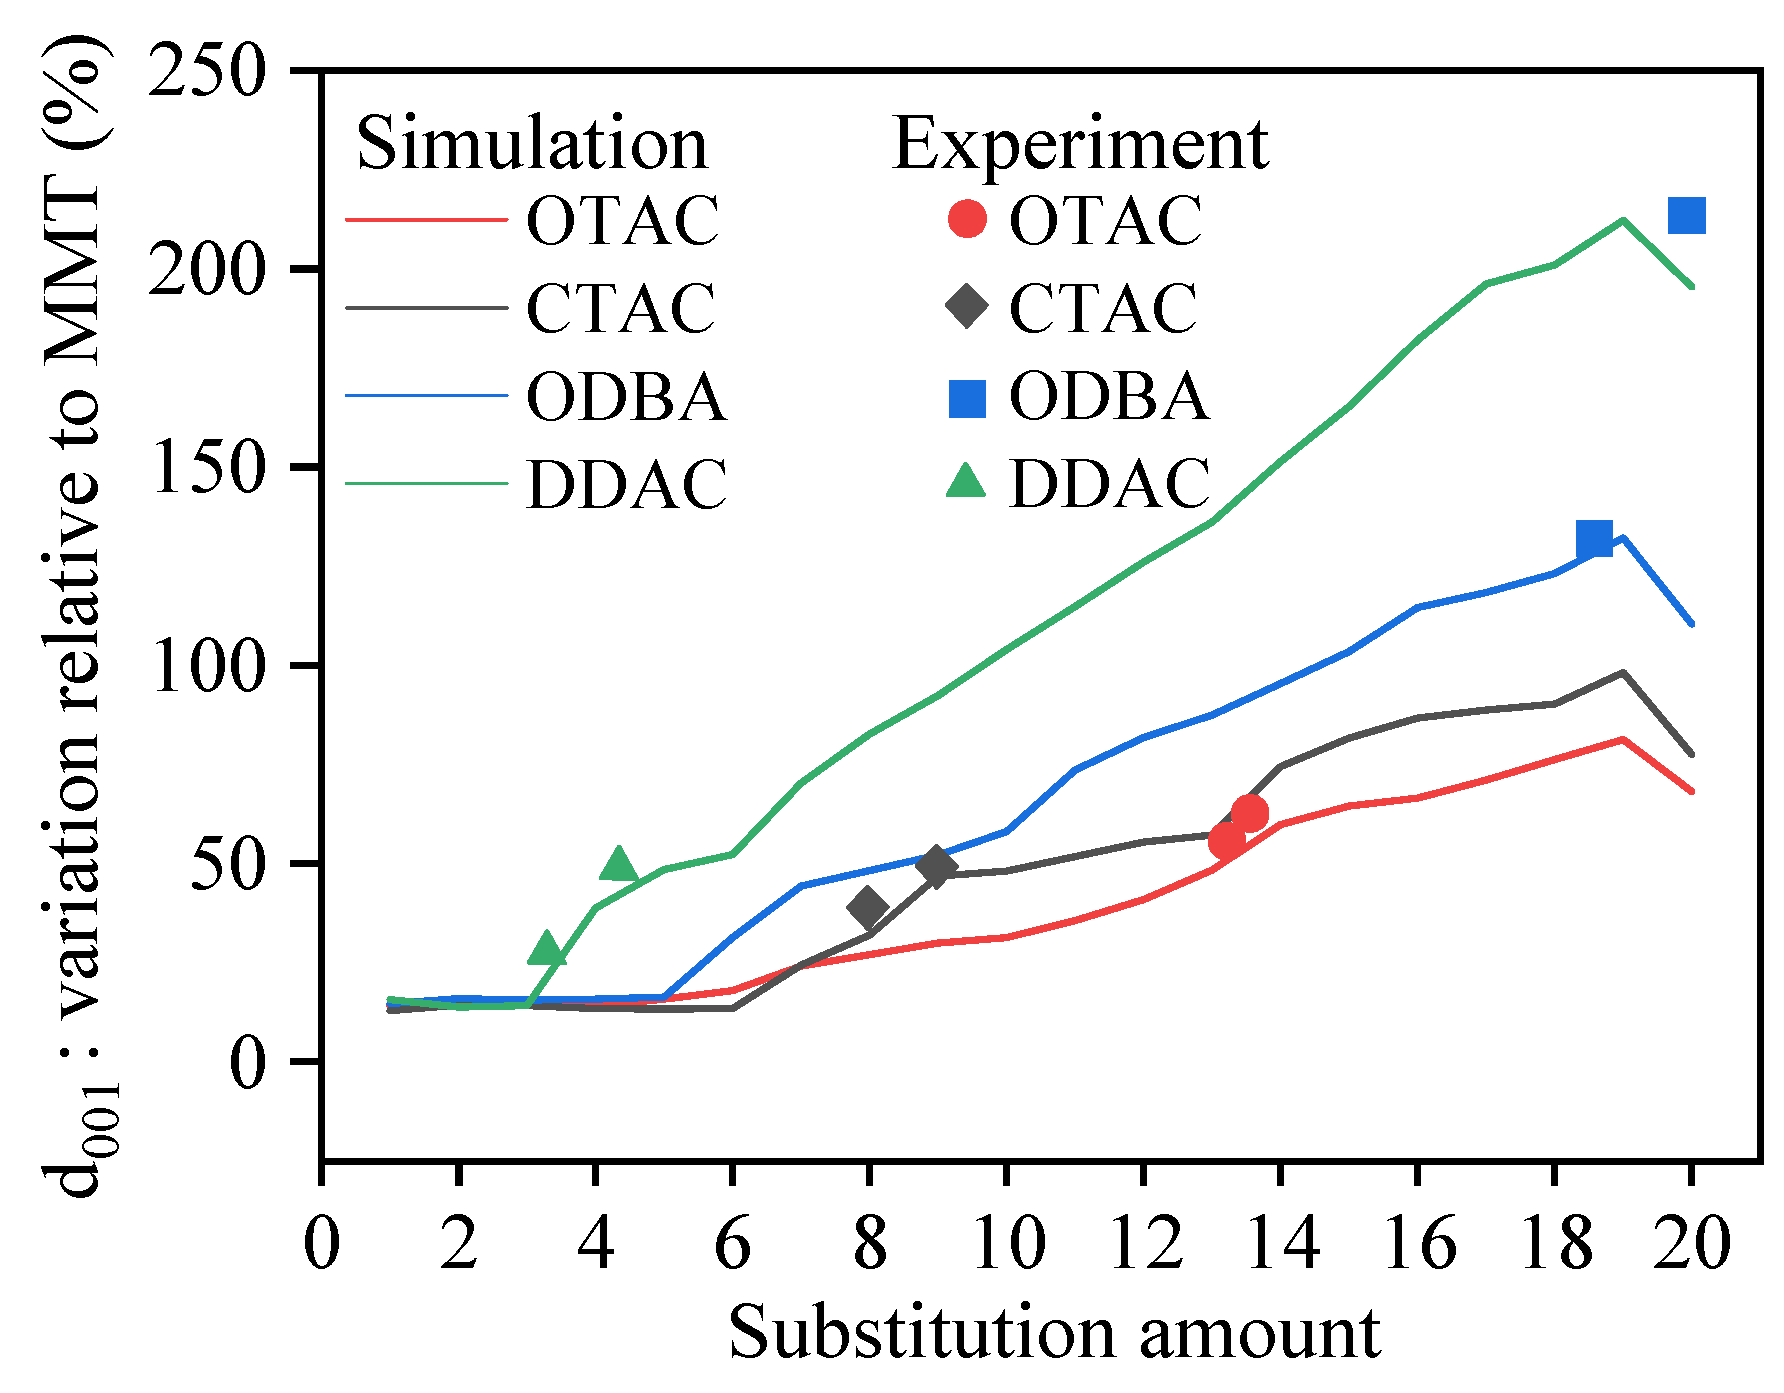
3.2. Basal Spacing
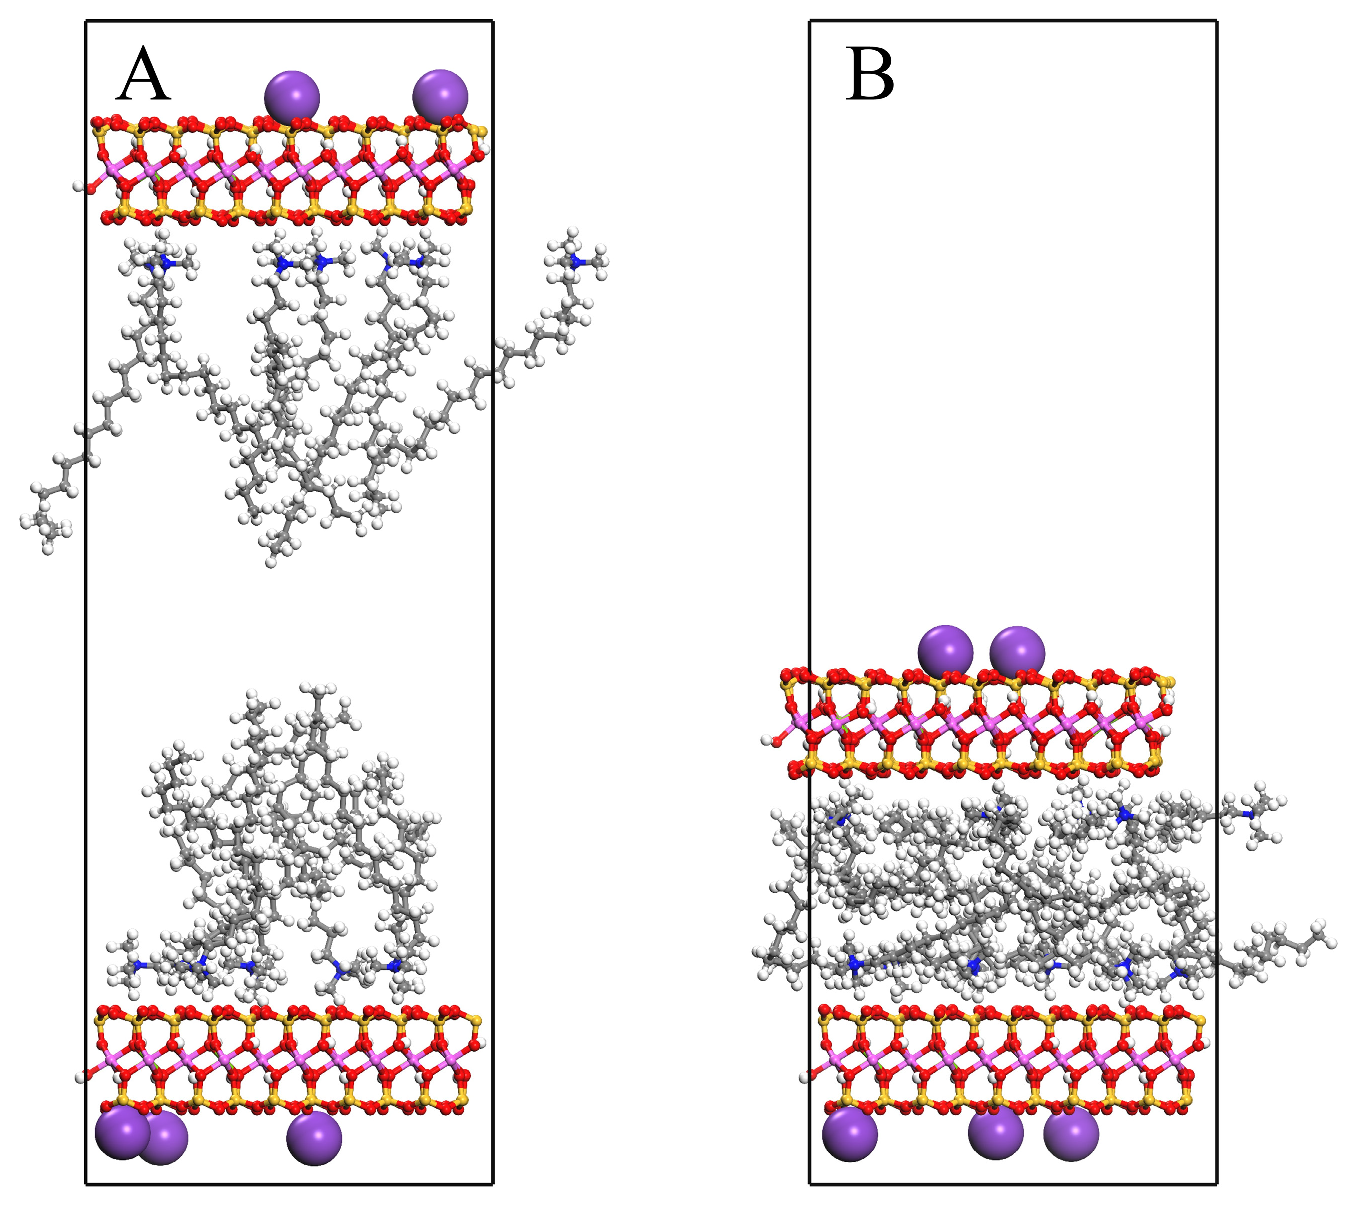
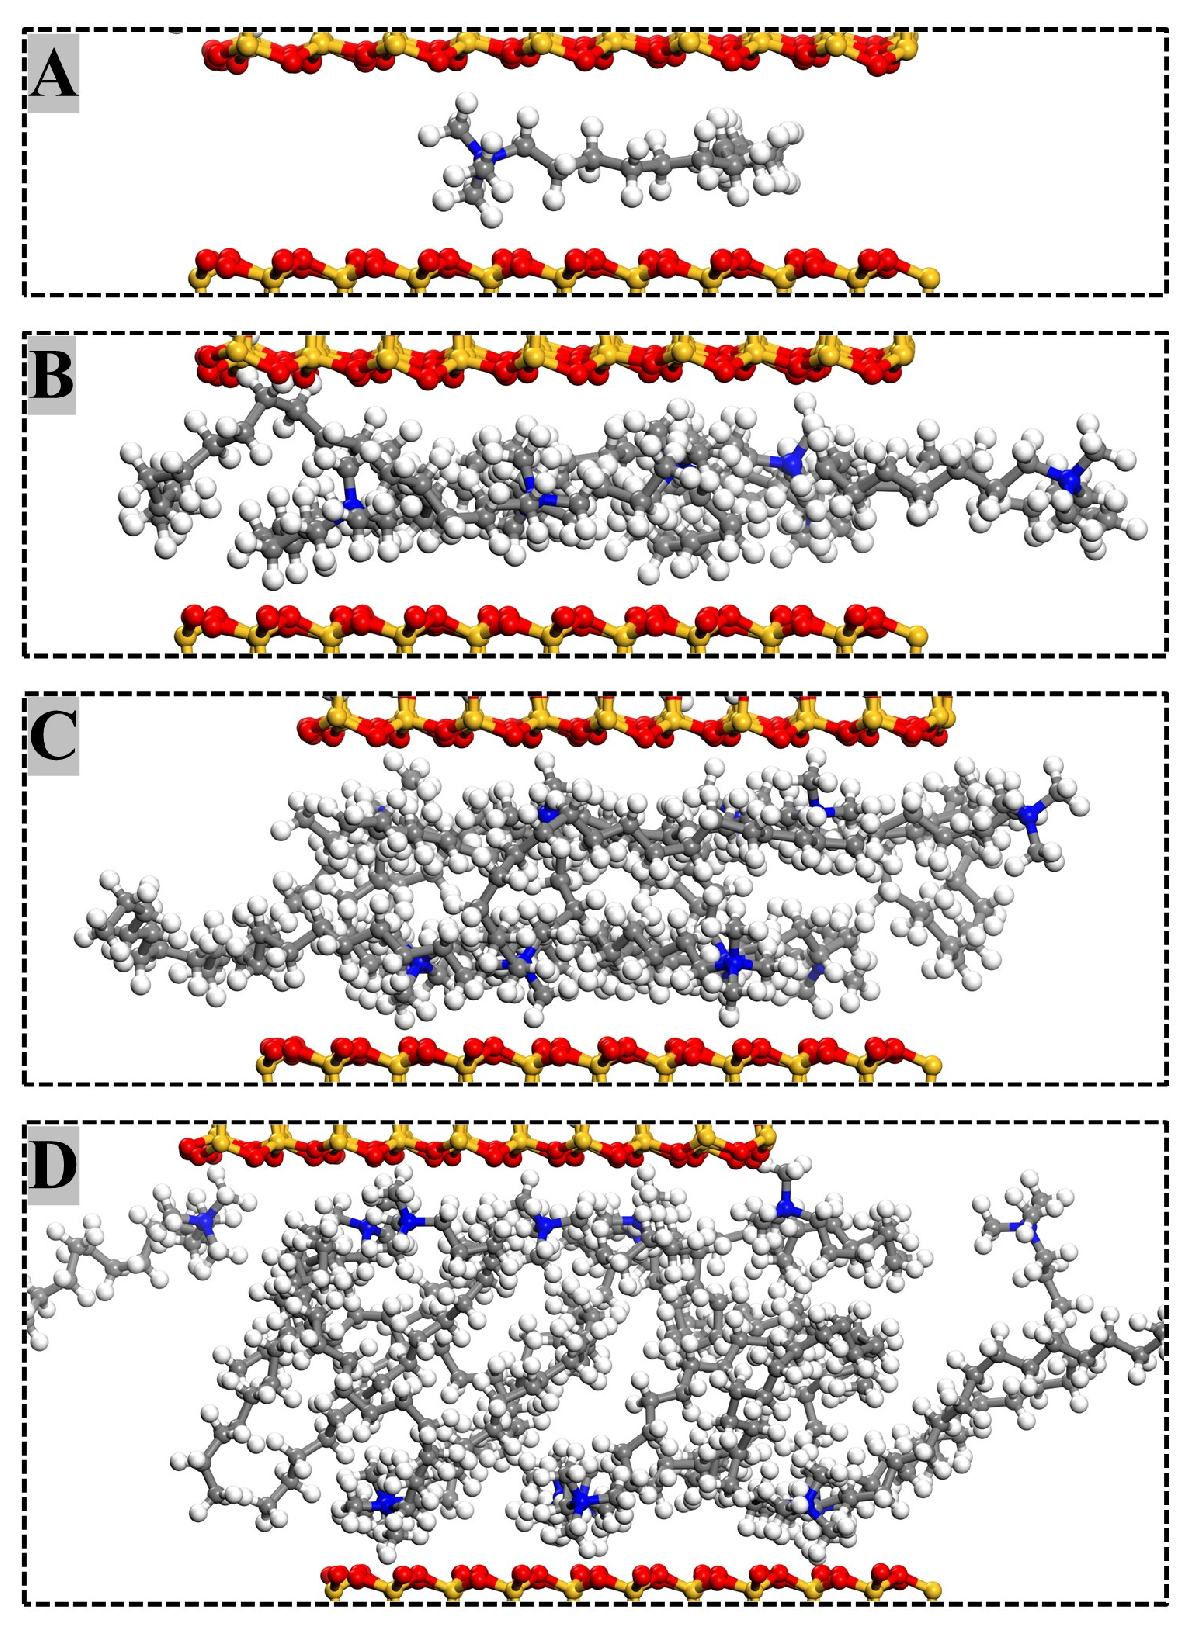
3.3. Molecular Arrangement and Movement
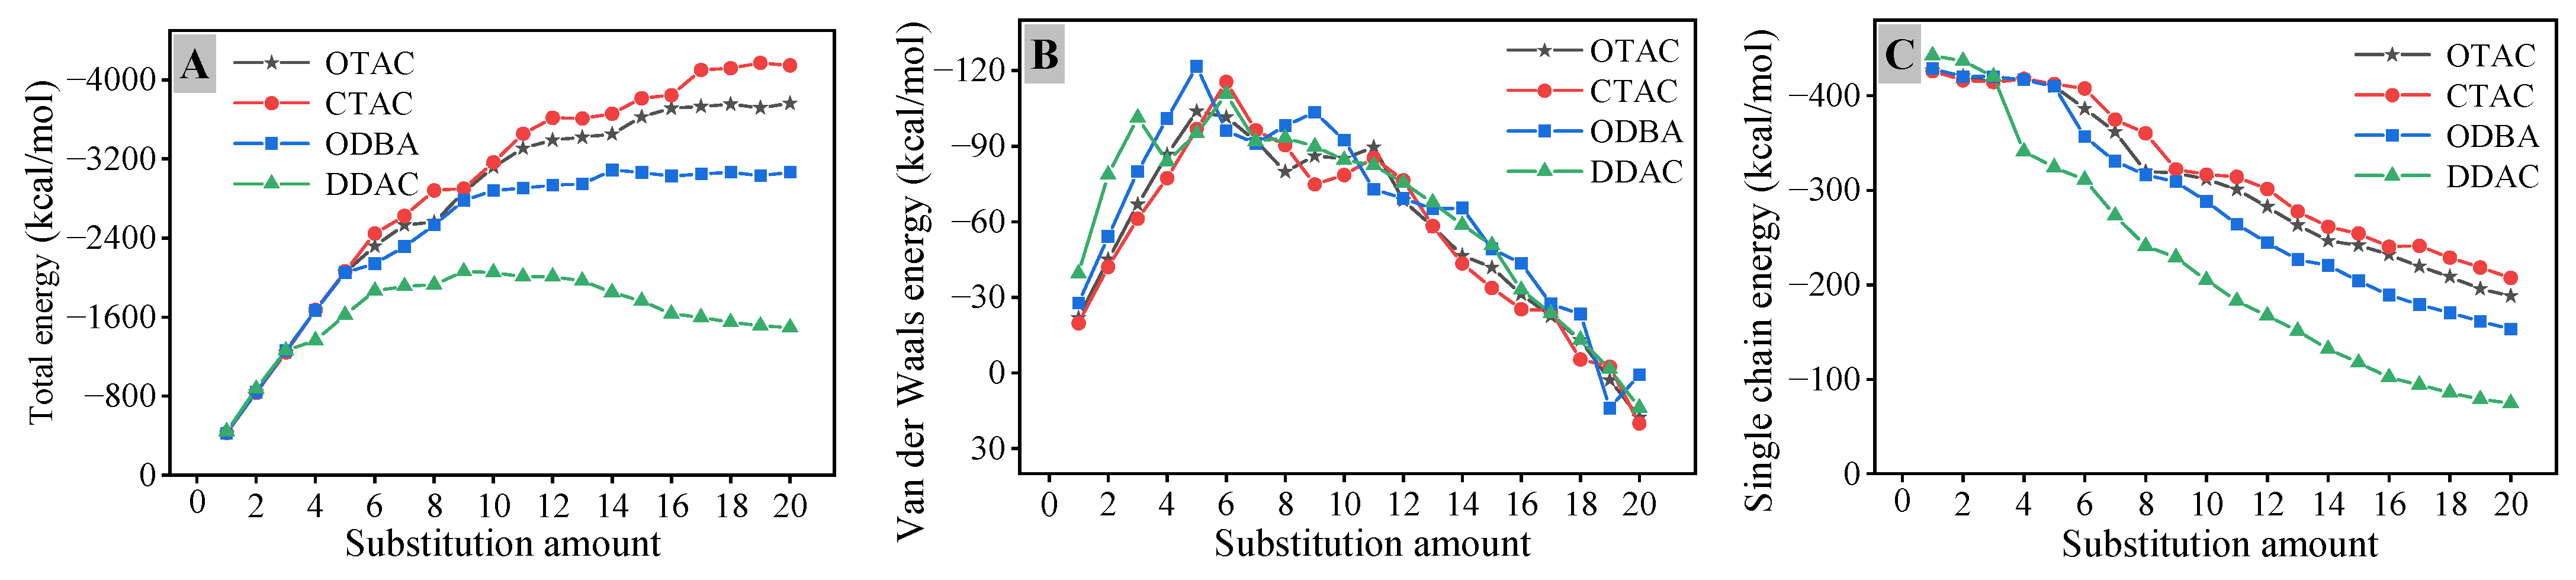
3.4. Interaction Energy
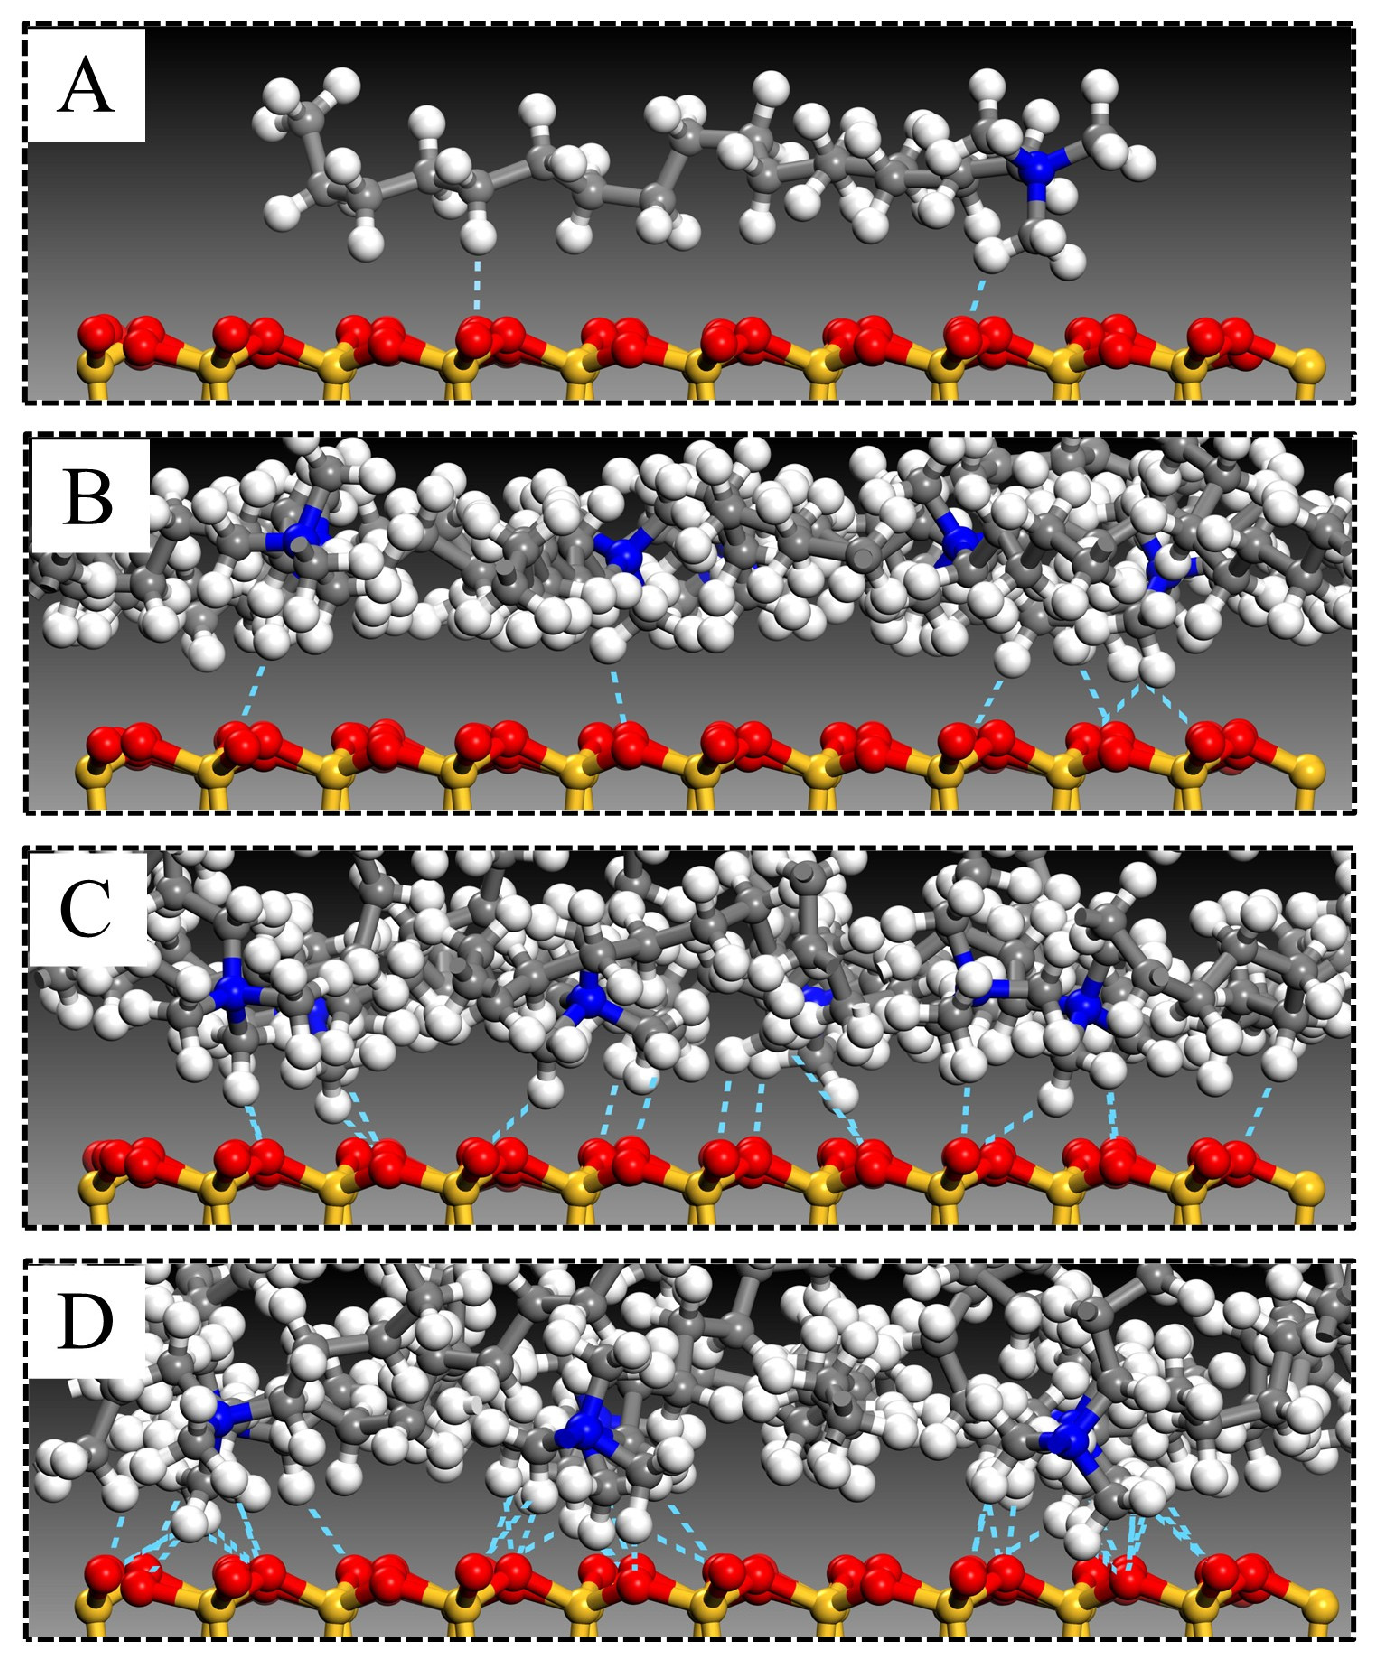
3.5. Hydrogen Bond Interactions
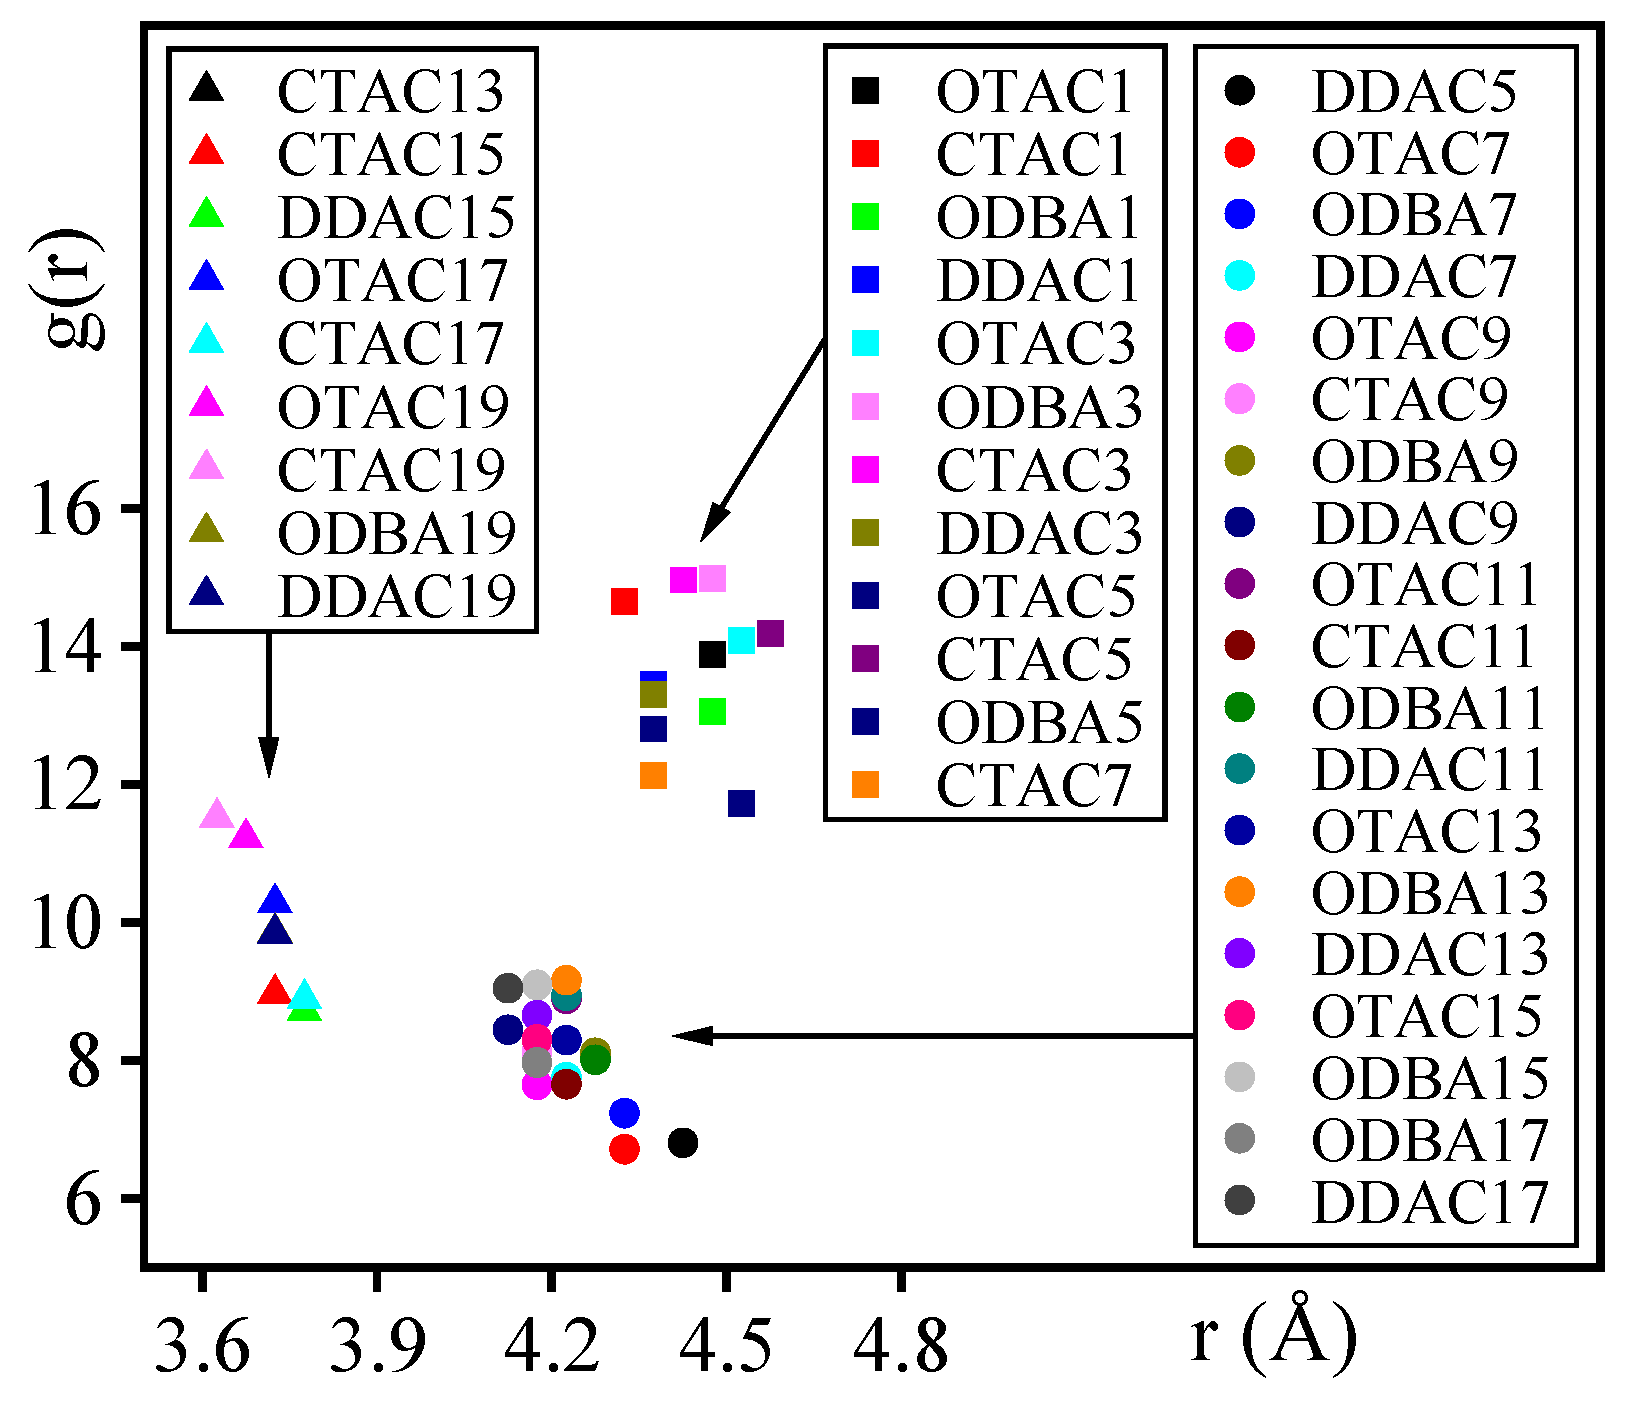
3.6. Nitrogen Atom Distance
3.7. Comparison to Experiments
4. Conclusions
Author Contributions
Funding
Institutional Review Board Statement
Informed Consent Statement
Data Availability Statement
Conflicts of Interest
Abbreviations
| MMT | Montmorillonite |
| OMMT | Organic Montmorillonite |
| MD | Molecular dynamics |
| OTAC | Octadecyl Trimethyl Ammonium Chloride |
| CTAC | Cetyl Trimethyl Ammonium Chloride |
| ODBA | Octadecyl dimethyl benzyl ammonium chloride |
| DDAC | Dioctadecyl dimethyl ammonium chloride |
| Eint | Interaction energy |
| Eelec | Electrostatic interaction energy |
| EvdW | Van der Waals interaction energy |
| Esingle | Single chain interaction energy |
| H-bond | Hydrogen bond |
| H | Hydrogen atom |
| C | Carbon atom |
| O | Oxygen atom |
| N | Nitrogen atom |
| K+ | Potassium ion |
| NVT | Canonical ensemble |
| RDF | Radial distribution function |
References
- Wu, L.; He, X.; Zhao, Y.; Huang, K.; Tong, Z.; Liao, B.; Pang, H. Montmorillonite-based materials for electrochemical energy storage. Green Chem. 2024, 26, 678–704. [Google Scholar] [CrossRef]
- Chellapandi, T.; Madhumitha, G. Montmorillonite clay-based heterogenous catalyst for the synthesis of nitrogen heterocycle organic moieties: A review. Mol. Divers. 2022, 26, 2311–2339. [Google Scholar] [CrossRef] [PubMed]
- Huang, W.J.; Liu, J.H.; She, Q.M.; Zhong, J.Q.; Christidis, G.E.; Zhou, C.H. Recent advances in engineering montmorillonite into catalysts and related catalysis. Catal. Rev. Sci. Eng. 2023, 65, 929–985. [Google Scholar] [CrossRef]
- Al Kausor, M.; Sen Gupta, S.; Bhattacharyya, K.G.; Chakrabortty, D. Montmorillonite and modified montmorillonite as adsorbents for removal of water soluble organic dyes: A review on current status of the art. Inorg. Chem. Commun. 2022, 143, 109686. [Google Scholar] [CrossRef]
- Zango, Z.U.; Garba, A.; Garba, Z.N.; Zango, M.U.; Usman, F.; Lim, J. Montmorillonite for adsorption and catalytic elimination of pollutants from wastewater: A state-of-the-arts review. Sustainability 2022, 14, 16441. [Google Scholar] [CrossRef]
- Hossain, S.I.; Kukushkina, E.A.; Izzi, M.; Sportelli, M.C.; Picca, R.A.; Ditaranto, N.; Cioffi, N. A review on montmorillonite-based nanoantimicrobials: State of the art. Nanomaterials 2023, 13, 848. [Google Scholar] [CrossRef]
- Wang, W.; Wu, L.; Chang, L.; Yang, W.; Si, L.; Nan, H.; Peng, W.; Cao, Y. Functionality developments in montmorillonite nanosheet: Properties, preparation, and applications. Chem. Eng. J. 2024, 499, 156186. [Google Scholar] [CrossRef]
- Hassen, J.H.; Abdalkadir, H.K.; Abed, S.F. An overview of medical applications of montmorillonite clay. J. Med. Sci. 2023, 92, e826. [Google Scholar] [CrossRef]
- Prasad Kumara, P.A.A.S.; Deng, X.; Cooper, P.R.; Cathro, P.; Dias, G.; Gould, M.; Ratnayake, J. Montmorillonite in dentistry: A review of advances in research and potential clinical applications. Mater. Res. Express 2024, 11, 72001. [Google Scholar] [CrossRef]
- Archibong, F.N.; Orakwe, L.C.; Ogah, O.A.; Mbam, S.O.; Ajah, S.A.; Okechukwu, M.E.; Igberi, C.O.; Okafor, K.J.; Chima, M.O.; Ikelle, I.I. Emerging progress in montmorillonite rubber/polymer nanocomposites: A review. J. Mater. Sci. 2023, 58, 2396–2429. [Google Scholar] [CrossRef]
- Chen, X.X.; Liu, J.H.; Kurniawan, A.; Li, K.J.; Zhou, C.H. Inclusion of organic species in exfoliated montmorillonite nanolayers towards hierarchical functional inorganic-organic nanostructures. Soft Matter 2021, 17, 9819–9841. [Google Scholar] [CrossRef] [PubMed]
- Nguyen Van, H.; Chu Van, H.; Luu Hoang, T.; Vo Nguyen, D.K.; Ha Thuc, C.N. The starch modified montmorillonite for the removal of Pb(II), Cd(II) and Ni(II) ions from aqueous solutions. Arab. J. Chem. 2020, 13, 7212–7223. [Google Scholar] [CrossRef]
- Abulyazied, D.E.; Ene, A. An investigative study on the progress of nanoclay-reinforced polymers: Preparation, properties, and applications: A review. Polymers 2021, 13, 4401. [Google Scholar] [CrossRef] [PubMed]
- Xu, H.; Deng, H.; Chen, H.; Zhou, H.; Zhou, X.; Pu, X. One step synthesis, characterization of modified montmorillonite with Hydrothermal-Assist for triazolone sustained release system with pH sensitivity. Mater. Sci. 2020, 26, 451–456. [Google Scholar] [CrossRef]
- Yan, H.; Chen, X.; Bao, C.; Yi, J.; Lei, M.; Ke, C.; Zhang, W.; Lin, Q. Synthesis and assessment of CTAB and NPE modified organo-montmorillonite for the fabrication of organo-montmorillonite/alginate based hydrophobic pharmaceutical controlled-release formulation. Colloids Surf. B Biointerfaces 2020, 191, 110983. [Google Scholar] [CrossRef]
- Li, Y.; Yang, D.; Cheng, F.; Li, Z.; Wu, D. Regulating interlayer and surface properties of montmorillonite by dodecyl dimethyl betaine for enhanced lead ion capture. Surf. Interfaces 2023, 42, 103348. [Google Scholar] [CrossRef]
- Chen, Y.; Zhao, H.; Liu, Y.; Chu, H. Enhancing the mechanical properties of bismaleimide resin with montmorillonite modified by two intercalators (amino-terminated polyoxypropylene and octadecyl trimethyl ammonium chloride). Pigment. Resin Technol. 2021, 51, 406–412. [Google Scholar] [CrossRef]
- Kodali, D.; Uddin, M.; Moura, E.A.B.; Rangari, V.K. Mechanical and thermal properties of modified Georgian and Brazilian clay infused biobased epoxy nanocomposites. Mater. Chem. Phys. 2021, 257, 123821. [Google Scholar] [CrossRef]
- Qian, Y.; Huang, Z.; Zhou, G.; Chen, C.; Sang, Y.; Yu, Z.; Jiang, L.; Mei, Y.; Wei, Y. Preparation and properties of organically modified Na-montmorillonite. Materials 2023, 16, 3184. [Google Scholar] [CrossRef]
- Yan, Z.; Wang, F.; Liu, Y.; Fan, J.; Wang, P.; Chu, M. Dynamic wetting of a CO2-H2O-montmorillonite system using molecular dynamics. Fuel 2024, 377, 132787. [Google Scholar] [CrossRef]
- Zhang, Y.Y.; Chen, M.; Deng, Y.; Jin, Y.; Lu, Y.H.; Xia, Y. Molecular dynamics simulation of temperature and pressure effects on hydration characteristics of montmorillonites. J. Chin. Ceram Soc. 2018, 46, 1489–1498. [Google Scholar]
- Gao, R.B.; Zhao, Y.L.; Chen, L.C.; Zhang, T.T.; Bai, H.Y.; Song, S.X. Effect of layer charge density on the exfoliation of montmorillonite to prepare two-dimensional nanosheets. J. Chin. Ceram Soc. 2021, 49, 1420–1428. [Google Scholar]
- Li, C.; Zhang, Z.; Zhan, H.; Zheng, Z.; Bai, J.; Gu, Y. Mechanical properties of single-layer diamond reinforced poly (vinyl alcohol) nanocomposites through atomistic simulation. Macromol. Mater. Eng. 2021, 306, 2100292. [Google Scholar] [CrossRef]
- Heinz, H.; Lin, T.; Kishore Mishra, R.; Emami, F.S. Thermodynamically consistent force fields for the assembly of inorganic, organic, and biological nanostructures: The interface force field. Langmuir 2013, 29, 1754–1765. [Google Scholar] [CrossRef] [PubMed]
- Qiu, Q.; Zhang, J.; Yang, L.; Zhang, J.; Chen, B.; Tang, C. Simulation of the diffusion behavior of water molecules in palm oil and mineral oil at different temperatures. Renew. Energy 2021, 174, 909–917. [Google Scholar] [CrossRef]
- Li, L.; Xu, X.; Song, P.; Cao, Q.; Qiao, X.; Xu, Z.; Yang, Y.; Zuo, C.; Wang, H. Insights into the hydrogen-bond cross-linking effects of small multiamine molecules on physical and mechanical properties of poly (vinly alcohol) by molecular dynamics simulations. Model. Simul. Mater. Sci. Eng. 2021, 29, 35012. [Google Scholar] [CrossRef]
- Abreu, C.R.A.; Tuckerman, M.E. Multiple timescale molecular dynamics with very large time steps: Avoidance of resonances. Eur. Phys. J. B 2021, 94, 231. [Google Scholar] [CrossRef]
- Heinz, H.; Koerner, H.; Anderson, K.L.; Vaia, R.A.; Farmer, B.L. Force field for mica-type silicates and dynamics of octadecylammonium chains grafted to montmorillonite. Chem. Mater. 2005, 17, 5658–5669. [Google Scholar] [CrossRef]
- Li, L.; Wang, Y.; Gao, J.; Chi, X.; Han, G.; Guo, N. Effects of microstructure on the breakdown characteristics of polyethylene-montmorillonite nanocomposites. J. Appl. Polym. Sci. 2022, 139, e52678. [Google Scholar] [CrossRef]
- Yi, X.; Yu, W.; Yan, J.; Cheng, J.; Lei, Q.; Liao, Y.; Jiang, H. Mechanical properties and glass transition temperature of PVA-OMMT composites: A molecular dynamics simulation. Mater. Today Commun. 2025, 42, 111287. [Google Scholar] [CrossRef]
- Shuai, C.; Yu, L.; Feng, P.; Zhong, Y.; Zhao, Z. Organic montmorillonite produced an interlayer locking effect in a polymer scaffold to enhance interfacial bonding. Mater. Chem. Front. 2020, 4, 2398–2408. [Google Scholar] [CrossRef]
- Li, T.; Chai, Z.; Yang, Z.; Yan, K.; Liu, X.; Xiao, C. Molecular dynamics simulation of the influence of doping on the water absorption characteristics of kaolinite. Surf. Sci. 2023, 737, 122368. [Google Scholar] [CrossRef]
- Wang, Y.P.; Tang, S.B.; Liu, X.J.; Wang, P.F.; Gao, Y.W.; Yang, Y.; Liang, L.X. Molecular dynamics simulation of sodium montmorillonite hydration under complex buried conditions. Chin. J. Geotech. Eng. 2025, 47, 599–607. [Google Scholar]
- Zhao, H.H.; Jiang, S.Q.; Ge, Y.Y.; Liu, C. Molecular dynamics simulation of water molecules adsorption by different cations based montmorillonite. Sci. China Technol. Sci. 2019, 49, 703–715. [Google Scholar] [CrossRef]
- Su, H.; Zhang, Y.; Zhou, J.; Hou, Q. Molecular dynamics simulation of dodecyl dimethyl benzyl ammonium cation-intercalated montmorillonite. Clay Miner. 2023, 58, 415–423. [Google Scholar] [CrossRef]
- Qiu, J.; Liu, D.; Chen, G.; Wang, Y.; Jiang, S.; Wu, P.; Wang, G.; Lyu, X. Microscopic distribution of chemical constituents in the interlayer space of OTAC intercalated montmorillonite complex: Molecular simulation study. Chemistryselect 2020, 5, 8142–8150. [Google Scholar] [CrossRef]
- Wu, L.; Liao, L.; Lv, G.; Qin, F.; Li, Z. Microstructure and process of intercalation of imidazolium ionic liquids into montmorillonite. Chem. Eng. J. 2014, 236, 306–313. [Google Scholar] [CrossRef]
- Wang, X.; Song, M.; Liu, S.; Wu, S.; Thu, A.M. Analysis of phthalate plasticizer migration from PVDC packaging materials to food simulants using molecular dynamics simulations and artificial neural network. Food Chem. 2020, 317, 126465. [Google Scholar] [CrossRef]
- Ouachtak, H.; El Guerdaoui, A.; El Haouti, R.; Haounati, R.; Ighnih, H.; Toubi, Y.; Alakhras, F.; Rehman, R.; Hafid, N.; Addi, A.A.; et al. Combined molecular dynamics simulations and experimental studies of the removal of cationic dyes on the eco-friendly adsorbent of activated carbon decorated montmorillonite Mt@AC. RSC Adv. 2023, 13, 5027–5044. [Google Scholar] [CrossRef]
- Xia, Y.; Zhang, R.; Xing, Y.; Gui, X. Improving the adsorption of oily collector on the surface of low-rank coal during flotation using a cationic surfactant: An experimental and molecular dynamics simulation study. Fuel 2019, 235, 687–695. [Google Scholar] [CrossRef]
- Luo, Y.; Chen, X.; Wu, S.; Cao, S.; Luo, Z.; Shi, Y. Molecular dynamics simulation study on two-component solubility parameters of carbon nanotubes and precisely tailoring the thermodynamic compatibility between carbon nanotubes and polymers. Langmuir 2020, 36, 9291–9305. [Google Scholar] [CrossRef] [PubMed]
- Joseph, S.; Aluru, N.R. Why are carbon nanotubes fast transporters of water? Nano Lett. 2008, 8, 452–458. [Google Scholar] [CrossRef] [PubMed]
- Tamai, Y.; Tanaka, H.; Nakanishi, K. Molecular dynamics study of polymer-water interaction in hydrogels. 1. Hydrogen-bond structure. Macromolecules 1996, 29, 6750–6760. [Google Scholar] [CrossRef]
- He, C.; Xu, B.; Li, X. Effects of modified single-wall carbon nanotubes on the mechanical properties of polyvinyl alcohol composites by molecular dynamics simulation. Mater. Today Commun. 2023, 35, 105598. [Google Scholar] [CrossRef]
- Yang, C.; Xu, R.; Tang, S.; Zhuang, Y.; Luo, L.; Liu, X. Free H-bonding interaction sites in rigid-chain polymers and their filling approach: A molecular dynamics simulation study. Adv. Theory Simul. 2021, 4, 2100016. [Google Scholar] [CrossRef]
- Li, Z.; Chen, Y.; Liu, Y.; Teng, C.; Chen, S.; Cui, W. Enhanced dielectric and mechanical properties of epoxy-cyanate ester resin by Al2O3 and OMMT. J. Mater. Sci. Mater. Electron. 2020, 31, 8536–8545. [Google Scholar] [CrossRef]
- Shiva, M.; Ghamari Kargar, P.; Seyfollahi, R.; Vakili Nia, F. Organoclay application in the tire tread base composite. Polym. Bull. 2024, 81, 12985–13007. [Google Scholar] [CrossRef]
- Zhang, T.; Ren, B.; Bai, H.; Wen, T.; Chen, L.; Ma, S.; Wang, X.; Wang, S.; Zhao, Y. Subnanometer-scale control of channel height in two-dimensional montmorillonite membrane for ion separation. J. Membr. Sci. 2023, 675, 121573. [Google Scholar] [CrossRef]
- Yuan, X.; Zhang, J.; Zhang, R.; Liu, J.; Wang, W.; Hou, H. Ultrasound-Assisted preparation, characterization, and antibacterial activity of montmorillonite modified by epsilon-Polylysine hydrochloride. Materials 2019, 12, 4148. [Google Scholar] [CrossRef]
- Nunes, M.B.S.; Farias, A.F.F.; Medeiros, E.S.; Oliveira, J.E.; Santos, I.M.G.; Carvalho, L.H.; Santos, A.S.F. The effect of clay organophilization on wood plastic composite (WPC) based on recycled high density polyethylene (HDPE) and coir fiber. Prog. Rubber Plast. Recycl. Technol. 2021, 37, 394–411. [Google Scholar] [CrossRef]
- Jia, M.; Zhang, Z.; Wei, L.; Wu, X.; Cui, X.; Zhang, H.; Lv, W.; Zhang, Q. Study on properties and mechanism of organic montmorillonite modified bitumens: View from the selection of organic reagents. Constr. Build. Mater. 2019, 217, 331–342. [Google Scholar] [CrossRef]
- Gao, H.; Xing, X.; Chu, Y.; Dai, Y.; Zhang, H. Modification of sodium montmorillonite by two quaternary ammonium surfactants with different chain lengths: Preparation, characterization and adsorption of acetaminophen. J. Mol. Struct. 2025, 1326, 141149. [Google Scholar] [CrossRef]


| Substance | Molecular Structure | Model |
|---|---|---|
| MMT | \ | 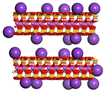 |
| OTAC |  |  |
| CTAC |  |  |
| ODBA | 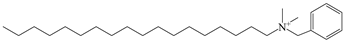 | 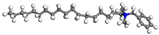 |
| DDAC | 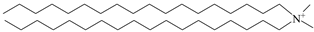 |  |
Disclaimer/Publisher’s Note: The statements, opinions and data contained in all publications are solely those of the individual author(s) and contributor(s) and not of MDPI and/or the editor(s). MDPI and/or the editor(s) disclaim responsibility for any injury to people or property resulting from any ideas, methods, instructions or products referred to in the content. |
© 2025 by the authors. Licensee MDPI, Basel, Switzerland. This article is an open access article distributed under the terms and conditions of the Creative Commons Attribution (CC BY) license (https://creativecommons.org/licenses/by/4.0/).
Share and Cite
Yu, W.; Yi, X.; Yan, J.; Cheng, J.; Ou, S.; Xue, Q. Microscopic Distribution of Quaternary Ammonium Salt Organic Modifiers in the Interlayer Space of Montmorillonite: Molecular Simulation Study. Materials 2025, 18, 2338. https://doi.org/10.3390/ma18102338
Yu W, Yi X, Yan J, Cheng J, Ou S, Xue Q. Microscopic Distribution of Quaternary Ammonium Salt Organic Modifiers in the Interlayer Space of Montmorillonite: Molecular Simulation Study. Materials. 2025; 18(10):2338. https://doi.org/10.3390/ma18102338
Chicago/Turabian StyleYu, Wenxi, Xijian Yi, Jianwei Yan, Juan Cheng, Siyu Ou, and Qiong Xue. 2025. "Microscopic Distribution of Quaternary Ammonium Salt Organic Modifiers in the Interlayer Space of Montmorillonite: Molecular Simulation Study" Materials 18, no. 10: 2338. https://doi.org/10.3390/ma18102338
APA StyleYu, W., Yi, X., Yan, J., Cheng, J., Ou, S., & Xue, Q. (2025). Microscopic Distribution of Quaternary Ammonium Salt Organic Modifiers in the Interlayer Space of Montmorillonite: Molecular Simulation Study. Materials, 18(10), 2338. https://doi.org/10.3390/ma18102338