
Investigating Stress Limitations in Dynamic Response of Coral Limestone Concrete: Integrated FDM-DEM Simulations and Experimental Validation

Abstract
1. Introduction
2. Dynamic Impact Test Study of Reef Limestone Concrete
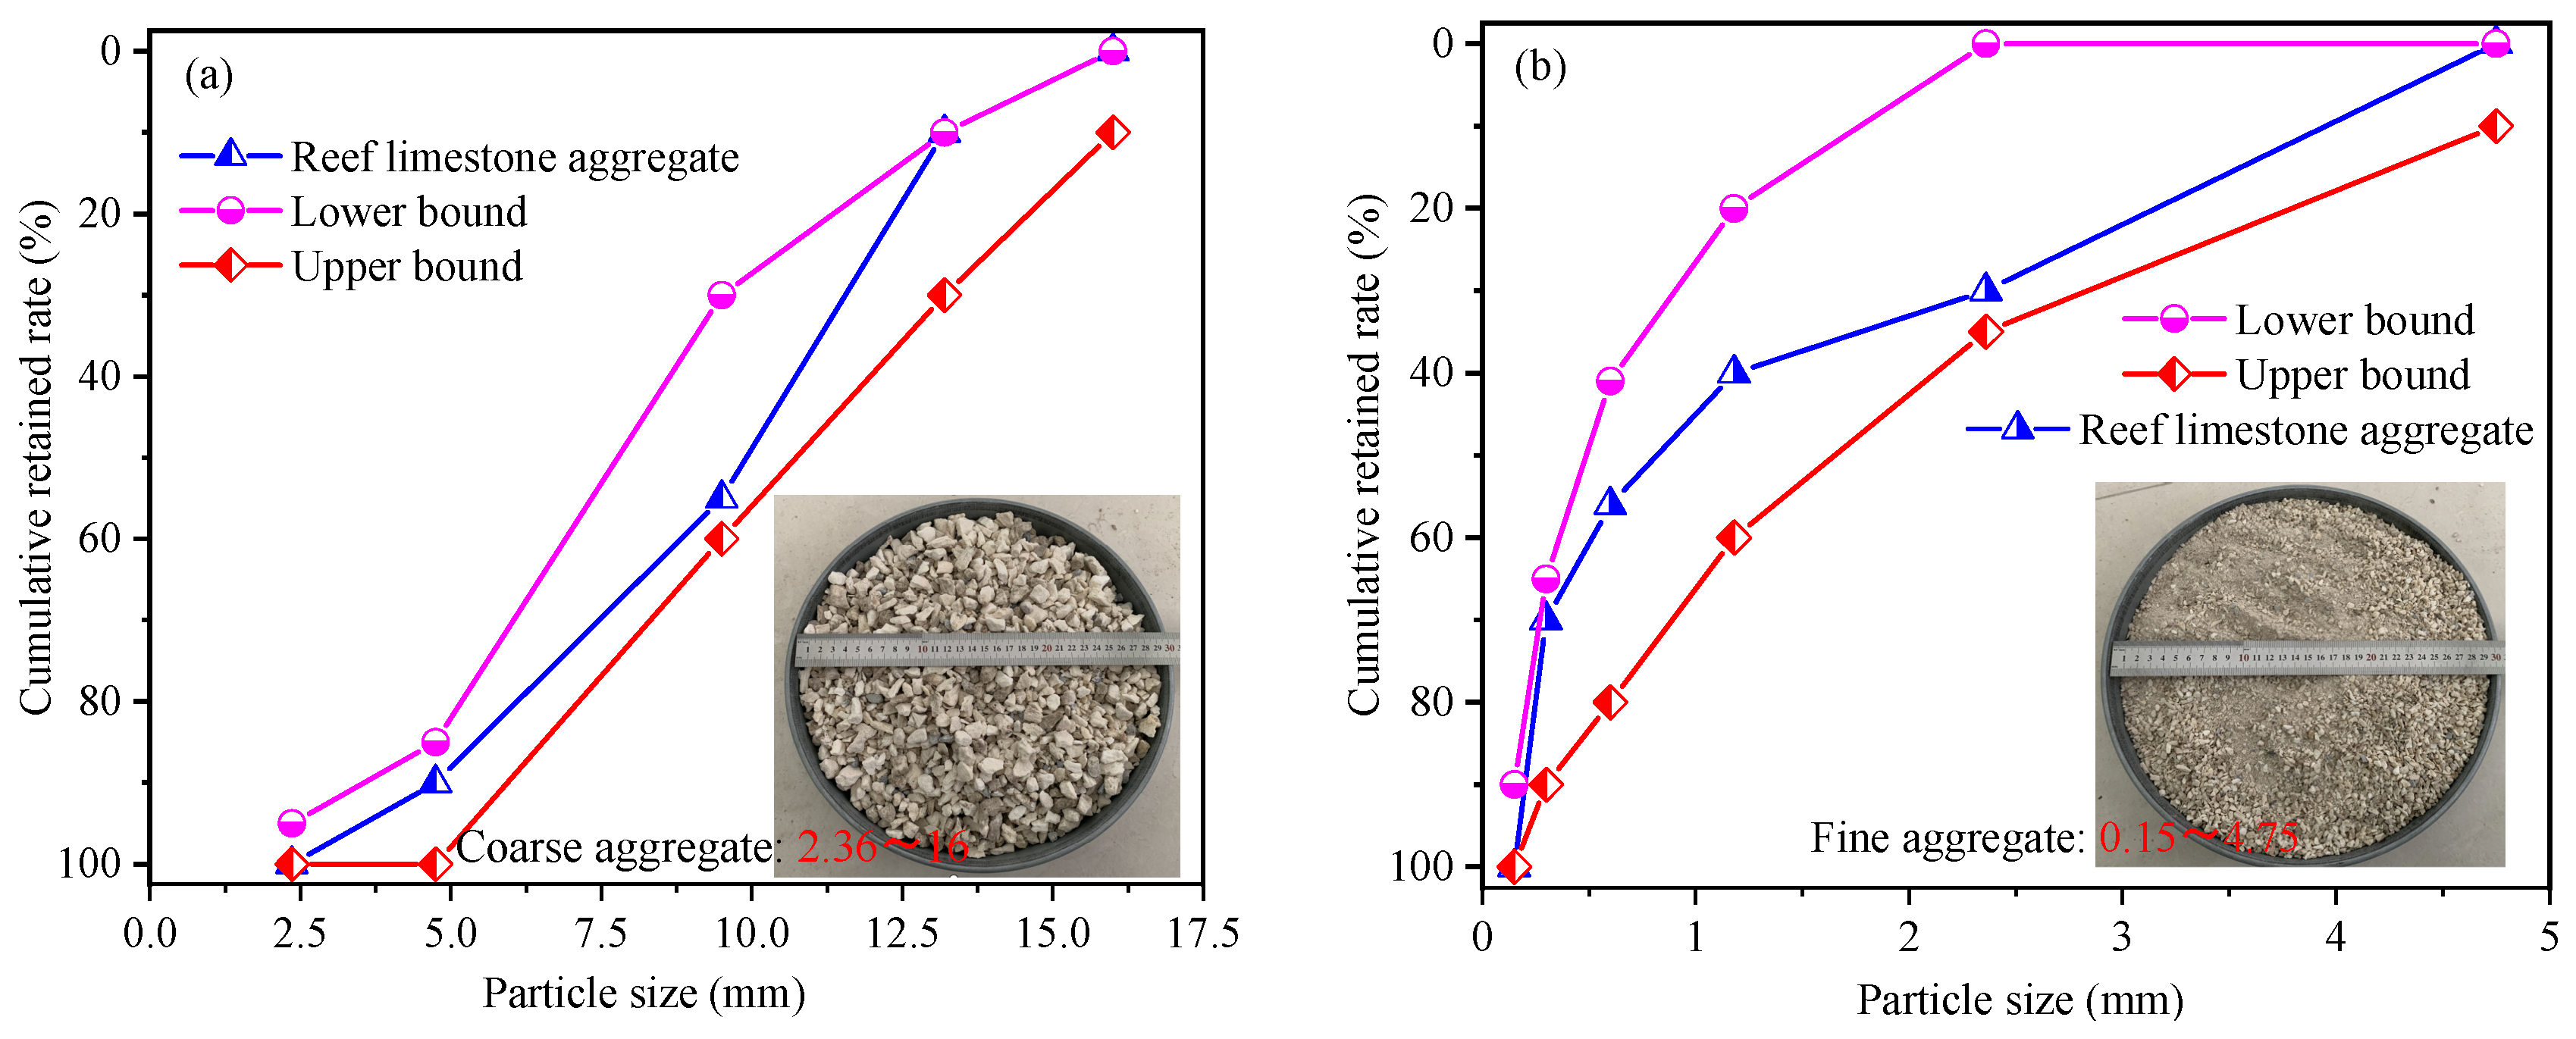
2.1. Sample Preparation
2.2. SHPB Device and Principle
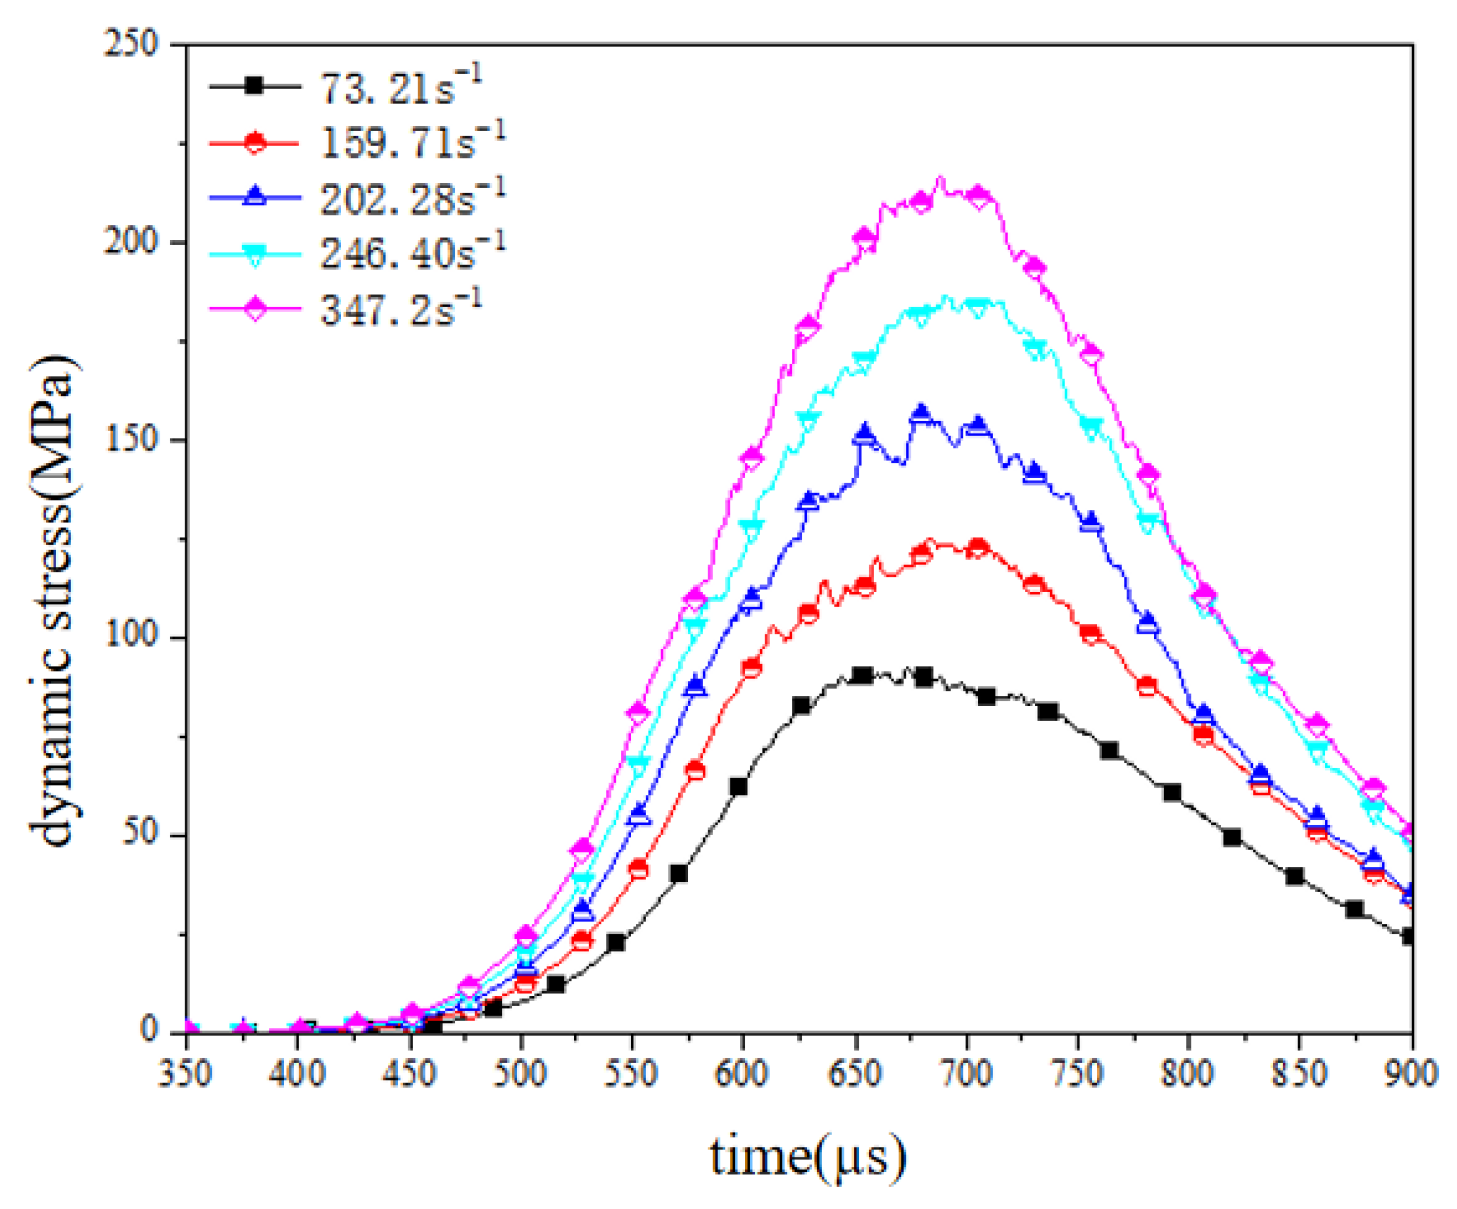
2.3. Test Results Analysis
3. Multiscale Simulation of Dynamic Loading Effects on Reef Aggregates Using FDM-DEM Coupling
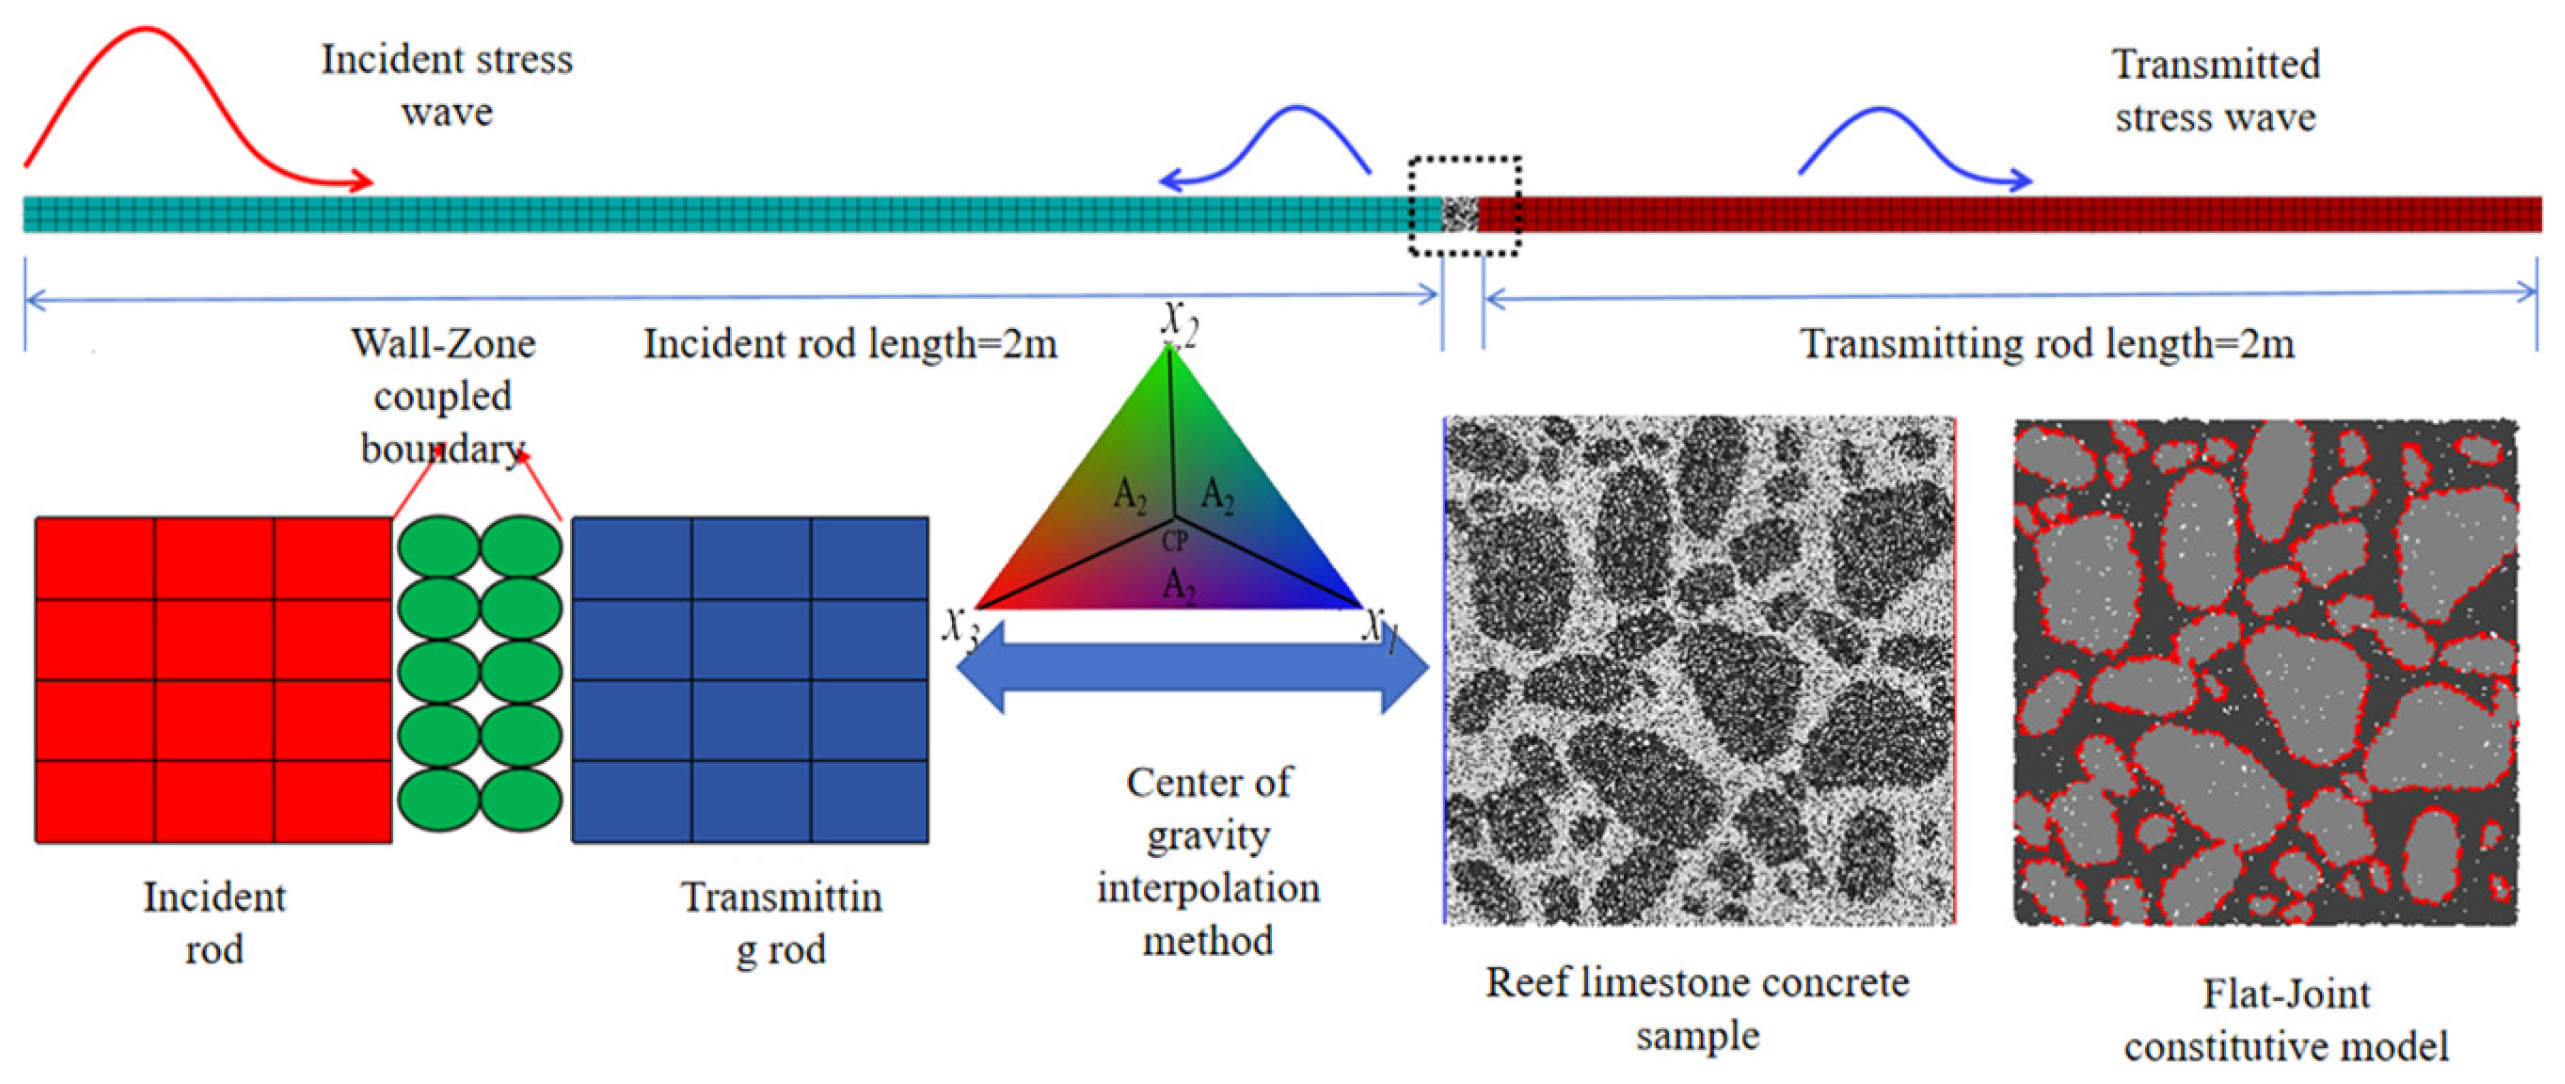
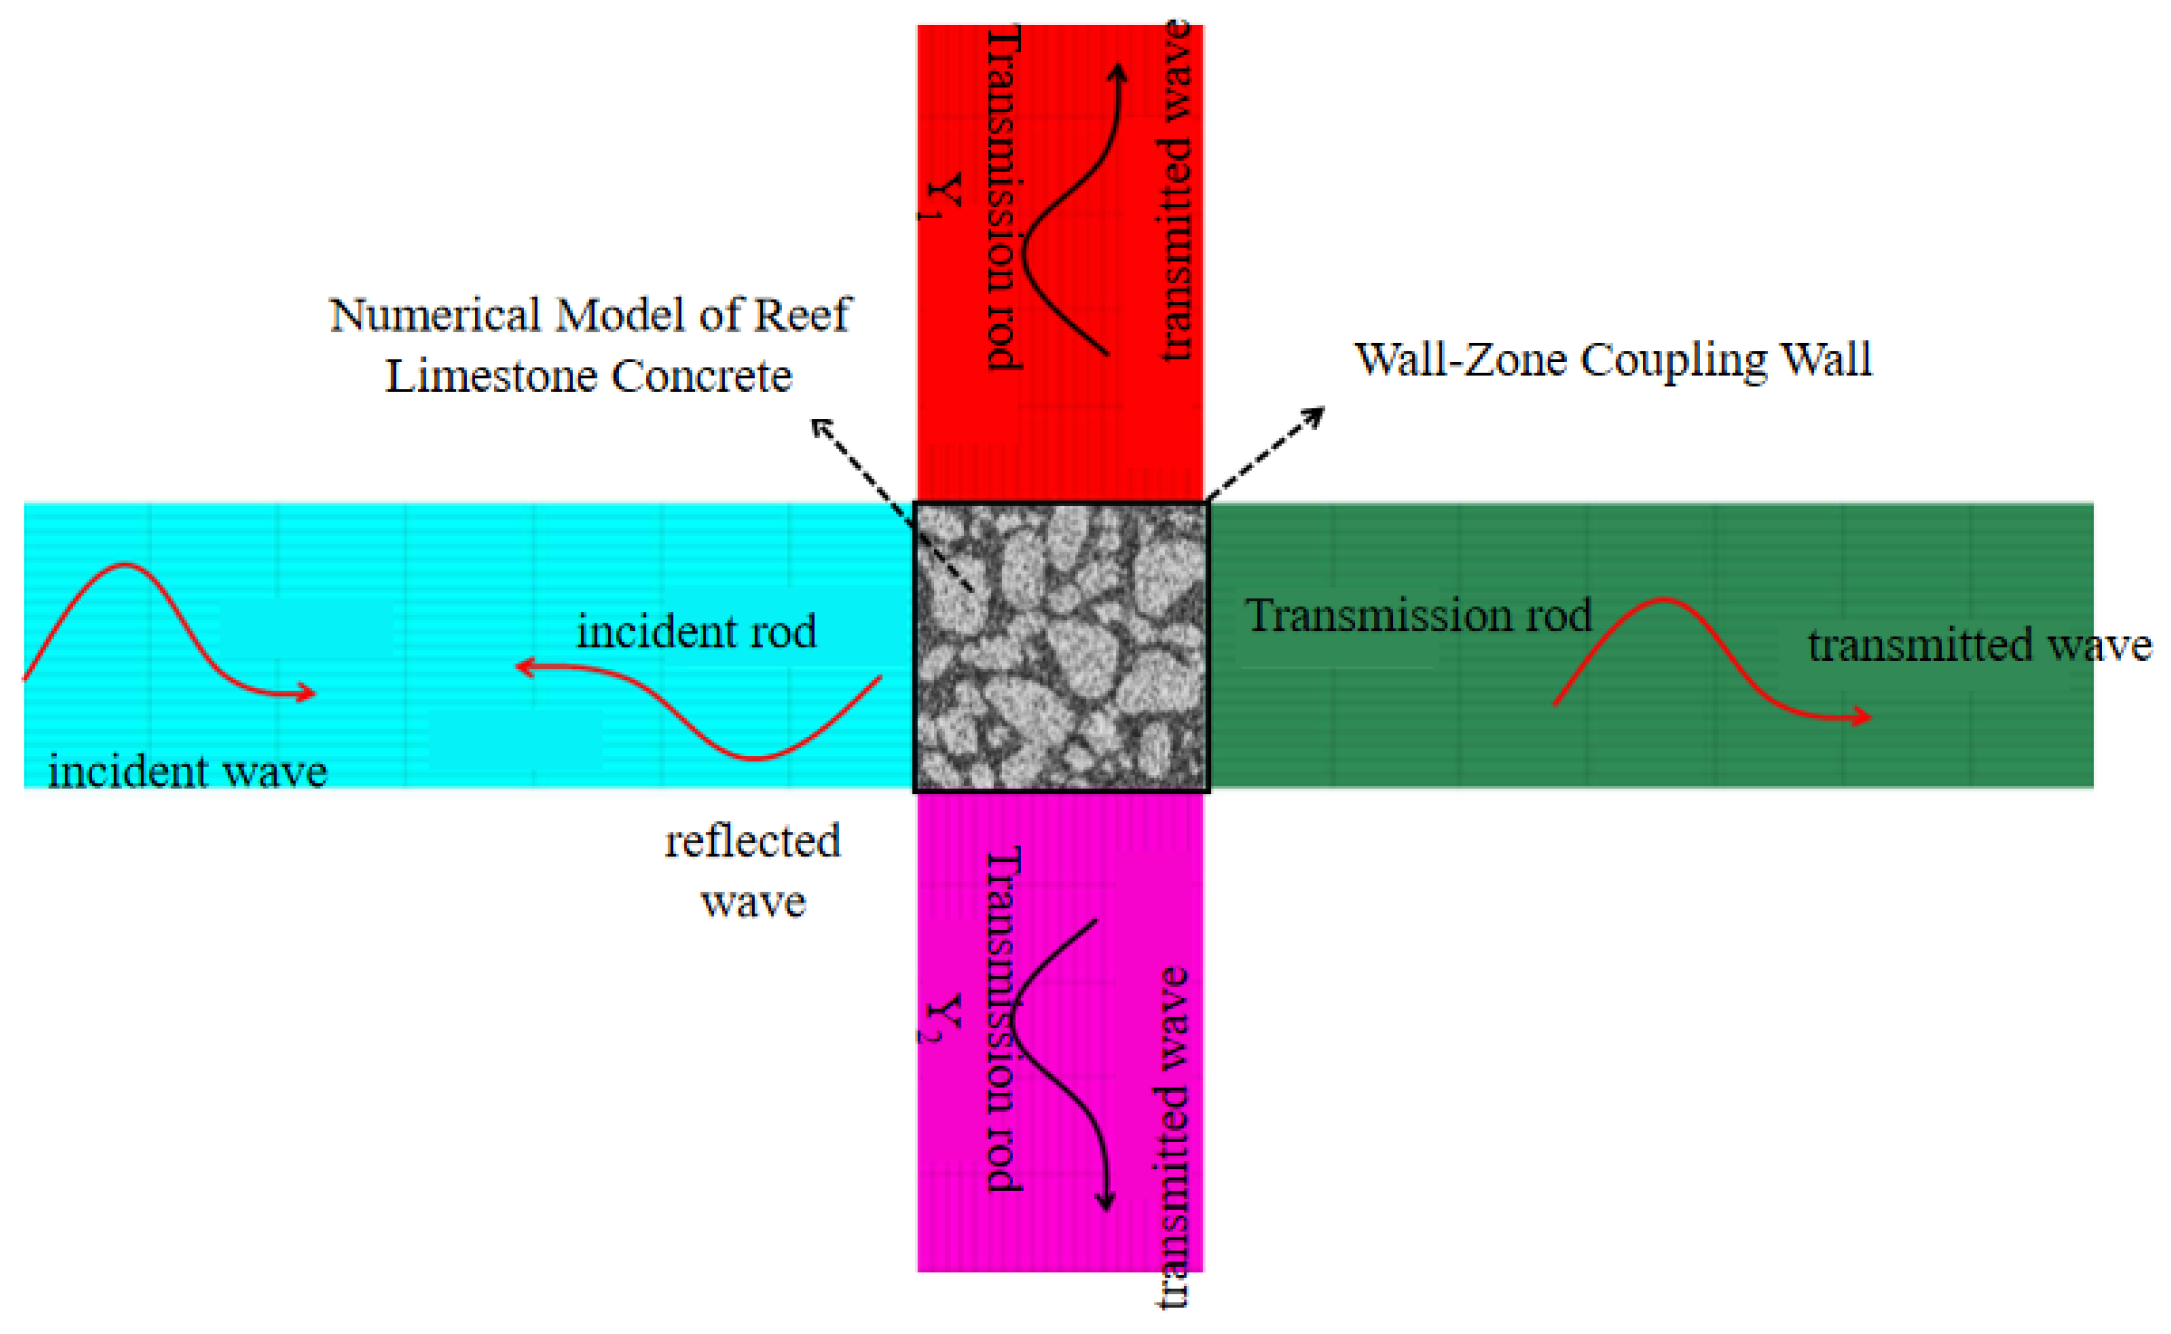
3.1. Numerical Model Establishment
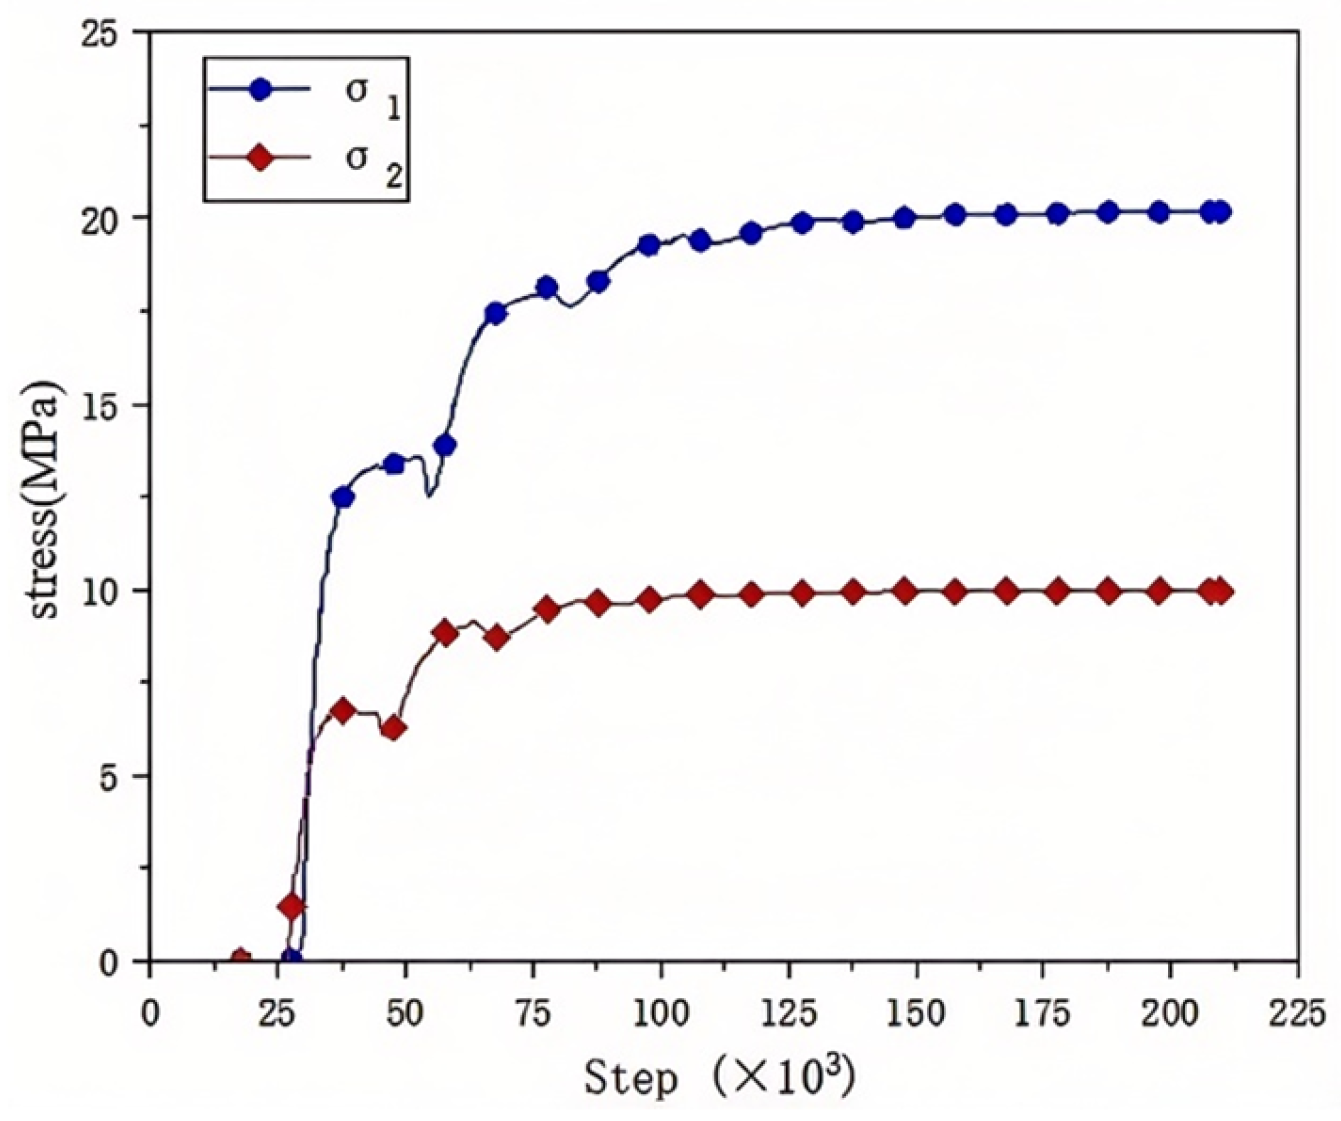
3.2. Microscopic Parameter Calibration and Correction
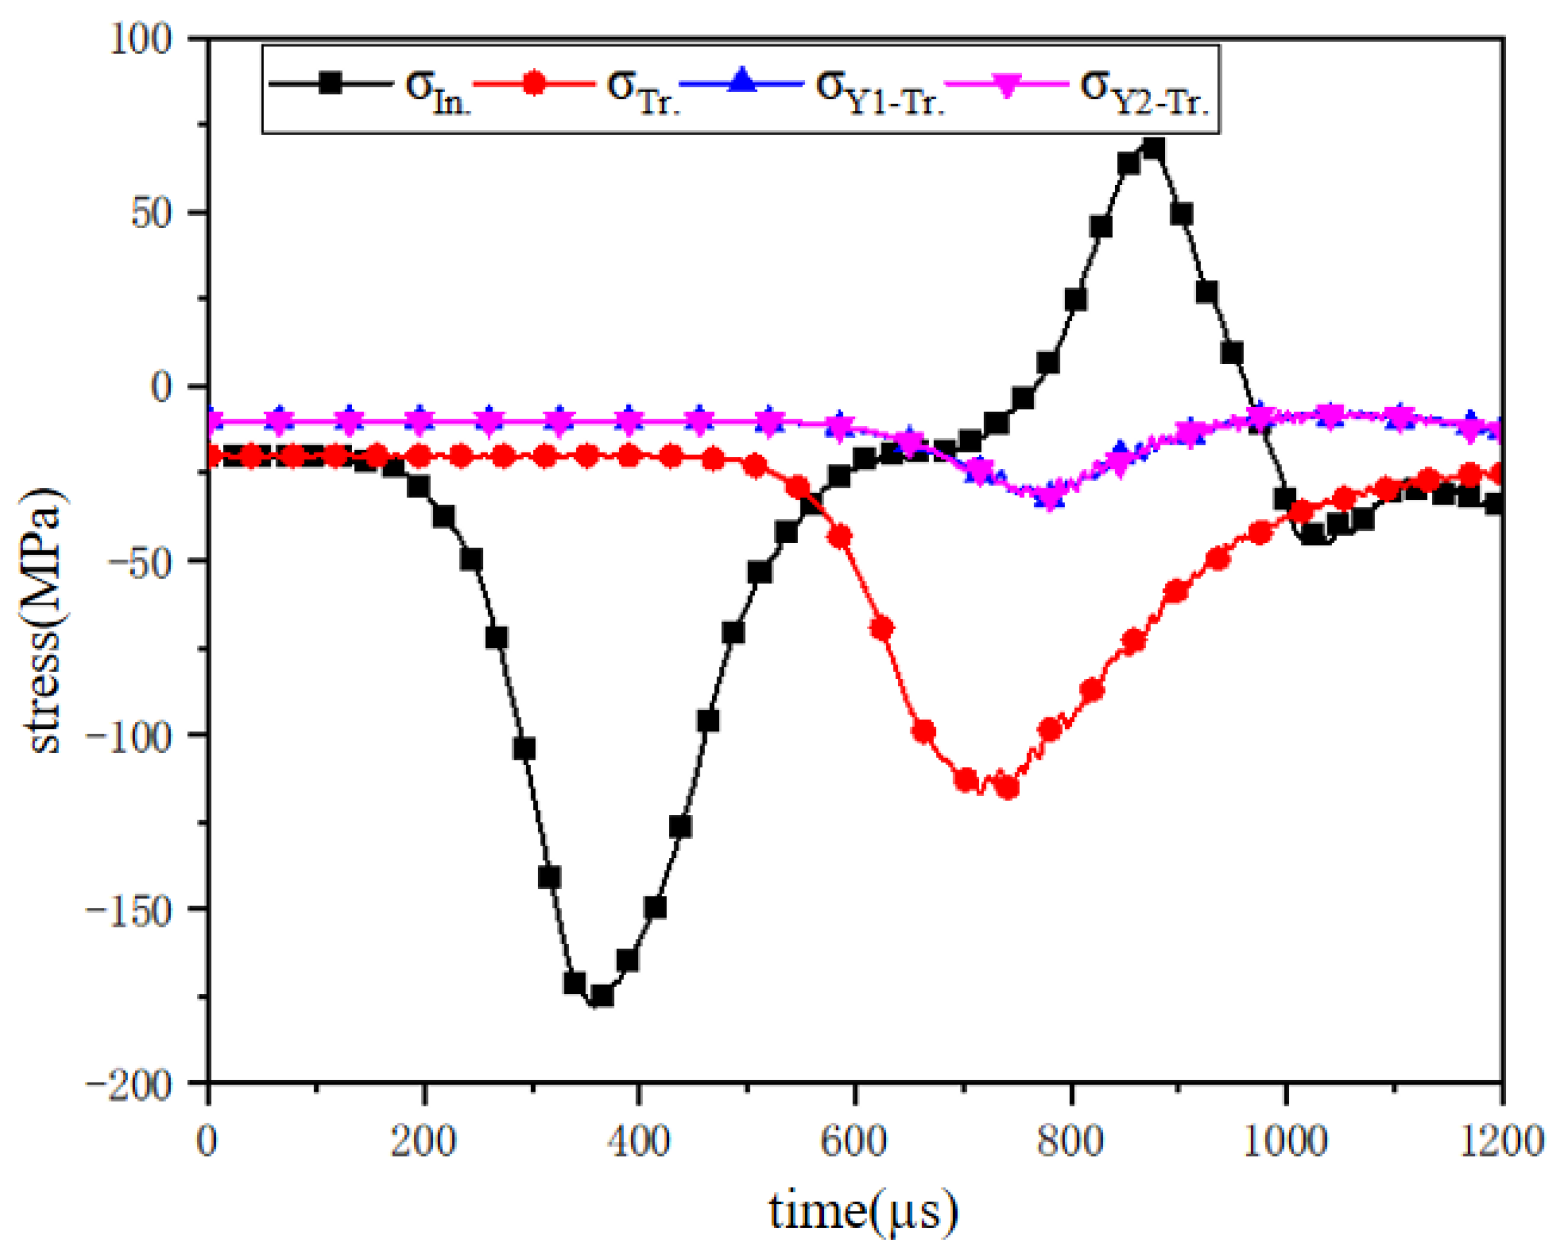
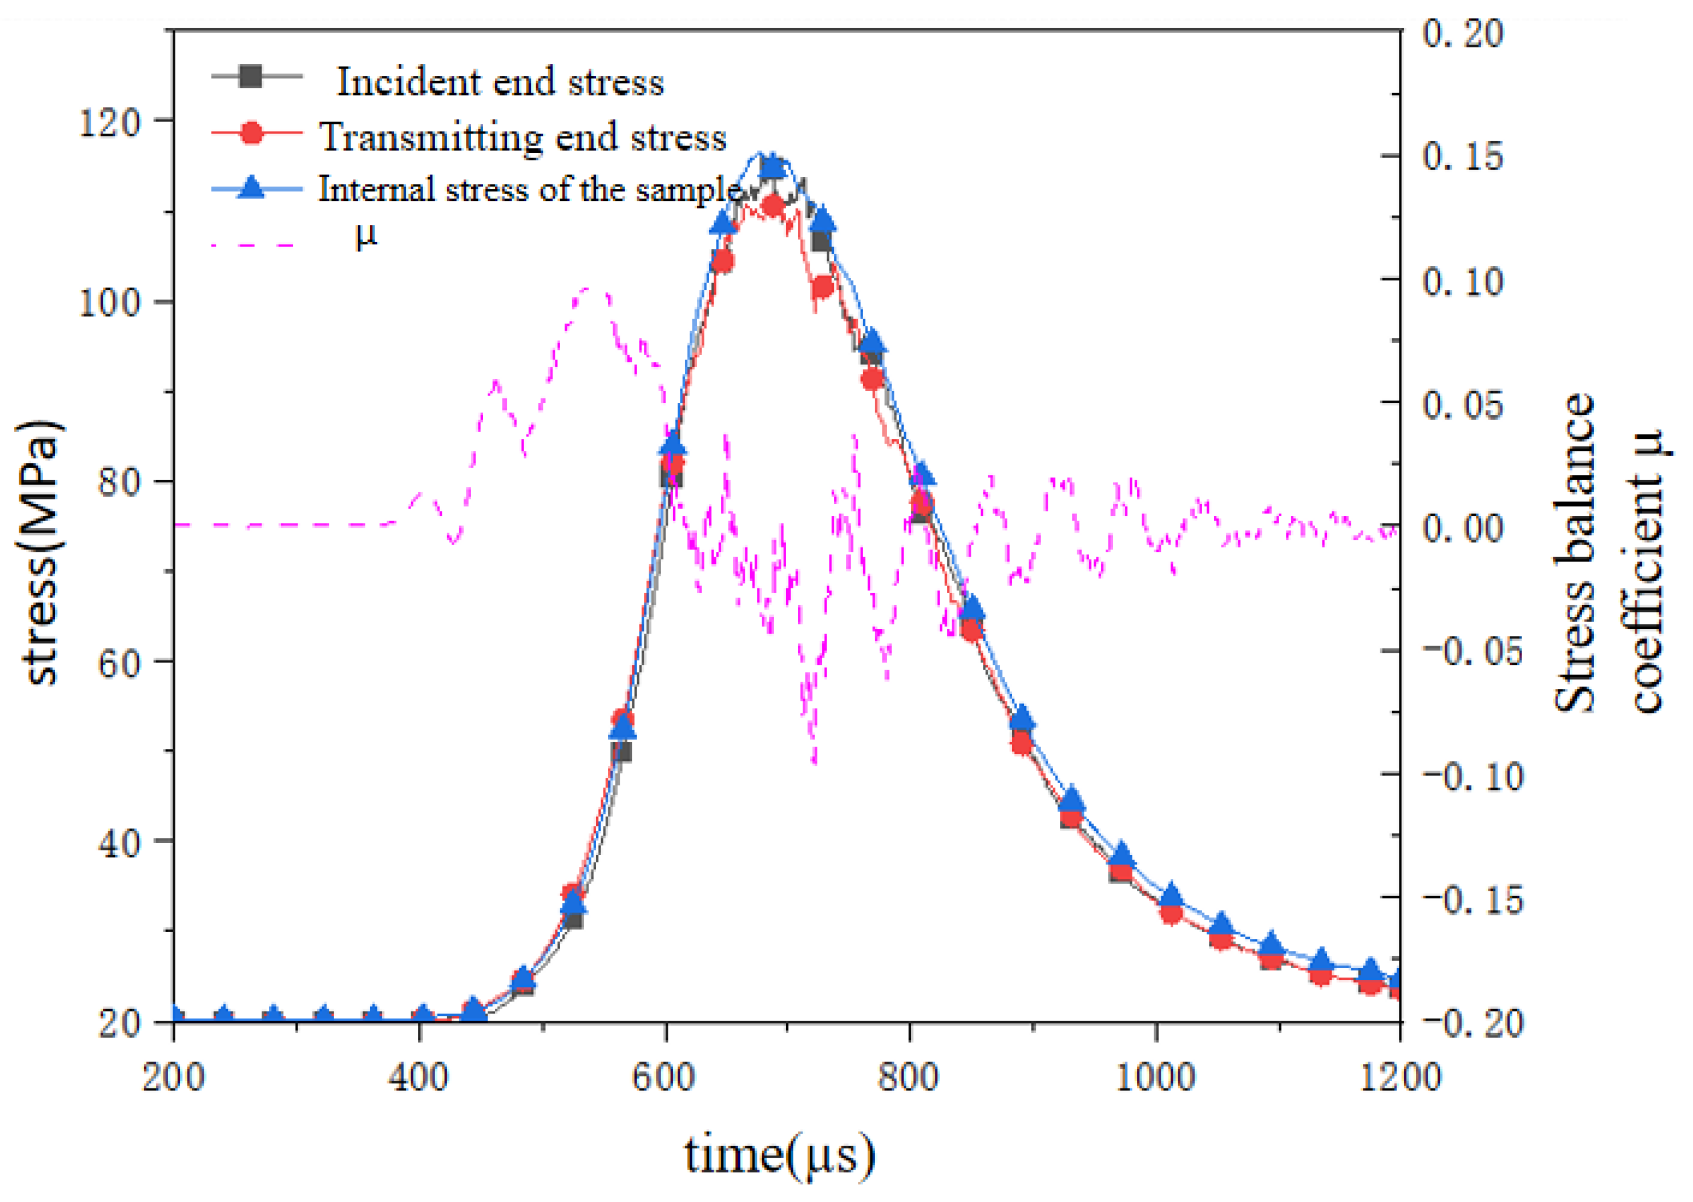
3.3. Stress Balance Verification Analysis During Dynamic Impact Process
3.4. Results and Discussion
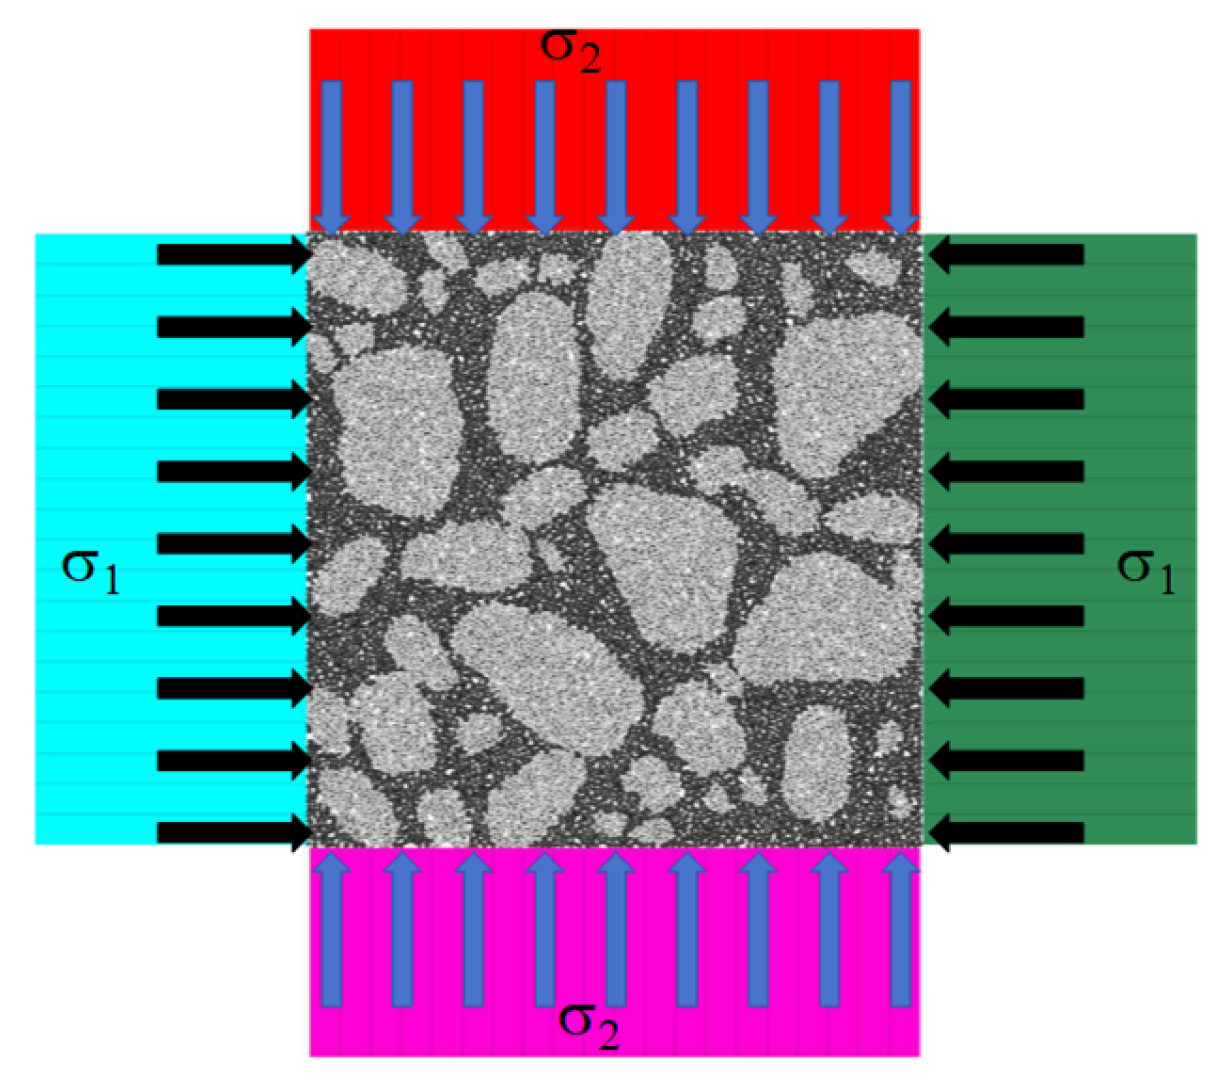
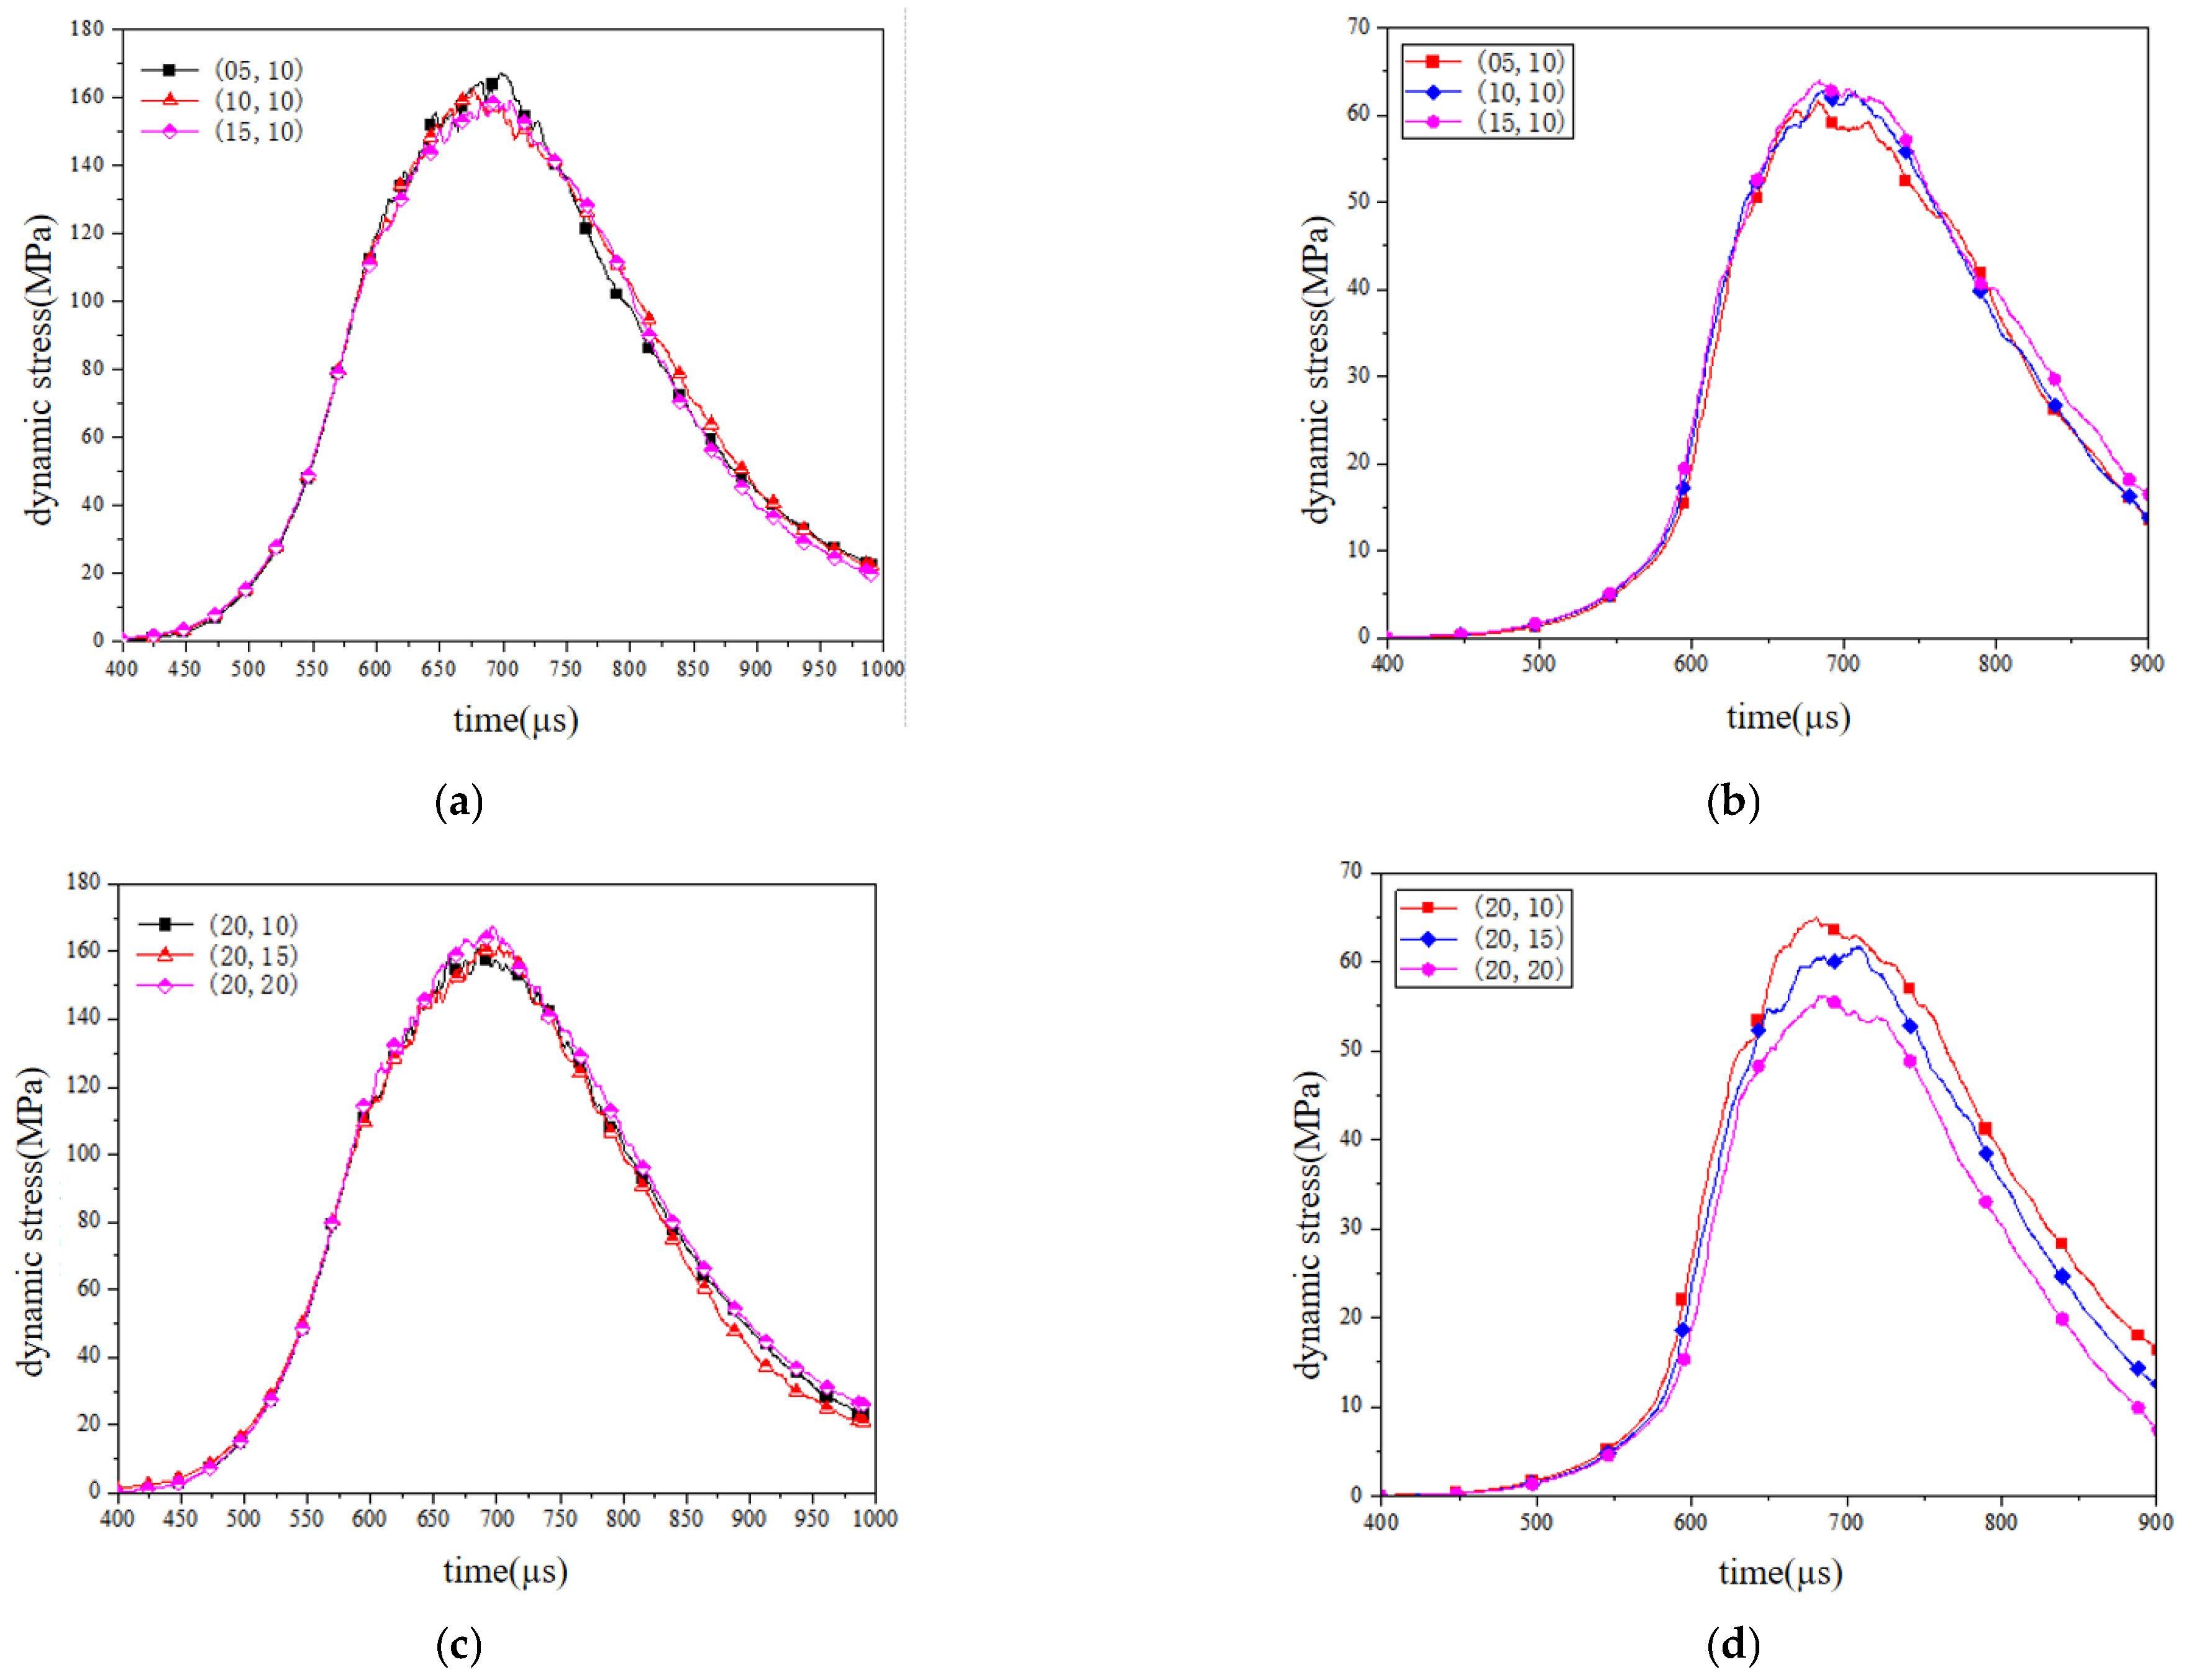
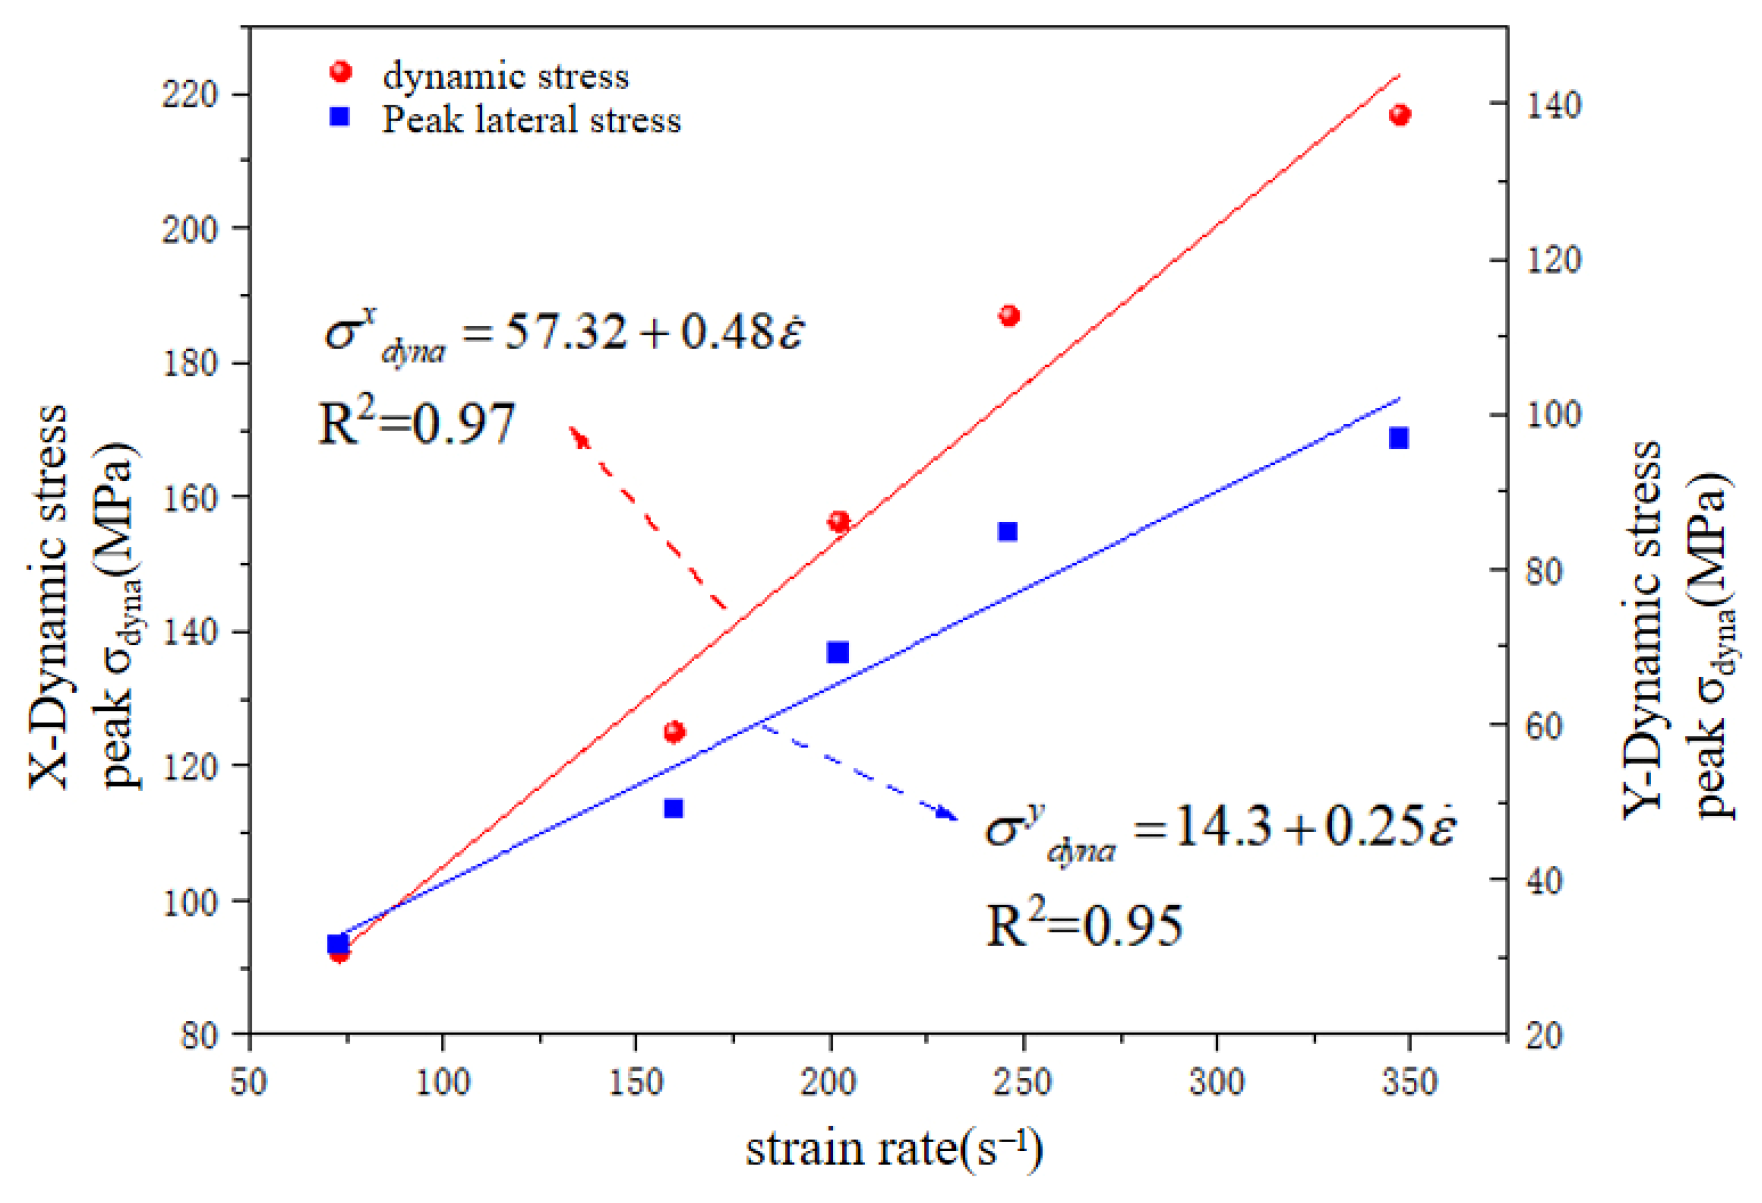
3.4.1. Effect of Biaxial Stress Constraint on Dynamic Mechanical Properties
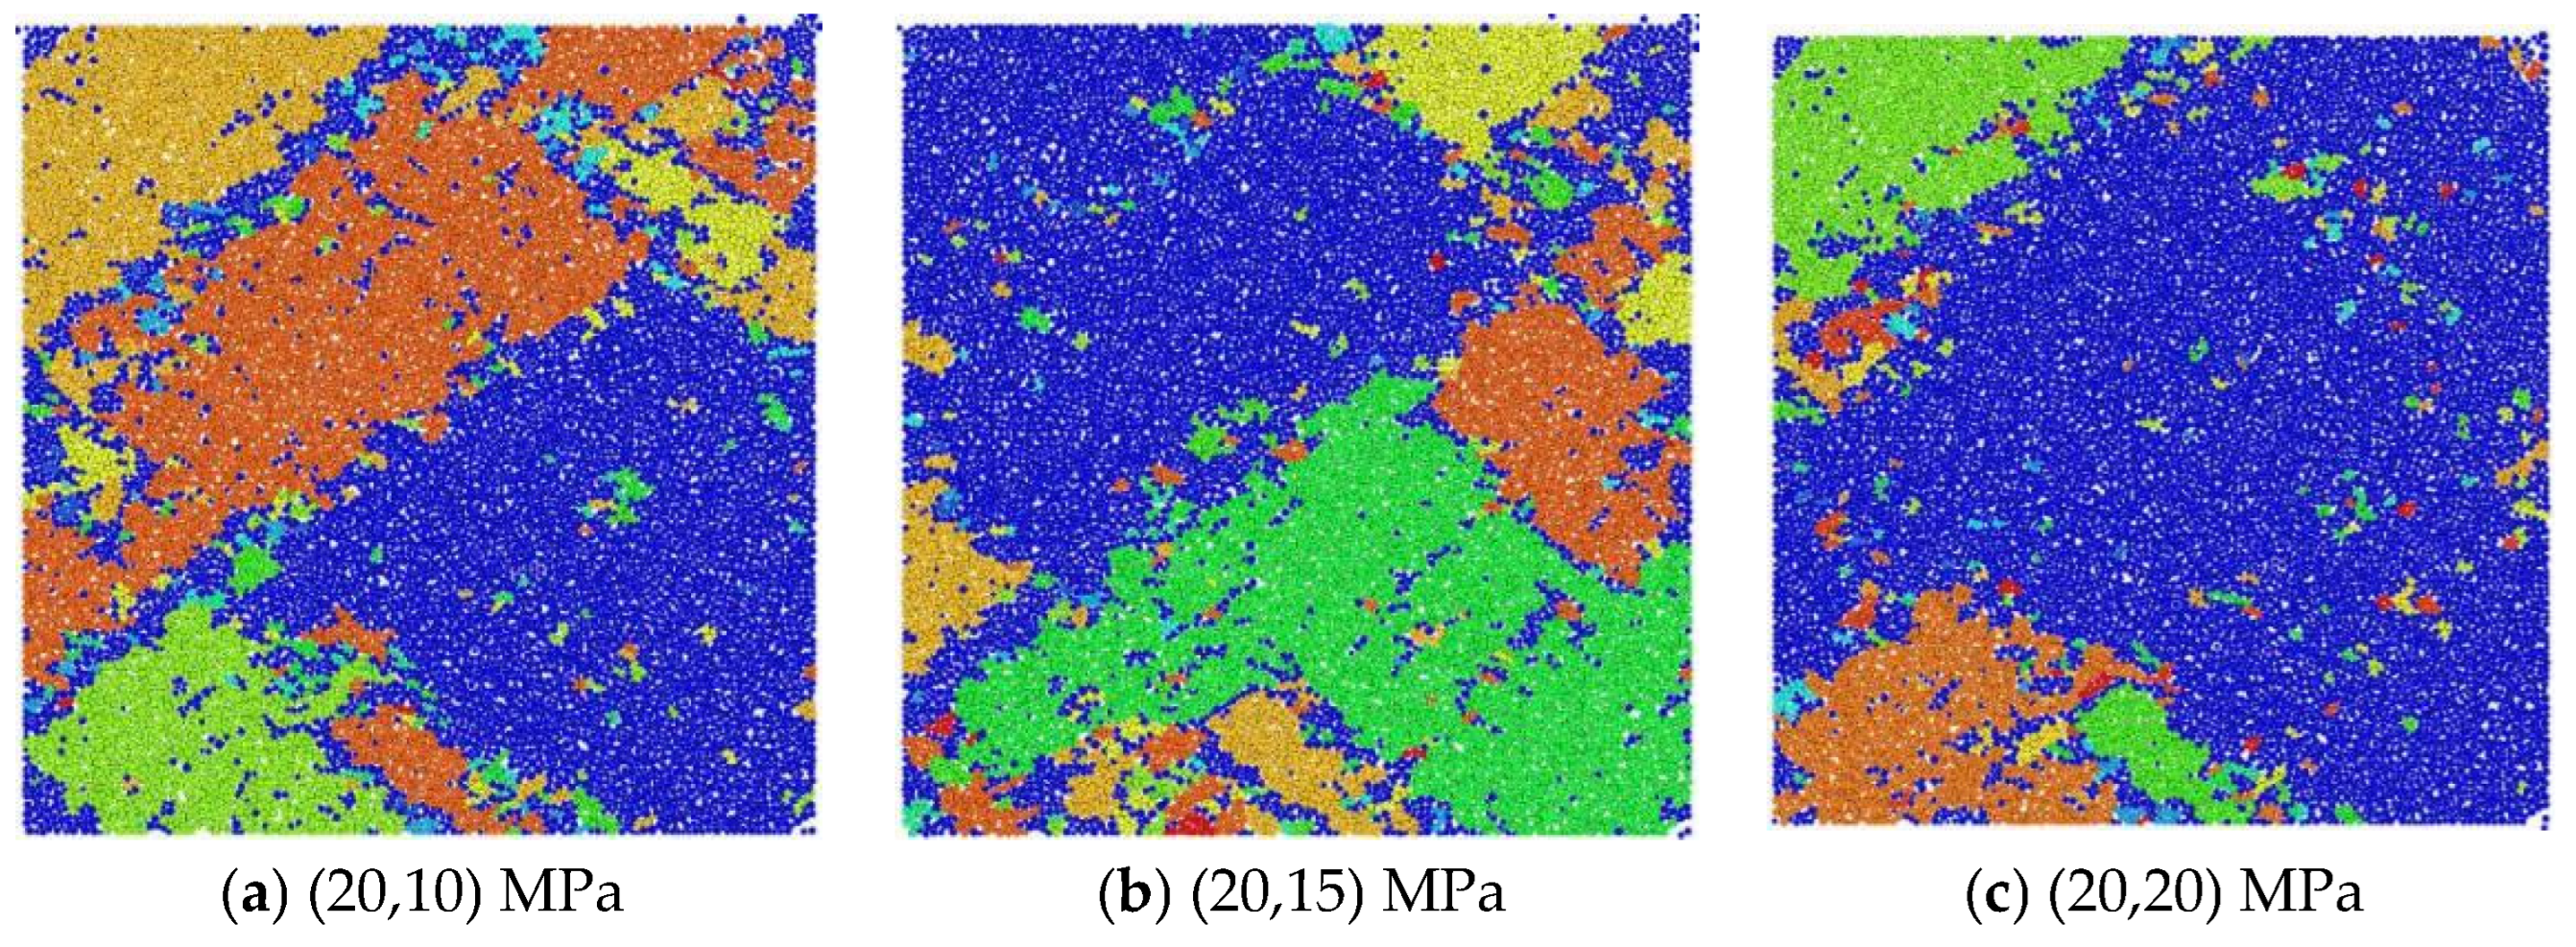
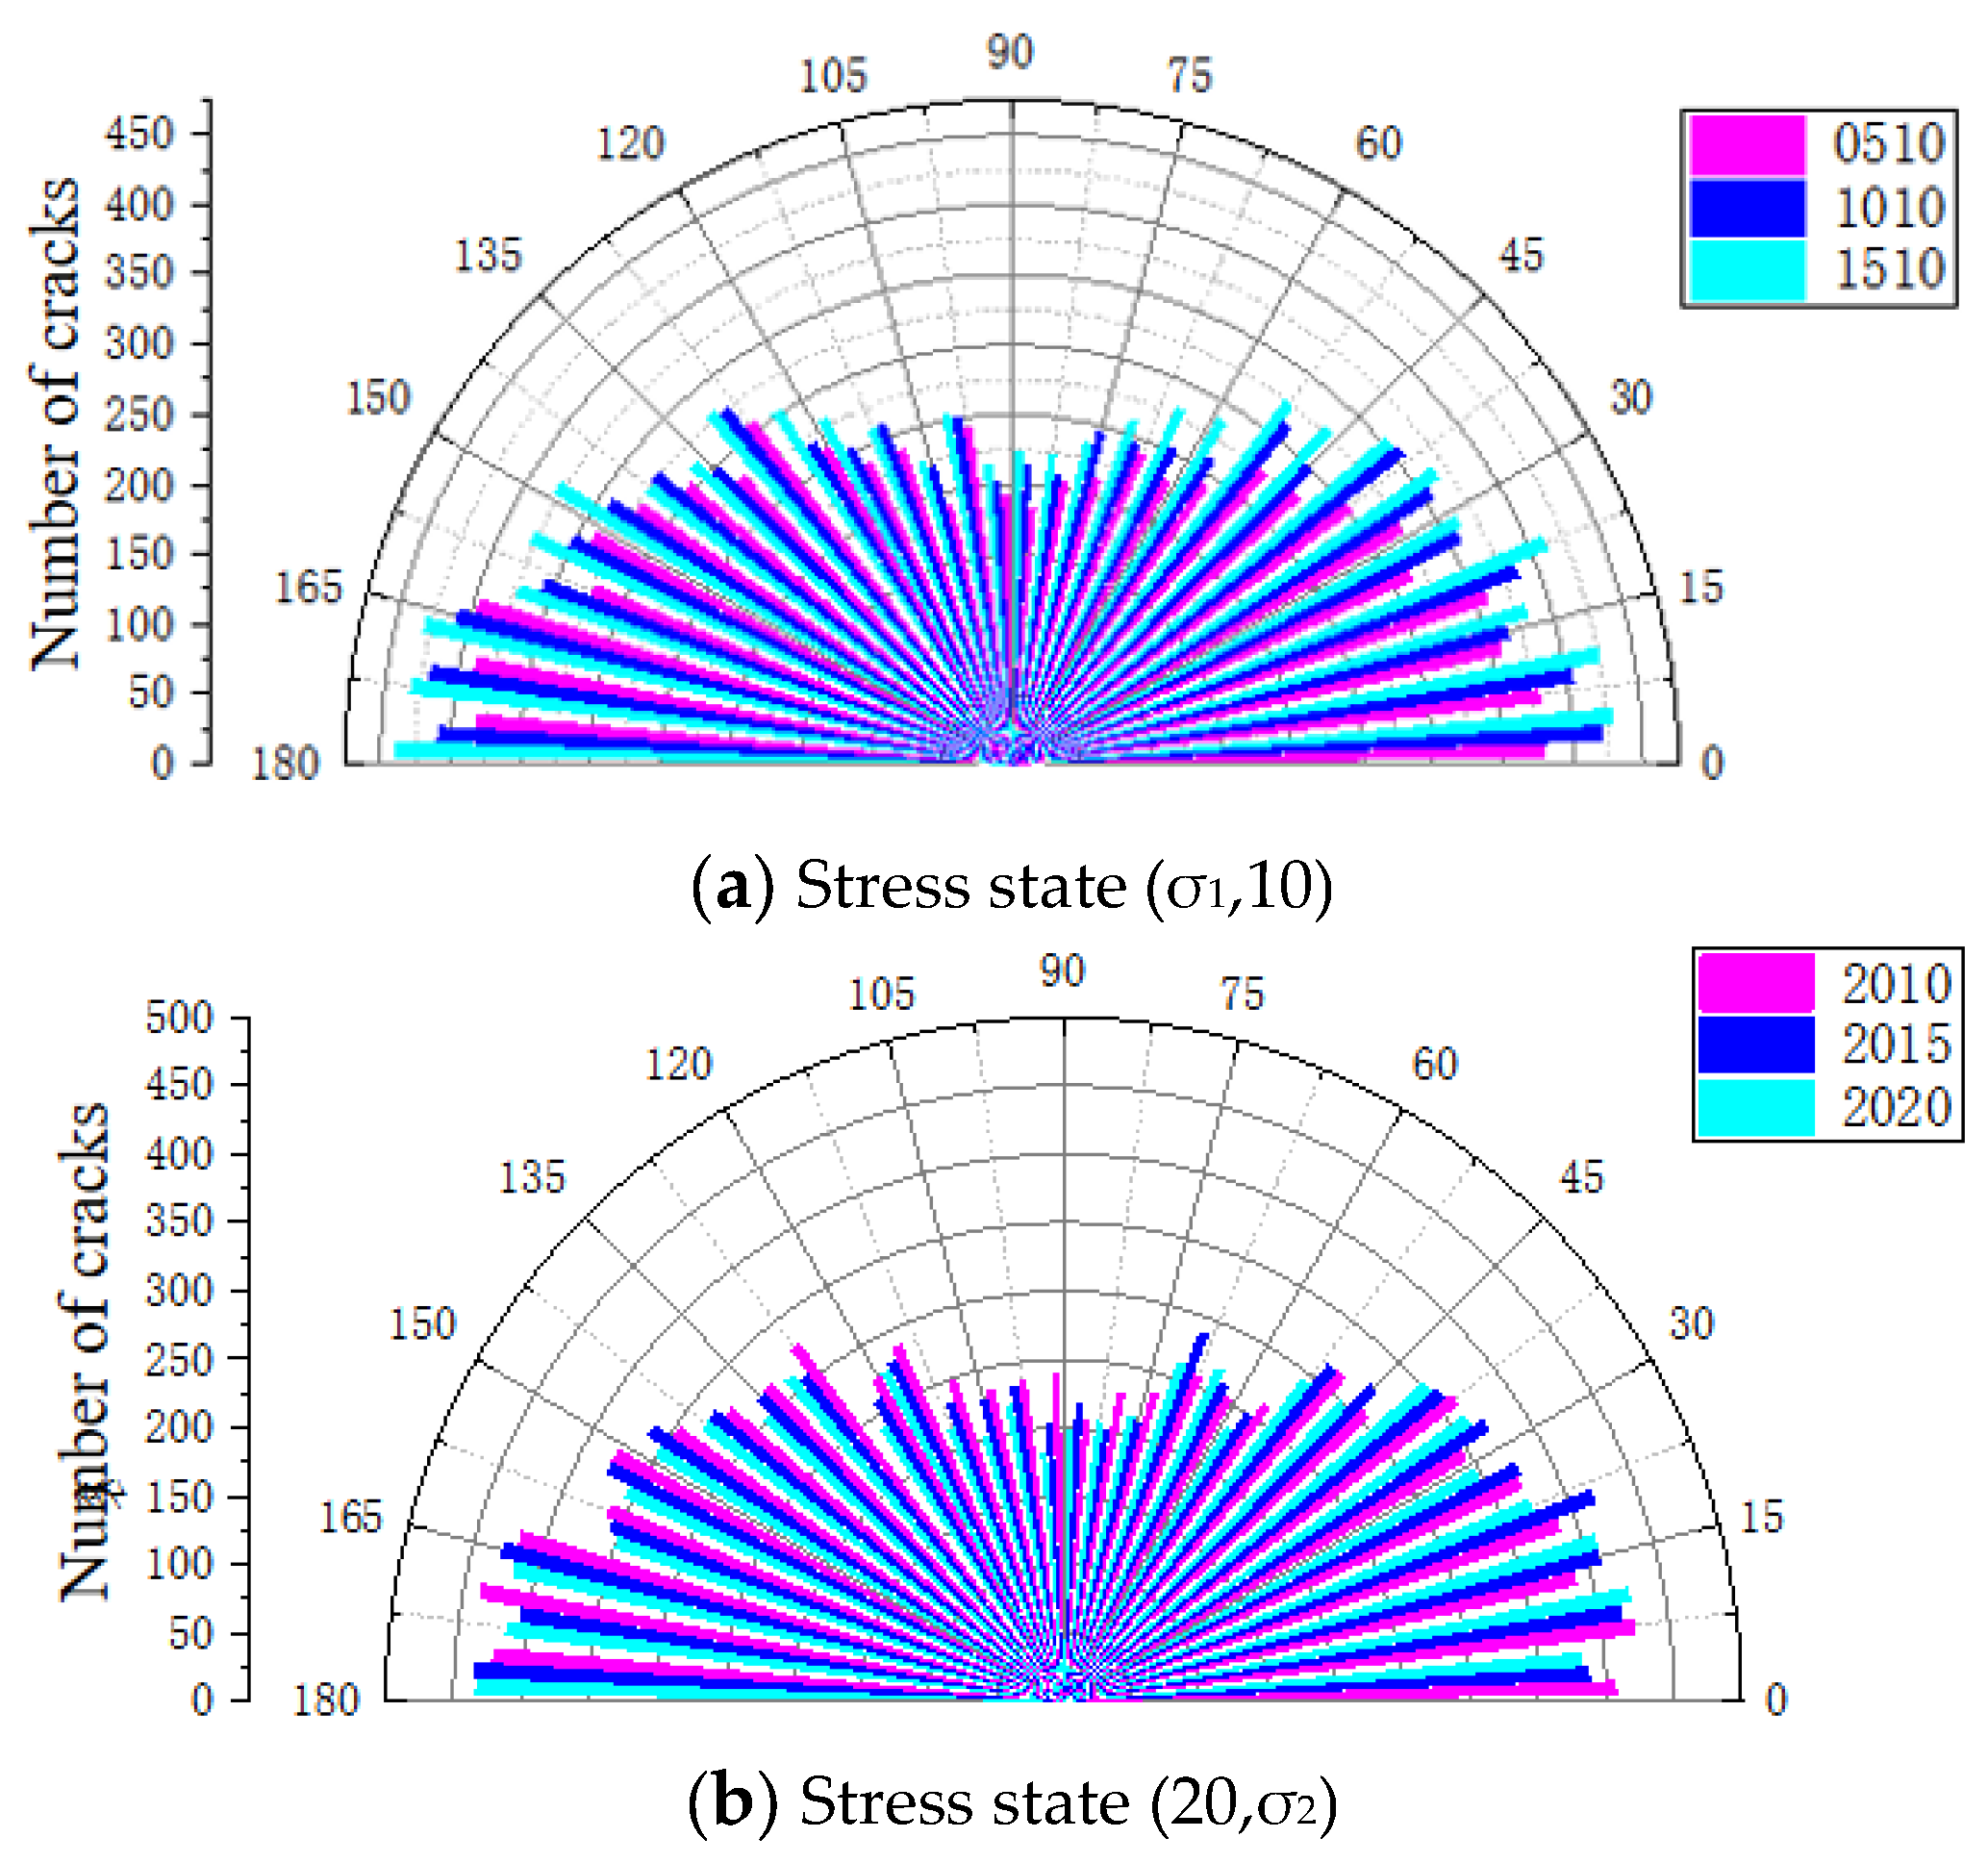
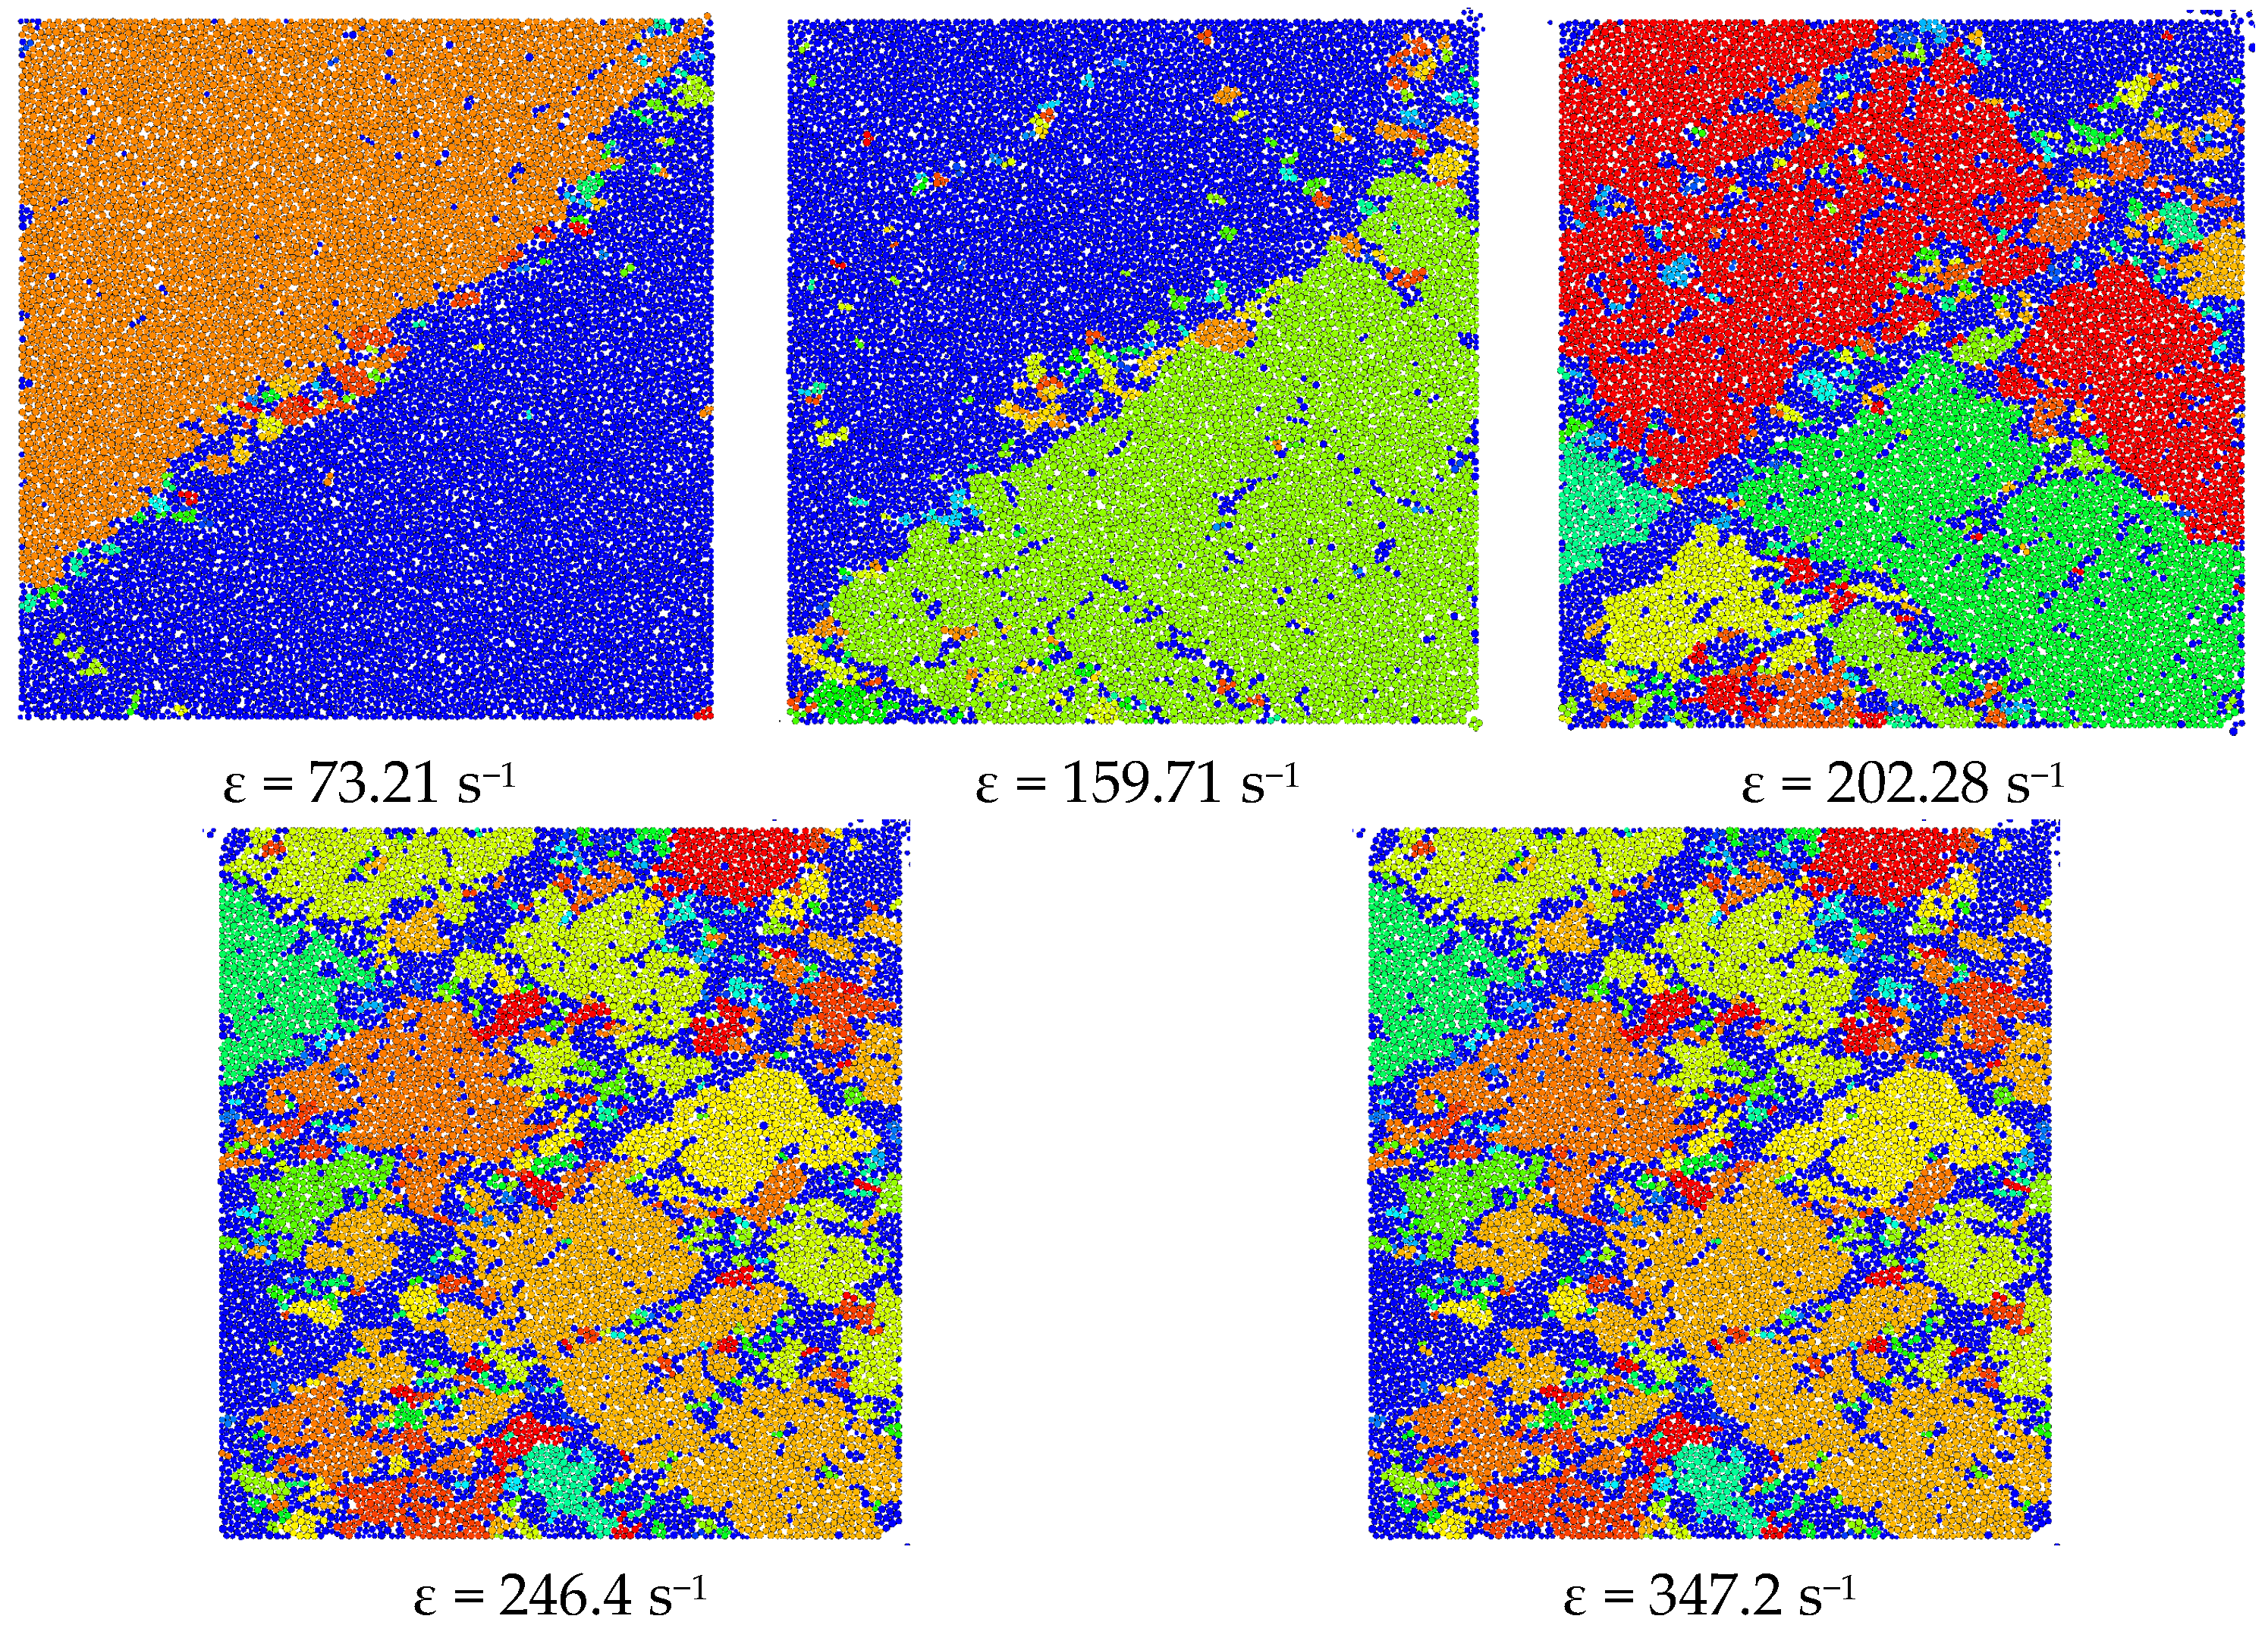
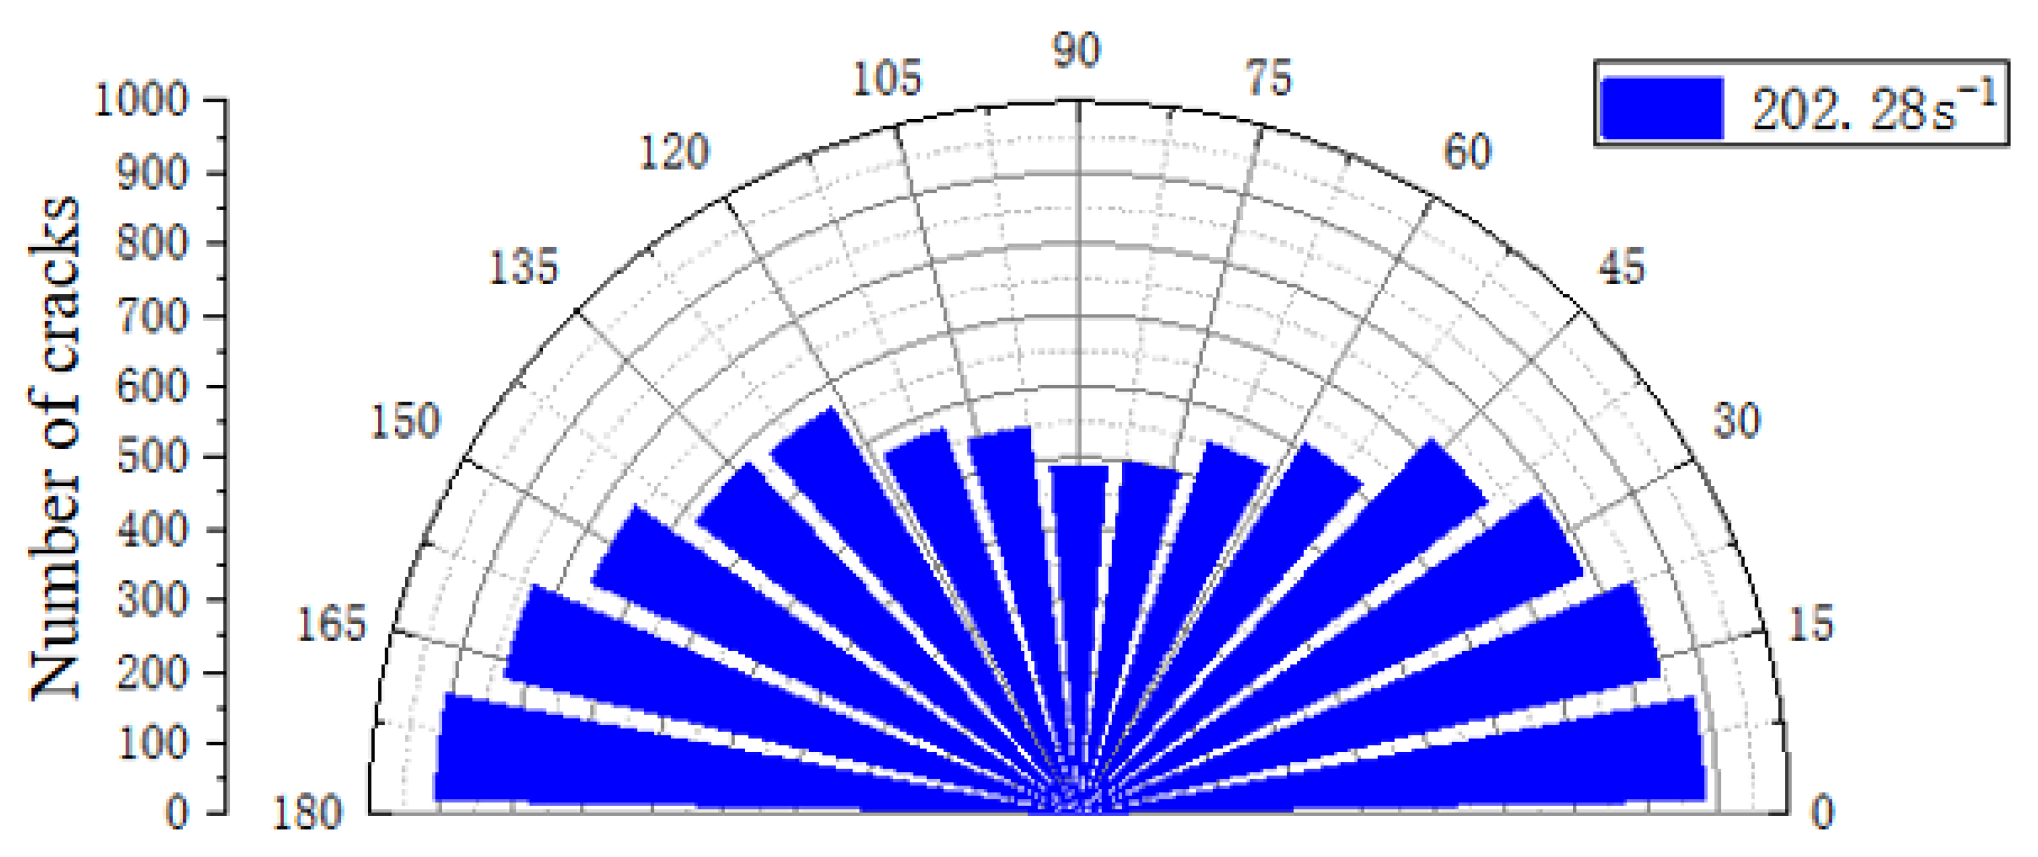
3.4.2. Dynamic Damage and Mesoscopic Fracture Evolution Under Biaxial Stress Constraints
4. Conclusions
- (1)
- As the strain rate escalated, the dynamic stress peak initially exhibited rapid growth followed by stabilization, with a 25.51% enhancement observed. When the strain rate increased to 67.8 s−1, failure transitioned from mode I to mode II, accompanied by the disappearance of stress rebound phenomena. Dynamic stress–strain curves demonstrated progressive opening characteristics that intensified with the strain rate elevation.
- (2)
- By programming the crack time-history monitoring program using the built-in FISH language, it was found that as the stress increased, the internal crack growth rate of the specimen was faster. When the stress decreased, the internal crack growth tended to be stable.
- (3)
- The dynamic performance of the numerical model of reef limestone concrete under biaxial static load conditions is closely related to the magnitude of its initial static load. Under a constant σ1 static load, an elevating σ2 static load under biaxial conditions enhanced the σ1-direction dynamic peak stress while suppressing the σ2-direction dynamic peak stress. The stress constraint value in the σ2 direction had an inhibitory effect on the degree of sample crushing. With the increase in the stress constraint value, the number of model cracks decreased by 10% and 30%, respectively. The degree of internal crushing of the sample was significantly reduced. In the (σ1,10) stress constraint state, the constraint stress in the impact direction promoted the crushing of the sample, and the angle and number distribution of the cracks were M-shaped. This discovery can be directly applied to the optimization of key structures such as tunnel lining and breakwaters on islands and reefs; in areas with frequent dynamic loads, designing multi-directional constraint systems can significantly improve the impact toughness of concrete and extend the service life of the structure.
Author Contributions
Funding
Institutional Review Board Statement
Informed Consent Statement
Data Availability Statement
Conflicts of Interest
References
- Liu, J. Study on Energy Evolution Law and Damage Characteristics of Coral Concrete During Deformation and Failure Process; Nanjing University of Aeronautics and Astronautics: Nanjing, China, 2022. [Google Scholar]
- Cai, X.; Zhao, Q.; Chen, H. Research Progress in Coral Concrete. J. Chin. Ceram. Soc. 2021, 49, 1753–1764. [Google Scholar]
- Liu, B.; Guo, J.; Zhou, J.; Wen, X.; Deng, Z.; Wang, H.; Zhang, X. The mechanical properties and microstructure of carbon fibers reinforced coral concrete. Constr. Build. Mater. 2020, 249, 118771. [Google Scholar] [CrossRef]
- Zhang, M.; Lu, B. An approach to corrosion and corrosion protection of concrete in the corrosive media in the tropic islands. Ocean. Eng. 1997, 2, 88–91. [Google Scholar]
- Li, P.; Mou, L.; Tang, G.; Wang, S. Effect of concrete cracks on durability of reinforced concrete structures exposed in ocean tidal zone. Concrete 2020, 11, 125–128. [Google Scholar]
- Su, Y.; Zhang, J.; Wu, P.; Wang, J.; Lv, X. Review on the influence of sea sand on the durability of concrete. Concrete 2021, 2, 63–67. [Google Scholar]
- Chen, X.; Wu, S.; Zhou, J. Experimental and modeling study of dynamic mechanical properties of cement paste, mortar and concrete. Constr. Build. Mater. 2013, 47, 419–430. [Google Scholar] [CrossRef]
- Wu, W.; Gong, F.; Zhang, Z. Sidewall rockburst characteristics of highly stressed circular tunnel under impact load. J. Rock Mech. Geotech. Eng. 2024, 16, 4909–4924. [Google Scholar] [CrossRef]
- Chen, F.; Li, R.; Wang, K.; Du, Y.; Tang, C.; Pan, Y.; Dong, Z. Analysis of slab buckling rockburst of surrounding rock under dynamic and static combined disturbance. Tunn. Undergr. Space Technol. 2025, 158, 106417. [Google Scholar] [CrossRef]
- Luo, H.; Tao, M.; Hong, Z.; Xiang, G.; Wu, C. Analysis of the dynamic response and damage characteristic for the tunnel under near-field blasts and far-field earthquakes. Undergr. Space 2025, 21, 331–351. [Google Scholar] [CrossRef]
- Sun, B. Mechanical property test of silica fume reinforced coral concrete. Low Temp. Archit. Technol. 2014, 36, 12–14. [Google Scholar]
- Yuan, Y. Mix Design and Property of Coral Aggregate Concrete; Nanjing University of Aeronautics and Astronautics: Nanjing, China, 2015. [Google Scholar]
- Mi, R.; Yu, H.; Ma, H.; Da, B.; Yuan, Y.; Zhang, X.; Zhu, H.; Dou, X. Study on the mechanical property of coral concrete. Ocean Eng. 2016, 34, 47–54. [Google Scholar]
- Yue, C.; Yu, H.; Ma, H.; Mei, Q.; Liu, T. Experimental Study and Simulation of Impact Compression of Coral Aggregate Seawater Concrete. J. Build. Mater. 2021, 24, 283–290. [Google Scholar]
- Ma, H.; Yue, C.; Yu, H.; Mei, Q.; Chen, L.; Zhang, J.; Zhang, Y.; Jiang, X. Experimental study and numerical simulation of impact compression mechanical properties of high strength coral aggregate seawater concrete. Int. J. Impact Eng. 2020, 137, 103466. [Google Scholar] [CrossRef]
- Ma, L.; Li, Z.; Liu, J.; Duan, L.; Wu, J. Mechanical properties of coral concrete subjected to uniaxial dynamic compression. Constr. Build. Mater. 2019, 199, 244–255. [Google Scholar] [CrossRef]
- Xu, J.; Tang, Y.; Chen, Y.; Chen, Z. Split-Hopkinson pressure bar tests on dynamic properties of concrete made of seawater and marine aggregates. J. Vib. Shock. 2022, 41, 233–242. [Google Scholar]
- Wu, J.; Ma, L.; Kong, X.; Luo, Z.; Duan, L. Dynamic Characteristics of Coral Concrete under Impact Load. J. Build. Mater. 2020, 23, 581–588. [Google Scholar]
- Qin, Q.; Meng, Q.; Mei, Q.; Wu, K.; Wang, C.; Zhang, J. Dynamic response characteristics of coral reef sand concrete under impact loading. J. Build. Eng. 2023, 66, 105847. [Google Scholar] [CrossRef]
- Rad, M.M. A Review of Elasto-Plastic Shakedown Analysis with Limited Plastic Deformations and Displacements. Period. Polytech. Civ. Eng. 2018, 62, 812–817. [Google Scholar] [CrossRef]
- Shafaie, V.; Ghodousian, O.; Ghodousian, A.; Homayounfar, M.; Rad, M.M. Slant shear tests and fuzzy logic integration for evaluating shear bond strength in SCC and FRSCC repair applications. Case Stud. Constr. Mater. 2025, 22, e04176. [Google Scholar] [CrossRef]
- Shafaie, V.; Rad, M.M. Multi-objective genetic algorithm calibration of colored self-compacting concrete using DEM: An integrated parallel approach. Sci. Rep. 2024, 14, 4126. [Google Scholar] [CrossRef]
- Feng, W.; Chen, B.; Tang, Y.; Wei, W.; He, W.; Yang, Y. Structural effects and real strain-rate effects on compressive strength of sustainable concrete with crumb rubber in split Hopkinson pressure bar tests. Arch. Civ. Mech. Eng. 2022, 22, 136. [Google Scholar] [CrossRef]
- Qiu, H.; Wang, F.; Zhu, Z.; Wang, M.; Yu, D.; Luo, C.; Wan, D. Study on dynamic fracture behaviour and fracture toughness in rock-mortar interface under impact load. Compos. Struct. 2021, 271, 114174. [Google Scholar] [CrossRef]
- Shi, D.; Shi, Q. Study on Mechanical Properties and Mesoscopic Numerical Simulation of Recycled Concrete. Sustainability 2022, 14, 12125. [Google Scholar] [CrossRef]
- ASTM D7012-10; Standard Test Method for Compressive Strength and Elastic Moduli of Intact Rock Core Specimens under Varying States of Stress and Temperatures. ASTM: West Conshohocken, PA, USA, 2023.
- Lei, J.; Wei, L.; Lin, T.; Xia, N.; Liu, X.; Wu, Z. Influence of interfacial transition zone strength on concrete crack propagation by DEM simulation. Yangtze River 2022, 53, 217–221+227. [Google Scholar] [CrossRef]
- Wu, X.; Gong, M.; Wu, H.; Hu, G.; Wang, S. Vibration reduction technology and the mechanisms of surrounding rock damage from blasting in neighborhood tunnels with small clearance. Int. J. Min. Sci. Technol. 2023, 33, 625–637. [Google Scholar] [CrossRef]


| Coarse aggregate | Bulk density (kg/m3) | Apparent density (kg/m3) | Porosity % | Moisture content % | Water absorption % |
| 873 | 1939.6 | 59 | 13.2 | 22.9 | |
| Fine Aggregate | Bulk density (kg/m3) | Apparent density (kg/m3) | Fineness modulus | Moisture content % | Water absorption % |
| 1392 | 2698.5 | 2.5 | 2.9 | 3.7 |
| Name | Ordinary Portland Cement | Reef Limestone | Reef Limestone | Groundwater | Fly Ash | Slag | Anti-Cracking Waterproofing Agent |
|---|---|---|---|---|---|---|---|
| Dosage | 780 | 700 | 300 | 250 | 70 | 150 | 15 |
| Impact Load/MPa | Strain Rate/s−1 | Dynamic Peak Intensity/MPa | Peak Strain/% | Destruction Form |
|---|---|---|---|---|
| 0.2 | 54.65 | 68.20 | 0.489 | 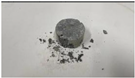 |
| 0.4 | 83.88 | 84.48 | 0.524 | 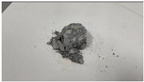 |
| 0.6 | 106.57 | 88 | 0.576 | 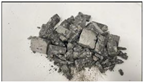 |
| 0.8 | 124.60 | 97.90 | 0.644 | 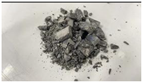 |
| Strain Rate | Sample Crushing State | Simulate Broken State | Dynamic Yield Strength | ||
|---|---|---|---|---|---|
| Indoor Test | Numerical Simulation | Experiment (MPa) | Simulation (MPa) | ||
| 83.88 | 81.2 |  | 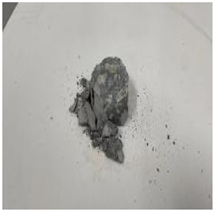 | 84.48 | 85 |
| 106.57 | 104.8 | 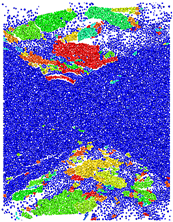 |  | 88 | 86.98 |
| Type | Contact Model | Particle Size | Coefficient of Friction | Density (kg/m3) | Elastic Modulus (GPa) | Stiffness Ratio (kratio) | Fj_ten (MPa) | Fj_coh (MPa) | Fj_fa (°) |
|---|---|---|---|---|---|---|---|---|---|
| Cement particles | Flat-joint model | 0.45 × 10⁻³~0.74 × 10⁻³ | 0.2 | 2800 | 12.2 | 3.0 | 28.2 | 52.5 | 35 |
| Aggregate particles | Flat-joint model | 0.25 | 2500 | 15.0 | 3.0 | 40.0 | 70.0 | 45 | |
| ITZ | Flat-joint model | 0.3 | 2800 | 10 | 3.0 | 30 | 40 | 35 |
| Type | Contact Model | Density (kg/m3) | Rod Length (m) | Elastic Modulus (GPa) | Poisson’s Ratio |
|---|---|---|---|---|---|
| Incident rod | Elastic model | 7800 | 2.0 | 205 | 0.25 |
| Transmission rod | Elastic model | 7800 | 1.5 | 205 | 0.3 |
Disclaimer/Publisher’s Note: The statements, opinions and data contained in all publications are solely those of the individual author(s) and contributor(s) and not of MDPI and/or the editor(s). MDPI and/or the editor(s) disclaim responsibility for any injury to people or property resulting from any ideas, methods, instructions or products referred to in the content. |
© 2025 by the authors. Licensee MDPI, Basel, Switzerland. This article is an open access article distributed under the terms and conditions of the Creative Commons Attribution (CC BY) license (https://creativecommons.org/licenses/by/4.0/).
Share and Cite
Zhang, Y.; Hu, H.; Luo, Y.; Gong, Y.; Zhang, J. Investigating Stress Limitations in Dynamic Response of Coral Limestone Concrete: Integrated FDM-DEM Simulations and Experimental Validation. Materials 2025, 18, 2268. https://doi.org/10.3390/ma18102268
Zhang Y, Hu H, Luo Y, Gong Y, Zhang J. Investigating Stress Limitations in Dynamic Response of Coral Limestone Concrete: Integrated FDM-DEM Simulations and Experimental Validation. Materials. 2025; 18(10):2268. https://doi.org/10.3390/ma18102268
Chicago/Turabian StyleZhang, Yuzhu, Haoran Hu, Yi Luo, Yi Gong, and Jinrui Zhang. 2025. "Investigating Stress Limitations in Dynamic Response of Coral Limestone Concrete: Integrated FDM-DEM Simulations and Experimental Validation" Materials 18, no. 10: 2268. https://doi.org/10.3390/ma18102268
APA StyleZhang, Y., Hu, H., Luo, Y., Gong, Y., & Zhang, J. (2025). Investigating Stress Limitations in Dynamic Response of Coral Limestone Concrete: Integrated FDM-DEM Simulations and Experimental Validation. Materials, 18(10), 2268. https://doi.org/10.3390/ma18102268