
The Cementation Mechanisms and Mechanical Properties of Different Soil–Rock Mixtures–Slurry Cements

Abstract
1. Introduction
2. Experiments on the Macromechanical Properties and Microscopic Characterization of SRM–SC
2.1. Macromechanical Property Experiment on SRM–SC
2.1.1. Test Materials
- (1)
- Ordinary Portland cement
- (2)
- Low-alkalinity sulfoaluminate cement
- (3)
- Water–glass
- (4)
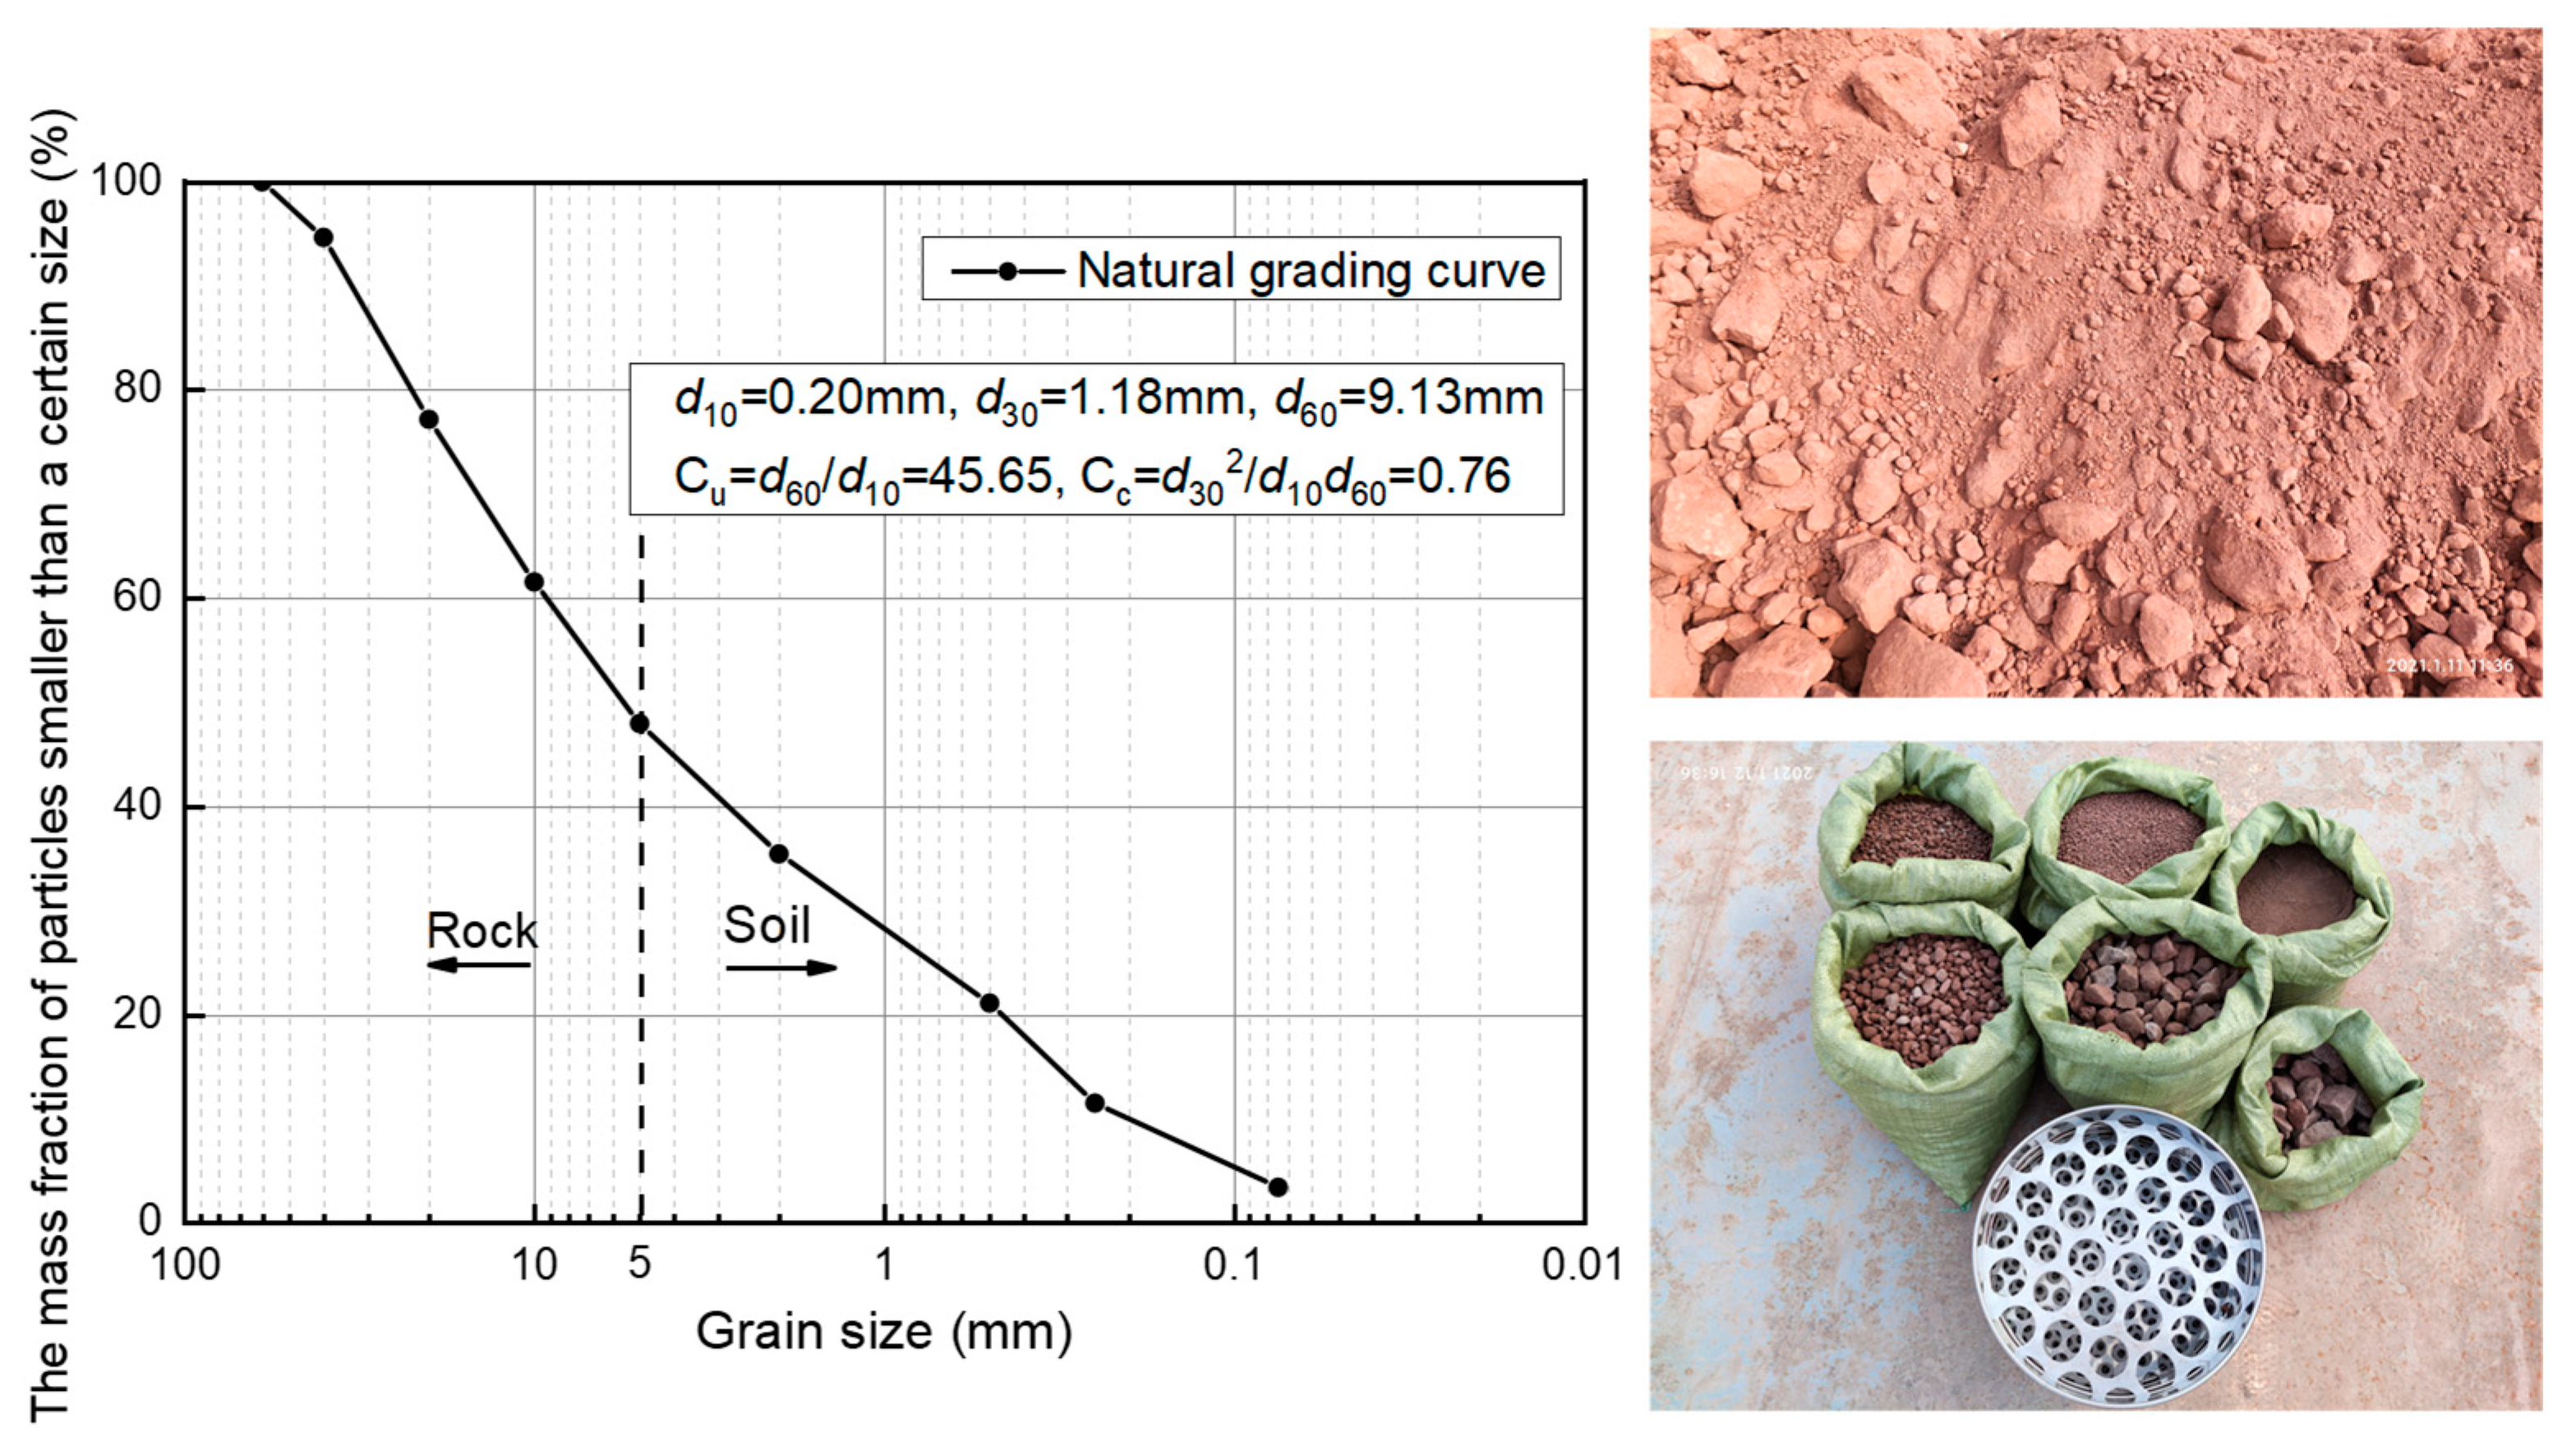
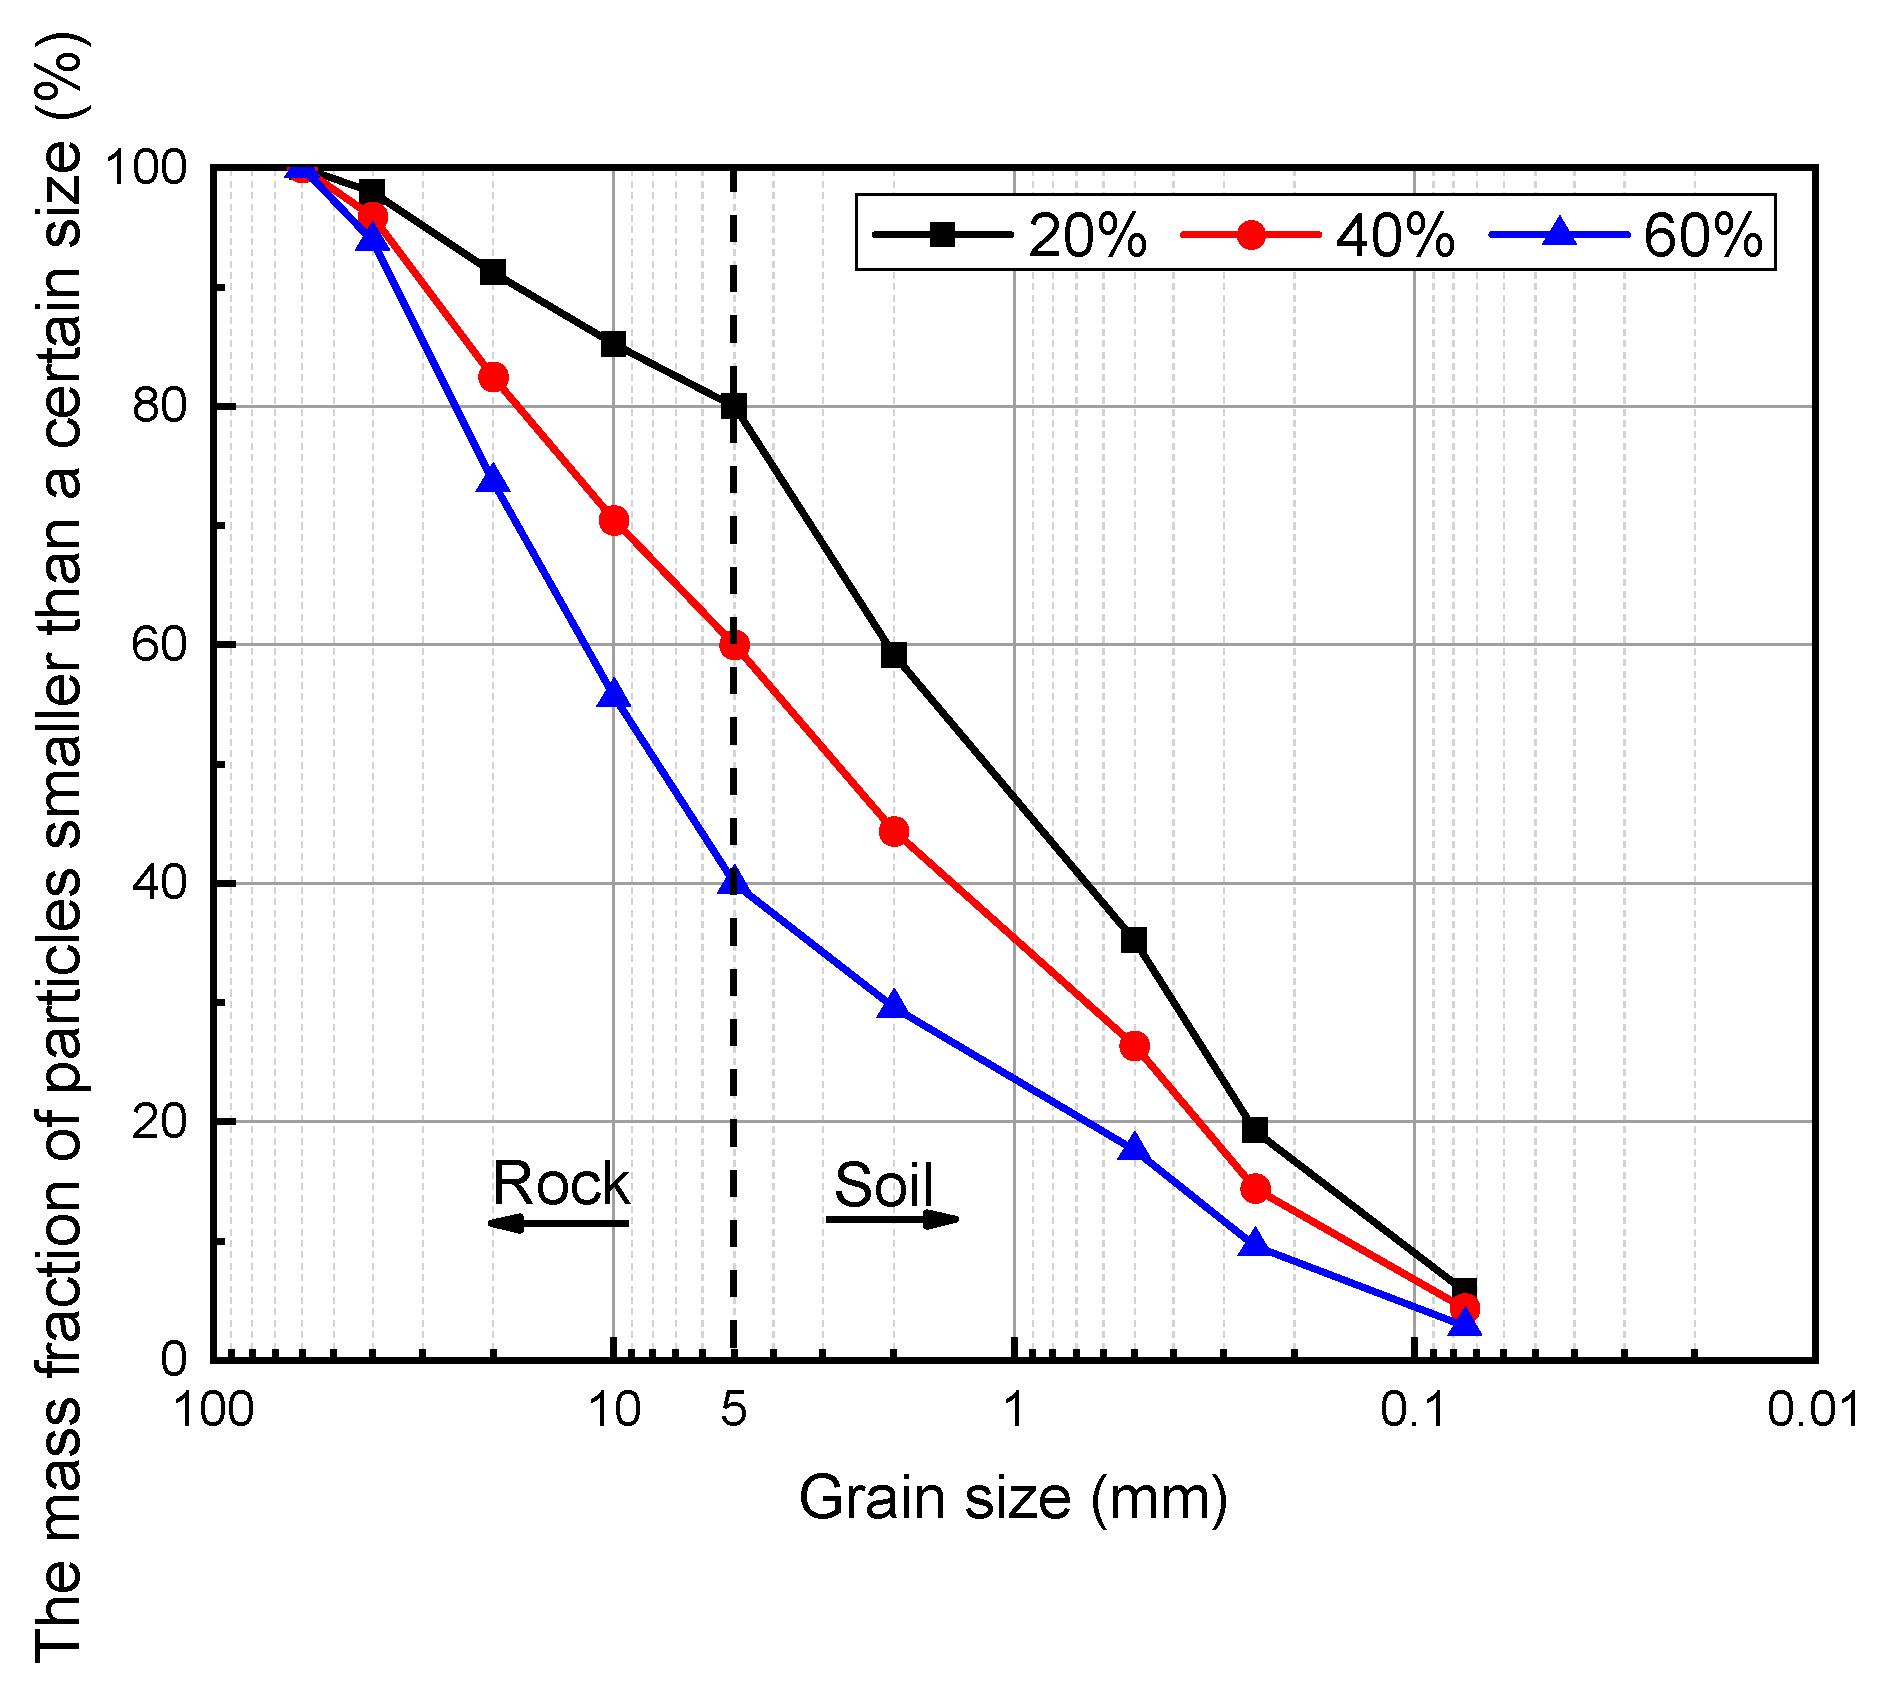
- Soil–rock mixture
2.1.2. Preparation Program for SRM–SC
- (1)
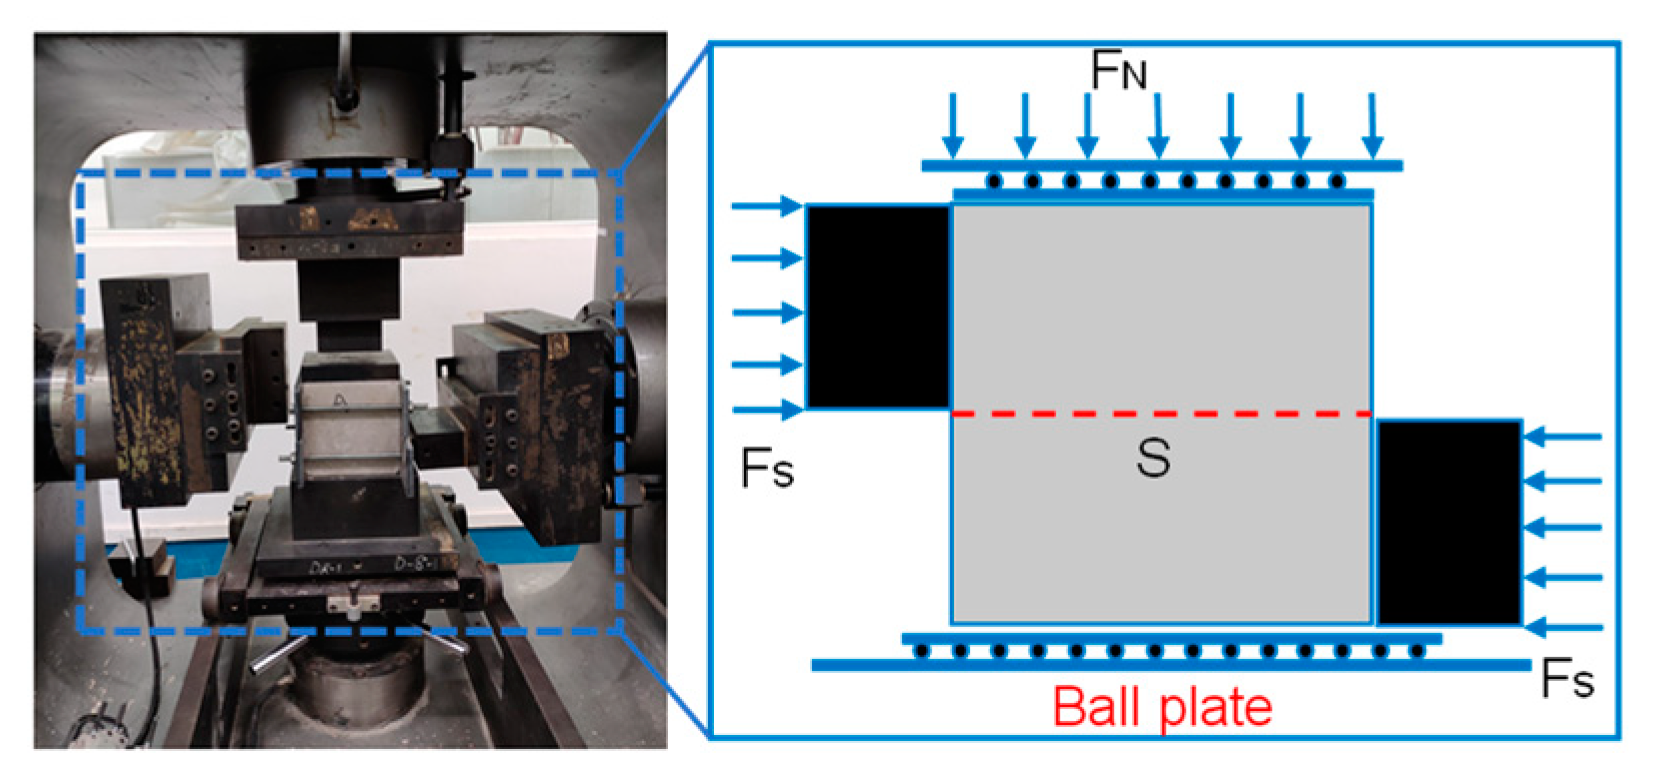
- Testing equipment
- (2)
- Testing programs
- (3)
- Specimen preparation of SRM–SC
2.1.3. Test Procedure
2.2. Microscopic Characterization Experiment of SRM–SC
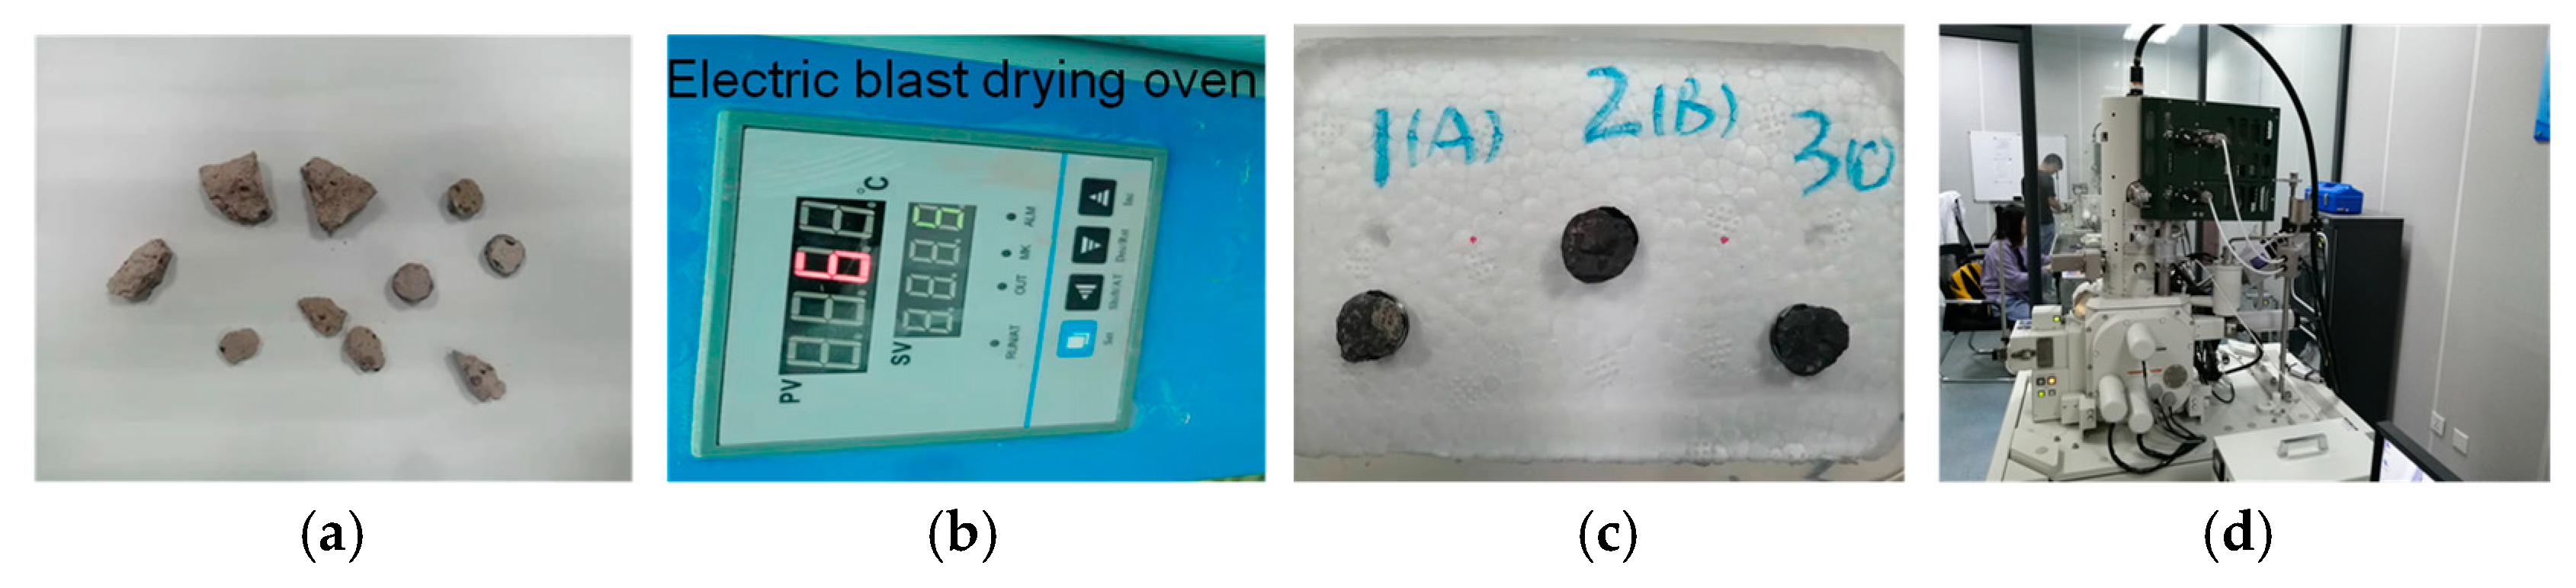
- The collection of the SRM–SC specimens left following the mechanical tests. From these specimens, a fragment specimen with a flat bottom and a size adapted to the size of the sample table (the size of the sample table was Φ12.7 × 9 mm) was selected as the sample to be tested; the specimen contained small rock particles (the particle size was approximately 5 mm), presenting the interface between the slurry and the rock. One test sample was made for each of the three grouting materials.
- Cleaning and drying treatment. To ensure the actual uncontaminated state of the specimen surface, the slices were soaked in anhydrous alcohol for 1 d to terminate hydration and then dried at 65 °C to a constant weight.
- Surface gilding. For samples with poor electrical conductivity, such as SRM–SC, it was necessary to spray a conductive layer before observation to form a conductive film on the surface of the material to avoid the accumulation of charge on the surface of the sample, to improve the quality of the image and to prevent thermal damage to the sample. The samples were pasted onto the scanning electron microscope sample stage with professional conductive adhesive, and the surface was plated with a spraying rate of 30 s × 4 times.
- Upon attaining a vacuum level of lower than Torr, we proceeded with the electron microscope scanning analysis.Figure 4. The primary test process of scanning electron microscopy: (a) Sample selection. (b) Clean and dry. (c) Surface gilding (A, B, and C represent slurry A, slurry B, and slurry C). (d) Vacuum scanning.Figure 4. The primary test process of scanning electron microscopy: (a) Sample selection. (b) Clean and dry. (c) Surface gilding (A, B, and C represent slurry A, slurry B, and slurry C). (d) Vacuum scanning.
![Materials 18 02186 g004]()
3. The Analysis of the Results of the SRM–SC Microscopic Property Detection Test
3.1. The Analysis of the Electron Microscope Scanning Test Results of SRM–SC
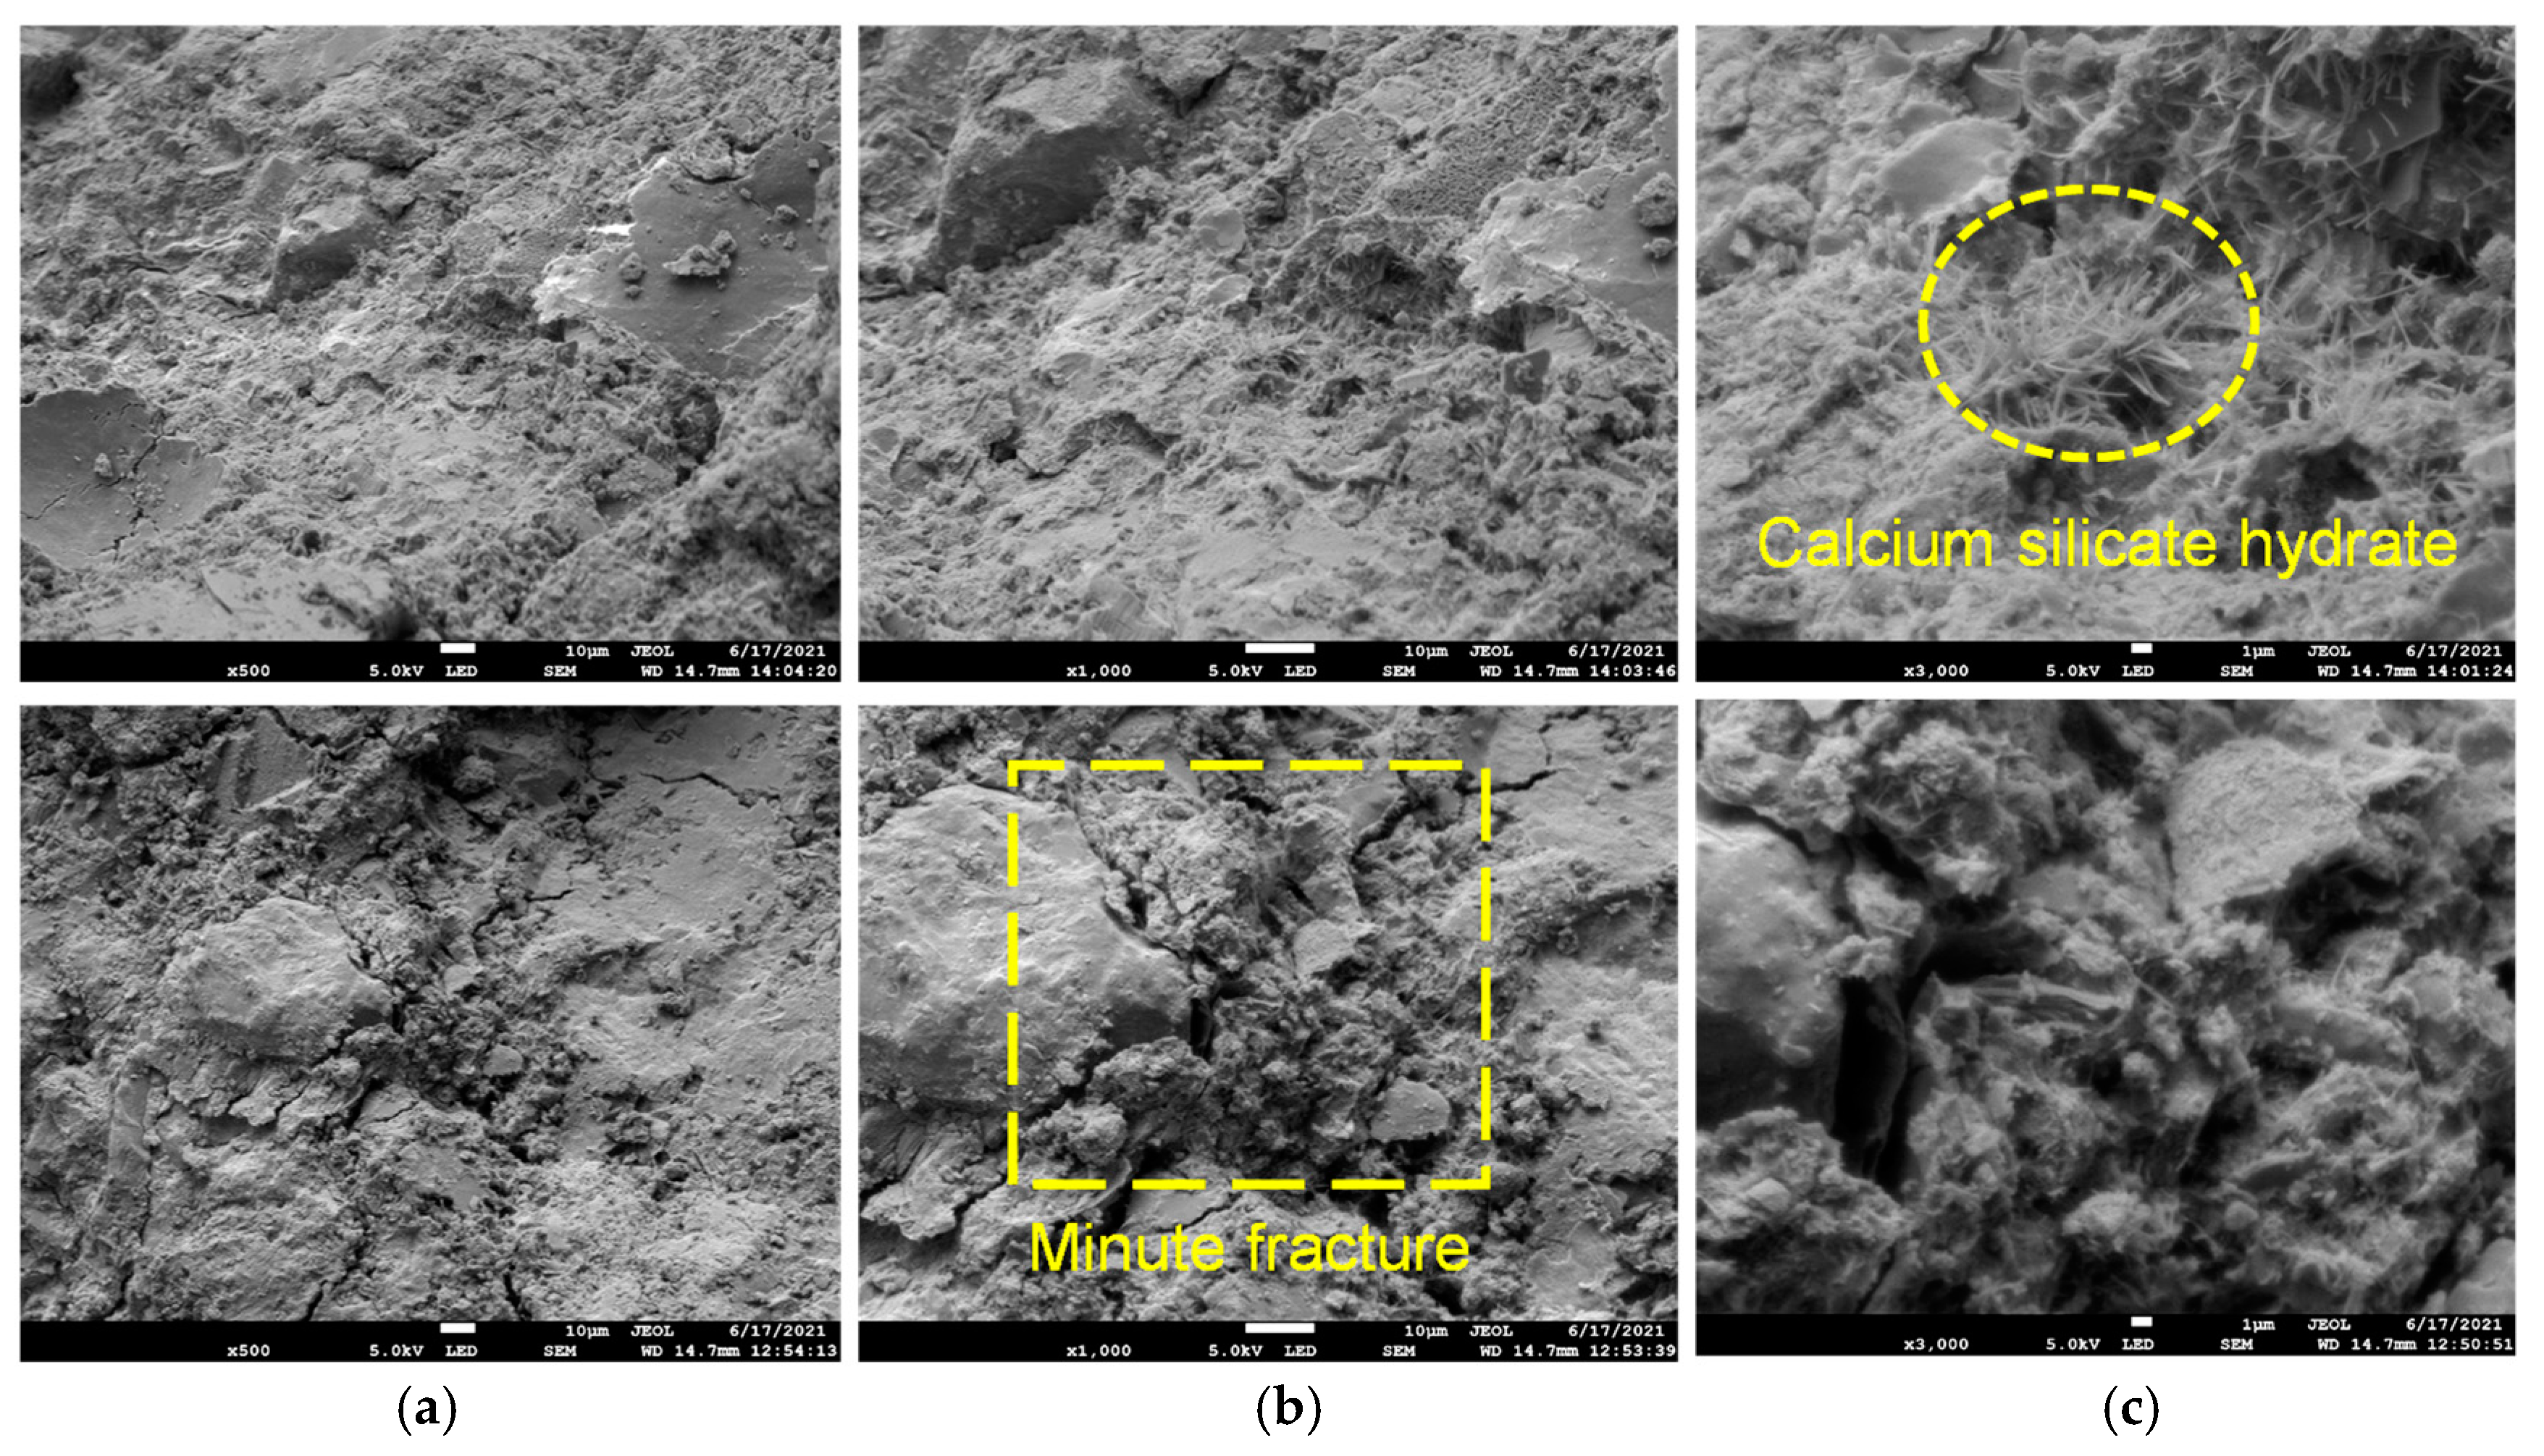
- There were defects such as tiny cracks on the cemented surface, interconnected pores between the calcium silicate hydrate gel () particles, voids between the hydration products, capillary pores that were not filled by the hydration products, and voids between the soil particles, and the defects were obviously distributed in a wide range and large in number;
- The calcium silicate hydrate showed a fiber-like and flocculent, sparse distribution in the vicinity of voids and minute fractures;
- The distribution of calcium silicate hydrate on the surface of different scanning areas varied in density, and the distribution of calcium silicate hydrate in the same scanning area was not uniform;
- The voids between the interface of the rock particles and other particles were filled with calcium silicate hydrate, but the number of hydration products produced was not enough to fill the entire void, and the parts without cementation could still be clearly seen. The particles were more loosely connected, without forming a solid cementation.Figure 5. Microstructure of ordinary Portland cement slurry cementation (WD = 14.7 mm, EHT = 5.0 KV): (a) amplification factor (500); (b) amplification factor (1000); (c) amplification factor (3000).Figure 5. Microstructure of ordinary Portland cement slurry cementation (WD = 14.7 mm, EHT = 5.0 KV): (a) amplification factor (500); (b) amplification factor (1000); (c) amplification factor (3000).
![Materials 18 02186 g005]()
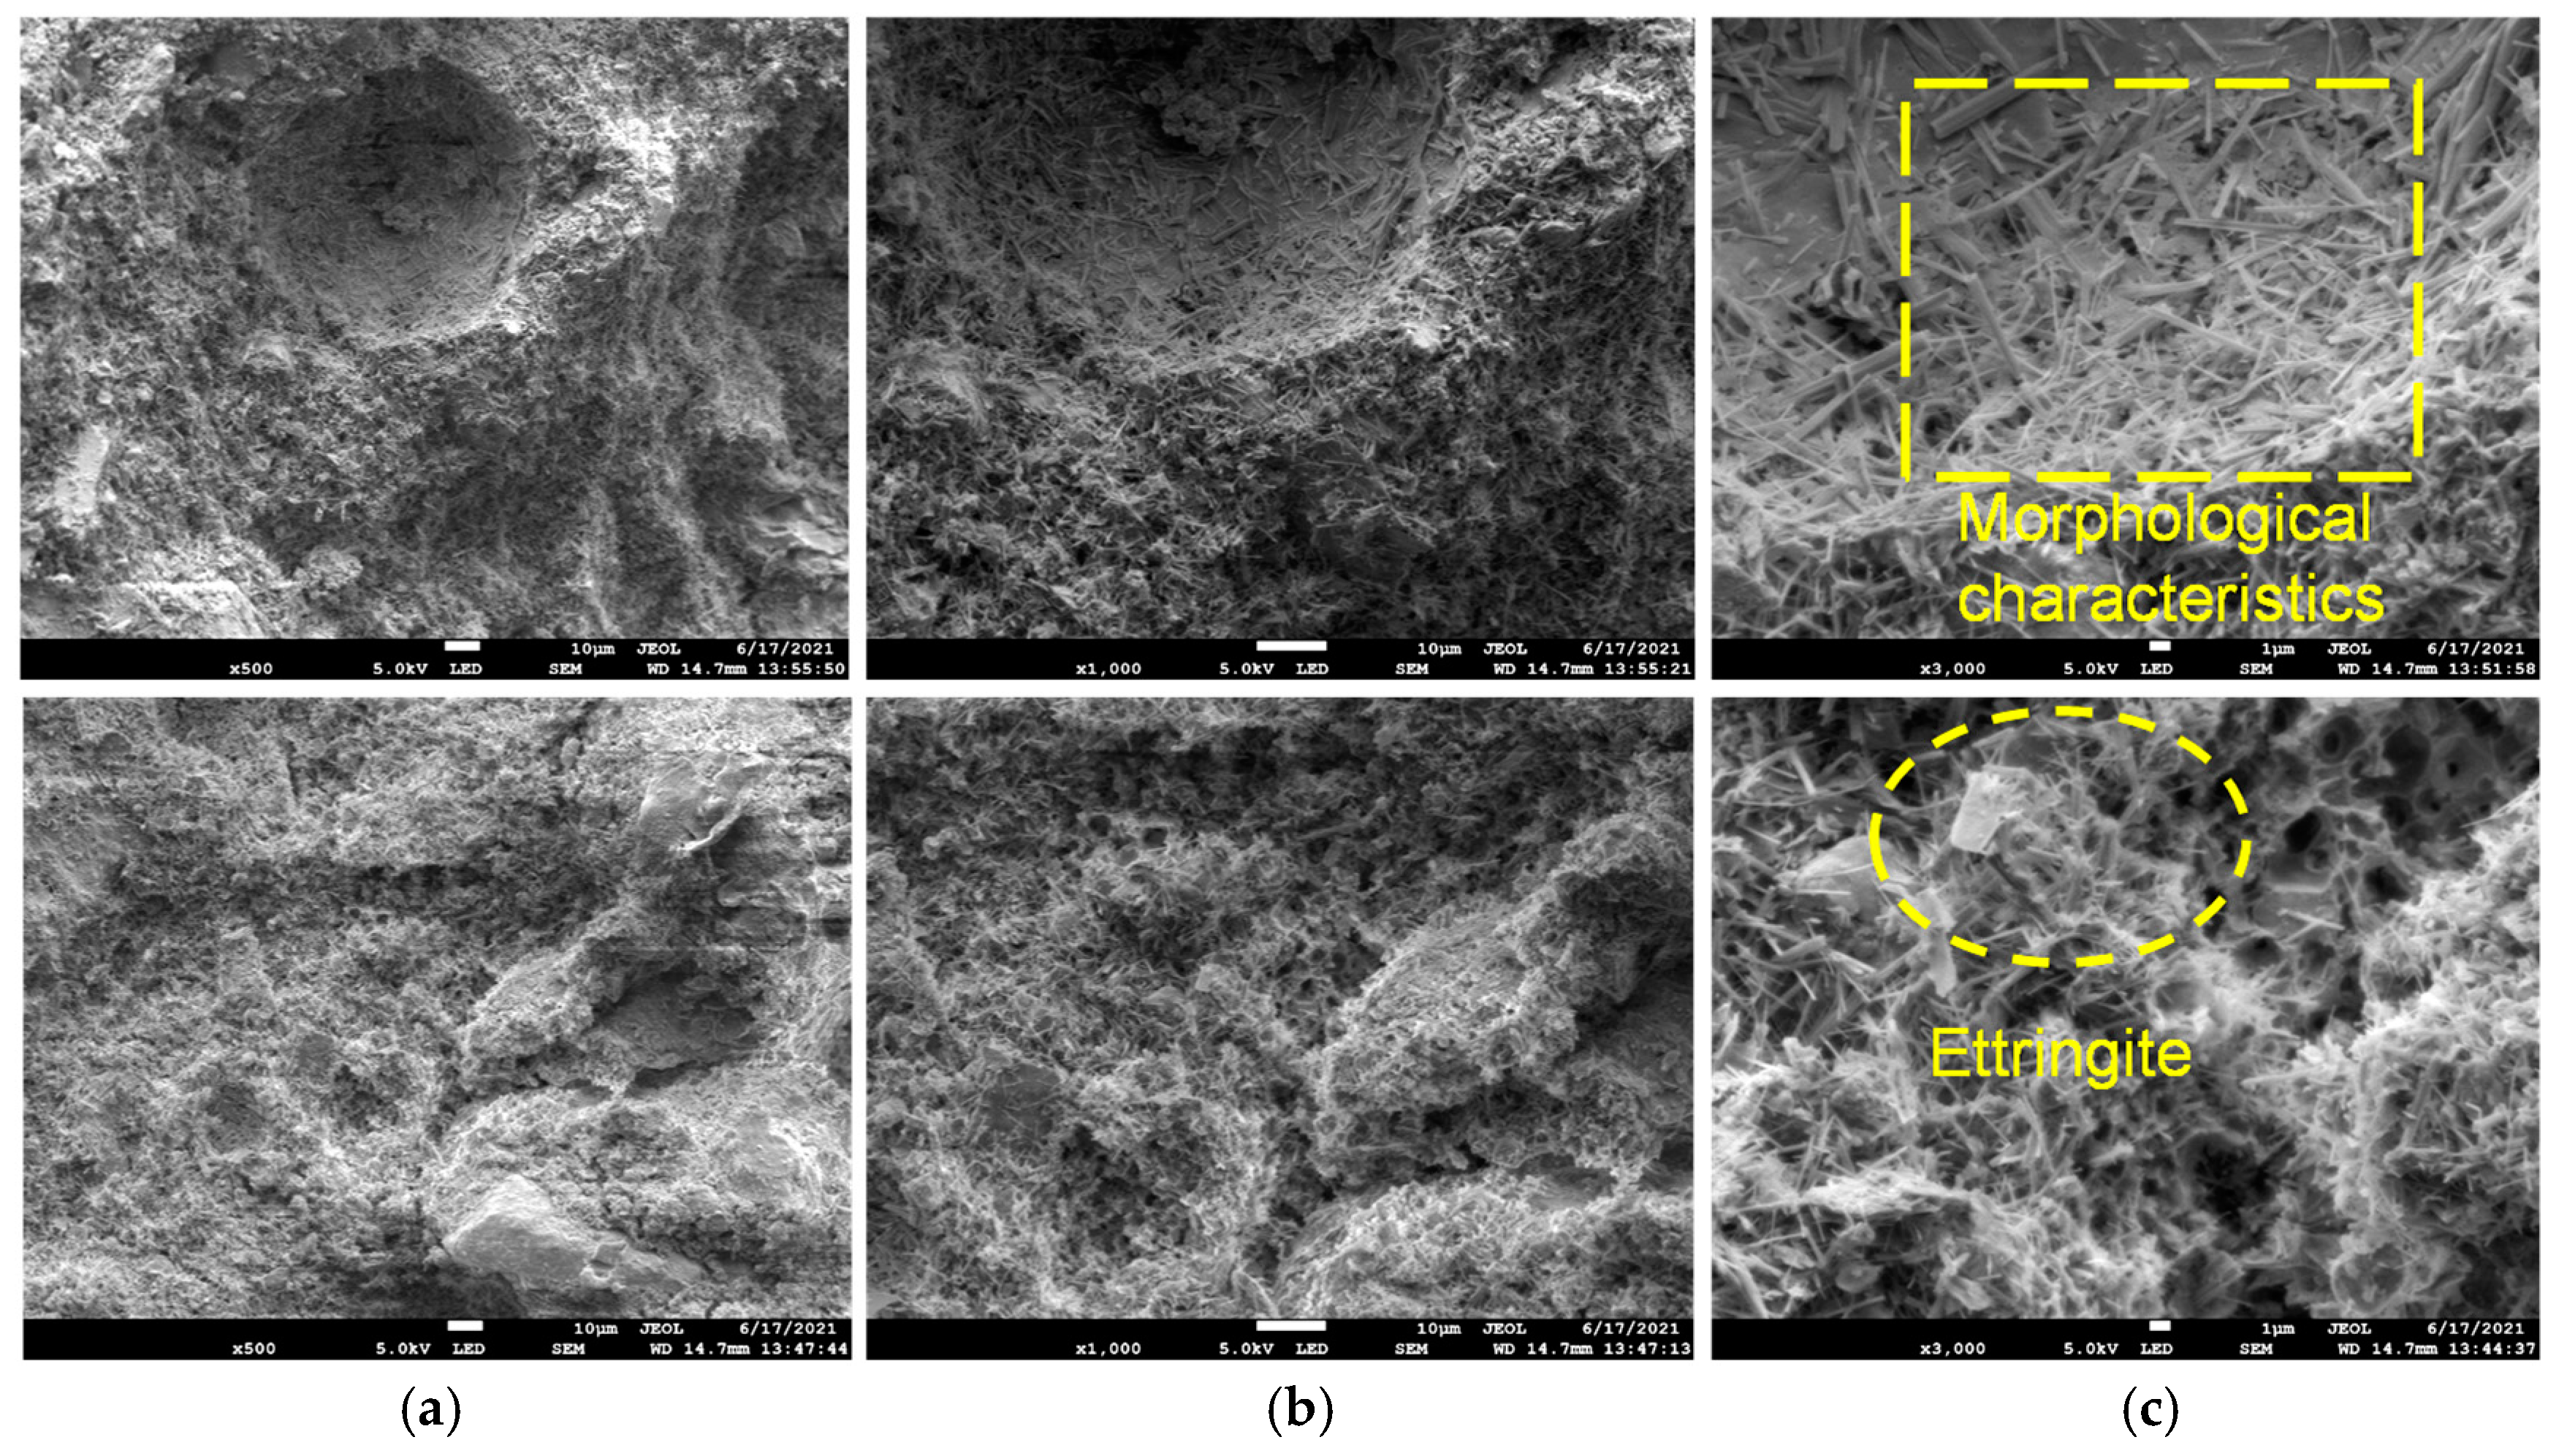
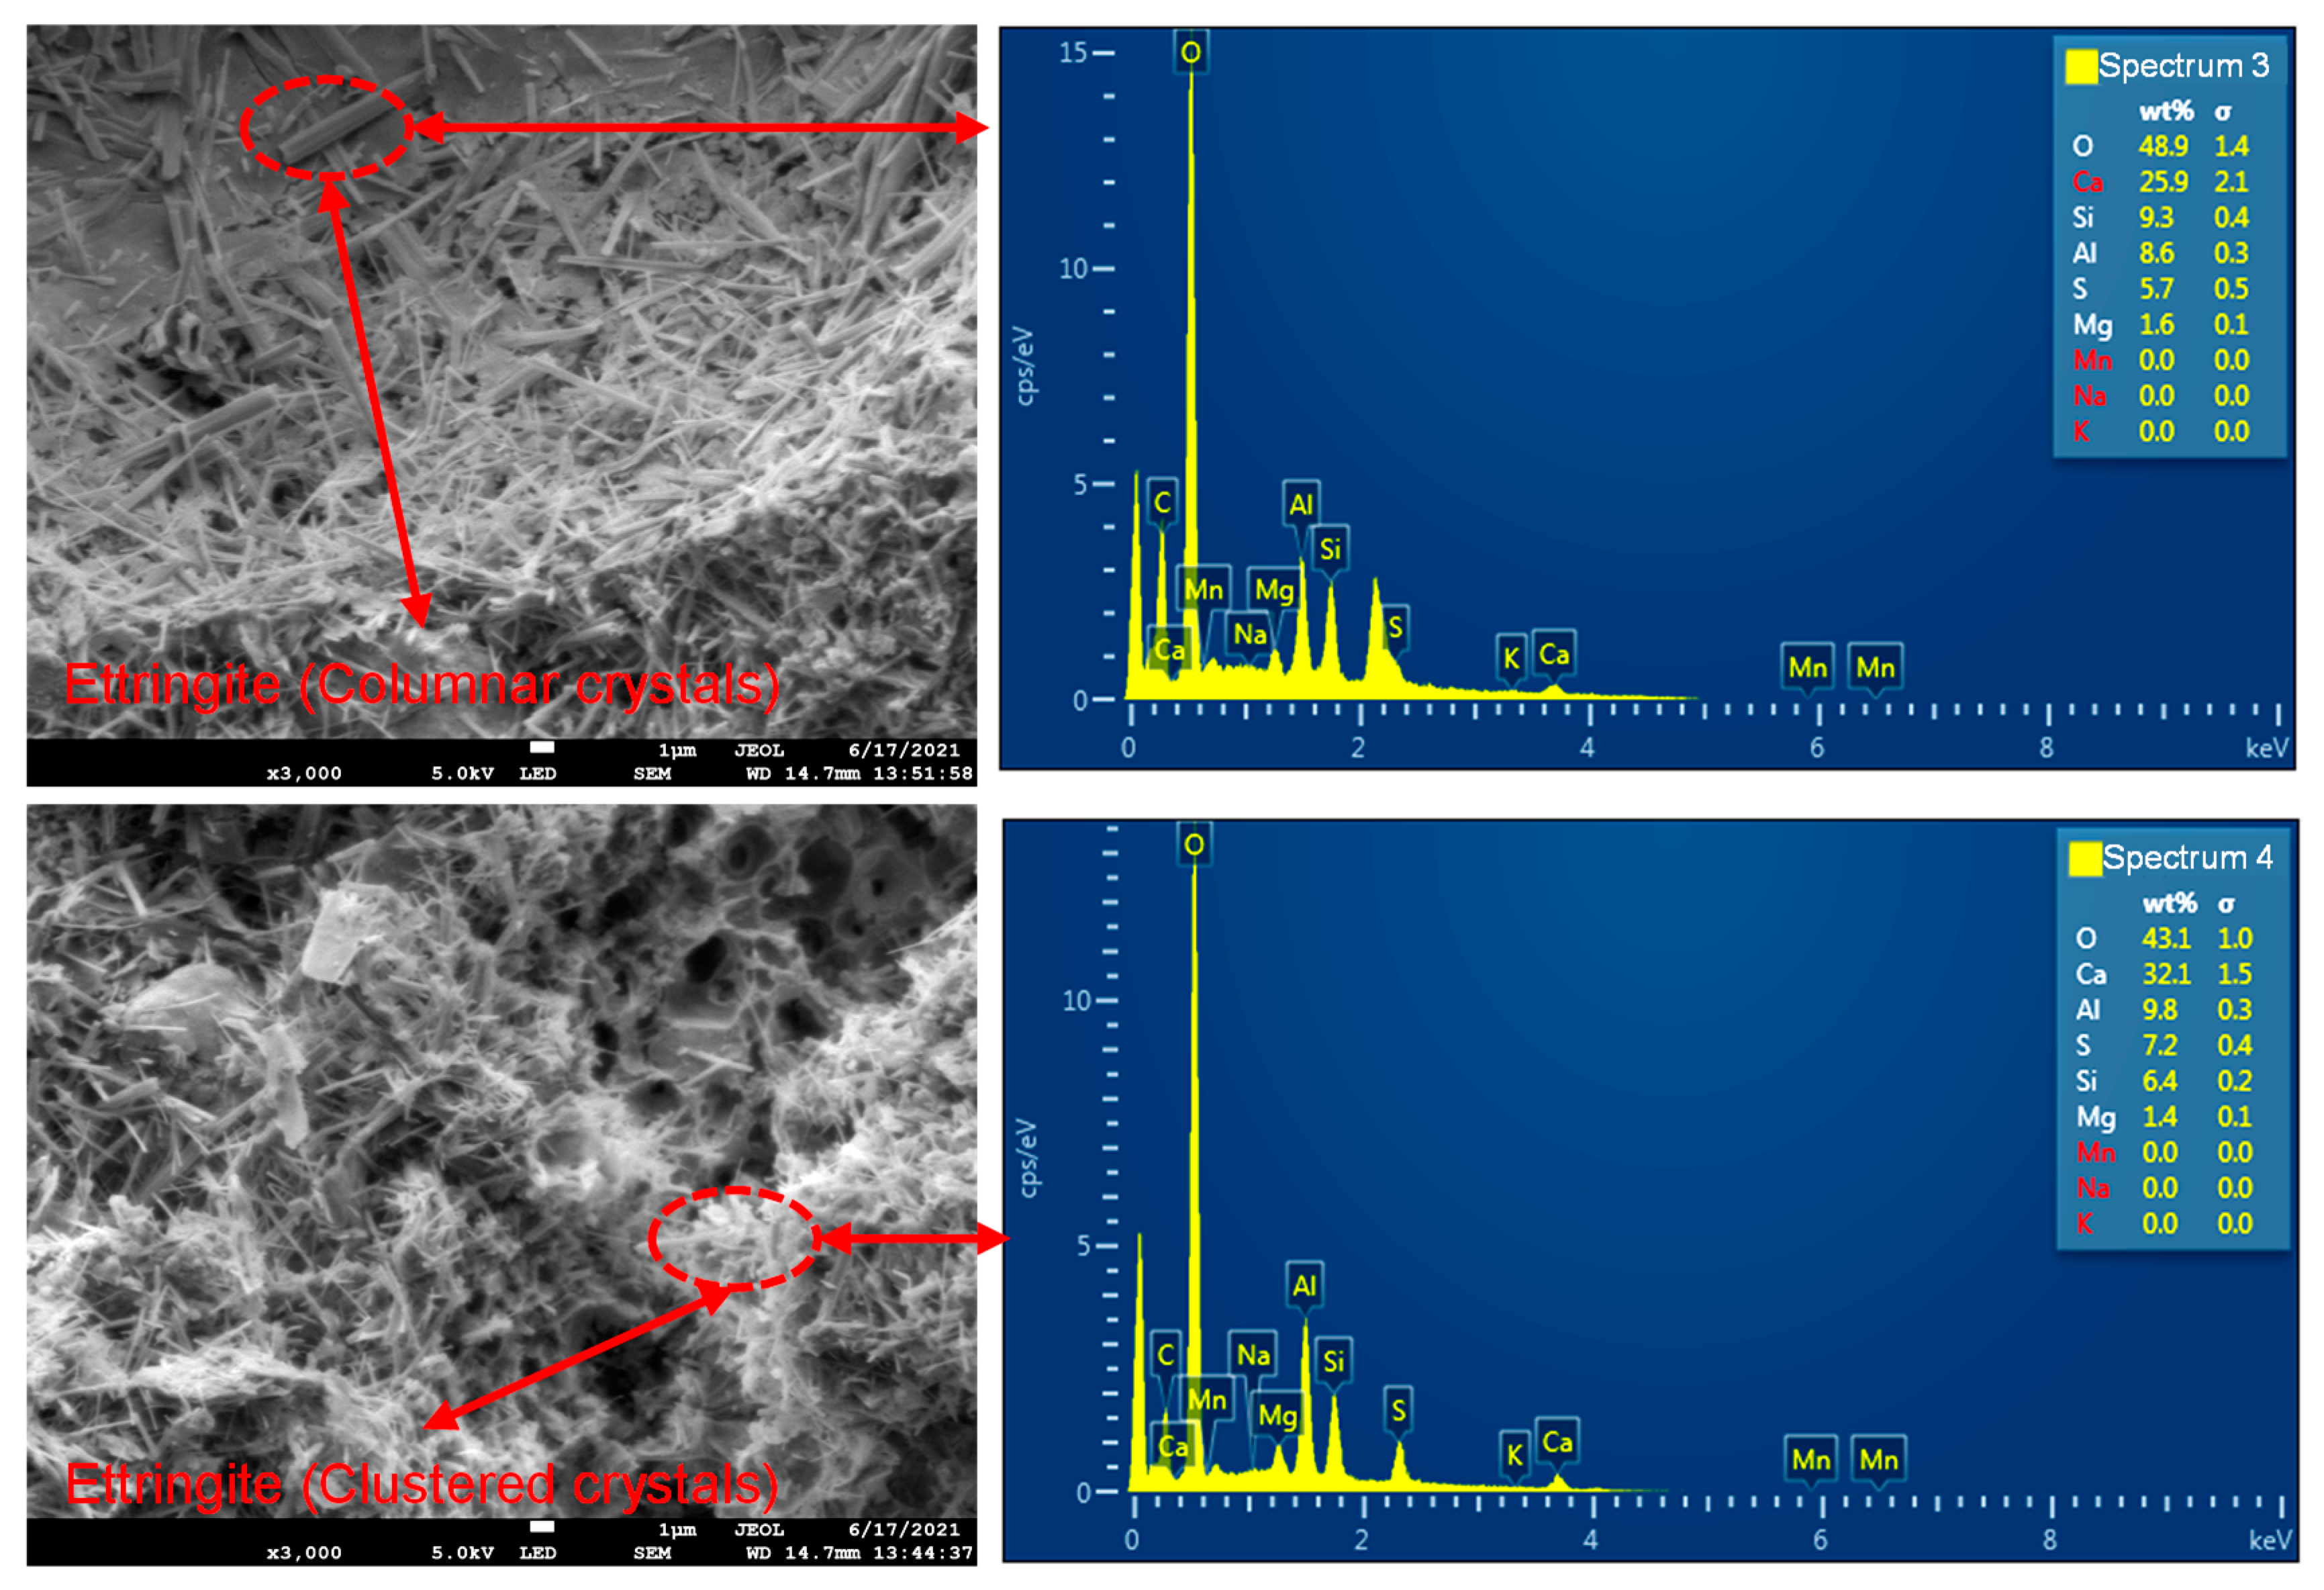
- Compared with the cement surface of the ordinary Portland cement slurry, the cement surface of the low-alkalinity sulfoaluminate cement slurry was basically free of defects, such as minute fractures, and was mainly dominated by interconnected pores between ettringite () particles.
- The main product of hydration was ettringite, with minor amounts of calcium silicate hydrate and hydrated aluminum oxide. Ettringite was densely distributed in columnar and cluster shapes, interweaving and cementing with each other to form a net-like structure that filled and covered the entire scanning area. Calcium silicate hydrate was dispersed within it in fibrous and flocculent forms.
- The distribution of hydration products on the surface of different scanning areas was approximately the same density, and the distribution of hydration products in the same scanning area was uniform.
- Besides the hydration products, such as ettringite and calcium silicate hydrate, on the cemented surface, no soil particles or rock particles could be seen.Figure 6. Microstructure of cementation of low-alkalinity sulfoaluminate cement slurry (WD = 14.7 mm, EHT = 5.0 KV): (a) amplification factor (500); (b) amplification factor (1000); (c) amplification factor (3000).Figure 6. Microstructure of cementation of low-alkalinity sulfoaluminate cement slurry (WD = 14.7 mm, EHT = 5.0 KV): (a) amplification factor (500); (b) amplification factor (1000); (c) amplification factor (3000).
![Materials 18 02186 g006]()
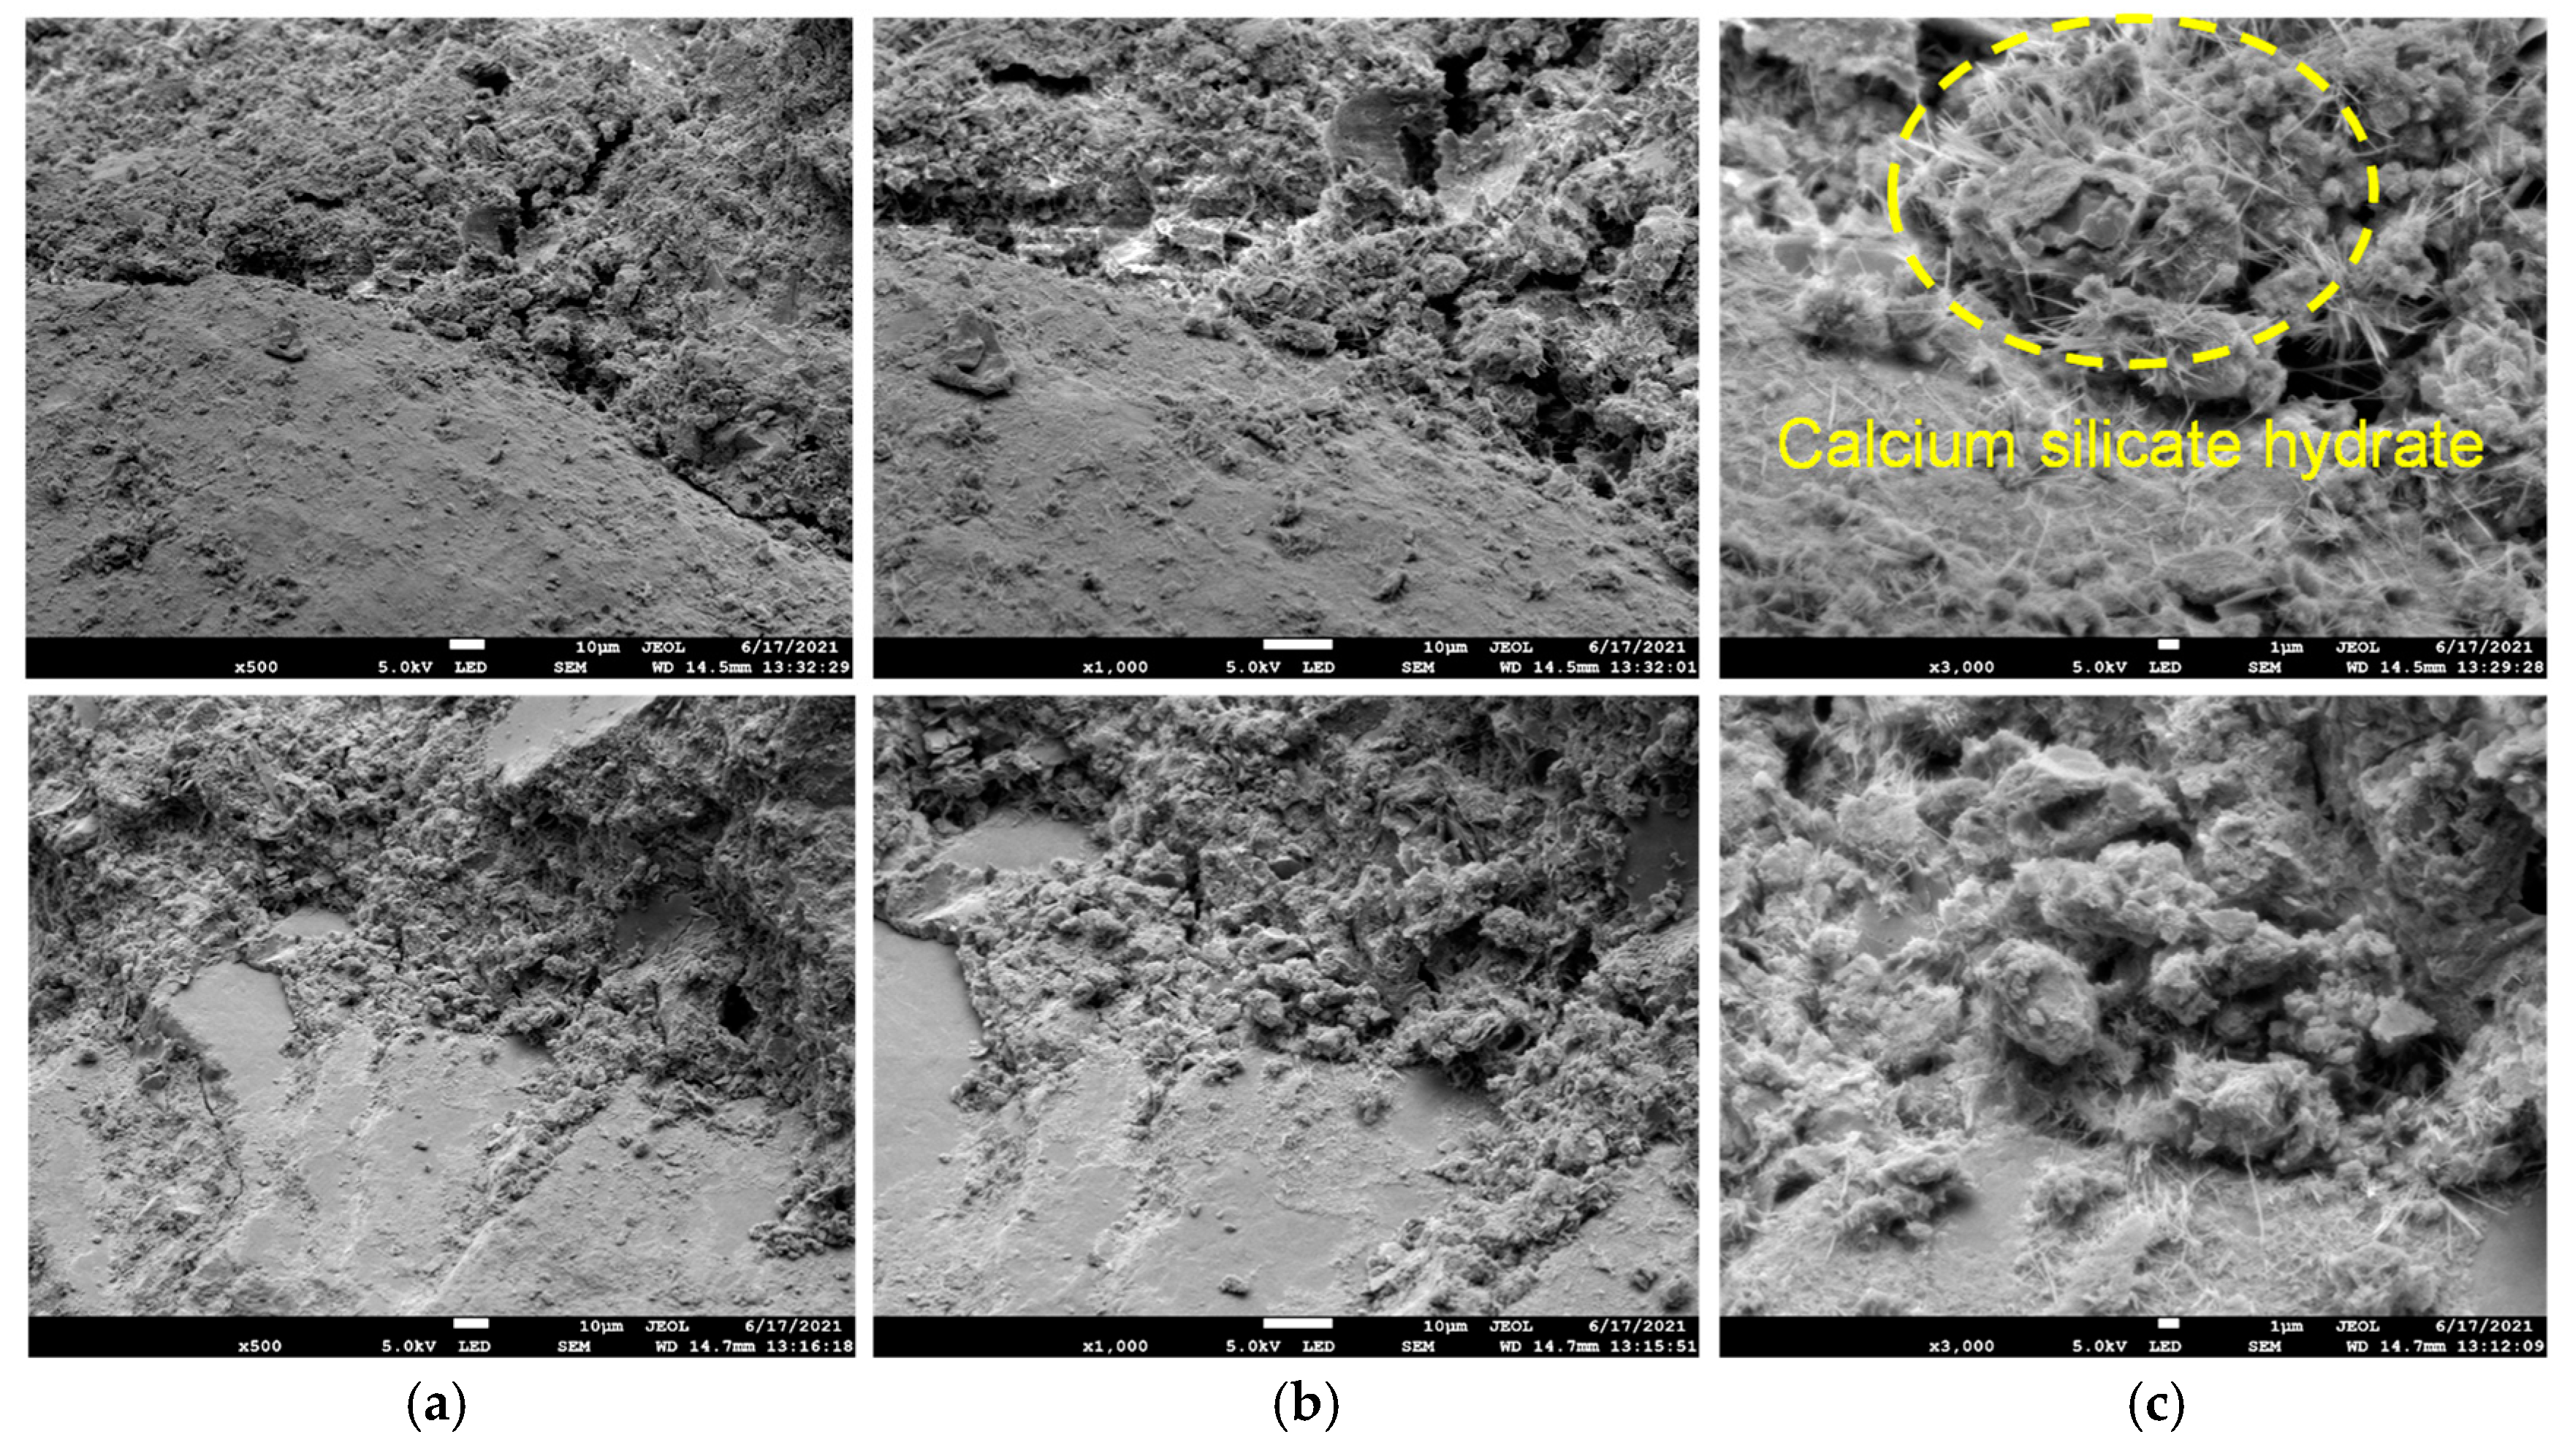
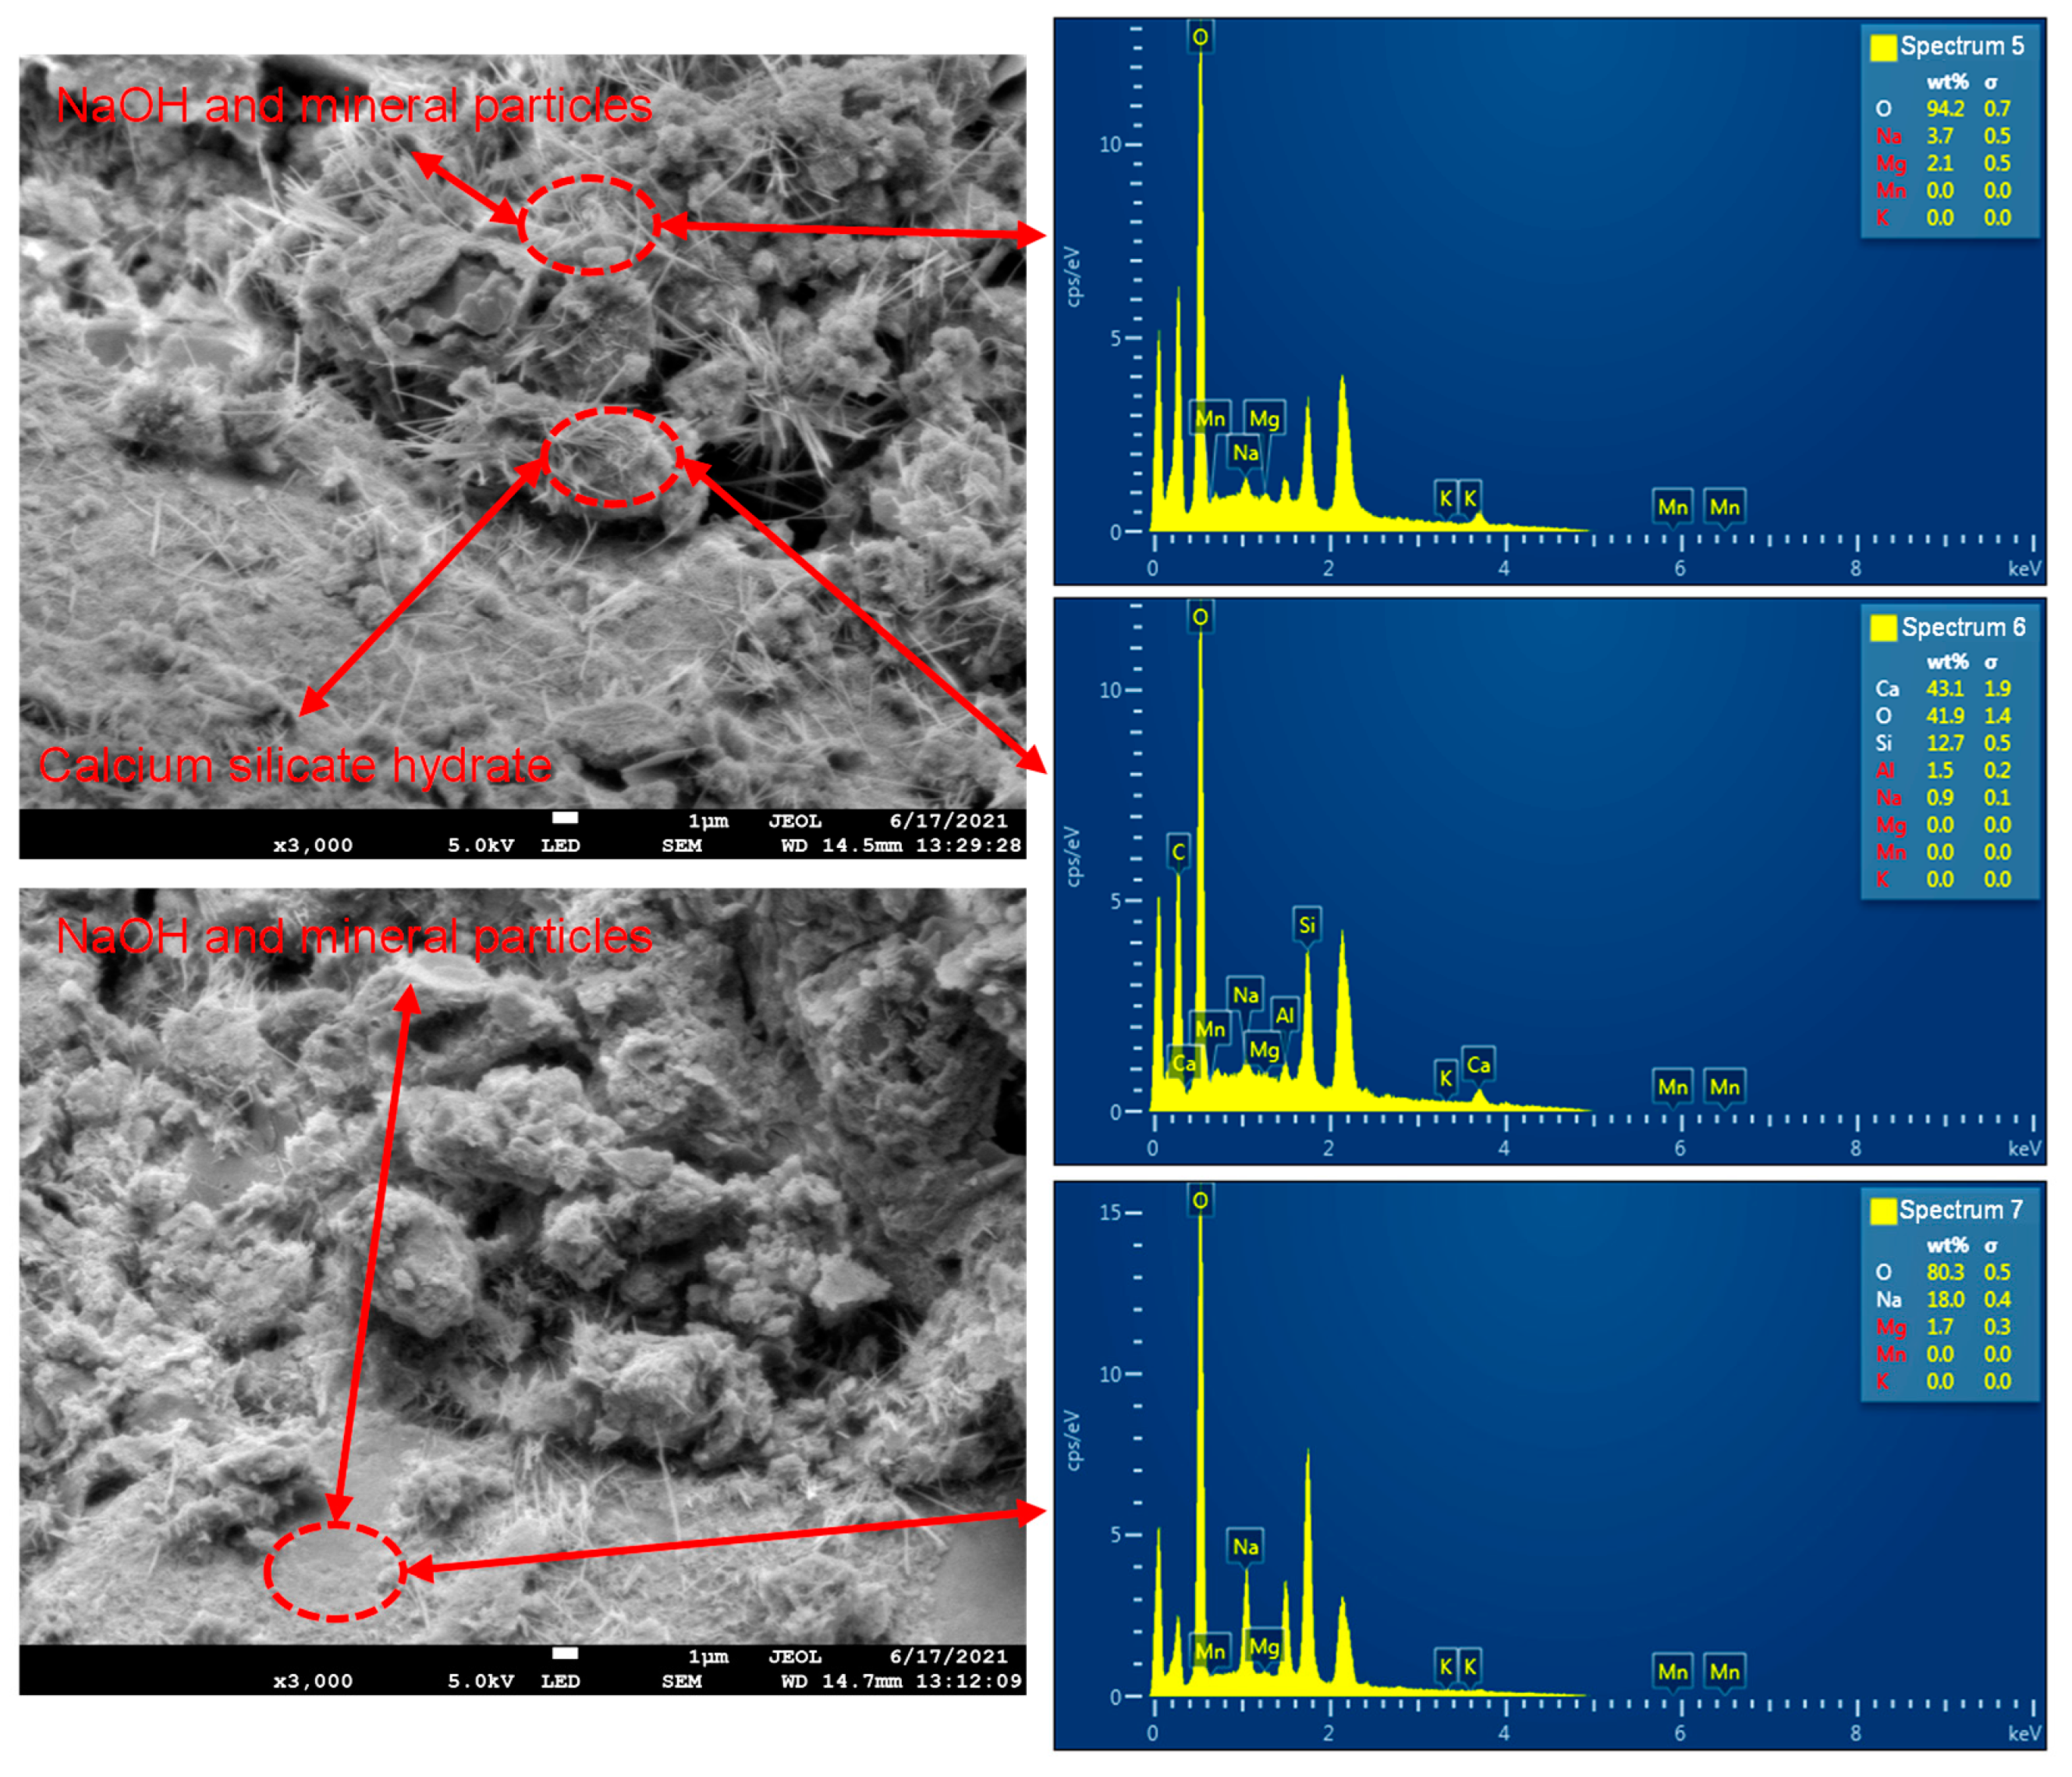
- The defects on the cemented surface of ordinary Portland cement–water–glass slurry were fewer and mainly dominated by the voids between the hydration products ().
- The calcium silicate hydrate showed a fibrous and flocculent distribution near the interface between the voids and the particles of the rock mass, and the generation of the calcium silicate hydrate was significantly increased in number and densely distributed compared to that on the cemented surface of the ordinary Portland cement.
- The distribution of hydration products on the surface of different scanning areas had approximately the same density, and the distribution of hydration products in the same scanning area was uniform.
- The calcium silicate hydrate filled the voids and surfaces covered between the interfaces of the rock particles.Figure 7. Microstructure of ordinary Portland cement–water–glass slurry cementation (WD = 14.7 mm, EHT = 5.0 KV): (a) amplification factor (500); (b) amplification factor (1000); (c) amplification factor (3000).Figure 7. Microstructure of ordinary Portland cement–water–glass slurry cementation (WD = 14.7 mm, EHT = 5.0 KV): (a) amplification factor (500); (b) amplification factor (1000); (c) amplification factor (3000).
![Materials 18 02186 g007]()
3.2. Analysis of the Reinforcement Mechanism of SRM–SC
3.2.1. The Principle of the Hydration Reaction of Ordinary Portland Cement
3.2.2. The Principle of the Hydration Reaction of Low-Alkalinity Sulfoaluminate Cement
3.2.3. The Principle of the Hydration Reaction of Ordinary Portland Cement–Water–Glass
4. The Analysis of the Results of the Macroscopic Mechanical Property Test of SRM–SC
4.1. The Analysis of the Uniaxial Compression Test Results
4.2. The Analysis of the Direct Shear Test Results
4.3. The Analysis of the Failure Characteristics of SRM–SC
4.3.1. The Analysis of the Typical Failure Characteristics in Uniaxial Compression Tests
4.3.2. The Analysis of the Typical Failure Characteristics in Direct Shear Tests
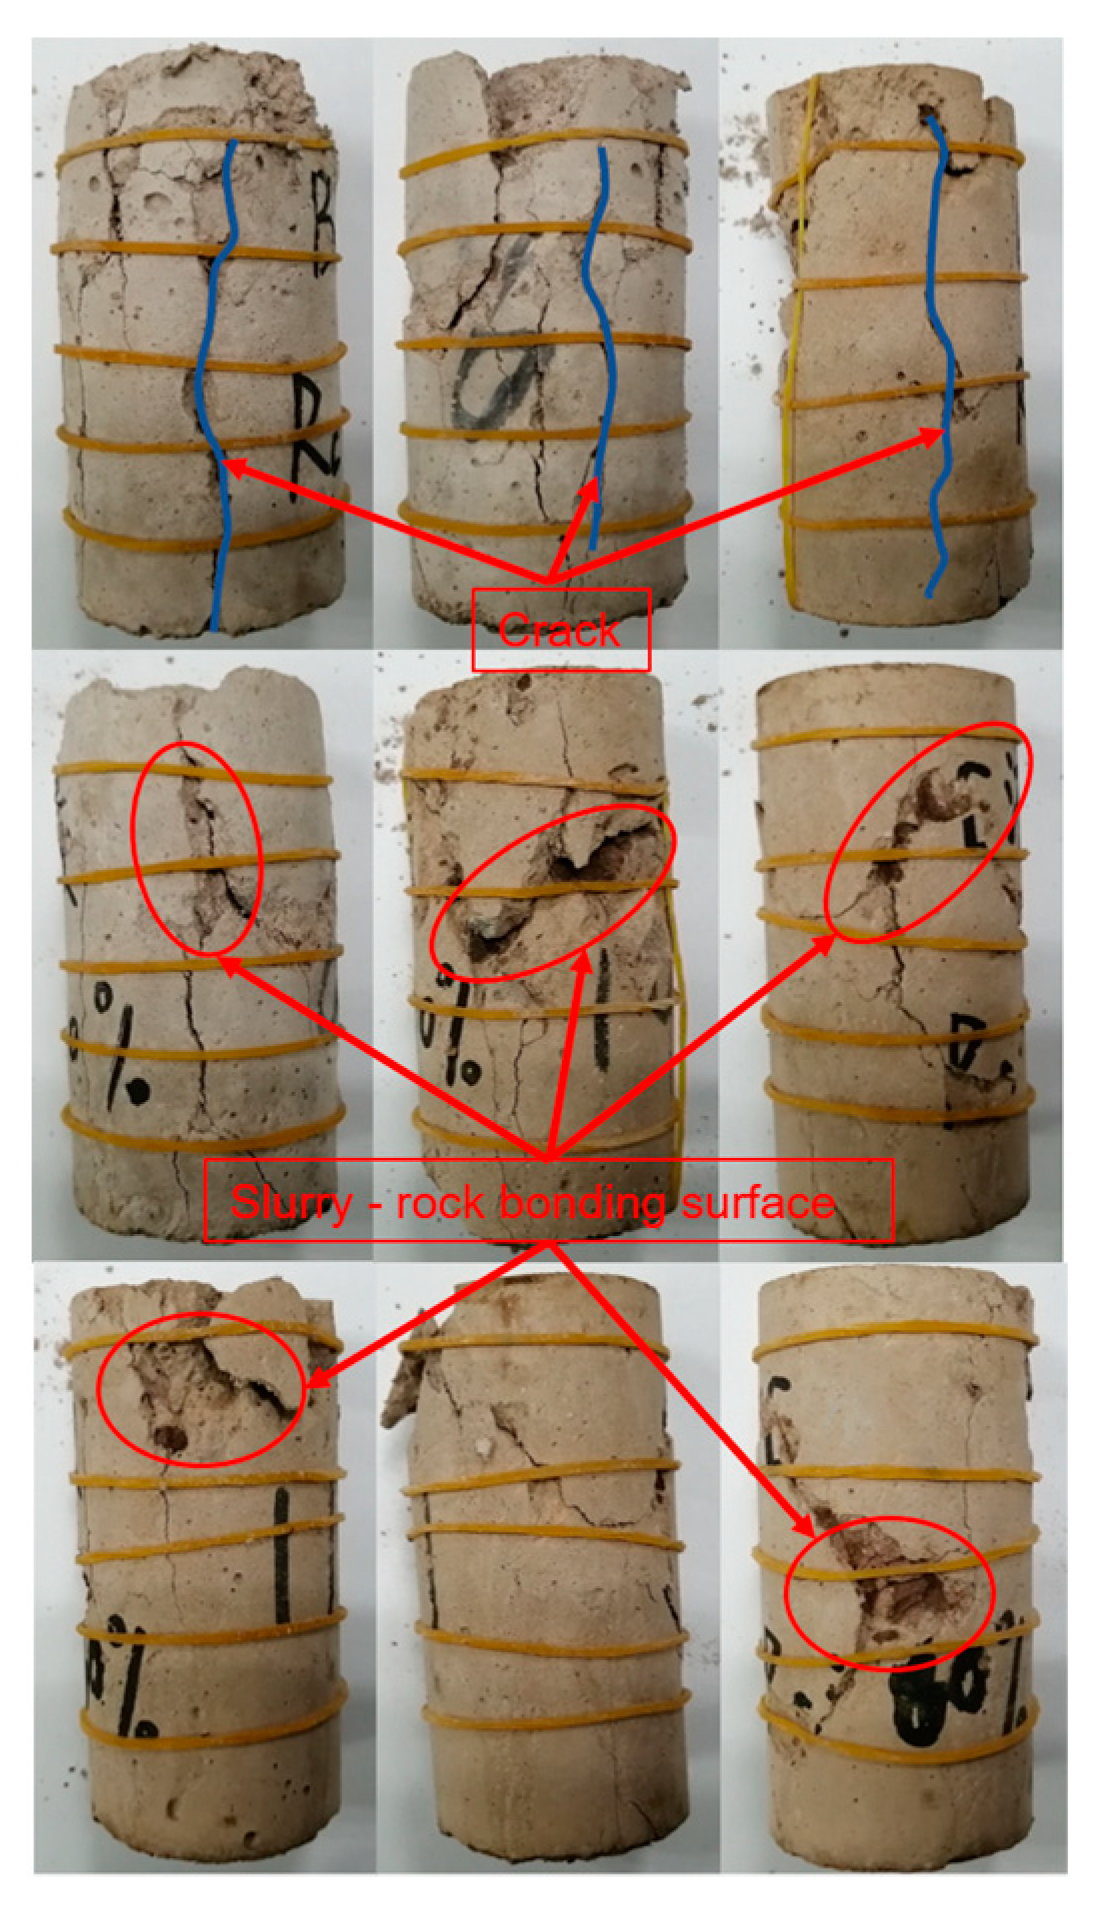
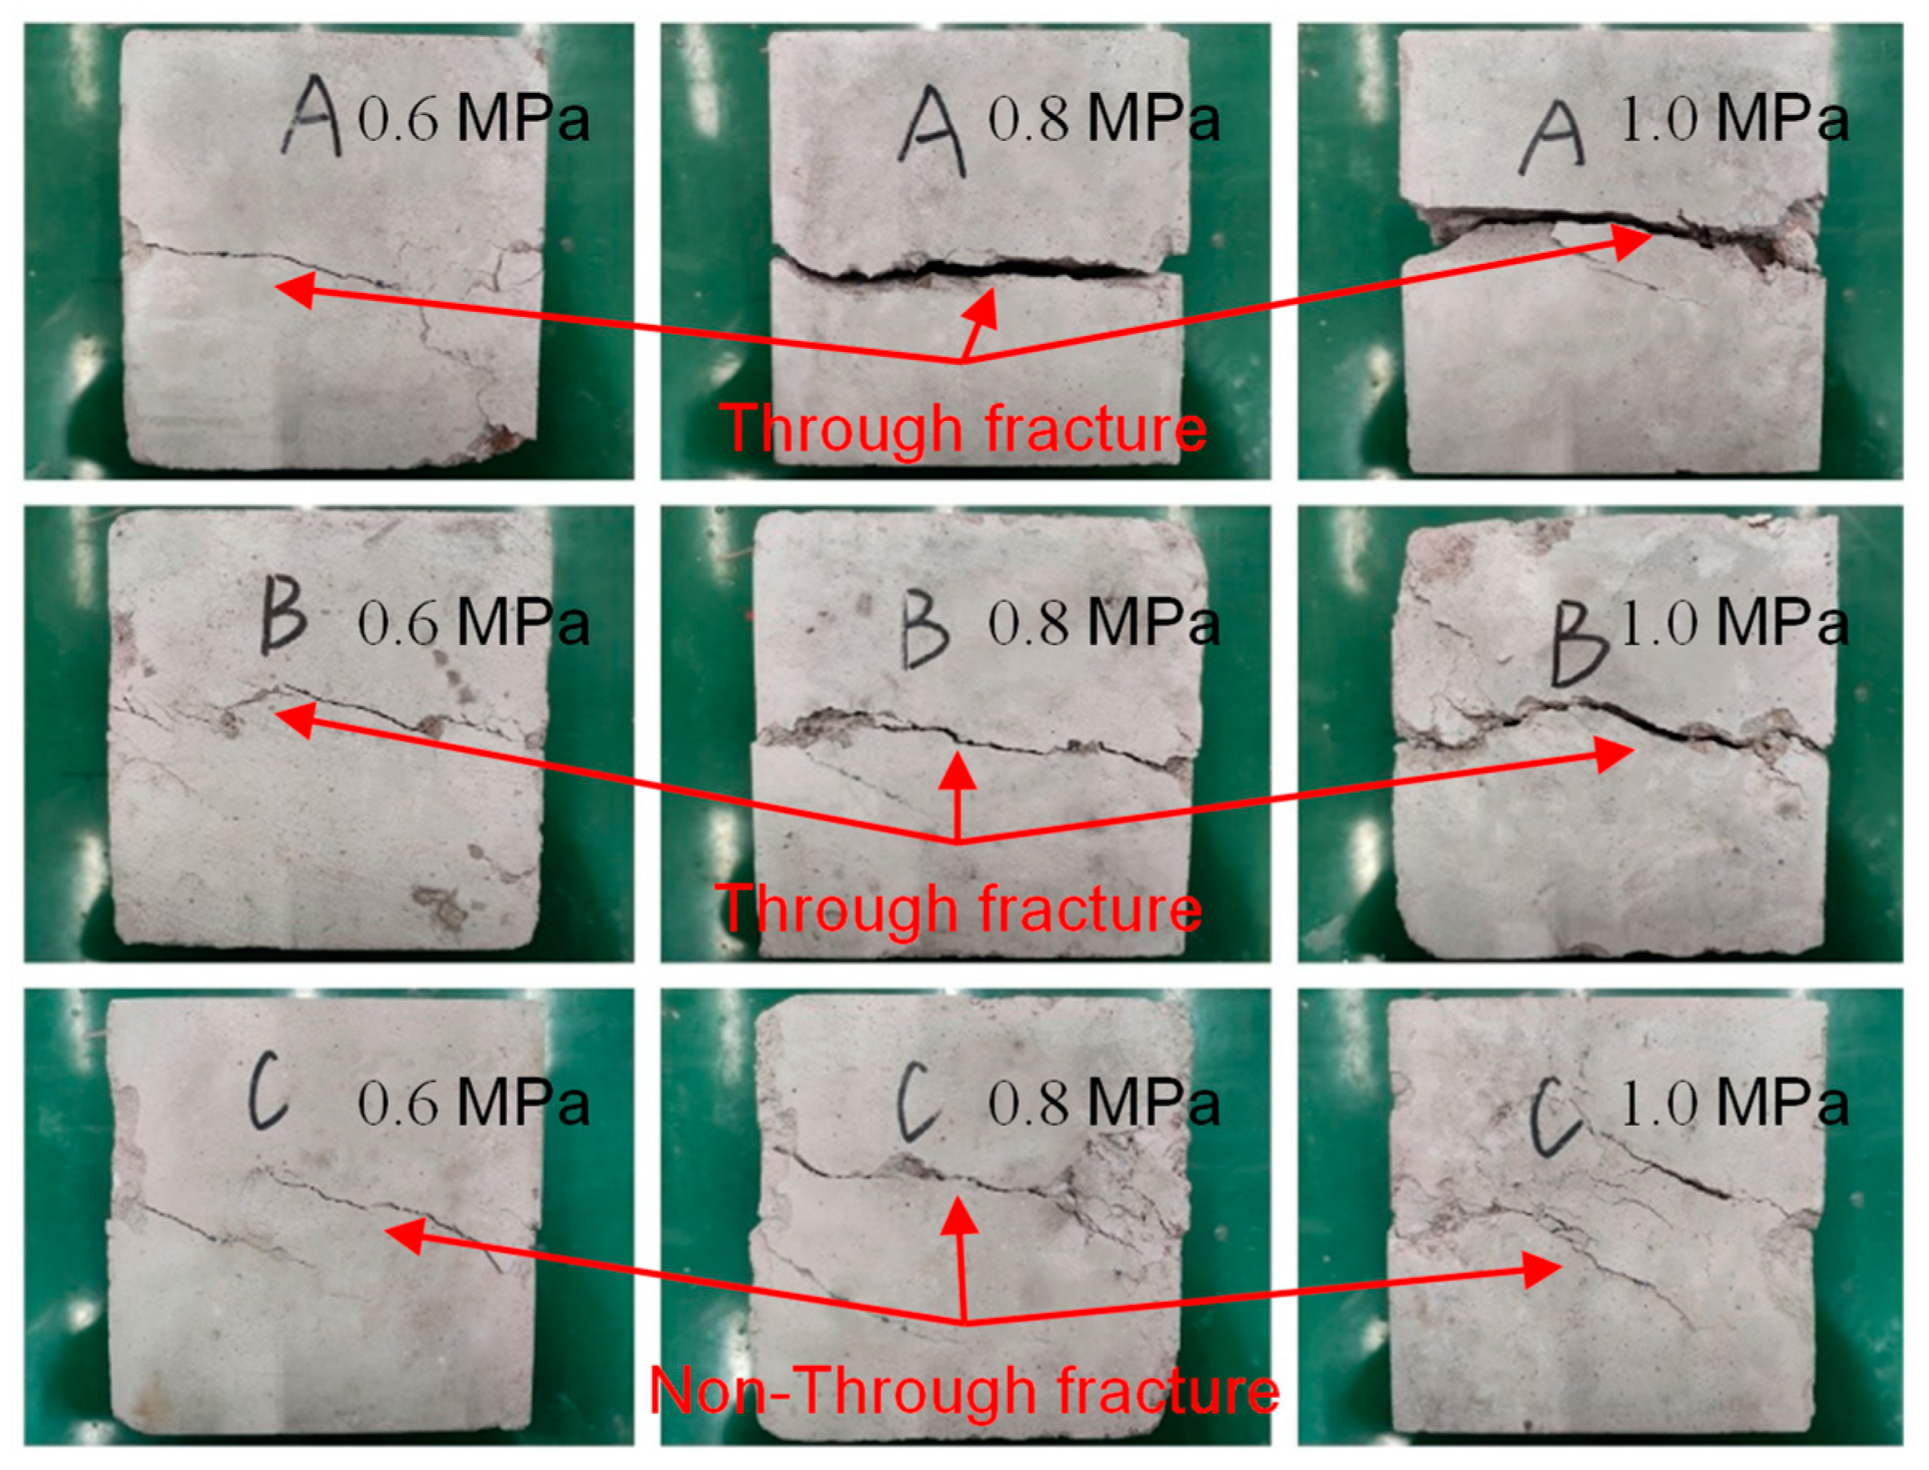
- The SRM–SC specimen cemented with ordinary Portland cement slurry (slurry A in Figure 14) and the SRM–SC specimen cemented with slurry (slurry B in Figure 14) produced a through fracture approximately parallel to the shear surface after reaching the peak shear strength; the fracture was dominated by the main fracture, with a lesser accompanying diagonal fracture. The SRM–SC specimen cemented with ordinary Portland cement–water–glass (slurry C in Figure 14) did not produce an apparent main fracture after reaching the peak shear strength, which indicated that its internal rock bite strength accounted for a more significant proportion than the slurry cement strength. In the soil–rock mixture, the internal rock bite strength of the rock refers to the resistance generated by the interlocking and meshing of rock particles. This bite action can enhance the overall strength and stability of the soil–rock mixture.
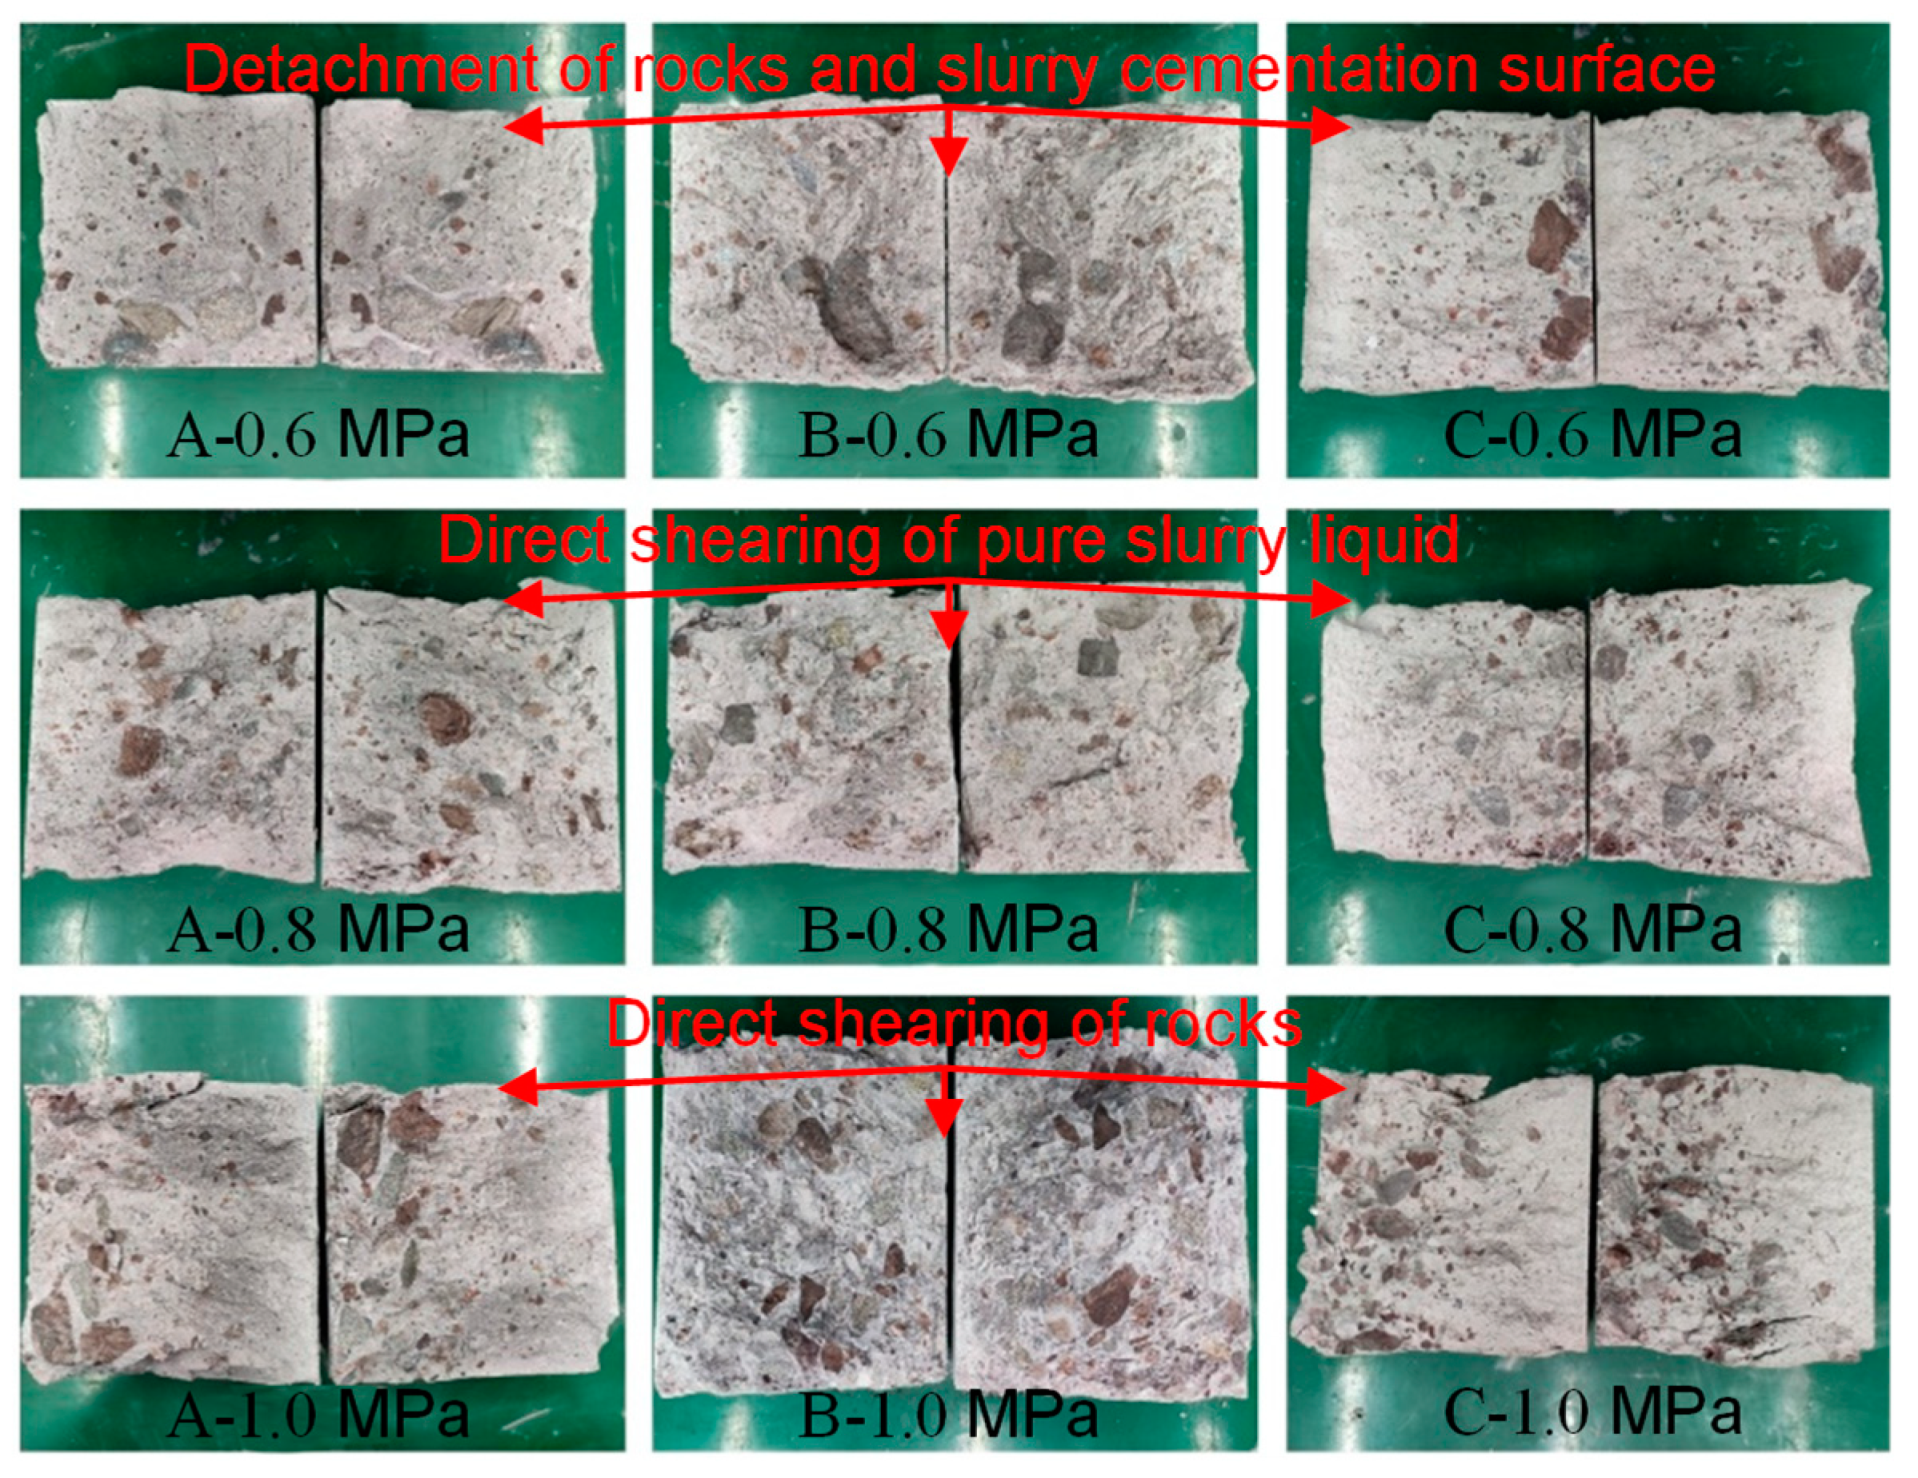
- Shear surface damage was divided into three categories: the direct shearing of rocks, the detachment of rocks and the slurry cementation surface, and the direct shearing of hardened cement paste. The hardened cement paste does not contain any soil or rock fragments. The damage mode was related to the level of axial pressure. When the axial pressure level was larger, it was mainly to shear rocks and pure slurry liquid, and when the level of axial pressure was smaller, it was mainly the detachment of rocks and slurry cementation surface.
- The main fracture shear surface with low flatness and a friction phenomenon was on the surface, which indicated that after the shear damage, the friction effect provides a certain residual strength.
5. Discussions
5.1. The Influence Regularity of Slurry Type on the Microstructure’s Property of SRM–SC
- The weak cementing ability of the ordinary Portland cement slurry was determined by the inherent nature of the hydration reaction of ordinary Portland cement slurry, resulting in a small amount of calcium silicate hydrate and an uneven distribution. In contrast, the calcium silicate hydrate gel was the substance that played a fundamental role in the process of reinforcing the soil–rock mixture of the ordinary Portland cement slurry.
- The hydration reaction of the low-alkalinity sulfoaluminate cement slurry was sufficient to produce a large amount of ettringite and calcium silicate hydrate to fill the void between the covering soil particles and rock particles and establish strong cementation between the soil–rock mixture particles and particles, as well as between the particle surfaces and the slurry, to give it a certain degree of structural strength. In the early stage of hydration, the ettringite reaction was generated quickly because ettringite has the role of counteracting contraction and generating mechanical prestress, so it first plays the role of gelling and then the generation of calcium silicate hydrate to form a cemented skeleton; after the completion of hydration, ettringite also has an expansion effect. As mentioned above, from the analysis of the cementing ability, only the cementing ability of the low-alkalinity sulfoaluminate cement slurry was powerful. Ettringite was the main component of the low-alkalinity sulfoaluminate cement slurry in the process of reinforcing the soil–rock mixture, which not only has a cementing effect but also, through its expansion characteristics, compacts further the bulk structure of the soil–rock mixture.
- The microstructures of the ordinary Portland cement–water–glass slurry cementation and the ordinary Portland cement slurry cementation are generally the same, and the difference lies in the amount of calcium silicate hydrate generated, which also leads to the difference in the effect of calcium silicate hydrate on the filling of the gap cementation between the particles of the soil–rock mixture.
5.2. The Influence Regularity of the Slurry Type on the Compressive Properties of SRM–SC
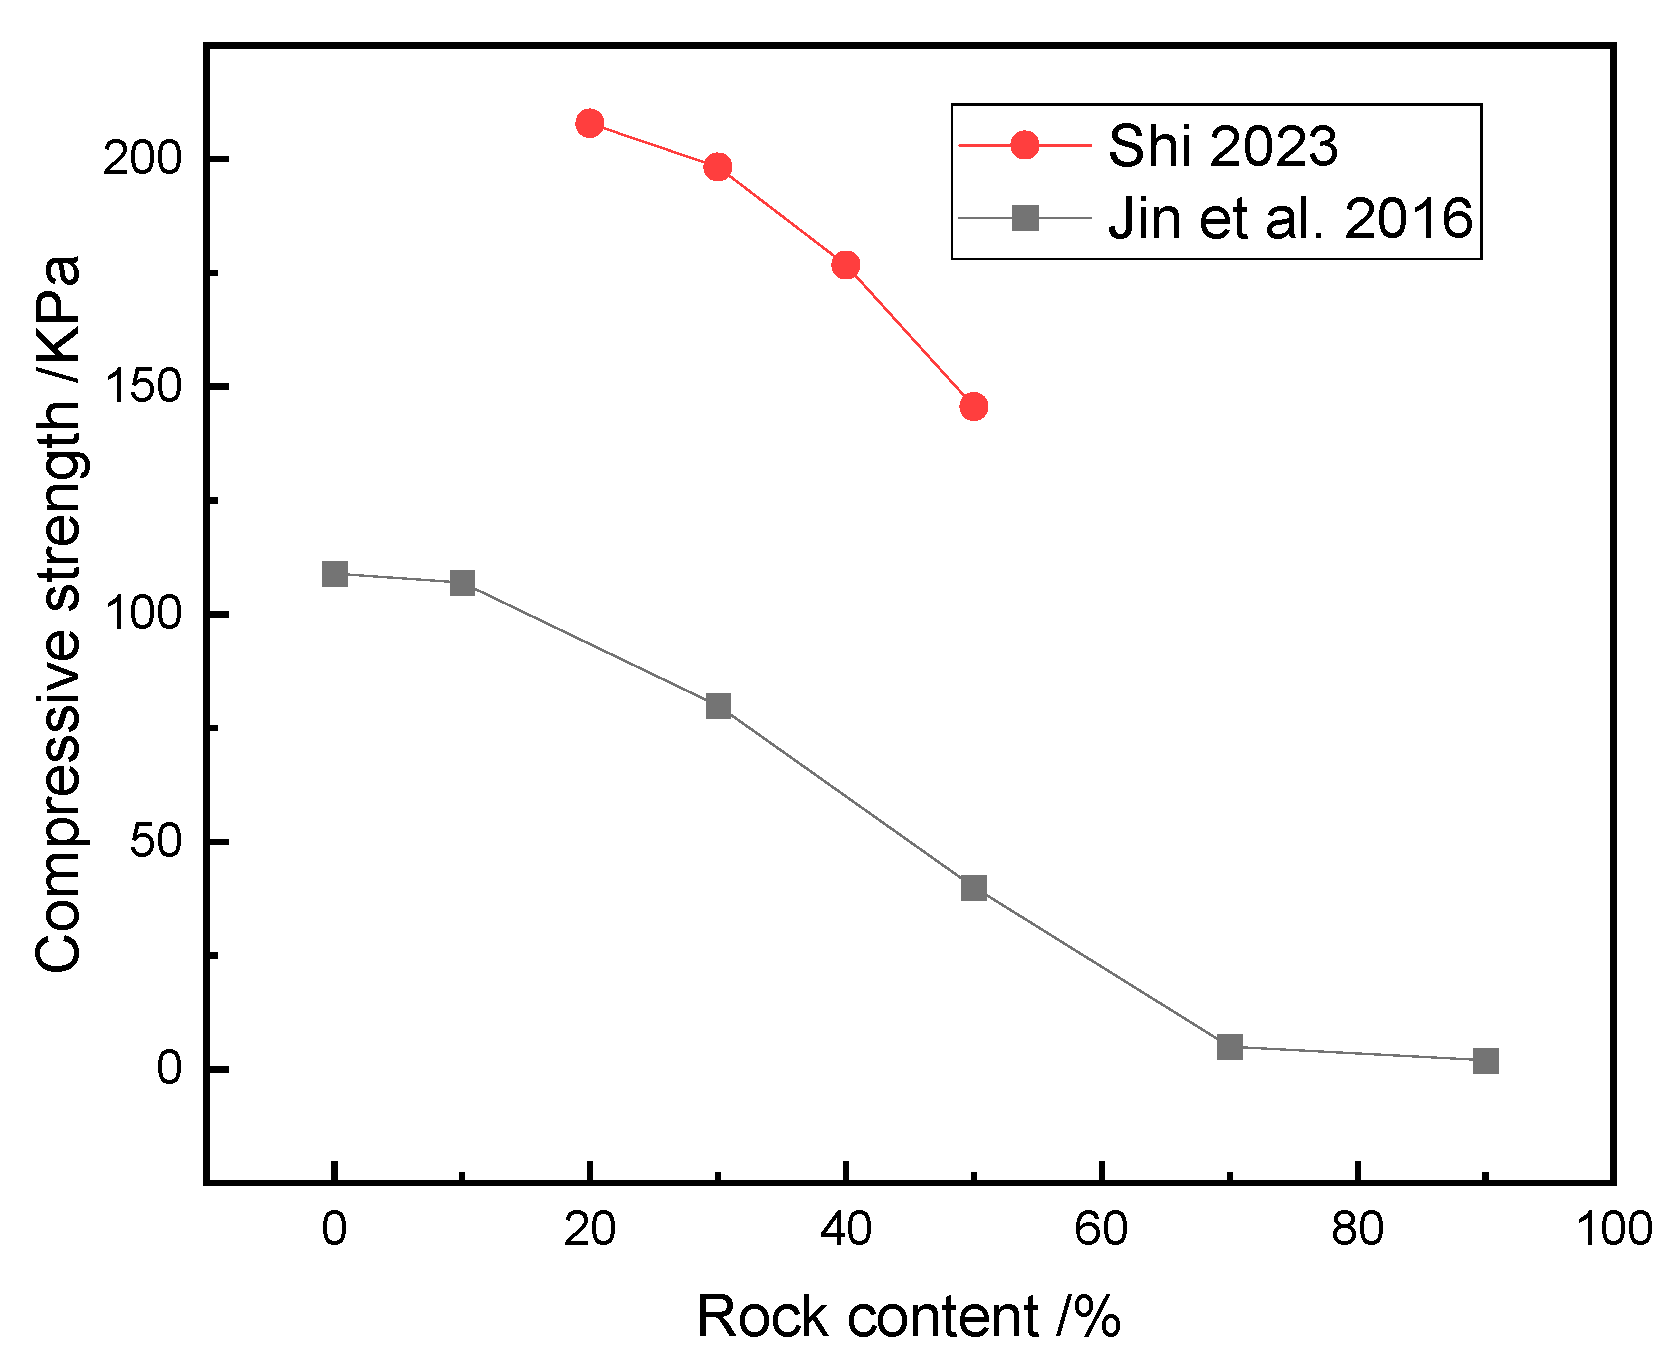
5.3. The Influence Regularity of the Rock Content on the Compressive Properties of SRM–SC
5.4. The Influence Regularity of the Slurry Type on the Shear Properties of SRM–SC
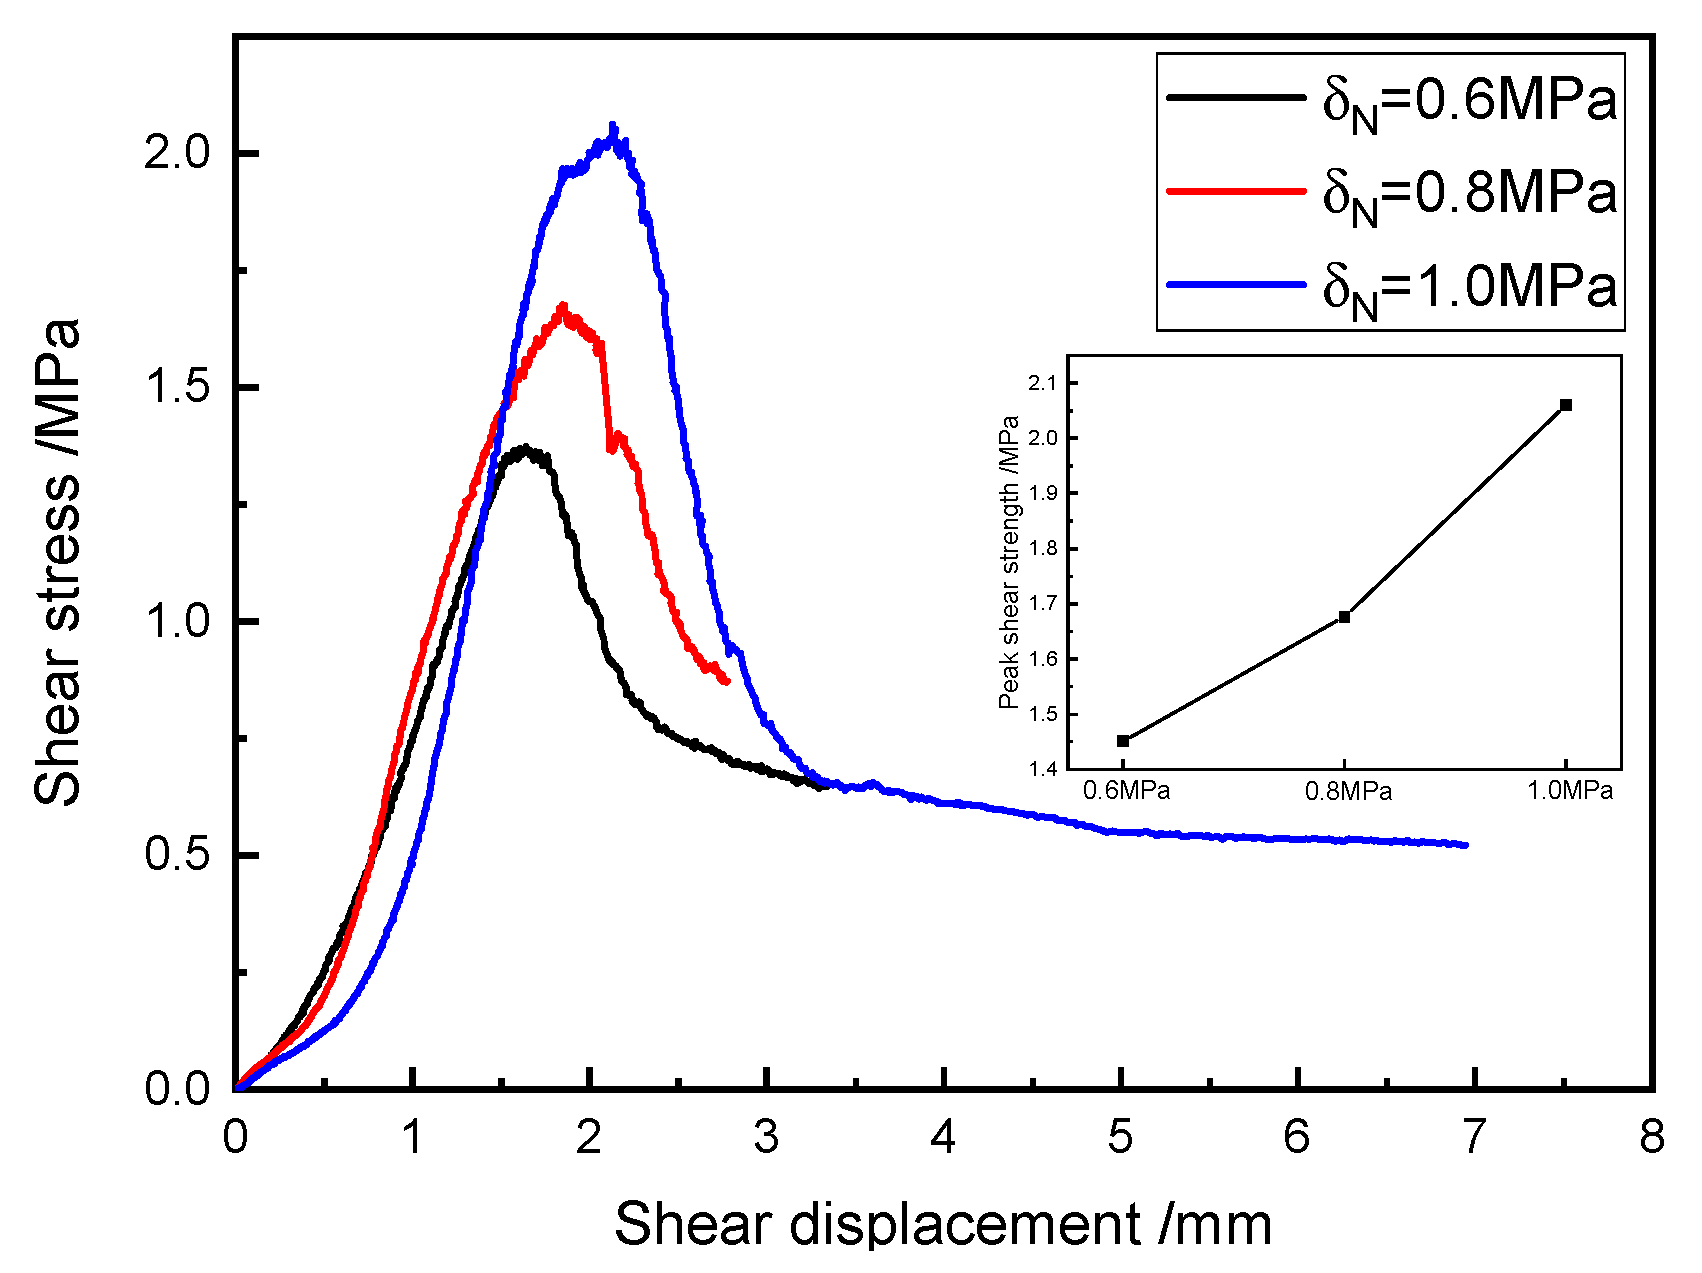
5.5. The Influence Regularity of the Axial Pressure on the Shear Properties of SRM–SC
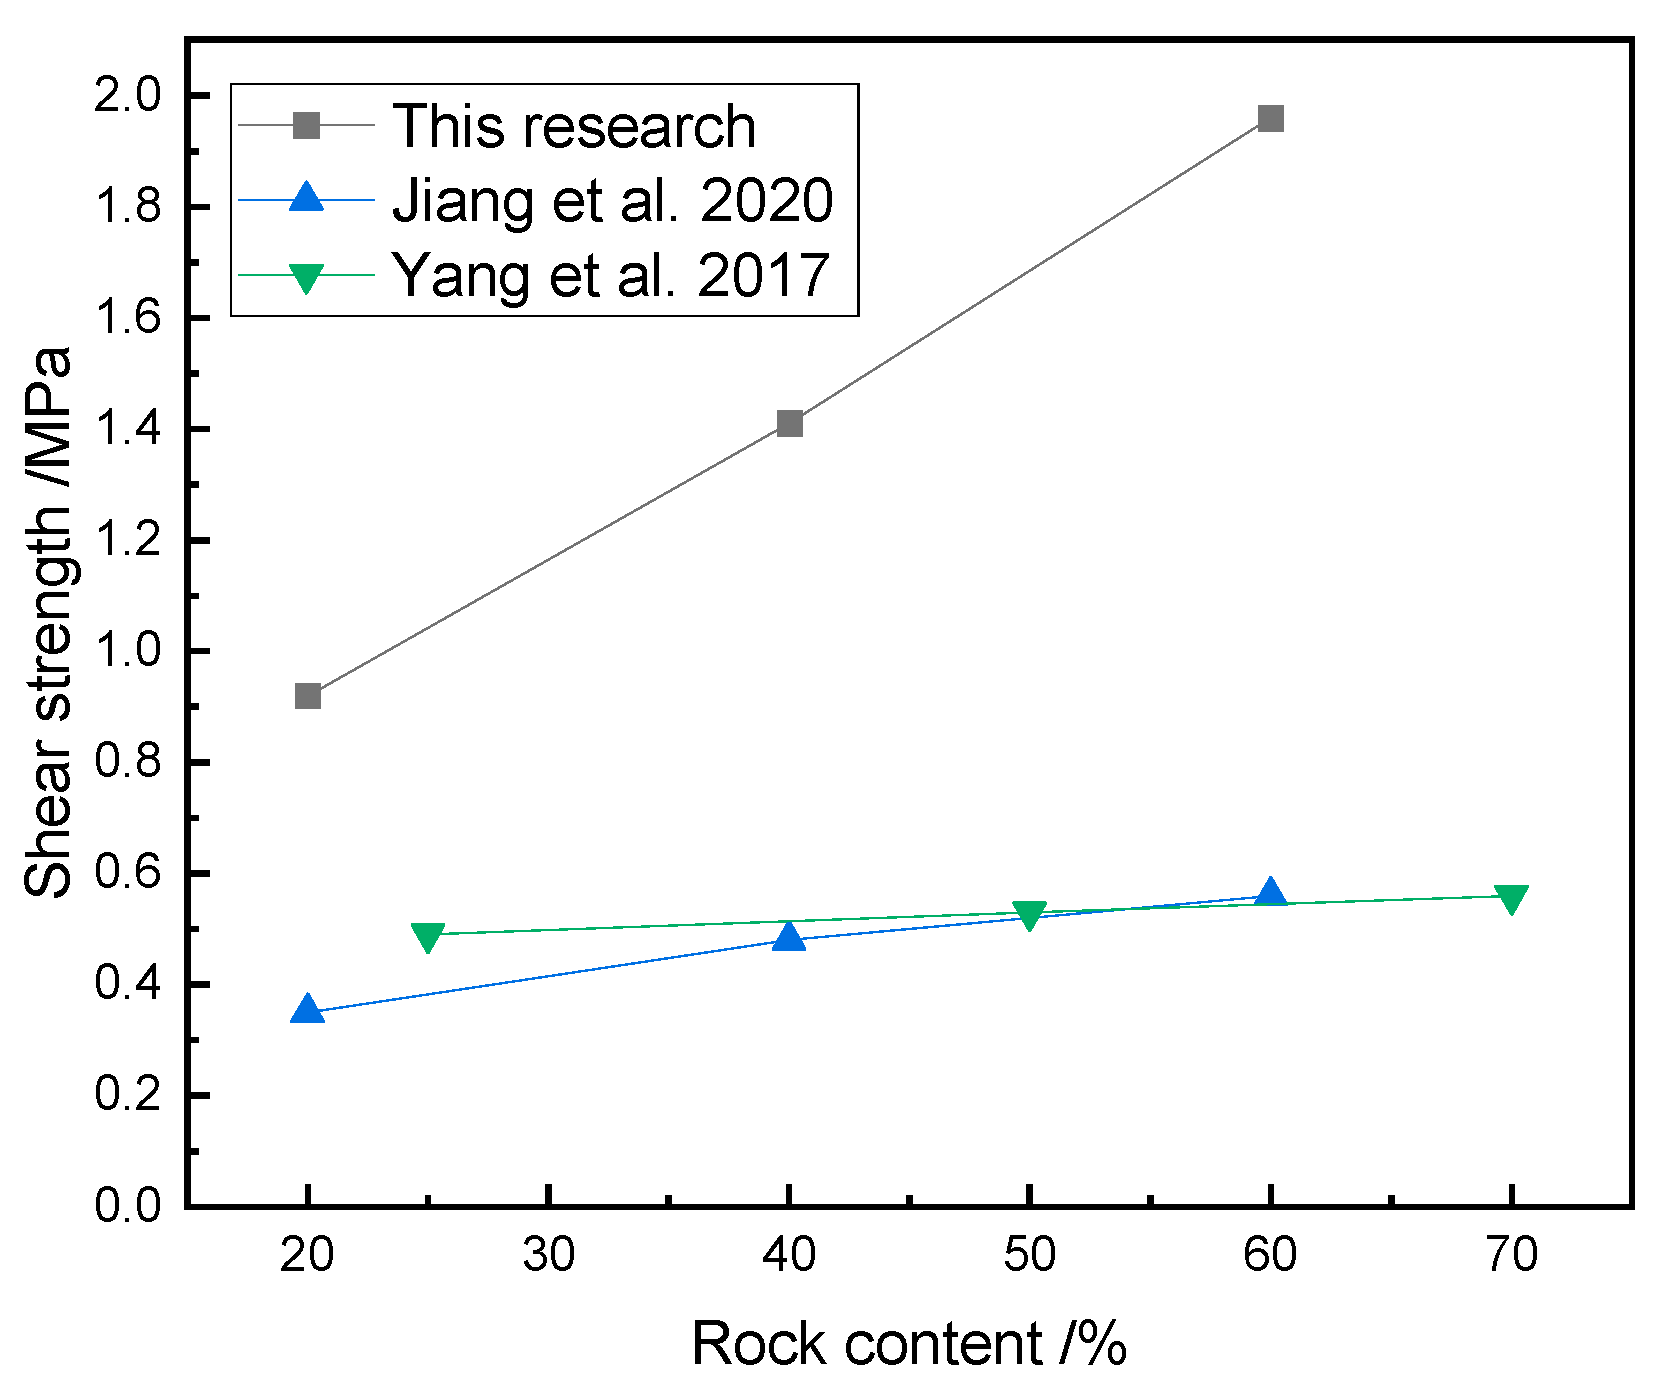
5.6. The Influence Regularity of the Rock Content on the Shear Properties of SRM–SC
- Macroscopically, the SRM–SC specimen cemented with the ordinary Portland cement–water–glass slurry had advantages in mechanical properties; microscopically, it presented fewer defects on the cementing surface, a more uniform and dense distribution of calcium silicate hydrate, and an apparent cementing effect. This was because adding a water–glass aqueous solution accelerated the ordinary Portland cement’s hydration reaction and generated more calcium silicate hydrate cementation products, high early strength, and late strength. The shortcomings were that the impurities in the water–glass aqueous solution caused the poor durability of the SRM–SC.
- Macroscopically, the SRM–SC specimen cemented with the low-alkalinity sulfoaluminate cement slurry had the characteristics of high strength in the early stage and insufficient strength in the late stage; microscopically, it showed that ettringite fills and covers the whole cement surface, and the structural compactness was obviously improved compared with the SRM–SC cemented with the other two types of slurry because of the fast rate of the reaction of the low-alkalinity sulfoaluminate cement to generate ettringite, and its quantity was high. The ettringite crystals interlaced with each other between the particles of the soil–rock mixture to form the backbone, rapidly forming the early strength. However, due to the expansion characteristics of ettringite, the internal stress exceeded the tensile strength of the cement and produced minor fractures in the late stage, which manifested as a loss of strength and a reduction in the elastic modulus at the macroscopic level.
- The SRM–SC specimen cemented with the ordinary Portland cement slurry had higher late strength than the SRM–SC specimen cemented with the low-alkalinity sulfoaluminate cement slurry in terms of macroscopic mechanical properties but had the worst microscopic cementation properties.
6. Conclusions
- (1)
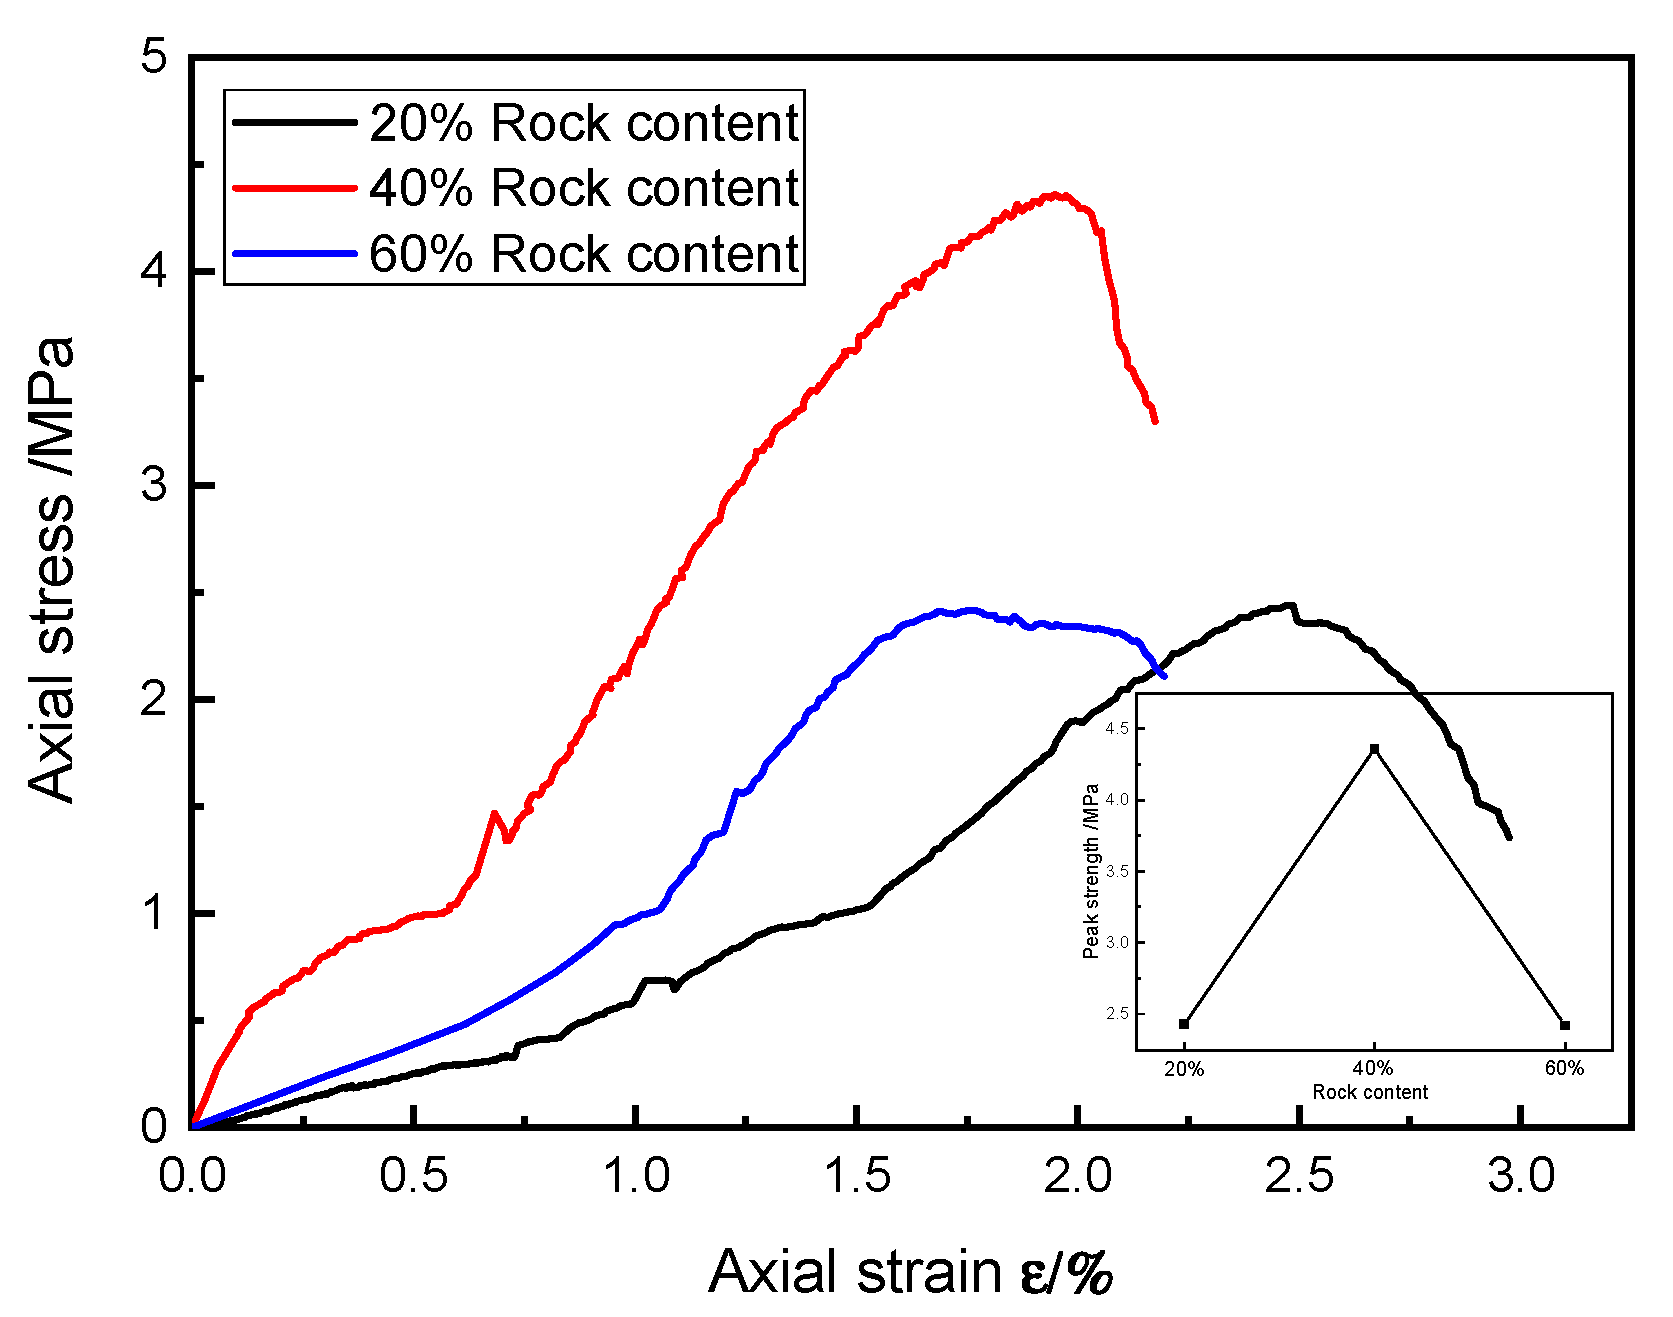
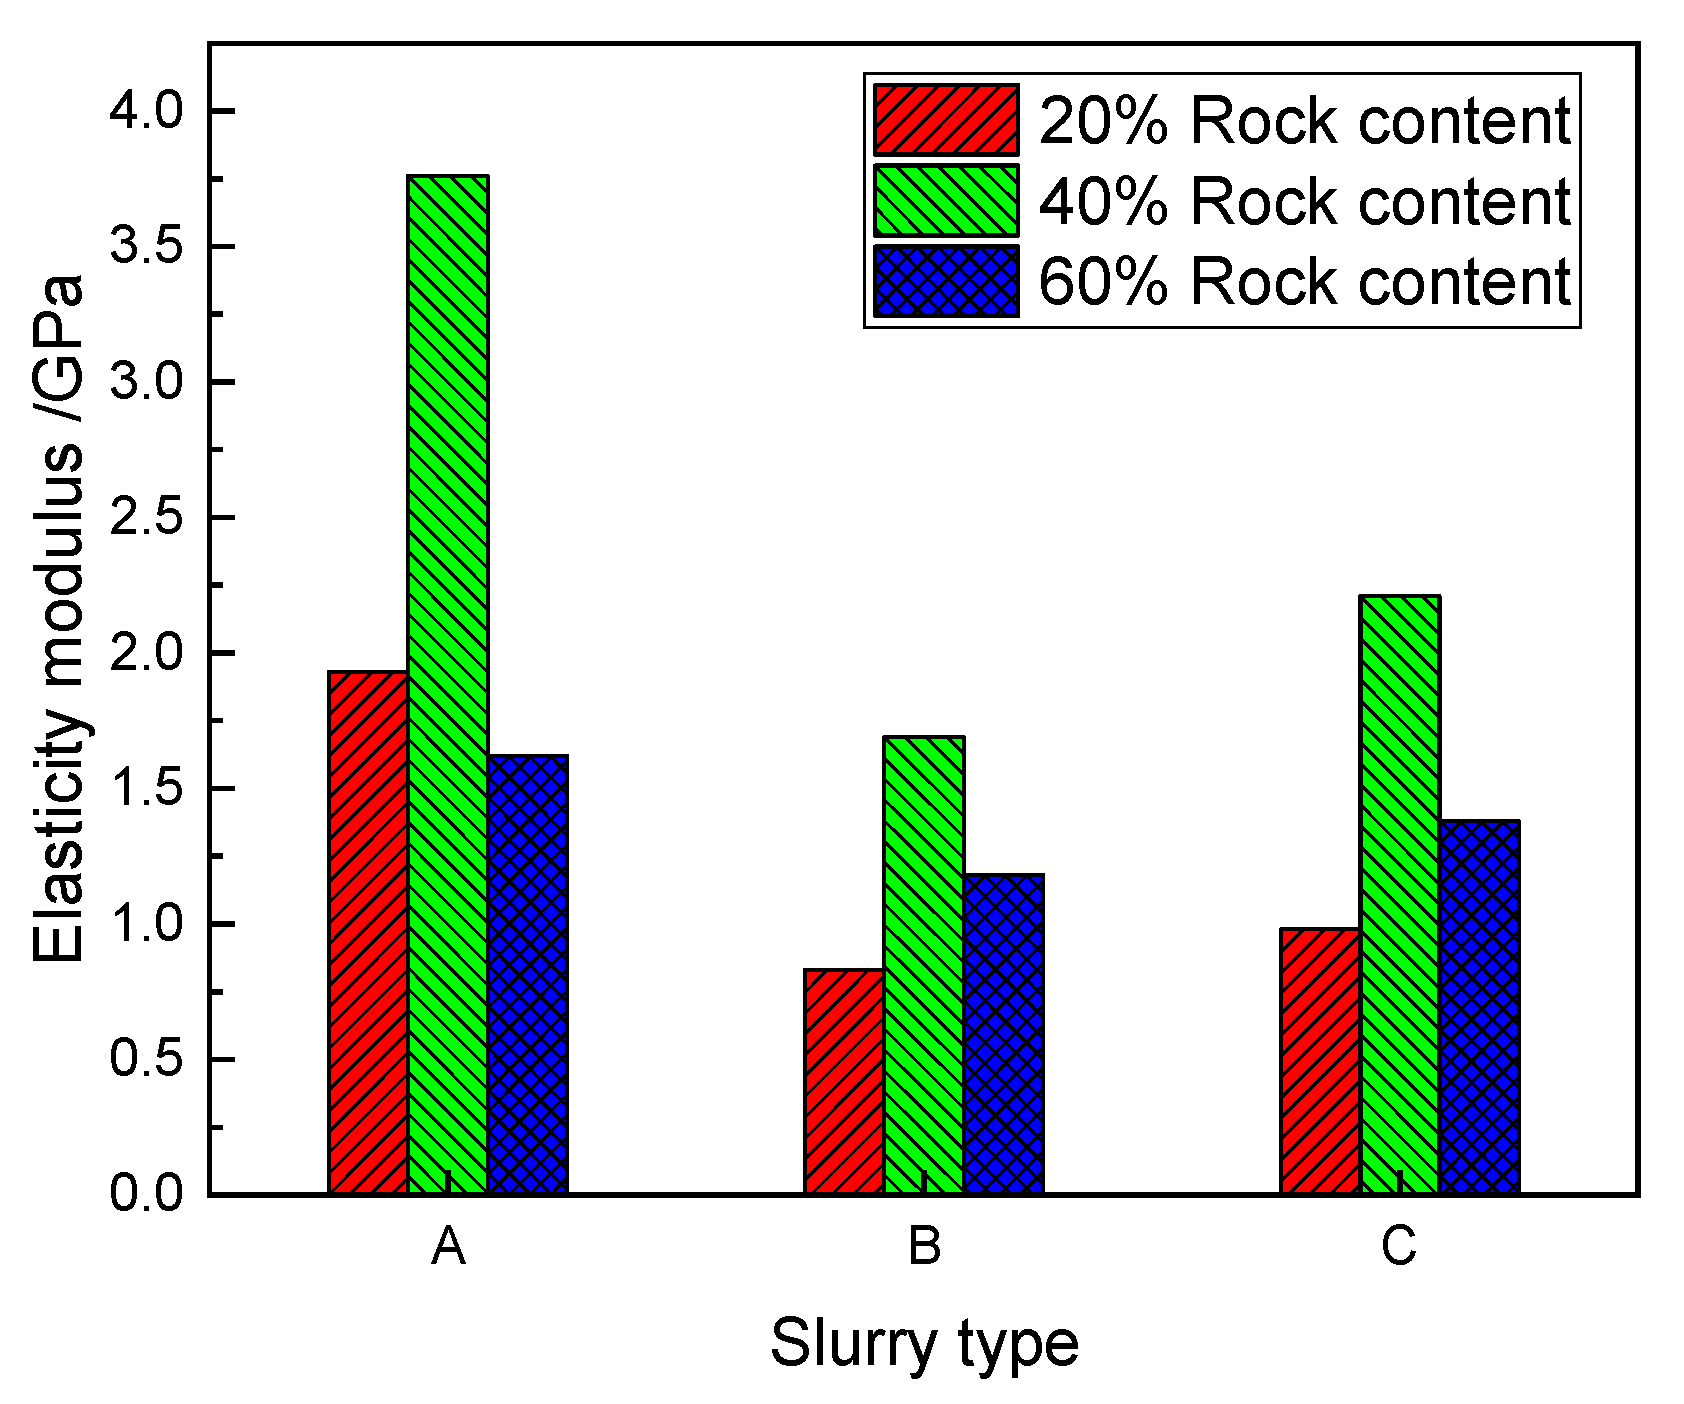
- The rock content significantly affects the macromechanical properties of an SRM–SC; the compressive strength and stiffness of the SRM–SC is stronger and then weaker with the increasing rock content. For instance, utilizing slurry A as a representative, the compressive strengths recorded at rock contents of 20%, 40%, and 60% were 1.88 MPa, 3.54 MPa, and 1.85 MPa, respectively. Correspondingly, the elastic moduli measured were 1.93 GPa, 3.76 GPa, and 1.62 GPa, respectively. Notably, an inflection point was observed within the range of the rock content being between 20% and 60%. The shear strength and stiffness both increased with the increasing rock content. Taking slurry A as a representative, the recorded shear strengths at rock contents of 20%, 40%, and 60% were 0.92 MPa, 1.41 MPa, and 1.96 MPa, respectively. Correspondingly, the shear moduli measured were 0.24 GPa, 0.38 GPa, and 0.58 GPa, respectively.
- (2)
- The macroscopic mechanical properties of SRM–SCs formed by different types of slurry reinforcement differed significantly. Among them, the SRM–SC specimen cemented with the ordinary Portland cement–water–glass slurry had the best compressive, shear, and deformation resistance performance, the SRM–SC specimen cemented with the ordinary Portland cement slurry was the second best, and the SRM–SC specimen cemented with the low-alkalinity sulfoaluminate cement slurry was poor. The addition of water–glass can obviously shorten the initial setting time of the slurry and quickly provide early strength, and the later strength can be significantly improved. It is recommended to use an ordinary Portland cement–water–glass slurry as the grouting reinforcement material in engineering applications.
- (3)
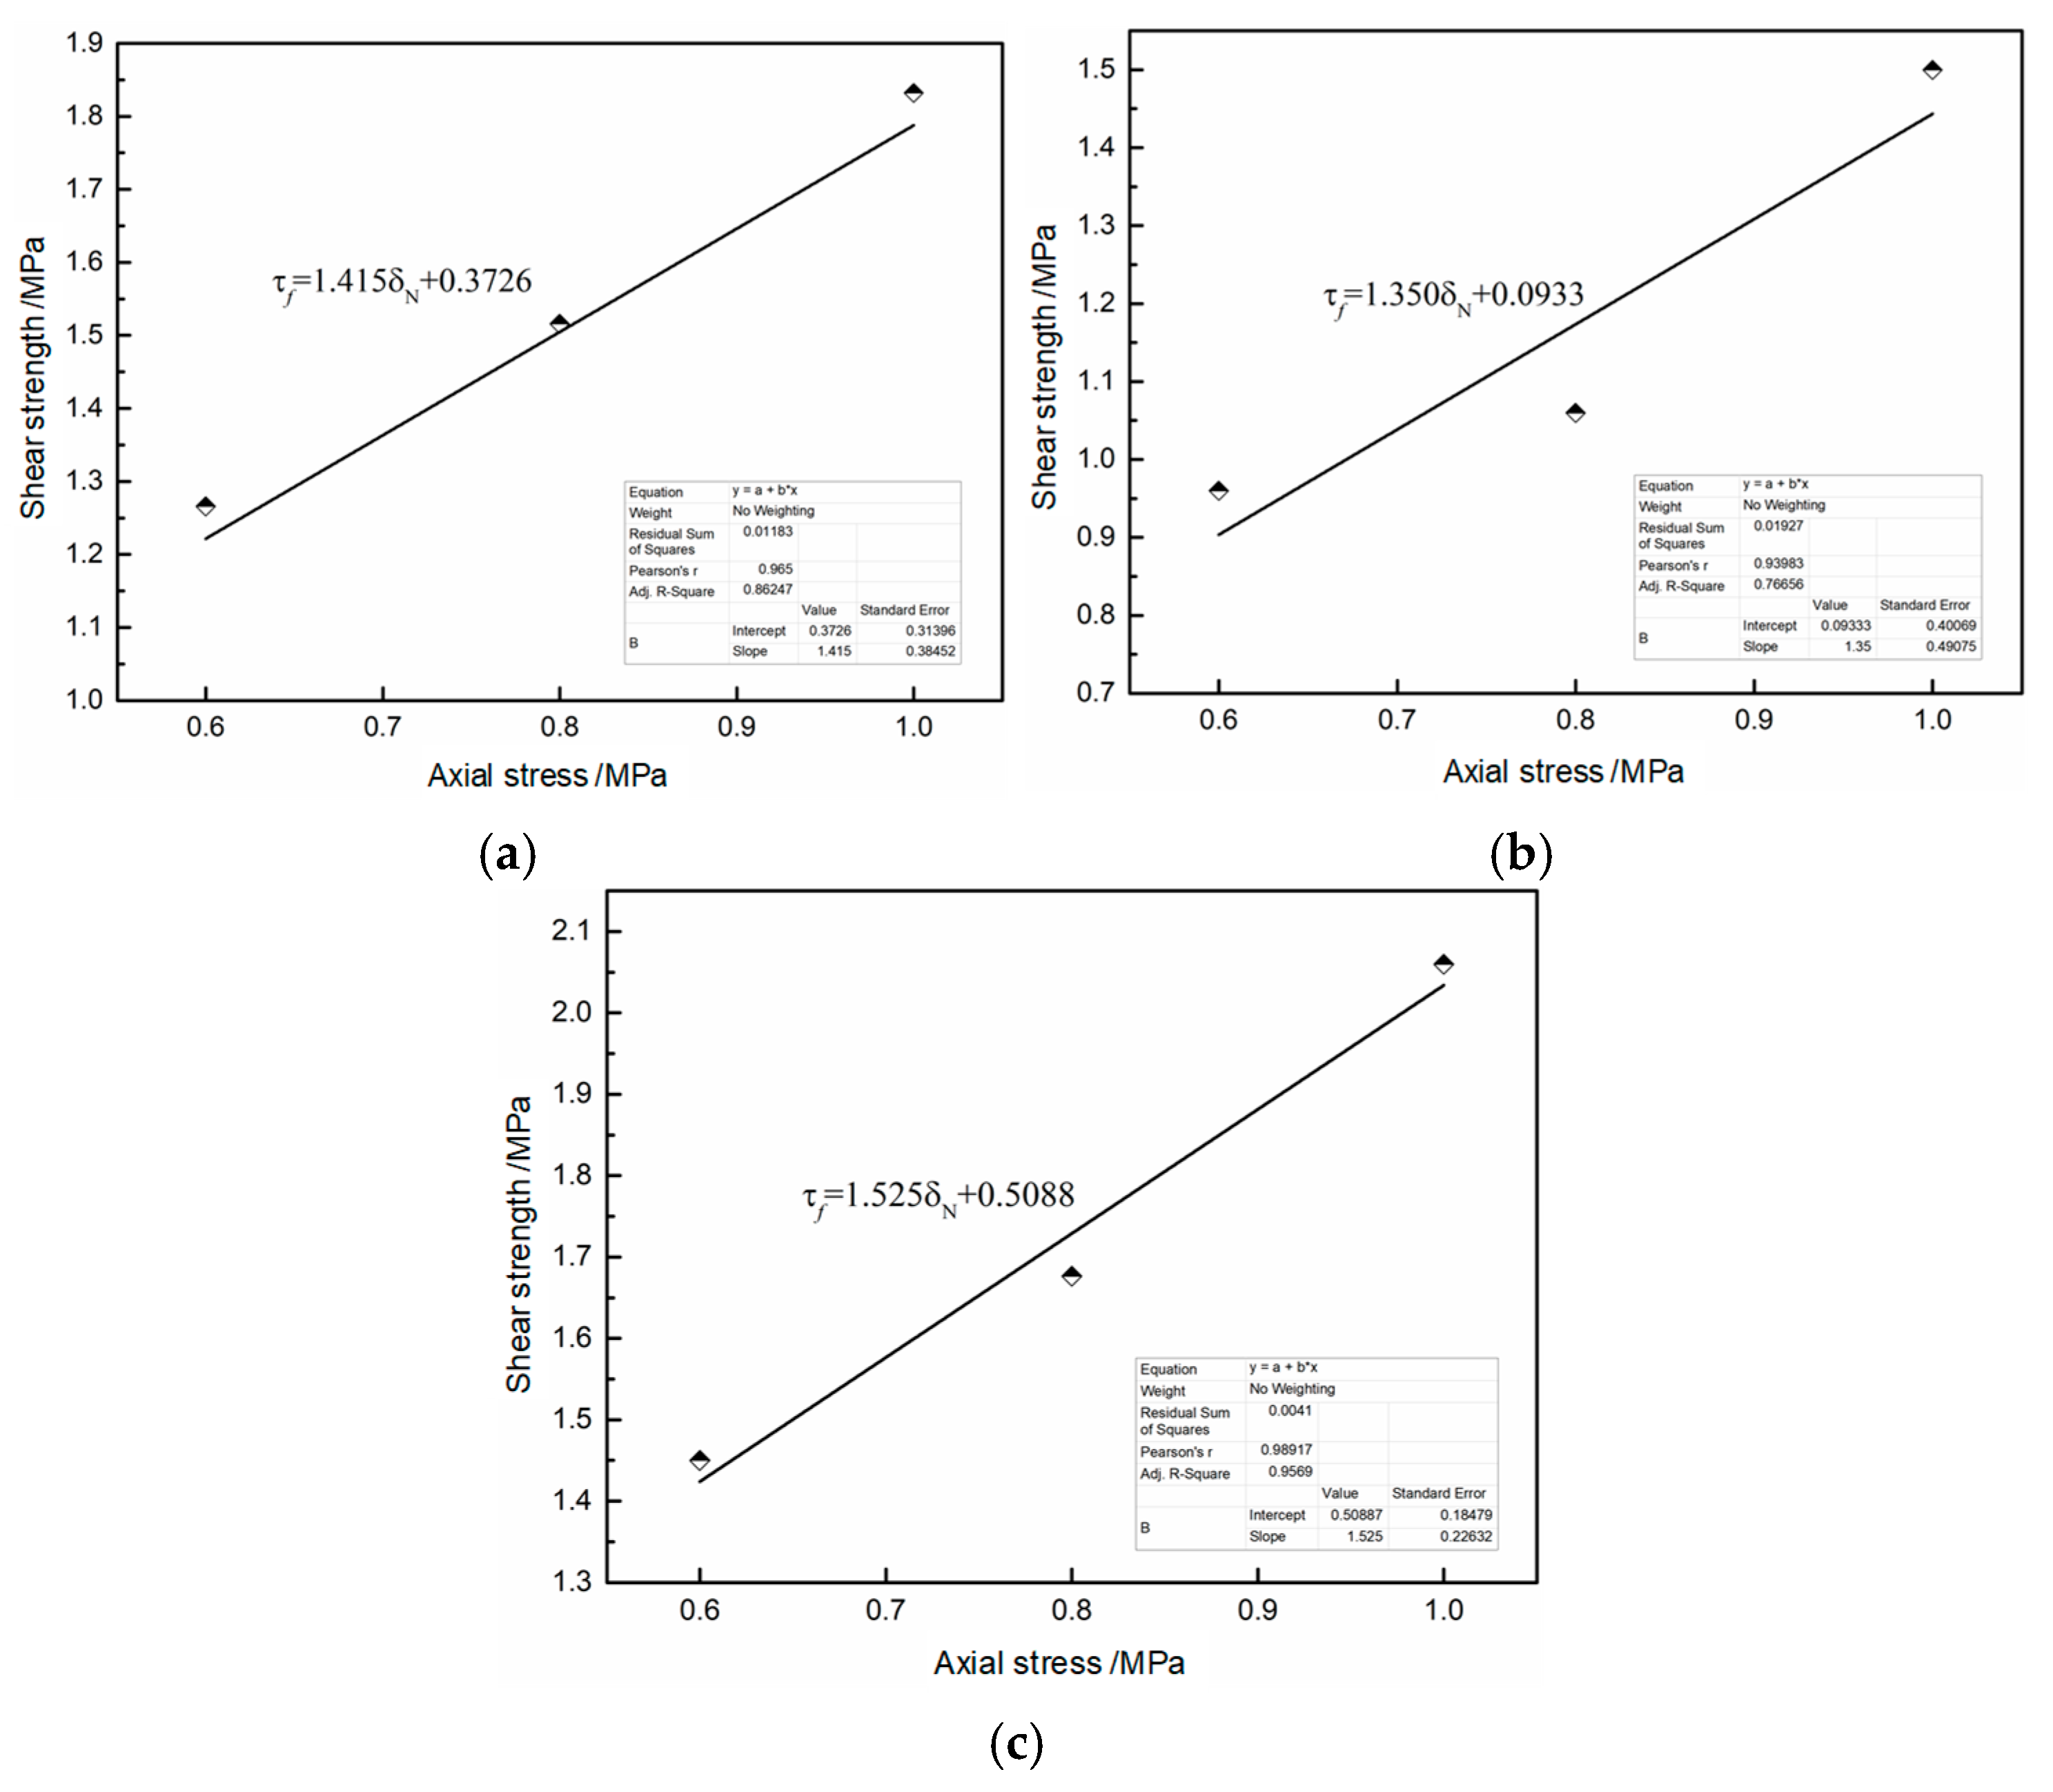
- The SRM–SC basically conforms to the Mohr–Coulomb criterion in the range of axial stress 0.6 MPa~1.0 MPa. The damage mode of the shear surface was divided into three categories: the direct shearing of rock, the detachment of the rock and slurry cementation surface, and the direct shearing of pure slurry liquid. The damage mode is related to the axial pressure level; when the axial pressure level is higher, it is dominated by the shearing of the rock and pure slurry liquid, and when the axial pressure level is less, it is dominated by the detachment of the rock and slurry cementation surface.
- (4)
- The microscopic cementation mechanism of SRM–SC is related to the hydration products produced by the hydration reaction of different types of slurries, and the formation quantity, formation speed, and characteristics of the hydration products directly determine the strengthening and cementation effect. The hydration products are represented by calcium silicate hydrate and ettringite.
Author Contributions
Funding
Institutional Review Board Statement
Informed Consent Statement
Data Availability Statement
Conflicts of Interest
References
- Wang, Y.; Que, J.M.; Wang, C.; Li, C.H. Three-dimensional observations of meso-structural changes in bimsoil using X-ray computed tomography (CT) under triaxial compression. Constr. Build. Mater. 2018, 190, 773–786. [Google Scholar] [CrossRef]
- Zhang, Z.L.; Xu, W.J.; Xia, W.; Zhang, H.Y. Large-scale in situ test for mechanical characterization of soil-rock mixture used in an embankment dam. Int. J. Rock Mech. Min. Sci. 2016, 86, 317–322. [Google Scholar] [CrossRef]
- Zhang, H.Y.; Xu, W.J.; Yu, Y.Z. Numerical analysis of soil-rock mixture’s meso-mechanics based on biaxial test. J. Cent South. Univ. 2016, 23, 685–700. [Google Scholar] [CrossRef]
- Chang, C.S.; Meidani, M.; Deng, Y. A compression model for sand-silt mixtures based on the concept of active and inactive voids. Acta. Geotech. 2017, 12, 1301–1317. [Google Scholar] [CrossRef]
- Li, Z.Q.; Hu, F.; Qi, S.W.; Hu, R.L. Strain-softening failure mode after the post-peak as a unique mechanism of ruptures in a frozen soil-rock mixture. Eng. Geol. 2020, 274, 105725. [Google Scholar] [CrossRef]
- Moufida, E.M.; Dhekra, S.; Hela, B.S.; Mahmoud, D. Geotechnical characterization of the quaternary alluvial deposits in Tunis City (Tunisia). J. Afr. Earth. Sci. 2015, 108, 89–100. [Google Scholar] [CrossRef]
- Chen, L.; Yang, Y.T.; Zheng, H. Numerical study of soil-rock mixture: Generation of random aggregate structure. Sci. Chin. Technol. Sci. 2018, 61, 359–369. [Google Scholar] [CrossRef]
- Xu, W.J.; Wang, S.; Zhang, H.Y.; Zhang, H.Y. Discrete element modelling of a soil-rock mixture used in an embankment dam. Int. J. Rock Mech. Min. Sci. 2016, 86, 141–156. [Google Scholar] [CrossRef]
- Zhong, Z.L.; Li, J.Y.; Bie, C.Y. Theoretical Approach to Predicting the Diffusion Radius of Fracture Grouting in Soil–Rock Mixtures. Appl. Sci. 2023, 13, 4730. [Google Scholar] [CrossRef]
- Avsar, E. An experimental investigation of shear strength behavior of a welded bimrock by meso-scale direct shear tests. Eng. Geol. 2021, 294, 106321. [Google Scholar] [CrossRef]
- Wang, Y.; Li, X.; Zheng, B.; Mao, T.Q.; Hu, R.L. Investigation of the effect of soil matrix on flow characteristics for soil and rock mixture. Geotech. Lett. 2016, 6, 226–233. [Google Scholar] [CrossRef]
- Dan, H.C.; He, L.H.; Xu, B. Experimental Investigation on Non-Darcian Flow in Unbound Graded Aggregate Material of Highway Pavement. Transport. Porous. Med. 2016, 112, 189–206. [Google Scholar] [CrossRef]
- Wang, Y.; Li, X.; Zheng, B.; Zhang, Y.X.; Li, G.F.; Wu, Y.F. Experimental study on the non-Darcy flow characteristics of soil–rock mixture. Environ. Earth. Sci. 2016, 75, 756. [Google Scholar] [CrossRef]
- Zhong, Z.L.; Zou, H.; Hu, X.X.; Liu, X.R. Experimental study on stiffness softening of soil–rock mixture backfill under metro train cyclic load. Adv. Mater. Sci. Eng. 2021, 2021, 3024490. [Google Scholar] [CrossRef]
- Huang, F.; Mi, J.L.; Yang, Y.H.; Dong, G.F.; Zhang, B.; Liu, X.C. Morphological characteristics of hysteretic curves of soil–rock mixture under stepped axial cyclic loading. Rock. Soil. Mech. 2024, 45, 674–684. (In Chinese) [Google Scholar] [CrossRef]
- Wang, P.S.; Hu, W.J.; Liu, P.Y.; Yan, Z.Q.; Kong, X.H.; Zhao, Q.M.; Yin, W.H. An Experimental Study on Dynamic Characteristics of Coarse-Grained Soil Under Step Cyclic Loading. Coatings 2022, 12, 640. [Google Scholar] [CrossRef]
- Tian, Y.C.; Liu, Q.S.; Ma, H.; Liu, Q.; Deng, P.H. New peak shear strength model for cement filled rock joints. Eng. Geol. 2018, 233, 269–280. [Google Scholar] [CrossRef]
- Zhang, Z.P.; Sheng, Q.; Fu, X.D.; Zhou, Y.Q.; Huang, J.H.; Du, Y.X. An approach to predicting the shear strength of soil–rock mixture based on rock block proportion. Bull. Eng. Geol. Environ. 2020, 79, 2423–2437. [Google Scholar] [CrossRef]
- Wang, Y.; Feng, W.K.; Li, C.H.; Hou, Z.Q. An investigation into the effects of block size on the mechanical behaviors of bimsoils using variable-angle shear experiments. Environ. Earth. Sci. 2020, 79, 69. [Google Scholar] [CrossRef]
- Qian, J.F.; Yao, Y.S.; Li, J.; Xiao, H.B.; Lou, S.P. Resilient Properties of Soil–Rock Mixture Materials: Preliminary Investigation of the Effect of Composition and Structure. Materials 2020, 13, 1658. [Google Scholar] [CrossRef]
- Jin, L.; Zeng, Y.W.; Xia, L.; Ye, Y. Experimental and Numerical Investigation of Mechanical Behaviors of Cemented Soil–Rock Mixture. Geotech. Geol. Eng. 2017, 35, 337–354. [Google Scholar] [CrossRef]
- Ding, X.H.; Shi, X.Y.; Zhou, W.; Luan, B.Y. Experimental Study on the Permeability of a Soil–Rock Mixture Based on the Threshold Control Method. Adv. Civ. Eng. 2019, 2019, 8987052. [Google Scholar] [CrossRef]
- Park, K.; Kim, D. Analysis of Homogel Uniaxial Compression Strength on Bio Grouting Material. Materials 2016, 9, 244. [Google Scholar] [CrossRef]
- Shi, Z.; Wang, Q.; Xu, L. Experimental Study of Cement Alkali-Resistant Glass Fiber (C-ARGF) Grouting Material. Materials 2020, 13, 605. [Google Scholar] [CrossRef]
- Wu, Y.H.; Li, Q.Q.; Li, G.X.; Tang, S.Y.; Niu, M.D.; Wu, Y.F. Effect of Naphthalene-Based Superplasticizer and Polycarboxylic Acid Superplasticizer on the Properties of Sulfoaluminate Cement. Materials 2021, 14, 662. [Google Scholar] [CrossRef] [PubMed]
- Ma, H.; Liu, Q. Prediction of the Peak Shear Strength of Sandstone and Mudstone Joints Infilled with High Water-Cement Ratio Grouts. Rock Mech. Rock Eng. 2017, 50, 2021–2037. [Google Scholar] [CrossRef]
- Tian, H.M.; Chen, W.Z.; Yang, D.S.; Yang, J.P. Experimental and Numerical Analysis of the Shear Behavior of Cemented Concrete-Rock Joints. Rock Mech. Rock Eng. 2015, 48, 213–222. [Google Scholar] [CrossRef]
- Zhang, H.; Hu, X.; Boldini, D.; He, C.C.; Liu, C.; Ai, C.J. Evaluation of the shear strength parameters of a compacted S-RM fill using improved 2-D and 3-D limit equilibrium methods. Eng. Geol. 2020, 269, 105550. [Google Scholar] [CrossRef]
- Mahdevari, S.; Moarefvand, P.; Mohammadzamani, D. Considering the Effect of Block-to-Matrix Strength Ratio on Geomechanical Parameters of Bimrocks. Geotech. Geol. Eng. 2020, 38, 4501–4520. [Google Scholar] [CrossRef]
- Koohestani, B.; Belem, T.; Koubaa, A.; Bussiere, B. Experimental investigation into the compressive strength development of cemented paste backfill containing Nanosilica. Cement. Concrete. Comp. 2016, 72, 180–189. [Google Scholar] [CrossRef]
- Shaikh, F.U.A.; Shafaei, Y.; Sarker, P.K. Effect of nano and micro-silica on bond behavior of steel and polypropylene fibers in high volume fly ash mortar. Constr. Build. Mater. 2016, 115, 690–698. [Google Scholar] [CrossRef]
- GB/T 50123-2019; Test Preparation of Coarse Granular Soil. Standard for Geotechnical Tesing Method. China Planning Press: Beijing, China, 2019. (In Chinese)
- Zhong, Z.L.; Tu, Y.L.; He, X.Y.; Feng, J.H.; Wang, Z.L. Research Progress on Physical Index and Strength Characteristics of Bimsoils. Chin. J. Undergr. Sp. Eng. 2016, 12, 1135–1144. (In Chinese) [Google Scholar]
- Xu, H.; Zhou, T.Y.; Wang, X.Y.; Zhang, J.; Zhang, X.B.; Liu, Y.C. Compression test and numerical simulation research on improved red beds subgrade fillers in Sichuan-Tibet Railway. Rock. Soil. Mech. 2021, 42, 2259–2268. (In Chinese) [Google Scholar]
- Shi, S.Z. Experimental Study on the Mechanical and Acoustic Characteristics of Soil Rock Mixture. Master’s Thesis, China University of Geosciences (Beijing), Beijing, China, 2023. (In Chinese). [Google Scholar]
- Jin, L.; Zeng, Y.W.; Ye, Y. Three–Dimensional Particle Flow Simulation of Uniaxial Compression Tests on Soil–rock Mixture. J. Changjiang River. Sci. Res. Inst. 2016, 33, 93–99. (In Chinese) [Google Scholar]
- Jiang, Q.Q.; Xu, Y.Q.; Wang, H. Research on shear deformation characteristics of soil–rock mixtures under different stone contents. J. Eng. Geol. 2020, 28, 951–958. (In Chinese) [Google Scholar]
- Yang, Z.P.; Lei, X.D.; Wang, L.; Hu, Y.X.; Liu, Y.Q. Impact of stone content to shear properties of soil–rock mixture using particle flow code simulation. J. Eng. Geol. 2017, 25, 1035–1045. (In Chinese) [Google Scholar]
- Jia, C.J.; Liang, G.D.; Huang, J.; Lei, M.F.; Zhao, C.Y.; Zhang, Q.; Zhang, J. Study on mechanical characteristics of soil rock mixture based on reconstruction of digital image meso–model. J. Railway. Sci. Eng. 2022, 19, 3351–3360. (In Chinese) [Google Scholar]


| Specific Surface Area ) | Setting Time (min) | Flexural Strength (MPa) | Compressive Strength (MPa) | Content of Supplementary Cementitious Material/Filler (%) | Gypsum (%) | ||||
|---|---|---|---|---|---|---|---|---|---|
| Initial Setting Time | Final Setting Time | 3 d | 28 d | 3 d | 28 d | slag | Calcium Carbonate | ||
| 342 | 163 | 223 | 6.1 | 8.6 | 32.2 | 50.8 | 2.29 | 7.42 | 5 |
| Specific Surface Area ) | Setting Time (min) | Flexural Strength 1 d (MPa) | Compressive Strength 1 d (MPa) | pH | Calcium Carbonate (%) | 28 d Free Swelling Ratio (%) | |
|---|---|---|---|---|---|---|---|
| Initial Setting Time | Final Setting Time | ||||||
| 473 | 10 | 15 | 6.2 | 37.5 | 9.6 | 19 | 0.07 |
| Density 20 °C ) | (%) | (%) | Modulus (M) | Baume Degree ) |
|---|---|---|---|---|
| 1.378 | 8.49 | 26.85 | 3.26 | ° |
| Silty Clay | Argillaceous Sandstone | ||||||
|---|---|---|---|---|---|---|---|
| Natural Moisture Content (%) | Soil Natural Density ) | Specific Gravity | Natural Void Ratio | Natural Density ) | Saturated Density ) | Compressive Strength (MPa) | Elastic Modulus (GPa) |
| 21.6 | 2.02 | 2.71 | 0.63 | 2.49 | 2.52 | 27.35 | 3.43 |
| Sample Number | Rock Content (%) | Slurry Type | Axial Pressure (MPa) | Soil:Rock:Slurry Ratio |
|---|---|---|---|---|
| 1 | 40 | A | 0.6 | 3:2:2 |
| 2 | B | |||
| 3 | C | |||
| 4 | 40 | A | 0.8 | 3:2:2 |
| 5 | B | |||
| 6 | C | |||
| 7 | 40 | A | 1.0 | 3:2:2 |
| 8 | B | |||
| 9 | C | |||
| 10 | 20 | A | 0.8 | 4:1:2 |
| 11 | 60 | 2:3:2 |
| Sample Number | Rock Content (%) | Slurry Type | Soil:Rock:Slurry Ratio |
|---|---|---|---|
| a | 20 | A | 4:1:2 |
| b | B | ||
| c | C | ||
| d | 40 | A | 3:2:2 |
| e | B | ||
| f | C | ||
| g | 60 | A | 2:3:2 |
| h | B | ||
| i | C |
| Slurry Type | Rock Content (20%) | Rock Content (40%) | Rock Content (60%) | |||
|---|---|---|---|---|---|---|
| Compressive Strength (MPa) | Strain (%) | Compressive Strength (MPa) | Strain (%) | Compressive Strength (MPa) | Strain (%) | |
| A | 1.88 | 0.972 | 3.54 | 0.941 | 1.85 | 1.137 |
| B | 1.77 | 2.124 | 2.23 | 1.317 | 1.53 | 1.289 |
| C | 2.43 | 2.476 | 4.36 | 1.974 | 2.42 | 1.751 |
| Rock Content (%) | Arial Compressive Force (MPa) | Slurry Type | Shear Strength (MPa) | Peak Shear Displacement (mm) |
|---|---|---|---|---|
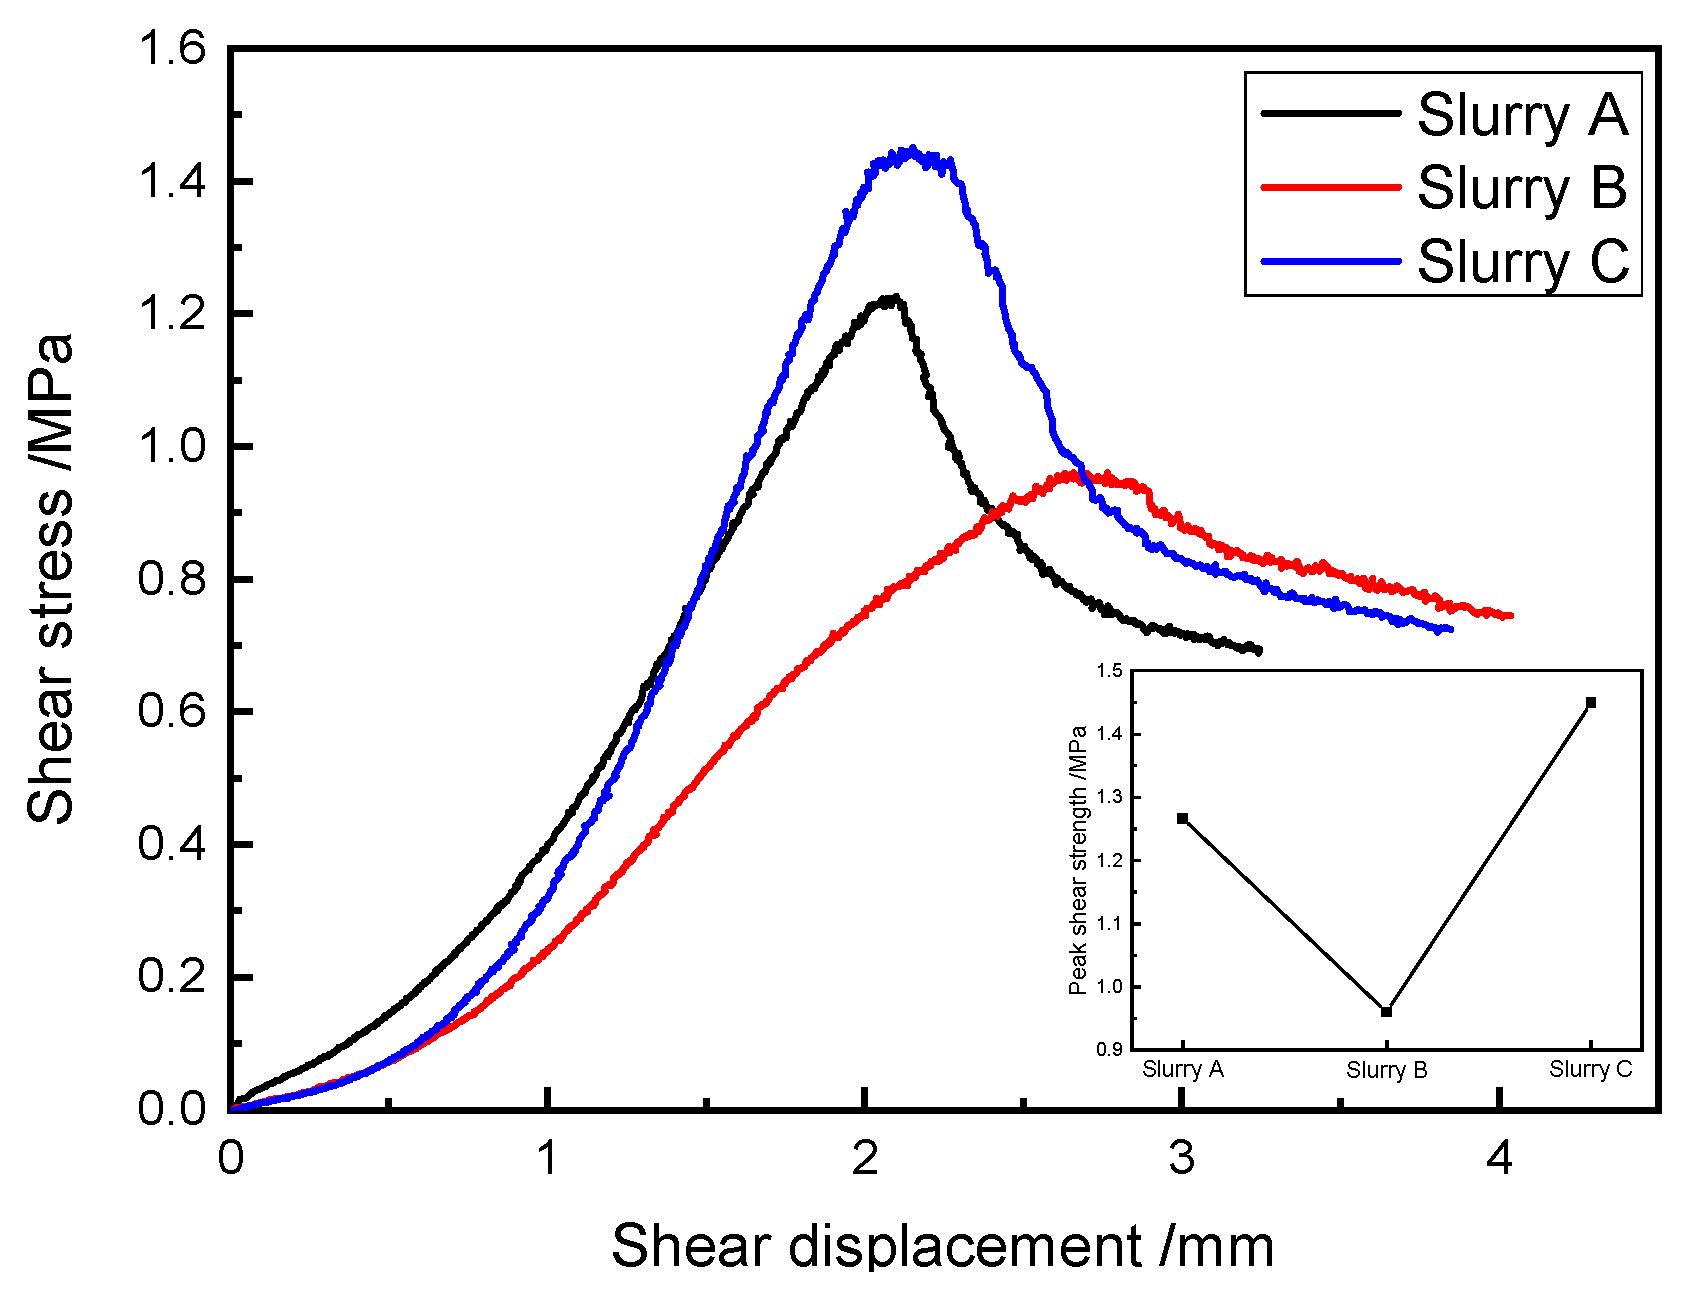
| 40 | 0.6 | A | 1.27 | 2.08 |
| B | 0.96 | 2.76 | ||
| C | 1.45 | 1.64 | ||
| 0.8 | A | 1.41 | 3.75 | |
| B | 1.06 | 3.39 | ||
| C | 1.68 | 1.86 | ||
| 1.0 | A | 1.83 | 2.77 | |
| B | 1.50 | 2.70 | ||
| C | 2.06 | 2.13 | ||
| 20 | 0.8 | A | 0.92 | 3.86 |
| 60 | 0.8 | A | 1.96 | 3.36 |
Disclaimer/Publisher’s Note: The statements, opinions and data contained in all publications are solely those of the individual author(s) and contributor(s) and not of MDPI and/or the editor(s). MDPI and/or the editor(s) disclaim responsibility for any injury to people or property resulting from any ideas, methods, instructions or products referred to in the content. |
© 2025 by the authors. Licensee MDPI, Basel, Switzerland. This article is an open access article distributed under the terms and conditions of the Creative Commons Attribution (CC BY) license (https://creativecommons.org/licenses/by/4.0/).
Share and Cite
Li, J.; Zhong, Z.; Zou, H. The Cementation Mechanisms and Mechanical Properties of Different Soil–Rock Mixtures–Slurry Cements. Materials 2025, 18, 2186. https://doi.org/10.3390/ma18102186
Li J, Zhong Z, Zou H. The Cementation Mechanisms and Mechanical Properties of Different Soil–Rock Mixtures–Slurry Cements. Materials. 2025; 18(10):2186. https://doi.org/10.3390/ma18102186
Chicago/Turabian StyleLi, Jiayong, Zuliang Zhong, and Hong Zou. 2025. "The Cementation Mechanisms and Mechanical Properties of Different Soil–Rock Mixtures–Slurry Cements" Materials 18, no. 10: 2186. https://doi.org/10.3390/ma18102186
APA StyleLi, J., Zhong, Z., & Zou, H. (2025). The Cementation Mechanisms and Mechanical Properties of Different Soil–Rock Mixtures–Slurry Cements. Materials, 18(10), 2186. https://doi.org/10.3390/ma18102186