Surface Scaling
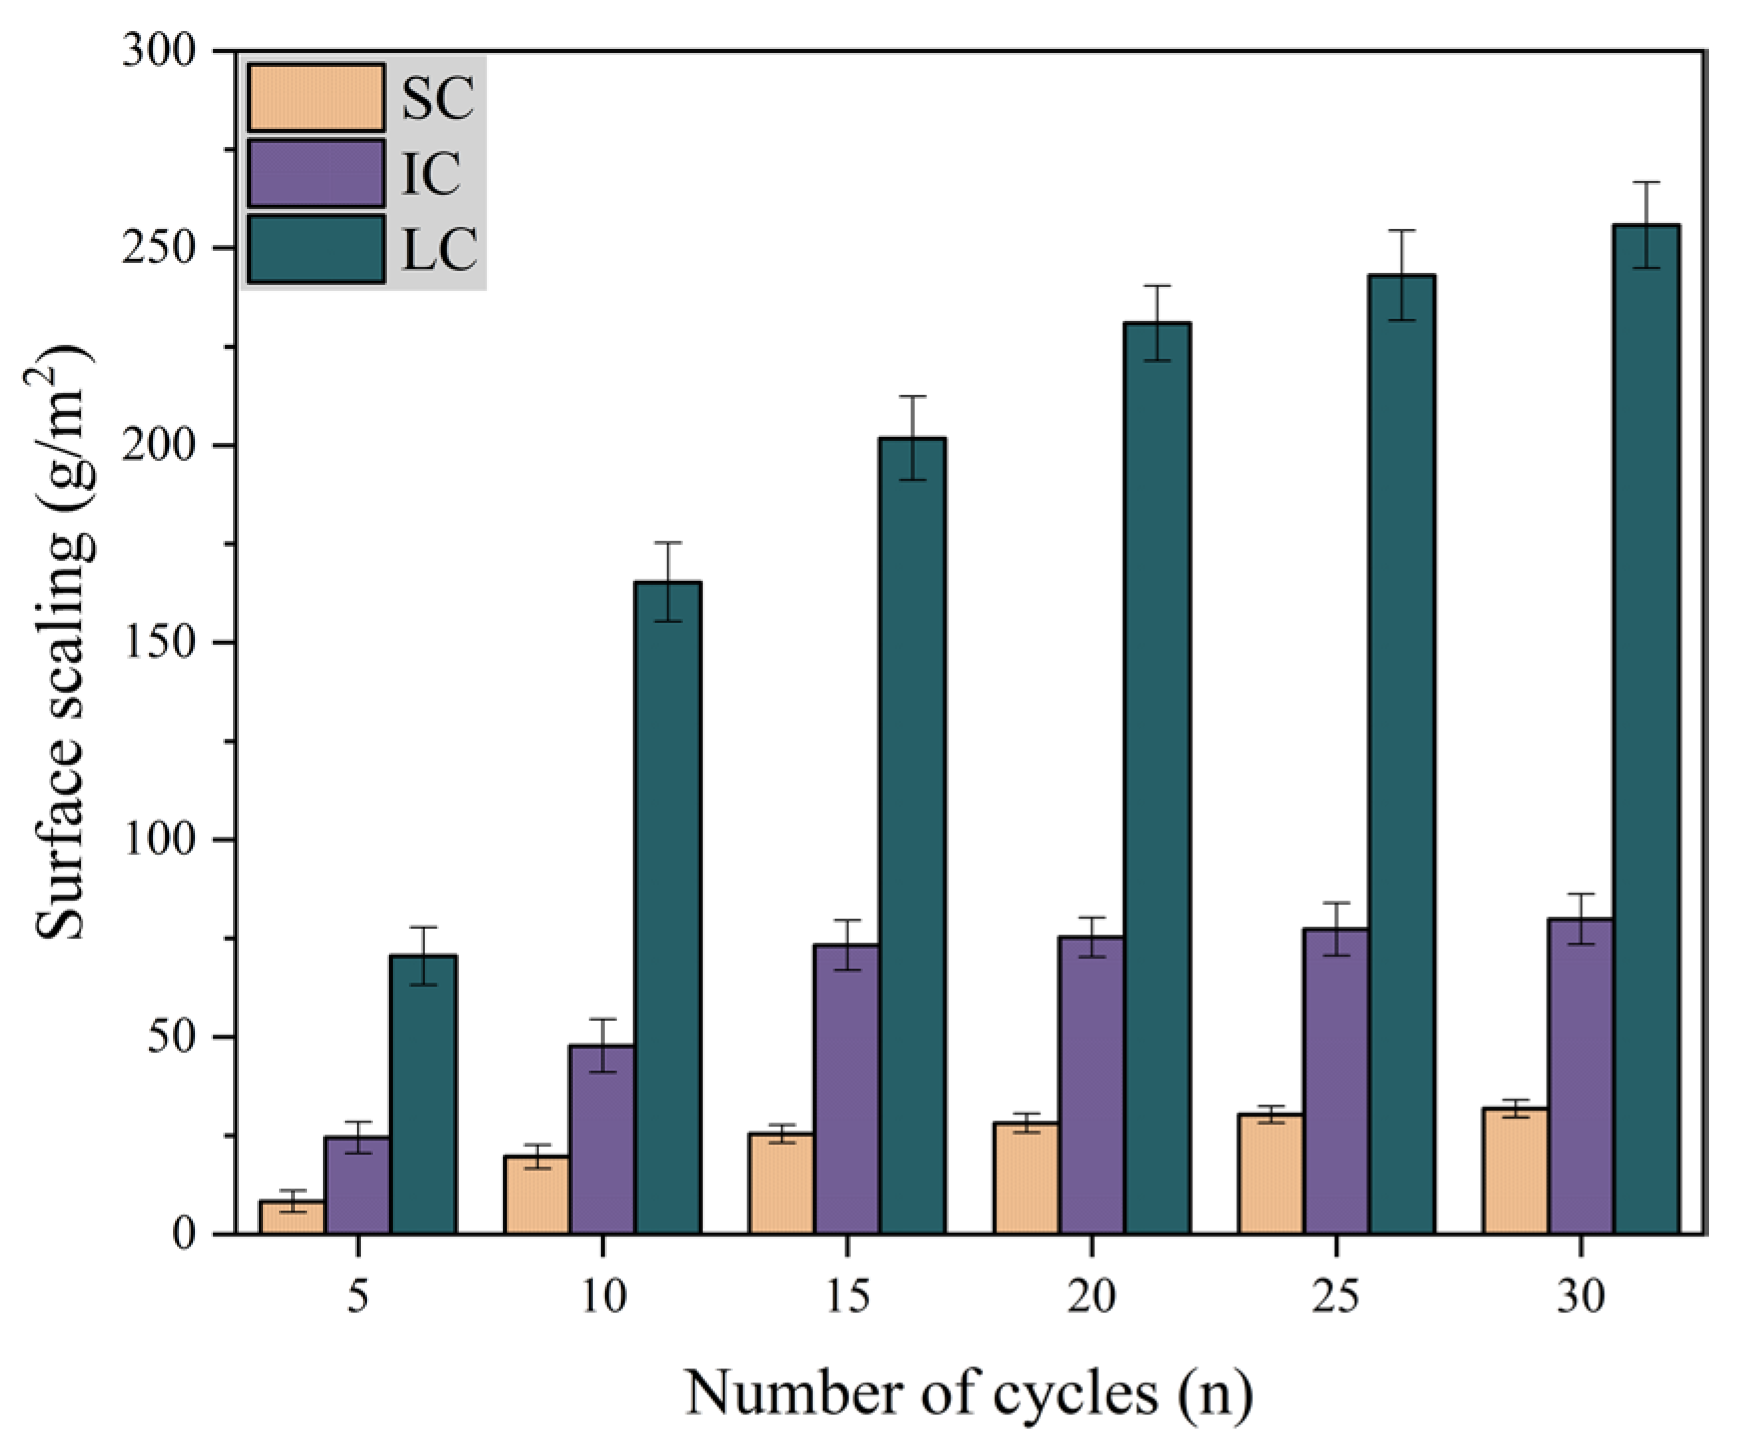
Figure 3 shows the variation of surface scaling with the number of freeze-thaw cycles under different curing conditions when the freeze-thaw medium is water. It is evident that SC concrete had the lowest surface scaling and LC concrete had the highest surface scaling. The surface scaling of SC concrete and IC concrete remained almost unchanged after 15 freeze-thaw cycles. From 20–30 freeze-thaw cycles, the surface scaling of LC concrete increased by only 10.8%. The data indicates that the concrete surface scaling is lower when exposed to single-sided freeze-thaw cycles with water as the medium.
The durability of concrete pavement can be reduced due to spalling of hardened mortar and aggregates caused by the combined effect of salt solution and freeze-thaw cycles [
11,
50,
51,
52].
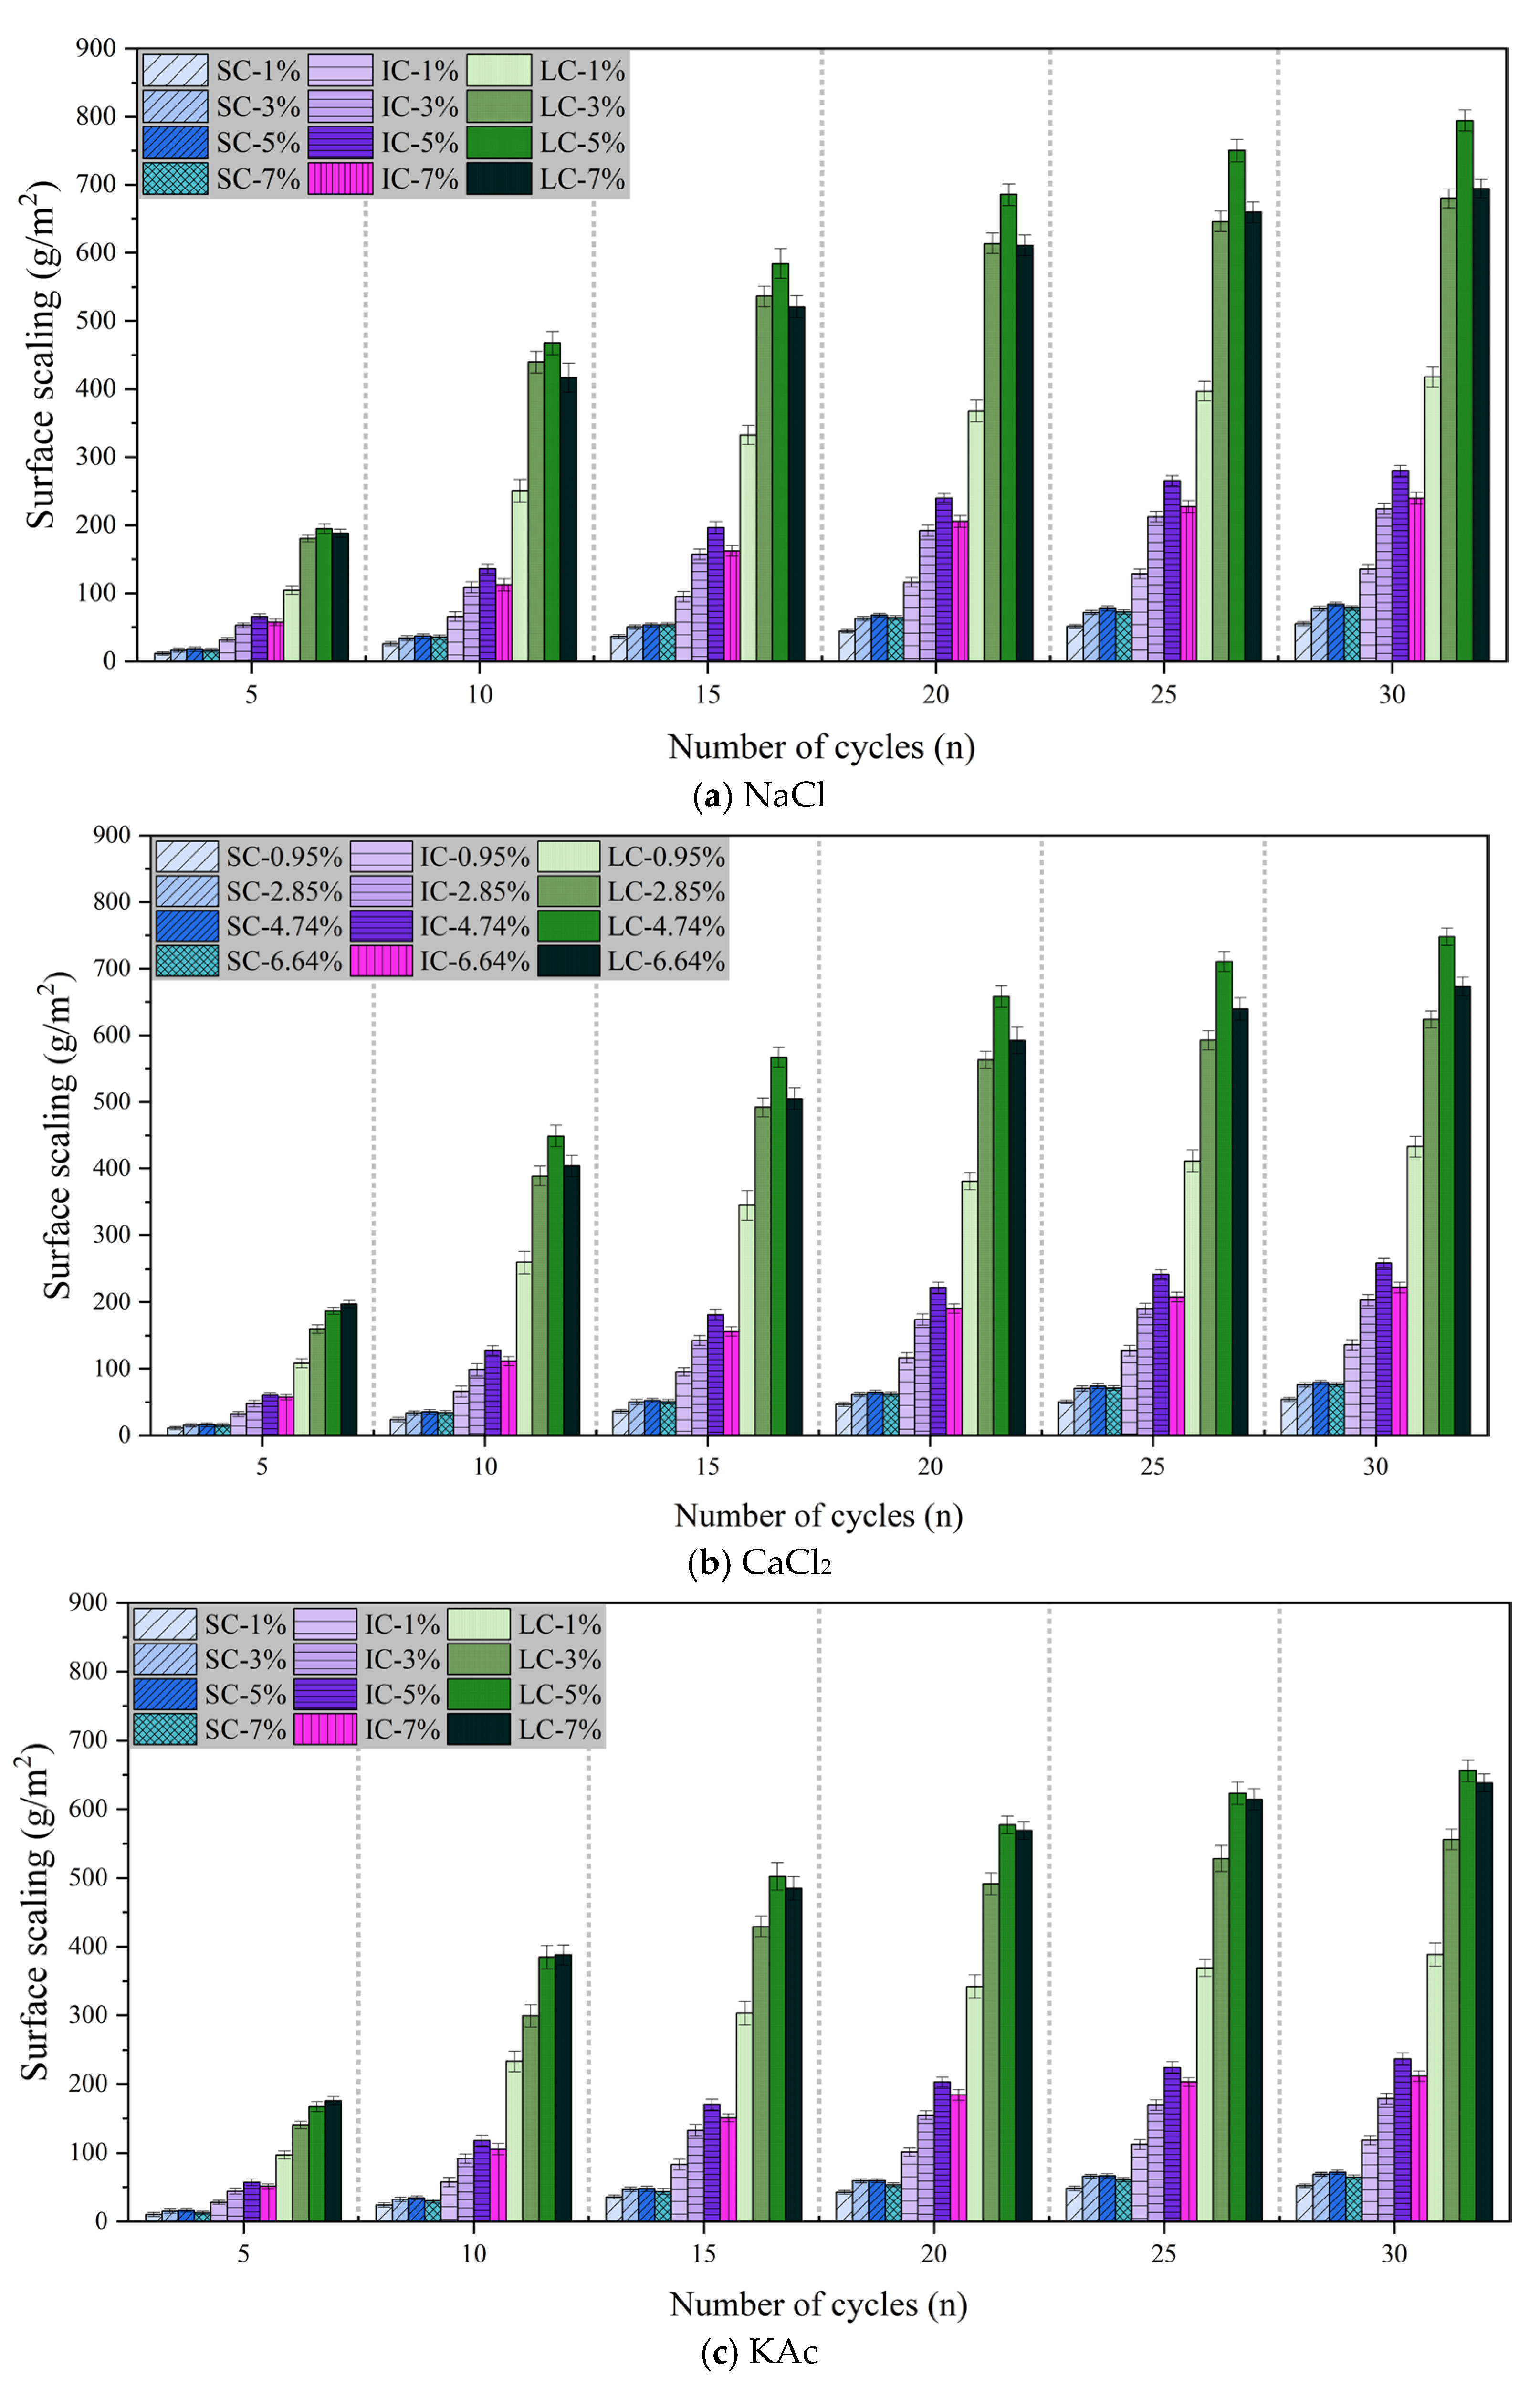
Figure 4a–c demonstrate the surface scaling of concrete with the number of freeze-thaw cycles under different curing conditions when the freeze-thaw medium is
, CaCl, and KAc solution, respectively.
Figure 4a displays the surface scaling of concrete with freeze-thaw cycles under various curing conditions when the freeze-thaw cycle medium is
solution. The surface scaling of the SC concrete was the lowest and had the least variation with the number of freeze-thaw cycles. The lowest surface scaling was observed after 30 freeze-thaw cycles with a
solution mass fraction of 1%. However, there was no significant difference in the surface scaling of concrete for
solution mass fractions of 3%, 5%, and 7%. The surface scaling of SC concrete and IC concrete was highest when the mass fraction of
solution was 5%. After 30 freeze-thaw cycles, the surface scaling of the LC concrete increased by 90.1%, 16.8%, and 14.4% when the mass fraction of
solution was 5%, compared to 1%, 3%, and 7%, respectively.
Figure 4b illustrates that the surface scaling of concrete is comparable when exposed to freeze-thaw cycles in
solution and
solution.
Figure 4c displays the variation of surface scaling of concrete with freeze-thaw cycles under different curing conditions when the freeze-thaw cycle medium is
solution. After 30 freeze-thaw cycles, SC concrete exhibited the lowest surface scaling and the smallest difference between freeze-thaw media. For both IC concrete and LC concrete, the surface scaling was significantly lower when the mass fraction of
solution was 1% compared to when it was 3%, 5%, and 7%. It is worth noting that after 30 freeze-thaw cycles, the surface scaling of LC concrete was highest when the
solution mass fraction was 5%, but only 2.7% higher than when it was 7%.
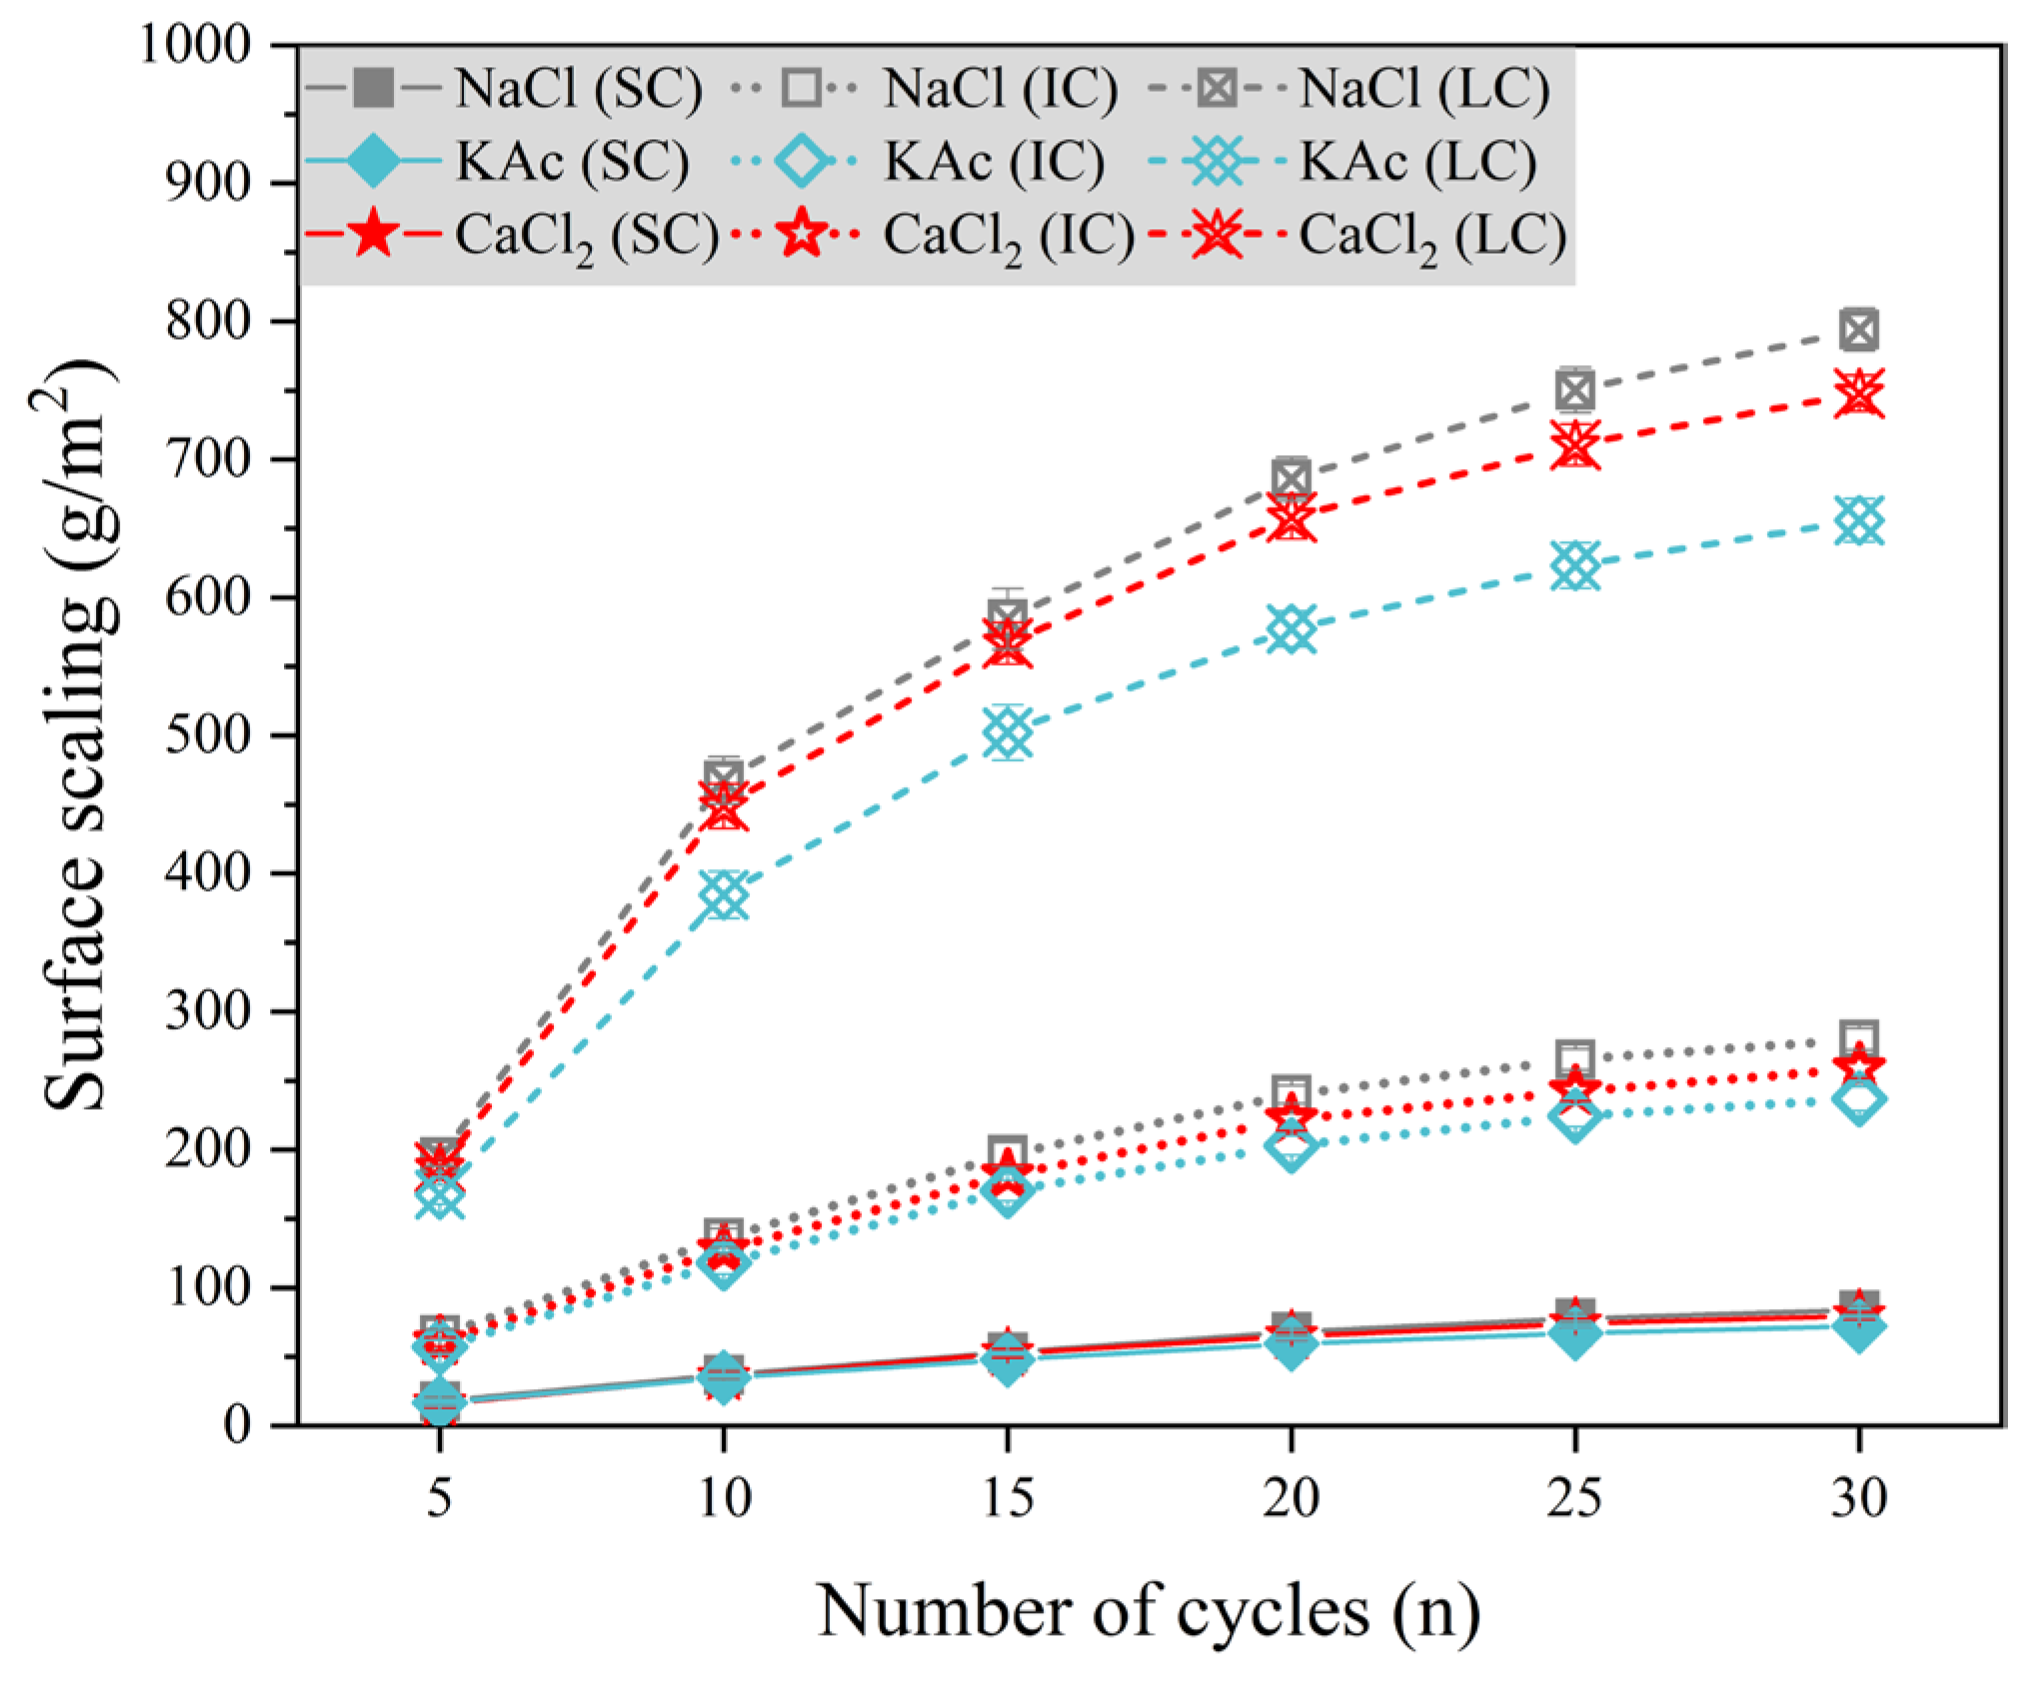
To compare and analyze the effects of various curing conditions and salt solutions on concrete surface scaling, we utilized 5%
solution, 4.74%
solution, and 5%
solution as examples for further analysis.
Figure 5 illustrates the variation of concrete surface scaling with the number of freeze-thaw cycles under three different salt solution conditions. The surface scaling of SC concrete was significantly lower, while there was no significant difference in the concrete surface scaling of the three freeze-thaw media. For IC concrete, there was no significant difference in the surface scaling of concrete during the first 10 freeze-thaw cycles with
,
, and
solutions as freeze-thaw media. After 15 freeze-thaw cycles, the surface scaling of concrete was slightly higher when the freeze-thaw medium was
solution, while it was slightly lower when the freeze-thaw medium was
solution. After 30 freeze-thaw cycles, the surface scaling of LC concrete was 21.1% and 14.0% higher when the freeze-thaw medium was
solution and
.
Comparison of
Figure 3 shows that the degree of concrete damage resulting from salt solution and freeze-thaw cycles was significantly greater than that caused by a single freeze-thaw cycle. This effect was particularly evident for LC concrete. Among the solutions tested,
,
, and
had the most severe impact on concrete surface scaling at mass fractions of 5%, 4.74%, and 5%, respectively. According to the Saturation and ice-formation pressure theory [
35], the presence of a salt solution can significantly increase the internal saturation of concrete, resulting in increased surface scaling. However, it can also decrease the rate of solution icing expansion and icing pressure, increase the critical saturation of the solution to produce icing pressure, and mitigate the surface scaling. The combination of these two factors results in a low mass fraction of salt solution, which in turn produces the highest icing pressure and leads to the most severe damage to the concrete.
Water Absorption Rate
Figure 6 shows the variation of water absorption rate with the number of freeze-thaw cycles under different curing conditions when the freeze-thaw medium is water. It is found that LC concrete exhibited significantly higher water absorption rate than SC concrete and IC concrete. After 15–30 freeze-thaw cycles, the water absorption rate of LC concrete was found to be 162.7% to 186.1% higher than that of SC concrete, while the water absorption rate of LC concrete was 82.4% to 83.0% higher than that of IC concrete. These results suggest that as the number of freeze-thaw cycles increases, the water absorption rate of SC concrete increases to a lesser extent than that of LC concrete, while the water absorption of IC concrete increases to a similar extent as that of LC concrete.
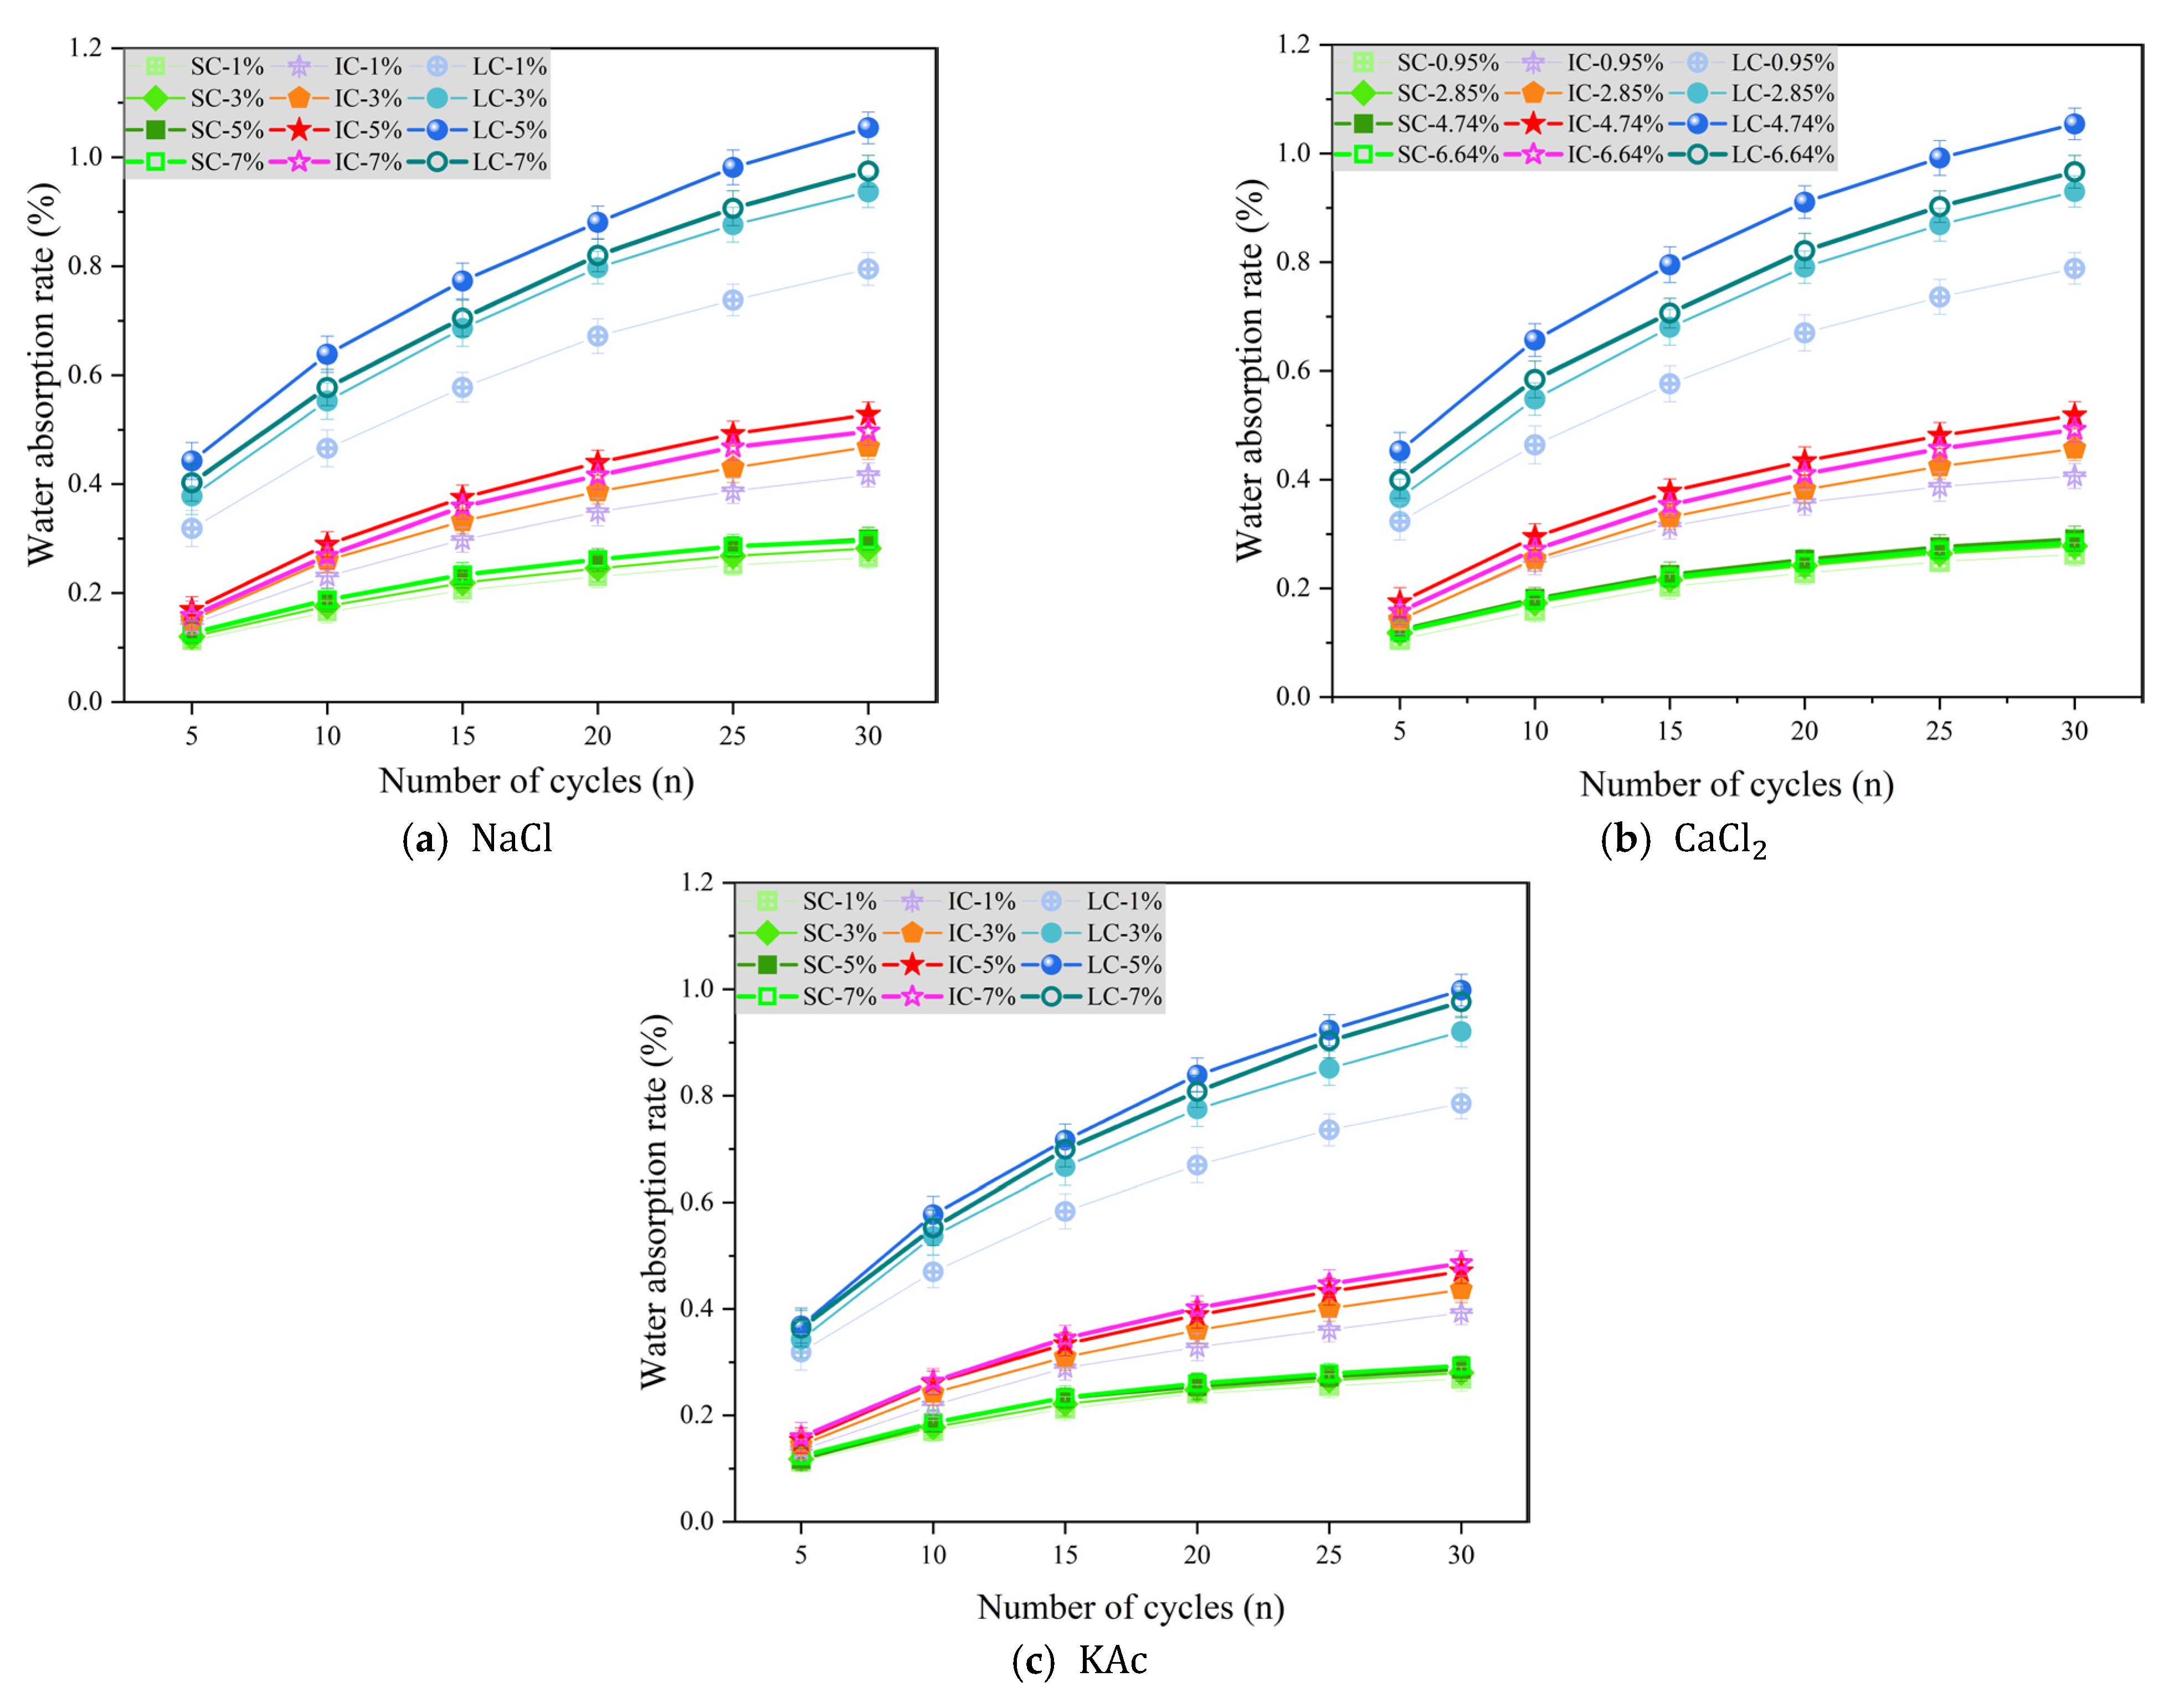
Figure 7a–c display the change in concrete water absorption rate as a function of the number of freeze-thaw cycles under various curing conditions when the freeze-thaw medium is
,
, and
solutions, respectively.
Figure 7a shows the variation in water absorption rate of concrete with the number of freeze-thaw cycles under different curing conditions when the freeze-thaw cycle medium is
solution. The water absorption rates of SC concrete with
solution mass fractions of 5% and 7% were slightly higher than those of concrete with
solution mass fractions of 1% and 3%, but the difference was not significant. The water absorption rate of IC concrete was highest when the mass fraction of
solution was 5%. After 30 freeze-thaw cycles, the water absorption rate was 26.7%, 12.8%, and 6.2% higher when the NaCl solution mass fraction was 5% compared to 1%, 3%, and 7%, respectively. Furthermore, LC concrete had significantly higher water absorption rate than SC and IC concrete. After 30 freeze-thaw cycles, the water absorption rate of concrete with a
solution mass fraction of 5% was higher than that of concrete with
solution mass fractions of 1%, 3%, and 7% by 32.6%, 12.5%, and 8.1%, respectively. When the freeze-thaw medium is a
solution, the water absorption rate of concrete under each curing condition has a similar trend compared to when the freeze-thaw medium is a
solution, as shown in
Figure 7b. This suggests that chloride ions in de-icing salt may be the main cause of freeze-thaw damage in concrete.
Figure 7c displays the change in concrete water absorption rate with the number of freeze-thaw cycles when using
solution as the freeze-thaw cycle medium. It is clear that the water absorption rate of SC concrete was less affected by the solution mass fraction. On the other hand, the water absorption rate of the IC concrete was the highest when the mass fraction of the
solution was 7%. After undergoing 30 freeze-thaw cycles, the water absorption rate of concrete with a 7%
solution mass fraction was higher than that of concrete with 1%, 3%, and 5%
solution mass fractions by 23.8%, 11.4%, and 3.3%, respectively. Furthermore, in regards to LC concrete, the water absorption rate only increased by 2.2% when a 5% mass fraction of
solution was used compared to a 7% mass fraction. It was also found to be 27.1% and 8.4% higher than LC concrete when a 1% and 3% mass fraction of
solution was used, respectively.
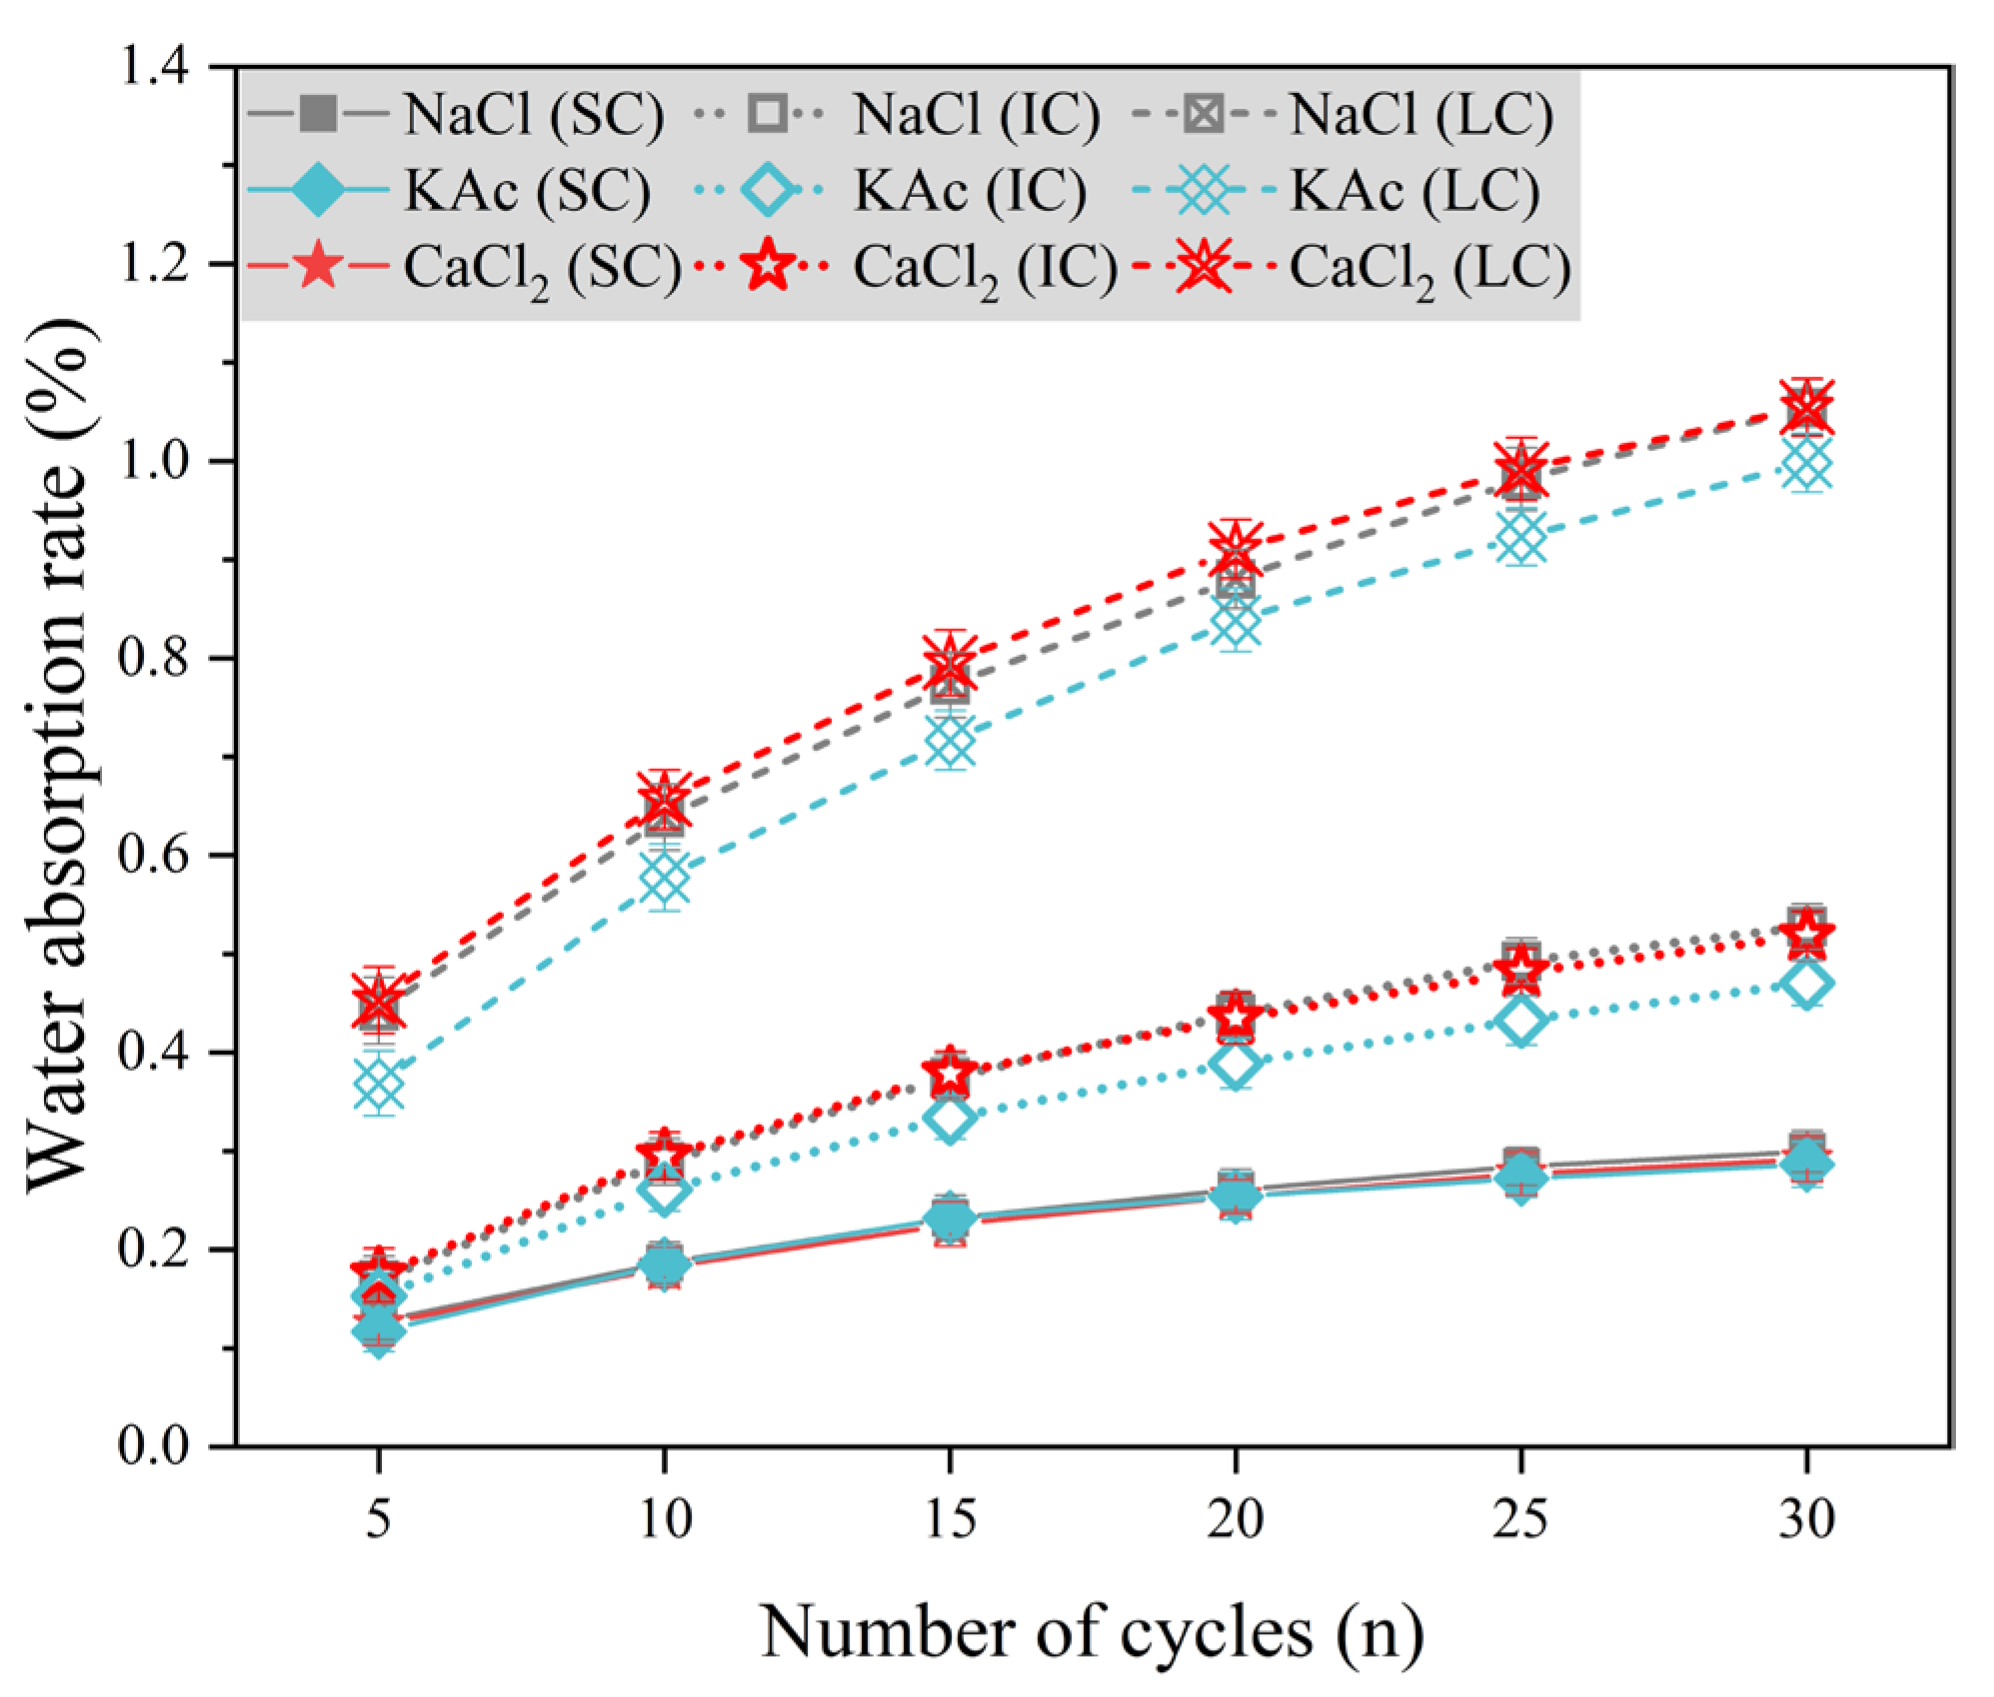
Figure 8 displays the water absorption rate variation of concrete with the number of freeze-thaw cycles, using 5% mass fraction of
solution, 4.74% mass fraction of
solution, and 5% mass fraction of
solution as the freeze-thaw medium. The water absorption rate of SC concrete was significantly lower than that of IC and LC concrete. Additionally, there was little difference in the water absorption rate of SC concrete under the three salt solution conditions. The water absorption rates of IC concrete and LC concrete were similar when exposed to
and
solutions as freeze-thaw mediums. However, these rates were higher compared to concrete exposed to
solution. For instance, after 30 freeze-thaw cycles, the water absorption rates of IC concrete and LC concrete were 12.1% and 5.6% higher than those of concrete exposed to
solution, respectively. The results indicate that the water absorption rate of IC and LC concrete is reduced under
solution conditions compared to
and
solutions as freeze-thaw mediums. However, the change in water absorption rate for SC concrete is not significant.
In summary, after being subjected to a single-sided freeze-thaw cycle and salt solution, it was observed that the surface scaling and water absorption rate of SC concrete were lower and less affected by the freeze-thaw medium. In contrast, the surface scaling and water absorption rate of LC concrete were significantly higher. This difference may be attributed to the pore structure and connectivity of the concrete itself. In addition, the presence of salt on concrete surfaces can cause water to migrate to the surface, which, if frozen, can create destructive pressure. It is important to note that the development of pores continues in the direction of stress concentration towards neighboring pores [
36,
53]. This can damage the internal pore structure of the concrete and generate microcracks on the surface and at deeper depths. Additionally, certain grains may lose their bonding properties, resulting in an increase in capillary porosity and connectivity. As a result, the pore structure and connectivity of LC concrete are increased, leading to greater surface scaling and water absorption rate.


