
Environmental and Economic Viability of Using Concrete Block Wastes from a Concrete Production Plant as Recycled Coarse Aggregates


Abstract
1. Introduction
2. Materials
2.1. Cement
2.2. Natural Fines and Coarse Aggregates
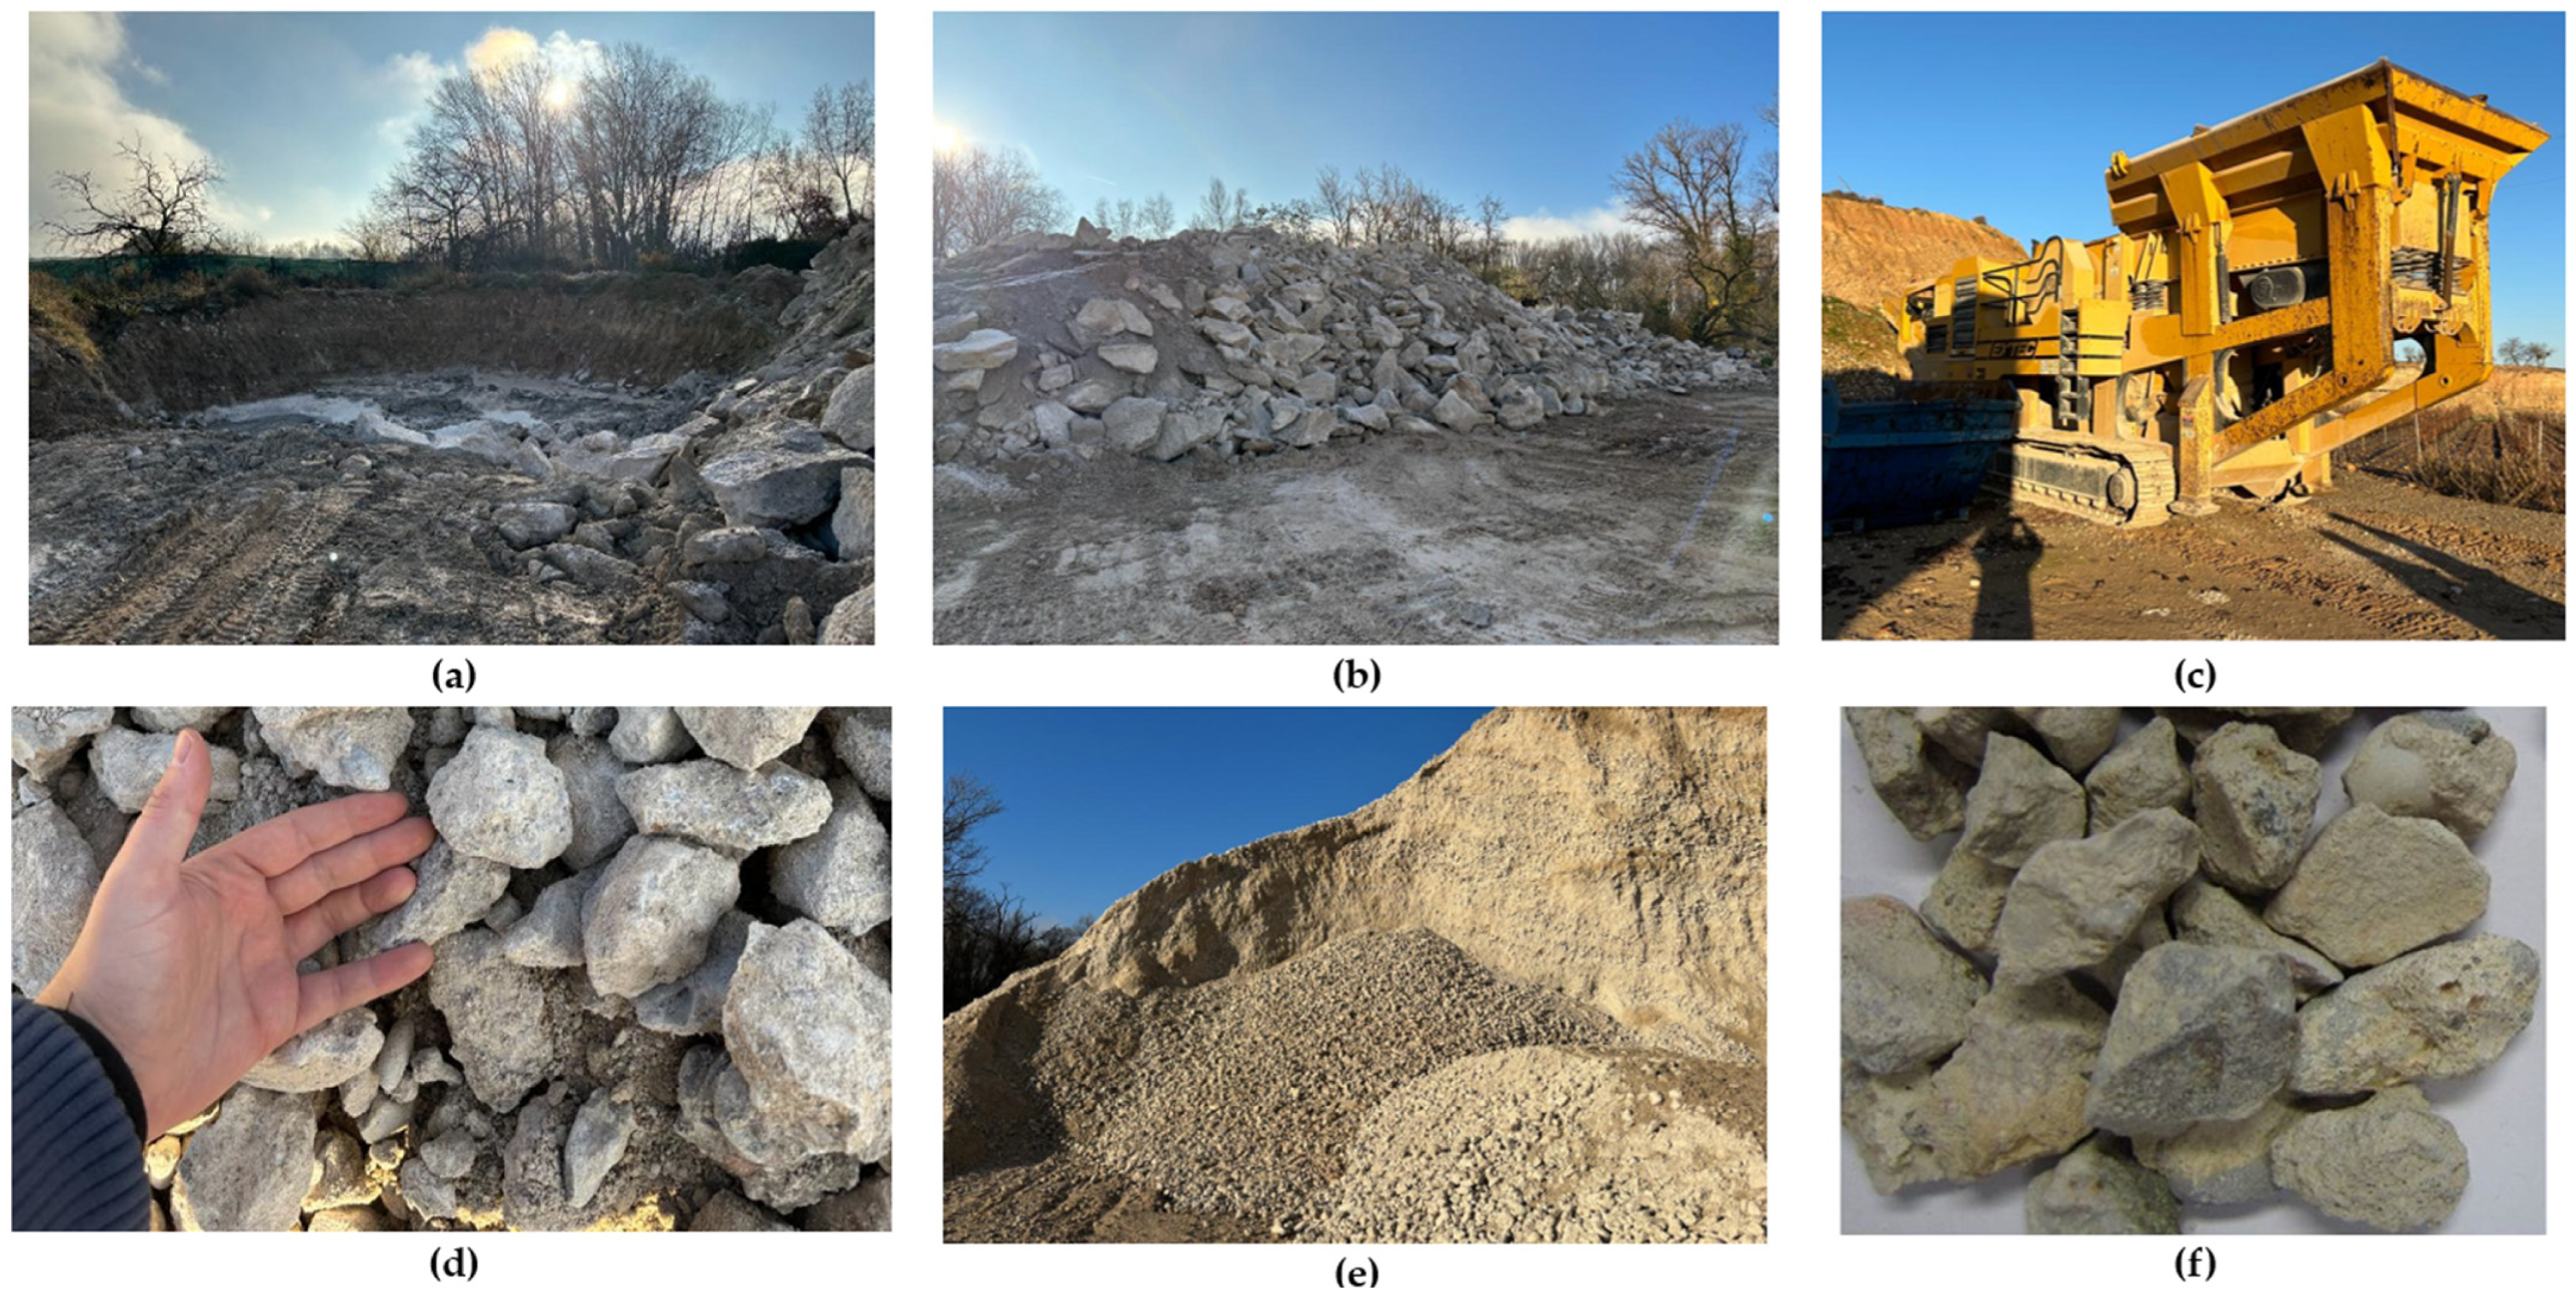
2.3. Recycled Coarse Aggregates (RCAs)
2.4. Water
2.5. Concrete Mixes
3. Methodology and Case of Study
3.1. Life Cycle Assessment (LCA)
3.1.1. Objective and Scope
3.1.2. Functional Unit
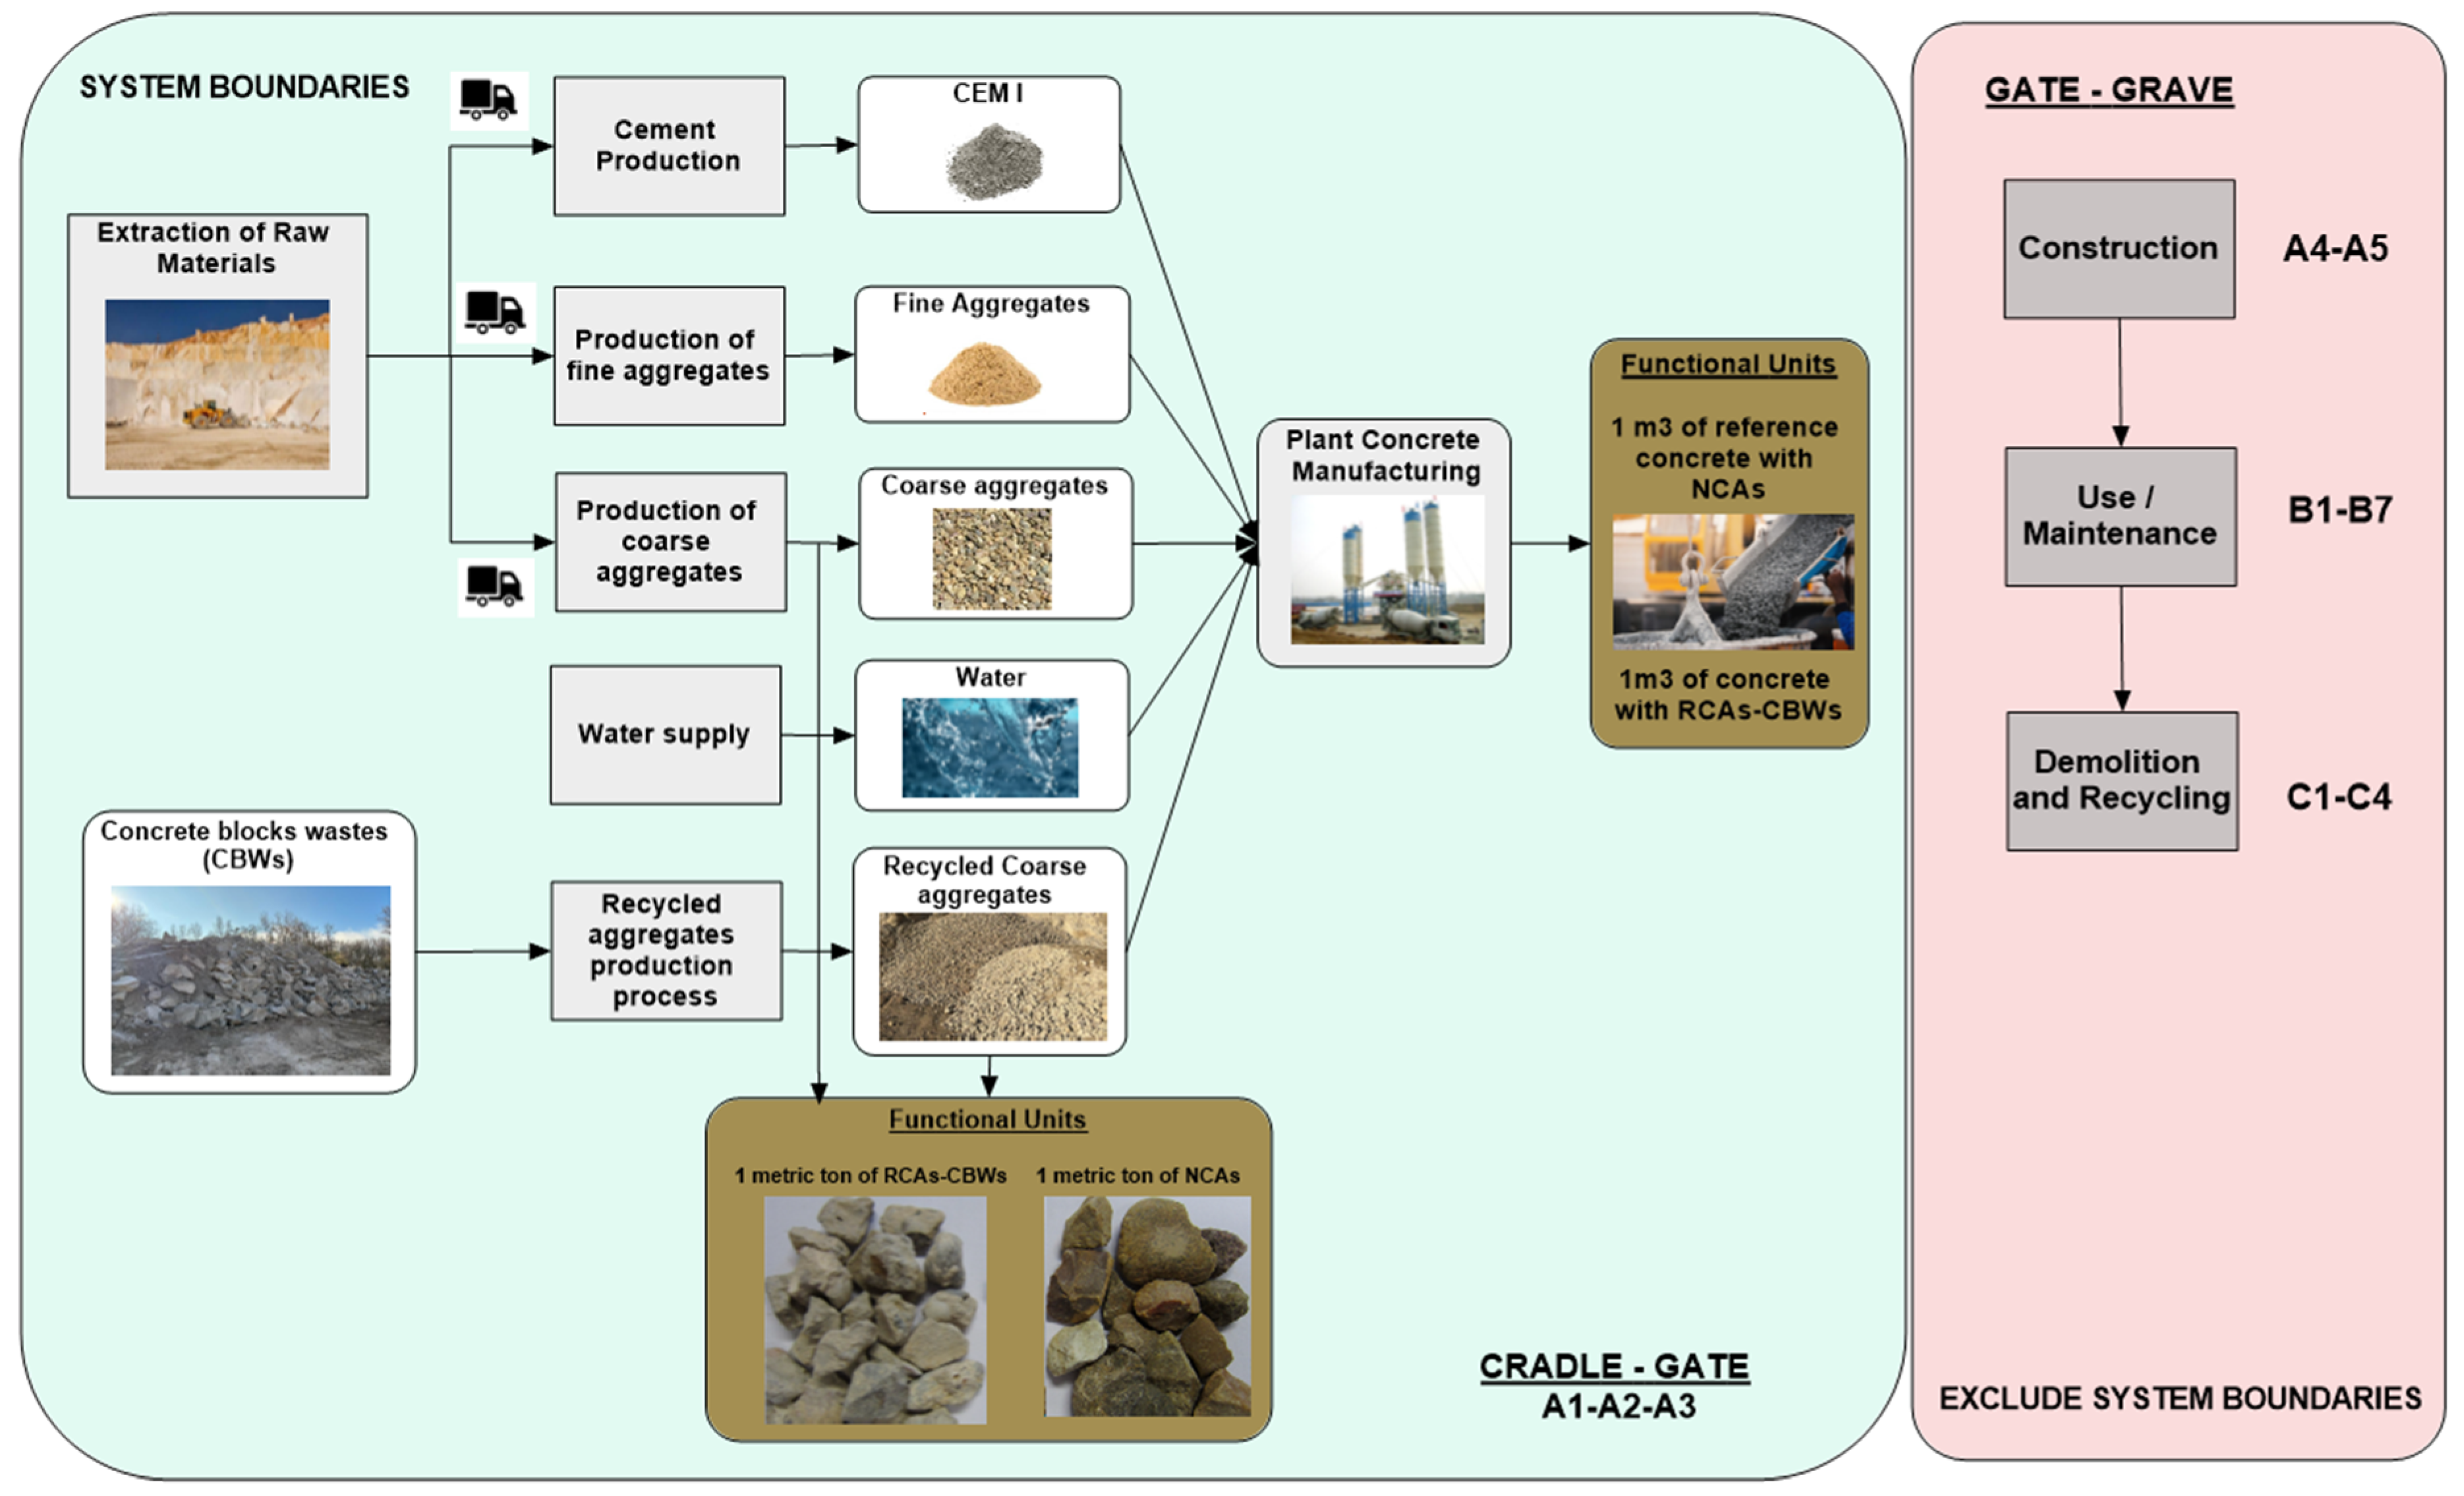
3.1.3. System Boundary
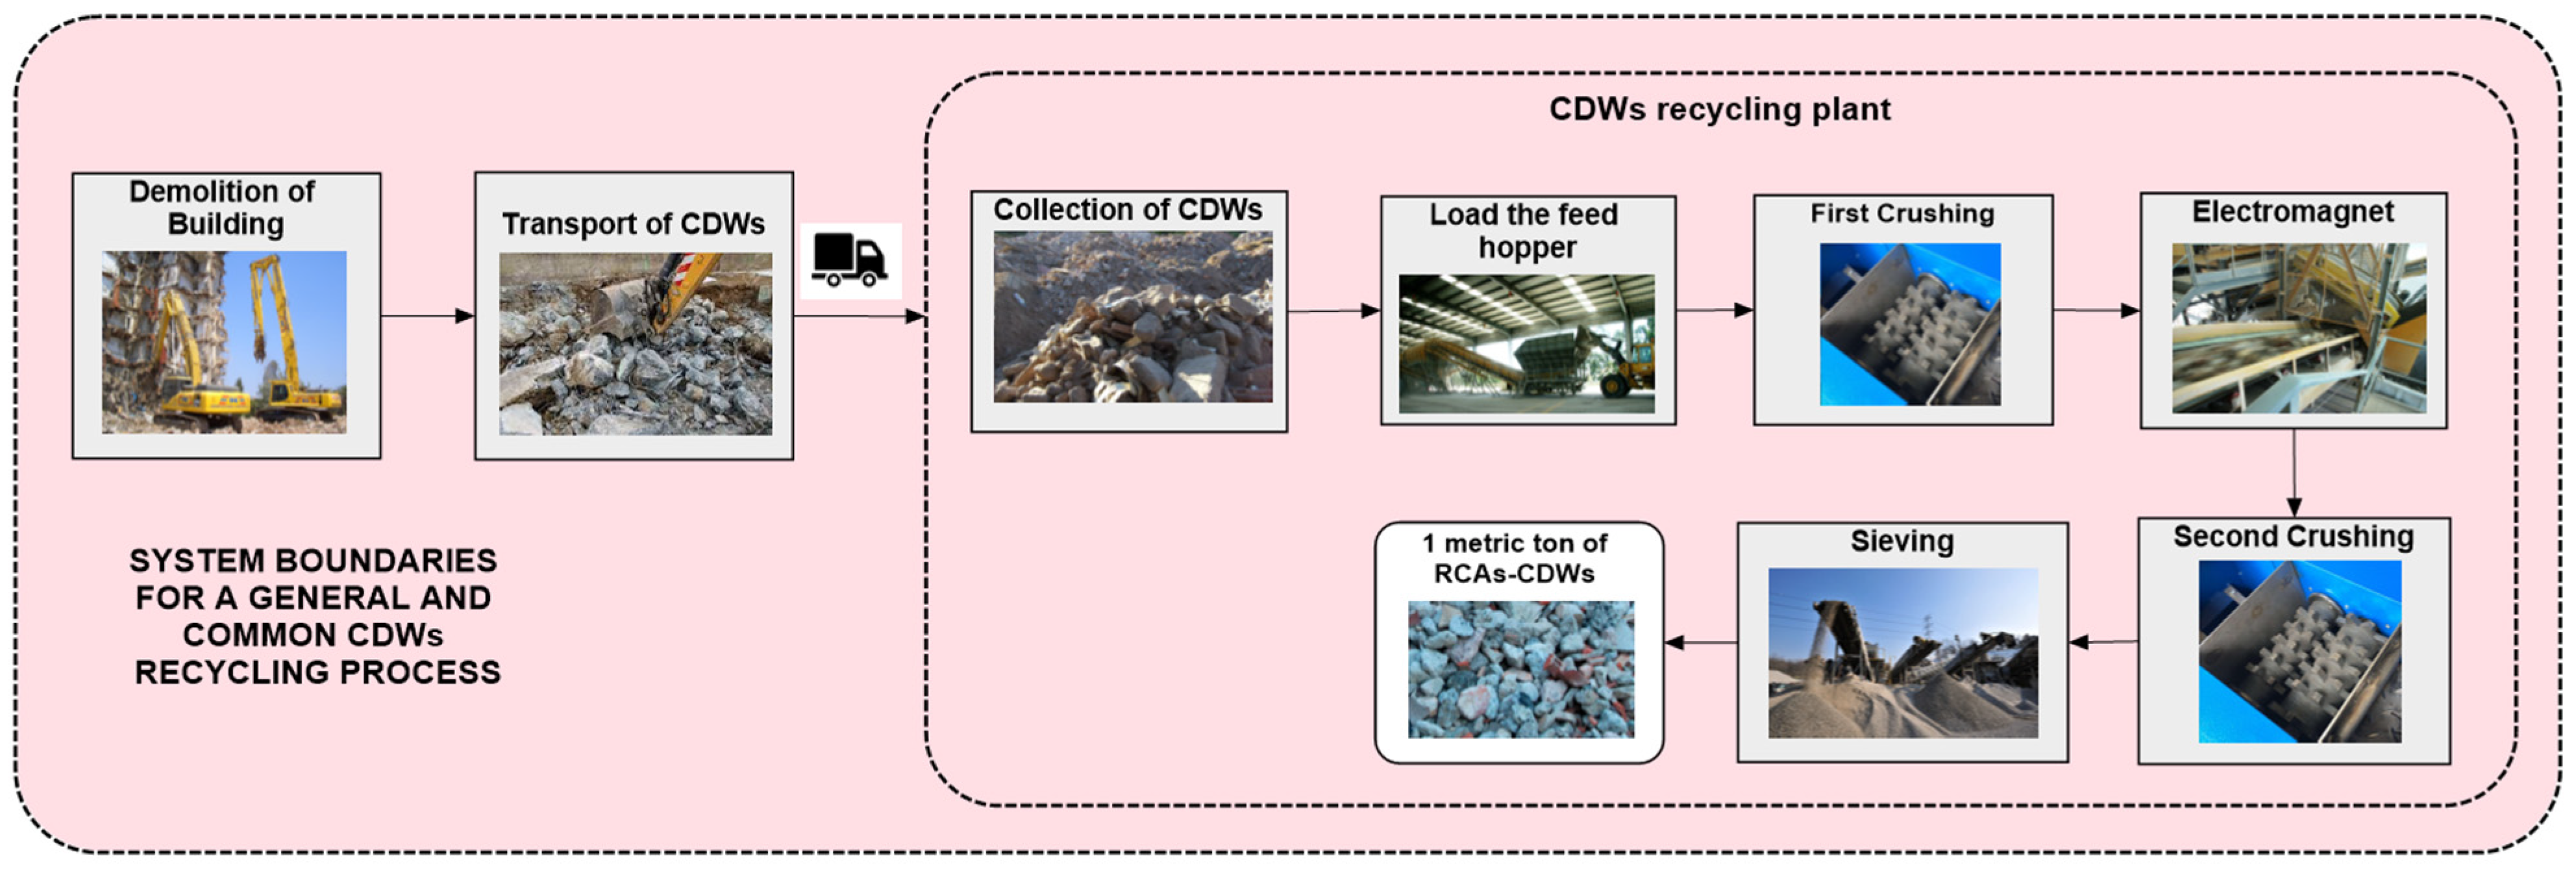
- RCA-CBWs System Boundary Comparison
3.1.4. Life Cycle Inventory (LCI)
- Materials
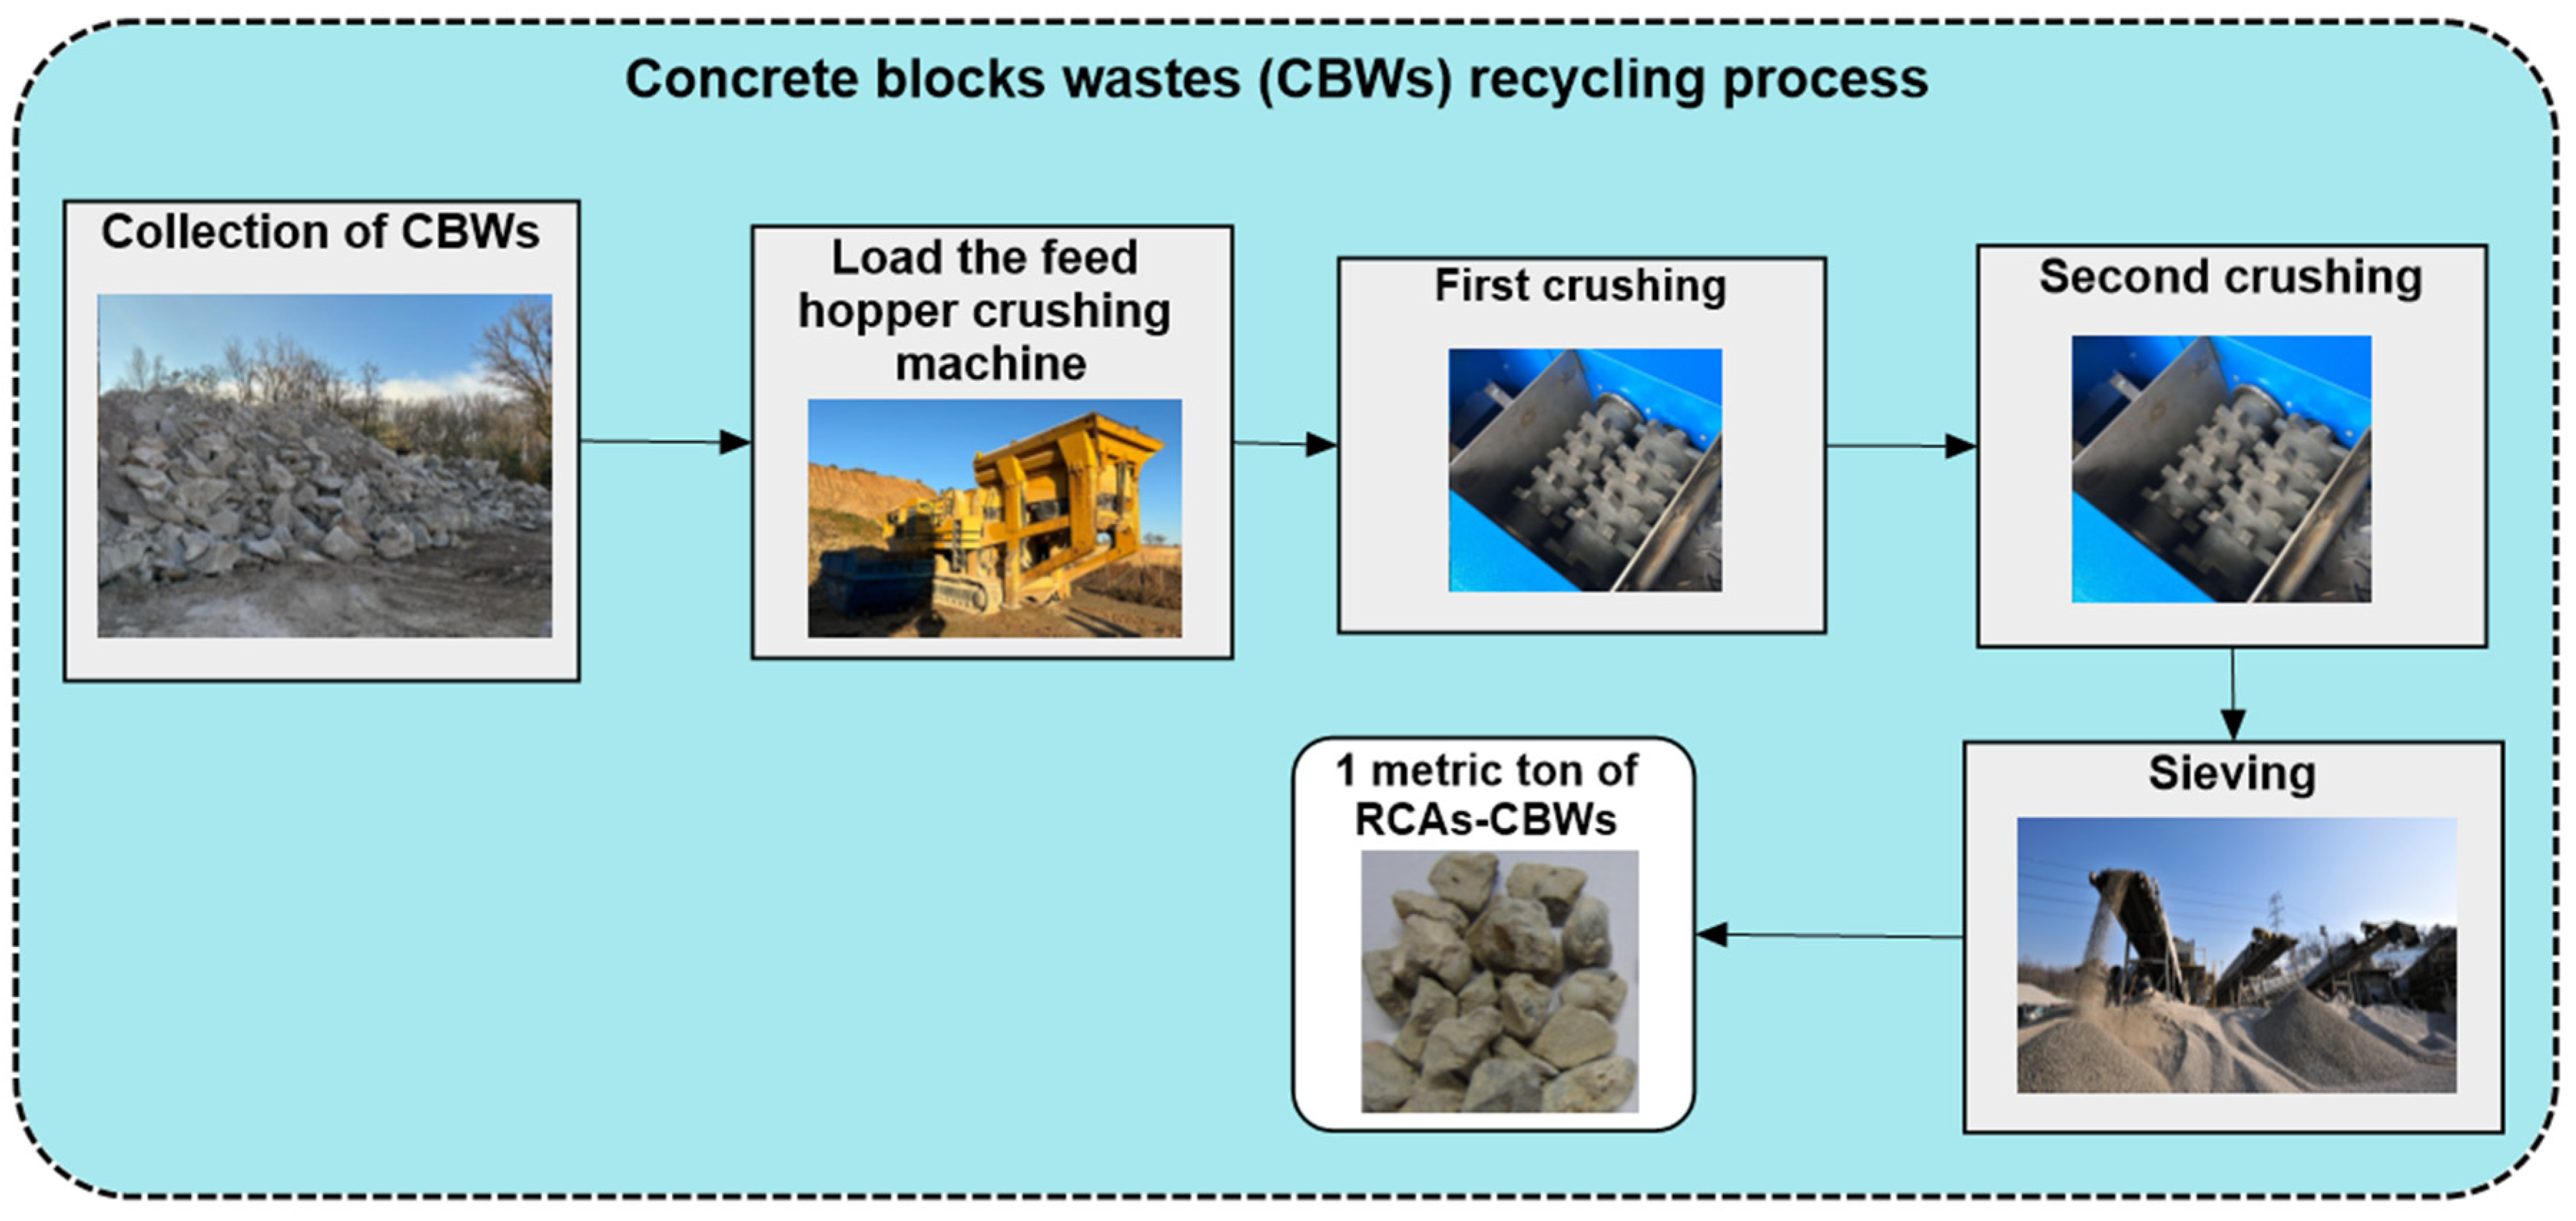
- Production process of RCA-CBWs
- LCI Hormigones Ebro
- LCI RCA-CDWs
- Transport
- Production of the concrete samples
3.1.5. Life Cycle Impact Assessment (LCIA)
3.2. Economic Analysis
4. Results and Discussion
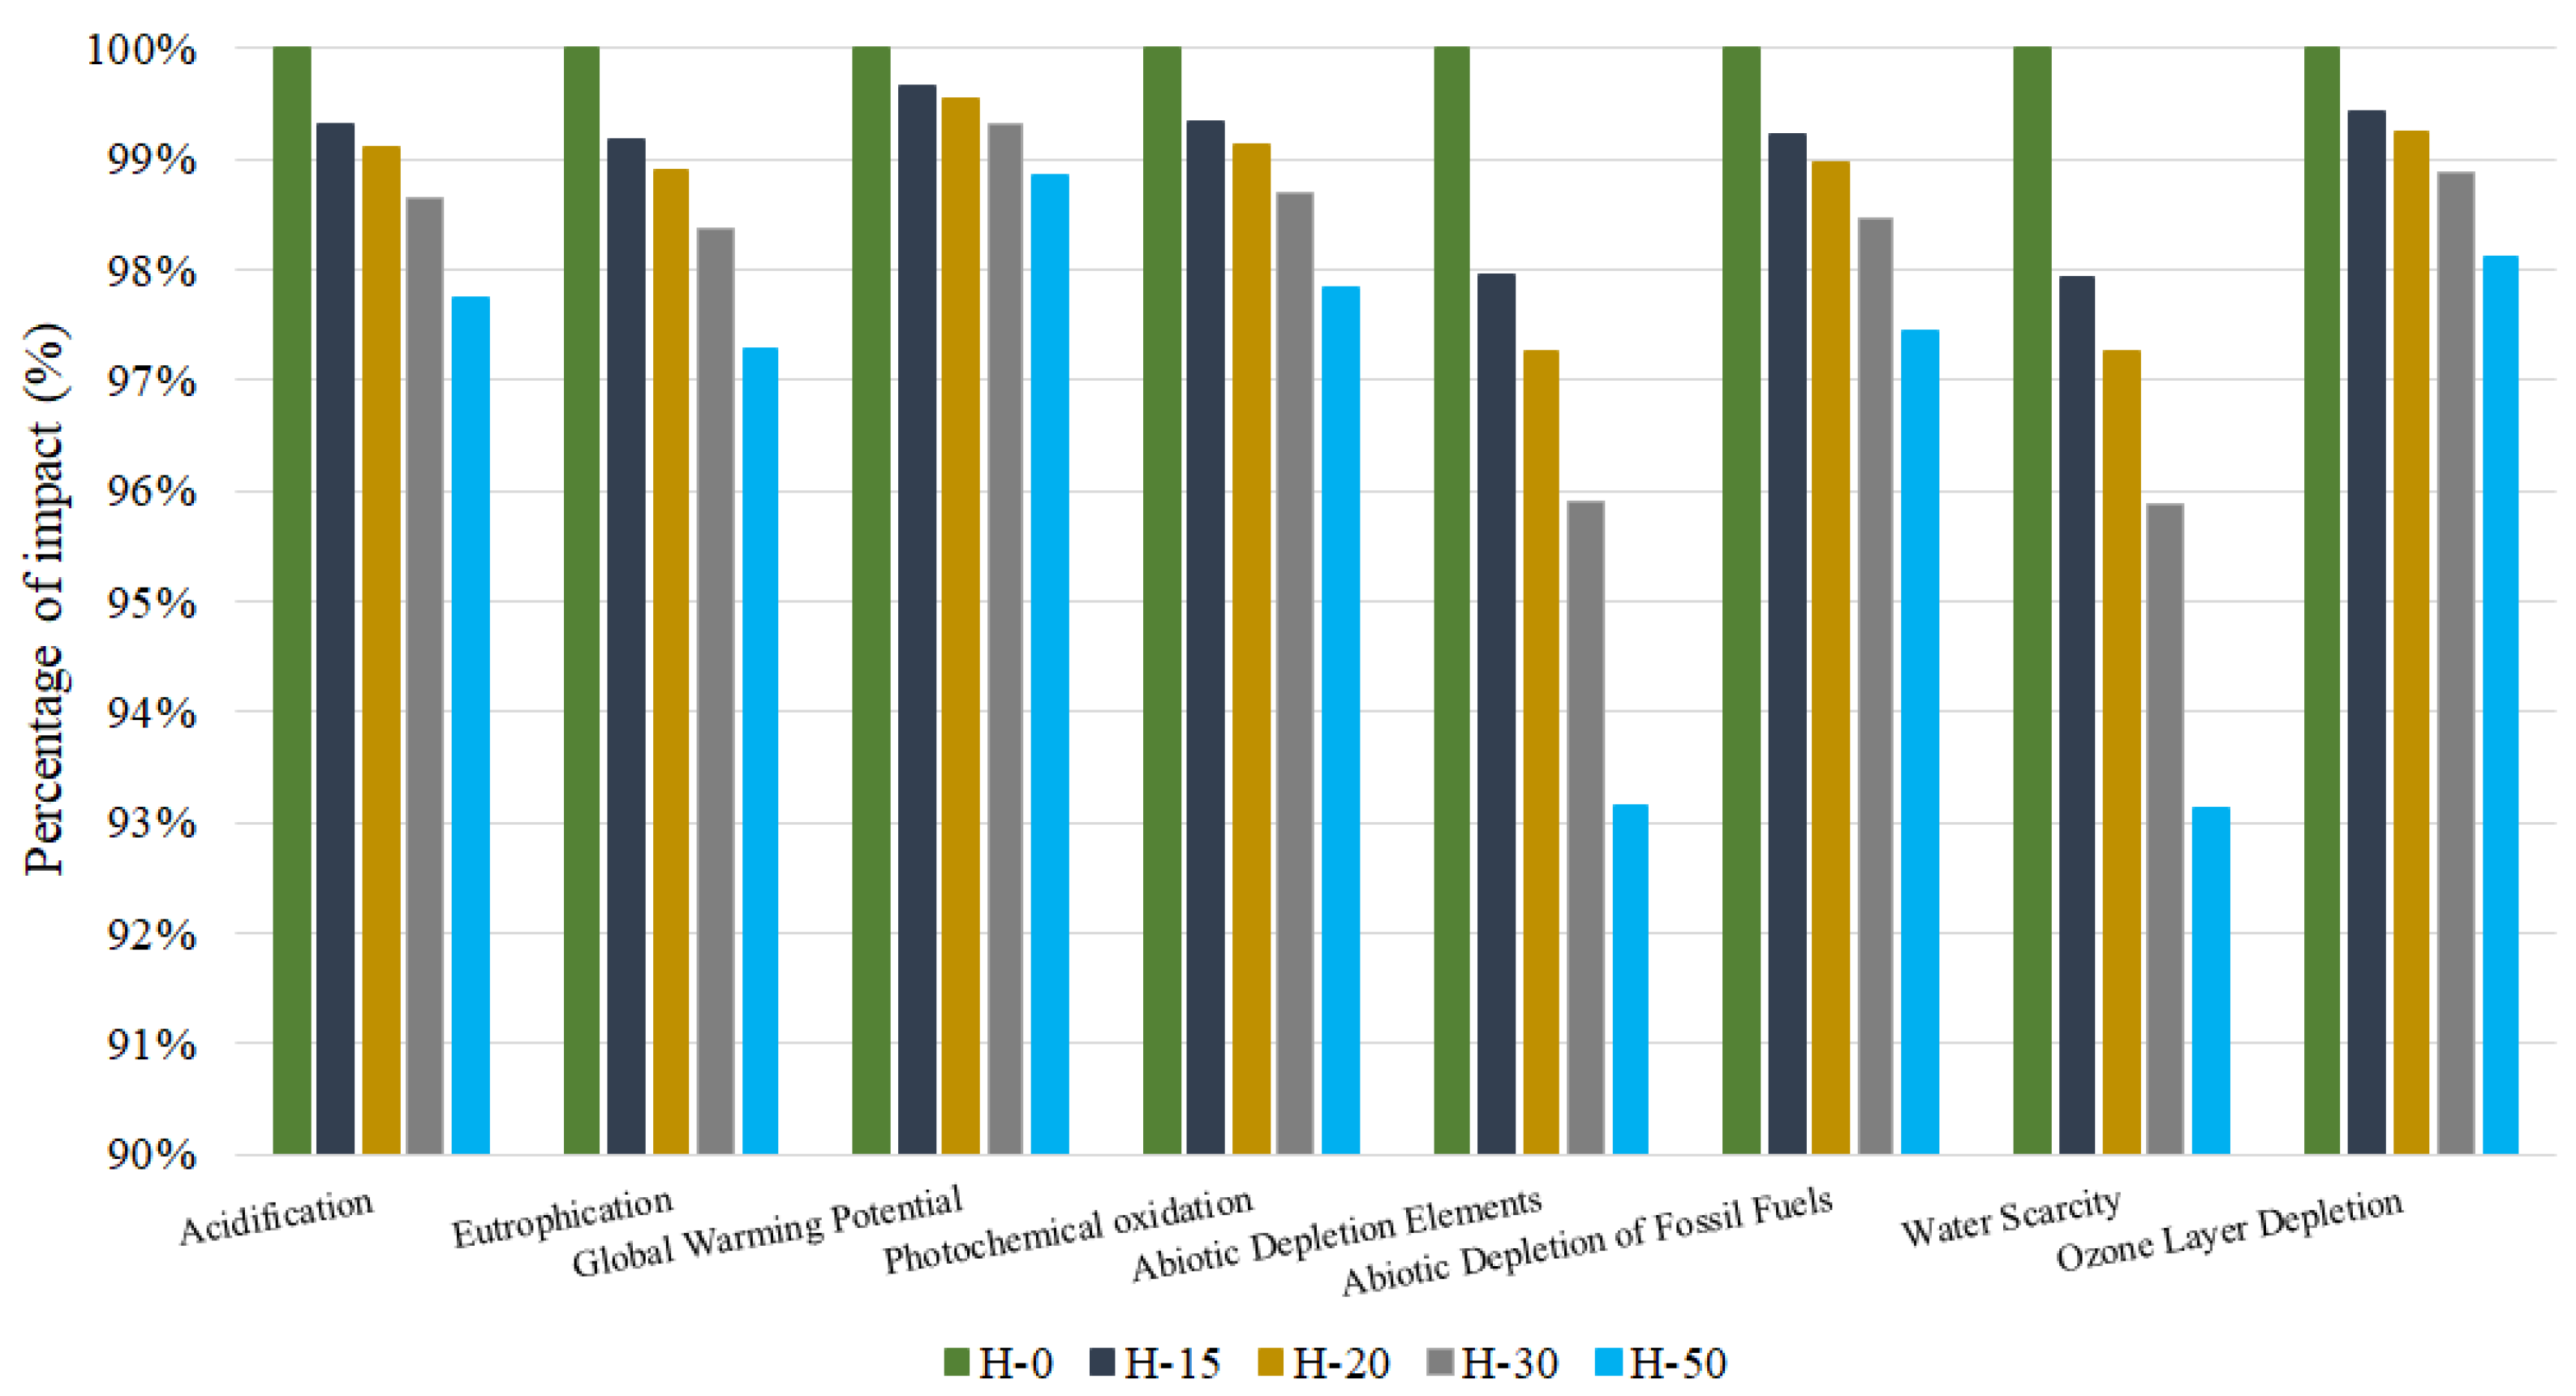
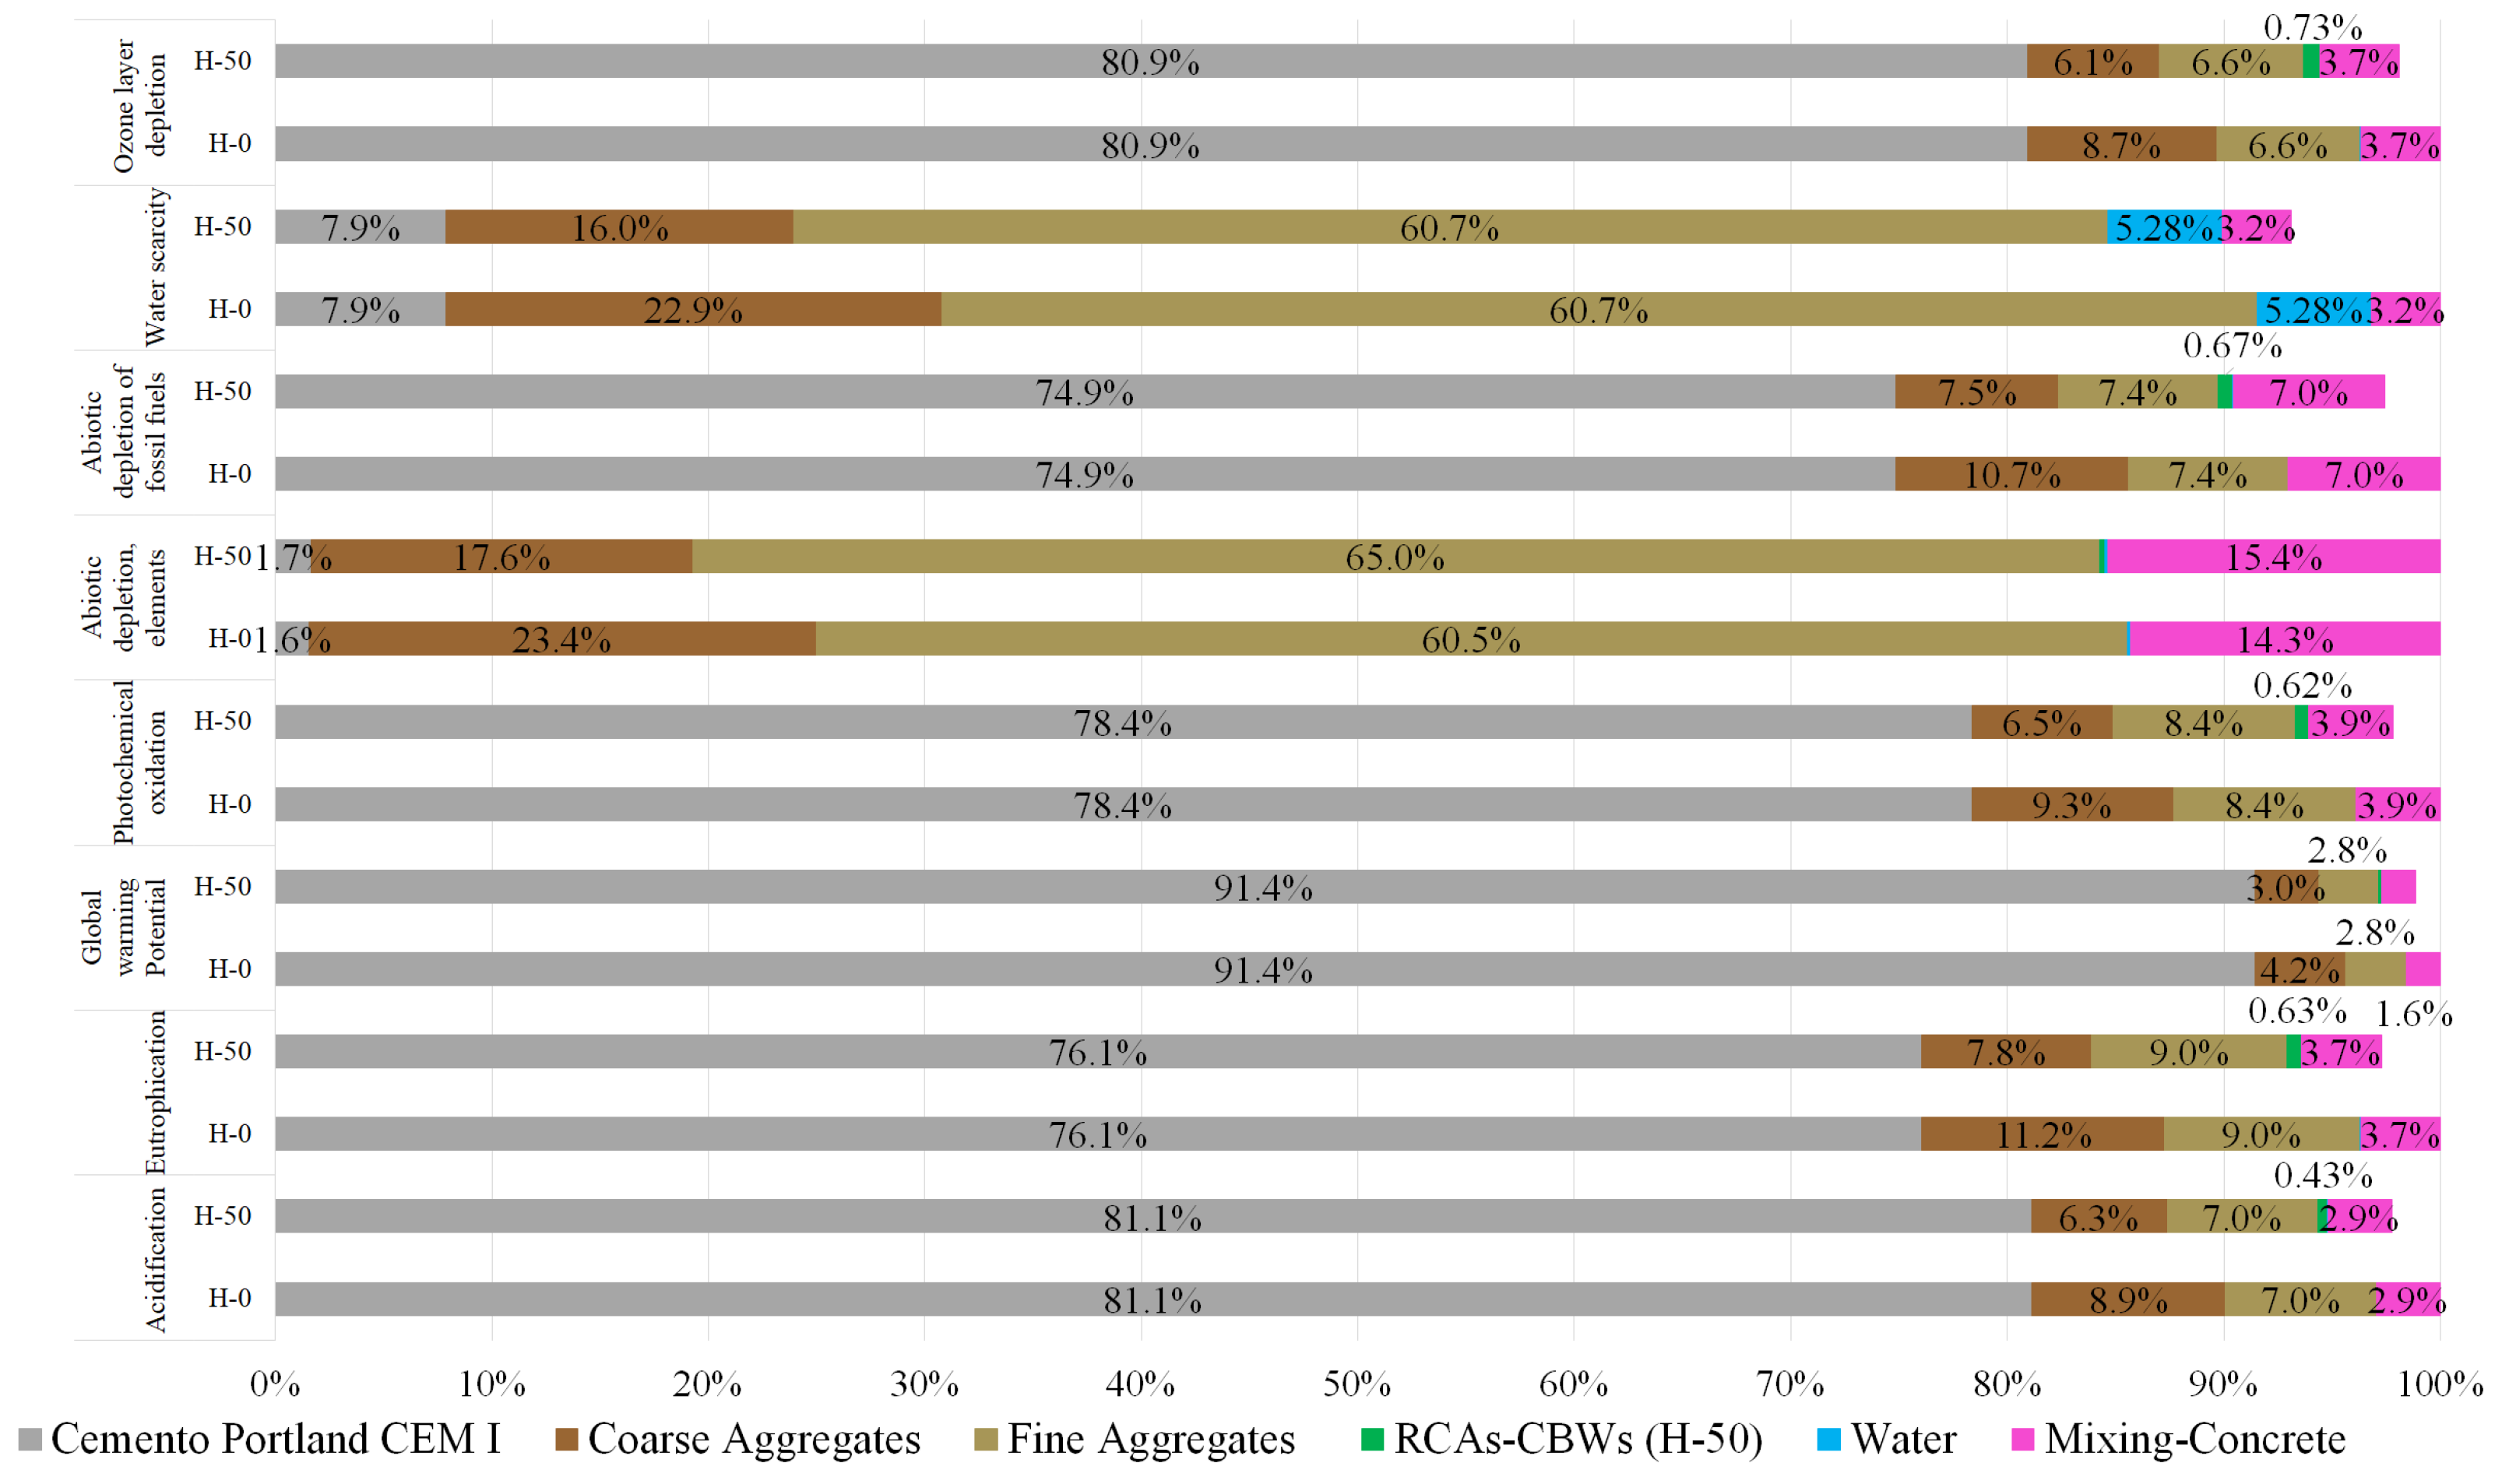
4.1. Results of the Production of 1 m3 of Concrete from the Samples
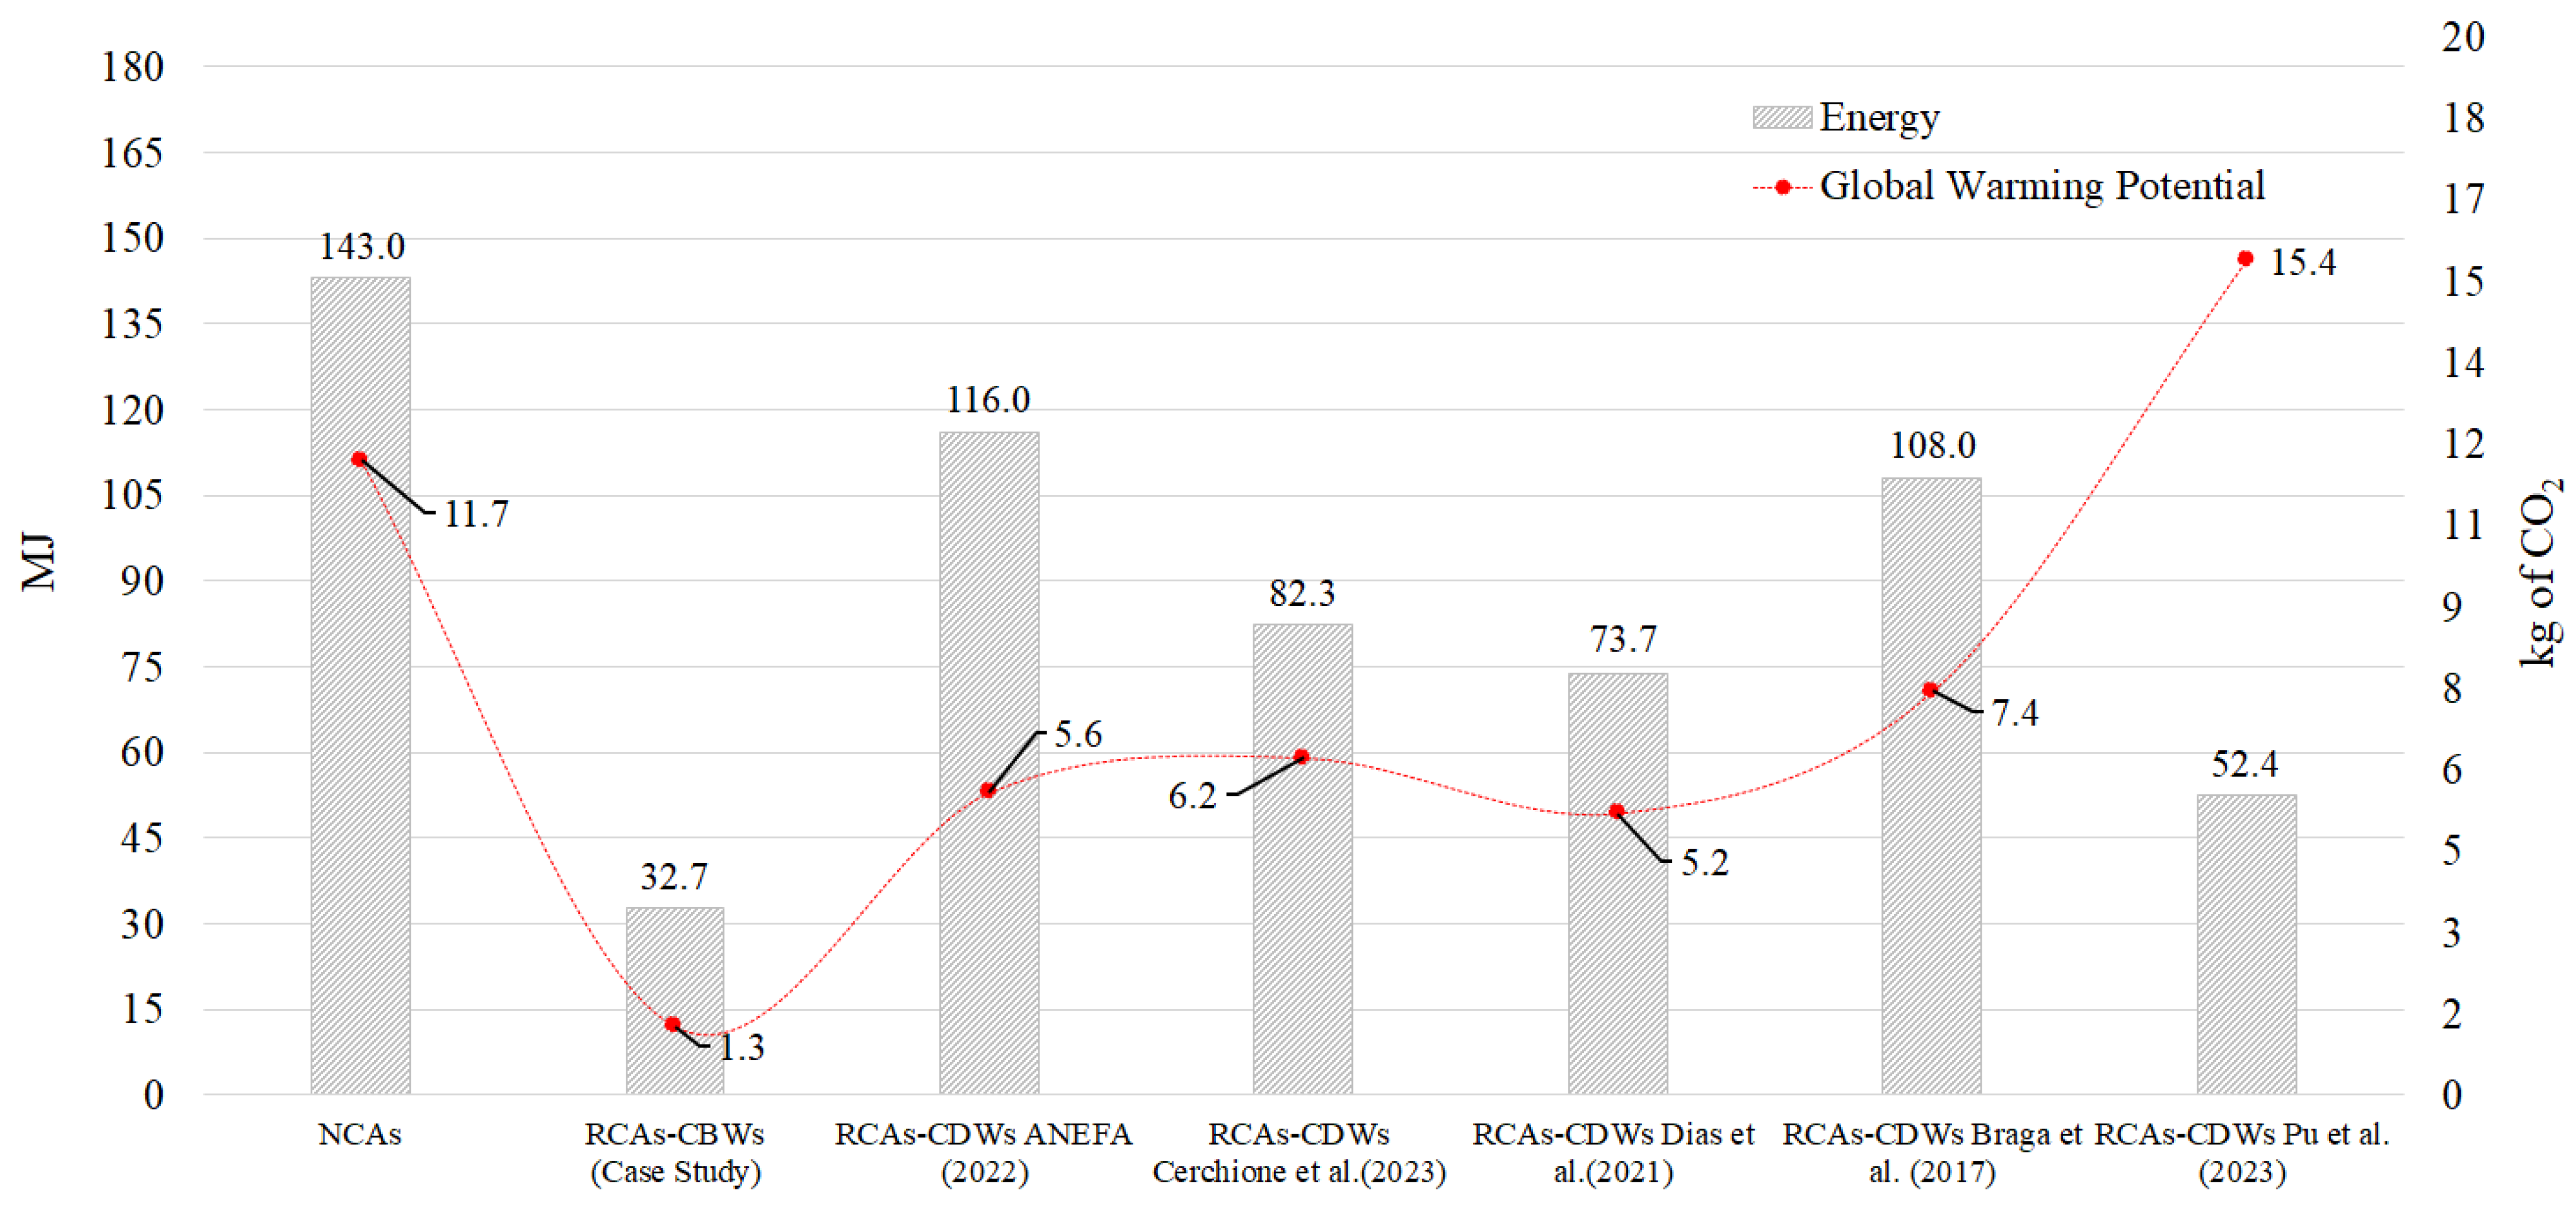
4.2. Results for the Production of 1 Tonne of RCAs
4.3. Economic Results
5. Conclusions
Author Contributions
Funding
Institutional Review Board Statement
Informed Consent Statement
Data Availability Statement
Acknowledgments
Conflicts of Interest
References
- Ricciotti, L.; Occhicone, A.; Ferone, C.; Cioffi, R.; Roviello, G. Eco-design of geopolymer-based materials recycling porcelain stoneware wastes: A life cycle assessment study. Environ. Dev. Sustain. 2024, 26, 4055–4074. [Google Scholar] [CrossRef]
- Código Estructural. Minsiterio de Transportes, Movilidad y Agenda Urbana. Available online: https://www.codigotecnico.org/DocumentosCTE/SeguridadEstructural.html (accessed on 18 January 2024).
- Ferreiro-Cabello, J.; Fraile-Garcia, E.; Pernia-Espinoza, A.; Martinez-de-Pison, F.J. Strength Performance of different mortars dopes using olive stones as lightweight aggregate. Buildings 2022, 12, 1668. [Google Scholar] [CrossRef]
- Sodupe-Ortega, E.; Fraile-Garcia, E.; Ferreiro-Cabello, J.; Sanz-Garcia, A. Evaluation of crumb rubber as aggregate for automated manufacturing of rubberized long hollow blocks and bricks. Constr. Build. Mater. 2016, 106, 305–316. [Google Scholar] [CrossRef]
- Los Santos-Ortega, J.; Fraile-García, E.; Ferreiro-Cabello, J.; González-González, C. Mechanical and Environmental Assessment of Lathe Waste as an Addiction to Concrete Compared to the Use of Commercial Fibres. Materials 2023, 16, 5740. [Google Scholar] [CrossRef]
- Chen, J.; Yu, J.; Nong, Y.; Yang, Y.; Zhang, H.; Tang, Y. Beyond time: Enhancing corrosion resistance of geopolymer concrete and BFRP bars in seawater. Comps. Struct. 2023, 322, 117439. [Google Scholar] [CrossRef]
- Tang, Y.; Wang, Y.; Wu, D.; Liu, Z.; Zhang, H.; Zhu, M.; Chen, Z.; Sun, J.; Wang, X. An experimental investigation and machine learning-based prediction for seismic performance of steel tubular column filled with recycled aggregate concrete. Adv. Mater. Sci. 2022, 61, 849–872. [Google Scholar] [CrossRef]
- Gayarre, F.L.; Pérez, J.G.; Pérez, C.L.C.; López, M.S.; Martínez, A.L. Life cycle assessment for concrete kerbs manufactured with recycled aggregates. J. Clean. Prod. 2016, 113, 41–53. [Google Scholar] [CrossRef]
- Iodice, S.; Garbarino, E.; Cerreta, M.; Tonini, D. Sustainability assessment of Construction and Demolition Waste management applied to an Italian case. Waste Manag. 2021, 128, 83–98. [Google Scholar] [CrossRef]
- Ruiz, L.A.L.; Ramon, X.R.; Mercedes, C.M.L.; Domingo, S.G. Multicriteria analysis of the environmental and economic performance of circularity strategies for concrete waste recycling in Spain. Waste Manag. 2022, 144, 387–400. [Google Scholar] [CrossRef]
- Blengini, G.A.; Garbarino, E. Resources and waste management in Turin (Italy): The role of recycled aggregates in the sustainable supply mix. J. Clean. Prod. 2010, 18, 10–11. [Google Scholar] [CrossRef]
- Borghi, G.; Pantini, S.; Rigamont, L. Life cycle assessment of non-hazardous Construction and Demolition Waste (CDW) management in Lombardy Region (Italy). J. Clean. Prod. 2018, 184, 815–825. [Google Scholar] [CrossRef]
- Cerchione, R.; Colangelo, F.; Farina, I.; Ghisellini, P.; Passaro, R.; Ulgiati, S. Life Cycle Assessment of Concrete Production within a Circular Economy Perspective. Sustainability 2023, 15, 11469. [Google Scholar] [CrossRef]
- Pu, Y.; Li, L.; Shi, X.; Wang, Q.; Abomohra, A. A comparative life cycle assessment on recycled concrete aggregates modified by accelerated carbonation treatment and traditional methods. Waste Manag. 2023, 172, 235–244. [Google Scholar] [CrossRef] [PubMed]
- Los Santos-Ortega, J.; Fraile-García, E.; Ferreiro-Cabello, J. Methodology for the environmental analysis of mortar doped with crumb rubber from end-of-life tires. Constr. Build. Mater. 2023, 399, 132519. [Google Scholar] [CrossRef]
- Fraile-Garcia, E.; Ferreiro-Cabello, J.; López-Ochoa, L.M.; López-González, L.M. Study of the Technical Feasibility of Increasing the Amount of Recycled Concrete Waste Used in Ready-Mix Concrete Production. Materials 2017, 10, 817. [Google Scholar] [CrossRef] [PubMed]
- Asociación Nacional de Empresarios Fabricantes de Áridos (ANEFA). Áridos Sostenibles. Indicadores Sectoriales. Available online: https://aridos.info/wp-content/uploads/2022/05/InformeAmbiental.pdf (accessed on 20 November 2023).
- Cuesta, V.R.; López, V.O.; Skaf, M.; Fiol, F.; Manso, J.M. Why is the effect of recycled concrete aggregate on the compressive strength of self-compacting concrete not homogeneous? A bibliographic review. Inf. Constr. 2022, 74, e435. [Google Scholar] [CrossRef]
- Trinchese, G.; Verniero, A.; Osa, G.G.L. New recycling technologies of demolished materials for sustainabe finishes: The project of concrete reuse on site in Tres Cantos, Madrid. VITRUVIO-Int. J. Archit. Technol. Sustain. 2022, 7, 100–111. [Google Scholar]
- UNE-EN 197-1:2011; Cement. Part I. iTeh Standards: Etobicoke, ON, Canada, 2011. Available online: https://tienda.aenor.com/norma-une-en-197-1-2011-n0048623?_gl=1*shrbx3*_up*MQ..&gclid=EAIaIQobChMIm5Sq78q_-wIVQ8TVCh00NQohEAAYASAAEgJP-_D_BwE&gclsrc=aw.ds (accessed on 21 November 2023).
- UNE-EN ISO 14040; Environmental Management—Life Cycle Assessment—Principles and Framework. International Organization for Standardization: Geneva, Switzerland, 2006. Available online: https://www.une.org/encuentra-tu-norma/busca-tu-norma/norma?c=N0038060 (accessed on 8 December 2023).
- UNE-EN ISO 14044; Environmental Management—Life Cycle Assessment—Requirements and Guidelines. International Organization for Standardization: Geneva, Switzerland, 2006. Available online: https://www.une.org/encuentra-tu-norma/busca-tu-norma/norma?c=norma-une-en-iso-14044-2006-a1-2018-n0060852 (accessed on 8 December 2023).
- Pesta, J.; Pavlu, T.; Koci, V. Life Cycle Assessment of Recycling Processes for Demolition Waste. In IOP Conference Series: Earth and Environmental Sciences (EES) Provides a Fast, Versatile and Cost-Effective Proceedings Publication Service; IOP Publishing: Bristol, UK, 2019. [Google Scholar]
- Dias, A.B.; Pacheco, J.N.; Silvestre, J.D.; Martins, I.M.; de Brito, J. Environmental and economic life cycle assessment of recycled coarse aggregates: A Portuguese case study. Materials 2021, 14, 5452. [Google Scholar] [CrossRef]
- Colangelo, F.; Forcina, A.; Farina, I.; Petrillo, A. Life Cycle Assessment (LCA) of different kinds of concrete containing waste for sustainable construction. Buildings 2018, 8, 70. [Google Scholar] [CrossRef]
- Colangelo, F.; Navarro, T.G.; Farina, I.; Petrillo, A. Comparative LCA of concrete with recycled aggregates: A circular economy mindset in Europe. Int. J. Life Cycle Assess. 2020, 25, 1790–1804. [Google Scholar] [CrossRef]
- Atta, I.; Bakhoum, E.S. Environmental feasibility of recycling construction and demolition waste. Int. J. Environ. Sci. Technol. 2023, 21, 2675–2694. [Google Scholar] [CrossRef]
- Dias, A. Environmental and Economic Comparison of Natural and Recycled Aggregates Using LCA. Recycling 2022, 7, 43. [Google Scholar] [CrossRef]
- Braga, A.M.; Silvestre, J.D.; Brito, J. Compared environmental and economic impact from cradle to gate of concrete with natural and recycled coarse aggregates. J. Clean. Prod. 2017, 162, 529–543. [Google Scholar] [CrossRef]
- Ecoinvent v3.0. Available online: https://ecoinvent.org (accessed on 4 December 2023).
- European Platform on Life Cycle Assessment-European Commission. Available online: https://data.jrc.ec.europa.eu/collection/EPLCA (accessed on 30 June 2023).
- Emisiones de los Vehículos Pesados (Euro VI). Available online: https://eur-lex.europa.eu/ES/legal-content/summary/emissions-from-heavy-duty-vehicles-euro-vi-certification-rules.html (accessed on 19 June 2023).
- Fraga, J.M.; Gochi, A.D.C.; López, M.P.D.L.C. Sostenibilidad en la preparación y puesta en obra de hormigón en España: Análisis de consumo energético y emisiones de CO2. In Proceedings of the 18th International Congress on Project Management and Engineering, Alcañiz, Spain, 16–18 July 2014. [Google Scholar]


| Material | Designation Substitution Percentage | H-0 | H-15 | H-20 | H-30 | H-50 |
|---|---|---|---|---|---|---|
| 0% | 15% | 20% | 30% | 50% | ||
| Cement | CEM I-32.5R (kg) | 300 | ||||
| Natural Fine Aggregates | FA-0/6-T-S-L (kg) | 833.3 | ||||
| Natural Coarse Aggregates | CA-6/12-T-S-L (kg) | 400 | ||||
| CA-12/20-T-R (kg) | 600 | 510 | 480 | 420 | 300 | |
| RCAs | CA-12/20-T-R (kg) | - | 90 | 120 | 180 | 300 |
| Water | Water (kg) | 163 | ||||
| Material | Unit | H-0 | H-15 | H-20 | H-30 | H-50 | SimaPro Process |
|---|---|---|---|---|---|---|---|
| Cement | kg | 300 | Portland cement (CEM I), CEMBUREAU technology mix, CEMBUREAU production mix, at plant. (ELCD) | ||||
| Fine Aggregates 0/6 | kg | 833.3 | Sand {RoW} market for sand|Cut-off, U. (Ecoinvent v.3) | ||||
| Coarse Aggregates 6/12 | kg | 400 | Gravel, crushed {RoW} market for gravel, crushed|Cut-off, U. (Ecoinvent v.3) | ||||
| Coarse Aggregates 12/20 | kg | 600 | 510 | 480 | 420 | 300 | |
| RCA-CBWs 12/20 | kg | - | 90 | 120 | 180 | 300 | CBWs Recycling Process |
| Water | kg | 163 | Tap water {RER} market group for|Cut-off, U. (Ecoinvent v.3) | ||||
| Material | Unit | Amount | SimaPro Process |
|---|---|---|---|
| Diesel Fuel | L | 0.334 | Diesel {RER} market group for|Cut-off, U |
| Combustion Diesel Shredder | kWh | 3.715 | Diesel, burned in building machine {GLO}|Cut-off, U |
| Steel Shredder | t | 6.9·10−6 | Steel, low alloyed {GLO} market for|Cut-off, U |
| Material | Unit | Amount | SimaPro Process |
|---|---|---|---|
| Diesel Fuel | L | 0.89 | Diesel {RER} market group for|Cut-off, U |
| Combustion Diesel Fuel | kWh | 9.75 | Diesel, burned in building machine {GLO}| Cut-off, U |
| Electricity | kWh | 2.22 | Electricity, medium voltage {ES} market for|Cut-off, U |
| Transport | mt·km | 22.68 | Transport, freight, lorry >32 metric ton, EURO 6 {RER}|Cut-off, U |
| Water | m3 | 0.05 | Tap water {RER} market group for|Cut-off, U |
| Tires | t | 2.2168·10−5 | Waste, pneumatic tyres {GLO} market for waste, pneumatic tyres|Cut-off, U |
| Screening mesh | t | 2.40828·10−6 | Steel, low alloyed {GLO} market for|Cut-off, U |
| Rollers | t | 4.49246·10−6 |
| Research | Transport Distance of CDWs |
|---|---|
| Cerchione et al. (2023) [13] | 30.0 km |
| Pu et al. (2023) [14] | 20.0 km |
| López Ruiz et al. (2022) [10] | 18.0 km |
| Colangelo et al. (2020) [26] | 30.0 km |
| Gayarre et al. (2016) [8] | 40.0 km |
| Impact Categories | Unit |
|---|---|
| Acidification | kg SO2 eq |
| Eutrophication | kg PO4 eq |
| Global Warming Potential (GWP) | kg CO2 eq |
| Photochemical Oxidation | kg NMVOC |
| Abiotic Depletion Elements | kg Sb eq |
| Abiotic Depletion of Fossil Fuels (ADFF) | MJ |
| Water Scarcity | m3 |
| Ozone Layer Depletion | kg CFC-11 eq |
| Material | Case Study | López Ruiz et al. (2022) [10] | Braga et al. (2017) [29] | Dias et al. (2021) [24] |
|---|---|---|---|---|
| Cement | 103 (€/t) | 99.37 (€/t) | 90 (€/t) | - |
| Fine Aggregates | 9.50 (€/t) | 17.46 (€/t) | 4.15 (€/t) | 4.60 (€/t) |
| Coarse Aggregates | 18.37 (€/t) | 4.59 (€/t) | ||
| RCAs | 8.90 (€/t) | 11.00 (€/t) | 2.00 (€/t) | 2.00 (€/t) |
| Water | 0.02 (€/m3) | 1.60 (€/m3) | 1.53 (€/m3) | - |
| Mixing of materials | 0.12 (€/m3) | 11.40 (€/m3) | - | - |
Disclaimer/Publisher’s Note: The statements, opinions and data contained in all publications are solely those of the individual author(s) and contributor(s) and not of MDPI and/or the editor(s). MDPI and/or the editor(s) disclaim responsibility for any injury to people or property resulting from any ideas, methods, instructions or products referred to in the content. |
© 2024 by the authors. Licensee MDPI, Basel, Switzerland. This article is an open access article distributed under the terms and conditions of the Creative Commons Attribution (CC BY) license (https://creativecommons.org/licenses/by/4.0/).
Share and Cite
Los Santos-Ortega, J.; Fraile-García, E.; Ferreiro-Cabello, J. Environmental and Economic Viability of Using Concrete Block Wastes from a Concrete Production Plant as Recycled Coarse Aggregates. Materials 2024, 17, 1560. https://doi.org/10.3390/ma17071560
Los Santos-Ortega J, Fraile-García E, Ferreiro-Cabello J. Environmental and Economic Viability of Using Concrete Block Wastes from a Concrete Production Plant as Recycled Coarse Aggregates. Materials. 2024; 17(7):1560. https://doi.org/10.3390/ma17071560
Chicago/Turabian StyleLos Santos-Ortega, Jorge, Esteban Fraile-García, and Javier Ferreiro-Cabello. 2024. "Environmental and Economic Viability of Using Concrete Block Wastes from a Concrete Production Plant as Recycled Coarse Aggregates" Materials 17, no. 7: 1560. https://doi.org/10.3390/ma17071560
APA StyleLos Santos-Ortega, J., Fraile-García, E., & Ferreiro-Cabello, J. (2024). Environmental and Economic Viability of Using Concrete Block Wastes from a Concrete Production Plant as Recycled Coarse Aggregates. Materials, 17(7), 1560. https://doi.org/10.3390/ma17071560