Article

Luminescence Properties of an Orthorhombic KLaF4 Phosphor Doped with Pr3+ Ions under Vacuum Ultraviolet and Visible Excitation

by
Patrycja Zdeb
,
Nadiia Rebrova
,
Radosław Lisiecki
and
Przemysław Jacek Dereń
*
Institute of Low Temperature and Structure Research, Polish Academy of Science, Okólna Street 2, 50-422 Wrocław, Poland
*
Author to whom correspondence should be addressed.
Materials 2024, 17(6), 1410; https://doi.org/10.3390/ma17061410
Submission received: 20 February 2024 / Revised: 8 March 2024 / Accepted: 10 March 2024 / Published: 19 March 2024

Abstract

:
Fluorides have a wide bandgap and therefore, when doped with the appropriate ions, exhibit emissions in the ultraviolet C (UVC) region. Some of them can emit two photons in the visible region for one excitation photon, having a quantum efficiency greater than 100%. In a novel exploration, praseodymium (Pr3+) ions were introduced into KLaF4 crystals for the first time. The samples were obtained according to a high-temperature solid-state reaction. They exhibited an orthorhombic crystal structure, which has not been observed for this lattice yet. The optical properties of the material were investigated in the ultraviolet (UV) and visible ranges. The spectroscopic results were used to analyze the Pr3+ electronic-level structure, including the 4f5d configuration. It has been found that KLaF4:Pr3+ crystals exhibit intense luminescence in the UVC range, corresponding to multiple 4f → 4f transitions. Additionally, under vacuum ultraviolet (VUV) excitation, distinct transitions, specifically 1S01I6 and 3P03H4, were observed, which signifies the occurrence of photon cascade emission (PCE). The thermal behavior of the luminescence and the thermometric performance of the material were also analyzed. This study not only sheds light on the optical behavior of Pr3+ ions within a KLaF4 lattice but also highlights its potential for efficient photon management and quantum-based technologies.

Graphical Abstract

1. Introduction

In recent years, the exploration of rare-earth-doped crystals has significantly advanced the realm of photonics and optical technologies. Praseodymium (Pr), a member of the lanthanide series, intrigues researchers with its distinctive spectroscopic properties despite possessing only two 4f electrons. Notably, phosphors activated by Pr3+ ions have undergone extensive investigation across diverse fields, such as light sources [1,2,3], optical thermometry [4,5,6], laser technologies [7,8], glass filters [9,10] and bioimaging [11]. The optical properties of these kinds of materials in the UV range are particularly interesting because they can be modulated by changing the crystallographic surroundings of the activator ion. This is possible due to their 4f5d levels, which have an energy of about 61,580 cm−1 [12] in free Pr3+ ions. However, upon doping into crystals, these levels are split and shifted towards lower energies. This red shift significantly depends on the crystal structure type and the material composition hosting the Pr3+ ions. Consequently, under excitation using UV light, three distinct scenarios emerge [13]:
  • If E(4f5d) < E(1S0), only interconfigurational 4f5d → 4f transitions are observed;
  • If E(4f5d) >> E(1S0), nonradiative relaxation between these two levels occurs, and only 4f → 4f transitions are observed;
  • If E(4f5d) ≥ E(1S0), both 4f5d → 4f and 4f → 4f transitions take place.
The influence of the crystal field on Pr3+ 4f5d level positions has been studied by several researchers, including Dorenbos [12,14,15,16,17] and Srivastava [13].
The process observed in the second case is known as ‘photon cascade emission’ (PCE) or ‘quantum cutting’ (QC). In this phenomenon, the absorption of one high-energy photon is followed by a two-step emission process that generates two photons. As a consequence, a quantum efficiency higher than 100% is possible to obtain. PCE was initially observed independently by Sommerdijk et al. [18] and Piper et al. [19] in 1974, marking a groundbreaking discovery. Since then, phosphors exhibiting PCE have gained a lot of attention due to their possible application in lamps based on Xe discharge, competitive with Hg-discharge-based lamps [20]. In Pr3+-doped materials, PCE is observed as two characteristic transitions, 1S01I6 (around 400 nm) and 3P03H4 (around 480 nm), which can be detected after excitation to the 4f5d level. Because E(4f5d) > E(1S0) is the crucial condition for PCE occurrence, this process is highly dependent on the type of crystal lattice. Thus, photon cascade emission was reported for limited types of hosts, including fluorides and oxides such as YF3 [21], KMgF3 [22], LiSrAlF6 [23], SrAl12O19 [24], and LaMgB5O10 [25].
Crystals represented by the formula ALnF4 (A = Li+, Na+, K+, Ln = Y3+, La3+, Lu3+) have been studied as a promising host for RE3+ ions due to their low phonon energies, high optical transparency in the UV-visible range, and good chemical and photochemical stability. Among these fluorides, some doped with Pr3+ ions have exhibited noteworthy characteristics. For instance, LiLuF4:Pr3+ and LiYF4:Pr3+ show intense UVC luminescence, attributed to interconfigurational 4f5d → 4f transitions, while others like NaYF4:Pr3+ and KYF4:Pr3+ demonstrate luminescence due to the PCE process [26]. It is worth noting that KLaF4 crystals stand out due to their exceptionally low phonon energy (262 cm−1) [27], positioning them as ideal hosts for highly efficient upconverters and downconverters [28]. Because of their great mono dispersion, long luminescence lifetime, and high up- or downconversion efficiency, they may have versatile and promising applications as luminescent nano-biolabels. Recent work by Deo et al. reported KLaF4 nanoparticles co-doped with Eu3+, Er3+, and Yb3+ ions, allowing simultaneous excitation in the visible and NIR regions, resulting in upconversion and downconversion emissions concurrently [29]. This dual-mode approach presents valuable applications in bioimaging or information encryption. Additionally, Nd3+-doped KLaF4 nanoparticle colloidal solutions were proposed as NIR high-power liquid laser materials and amplifiers [30]. Despite extensive studies on KLaF4, the incorporation of Pr3+ ions into this fluoride matrix remains unexplored. Consequently, the optical properties of KLaF4:Pr3+ are still unknown.
In this work, KLaF4 powders doped with Pr3+ ions were synthesized for the first time. To prepare this material, a high-temperature solid-state reaction was applied, leading to an orthorhombic structure. To the best of our knowledge, KLaF4 crystals with this type of space group have not been reported yet since this fluoride usually crystallizes in the cubic or hexagonal phase [27]. Furthermore, we studied the optical properties of KLaF4 doped with different concentrations of Pr3+ ions at room and low temperatures, as well as the temperature dependence of luminescence and thermometric performance. A special focus was put on spectroscopic measurements in the deep UV range, which revealed the great potential of this system as a photon cascade emitter.

2. Materials and Methods

Nanoparticles KLaF4:x% mol Pr3+, x = 0.1, 0.5, 1, 1.5, 2 (or KLa1−xPrxF4, x = 0.001, 0.005, 0.01, 0.015, 0.02) were prepared via high-temperature solid-state reactions. The raw materials LaF3 (99.99%), KF (99.9%), and PrF3 (99.99%) were mixed and carefully ground in an agate mortar for 15 min. The powders were sintered at 680 °C for 8 h in a reducing atmosphere at a gas flow rate of 10 l/h (N2 = 95%, H2 = 5%).
To obtain X-ray powder diffraction (XRPD) patterns, a Panalytical X’Pert PRO powder diffractometer with a copper Kα radiation source (λ = 1.54056 Å) was used. The morphology, composition, and mapping of the samples were investigated using an FE-SEM FEI Nova NanoSEM 230 (FEI Company, a part of Thermo Fisher Scientific, Waltham, MA, USA) equipped with an energy-dispersive X-ray spectrometer, the EDAX Genesis XM4. The SEM images were recorded at 5.0 kV in beam deceleration mode, which improves imaging parameters such as the resolution and contrast. In the case of the SEM-EDX measurements, a large area (250 μm × 200 μm) of the samples was scanned at 20 kV. The powder samples were included in the carbon resin (PolyFast Struers, Ballerup, Denmark) and then pressed using an automatic mounting press CitoPress-1 (Struers, Ballerup, Denmark) in order to obtain a large and flat area. Signals from three randomly selected areas were collected to ensure satisfactory statistical averaging. The particle size distribution histogram was calculated using ImageJ v1.53k software by collecting the size of 109 particles.
To examine the excitation and emission spectra in the UVC range, a VUV McPherson spectrometer equipped with a water-cooled deuterium lamp and a Hamamatsu photomultiplier R955P was utilized. An FLS1000 fluorescence spectrometer from Edinburgh Instruments, equipped with a xenon lamp, was employed for the excitation and emission spectra, as well as the decay profiles in the visible range. The same spectrometer connected to the Linkam THMS 600 Heating/Freezing Stage was used to perform temperature-dependent measurements.

3. Results and Discussion
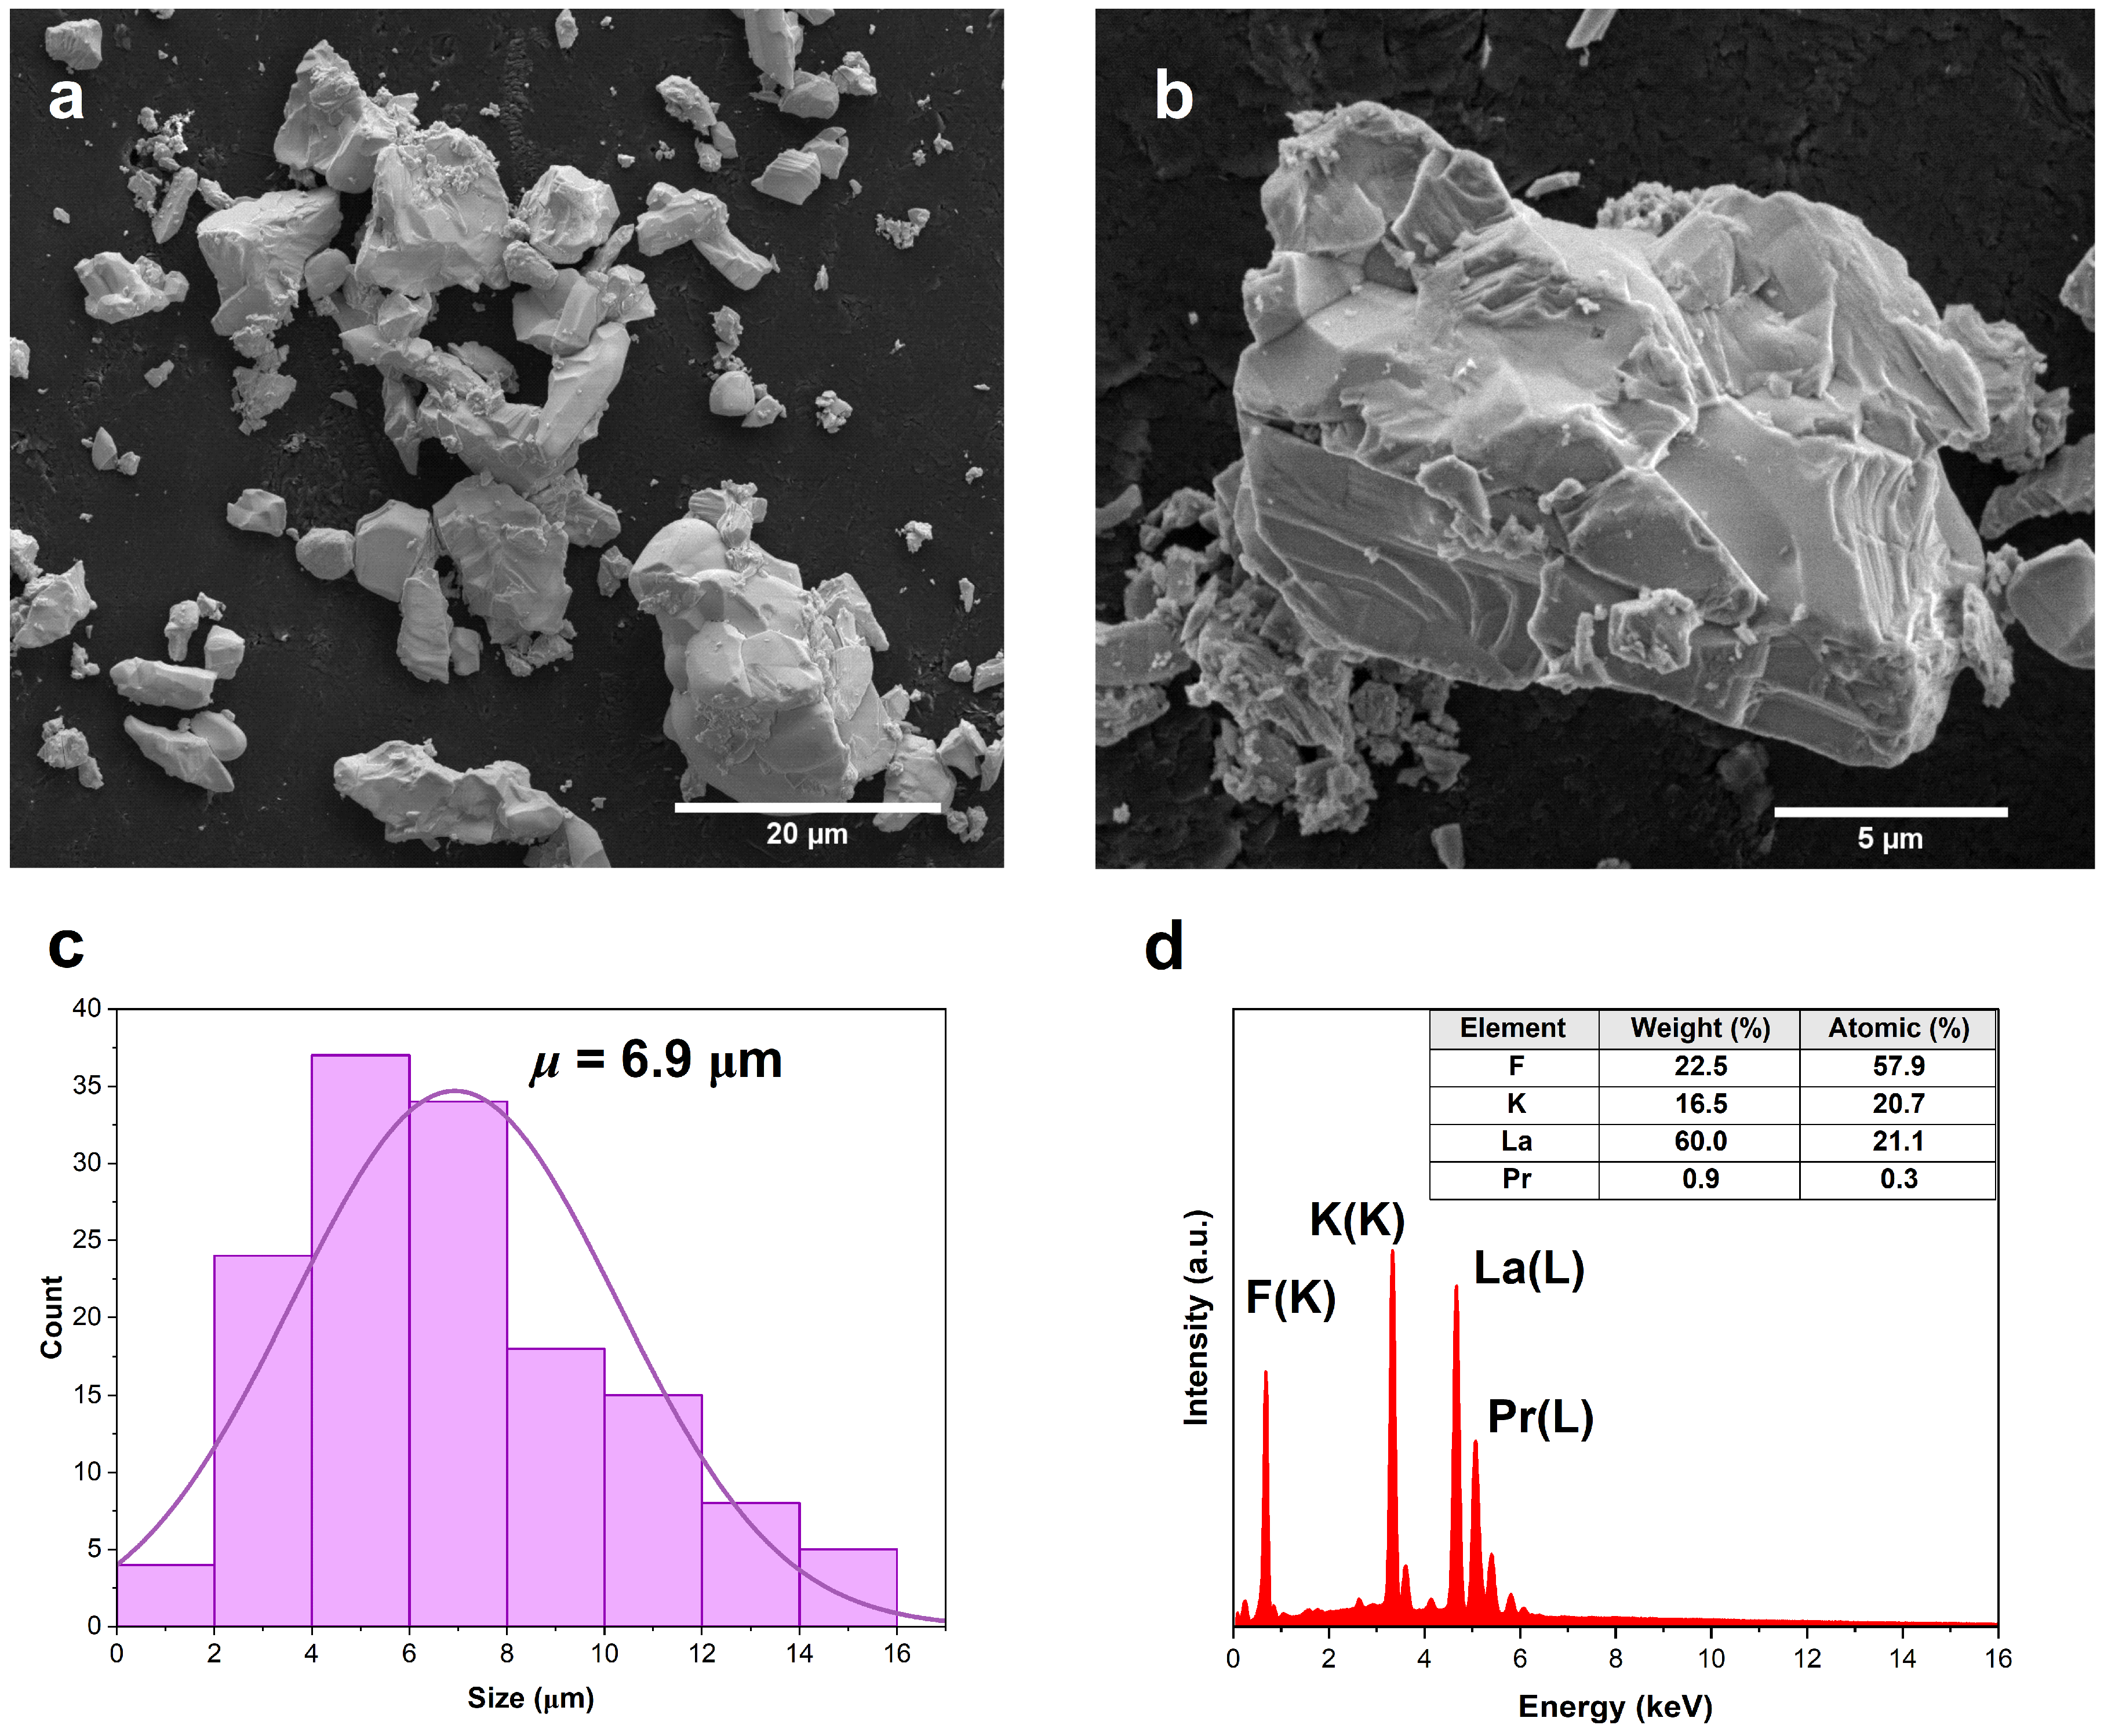
3.1. Structure

The structure of the KLaF4 crystals has been studied and described in numerous papers [28,31,32,33]; however, only cubic and hexagonal types of lattices have been reported. In this work, new orthorhombically ordered microcrystals were synthesized via a high-temperature solid-state reaction. Figure 1a shows the XRPD spectra of pure and Pr3+-doped KLaF4. The XRPD patterns were indexed similarly to the orthorhombic structure of KCeF4 (SG: Pnma; ICSD file No. 23229 [34]), and no peaks corresponding to any other phase were observed. In this lattice, La3+ ions are coordinated by nine fluorine atoms, forming a so-called tricapped triangular prism (Figure 1b). The unit cell parameters of KLaF4:Pr3+ are provided in Table S1. Notably, the lattice parameters and unit cell volume decrease with an increase in the activator concentration due to the smaller radius of Pr3+ ions (1.179 Å for CN = 9) compared to that of La3+ ions (1.216 Å for CN = 9) [35].
Figure 2a,b present SEM images of the KLaF4 grains at two different scales. The synthesized particles have an agglomerated, non-uniform shape with sharp edges. Based on the size distribution histogram (Figure 2c), the mean size of the grains was estimated to be 6.9 μm. The observed particle size and morphology are characteristic of the solid-state method of synthesis, and similar results were also obtained for LuPO4 powders prepared using the same synthesis method [36]. Figure 2d shows the energy-dispersive spectroscopy (EDS) spectrum for a KLaF4:1.5%Pr3+ sample. Emission peaks were observed at 0.8 and 4.7 keV for lanthanum, 3.3 keV for potassium, 0.7 keV for fluorine, and 5.1 eV for praseodymium. The inset in Figure 2d displays the weight and atomic percentages of the elements. The atomic percentage corresponds to the ratio of the stoichiometric value of the element in the formula to the sum of the stoichiometric values of all the elements, which confirms that the KLaF4 crystals were obtained with a new crystallographic structure. Furthermore, EDS mapping analysis confirmed the homogeneous distribution of the K, La, F, and Pr elements (refer to Figure S1 in the Supplementary Materials).

3.2. Optical Properties

3.2.1. VUV Excitation

Figure 3a presents the excitation spectrum of the KLaF4:1%Pr3+ powder monitored at 272 nm. To describe all the observed transitions, the experimental data were deconvoluted into five Gaussian-like components (blue solid lines in Figure 3), which can correspond to the transition from the 3H4 ground state of Pr3+ ions to higher-energy-lying 5d levels. The energies and Full Width at Half Maximum (FWHM) values of the detected bands are detailed in Table S2. The broad band, commencing around 71,000 cm−1, could be associated with host absorption, though other potential origins cannot be excluded. Further detailed research is necessary to confirm the assignment of this band.
The 5d-level positions of the lanthanide ions are influenced by factors such as centroid shift (εc), crystal field splitting (εcfs), and redshift (D(A)) [14]. Dorenbos investigated these parameters across various crystalline lattices, including fluorides [14], chlorides [15], oxides [16], and aluminates [17].
The centroid shift (εc) represents the energy difference between the average positions of the 5d levels in a free RE3+ ion and within a crystalline host. The εc value is influenced by the coordinating ligand and is the smallest for fluoride matrices according to the nephelauxetic series:
F < Cl < Br < I < O2− < S2−.
Crystal field splitting (εcfs) is the energy difference between the lowest and highest 5d components. It tends to increase with a decreasing coordination number. In the orthorhombic KLaF4 lattice, La3+ ions are coordinated by nine fluorine anions, resulting in small εcfs (11,592 cm−1). Both εc and εcfs contribute to the redshift (D(A)) of the first allowed 4f → 5d transition in host A. This redshift can be expressed as:
D A = E 5 d f r e e E 5 d A ,
where E5d(free) is the position of the lowest 5d level of RE3+ as a free ion (for Pr3+, E5d(free) = 61,580 cm−1) and E5d(A) is the energy of the lowest 5d level for RE3+ ions doped into compound A (E5d(KLaF4) = 52,880 cm−1). For Pr3+ in KLaF4, D(KLaF4) is calculated as 8700 cm−1, aligning with the data for other fluoride crystals [12]. Although the values of εc, εcfs, and D(A) reported in Refs. [12,14,15,16,17] were calculated for Ce3+ ions, Dorenbos suggests these parameters are similar for all Ln3+ ions when doped in the same host compound [37].
Considering the influence of the crystalline environment on the position of the Pr3+ 5d levels, fluoride matrices emerge as suitable candidates for the PCE process due to the relatively high energy of the lowest 5d level. Since the first allowed 4f → 5d transition in KLaF4:Pr3+ has an energy of 52,880 cm−1, the lowest 5d level must be located above the 1S0 (E(1S0) ≈ 47,000 cm−1) [38]. Figure 3b depicts the emission spectrum of KLaF4:1%Pr3+ recorded under 160 nm excitation. Seven bands were observed at 216, 237, 252, 272, 338, 405, and 484 nm. They all exhibit significantly smaller FWHM values, as indicated in Table S2, in comparison to the bands observed in the excitation spectrum. This implies that they align with 4f → 4f transitions. The first six bands can be assigned to transitions from the 1S0 level to the 3H4, 3H6, 3F3, 1G4, 1D2, and 1I6 states, respectively, while the last band is considered to be 3P03H4. The experimental branching ratios (βex) of the transitions from the 1S0 level were calculated as the ratio between the area under the specific peak and the area of the spectrum in the 22,500–55,000 cm−1 range. The obtained results are listed in Table S2. It could be noted that the highest values were observed for the 1S01G4 and 1S01I6 transitions due to their spin-allowed character. According to Kück [39], the typical branching ratio of 1S01I6 transitions varies from 60 to 80% depending on the host type. Here, a βex (1S01I6) of 39.8% is much smaller than the expected value. This discrepancy is attributed to the significant influence of instrumental factors, such as the efficiency of the photomultiplier and the specifications of the diffraction grating, on the experimental branching ratio. The measured spectrum was corrected for both of these factors. However, even if correction is performed, the real relative intensities of the observed transitions can remain unknown.
A schematic illustration of the PCE process observed in KLaF4:Pr3+ under VUV excitation is presented in Figure 4. After the absorption of one 160 nm photon, Pr3+ ions are excited into a 4f5d configuration and then relax nonradiatively into the lower-lying 1S0 level. During radiative relaxation into the ground state, the emission of two photons occurs at 406 (1S01I6) and 484 nm (3P03H4). Because the lowest 5d level is located about 6000 cm−1 above 1S0, 5d → 4f transitions are not observed.

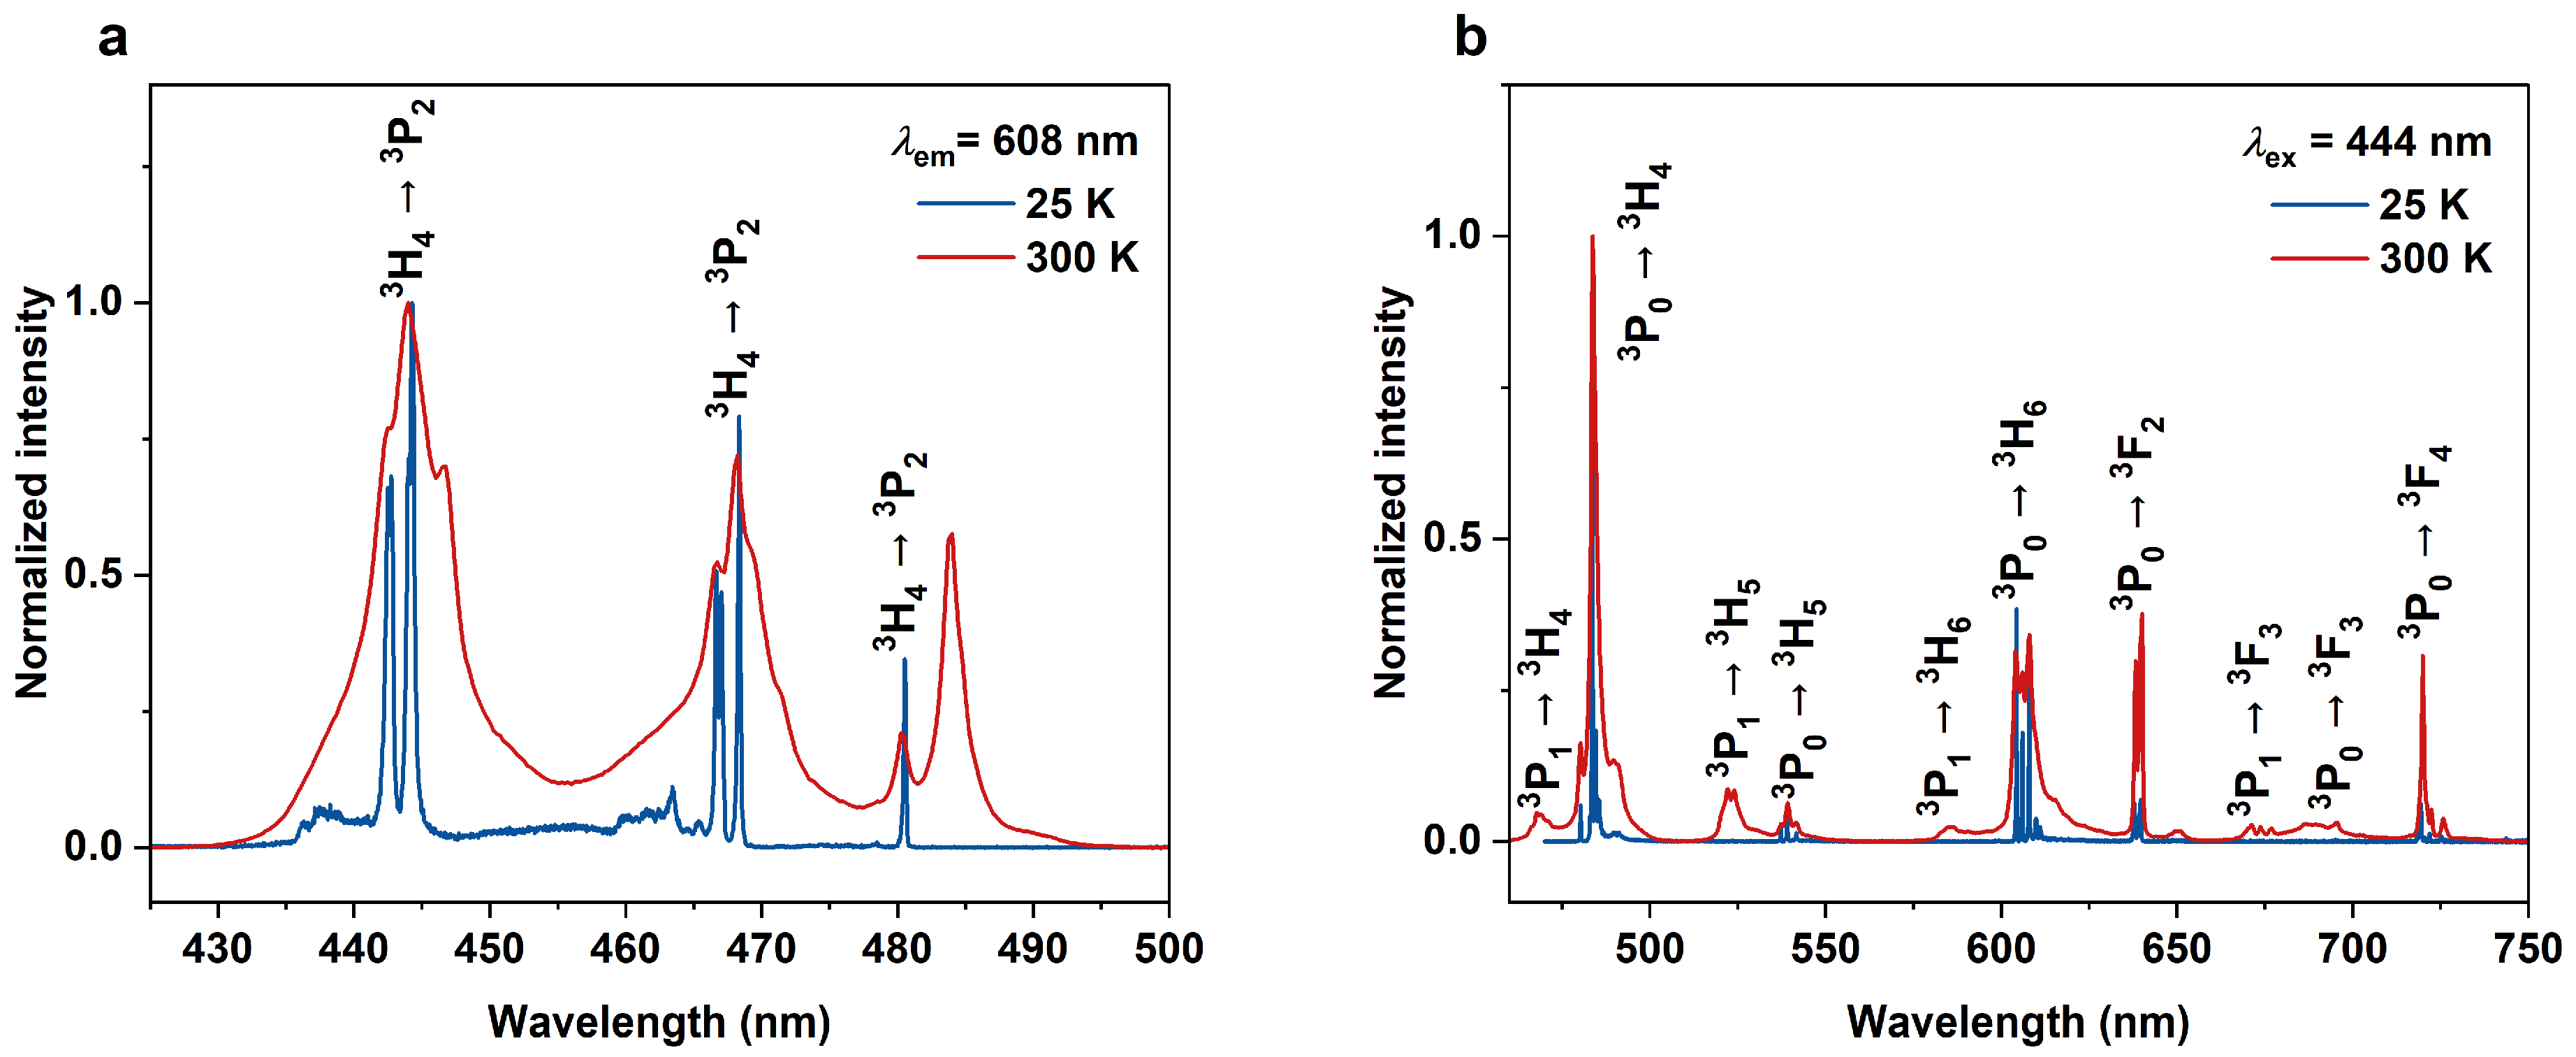
3.2.2. Visible Excitation

As KLaF4 crystals doped with Pr3+ ions are introduced in this paper for the first time, an exploration of their optical properties in the visible range was undertaken. Figure 5a presents the excitation spectrum of KLaF4:0.5%Pr3+ monitored at 608 nm. Three 4f → 4f transitions, 3H43P2, 3P1, and 3P0, were observed at 444, 468, and 480 nm, respectively. The band at 484 nm corresponds to the transition from the first excited Stark sublevel of the 3H4 state, which is thermally populated at room temperature. Upon exciting the sample with 444 nm light, emissions from the 3P1 and 3P0 levels were detected (Figure 5b). The most intense bands observed at 484, 608, 640, and 720 nm correspond to the spin-allowed transition from 3P0 to the 3H4, 3H6, 3F2, and 3F4 levels, respectively [42].
To investigate the influence of the dopant concentration, emission spectra were acquired under 444 nm excitation for samples with varying Pr3+ ion concentrations but under the same measurement conditions (Figure S2). The highest relative intensity of visible luminescence was obtained for the sample doped with a 0.5% content (see inset in Figure 5b). For a higher Pr3+ content, concentration quenching of the luminescence occurs. The process responsible for concentration quenching is cross-relaxation (CR), which depends on the distance between the ions involved in these phenomena. As the concentration increases, the average distance between the activator ions is shortened, leading to a rise in the effectiveness of CR. The two main CR processes responsible for quenching the Pr3+ luminescence can be described using the following equations:
{3P0, 3H4} → {1D2, 3H6}
{20,809; 186} → {16,775; 4275} − 55 [cm−1]
{1D2, 3H4} → {1G4, 3F3, 4}.
{16,775; 0} → {9694; 6969} + 112 [cm−1]
The energies of the Stark levels used in Equations (2) and (3) were obtained from Table S3. Following the cross-relaxation (CR) process, there is a slight energy mismatch (as is evident in Equations (2) and (3)), which can be easily compensated by the host phonon energies. Consequently, it can be assumed that both processes are practically resonant at room temperature.
Moreover, concentration quenching significantly influences the lifetime of the emitting levels. Figure 5c,d show the emission decay curves of the 3P0 and 1D2 levels, respectively, measured for different activator ion contents. Only the sample with the lowest dopant concentration (0.1%) exhibited an exponential decay profile at both levels. When the concentration is increased, the decay patterns become increasingly non-exponential. To calculate the average observed decay time τOB, a bellowed equation was applied [43]:
τ O B = 0 t I t   d t / 0 I t   d t
where I(t) and I(0) indicate the luminescence intensity at time t and t = 0, respectively. The obtained results are listed in Table 1. The luminescence of both levels exhibits the longest decay time for the smallest concentration of Pr3+ ions (37 μs for 3P0 and 346 μs for 1D2). The lifetime of the 1D2-level emissions decreases more rapidly with the concentration of Pr3+ than that of the 3P0 level. In the CR described using Equation (2), spin-forbidden transitions are involved, while the one occurring from level 1D2 is spin-allowed, making it more efficient.
Since the observed luminescence decay is a result of the radiative and nonradiative relaxation paths, the observed transition rate (WOB) can be described as:
W O B = W R + W N R = 1 τ O B ,
where WR and WNR are the rates of the radiative and nonradiative transitions, respectively. There are two main processes involved in the nonradiative relaxation of ions: multiphonon relaxation (MNR) and CR. Due to the small phonon energies of KLaF4 and the large energy difference between the 3P0 and 1D2 (4034 cm−1) and 1D2 and 1G4 levels (7081 cm−1), the MNR process has a neglected influence on the 3P0 and 1D2 decay times. According to this, WNR is equal to WCR, which is the rate of the cross-relaxation processes:
W C R = 1 τ O B 1 τ R ,
where τR is the radiative decay time.
For the calculation of radiative lifetimes, the Judd–Ofelt theory proves invaluable. Independently proposed by Brian Judd [44] and George S. Ofelt [45] in 1962, this approach facilitates the determination of the Einstein coefficient AaJ,bJ for the spontaneous emission of electric dipole transitions, and subsequently the radiative lifetime τR = 1/AaJ,bJ, using the formula:
A a J , b J = 64 π 4 e 2 3 h 2 J + 1 1 λ 3 n n 2 + 2 2 9 S a J : b J .
Here e, h, λ, and n represent the electron charge, Planck’s constant, transition wavelength, and refractive index, respectively. J denotes the total angular momentum of the initial state, while S signifies the line strength of the electric dipole transition between the two J (spin–orbit) multiplets a and b.
The line strength within the Judd–Ofelt theory is expressed as follows:
S a J : b J = t = 2 ,   4 ,   6 Ω t a J U t b J 2
with summation over all the components 2J + 1. The a J U t b J terms represent the reduced-matrix elements of the matrix, wherein the transition values between each level of a rare-earth ion are calculated, independent of the surrounding environment. These were calculated and tabulated by Carnal [46]. Ωλ (λ = 2, 4, 6) are the phenomenological parameters linked to the host. These parameters are determined using fitting by comparing the experimental oscillator strengths measured for as many transitions in the absorption spectrum as possible with theoretical ones, expressed as:
f e d = 8 π 2 m c 3 h λ 2 J + 1 n 2 + 2 2 9 n S a J : b J ,
where fed denotes the electric dipole oscillator strength, with the other constants as previously explained. This classical approach, although highly successful [47], is restricted to monocrystals and glasses, as it necessitates measuring the absorption spectra using transmission techniques, along with the exact dopant concentration and refractive index of the host. A thorough introduction to this theory by Robert D. Peacock is recommended for interested readers [48].
Towards the end of the 20th century, Brazilian colleagues proposed a useful method for calculating the Ωλ parameters for Eu3+ based on emission spectra [49,50]. They observed that for several transitions, only one a J U t b J parameter differs from zero, enabling straightforward calculation of Ωλ. This approach paved the way for further innovation, such as utilizing excitation spectra, as demonstrated by W. Luo et al. [51]; diffuse reflection spectra, as explored by Gao et al. [52]; or fluorescence decay analyses, as verified by M. Luo et al. [53]. In this study, we employed a method proposed by Ćirić et al. [54] to determine the Ωλ parameters from the emission spectra.
With the Ωλ parameters determined, it becomes feasible to calculate the Einstein coefficient of spontaneous emission, radiative decay times, emission branching ratios, and the rates of nonradiative transitions. These parameters were calculated by us using the web application published by Ćirić et al., and their values were equal to 0.488, 1.186, and 4.659 [all in 10−20 cm2] for Ω2, Ω4, and Ω6, respectively. Thus, it was possible to calculate the radiative lifetimes of the 3P0 and 1D2 levels, which are 42 and 582 μs, respectively, taking n = 1.6 as the refractive index and data from the 300 K emission spectra. In our view, this was justified for a primary reason, it ensured compliance with the assumptions of the Judd–Ofelt theory regarding the equal occupancy of the 4f electronic configuration levels. Therefore, using the classical method, absorption spectrum data obtained at room temperature should be utilized for calculations. In his study, Ćirić et al. suggest measurements at 77 K to avoid the presence of the 1D23H4 transition in the spectrum. However, in the case of fluoride, the lattice vibrations are minimal, and as a result, this transition is not observed at low dopant concentrations.
Since cross-relaxation is a process within a pair of ions, WCR increases with increases in the Pr3+ concentration for both the 3P0 and 1D2 levels. The order of magnitude of the CR rate is the same for both levels when comparing samples with the same dopant content. However, it is important to note that CR rates are not absolute values. To compare the CR rates of the two processes, it is appropriate to normalize them to the rates of the radiative transitions of the levels involved. This approach allows not only the comparison of different CR processes within a matrix but also the comparison of CR processes occurring in different matrices. Figure 6 illustrates the dependence of the WCR/WR ratio on the function of Pr3+ ion concentration. One can see that the effectiveness of the CR process occurring from level 1D2 is enormous compared to the CR arising from 3P0, being for the 2% sample 14 times more effective at the depopulation of the1D2 level than the radiative process.

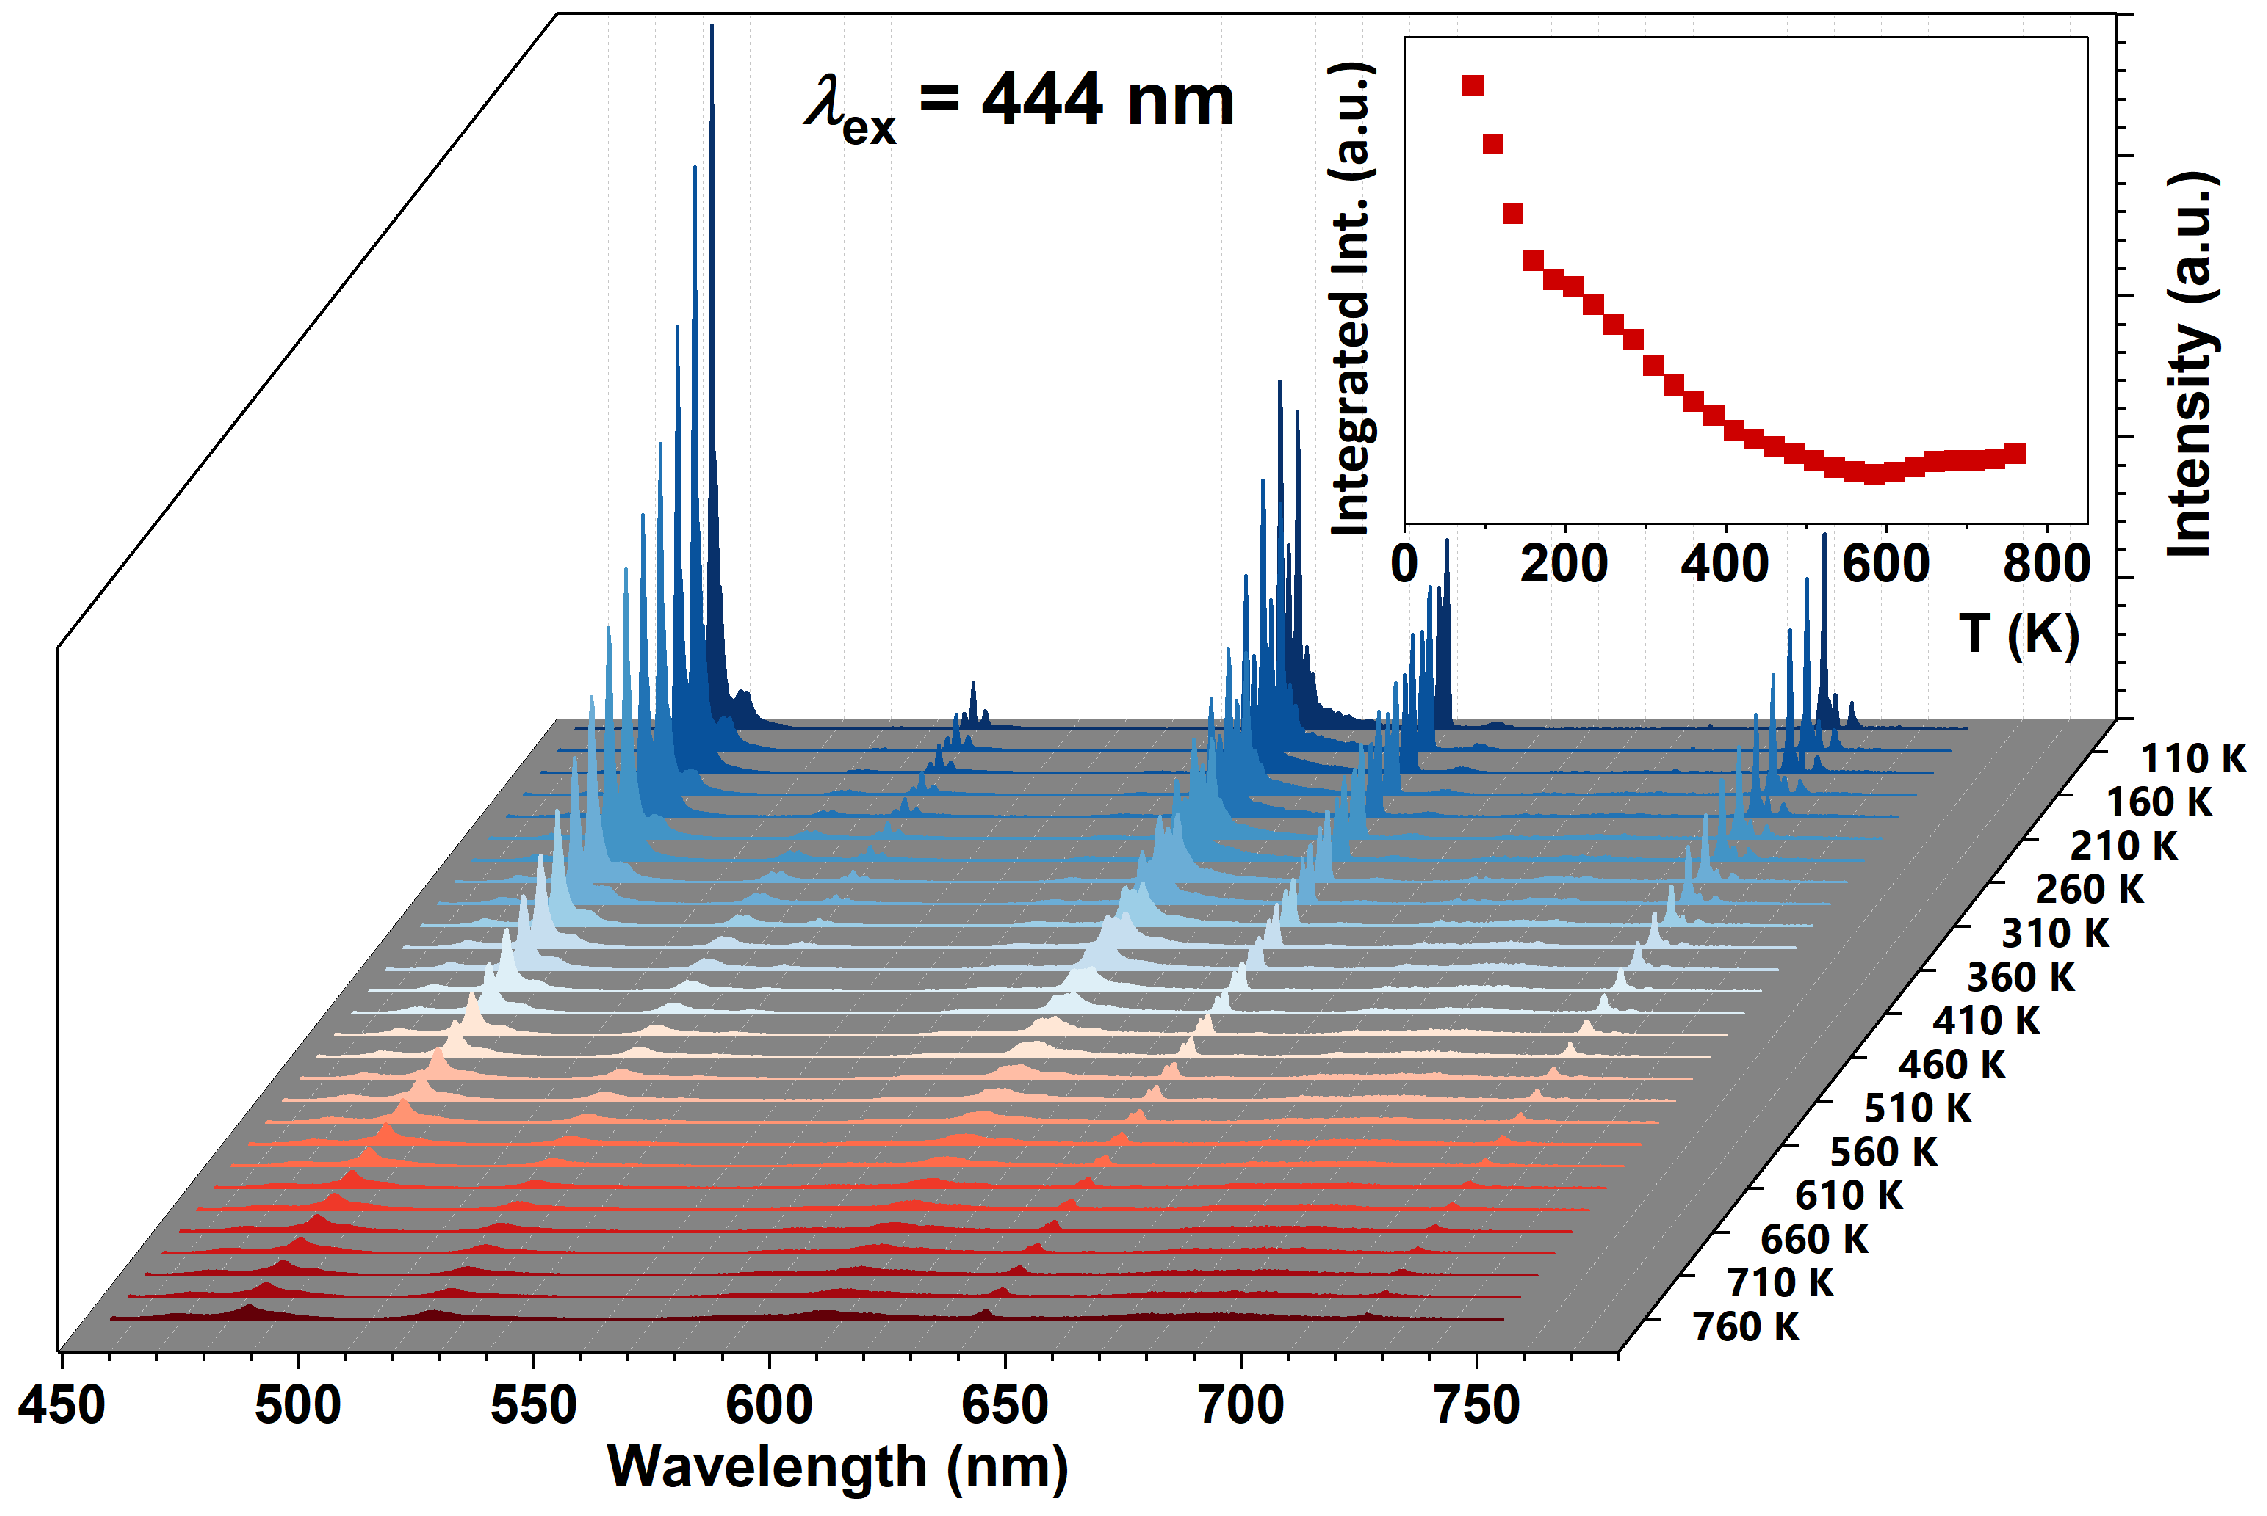
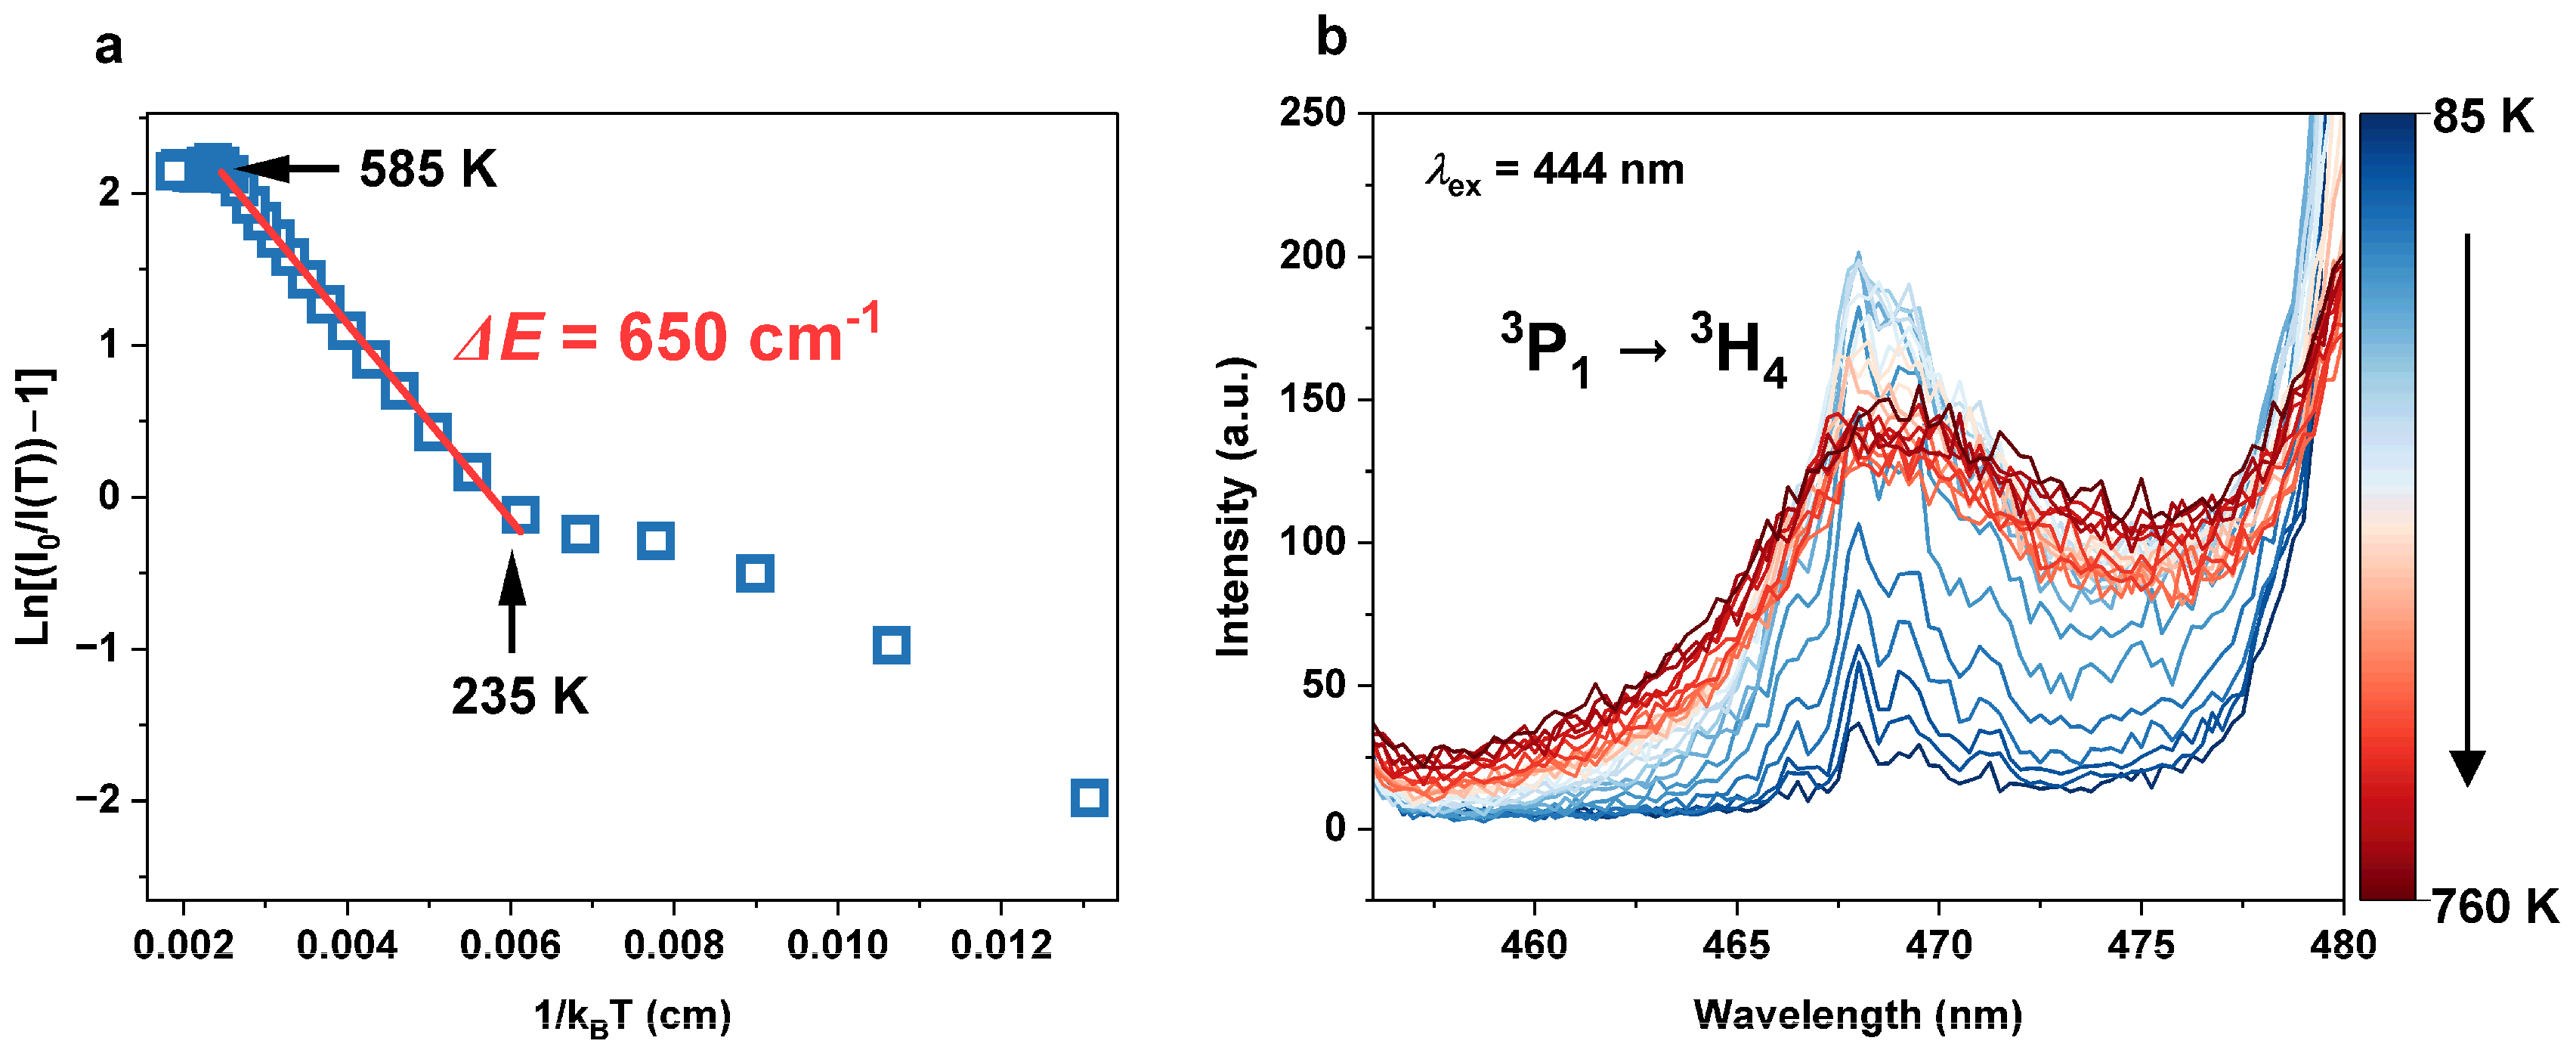
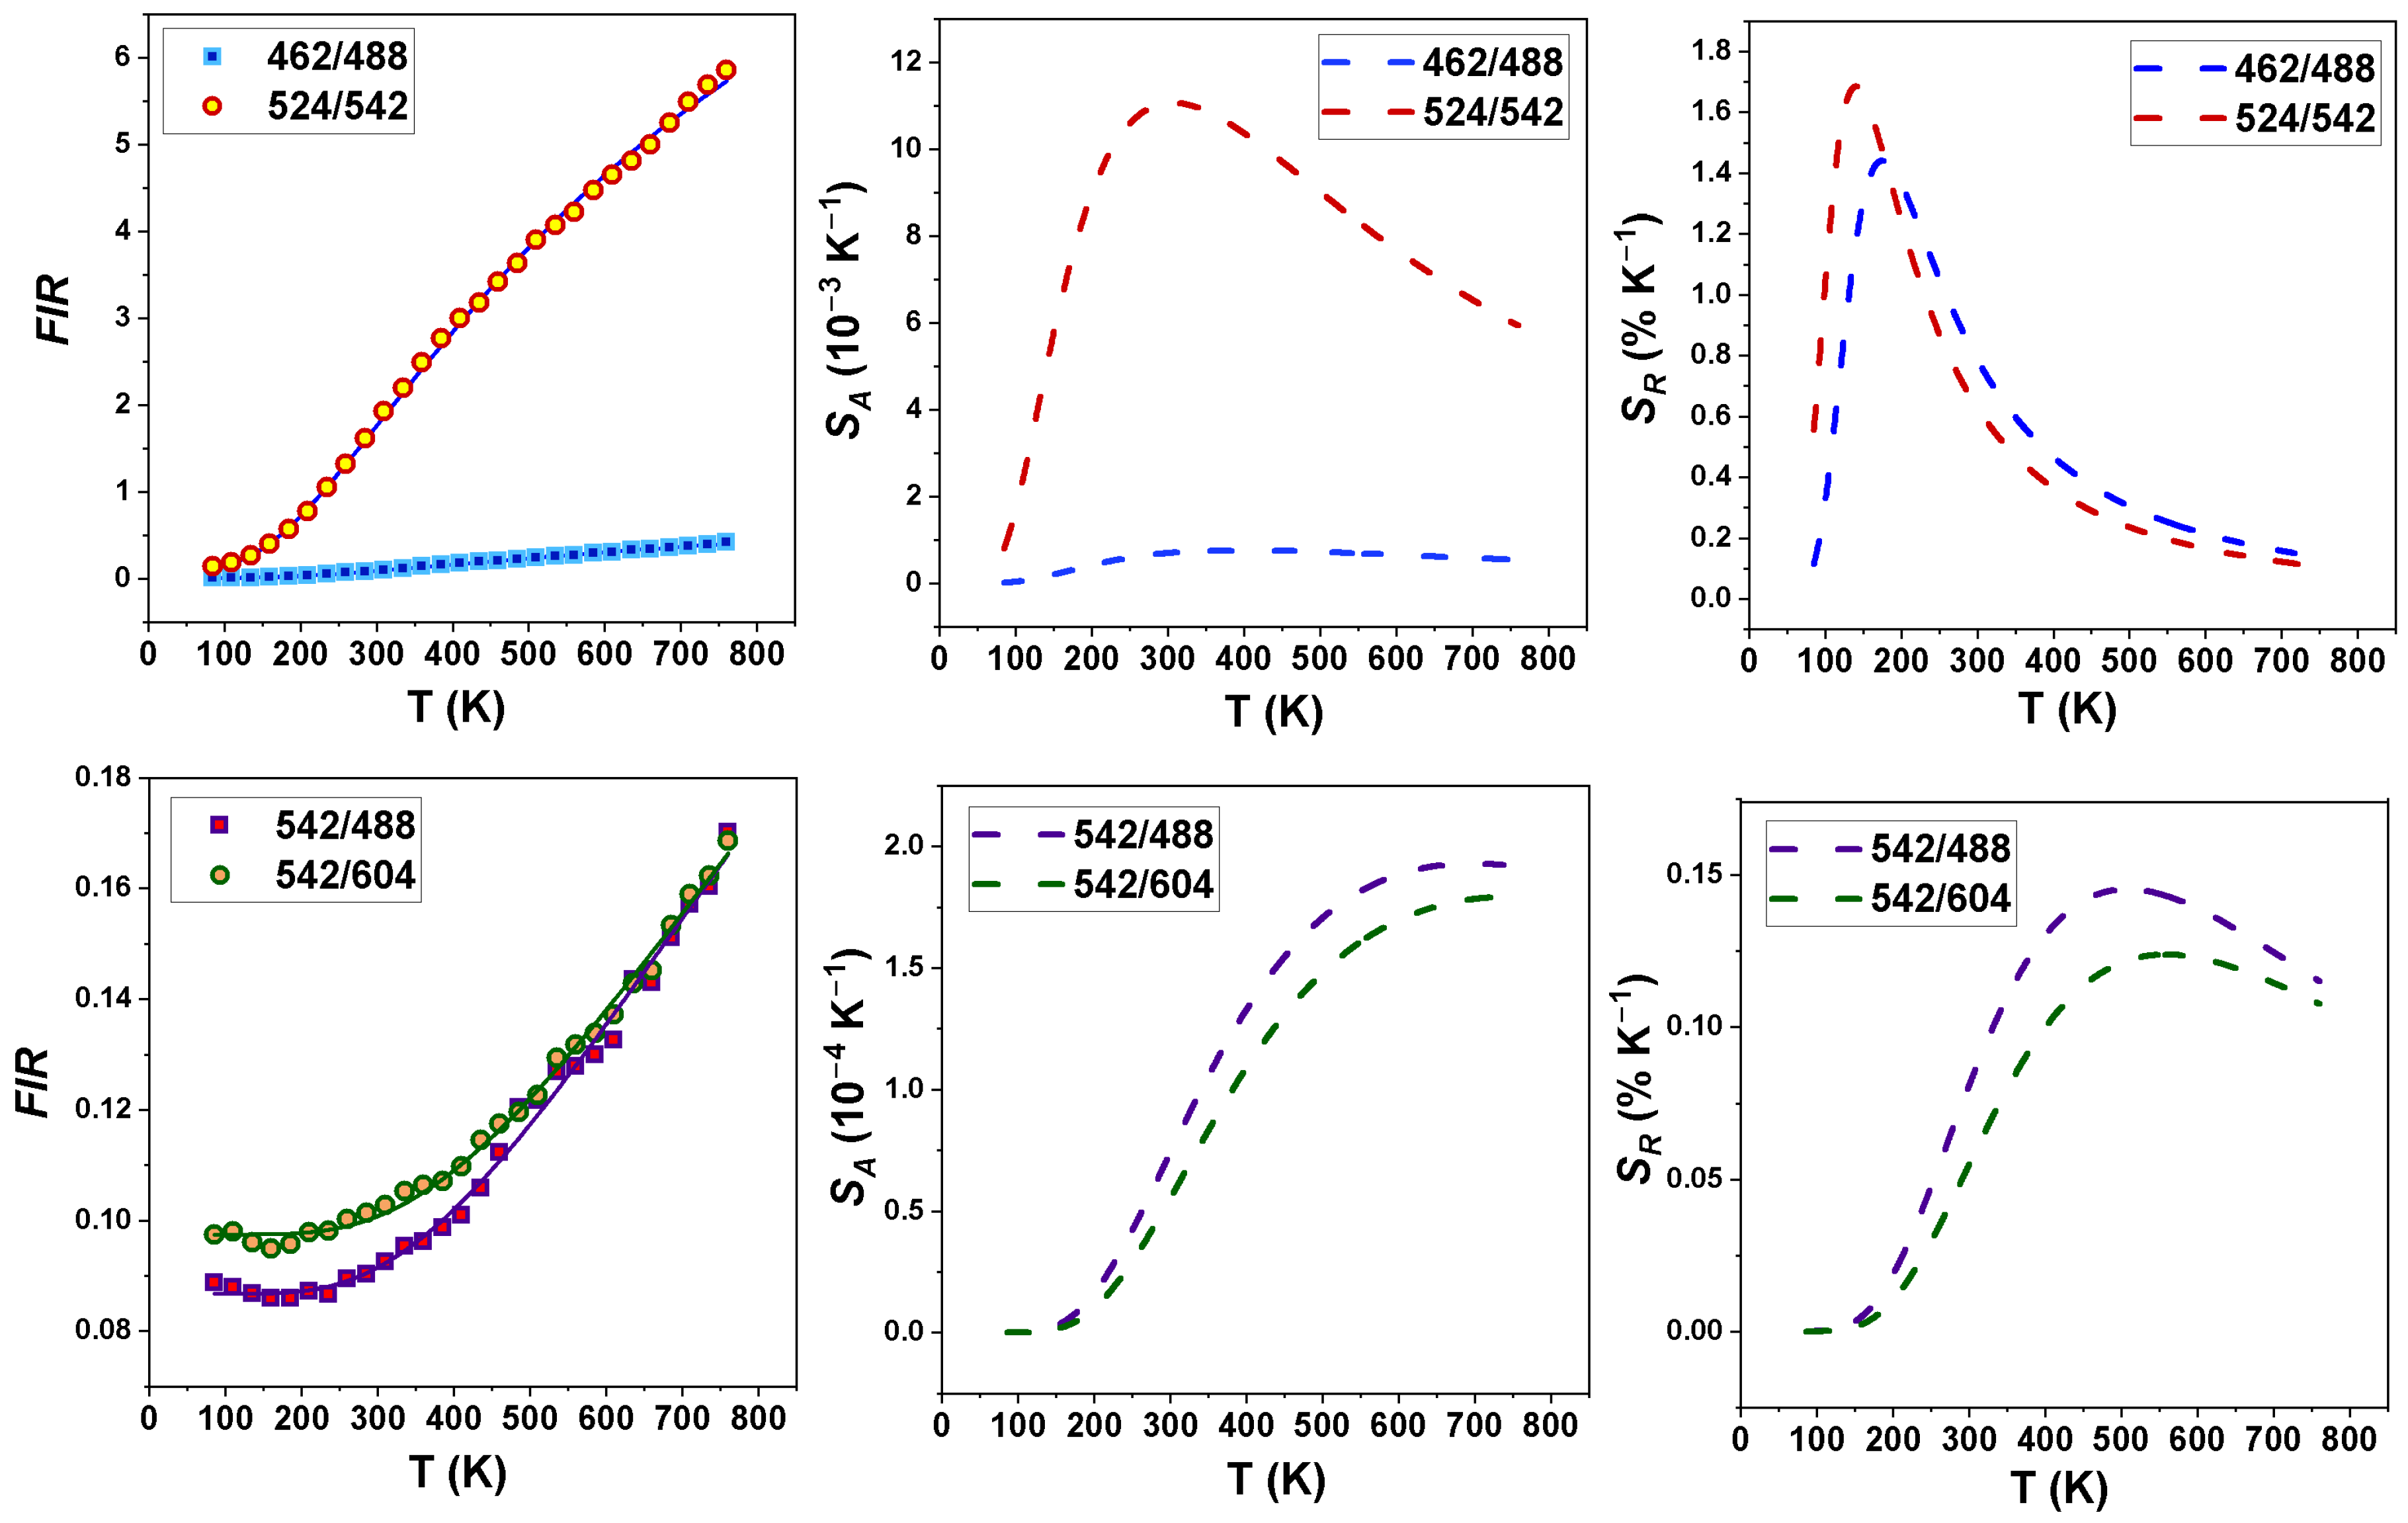
3.2.3. Thermal Behavior of Luminescence

The optical properties of KLaF4:Pr3+ were investigated at different temperatures as well. Figure 7 presents the excitation and emission spectra of the KLaF4:0.5%Pr3+ powder measured at 25 K, compared with those recorded at 300 K. Assignment of all the detected peaks is showed in both spectra. As expected, at a low temperature, the spectral lines are narrower, and their multiple-component shape can be easily observed. Based on these 25 K spectra, the experimental energies of the 2S+1Lj Stark levels were calculated and are listed in Table S3. Please note that the energies of the 3F3, 1G4, 1D2, and 1S0 levels were estimated based on the room-temperature spectra (Figure 3b and Figure 5b) because no transitions involving those levels were observed in the low-temperature spectra.
Comparing the 25 K and 300 K excitation spectra of KLaF4:0.5%Pr3+ (Figure 7a), the band at 484 nm, which occurs at room temperature, is not observed at a low temperature. This signal is associated with a transition from the second excited crystal field level of the ground state (here named 3H4(2)) to the 3P0 level. According to Boltzmann’s statistical law, the electron distribution between the two electron levels obeys the dependence N 1 N 0   ~ exp E k B T , where N1 and N0 are the populations of the higher and lower levels, respectively; ΔE is the energy gap between these levels; kB represents the Boltzmann constant; and T is the temperature. Since the ΔE between 3H4(0) and 3H4(2) is 147 cm−1 (see Table S3), both levels are populated and participate in sample excitation at 300 K. However, when the temperature is lowered to 25 K, the thermal population of the 3H4(2) level is reduced, and only transitions from the 3H4(0) level are detected. A similar effect is observed in the low- and room-temperature emission spectra (Figure 7b) recorded under 444 nm excitation. At 300 K, emissions from both the 3P0 and 3P1 levels are observed, but at 25 K, transitions from the 3P1 level are quenched.
To better understand the thermal behaviour of Pr3+ luminescence in KLaF4 crystals, emission spectra under 444 nm excitation were recorded in the 85–760 K temperature range (Figure 8), with a 25 K interval. The observed trend reveals thermal quenching of luminescence occurs while the sample temperature is increased, which is also presented in the inset. Considering the whole measured temperature range, the I(T) function exhibits a complex nature and cannot be fitted using one simple formula. This is because integrated luminescence includes the intensities of multiple transitions, which are characterized by different thermal behaviours. Generally, to fit I(T) dependence, the Arrhenius equation is used:
I T = I ( 0 ) 1 + C   e x p E k B T ,
where I(T) is the luminescence intensity measured at temperature T, I(0) is the initial intensity, C means constant, and ΔE is the activation energy of the thermal quenching. In Figure 9a, the plot depicts the dependence of ln I 0 I T 1 on 1 k B T for the 3P03H4 radiative transition. The integral intensity I(0) was derived by integrating the 480 nm multiplet in the 85 K spectrum. Linear dependence can be distinguished for temperatures ranging from 235 to 585 K. In this range, the data can be well fitted using a linear equation, where the slope is equal to ΔE as follows:
ln I 0 I T 1 = E 1 k B T + l n C .
The ΔE for the thermal quenching of 3P03H4 luminescence is determined to be 650 cm−1 within the temperature range of 235 K to 585 K. Notably, this value closely aligns with the energy difference between the 3P0 and 3P1 levels, calculated to be 622 cm−1 (see Table S3). As a consequence, the quenching of the 3P0 emission should be explained by the thermal population of the 3P1 level when the temperature is raised from 235 to 585 K. Moreover, analyzing the thermal behaviour of the 3P13H4 transition (Figure 9b), it has been noticed that the luminescence intensity increases in the 85–510 K range, confirming that the 3P1 level is populated by thermal activation. Increasing the temperature creates an additional channel for the depopulation of the 3P0 level via CR:
{3P1, 3H4} → {1D2, 3H6}
{21,352; 0} → {16,775; 4457} − 120 [cm−1].
Recently, a distinct luminescence thermometry strategy based on the emission of praseodymium-doped phosphors has been elaborated. Among others, down-converted emissions from the two thermally coupled excited states 3P0,1 of Pr3+ were recorded in a temperature range of 293–593 K for YAG:Pr3+ [55]. This investigation revealed a remarkable temperature sensitivity, reaching up to 0.0025 K−1 at 573 K. Additionally, A.S. Rao observed the different temperature dependence of four various emission bands corresponding to 3P03H4, 3P13H4, 1D23H4, and 3P03F2 praseodymium transitions [56].
Consequently, four fluorescence intensity ratio models based on the relationships between different emission peaks were examined, and finally a maximum relative sensitivity was found to be 1.03% K−1. Previously, Pr3+-doped tungstate phosphors were examined as well by Ruoshan Lei et al. [57], and a similar evaluation strategy resulted in quite a high relative sensitivity (1~3.25% K−1) and low temperature uncertainty (0.15–0.5 K) within a wide temperature range. Another exploration focused on the emission intensity variation in 3P03H4 and 1D23H4 at lower temperatures in YPO4:Pr3+ nanopowders [58]. The obtained values for the maximum absolute and relative sensitivities were 4.60 × 10⁻³ K−1 at 100 K and 2.30% K−1 at 10 K, respectively. Additionally, glass materials have been employed in the development of luminescence thermometers. Notably, Maturi et al. recently presented Yb3+/Pr3+ co-doped fluoride phosphate glasses working as primary thermometers, demonstrating a relative thermal sensitivity and uncertainty of 1.0% K−1 and 0.5 K, respectively [59].
In relation, we observed the different effect of temperatures of 80–750 K on several emission bands of praseodymium originating in the 3P0 and 3P1 multiplets. We utilized the fluorescence intensity ratio (FIR) expressed using the equation:
F I R = I 3 P 1 I 3 P 0 = B exp Δ E k B T
where ΔE is the energy gap between the two thermally coupled levels and B is the temperature-independent constant. Figure 10 displays the effect of temperature (80–750 K) on the fluorescence intensity ratio corresponding to certain praseodymium emission bands. A reliable fit in applying Equation (13) was achieved for ΔE = 567 cm−1. It follows from these plots that the fluorescence intensity ratios attributed to the thermally coupled levels 3P0 and 3P1 rise with an increasing temperature, reaching their highest values at 750 K. The variations in the absolute and relative FIR changes SA and SR with temperature are expressed as [60]:
S A = d F I R d T = F I R Δ E k T 2
and
S R = 1 F I R d F I R d T 100 % = Δ E k T 2 100 %
The potential application of optical material as a luminescence thermometer can be assessed utilizing these SA and SR parameters, which determine the thermosensitive phosphor properties. In the case of Pr3+-doped KLaF4, the most efficient relative temperature sensitivities were found to be 1.70% K−1 at T = 140 K and 1.45% K−1 at T = 175 K for the (3P13H4/3P03H4) and (3P13H5/3P03H5) transitions, respectively. These values are compared with those reported for other Ln3+-based luminescence thermometers in Table S4 [61,62,63,64,65,66,67,68].
The temperature resolution δT (uncertainty in temperature), which refers to the minimal temperature change that causes significant fluctuation in an examined parameter, was estimated according to the formula [60]:
δ T = 1 S R δ
where δΔ/Δ represents the relative error in determining the thermometric parameters (around 0.5% for emission ratiometric measurements [69]). For the (3P13H4/3P03H4) and (3P13H5/3P03H5) ratiometric estimations, the relative sensitivity with temperature resolutions of 0.29 K and 0.34 K over the whole measurement range can be estimated, respectively. Eventually, the thermographic qualities of the studied phosphor are especially promising for potential optical sensing considering the 125–250 K temperature region.

4. Conclusions

KLaF4 crystalline powders doped with different Pr3+ ion contents were synthesized for the first time, and their optical properties were investigated. Although all papers dealing with KLaF4 crystals have previously reported a cubic or hexagonal structure, here, an orthorhombic Pnma space group was observed. The obtained crystallites, which were synthesized via a high-temperature solid-state reaction, had an agglomerated, non-uniform shape with a main grain size of 6.9 μm.
The optical properties of the prepared phosphor were investigated in the UV and visible ranges. The influence of the host crystal structure on the position of the Pr3+ 5d levels was analyzed according to the UVC excitation spectrum. It was found that the energy of the lowest 5d level (52,880 cm−1) is higher than the energy of the 1S0 level (46,387 cm−1), meaning the PCE process should be observed for this system. The occurrence of the quantum-cutting effect was proven through observation of the 1S03I6 (406 nm) and 3P03H4 (484 nm) transitions upon exciting the sample with 160 nm radiation. Under blue light excitation (444 nm), emissions from the 3P0 and 3P1 levels were observed at 300 K. In contrast, the 25 K emission spectrum contained only transitions from the 3P0 level. The Arrhenius plot calculation revealed that the thermal population of the 3P1 level is responsible for the difference between the room- and low-temperature spectra. Furthermore, the concentration-quenching effect was observed as a result of the increasing cross-relaxation rate for both the 3P0 and 1D2 levels. However, analysis of the cross-relaxation rates revealed that the CR process is much more effective for the 1D2 level. Finally, the thermometric properties of the prepared system were investigated based on transitions involving the thermally coupled levels 3P0 and 3P1. The most efficient relative temperature sensitivity was found to be 1.70% K−1 at T = 140 K.
Summing up, the newly synthesized material KLaF4:Pr3+ was found to be an effective PCE phosphor, which makes it attractive for various optical applications.

Supplementary Materials

The following supporting information can be downloaded at https://www.mdpi.com/article/10.3390/ma17061410/s1. Figure S1: EDS mapping of the chosen grain; Figure S2: Emission spectra (λex = 444 nm) of the samples with different Pr3+ contents; Table S1: Lattice parameters and unit cell volume; Table S2: Transitions observed in UV PL and PLE spectra; Table S3: Energies of Pr3+ Stark levels; Table S4: Comparison of Ln3+-based luminescence thermometers.

Author Contributions

Conceptualization, P.Z. and P.J.D.; methodology, N.R. and P.Z.; formal analysis, P.Z., R.L. and N.R.; investigation, P.Z. and R.L.; data curation, P.Z. and R.L.; writing—original draft preparation, P.Z., R.L. and N.R.; writing—review and editing, P.J.D.; visualization, P.Z. and R.L.; supervision, P.J.D.; project administration, P.J.D.; funding acquisition, P.J.D. All authors have read and agreed to the published version of the manuscript.

Funding

This research was funded by the National Science Center, grant number 2021/41/B/ST5/03792.

Institutional Review Board Statement

Not applicable.

Informed Consent Statement

Not applicable.

Data Availability Statement

The data presented in this study are openly available in Zenodo at https://doi.org/10.5281/zenodo.10559692.

Acknowledgments

The authors would like to thank E. Bukowska for performing the XRPD measurements and D. Szymański for the SEM and EDS measurements.

Conflicts of Interest

The authors declare no conflicts of interest.

References

  1. Jang, H.S.; Im, W.B.; Lee, D.C.; Jeon, D.Y.; Kim, S.S. Enhancement of Red Spectral Emission Intensity of Y3Al5O12:Ce3+ Phosphor via Pr Co-Doping and Tb Substitution for the Application to White LEDs. J. Lumin. 2007, 126, 371–377. [Google Scholar] [CrossRef]
  2. Pawar, P.P.; Munishwar, S.R.; Gedam, R.S. Physical and Optical Properties of Dy3+/Pr3+ Co-Doped Lithium Borate Glasses for W-LED. J. Alloys Compd. 2016, 660, 347–355. [Google Scholar] [CrossRef]
  3. Dereń, P.J.; Pązik, R.; Stręk, W.; Boutinaud, P.; Mahiou, R. Synthesis and Spectroscopic Properties of CaTiO3 Nanocrystals Doped with Pr3+ Ions. J. Alloys Compd. 2008, 451, 595–599. [Google Scholar] [CrossRef]
  4. Gao, Y.; Huang, F.; Lin, H.; Zhou, J.; Xu, J.; Wang, Y. A Novel Optical Thermometry Strategy Based on Diverse Thermal Response from Two Intervalence Charge Transfer States. Adv. Funct. Mater. 2016, 26, 3139–3145. [Google Scholar] [CrossRef]
  5. Brites, C.D.S.; Fiaczyk, K.; Ramalho, J.F.C.B.; Sójka, M.; Carlos, L.D.; Zych, E. Widening the Temperature Range of Luminescent Thermometers through the Intra- and Interconfigurational Transitions of Pr3+. Adv. Opt. Mater. 2018, 6, 1701318. [Google Scholar] [CrossRef]
  6. Stefanska, J.; Marciniak, L. Single-Band Ratiometric Luminescent Thermometry Using Pr3+ Ions Emitting in Yellow and Red Spectral Ranges. Adv. Photonics Res. 2021, 2, 2100070. [Google Scholar] [CrossRef]
  7. Luo, Z.; Wu, D.; Xu, B.; Xu, H.; Cai, Z.; Peng, J.; Weng, J.; Xu, S.; Zhu, C.; Wang, F.; et al. Two-Dimensional Materi-al-Based Saturable Absorbers: Towards Compact Visible-Wavelength All-Fiber Pulsed Lasers. Nanoscale 2016, 8, 1066–1072. [Google Scholar] [CrossRef] [PubMed]
  8. Gün, T.; Metz, P.; Huber, G. Power Scaling of Laser Diode Pumped Pr3+:LiYF4 CW Lasers: Efficient Laser Operation at 522.6 nm, 545.9 nm, 607.2 nm, and 639.5 nm. Opt. Lett. 2011, 36, 1002–1004. [Google Scholar] [CrossRef]
  9. Mazurak, Z.; Bodył, S.; Lisiecki, R.; Gabryś-Pisarska, J.; Czaja, M. Optical Properties of Pr3+, Sm3+ and Er3+ Doped P2O5–CaO–SrO–BaO Phosphate Glass. Opt. Mater. 2010, 32, 547–553. [Google Scholar] [CrossRef]
  10. Klimesz, B.; Dominiak-Dzik, G.; Lisiecki, R.; Ryba-Romanowski, W. Systematic Study of Spectroscopic Properties and Thermal Stability of Lead Germanate Glass Doped with Rare-Earth Ions. J. Non-Cryst. Solids 2008, 354, 515–520. [Google Scholar] [CrossRef]
  11. Abdukayum, A.; Chen, J.-T.; Zhao, Q.; Yan, X.-P. Functional Near Infrared-Emitting Cr3+/Pr3+ Co-Doped Zinc Gallogermanate Persistent Luminescent Nanoparticles with Superlong Afterglow for in Vivo Targeted Bioimag-ing. J. Am. Chem. Soc. 2013, 135, 14125–14133. [Google Scholar] [CrossRef]
  12. Dorenbos, P. The 5d Level Positions of the Trivalent Lanthanides in Inorganic Compounds. J. Lumin. 2000, 91, 155–176. [Google Scholar] [CrossRef]
  13. Srivastava, A.M. Aspects of Pr3+ Luminescence in Solids. J. Lumin. 2016, 169, 445–449. [Google Scholar] [CrossRef]
  14. Dorenbos, P. 5d-Level Energies of Ce 3+ and the Crystalline Environment. I. Fluoride Compounds. Phys. Rev. B 2000, 62, 15640–15649. [Google Scholar] [CrossRef]
  15. Dorenbos, P. 5d-Level Energies of Ce3+ and the Crystalline Environment. II. Chloride, Bromide, and Iodide Compounds. Phys. Rev. B 2000, 62, 15650–15659. [Google Scholar] [CrossRef]
  16. Dorenbos, P. 5d-Level Energies of Ce3+ and the Crystalline Environment. III. Oxides Containing Ionic Complexes. Phys. Rev. B 2001, 64, 125117. [Google Scholar] [CrossRef]
  17. Dorenbos, P. 5d-Level Energies of Ce3+ and the Crystalline Environment. IV. Aluminates and “Simple” Oxides. J. Lumin. 2002, 99, 283–299. [Google Scholar] [CrossRef]
  18. Sommerdijk, J.L.; Bril, A.; de Jager, A.W. Two Photon Luminescence with Ultraviolet Excitation of Trivalent Praseodymium. J. Lumin. 1974, 8, 341–343. [Google Scholar] [CrossRef]
  19. Piper, W.W.; DeLuca, J.A.; Ham, F.S. Cascade Fluorescent Decay in Pr3+-Doped Fluorides: Achievement of a Quantum Yield Greater than Unity for Emission of Visible Light. J. Lumin. 1974, 8, 344–348. [Google Scholar] [CrossRef]
  20. Kück, S.; Sokólska, I.; Henke, M.; Döring, M.; Scheffler, T. Photon Cascade Emission in Pr3+-Doped Fluorides. J. Lumin. 2003, 102–103, 176–181. [Google Scholar] [CrossRef]
  21. Sommerdijk, J.L.; Bril, A.; De Jager, A.W. Luminescecne of Pr3+-Activated Fluorides. J. Lumin. 1974, 9, 288–296. [Google Scholar] [CrossRef]
  22. Sokólska, I.; Kück, S. Observation of Photon Cascade Emission in the Pr3+-Doped Perovskite KMgF3. Chem. Phys. 2001, 270, 355–362. [Google Scholar] [CrossRef]
  23. Shiran, N.; Neicheva, S.; Gektin, A.; Boyarintseva, Y.; Stryganyuk, G.; Shimamura, K.; Villora, E. Luminescence of Pr-Doped LiCaAlF6 and LiSrAlF6 Crystals. J. Lumin. 2009, 129, 1542–1545. [Google Scholar] [CrossRef]
  24. Rodnyi, P.A.; Dorenbos, P.; Stryganyuk, G.B.; Voloshinovskii, A.S.; Potapov, A.S.; van Eijk, C.W.E. Emission of Pr3+ in SrAl12O19 under Vacuum Ultraviolet Synchrotron Excitation. J. Phys. Condens. Matter 2003, 15, 719–729. [Google Scholar] [CrossRef]
  25. Srivastava, A.M.; Doughty, D.A.; Beers, W.W. Photon Cascade Luminescence of Pr3+ in LaMgB5O10. J. Electrochem. Soc. 1996, 143, 4113–4116. [Google Scholar] [CrossRef]
  26. Wang, D.; Huang, S.; You, F.; Qi, S.; Fu, Y.; Zhang, G.; Xu, J.; Huang, Y. Vacuum Ultraviolet Spectroscopic Properties of Pr3+ in MYF4 (M=Li, Na, and K) and LiLuF4. J. Lumin. 2007, 122–123, 450–452. [Google Scholar] [CrossRef]
  27. Ahmad, S.; Prakash, G.V.; Nagarajan, R. Hexagonally Ordered KLaF4 Host: Phase-Controlled Synthesis and Luminescence Studies. Inorg. Chem. 2012, 51, 12748–12754. [Google Scholar] [CrossRef] [PubMed]
  28. Liu, R.; Tu, D.; Liu, Y.; Zhu, H.; Li, R.; Zheng, W.; Ma, E.; Chen, X. Controlled Synthesis and Optical Spectroscopy of Lanthanide-Doped KLaF4 Nanocrystals. Nanoscale 2012, 4, 4485–4491. [Google Scholar] [CrossRef] [PubMed]
  29. Deo, I.S.; Gupta, M.; Prakash, G.V. Up- and Downconversion Dual-Mode Excitation Spectral Studies of Rare Earth Doped KLaF4 Nano Emitters for Biophotonic Applications. J. Phys. Chem. C 2023, 127, 24233–24241. [Google Scholar] [CrossRef]
  30. Gupta, M.; Deo, I.S.; Nagarajan, R.; Prakash, G.V. Highly Efficient Hexagonal-Phase Nd3+ Doped KLaF4 Nano-particles Colloidal Suspension for Liquid Lasers. Opt. Mater. 2022, 133, 113045. [Google Scholar] [CrossRef]
  31. Bajaj, R.; Gupta, M.; Nagarajan, R.; Rao, A.S.; Vijaya Prakash, G. Strong Structural Phase Sensitive Rare-Earth Photoluminescence Color Flips in KLaF4:RE3+ (RE3+ = Eu3+, Er3+/Yb3+) Nanocrystals. Dalton Trans. 2020, 49, 10058–10068. [Google Scholar] [CrossRef] [PubMed]
  32. Du, Y.-P.; Zhang, Y.-W.; Sun, L.-D.; Yan, C.-H. Optically Active Uniform Potassium and Lithium Rare Earth Fluoride Nanocrystals Derived from Metal Trifluroacetate Precursors. Dalton Trans. 2009, 8574–8581. [Google Scholar] [CrossRef] [PubMed]
  33. Das, S.; Amarnath Reddy, A.; Ahmad, S.; Nagarajan, R.; Vijaya Prakash, G. Synthesis and Optical Characterization of Strong Red Light Emitting KLaF4:Eu3+ Nanophosphors. Chem. Phys. Lett. 2011, 508, 117–120. [Google Scholar] [CrossRef]
  34. Brunton, G. The Crystal Structure of β-KCeF4. Acta Cryst. 1969, B25, 600–602. [Google Scholar] [CrossRef]
  35. Shannon, R.D. Revised Effective Ionic Radii and Systematic Studies of Interatomic Distances in Halides and Chalcogenides. Acta Cryst. 1976, 32, 751–767. [Google Scholar] [CrossRef]
  36. Prokop, K.A.; Guzik, M.; Guyot, Y.; Boulon, G.; Cybińska, J. Combining XRD and SEM Techniques with Site Selective Spectroscopy for Structural and Spectroscopic Studies of Nd3+-Doped LuPO4 Micro-Powders. Ceram. Int. 2020, 46, 26350–26360. [Google Scholar] [CrossRef]
  37. Dorenbos, P. The 4fn↔4fn−15d Transitions of the Trivalent Lanthanides in Halogenides and Chalcogenides. J. Lumin. 2000, 91, 91–106. [Google Scholar] [CrossRef]
  38. Kaminskii, A.A. Crystalline Lasers: Physical Processes and Operating Schemes; CRC Press, Inc.: Boca Raton, FL, USA, 1996. [Google Scholar]
  39. Kück, S.; Sokólska, I.; Henke, M.; Scheffler, T.; Osiac, E. Emission and Excitation Characteristics and Internal Quantum Efficiencies of Vacuum-Ultraviolet Excited Pr3+-Doped Fluoride Compounds. Phys. Rev. B 2005, 71, 165112. [Google Scholar] [CrossRef]
  40. de Jong, M.; Biner, D.; Krämer, K.W.; Barandiarán, Z.; Seijo, L.; Meijerink, A. New Insights in 4f125d1 Excited States of Tm2+ through Excited State Excitation Spectroscopy. J. Phys. Chem. Lett. 2016, 7, 2730–2734. [Google Scholar] [CrossRef]
  41. Mahlik, S.; Wiśniewski, K.; Grinberg, M.; Meltzer, R.S. Temperature and Pressure Dependence of the Luminescence of Eu2+-Doped Fluoride Crystals BaxSr1− xF2(x = 0, 0.3, 0.5, and 1): Experiment and Model. J. Phys. Condens. Matter 2009, 21, 245601. [Google Scholar] [CrossRef]
  42. Runowski, M.; Woźny, P.; Martín, I.R.; Lavín, V.; Lis, S. Praseodymium Doped YF3:Pr3+ Nanoparticles as Optical Thermometer Based on Luminescence Intensity Ratio (LIR)–Studies in Visible and NIR Range. J. Lumin. 2019, 214, 116571. [Google Scholar] [CrossRef]
  43. Zatryb, G.; Klak, M.M. On the Choice of Proper Average Lifetime Formula for an Ensemble of Emitters Showing Non-Single Exponential Photoluminescence Decay. J. Phys. Condens. Matter 2020, 32, 15902. [Google Scholar] [CrossRef]
  44. Judd, B.R. Optical Absorption Intensities of Rare-Earth Ions. Phys. Rev. 1962, 127, 750–761. [Google Scholar] [CrossRef]
  45. Ofelt, G.S. Intensities of Crystal Spectra of Rare-Earth Ions. J. Chem. Phys. 1962, 37, 511–520. [Google Scholar] [CrossRef]
  46. Carnall, W.T.; Fields, P.R.; Wybourne, B.G. Spectral Intensities of the Trivalent Lanthanides and Actinides in Solution. I. Pr3+, Nd3+, Er3+, Tm3+, and Yb3+. J. Chem. Phys. 1965, 42, 3797–3806. [Google Scholar] [CrossRef]
  47. Görller-Walrand, C.; Binnemans, K. Chapter 167 Spectral Intensities of f-f Transitions. In Handbook on the Physics and Chemistry of Rare Earths; Elsevier: Amsterdam, The Netherlands, 1998; Volume 25, pp. 101–264. [Google Scholar]
  48. Peacock, R.D. The Intensities of Lanthanide f ↔ f Transitions. In Rare Earths; Springer: Berlin/Heidelberg, Germany, 2007; pp. 83–122. [Google Scholar]
  49. Kodaira, C.A.; Brito, H.F.; Malta, O.L.; Serra, O.A. Luminescence and Energy Transfer of the Europium (III) Tungstate Obtained via the Pechini Method. J. Lumin. 2003, 101, 11–21. [Google Scholar] [CrossRef]
  50. De, C.; Donega, M.; Alves Junior, S.; De, G.F.; Sá, S. Synthesis, Luminescence and Quantum Yields of Eu(III) Mixed Complexes with 4,4,4-Trifluoro-1-Phenyl-1,3-Butanedione and 1,10-Phenanthroline-N-Oxide. J. Alloys Compd. 1997, 250, 422–426. [Google Scholar] [CrossRef]
  51. Luo, W.; Liao, J.; Li, R.; Chen, X. Determination of Judd–Ofelt Intensity Parameters from the Excitation Spectra for Rare-Earth Doped Luminescent Materials. Phys. Chem. Chem. Phys. 2010, 12, 3276. [Google Scholar] [CrossRef]
  52. Gao, D.; Chen, B.; Sha, X.; Zhang, Y.; Chen, X.; Wang, L.; Zhang, X.; Zhang, J.; Cao, Y.; Wang, Y.; et al. Near Infrared Emissions from Both High Efficient Quantum Cutting (173%) and Nearly-Pure-Color Upconversion in NaY(WO4)2:Er3+/Yb3+ with Thermal Management Capability for Silicon-Based Solar Cells. Light Sci. Appl. 2024, 13, 17. [Google Scholar] [CrossRef] [PubMed]
  53. Luo, M.; Chen, B.; Li, X.; Zhang, J.; Xu, S.; Zhang, X.; Cao, Y.; Sun, J.; Zhang, Y.; Wang, X.; et al. Fluorescence Decay Route of Optical Transition Calculation for Trivalent Rare Earth Ions and Its Application for Er3+-Doped NaYF 4 Phosphor. Phys. Chem. Chem. Phys. 2020, 22, 25177–25183. [Google Scholar] [CrossRef] [PubMed]
  54. Ćirić, A.; Ristić, Z.; Barudzija, T.; Srivastava, A.; Dramićanin, M.D. Judd–Ofelt Parametrization from the Emission Spectrum of Pr3+ Doped Materials: Theory, Application Software, and Demonstration on Pr3+ Doped YF3 and LaF3. Adv. Theory Simul. 2021, 4, 2100082. [Google Scholar] [CrossRef]
  55. Hu, S.; Lu, C.; Liu, X.; Xu, Z. Optical Temperature Sensing Based on the Luminescence from YAG:Pr Transparent Ceramics. Opt. Mater. 2016, 60, 394–397. [Google Scholar] [CrossRef]
  56. Anu; Rao, A.S. Luminescence and Optical Thermometry Strategy Based on Emission Spectra of Li2Ba5W3O15:Pr3+ Phosphors. Opt. Mater. 2023, 145, 114476. [Google Scholar] [CrossRef]
  57. Wang, J.; Chen, N.; Li, J.; Feng, Q.; Lei, R.; Wang, H.; Xu, S. A Novel High-Sensitive Optical Thermometer Based on the Multi-Color Emission in Pr3+ Doped LiLaMgWO6 Phosphors. J. Lumin. 2021, 238, 118240. [Google Scholar] [CrossRef]
  58. Kahouadji, B.; Guerbous, L.; Jovanović, D.J.; Dramićanin, M.D. Temperature Dependence of Red Emission in YPO4:Pr3+ Nanopowders. J. Lumin. 2022, 241, 118499. [Google Scholar] [CrossRef]
  59. Maturi, F.E.; Gaddam, A.; Brites, C.D.S.; Souza, J.M.M.; Eckert, H.; Ribeiro, S.J.L.; Carlos, L.D.; Manzani, D. Extending the Palette of Luminescent Primary Thermometers: Yb3+/Pr3+ Co-Doped Fluoride Phosphate Glasses. Chem. Mater. 2023, 35, 7229–7238. [Google Scholar] [CrossRef] [PubMed]
  60. Lisiecki, R.; Macalik, B.; Komar, J.; Berkowski, M.; Ryba-Romanowski, W. Impact of Temperature on Optical Spectra and Up-Conversion Phenomena in (Lu0.3Gd0.7)2SiO5 Crystals Single Doped with Er3+ and Co-Doped with Er3+ and Yb3+. J. Lumin. 2023, 254, 119495. [Google Scholar] [CrossRef]
  61. Zhou, S.; Jiang, G.; Wei, X.; Duan, C.; Chen, Y.; Yin, M. Pr3+-Doped β-NaYF4 for Temperature Sensing with Fluorescence Intensity Ratio Technique. J. Nanosci. Nanotechnol. 2014, 14, 3739–3742. [Google Scholar] [CrossRef]
  62. Kolesnikov, I.E.; Kalinichev, A.A.; Kurochkin, M.A.; Mamonova, D.V.; Kolesnikov, E.Y.; Lähderanta, E.; Mikhailov, M.D. Bifunctional Heater-Thermometer Nd3+-Doped Nanoparticles with Multiple Temperature Sensing Parameters. Nanotechnology 2019, 30, 145501. [Google Scholar] [CrossRef]
  63. Trejgis, K.; Ledwa, K.; Bednarkiewicz, A.; Marciniak, L. A Single-Band Ratiometric Luminescent Thermometer Based on Tetrafluorides Operating Entirely in the Infrared Region. Nanoscale Adv. 2022, 4, 437–446. [Google Scholar] [CrossRef]
  64. Haro-González, P.; León-Luis, S.F.; González-Pérez, S.; Martín, I.R. Analysis of Er3+ and Ho3+ Codoped Fluoroindate Glasses as Wide Range Temperature Sensor. Mater. Res. Bull. 2011, 46, 1051–1054. [Google Scholar] [CrossRef]
  65. Zheng, S.; Chen, W.; Tan, D.; Zhou, J.; Guo, Q.; Jiang, W.; Xu, C.; Liu, X.; Qiu, J. Lanthanide-Doped NaGdF4 Core–Shell Nanoparticles for Non-Contact Self-Referencing Temperature Sensors. Nanoscale 2014, 6, 5675–5679. [Google Scholar] [CrossRef]
  66. Stefańska, D.; Bondzior, B.; Vu, T.H.Q.; Grodzicki, M.; Dereń, P.J. Temperature Sensitivity Modulation through Changing the Vanadium Concentration in a La2MgTiO6:V5+,Cr3+ Double Perovskite Optical Thermometer. Dalton Trans. 2021, 50, 9851–9857. [Google Scholar] [CrossRef]
  67. Stefańska, D.; Kabański, A.; Vu, T.H.Q.; Adaszyński, M.; Ptak, M. Structure, Luminescence and Temperature Detection Capability of [C(NH2)3]M(HCOO)3 (M = Mg2+, Mn2+, Zn2+) Hybrid Organic–Inorganic Formate Perovskites Containing Cr3+ Ions. Sensors 2023, 23, 6259. [Google Scholar] [CrossRef] [PubMed]
  68. Li, L.; Zhu, Y.; Zhou, X.; Brites, C.D.S.; Ananias, D.; Lin, Z.; Almeida Paz, F.A.; Rocha, J.; Huang, W.; Carlos, L.D.; et al. Visible-Light Excited Luminescent Thermometer Based on Single Lanthanide Organic Frameworks. Adv. Funct. Mater. 2016, 26, 8677–8684. [Google Scholar] [CrossRef]
  69. Wang, X.; Liu, Q.; Bu, Y.; Liu, C.-S.; Liu, T.; Yan, X. Optical Temperature Sensing of Rare-Earth Ion Doped Phosphors. RSC Adv. 2015, 5, 86219–86236. [Google Scholar] [CrossRef]
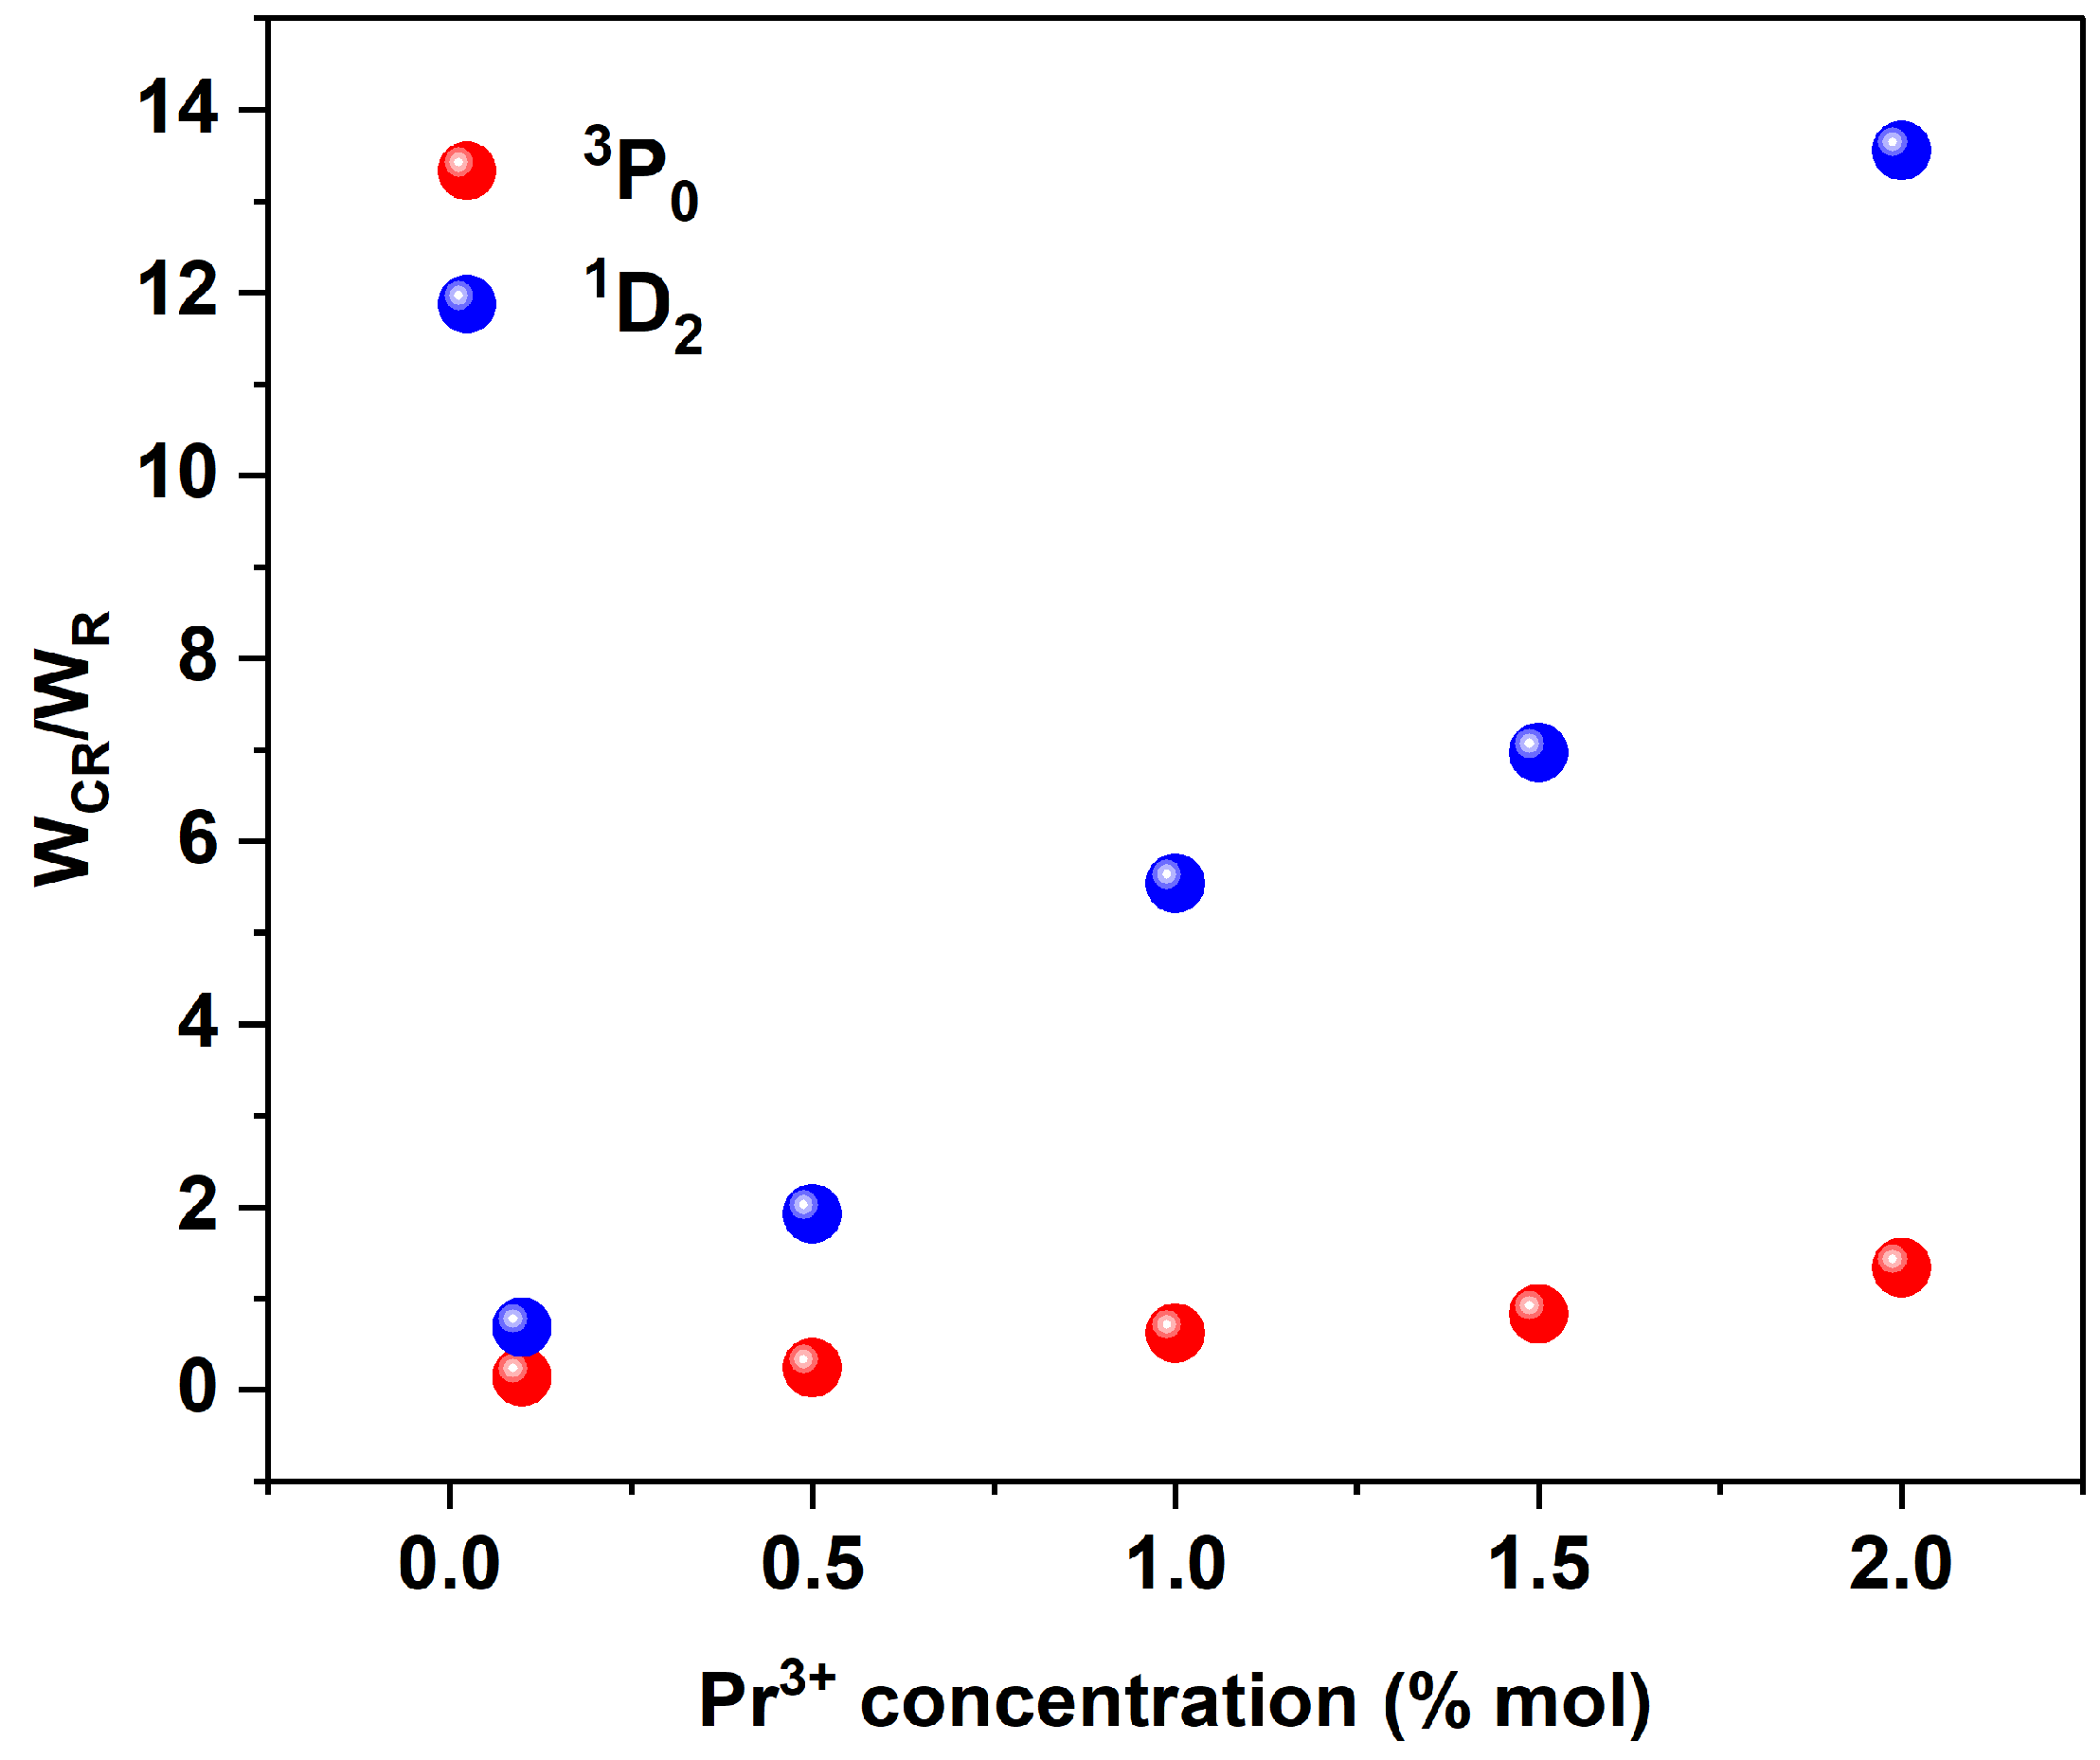
Figure 1. (a) X-ray powder diffraction patterns of KLaF4:Pr3+ particles and the orthorhombic KCeF4 standard data (ICSD file No. 23229) [34]. (b) Crystal structure of KLaF4 (orthorhombic system with the Pnma space group) along the a axis.
Materials 17 01410 g001
Figure 2. (a,b) SEM images of KLaF4 grains at two different scales. (c) Particle size distribution histogram. The purple line refers to the normal distribution function with μ = 6.9 μm and σ = 3.3 μm. (d) EDS spectrum of the KLaF4:1.5%Pr3+ sample; inset shows weight and atomic percentages of elements in the matrix.
Materials 17 01410 g002
Figure 3. (a) Excitation spectrum of the KLaF4:1%Pr3+ sample monitored at 272 nm. The arrow indicates the excitation energy used for emission measurement and the numbers 1–5 refer to peak numbers listed in Table S2 (b) Emission spectrum of the KLaF4:1%Pr3+ sample measured under 160 nm excitation. Both spectra were recorded at T = 300 K.
Materials 17 01410 g003
Figure 4. Schematic illustration of the PCE process in KLaF4 doped with Pr3+ ions. Solid arrows represent radiative transitions and dashed arrows correspond to nonradiative ones. Other observed transitions from the 1S0 level were not included in the graph. Please note that according to the work of Seijo et al. [40]. and Mahlik et al. [41], the metal–ligand (ML) distance is smaller for the 5d electronic configuration than for the 4f.
Materials 17 01410 g004
Figure 5. (a) Excitation (λem = 608 nm) and (b) emission (λex = 444 nm) spectra of KLaF4:0.5%Pr3+ measured at 300 K. The inset presents the relative luminescence intensity for different Pr3+ ion concentrations. Decay time curves of the (c) 3P0 and (d) 1D2 levels recorded at 300 K for samples with different Pr3+ contents.
Materials 17 01410 g005
Figure 6. Cross-relaxation rates (WCR) normalized to the radiation transition rate (WR) of 3P0 (red) and 1D2 (blue) levels for different Pr3+ ion concentrations.
Materials 17 01410 g006
Figure 7. (a) Excitation (λem = 608 nm) and (b) emission (λex = 444 nm) spectra of KLaF4:0.5%Pr3+ measured at 25 K (blue lines) and 300 K (red lines).
Materials 17 01410 g007
Figure 8. Emission spectra of the KLaF4:0.5%Pr3+ sample measured in the 85–760 K temperature range under 444 nm excitation. In the insets, the dependence of integrated luminescence intensity on temperature was plotted.
Materials 17 01410 g008
Figure 9. (a) Arrhenius plot for calculating activation energy of thermal quenching of 3P03H4 transition in KLaF4:0.5%Pr3+. (b) Emission band corresponding to 3P13H4 transition measured at different temperatures from 85 to 760 K.
Materials 17 01410 g009
Figure 10. Fluorescence intensity ratios, absolute and relative sensitivity determined for (3P13H4/3P03H4); (3P13H5/3P03H5); (3P03H5/3P03H4); and (3P03H5/3P03H6) band pairs in KLaF4:0.5%Pr3+.
Materials 17 01410 g010
Table 1. Radiative decay times (τR), observed decay times (τOB), and cross-relaxation rates (WCR) of the 3P0 and 1D2 levels for samples with different Pr3+ concentrations.
Pr3+ Concentration
(% mol)
3P01D2
τR [μs]τOB [μs]WCR [s−1]τR [μs]τOB [μs]WCR [s−1]
0.142373.2 × 1035823461.2 × 103
0.5345.6 × 1031993.3 × 103
1.0261.5 × 104899.5 × 103
1.5232.0 × 104731.2 × 104
2.0183.2 × 104402.3 × 104
Disclaimer/Publisher’s Note: The statements, opinions and data contained in all publications are solely those of the individual author(s) and contributor(s) and not of MDPI and/or the editor(s). MDPI and/or the editor(s) disclaim responsibility for any injury to people or property resulting from any ideas, methods, instructions or products referred to in the content.

