
Numerical Simulation and Machine Learning Prediction of the Direct Chill Casting Process of Large-Scale Aluminum Ingots
 ,
,
Abstract
:1. Introduction
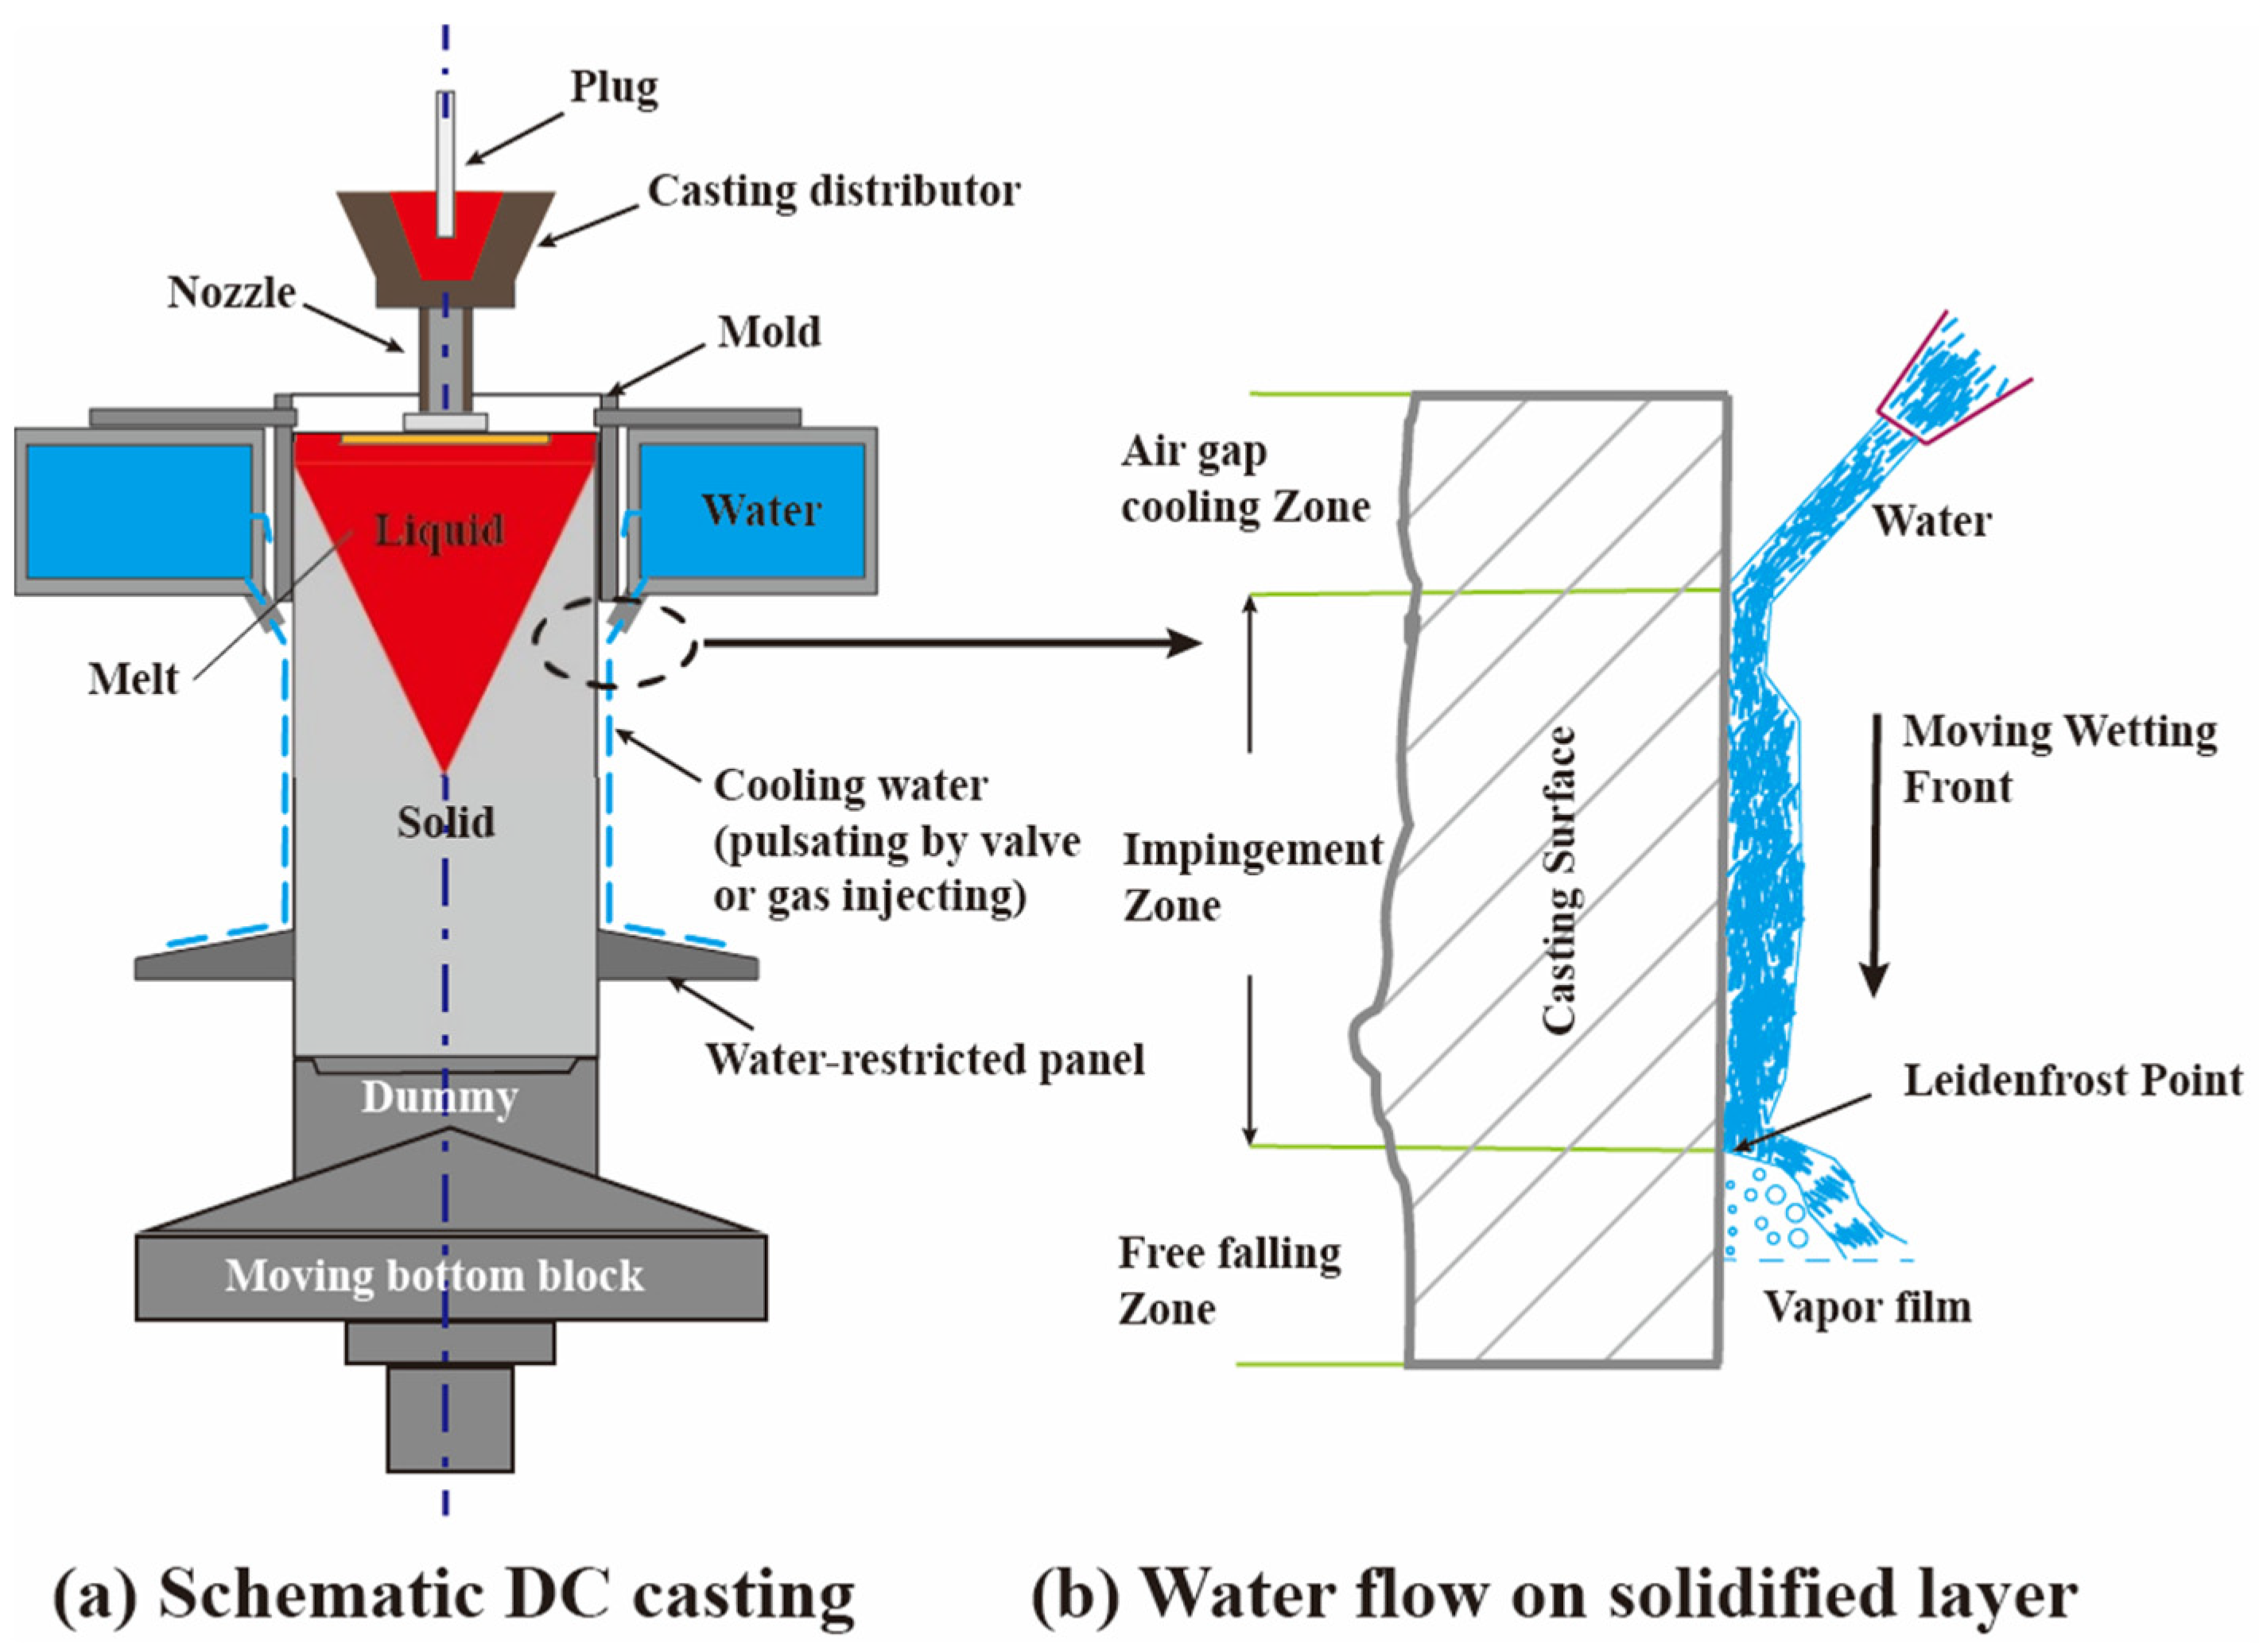
2. DC Model and Simulation Methods
2.1. Governing Equations of DC Model
2.1.1. Equation of Macroscopic Transport
2.1.2. Constitutive Equations
2.1.3. Cellular Automaton (CA) Model
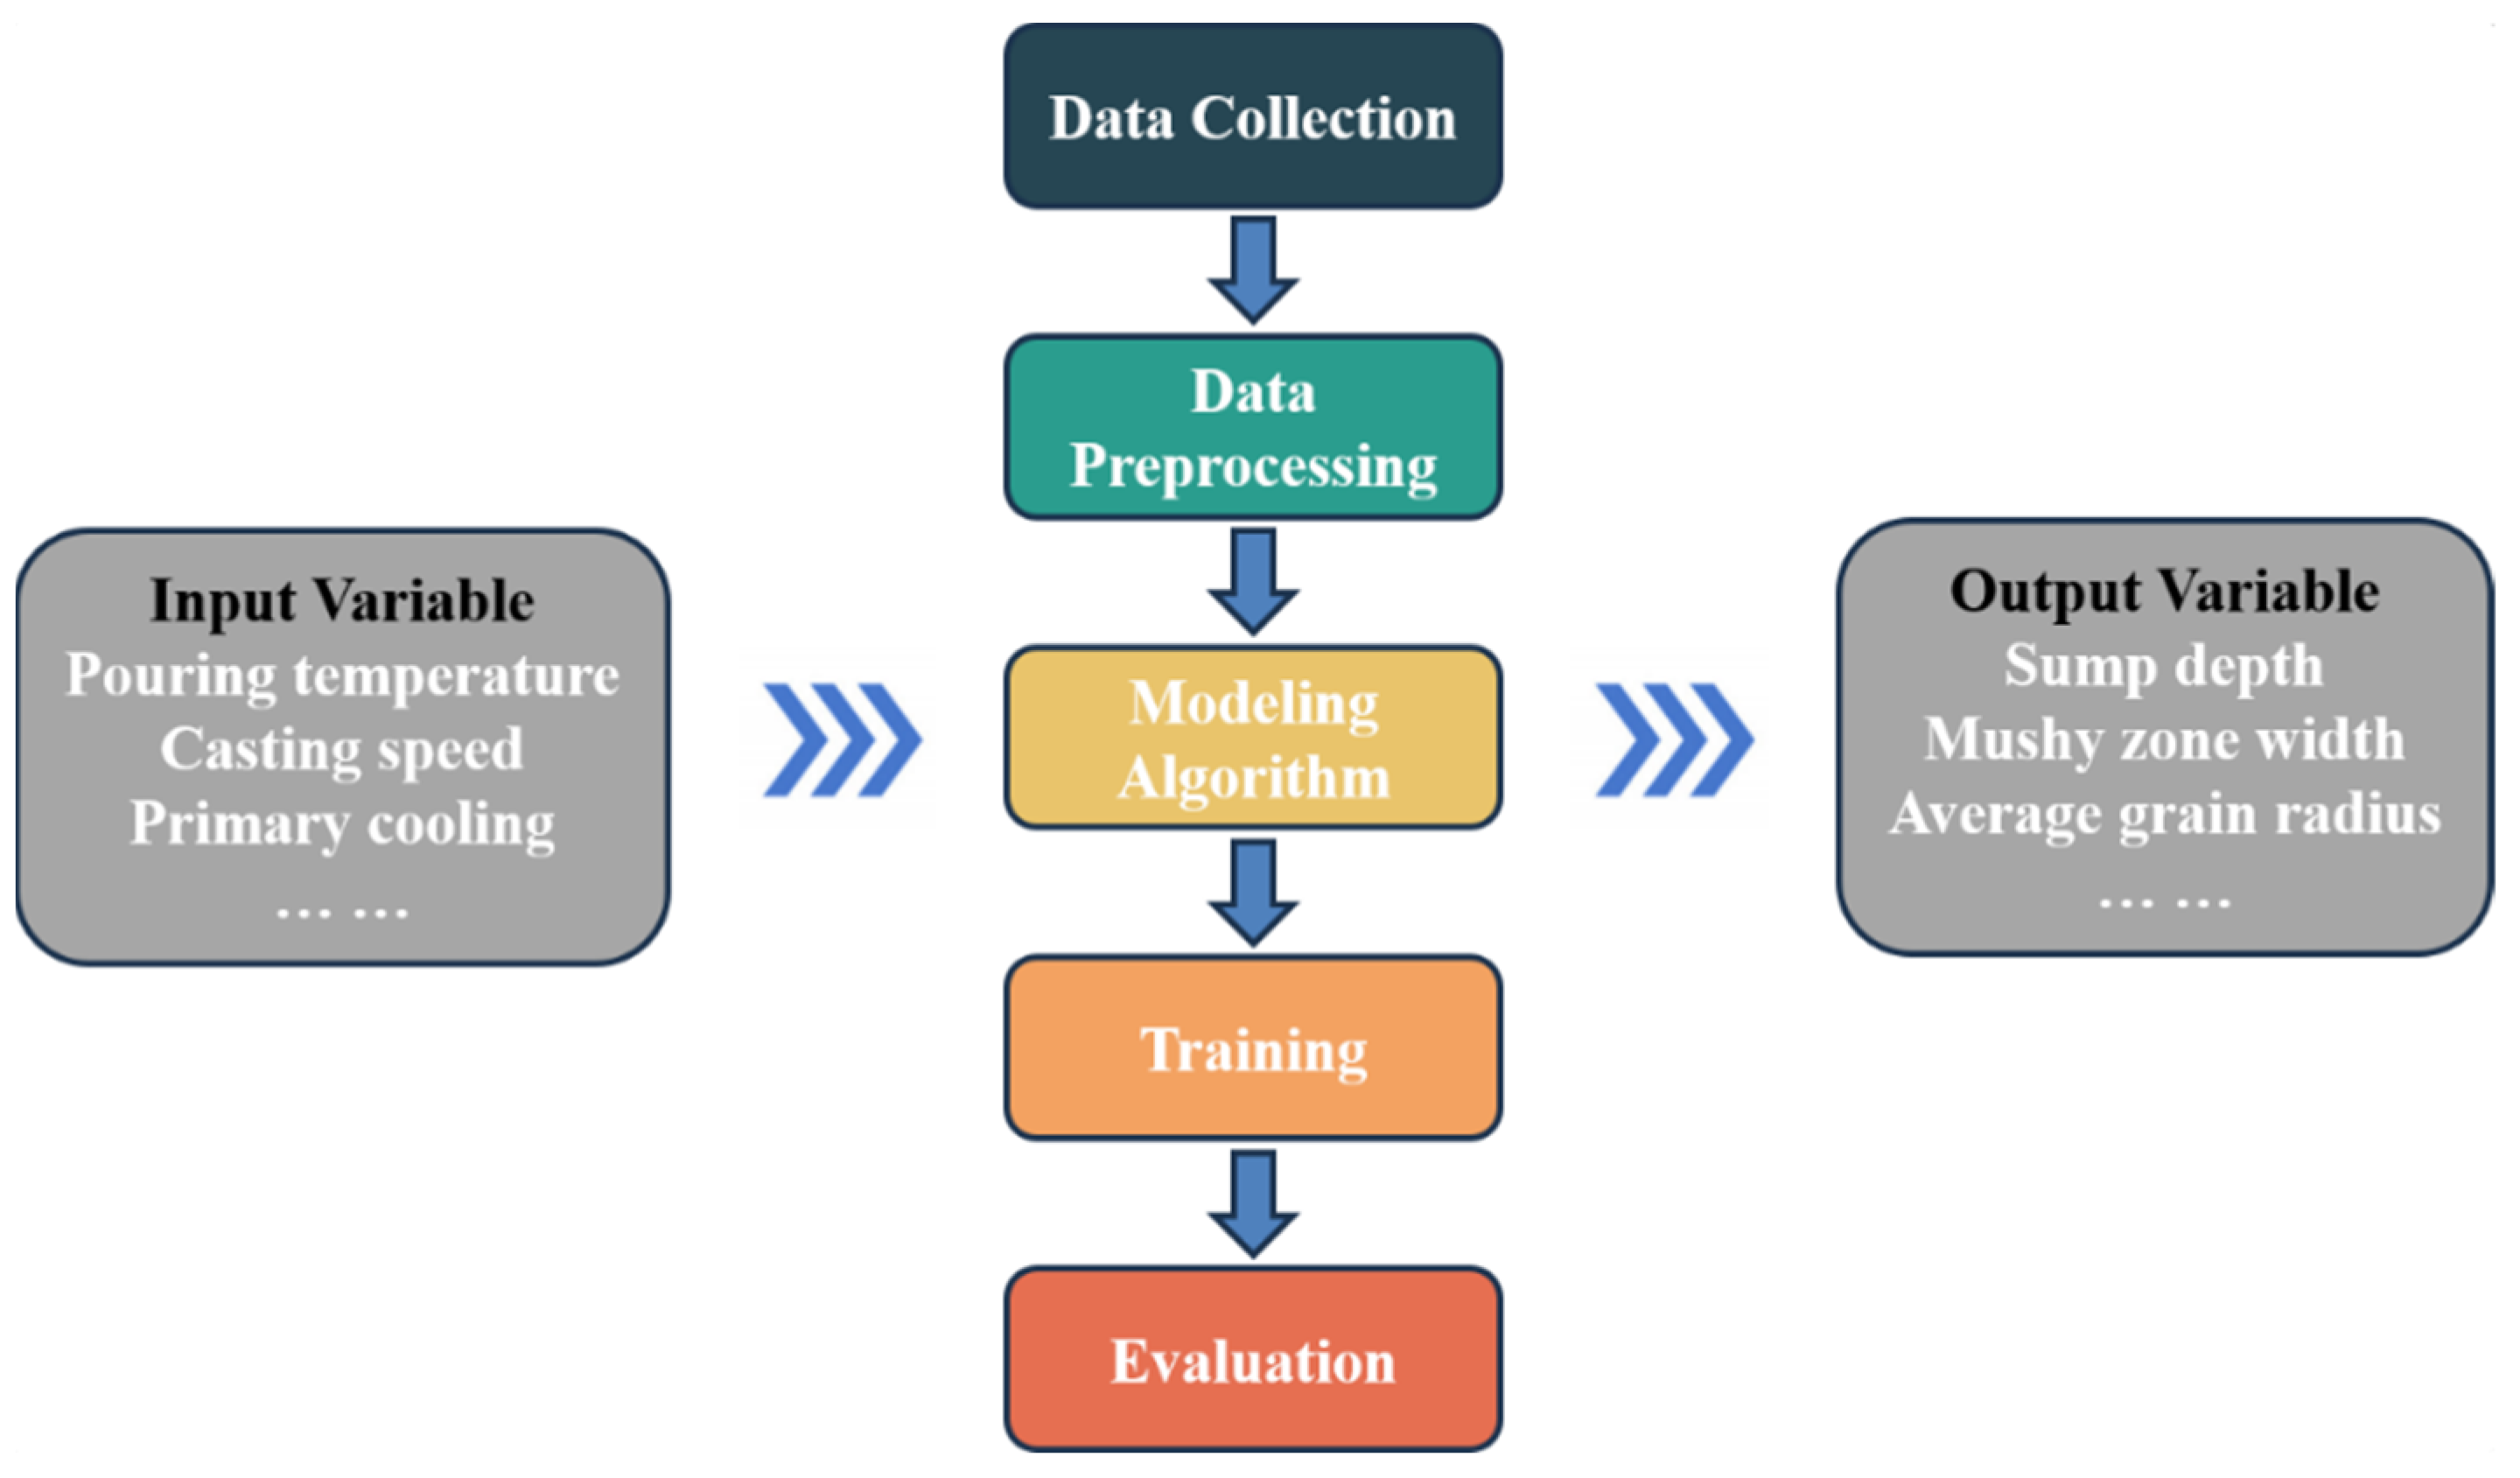
2.1.4. Multiple Linear Regression Machine Learning Models
2.2. Basic Assumptions of the Model
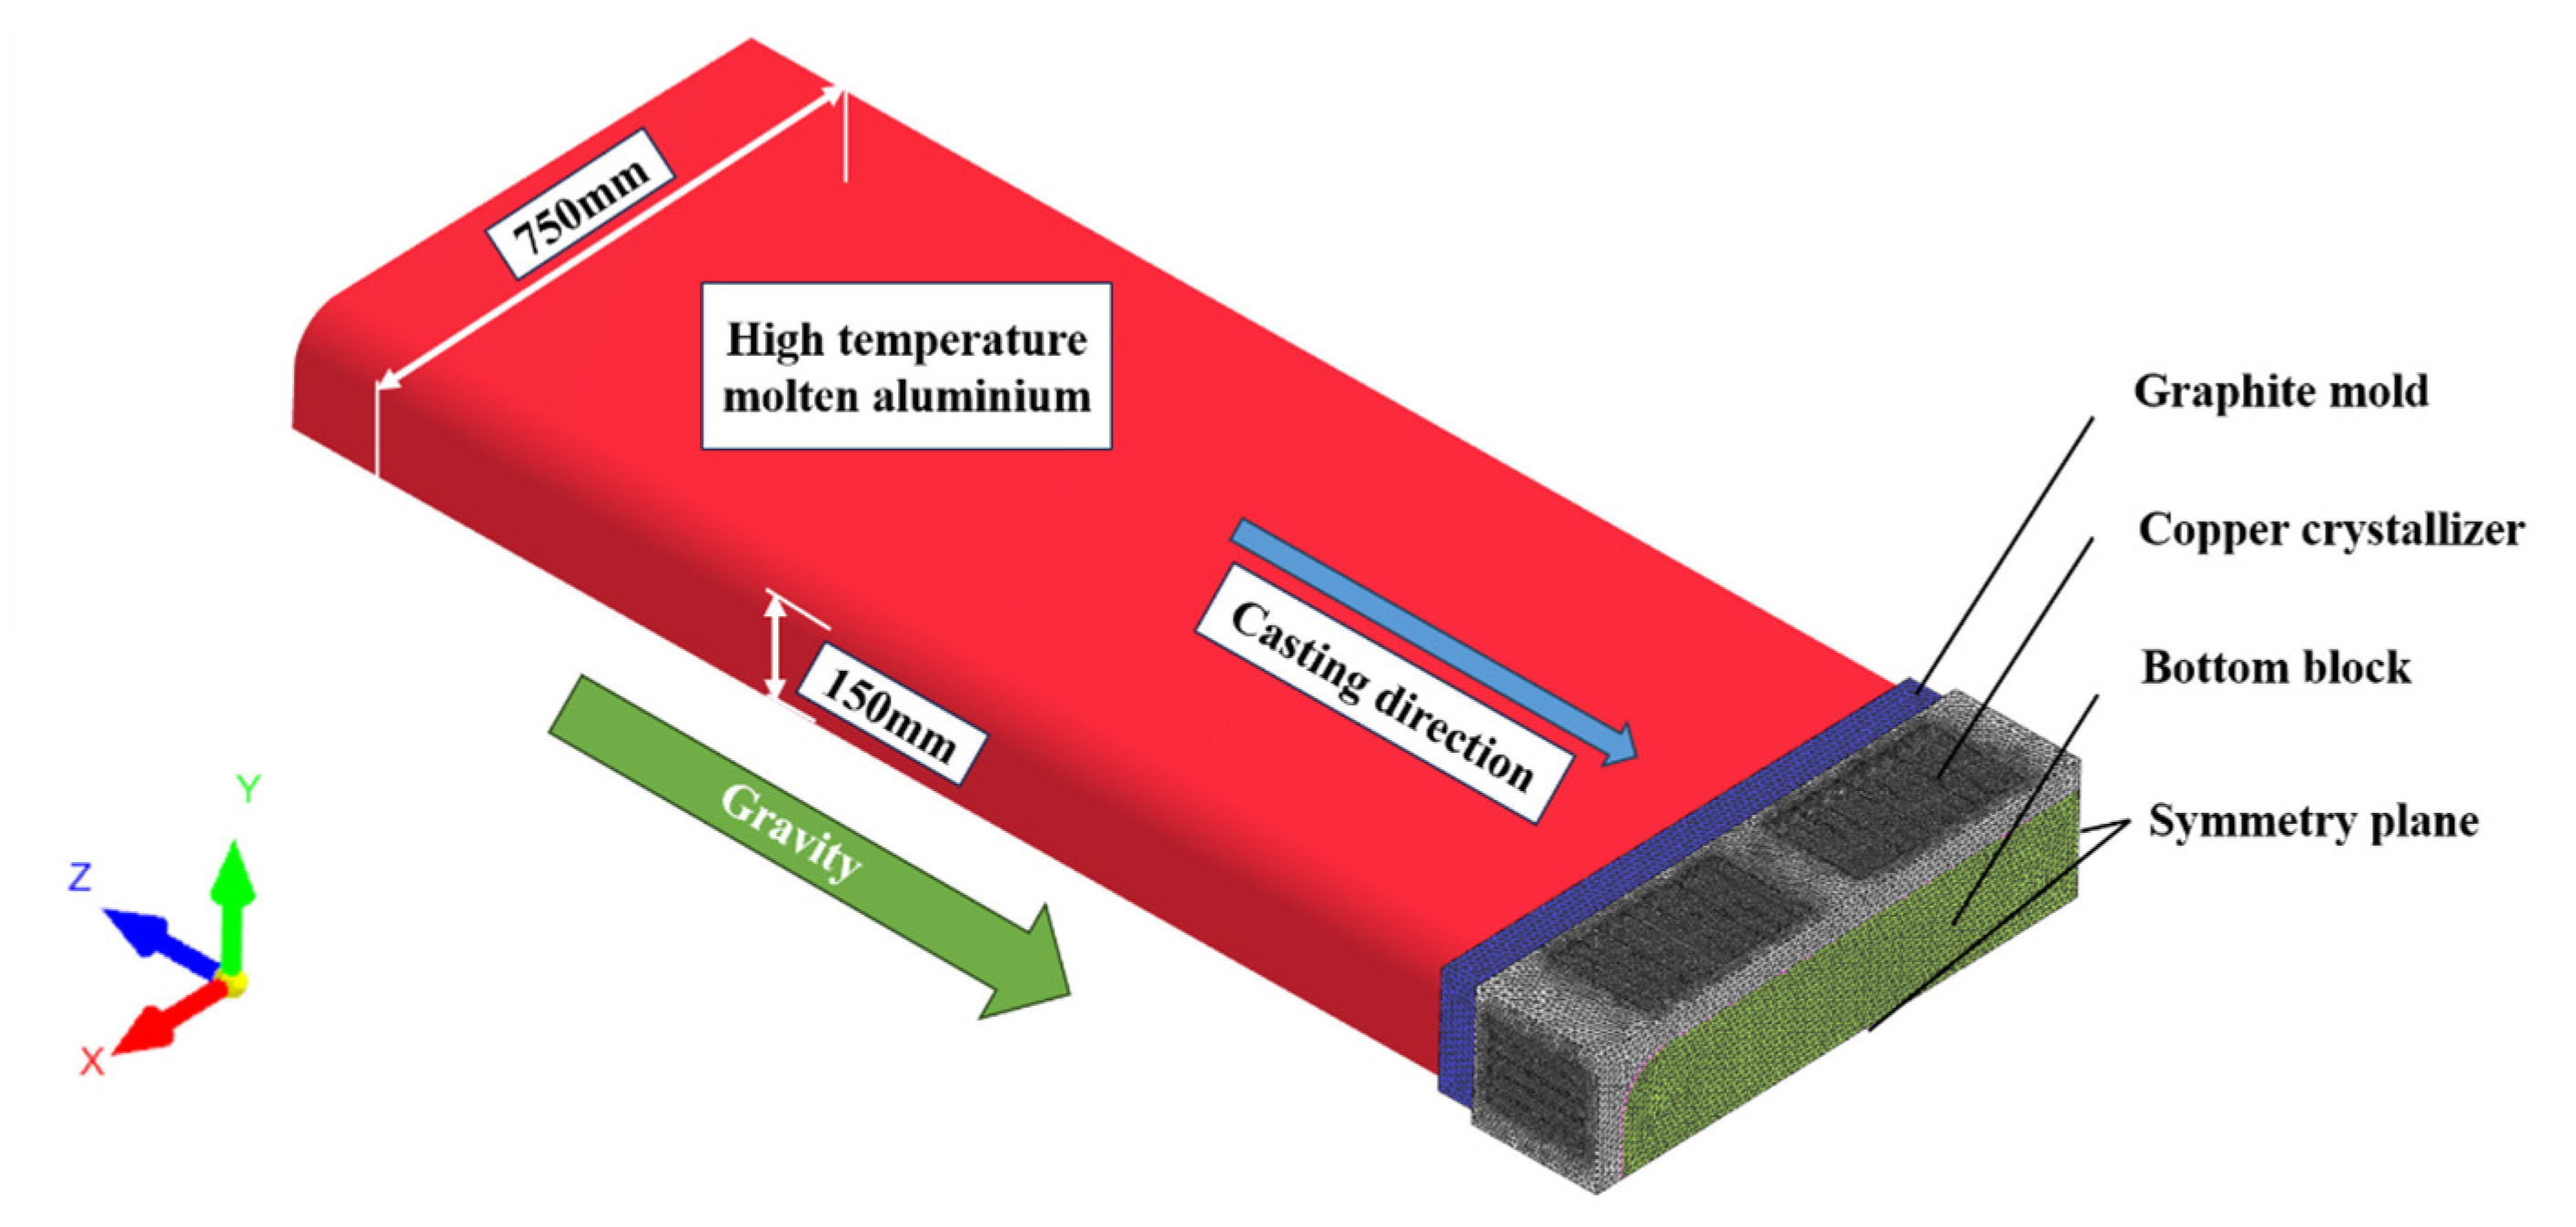
2.3. Geometry and Boundary Conditions of DC Model
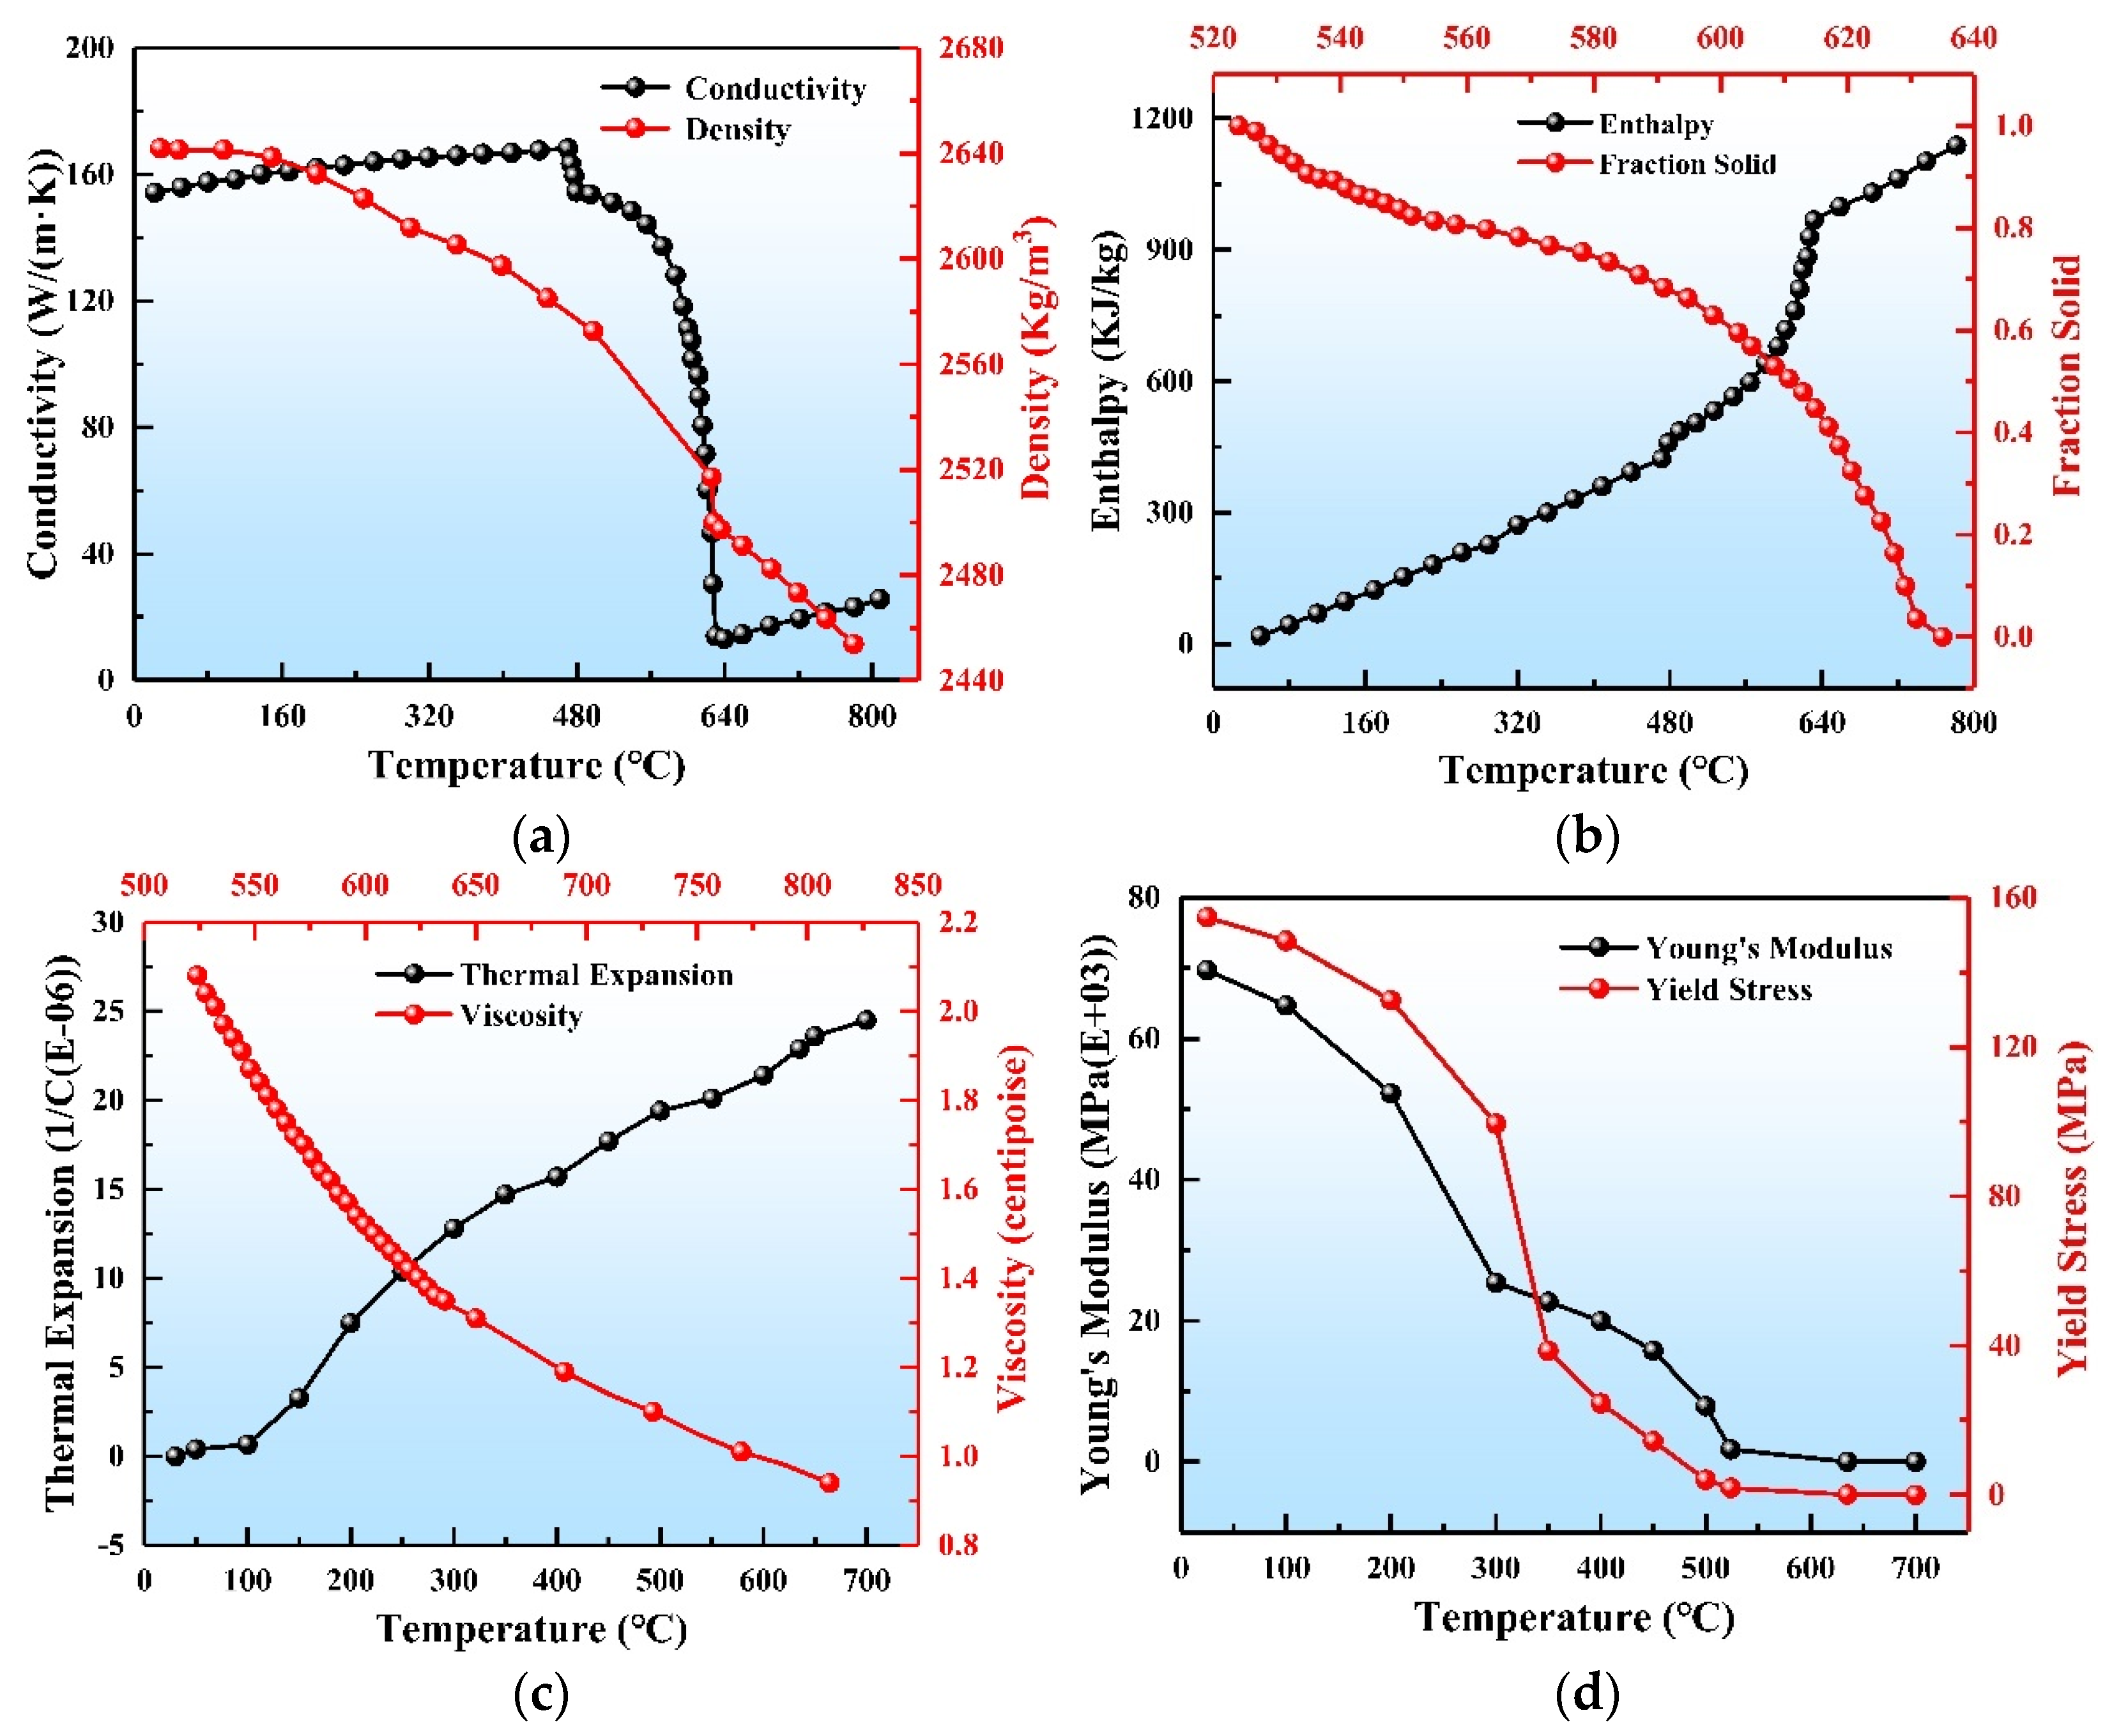
2.3.1. Geometry and Material Properties
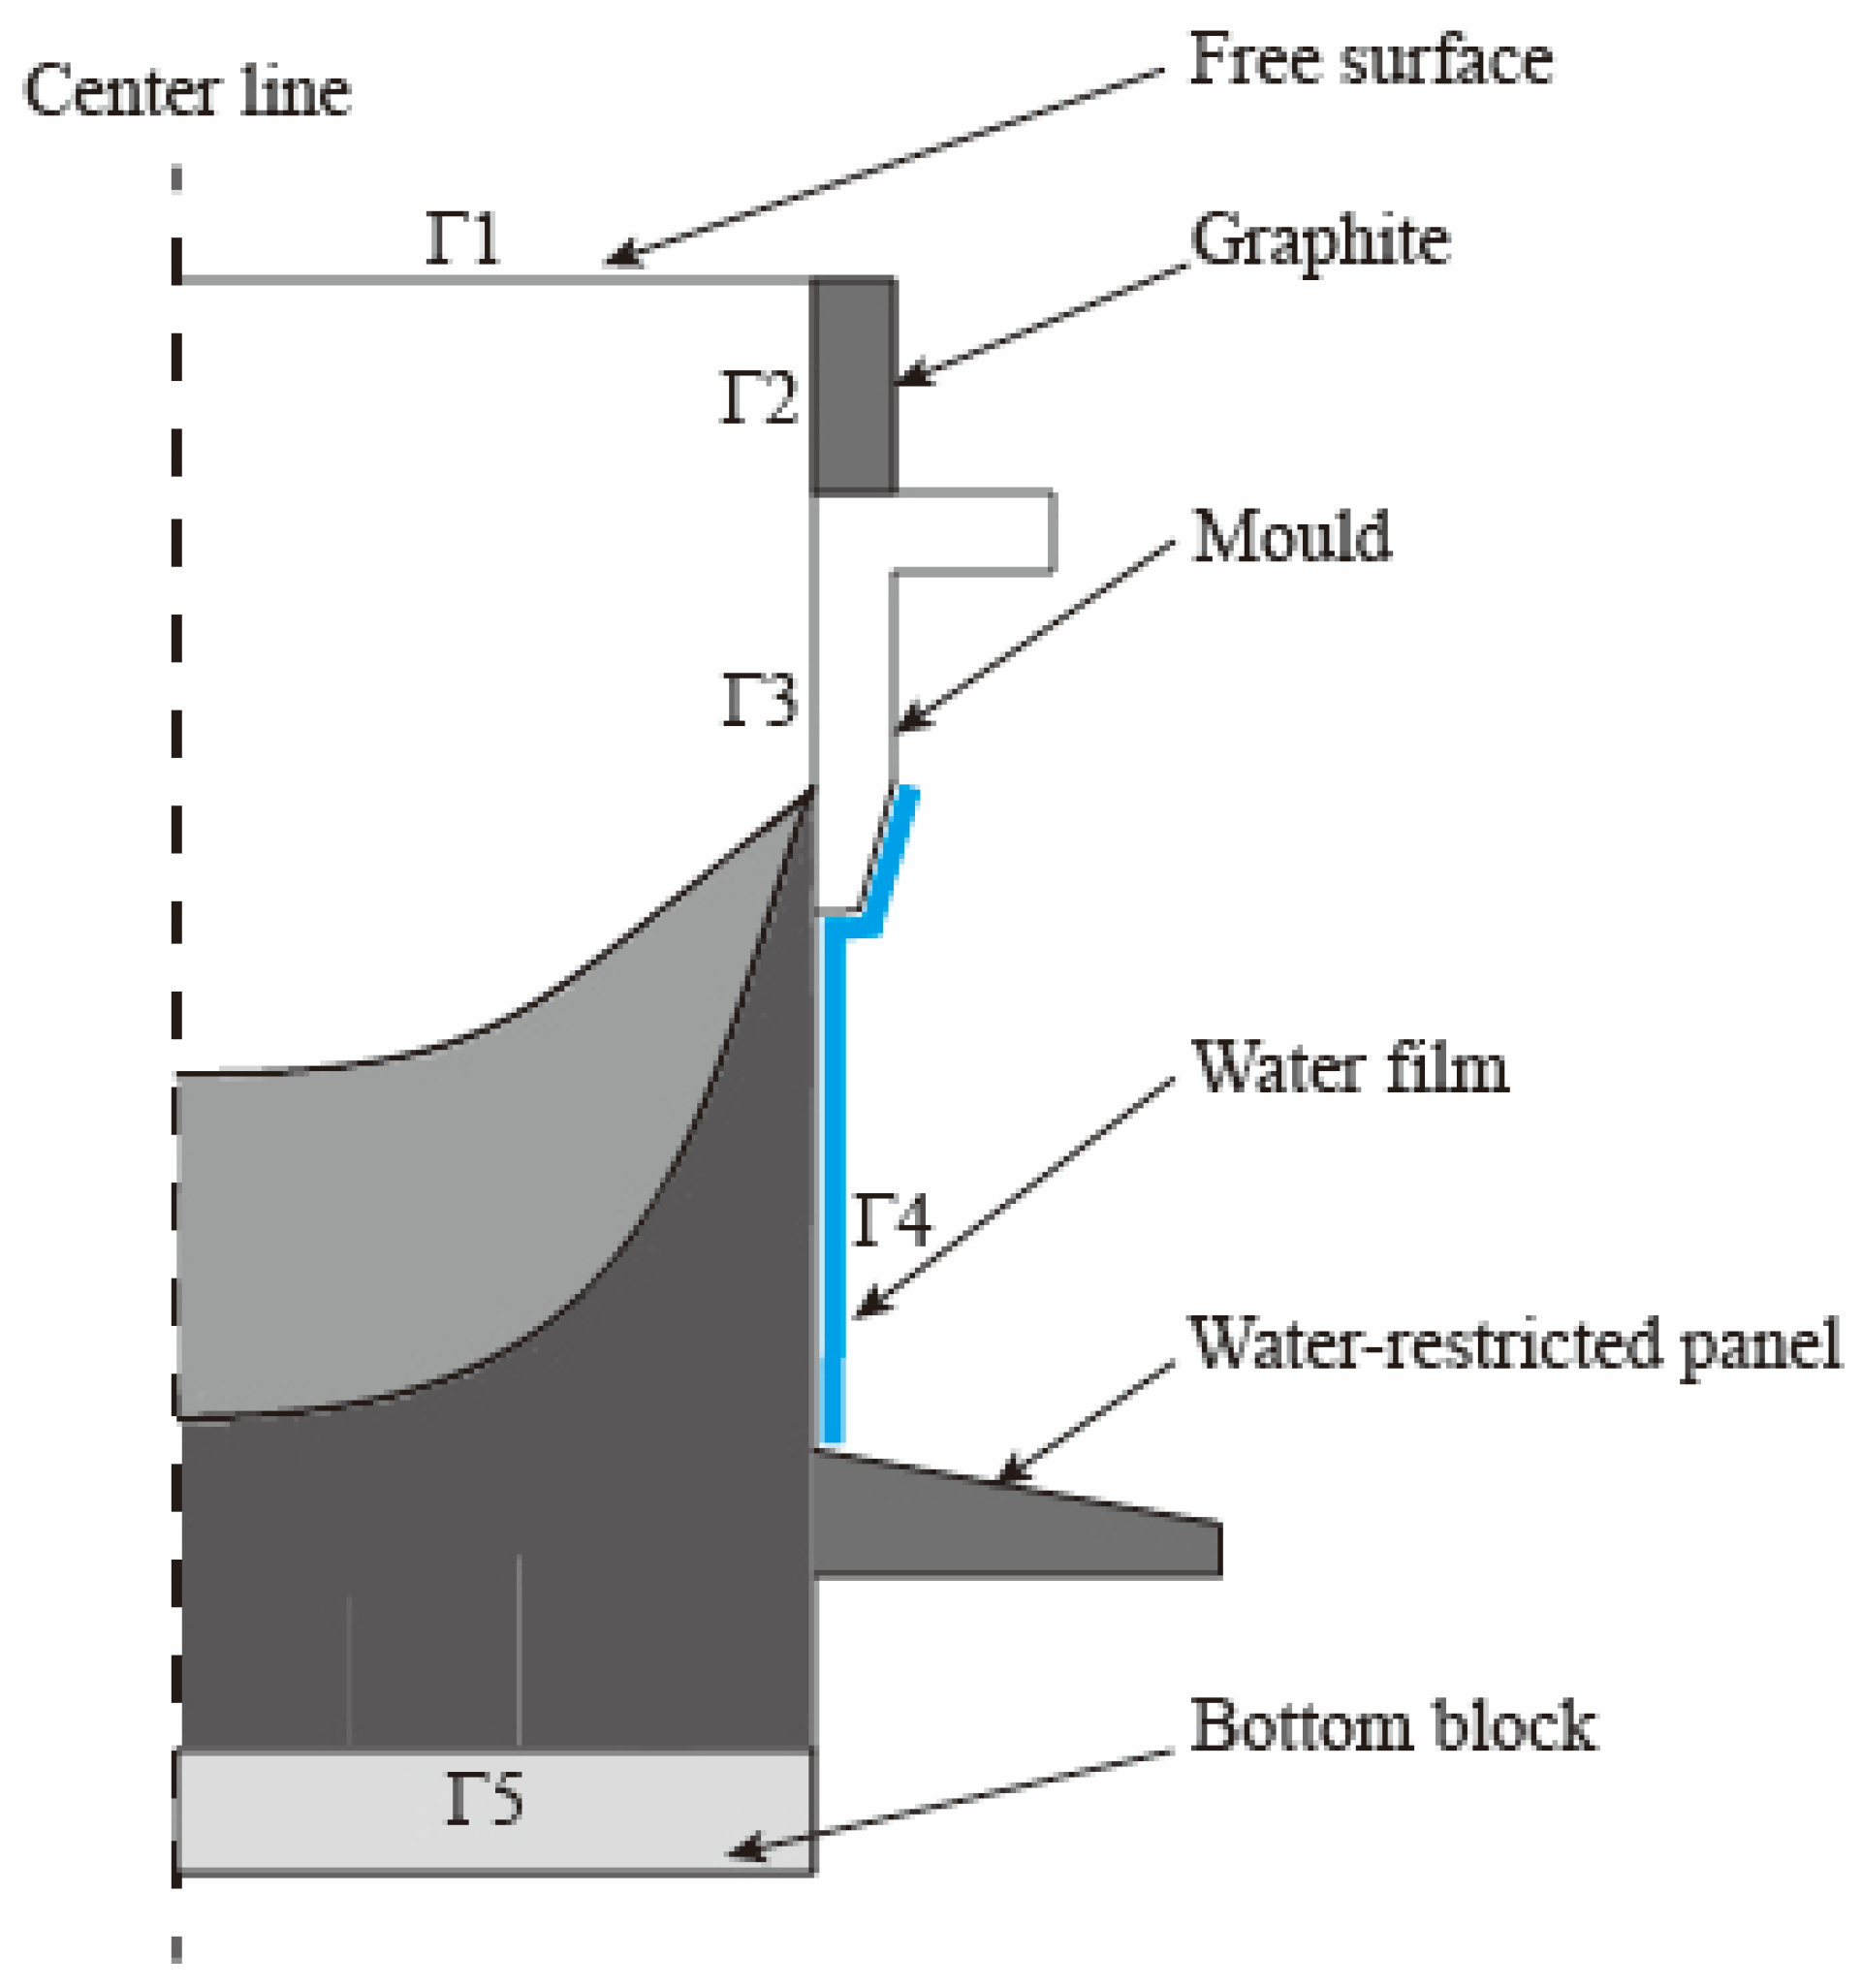
2.3.2. Boundary Conditions
2.4. Numerical Implementation
3. Results and Discussion
3.1. Validation of DC Casting Model
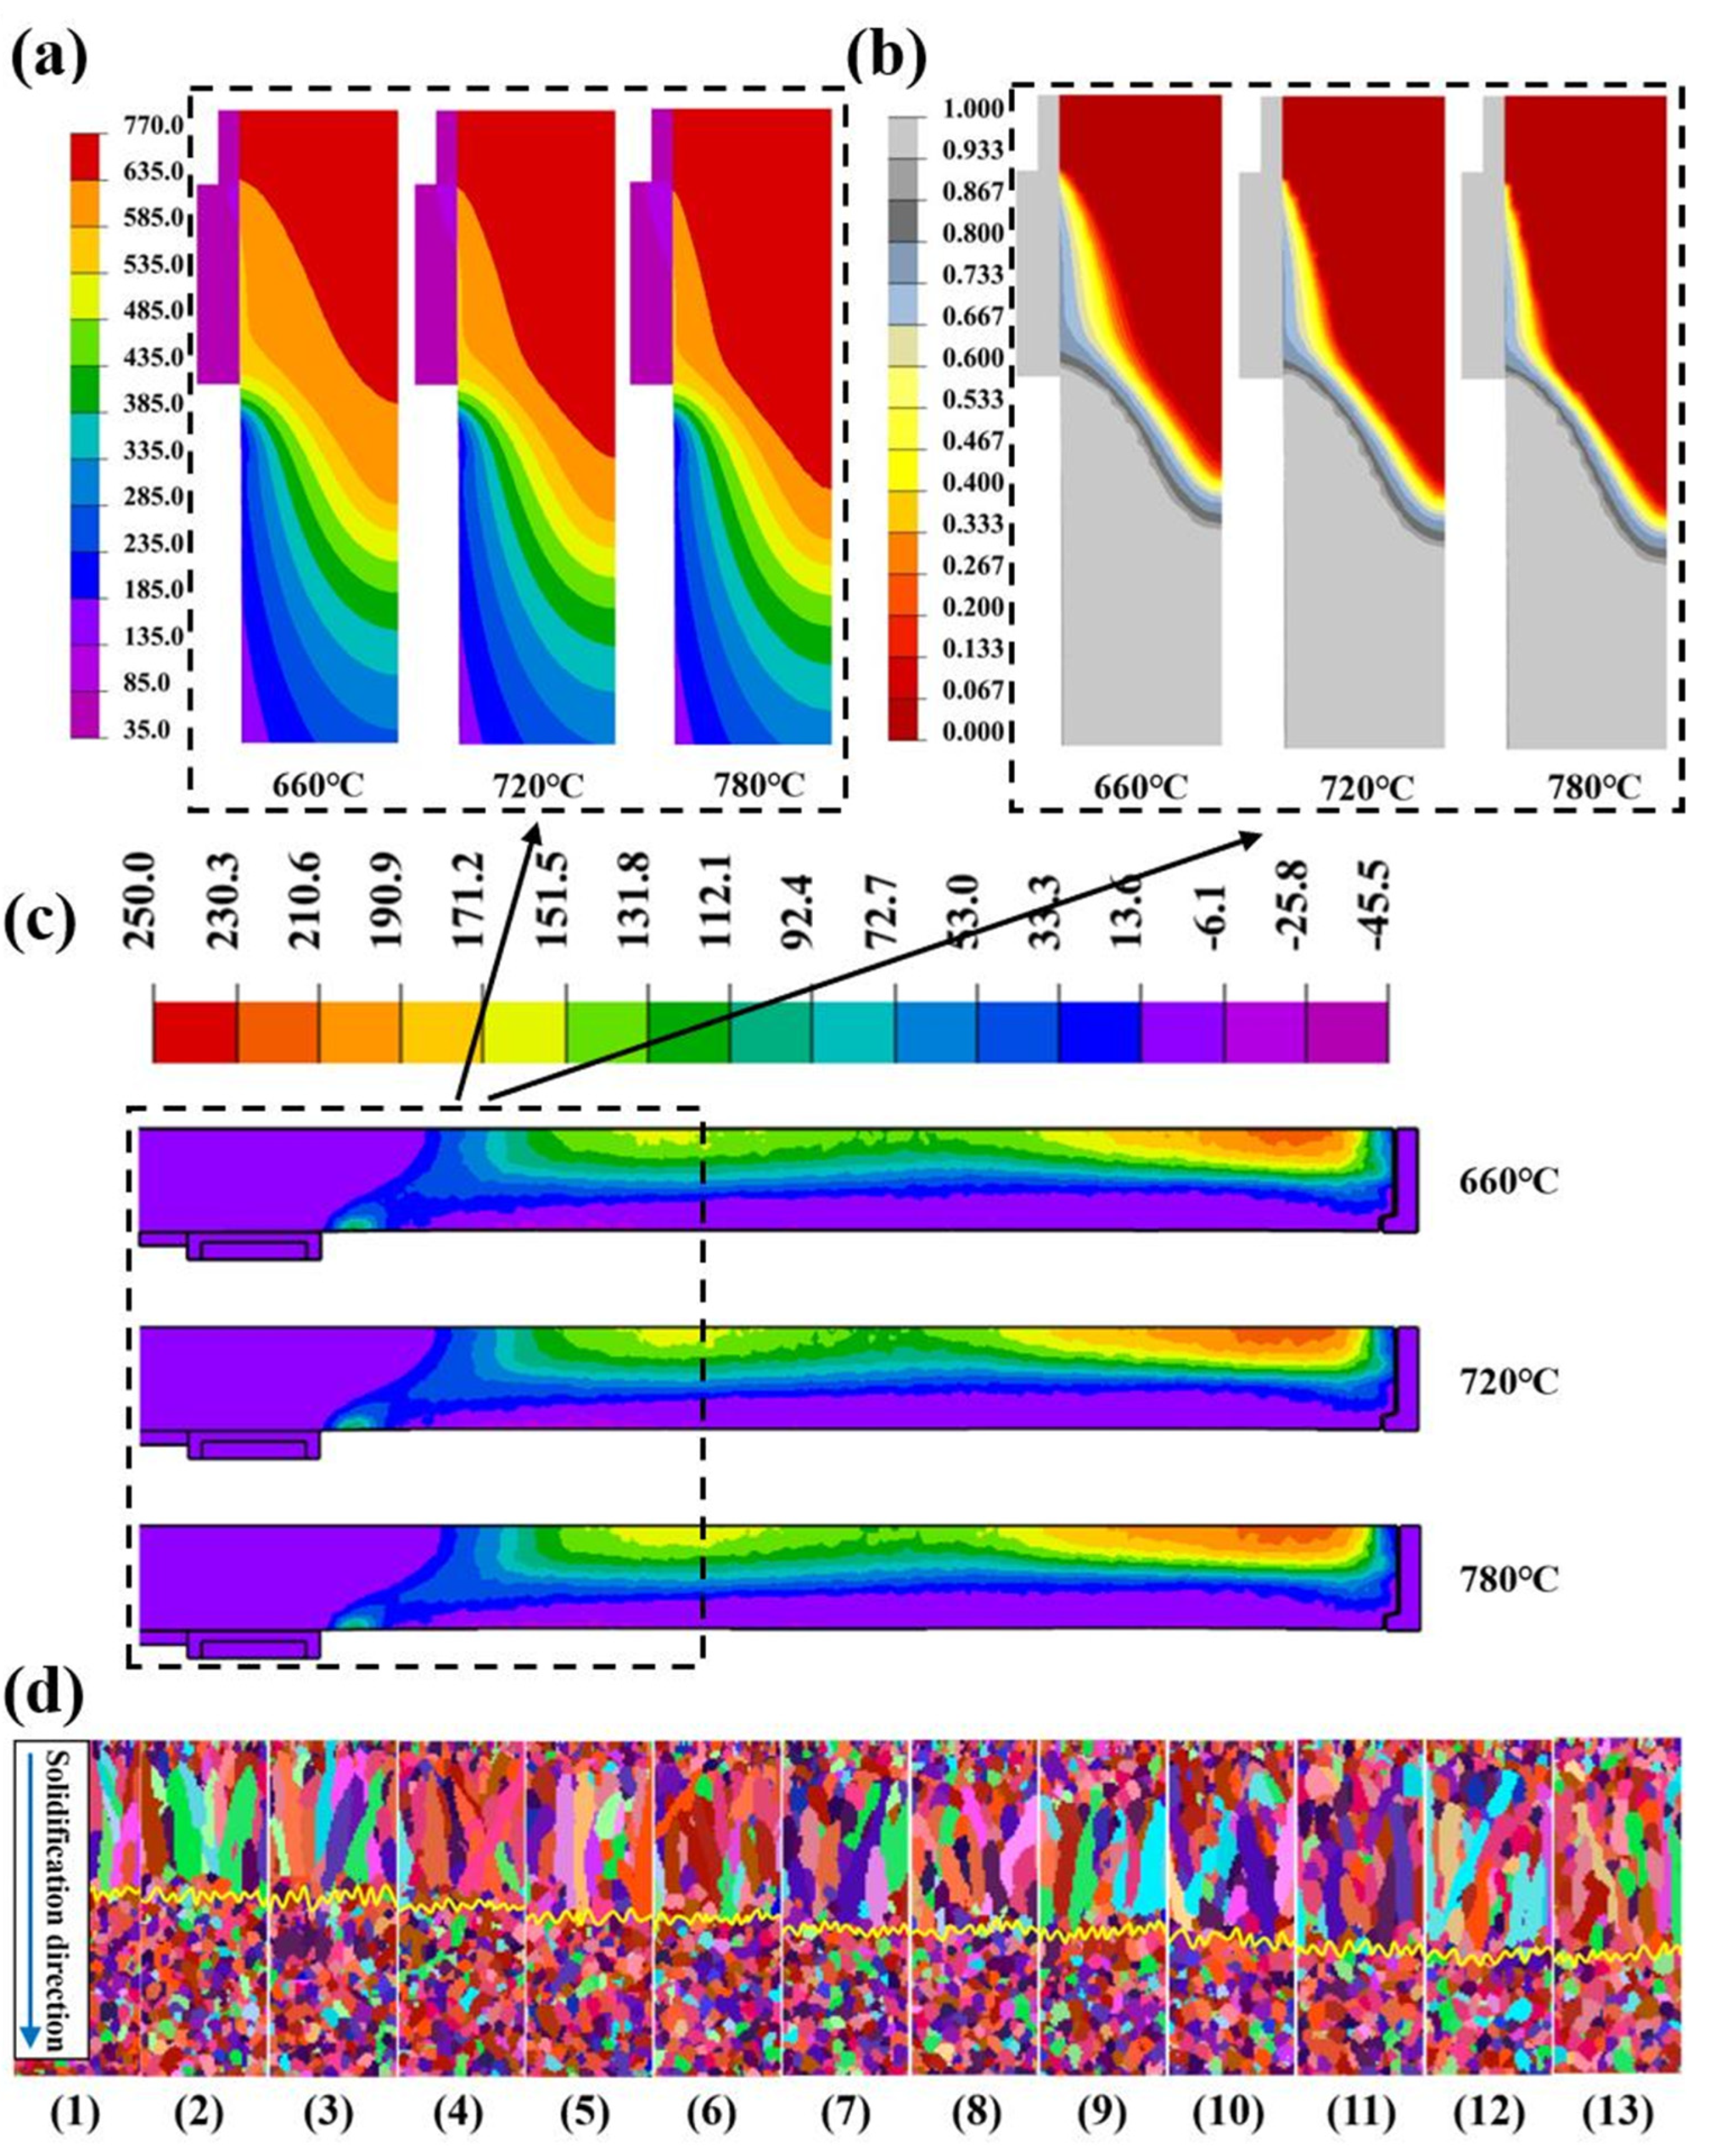
3.2. Effect of Pouring Temperature in DC Casting
3.3. Effect of Casting Speed in DC Casting
3.4. Effect of PCI in DC Casting
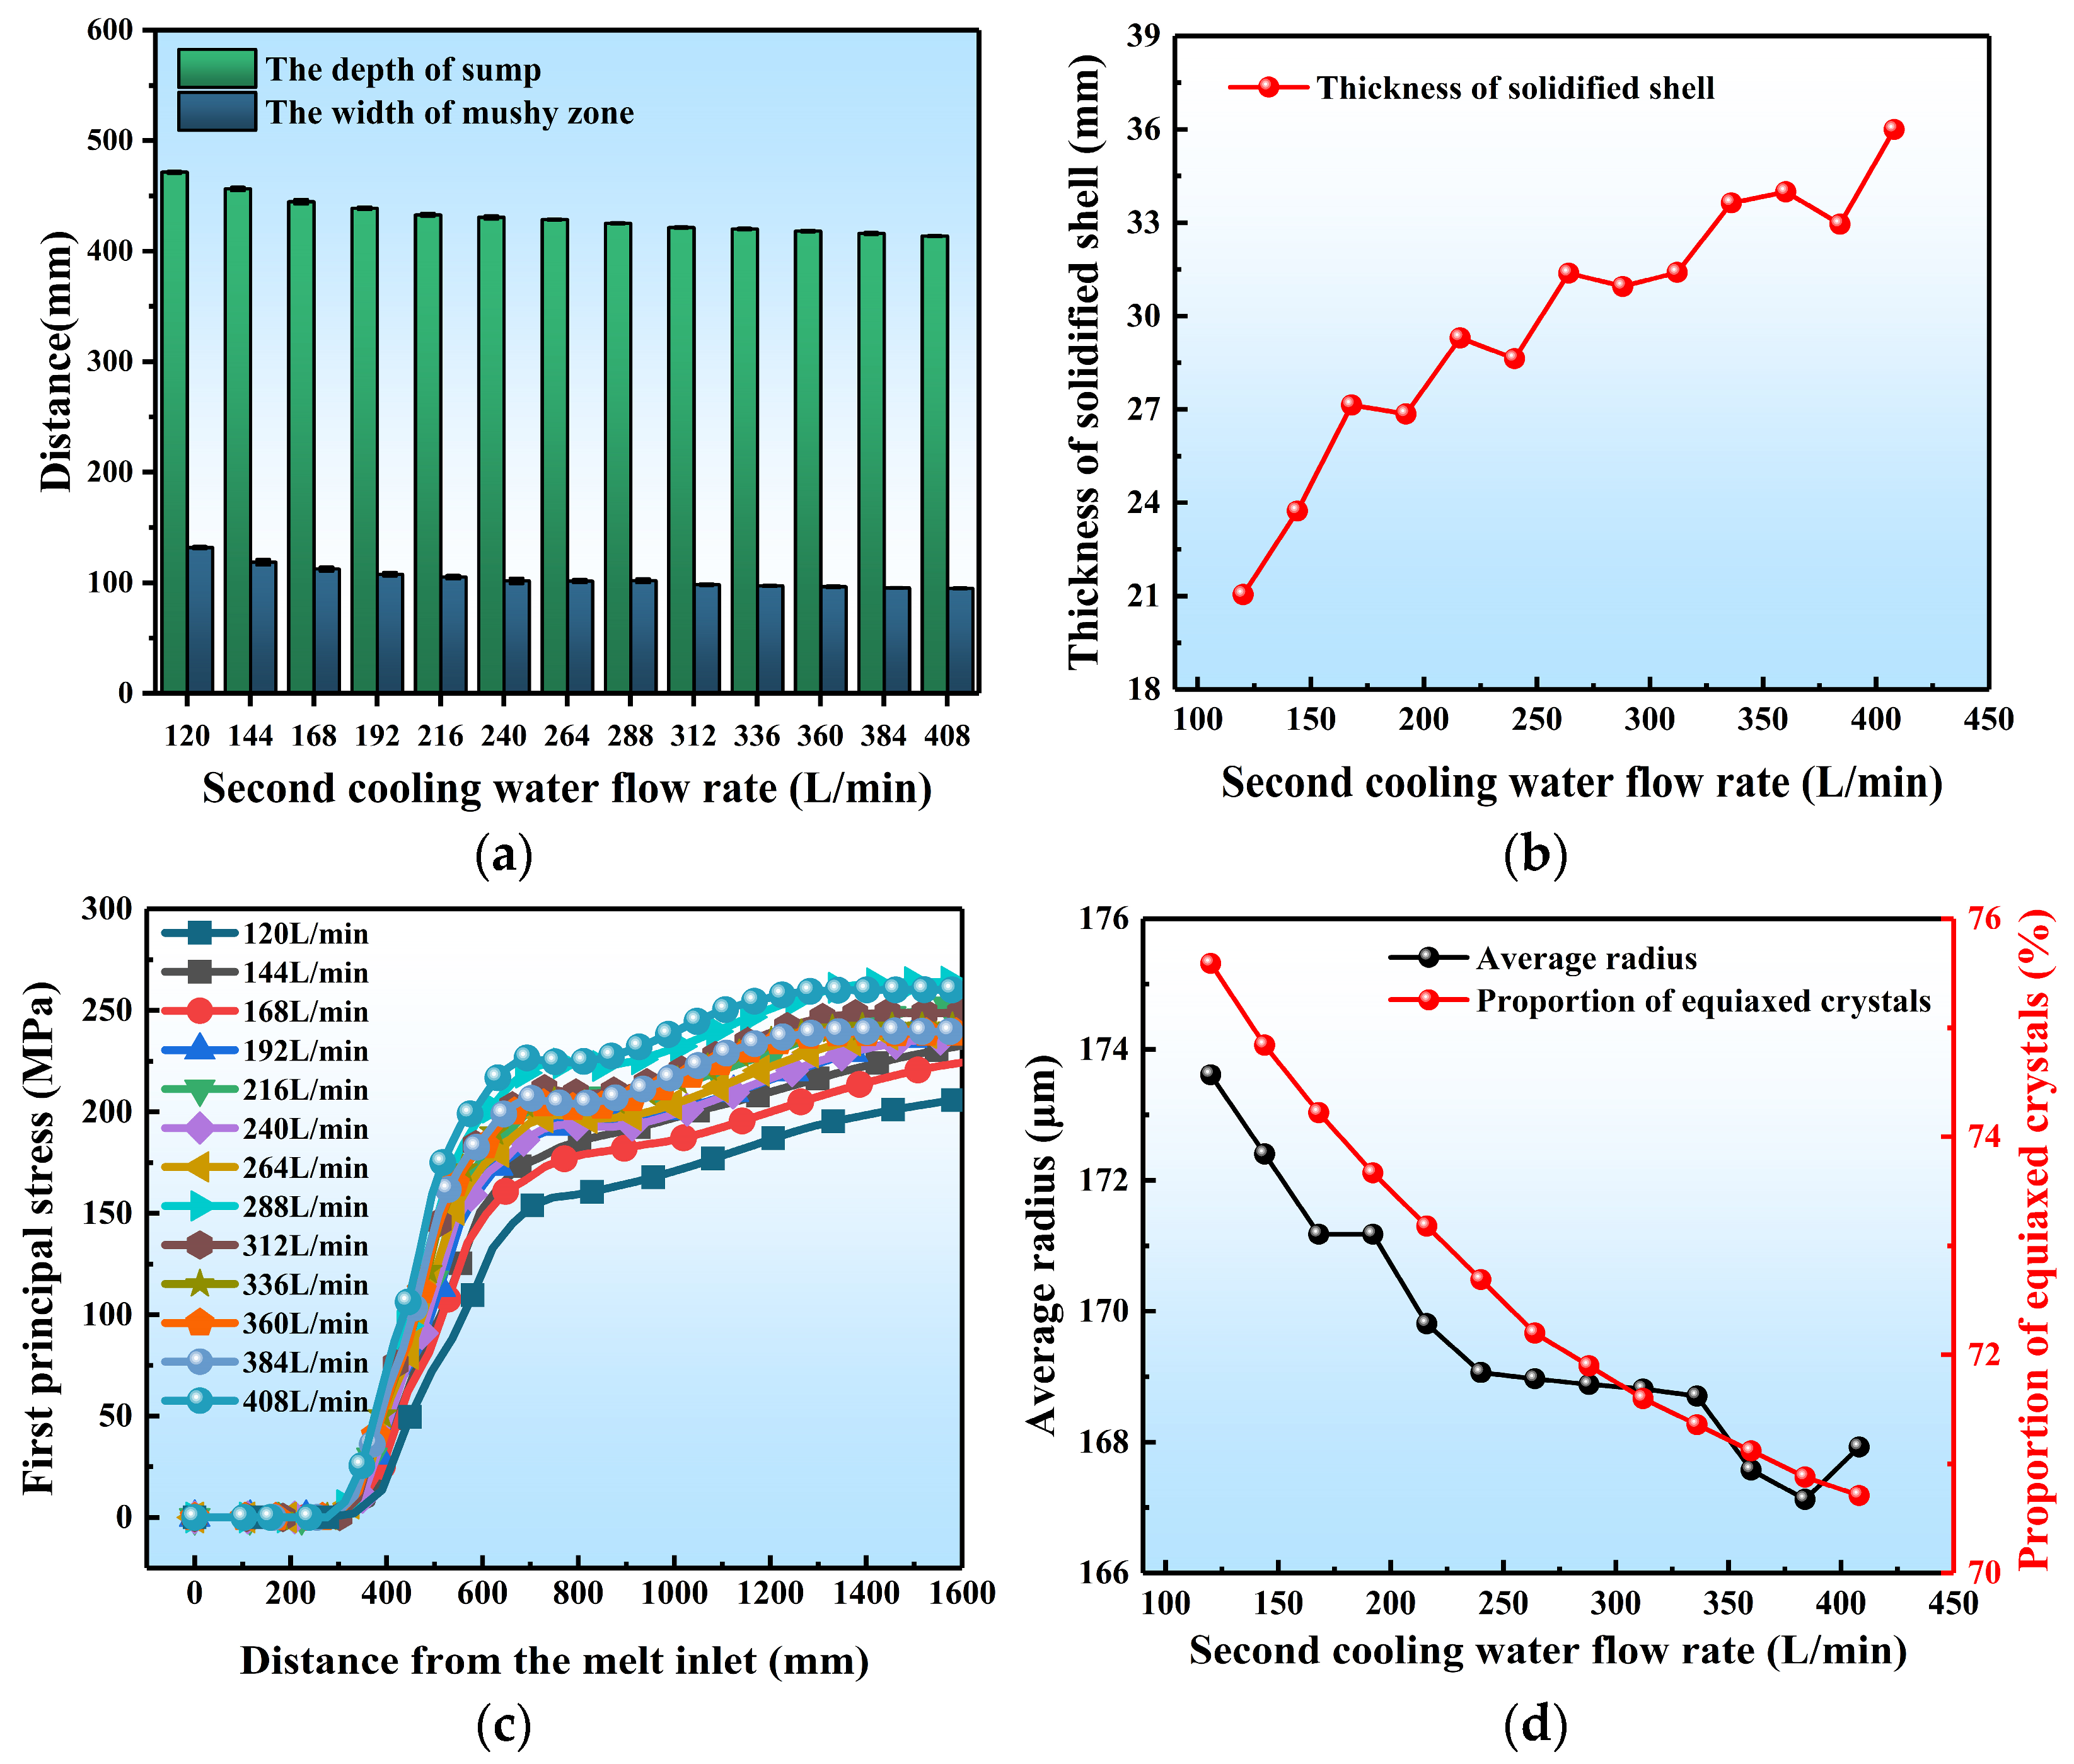
3.5. Effect of SCWFR in DC Casting
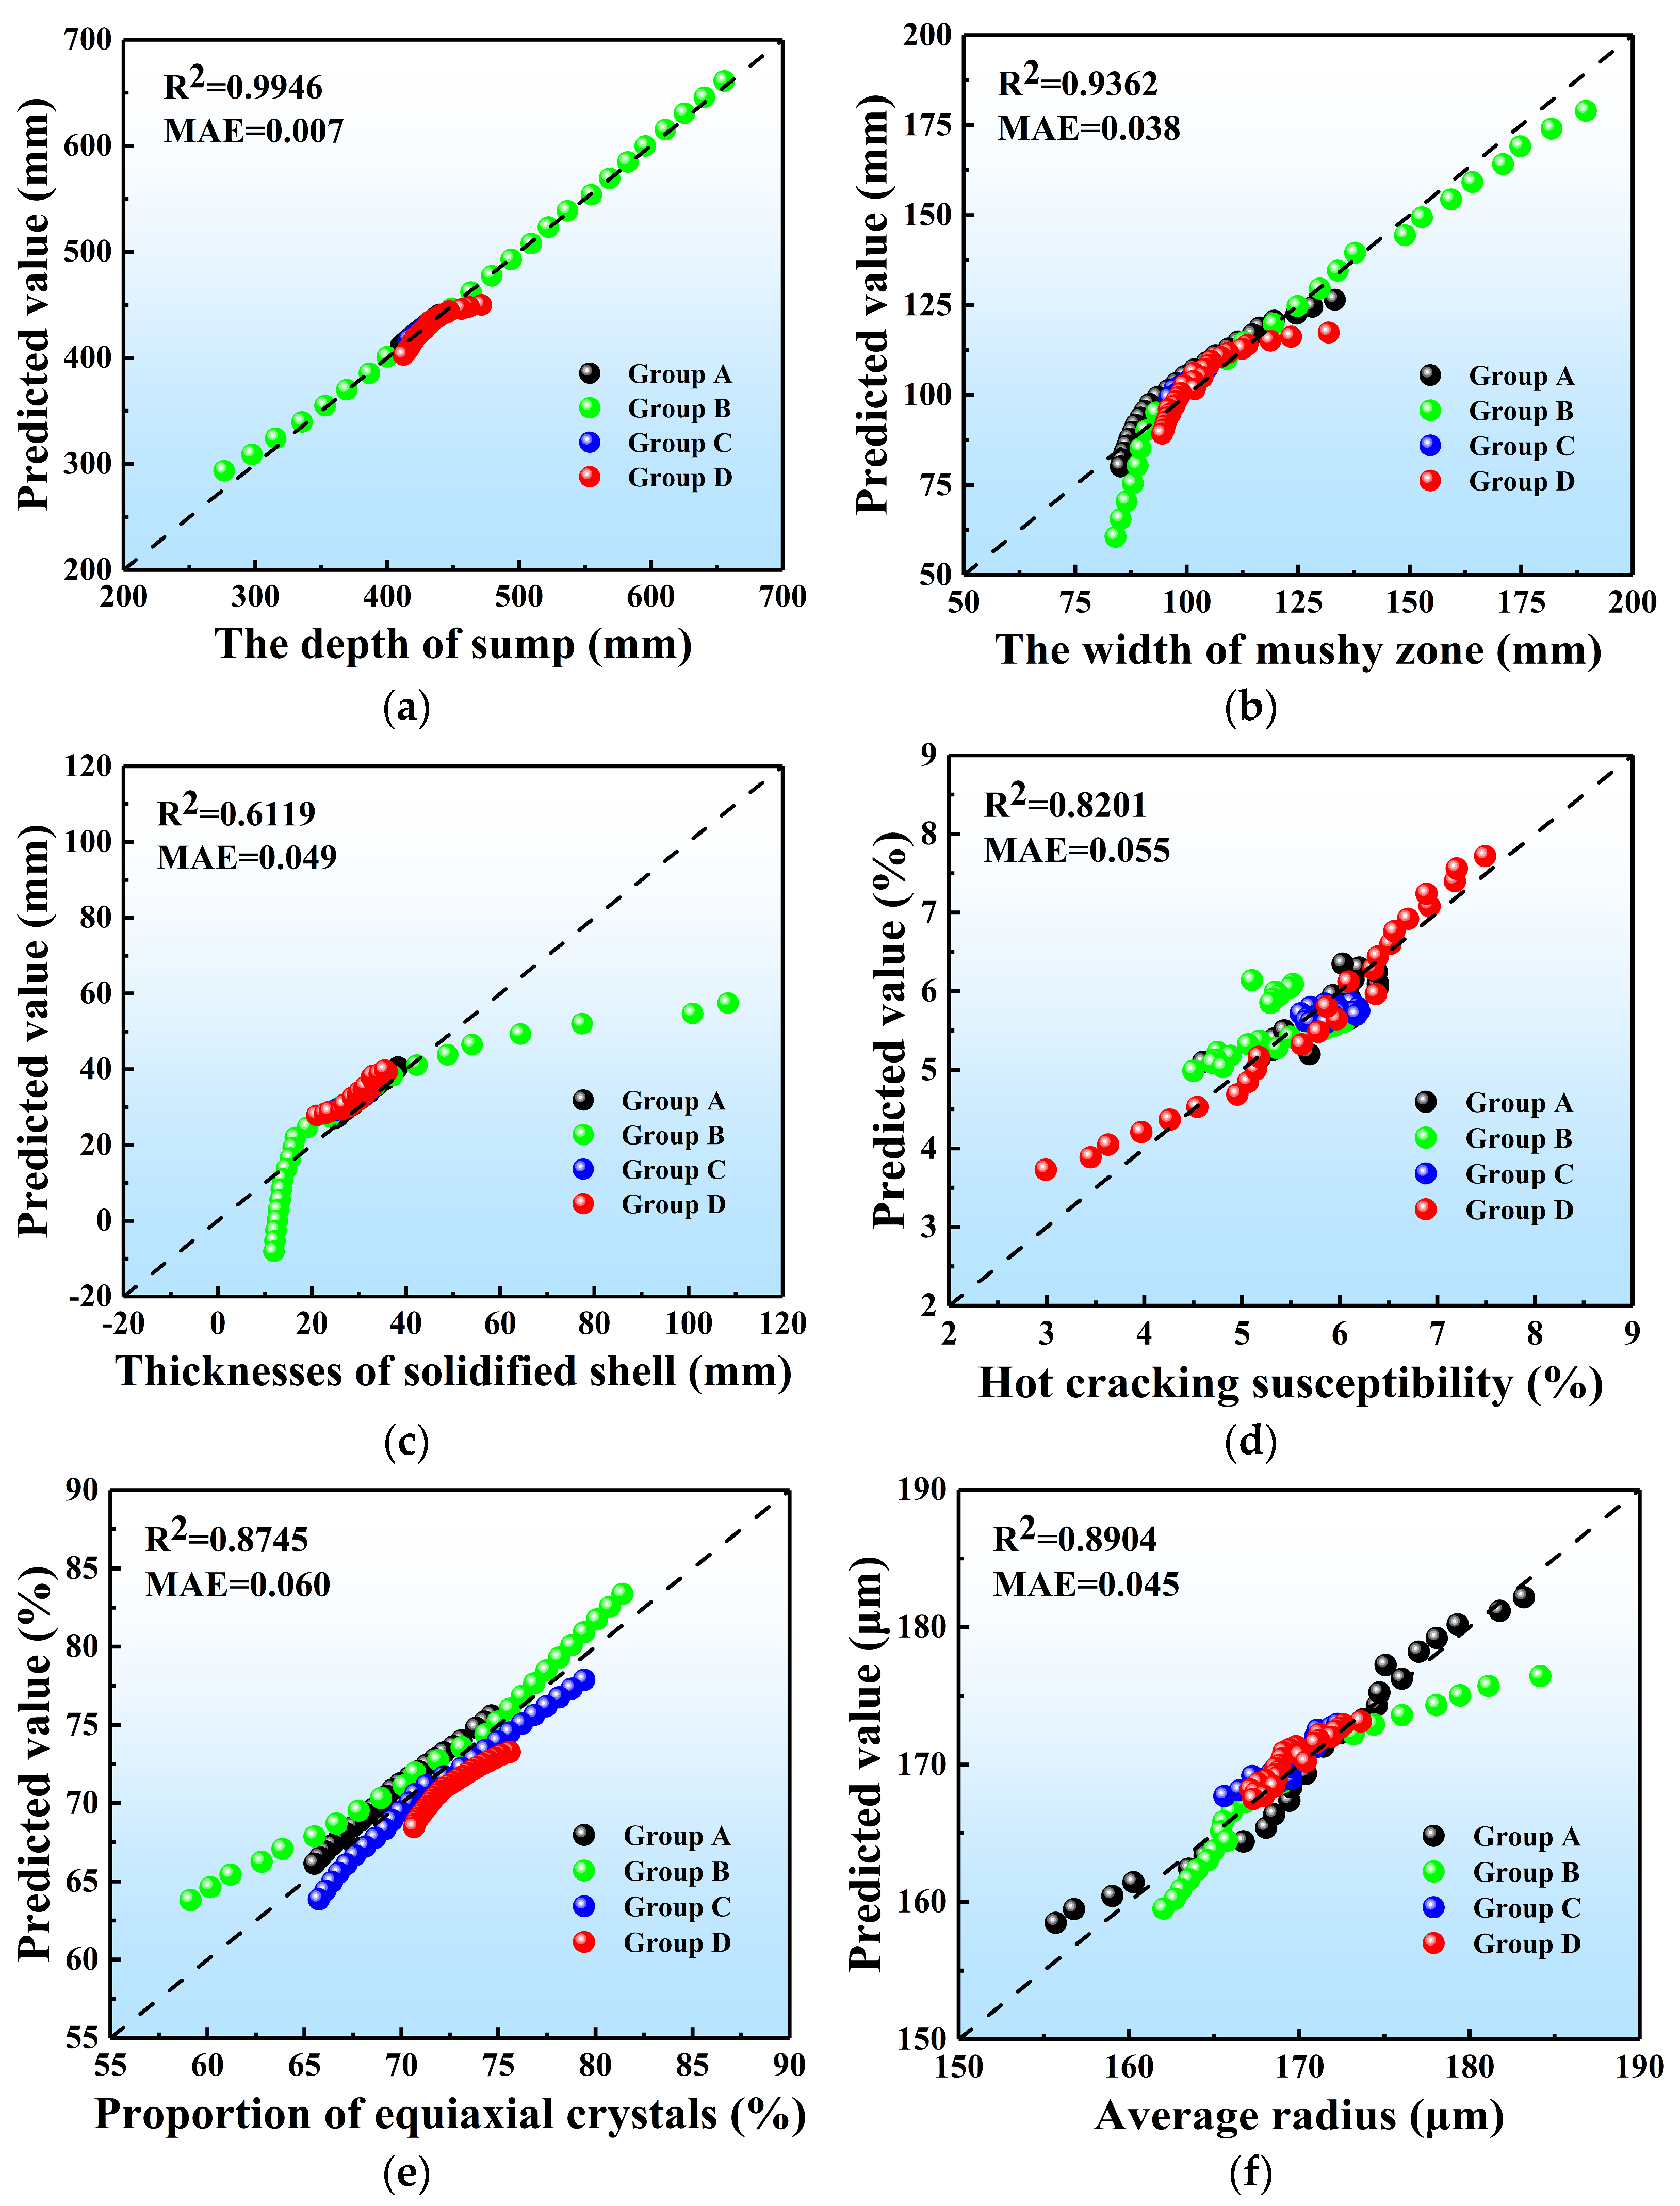
3.6. Multiple Linear Regression Analysis
4. Conclusions
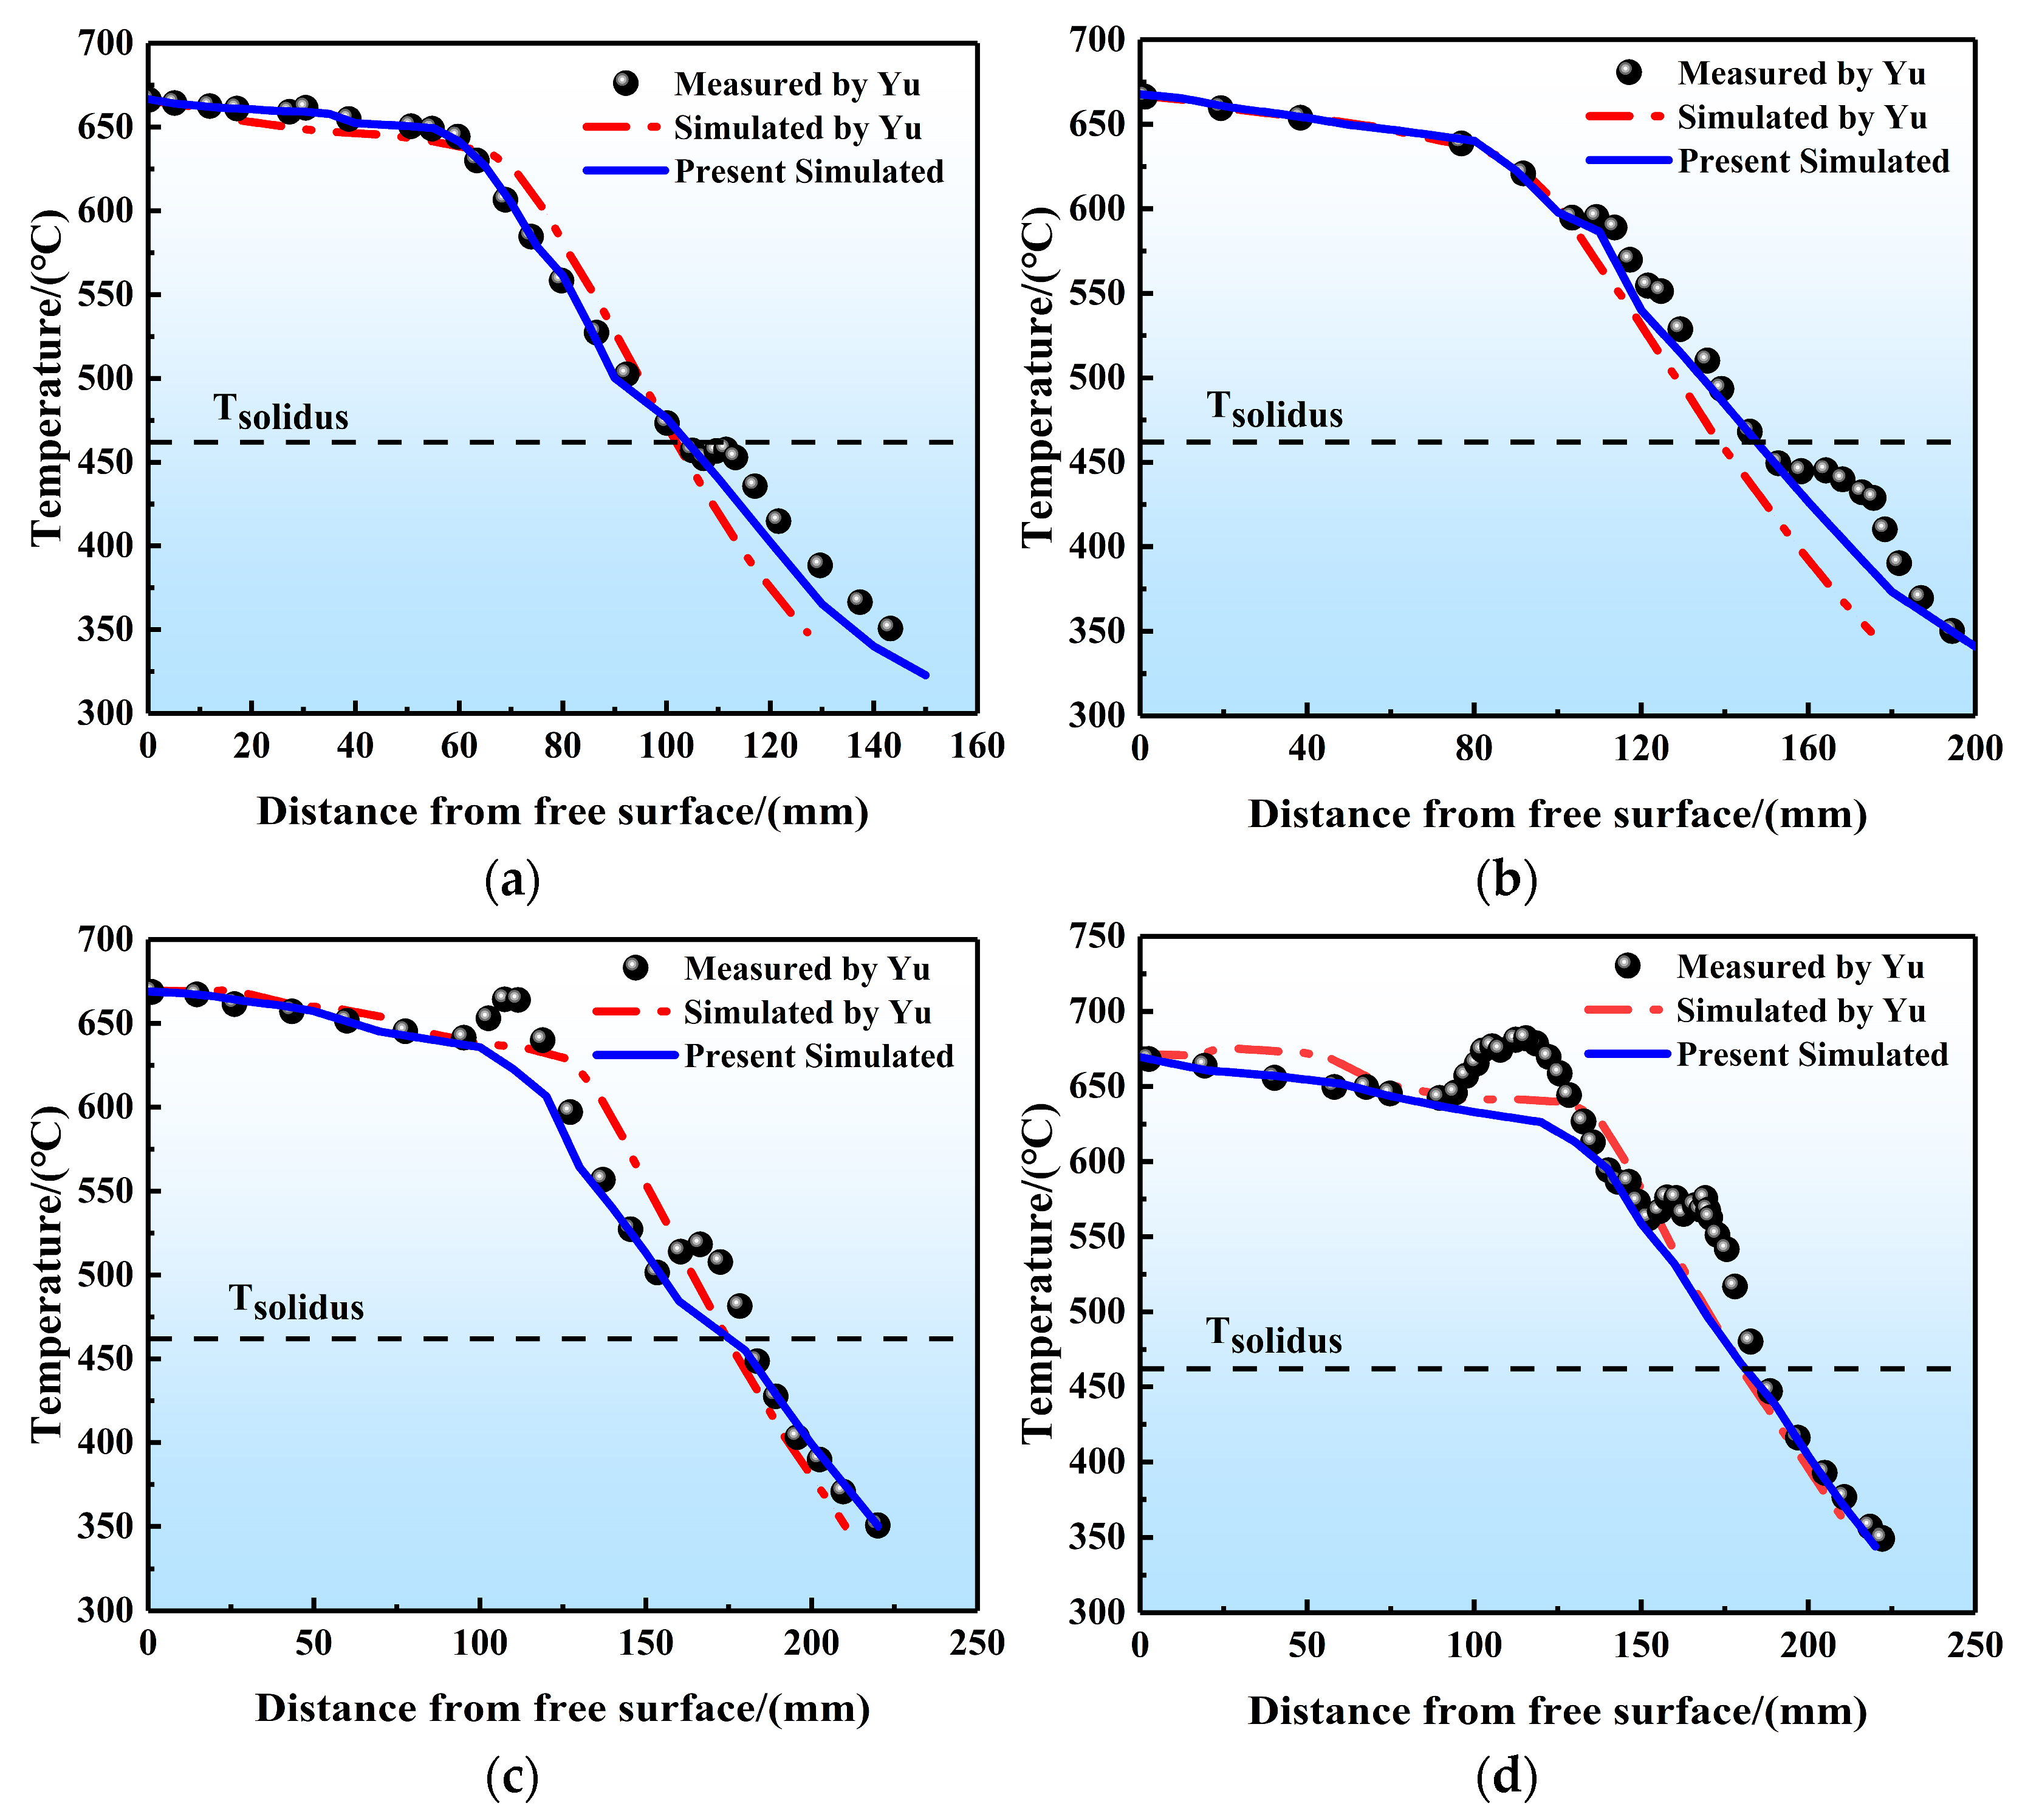
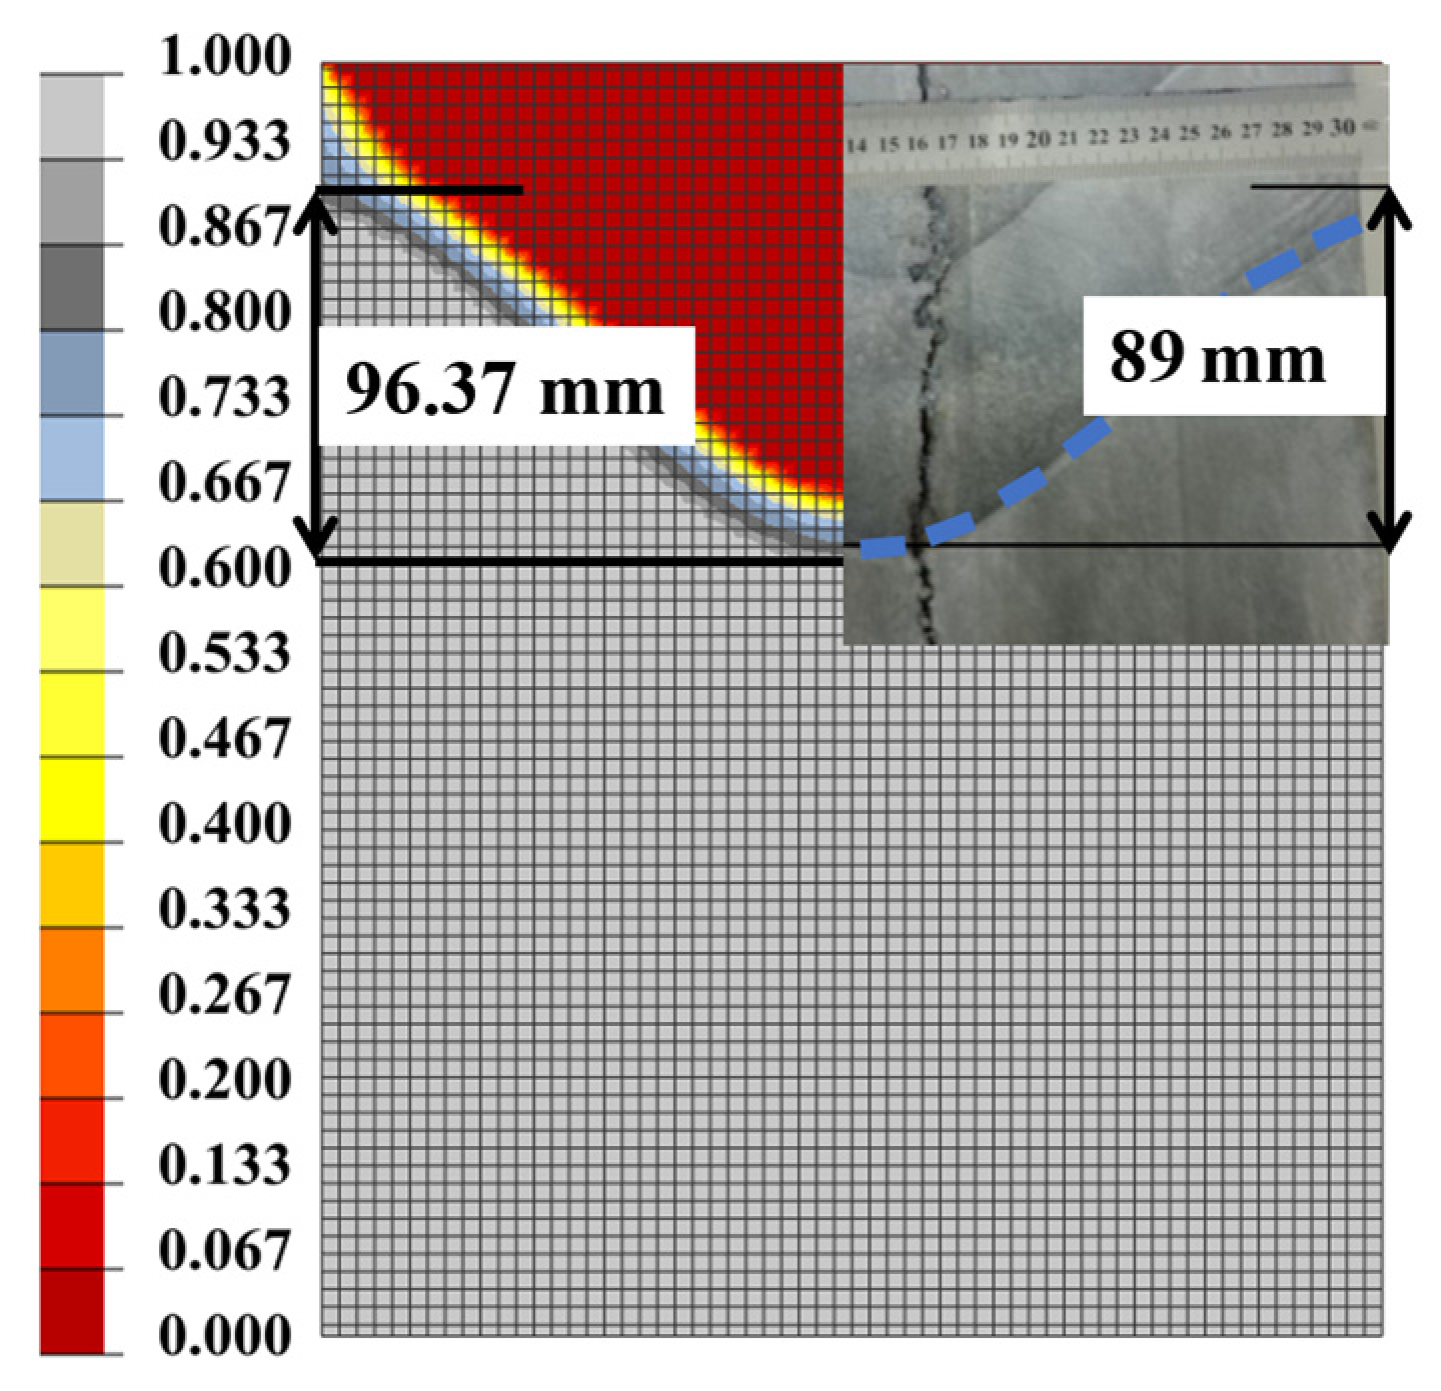
- The finite element model used in this manuscript underwent validation against the temperature and sump profiles measured by Yu et al. [35]. The findings indicated that the model used in this study agrees well with the experimental results.
- Through the analysis of process optimization, we quantitatively analyzed how multiple process parameters (such as pouring temperature, casting speed, and cooling conditions) affect the DC casting process. The results show that the influences of casting parameters on DC casting processes are very complex, exhibiting characteristics such as different weight coefficients, additive or offsetting, non-linearity, and so on.
- A novel and efficient method to predict the DC casting process was proposed. By using the integrated computational method combining numerical simulations with machine learning, a novel predicting model about correlation between the process of aluminum alloy DC casting ingots and the casting recipe was established. This model could accurately predict the quality of DC casting ingots, and show good consistency with experimental results by reasonably taking into account the geometry of ingot and material properties of alloys.
Supplementary Materials
Author Contributions
Funding
Institutional Review Board Statement
Informed Consent Statement
Data Availability Statement
Conflicts of Interest
Abbreviations
| Symbols | Nomenclature |
| The reference concentration value for species s | |
| Solute diffusion coefficient in the liquid phase | |
| Elastic modulus using multiple regression analysis to predict [MPa] | |
| Enthalpy [] | |
| Heat transfer coefficient [], the material Constant | |
| The permeability coefficient | |
| Latent heat of solidification [] | |
| Radius of a dendrite tip, billet | |
| Temperature, Initial, Saturation temperature of cooling water [°C] | |
| Y | Direction of pull |
| Dynamic coefficients of dendrite growth | |
| Specific heat [J] | |
| Yield stress, solid fraction, packing limit | |
| Heat transfer coefficient of the melt contact to the mold [] | |
| Heat transfer coefficient at air gap [], | |
| The partition coefficient | |
| The slope of the Al-X liquidus, the strain rate sensitivity Coefficient | |
| Nucleation density [], the strain hardening coefficient | |
| Maximum nucleation density [] | |
| Truth value, predicted value, the overall mean of truth value | |
| Density [] | |
| Pressure [] | |
| Time [ | |
| Velocity [ | |
| The dynamic viscosity, turbulent viscosity | |
| Regression coefficient, | |
| Node stress [MPa] | |
| Thermal, elastic, plastic strain | |
| Total plastic strain, equivalent plastic strain rate [], initial strain | |
| Regression errors | |
| Residual sum of squares, total sum of squares | |
| Total undercooling [°C] | |
| Mean nucleation undercooling [°C] | |
| Standard deviation of nucleation undercooling [°C] | |
| The undercooling contributions of solute diffusion [°C] | |
| The undercooling contributions of thermal diffusion [°C] | |
| The undercooling contributions of solid/liquid interface curvature [°C] | |
| The undercooling contributions of attachment kinetics [°C] | |
| Surface, bulk nuclear undercooling [K] | |
| Standard deviation of surface, bulk nuclear [K] | |
| Surface, bulk grain density [m−2] | |
| Gibbs–Thomson coefficient ( in this study) | |
| The plastic multiplier | |
| The thermal expansion coefficient, the solute expansion coefficient for species s |
References
- Lebon, G.B.; Li, H.-T.; Patel, J.B.; Assadi, H.; Fan, Z. Numerical modelling of melt-conditioned direct-chill casting. Appl. Math. Model. Model. 2020, 77, 1310–1330. [Google Scholar] [CrossRef]
- Zhang, L.; Li, X.; Li, R.; Jiang, R.; Zhang, L.; Guan, S.; Liu, B. Direct-Chill Casting of Large-Scale Al–Cu Alloy Ingot under Ultrasound: Distribution of Physical Fields and Analysis of Microstructure. Adv. Eng. Mater. 2021, 23, 2100432. [Google Scholar] [CrossRef]
- Bolduc, S.; Kiss, L. Sensitivity study of the influence of the water boiling parameters on aluminum semi-continuous DC casting. Int. J. Therm. Sci. 2020, 151, 106276. [Google Scholar] [CrossRef]
- Subroto, T.; Lebon, G.; Eskin, D.; Skalicky, I.; Roberts, D.; Tzanakis, I.; Pericleous, K. Numerical modelling and experimental validation of the effect of ultrasonic melt treatment in a direct-chill cast AA6008 alloy billet. J. Mater. Res. Technol. 2021, 12, 1582–1596. [Google Scholar] [CrossRef]
- Xu, Y.; Wang, J.; Guo, S.; Li, X.; Xue, G. Effects of water-restricted panel on the casting process of high strength aluminum alloy ingots. J. Mater. Process. Technol. 2011, 211, 78–83. [Google Scholar] [CrossRef]
- Lalpoor, M.; Eskin, D.; Katgerman, L. Cold Cracking Development in AA7050 Direct Chill–Cast Billets under Various Casting Conditions. Metall. Mater. Trans. A 2010, 41, 2425–2434. [Google Scholar] [CrossRef]
- Rao, R.; Kalyankar, V.; Waghmare, G. Parameters optimization of selected casting processes using teaching–learning-based optimization algorithm. Appl. Math. Model. 2014, 38, 5592–5608. [Google Scholar] [CrossRef]
- Kumar, R.; Jha, P. Effect of electromagnetic stirring on the transient flow, solidification and inclusion movements in the continuous casting slab mold. Int. J. Numer. Methods Heat Fluid Flow 2023, 33, 3716–3733. [Google Scholar] [CrossRef]
- Drezet, J.; Pirling, T. Influence of a wiper on residual stresses in AA7050 rolling plate ingots. J. Mater. Process. Technol. 2014, 214, 1372–1378. [Google Scholar] [CrossRef]
- Yamamoto, T.; Komarov, S. Influence of ultrasound irradiation on transient solidification characteristics in DC casting process: Numerical simulation and experimental verification. J. Mater. Process. Technol. 2021, 294, 117116. [Google Scholar] [CrossRef]
- Luo, H.; Jie, W.; Gao, Z.; Zheng, Y. Numerical simulation for macrosegregation in direct-chill casting of 2024 aluminum alloy with an extended continuum mixture model. Trans. Nonferrous Met. Soc. China 2018, 28, 1007–1015. [Google Scholar] [CrossRef]
- Han, Y.; Zhang, X.; Yu, E.; Sun, L.; Gao, Y. Numerical analysis of temperature field and structure field in horizontal continuous casting process for copper pipes. Int. J. Heat Mass Transf. 2017, 115, 294–306. [Google Scholar] [CrossRef]
- Kolahdooz, A.; Nourouzi, S.; Bakhshi, M.; Hosseinipour, S. Experimental investigation of thixoforging parameters effects on the microstructure and mechanical properties of the helical gearbox cap. J. Mech. Sci. Technol. 2014, 28, 4257–4265. [Google Scholar] [CrossRef]
- Cemernek, D.; Cemernek, S.; Gursch, H.; Pandeshwar, A.; Leitner, T.; Berger, M.; Klösch, G.; Kern, R. Machine learning in continuous casting of steel: A state-of-the-art survey. J. Intell. Manuf. 2021, 33, 1561–1579. [Google Scholar] [CrossRef]
- Jaskowiec, K.; Wilk-Kolodziejczyk, D.; Bartłomiej, S.; Reczek, W.; Bitka, A.; Malysza, M.; Doroszewski, M.; Pirowski, Z.; Boron, L. Assessment of the Quality and Mechanical Parameters of Castings Using Machine Learning Methods. Materials 2022, 15, 2884. [Google Scholar] [CrossRef] [PubMed]
- Xu, E.; Zou, F.; Shan, P. A multi-stage fault prediction method of continuous casting machine based on Weibull distribution and deep learning. Alex. Eng. J. 2023, 77, 165–175. [Google Scholar] [CrossRef]
- Rosnitschek, T.; Erber, M.; Alber-Laukant, B.; Hartmann, C.; Volk, W.; Rieg, F.; Tremmel, S. Predicting the solidification time of low pressure die castings using geometric feature-based machine learning metamodels. Procedia CIRP 2023, 118, 1102–1107. [Google Scholar] [CrossRef]
- Pastor-Lopez, I.; Sanz, B.; Tellaeche, A.; Tellaeche, A.; Psaila, G.; Puerta, J.; Bringas, P. Quality assessment methodology based on machine learning with small datasets: Industrial castings defects. Neurocomputing 2021, 456, 622–628. [Google Scholar] [CrossRef]
- Lee, S.; Tama, B.; Choi, C.; Hwang, J.; Bang, J.; Lee, S. Spatial and Sequential Deep Learning Approach for Predicting Temperature Distribution in a Steel-Making Continuous Casting Process. IEEE Access 2020, 8, 21953–21965. [Google Scholar] [CrossRef]
- Hore, S.; Das, S.K.; Humane, M.M.; Peethala, A.K. Neural Network Modelling to Characterize Steel Continuous Casting Process Parameters and Prediction of Casting Defects. Trans. Indian Inst. Met. 2019, 72, 3015–3025. [Google Scholar] [CrossRef]
- Pakanati, A.; M’hamdi, M.; Combeau, H.; Zaloznik, M. Investigation of macrosegregation formation in aluminium DC casting for different alloy systems. Metall. Mater. Trans. A 2018, 49, 4710–4721. [Google Scholar] [CrossRef]
- Hatič, V.; Mavrič, B.; Šarler, B. Simulation of macrosegregation in direct-chill casting—A model based on meshless diffuse approximate method. Eng. Anal. Bound. Elem. 2020, 113, 191–203. [Google Scholar] [CrossRef]
- Tokunaga, H.; Motoyama, Y.; Okane, T. Particle method simulation of direct-chill casting process including breakout. Int. J. Adv. Manuf. Technol. 2023, 113, 191–203. [Google Scholar] [CrossRef]
- Lebon, G.; Salloum, G.; Eskin, D.; Tzanakis, I.; Pericleous, K.; Jarry, P. Numerical modelling of acoustic streaming during the ultrasonic melt treatment of direct-chill (DC) casting. Ultrason.-Sonochem. 2019, 54, 171–182. [Google Scholar] [CrossRef]
- Maurya, A.; Kumar, R.; Jha, P.K. Simulation of electromagnetic field and its effect during electromagnetic stirring in continuous casting mold. J. Manuf. Process. 2020, 60, 596–607. [Google Scholar] [CrossRef]
- Song, W.; Zhang, J.; Liu, Y.; Wang, S.; Wang, B. Numerical simulation of solidification structure of 6.5wt-%Si steel ingot slab. Ironmak. Steelmak. 2015, 42, 656–663. [Google Scholar] [CrossRef]
- Založnik, M.; Šarler, B. Modeling of macrosegregation in direct-chill casting of aluminum alloys: Estimating the influence of casting parameters. Mater. Sci. Eng. A 2005, 413–414, 85–91. [Google Scholar] [CrossRef]
- Li, Y.; Li, H.; Katgerman, L.; Du, Q.; Zhang, J.; Zhuang, L. Recent advances in hot tearing during casting of aluminium alloys. Prog. Mater. Sci. 2021, 117, 100741. [Google Scholar] [CrossRef]
- Liu, S.; Bai, L.; Wang, B.; Yao, Y.; Huang, J.; Chen, Z.; Zhang, J. Numerical simulations of solidification and hot tearing for continuous casting of duplex stainless steel. J. Iron Steel Res. Int. 2020, 27, 643–655. [Google Scholar] [CrossRef]
- Lalpoor, M.; Eskin, D.G.; Katgerman, L. Constitutive parameters, mechanical properties and failure mechanism in DC-cast AA7050 billets. In Proceedings of the 12th International Conference on Fracture, Ottawa, ON, Canada, 12–17 July 2009; pp. 12–17. [Google Scholar]
- Rappaz, M.; Gandin, C.-A. Probabilistic modelling of microstructure formation in solidification processes. Acta Metall. Mater. 1993, 41, 345–360. [Google Scholar] [CrossRef]
- Chen, X.; Jiang, Z.; Liu, F.; Yu, J.; Chen, K. Effect of Melt Rate on Surface Quality and Solidification Structure of Mn18Cr18N Hollow Ingot during Electroslag Remelting Process. Steel Res. Int. 2017, 88, 1600816. [Google Scholar] [CrossRef]
- Kwak, S.; Kim, J.; Ding, H.; Xu, X.; Chen, R.; Guo, J.; Fu, H. Using multiple regression analysis to predict directionally solidified TiAl mechanical property. J. Mater. Sci. Technol. 2022, 104, 285–291. [Google Scholar] [CrossRef]
- Ding, F. Coupled-least-squares identification for multivariable systems. IET Control Theory Appl. 2013, 7, 68–79. [Google Scholar] [CrossRef]
- Yu, K.C.; Guo, S.J.; Nagaumi, H. Evaluation on the Accuracies of Sump Depth Measurements during DC Casting Process of 7050 Alloy. Mater. Sci. Forum 2016, 877, 78–83. [Google Scholar] [CrossRef]
- Kim, M.S.; Lee, S.H.; Jung, J.G.; Eah, K. Prediction of grain structure in direct-chill cast Al–Zn–Mg–Cu billets using cellular automaton-finite element method. Prog. Nat. Sci. Mater. Int. 2021, 31, 434–441. [Google Scholar] [CrossRef]
- Weckman, D.C.; Niessen, P. A Numerical Simulation of the D. C. Continuous Casting Process Including Nucleate Boiling Heat Transfer. Metall. Trans. B 1982, 13, 593–602. [Google Scholar] [CrossRef]
- Drezet, J.M.; Rappaz, M.; Grün, G.U.; Gremaud, M. Determination of Thermophysical Properties and Boundary Conditions of Direct Chill–Cast Aluminum Alloys Using Inverse Methods. Metall. Mater. Trans. A 2000, 31, 1627–1634. [Google Scholar] [CrossRef]
- Sengupta, J.; Cockcroft, S.L.; Maijer, D.M.; Welis, M.A.; Larouche, A. On the Development of a Three-Dimensional Transient Thermal Model to Predict Ingot Cooling Behavior during the Start-Up Phase of the Direct Chill Casting Process for an AA5182 Aluminum Alloy Ingot. Metall. Mater. Trans. B 2004, 35, 523–540. [Google Scholar] [CrossRef]
- Sengupta, J. Mathematical Modeling of the Evolution of Thermal Field during Startup Phase of the Direct Chill Casting Process for AA5182 Sheet Ingots. Ph.D. Thesis, University of British Columbia, Vancouver, BC, Canada, 2002. [Google Scholar]
- Ong, S.P.; Richards, W.D.; Jain, A.; Hautier, G.; Kocher, M.; Cholia, S.; Ceder, G. Python Materials Genomics (pymatgen): A robust, open-source python library for materials analysis. Comput. Mater. Sci. 2013, 68, 314–319. [Google Scholar] [CrossRef]
- Tropsha, A.; Gramatica, P.; Gombar, V.K. The Importance of Being Earnest: Validation is the Absolute Essential for Successful Application and Interpretation of QSPR Models. QSAR Comb. Sci. 2003, 22, 69–77. [Google Scholar] [CrossRef]
- Drezet, J.M.; Rappaz, M.; Carrupt, B.; Plata, M. Experimental investigation of thermomechanical effects during direct chill and electromagnetic casting of aluminum alloys. Metall. Mater. Trans. B 1995, 26, 821–829. [Google Scholar] [CrossRef]
- Wan, J. Thermal Stress Prediction for Direct-Chill Casting of a High Strength Aluminum Alloy; West Virginia University: Morgantown, WV, USA, 1998. [Google Scholar]
- Rage, K.R. Three Dimensional Modeling of Vertical DC Casting of Aluminum Alloys; McGill University: Montreal, QC, Canada, 2004. [Google Scholar]
- Das, S.K. Modeling and Optimization of Direct Chill Casting to Reduce Ingot Cracking. In Final Technical Report; ORNL/TM-2006/56; Secat Inc.: Lexington, KY, USA, 2006; p. 61. [Google Scholar] [CrossRef]
- Zuo, Y.B.; Cui, J.Z.; Mou, D.; Zhu, Q.F.; Wang, X.J.; Li, L. Effect of electromagnetic field on microstructure and macrosegregation of flat ingot of 2524 aluminium alloy. Trans. Nonferrous Met. Soc. China 2014, 24, 2408–2413. [Google Scholar] [CrossRef]


| Element | Zn | Cu | Mg | Fe | Cr | Mn | Si | Zr | Ti | Al |
|---|---|---|---|---|---|---|---|---|---|---|
| Content(wt%) | 6.0 | 2.15 | 2.3 | 0.10 | 0.04 | 0.10 | 0.03 | 0.11 | 0.03 | Bal. |
| Boundary Conditions | |
|---|---|
| Pressure P | |
| Free surface Γ1 | Dirichlet boundary condition with a fixed value of 1 × 10⁵ Pa |
| Temperature T | |
| Free surface Γ1 | Dirichlet boundary condition, value equal to the casting temperature |
| Graphite Γ2 | Heat transfer coefficient equal to 100 W/(m2∙K) |
| Mould Γ3 | Calculated by [1,3] |
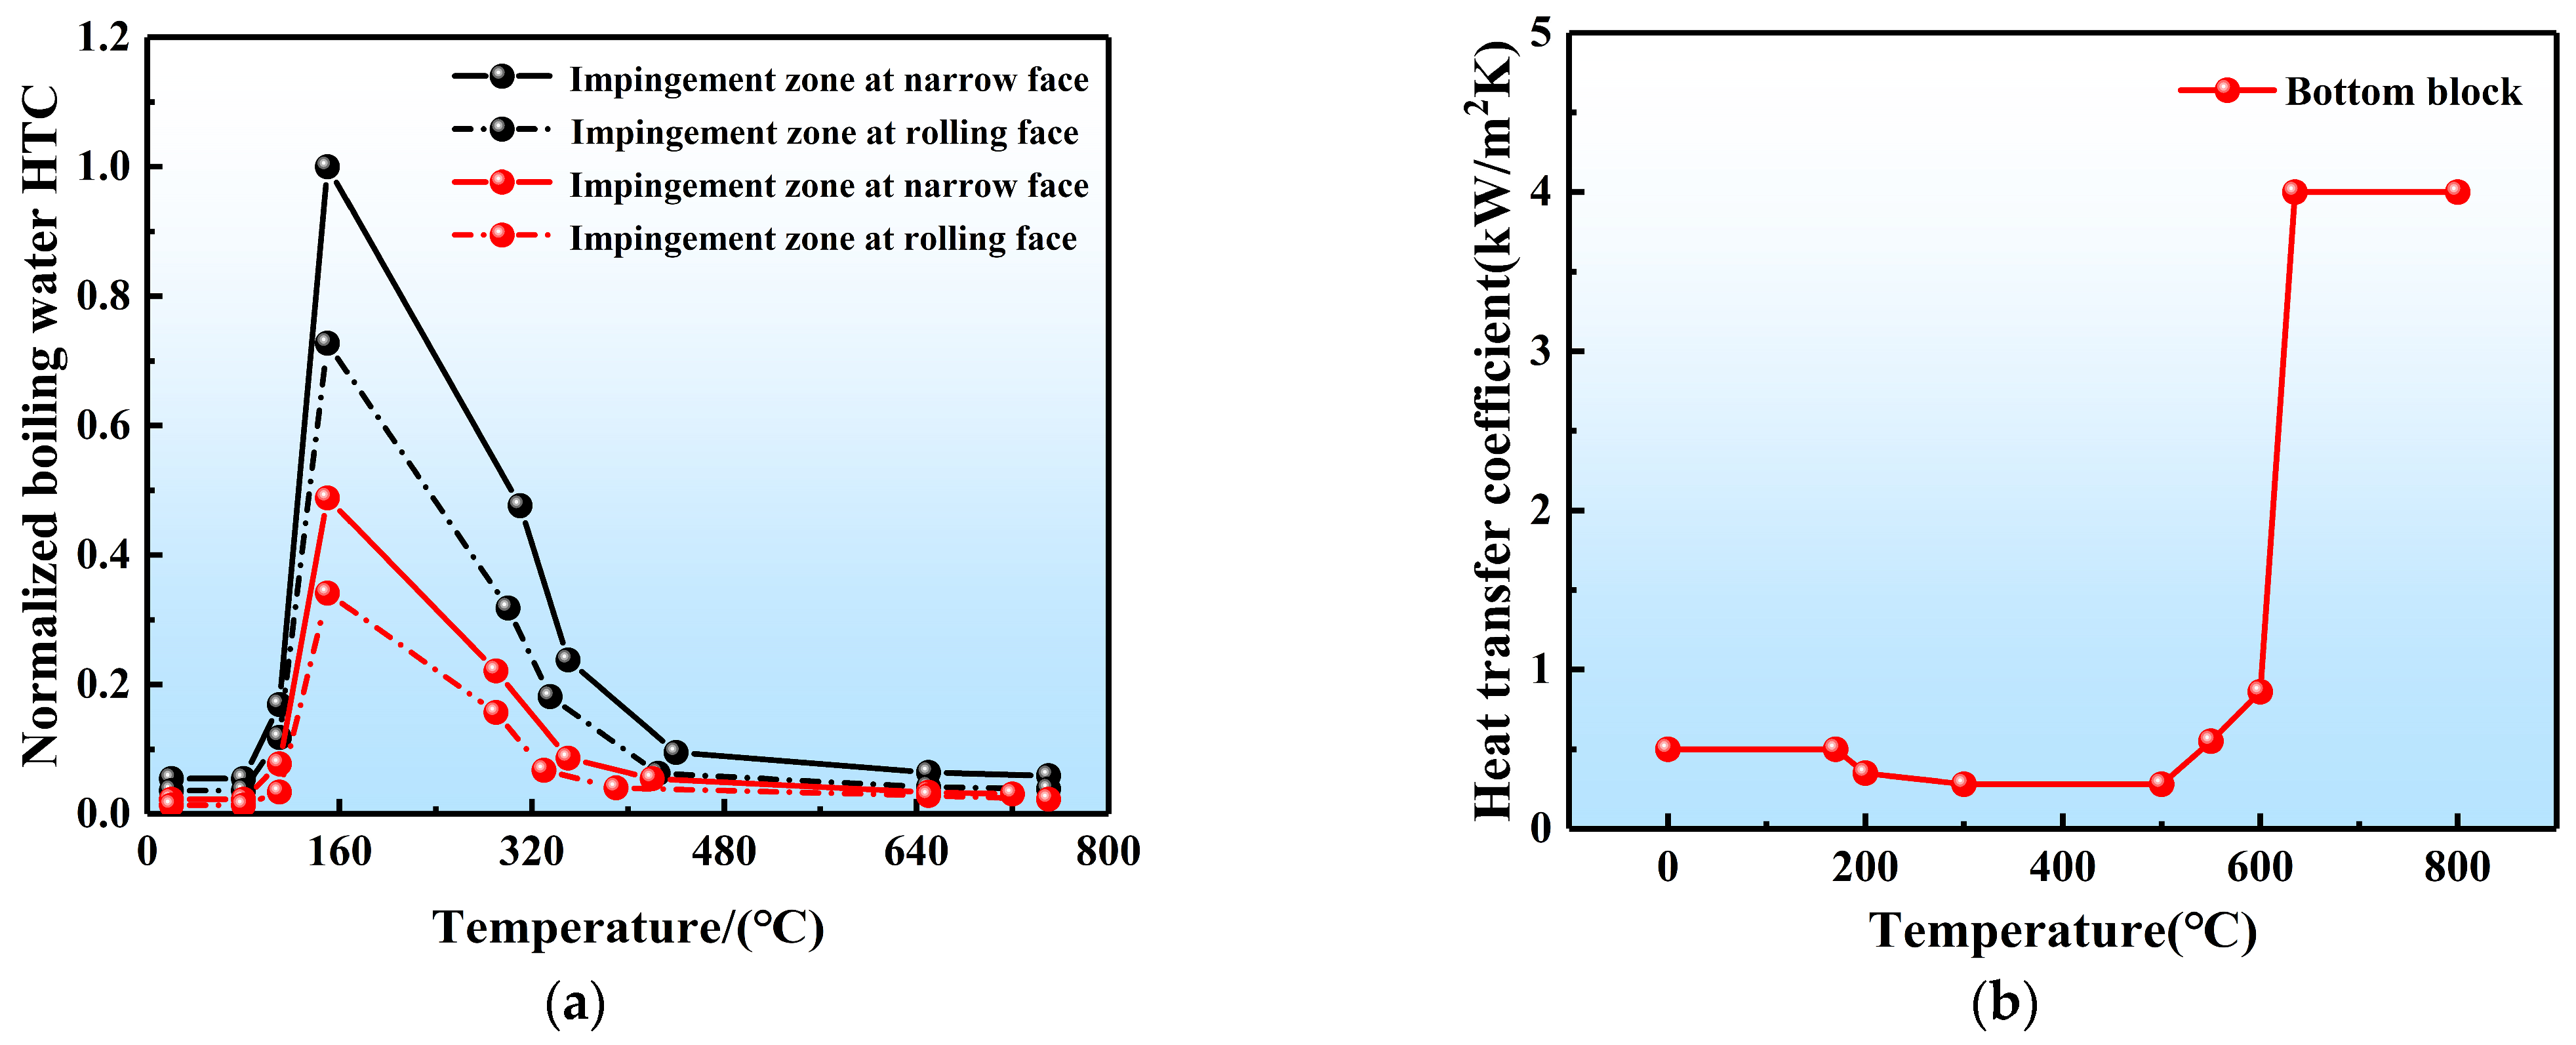
| Water film Γ4 | As shown in Figure 6a |
| Bottom block Γ5 | As shown in Figure 6b [39,40] |
| External temperature set to 25 °C The remaining heat exchange interfaces are set to adiabatic | |
| Velocity V | |
| Bottom block | Dirichlet boundary condition, value equal to the casting speed |
| Nucleation N | |
| Ingot | , [36] |
| Surface nucleation | , , |
| Volume nucleation | , , |
| Gp. | Temperature [°C] | Speed [mm/min] | PCI [W·m−2·K−1] | SCWFR [L/min] |
|---|---|---|---|---|
| A | 660~780 ΔT = 5 | 50 | 2000 | 270 |
| B | 720 | 24~96 ΔV = 3 | 2000 | 270 |
| C | 720 | 50 | 1000~3000 ΔPCI = 80 | 270 |
| D | 720 | 50 | 2000 | 120~420 ΔWFR = 12 |
| No. | Type of Alloy | Ingot Size [mm] | Experimental Results | Predicted Results | Errors(%) |
|---|---|---|---|---|---|
| The depth of sump [mm]: | |||||
| 1 [43] | AA 1xxx | 1860 × 510 | 425 480 580 | 419.85 470.93 573.11 | 1.21 1.89 1.19 |
| 2 [44] | AA 7050 | 1372 × 406 | 381 | 406.91 | 6.8 |
| 3 [45] | AA 3104 | 1320 × 660 | 440 | 448.98 | 2.04 |
| 4 [46] | AA 3004 | 2044 × 680 | 435 | 467.17 | 7.39 |
| The average grain size [μm]: | |||||
| 1 [46] | AA 3004 | 2044 × 680 | 400 | 321.395 | 19.65 |
| 2 [47] | AA 2524 | 350 × 160 | 210 ± 39 | 330.961 | 57.6 |
Disclaimer/Publisher’s Note: The statements, opinions and data contained in all publications are solely those of the individual author(s) and contributor(s) and not of MDPI and/or the editor(s). MDPI and/or the editor(s) disclaim responsibility for any injury to people or property resulting from any ideas, methods, instructions or products referred to in the content. |
© 2024 by the authors. Licensee MDPI, Basel, Switzerland. This article is an open access article distributed under the terms and conditions of the Creative Commons Attribution (CC BY) license (https://creativecommons.org/licenses/by/4.0/).
Share and Cite
Guo, G.; Yao, T.; Liu, W.; Tang, S.; Xiao, D.; Huang, L.; Wu, L.; Feng, Z.; Gao, X. Numerical Simulation and Machine Learning Prediction of the Direct Chill Casting Process of Large-Scale Aluminum Ingots. Materials 2024, 17, 1409. https://doi.org/10.3390/ma17061409
Guo G, Yao T, Liu W, Tang S, Xiao D, Huang L, Wu L, Feng Z, Gao X. Numerical Simulation and Machine Learning Prediction of the Direct Chill Casting Process of Large-Scale Aluminum Ingots. Materials. 2024; 17(6):1409. https://doi.org/10.3390/ma17061409
Chicago/Turabian StyleGuo, Guanhua, Ting Yao, Wensheng Liu, Sai Tang, Daihong Xiao, Lanping Huang, Lei Wu, Zhaohui Feng, and Xiaobing Gao. 2024. "Numerical Simulation and Machine Learning Prediction of the Direct Chill Casting Process of Large-Scale Aluminum Ingots" Materials 17, no. 6: 1409. https://doi.org/10.3390/ma17061409