
High-Temperature Reactive Wetting of Natural Quartz by Liquid Magnesium


1
Department of Materials Science and Engineering, Norwegian University of Science and Technology, 7491 Trondheim, Norway
2
Łukasiewicz Research Network–Kraków Institute of Technology, 30-418 Kraków, Poland
*
Author to whom correspondence should be addressed.
Materials 2024, 17(6), 1302; https://doi.org/10.3390/ma17061302
Submission received: 20 December 2023
/
Revised: 5 March 2024
/
Accepted: 6 March 2024
/
Published: 11 March 2024
(This article belongs to the Section Advanced and Functional Ceramics and Glasses)
Abstract
:High-temperature wetting of natural, high-purity quartz (SiO2) and liquid magnesium (Mg) was investigated at temperatures between 973 and 1273 K. Sessile drop experiments using the capillary purification (CP) procedure were carried out under an Ar gas atmosphere (N6.0), eliminating the native oxide layer on the surface of Mg melt. The results showed that the wetting behavior was strongly dependent on temperature. At 973 and 1073 K, the wetting system displayed relatively large contact angles of 90° and 65°, respectively, demonstrating modest wetting. The wetting increased to some extent by increasing the temperature to 1123 K with a wetting angle of 22°. However, the SiO2/Mg system demonstrated complete wetting at temperatures of 1173 K and above. Furthermore, interface microstructure examination showed different reaction product phases/microstructures, depending on the wetting experiment temperature.
1. Introduction
The metallothermic reduction of SiO2, including aluminothermic and magnesiothermic reduction, to produce Si for various applications has received increasing attention in recent years. These applications include high-purity Si and Si with special mesoporous structures for application, mainly in Li-ion batteries [1,2,3,4,5,6,7,8,9]. The difference in melting points of SiO2 as the oxide phase and metals like Mg and Al suggests that the metallothermic reduction reaction might occur between the solid oxide and the liquid metal, where the diffusion rate of metal and the wettability of SiO2 by the metal influence the reaction mechanism. While the latter has been thoroughly investigated, there are only a few studies on wettability in the SiO2/Mg system, particularly at higher temperatures [2,4,6,7,10,11,12].
Oxide–metal systems generally exhibit low wettability, where the wetting behavior might be improved through the formation of product compounds at the oxide–metal interface. Wetting systems, such as SiO2/Si, Al2O3/Si, MgO/Si, and Al/MgO, exhibit non-wetting behavior since chemical reactions between the metal and substrate only occur to a very limited extent. For example, the partial dissolution of oxygen in Si in the Si/SiO2 system and the formation of silicate layers (2MgO-SiO2 and 2MgO-2SiO2) in the MgO/Si system reportedly led to decreasing contact angles of a few degrees [13,14,15,16,17]. In contrast, reactive wetting systems, such as Mg/SiO2, Al/SiO2, Mg-Al/SiO2, and Mg/Al2O3, exhibit extensive chemical reaction with highly negative Gibbs energy, where the wettability is strongly affected by the chemical reaction at the metal–substrate interface. Marumo and Pask [18] studied the SiO2/Al system where the contact angle decreased with temperature as a result of the formation of various layers at the solid/liquid interface in the temperature range 933 to 1473 K (660 to 1200 °C). On the contrary, Shen et al. [19] reported a lack of wetting in the SiO2/Al system with a contact angle larger than 90° under an Ar-3% H2 atmosphere and 0.11 MPa pressure for temperatures between 1073 and 1523 K (800 and 1250 °C) where no product formation was detected at the SiO2/Al interface. In another work by Shi et al. [11], it was observed that the contact angle decreased when alloying Al with Mg in the SiO2/Al-Mg system. The contact angle changed from higher than 85° in the SiO2/Al system to less than 10° in the SiO2/Al-69%Mg system. The Mg/SiO2 system was studied by Shi et al. [12] over the temperature range 973 K to 1073 K using a sessile drop method under an Ar gas atmosphere. They found that there was good wetting of SiO2 by Mg, mainly due to the formation of Mg2Si in the reaction zone. In other words, the rate of spreading of a metal on an oxide substrate depends on the reaction rate, as well as the change in surface tension between liquid and vapor by, e.g., a dissolving product compound, a change in the viscosity of the liquid, and/or volume change due to product formation [11,12,18,19,20,21,22].
In our previous work on the kinetics of the reaction between Mg and SiO2, a noticeable difference between reaction kinetics at temperatures below 1173 K and higher temperatures was observed, which was primarily related to the diffusion rate of Mg. However, it was proposed that the reaction rate may be affected by the wetting behavior between different phases as well [23,24]. To the best of our knowledge, the SiO2/Mg system has not been studied at temperatures above 1073 K, as it can be challenging to conduct wetting experiments at such high temperatures due to the high vapor pressure of Mg and oxidation of the Mg source. Hence, a more in-depth understanding of the effect of temperature on wetting between reactants is beneficial to provide more detailed information about the mechanism of the Mg-SiO2 reaction. The aim of this work was to provide more detailed information on the wettability of high-purity natural quartz by liquid Mg, particularly at temperatures above 1173 K.
2. Materials and Methods
2.1. Materials
SiO2 disks (diameter of 16 mm and thickness of 3 mm) were prepared from high-purity natural quartz to be used as the substrate. The natural quartz contained 0.0106 wt% Al, 0.002 wt% Fe, 0.0023 wt% K, 0.001 wt% Na, 0.0009 wt% Mg, 0.0003 wt% Ca, 0.00042 wt% Ti, and 0.00003 wt% Mn as impurity elements measured by inductively coupled plasma–optical emission spectrometry (ICP-OES) [25]. The disks were ultrasonically cleaned in ethanol for 20 min before performing wetting tests. A commercial Mg with a purity of 99.98 wt% (supplied by Stanchem, Niemce, Poland) was used to make the liquid Mg metal drop. Mg pieces had a disk shape with dimensions adapted to the size of the graphite capillary making the drop (diameter of 10 mm and height of 15 mm). Before performing wetting tests, the Mg pieces were subjected to mechanical grinding with SiC papers to remove possible surface oxide layers, followed by ultrasonic cleaning in isopropanol for 5 min.
2.2. Procedure
High-temperature wettability tests of the SiO2/Mg system were performed by a classical sessile drop method using the capillary purification (CP) procedure. This procedure ensures non-contact heating of the materials couple under investigation (e.g., Mg and SiO2) combined with the in situ mechanical removal of the native oxide film from the Mg melt and deposition of the oxide-free Mg droplet on a substrate by squeezing liquid metal through a graphite capillary, as shown schematically in Figure 1. A more detailed description of the CP procedure is given elsewhere [26,27,28,29,30].
The de-greased and cleaned Mg pieces were directly put in a capillary located above the test substrate. Graphite capillaries were selected as “inert” containers to avoid alloy contamination by interactions between the molten Mg and the capillary. After positioning the samples inside the chamber, residual gases were evacuated using scroll and turbo-molecular pumps. When the total pressure inside the chamber reached approximately 5 × 10⁻⁶ mbar, the reactor was heated to the set temperature at a heating rate of 50 K/min. At 373 K, inert Ar gas (N6.0) was introduced into the chamber at a pressure of 760–850 mbar. The high-temperature wettability experiments of the SiO2/Mg system were carried out under an Ar gas flow at the following test temperatures: 973, 1073, 1123, 1173, 1223, and 1273 K. The test duration was 5 min at each temperature, after which the samples were cooled down to room temperature at a cooling rate of 50 K/min. During the wetting experiments, images of the SiO2/Mg couple were recorded in real time by a high-speed digital CCD camera (Microtron MC 1310, Microtron GmbH, Unterschleißheim, Germany) at 100 frames per second. A backlight was applied to enhance the contrast between the sessile drop couple profile and the background. The resulting images were analyzed using ASTRAView© software 2.0 developed by CNR-ICMATE (Genoa, Italy) and used for measuring the contact angle value [31]. During the whole experiment, the total pressure inside the experimental chamber; the temperature on the test table; the heater temperature; and the capillary temperature were simultaneously monitored.
2.3. Product Characterization
After the wetting test, the cross-sections of the samples were examined by Field Emission Scanning Electron Microscopy (Zeiss Ultra FESEM, Carl Zeiss AG, Oberkochen, Germany) equipped with an XFlash® 4010 Detector supplied by Bruker Corporation (Billerica, MA, USA) for Energy-Dispersive X-ray Spectroscopy (EDS).
3. Results and Discussion
3.1. Wetting Behavior
The recorded images and sample images after the wetting tests at various temperatures are presented in Figure 2. Recorded videos during the wetting tests are given in the Supplementary Materials, illustrating the change in the shape of the Mg drop during the wetting experiment. In each experiment, three to five drops were deposited on the SiO2 substrate to obtain a large enough Mg drop to measure the contact angle of the wetting system. Time zero was set as the first Mg drop was deposited on the substrate. The change in the left and right contact angles after the deposition of each drop with time is shown in Figure 3 at the beginning of the wetting test. At 973 K and 1073 K, the first Mg drop spread on the substrate with an initial decrease in the contact angle, while the contact angle did not change significantly by the deposition of more Mg melt drops, as seen in Figure 3a and Figure 3b, respectively. At 1123 and 1173 K, the Mg drops spread more rapidly on the substrate compared to the lower temperatures, as seen in Figure 3c,d, resulting in very low contact angles. Figure 4 compares the average contact angles at 973, 1073, and 1123 K over a wetting time of 5 min. The calculated average contact angles are the means of right and left contact angles, given in the Supplementary Materials Figure S1. It was observed that the contact angle decreased for the initial 1.5 min of wetting time at 973 K. After the initial period, the contact angle remained almost constant around an average of 90° over time. By increasing temperature to 1073 K, the contact angle decreased slowly with time. It reached an average value of 65° in the period of 4 to 5 min of wetting time. The contact angle also decreased continuously with time at 1123 K, where it was approximately 22° at 5 min of wetting time. At these three temperatures, the decreasing contact angles were accompanied by an increasing drop diameter. At 1073 and 1123 K, the spreading rate can be divided into three stages. In the first stage, the Mg drop spreads rapidly, followed by a slower spreading rate in the second stage and an almost constant contact angle in the third stage. At higher temperatures (1173, 1223, and 1273 K), the rapidly spreading Mg melt drop on the substrate made it impossible to measure contact angles over time. The Mg melt spread over the surface of the substrate and would subsequently either penetrate the substrate or evaporate due to its high vapor pressure. The recorded images by CCD visualize that the Mg melt drops were vibrating during wetting at higher temperatures, indicating Mg evaporation, which can be seen in the videos in the Supplementary Materials. Mg vapor pressures at the different reaction temperatures listed in Table 1 indicate a significant increase in Mg evaporation at 1173 K and above. It is worth noting that at lower temperatures, the Mg drop vibration was not dominant during wetting.
3.2. Microstructure Evaluation of the SiO2/Mg Interface
SiO2-Mg wetting will depend on Mg availability during the reduction reaction, forming Si-MgO and Mg2Si-MgO, as shown in Figure 5.
After the wetting test, the solidified Mg drops were found unattached to the substrates at 973, 1073, and 1123 K. However, product layers were observed on both the Mg drop and substrate surfaces, where the product thickness increased with temperature, as shown in Figure 6. On the Mg drop side, small eutectic Mg2Si particles were seen in the Mg matrix at 973 K. Relatively large primary Mg2Si crystals, in addition to small particles, were present at 1073 and 1123 K, indicating more Si formation at the higher temperature. The product layer between the Mg drop and the substrate can be divided into two layers. The layer next to the Mg drops mostly contains MgO, as most of the produced Si diffused into the Mg drop. The layer next to the substrate was characterized by a periodic, layered structure composed of Mg2Si and MgO-Si layers, as shown in Figure 7. The formation of the periodic layered structure has previously been observed in the SiO2/Mg system at a temperature range of 723–1073 K (450–800 °C) where solid-state reactions may take place [12,33,34,35,36]. There are two conditions that should be satisfied to establish the periodic layered structure in the ternary diffusion system. The first condition is that the mobility of one atom should be higher than the other two elements; here, Mg has high mobility compared to Si and O. The second condition is that only one of the product phases can have a thermodynamically stable interface with SiO2. Between the Mg2Si and MgO phases, the latter was found adjacent to SiO2, while the former is unable to establish an interface with SiO2 due to the strong tendency of Mg to reduce SiO2 and form MgO. There is a strong driving force for Si diffusion out of the MgO phase due to its low wetting; however, MgO is highly resistant to Si diffusion at 923–973 K (650–700 °C) [15,37]. The exact chemical compositions of the layers depend on the degree of phase separation. As seen in Figure 7e, MgO has more porosity, visualized in a slightly darker color in the upper part, indicating a higher degree of Si separation. The lighter gray color of MgO in the lower part implies lower Si separation.
As shown in Figure 8, wetting samples present different microstructures at 1173, 1223, and 1273 K. Three regions are distinguished in the microstructures, including a metal layer on top of two oxide layers with different microstructures. At 1173 K, the metal layer is composed of Mg2Si on top and Mg beneath, containing large crystals of Mg2Si. The metal layer is Mg2Si, containing a small amount of Mg with a large crack at 1223 K. At 1273 K, Si was found on the metal layer with some amount of Mg2Si, indicating a higher Mg diffusion rate or evaporation rate at higher temperatures. The intermediate layers at 1173 K and 1223 K contain a relatively coarse Mg2Si phase in a MgO matrix, while mainly MgO is found at 1273 K. The layer adjacent to the SiO2 substrate is newly formed product phases with no phase separation. Large cracks at the SiO2 substrate may originate from released stress due to the volume expansion during the conversion of reactants and during cooling due to differences in the thermal expansion of different phases. The formation of various layers was discussed in detail in our previous works [23,24].
3.3. Wetting Mechanism
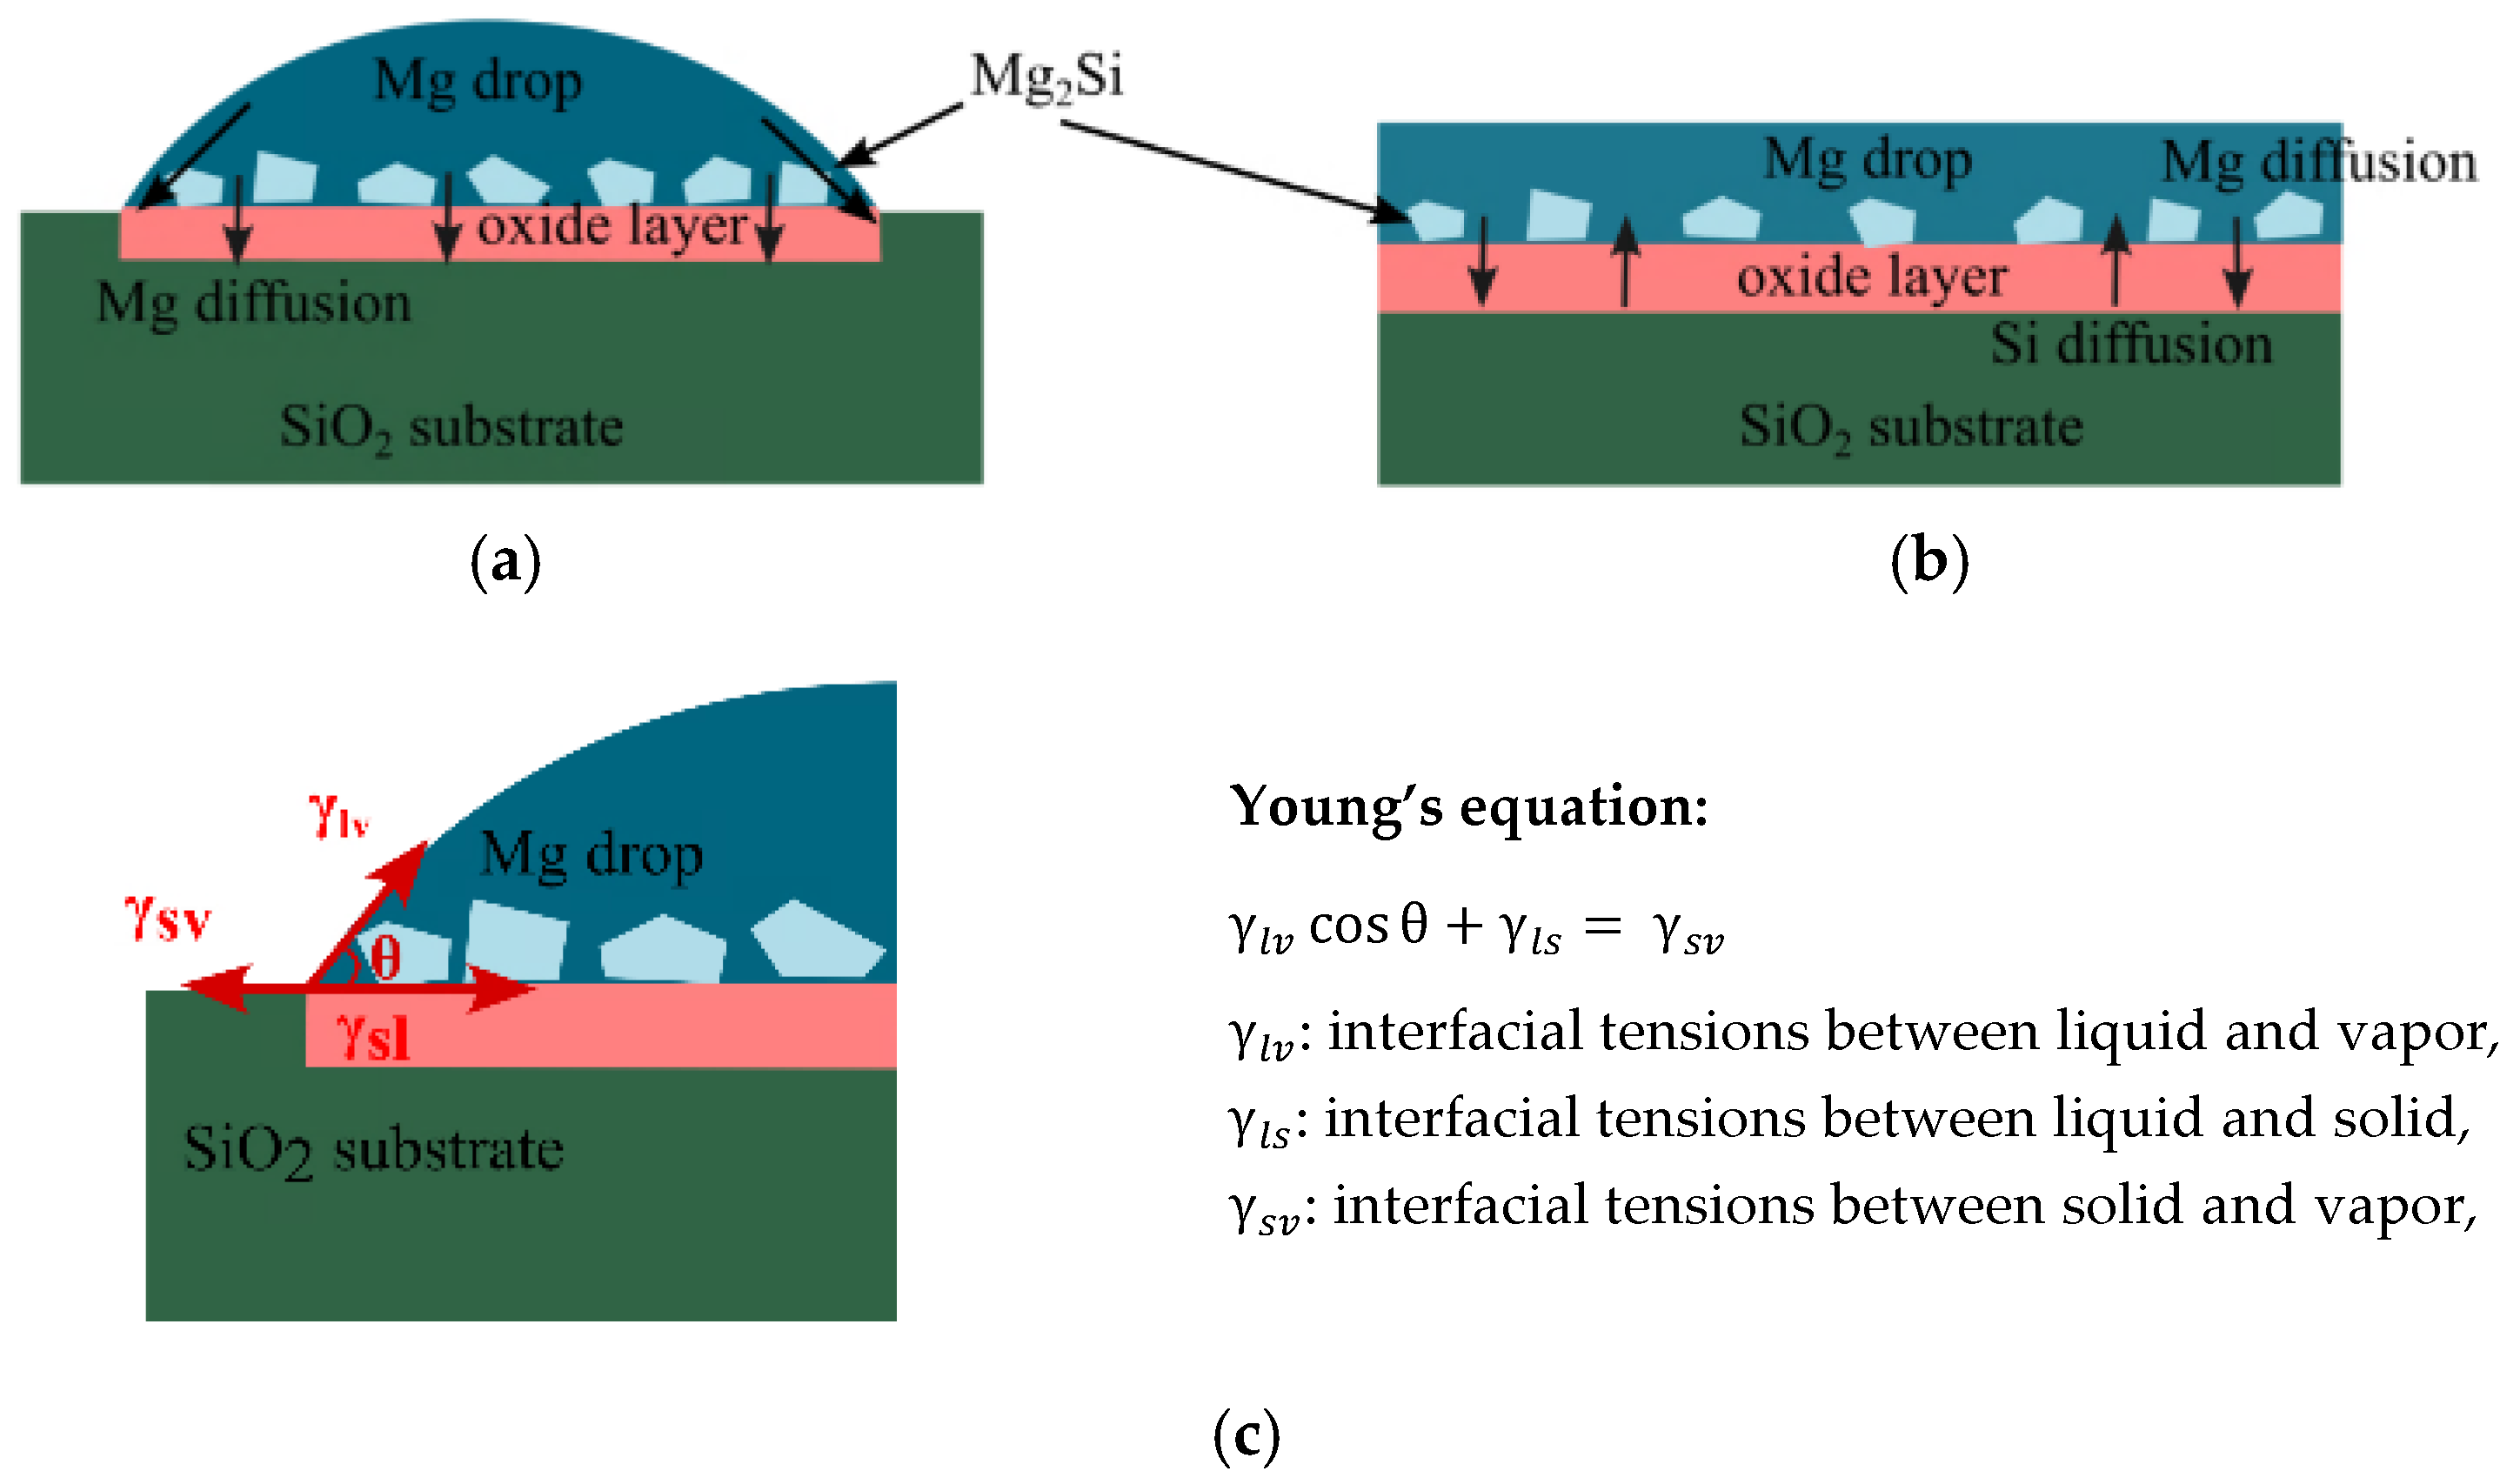
In the reactive wetting system, the contact angle and spreading rate of a drop depend on the interfacial reaction [18,38]. With the highly negative Gibbs energy of reduction of SiO2 by Mg, as shown in Figure 5, the contribution from the chemical reaction can significantly improve wettability, as reported by Shi et al. [12]. However, the transport rate of reacting species to or from the reaction interface can also impact the interfacial reaction. Here, Mg diffusion through the product layer/SiO2 material is the rate-limiting step [10,33,38]. As illustrated in the schematic view in Figure 9, a product layer containing an oxide phase and some Mg2Si particles formed between the Mg drop and SiO2. The diffusion rate of Mg through these product layers to the triple junction, where the gas phase, Mg liquid, and SiO2 substrate meet, governs the contact angle and spreading rate of the Mg drop. Moreover, the interfacial tension between various formed phases affects the wettability of SiO2 by Mg and makes the wetting system quite complex, as shown in Figure 9c.
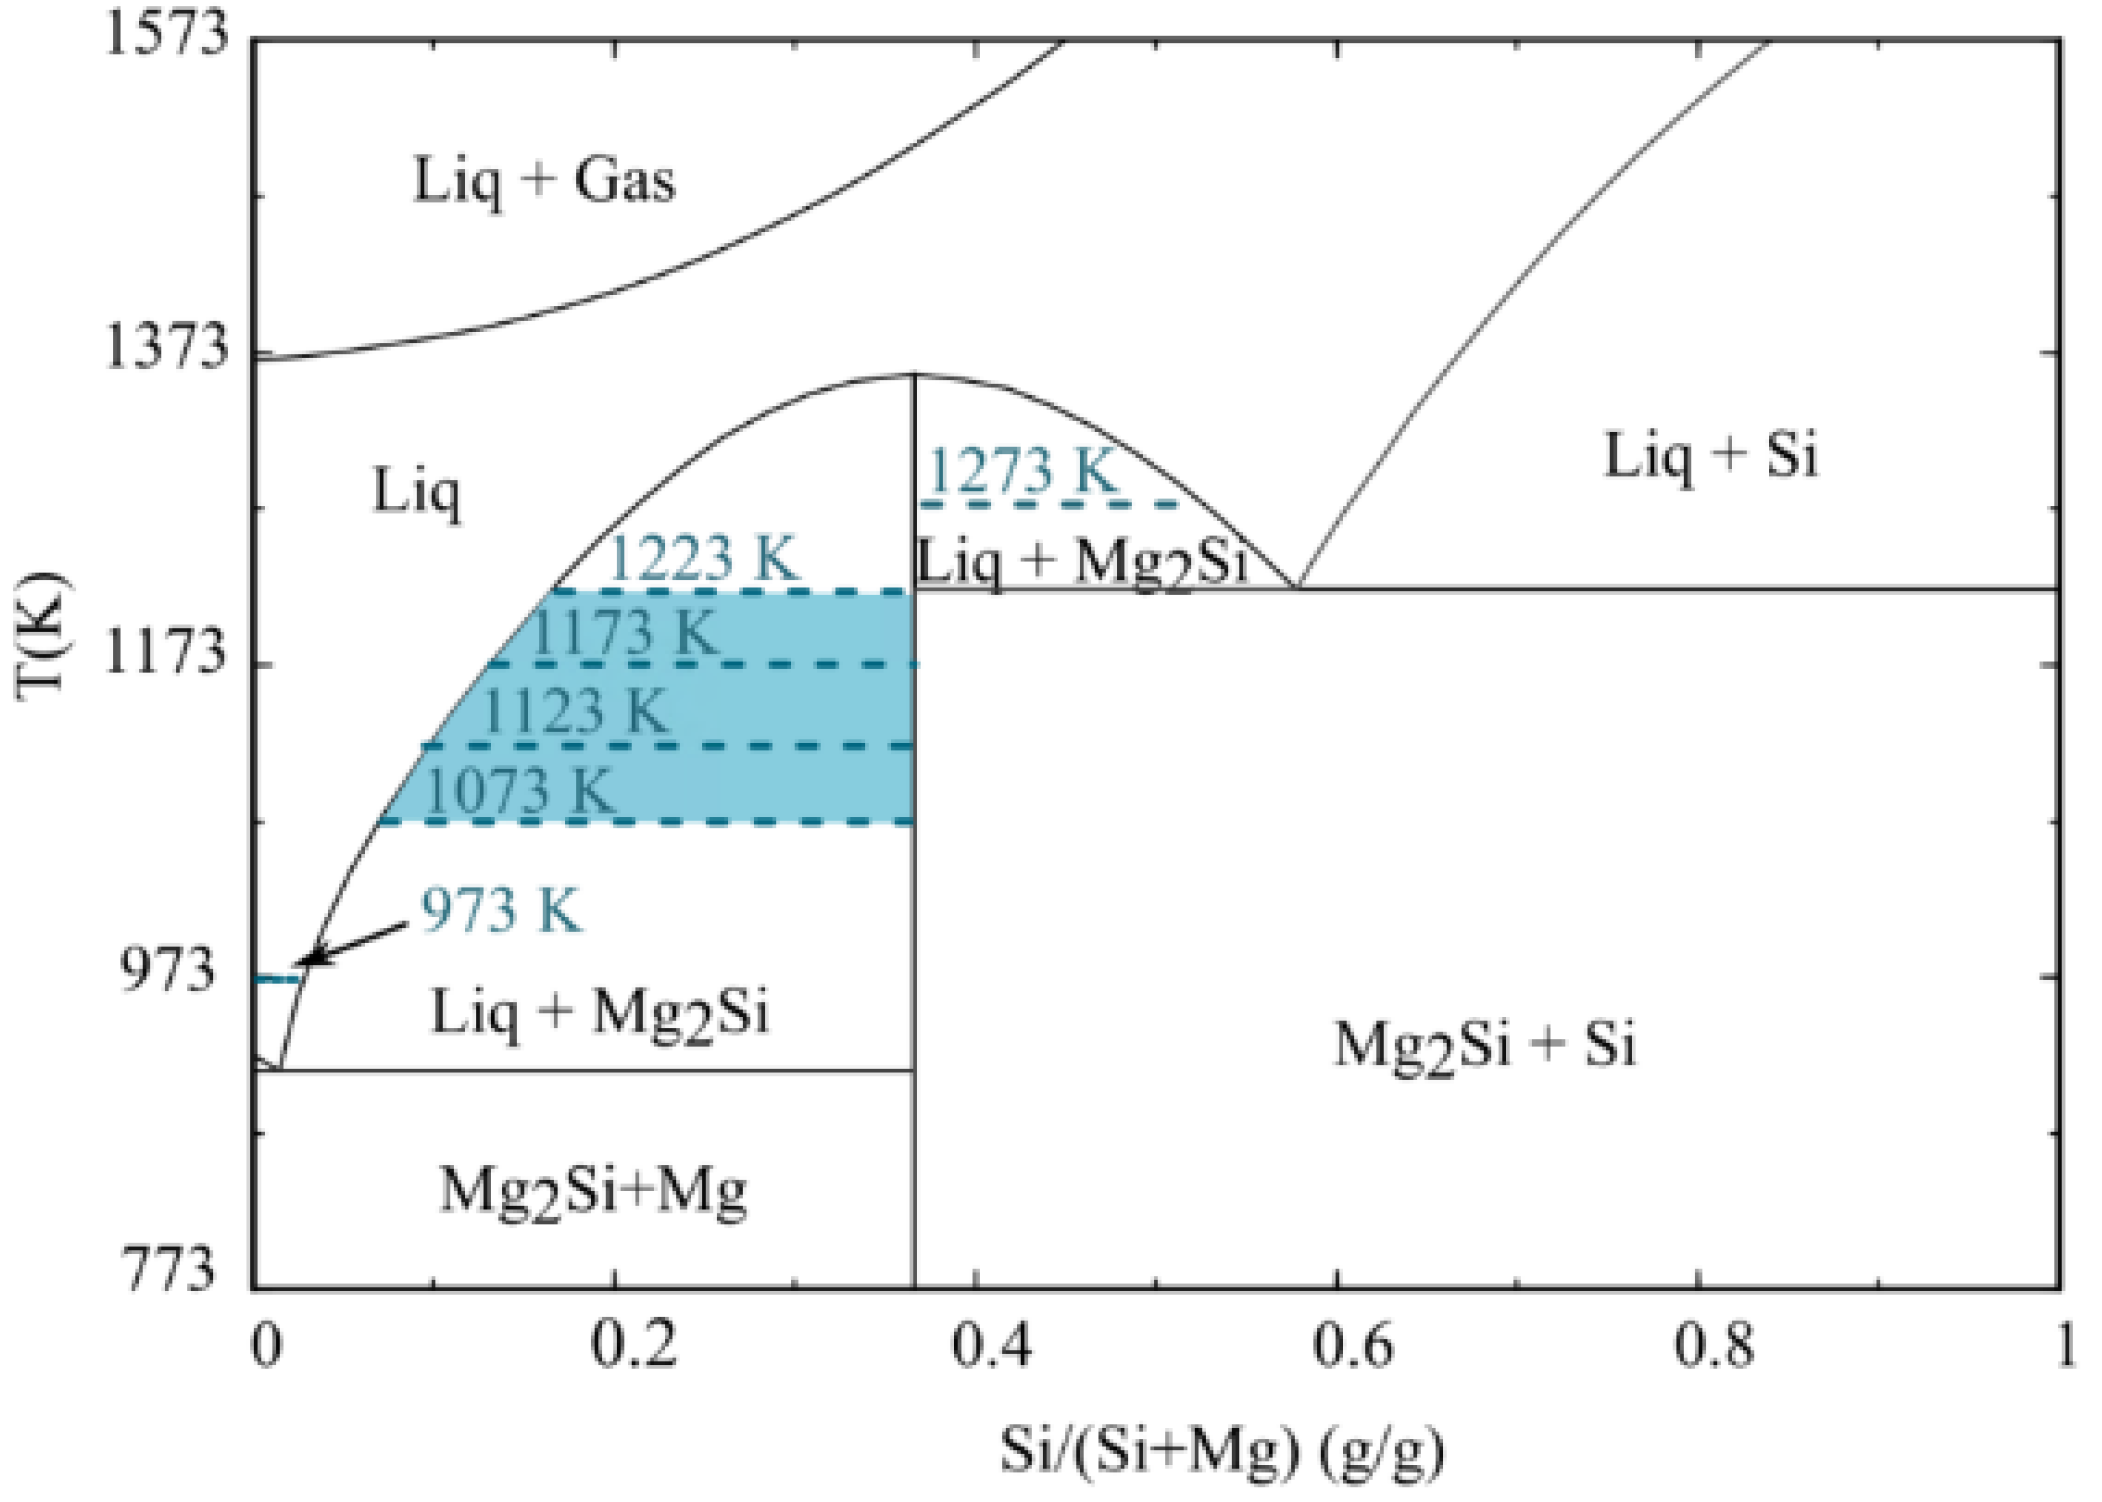
Furthermore, Mg has a surface tension of 559 mN.m−1 at its melting point, 928 K, whereas the surface tension of Si at its melting point, 1683 K, is 865 mN.m−1 [39]. The produced Si dissolved in the Mg drop leads to increasing surface tension of the drop at a constant temperature, consequently slowing down the spreading rate. As seen in Figure 7 and Figure 8, the top metal layer was composed of different phases, including Mg, Mg2Si, and Si at different temperatures. The binary phase diagram of Mg-Si in Figure 10 illustrates the produced Si initially dissolved in the Mg melt. Only eutectic Mg2Si formed at 973 K, while the formation of primary Mg2Si is observed at higher temperatures in the form of small particles. At temperatures up to 1223 K, all produced Si was found in the Mg2Si phase, indicating that the metal phase had a chemical composition on the left side of the Mg2Si line in the binary phase diagram. At 1273 K, the presence of Si and Mg2Si phases implies higher Si formation and higher Mg loss by evaporation, which introduced a metal phase with a chemical composition on the right side of the Mg2Si line, containing Mg2Si and Si. Moreover, Si reduces the viscosity of the Mg melt but also its spreading rate [40]. On the other hand, with increasing temperature, both the surface tension and viscosity of the Mg drop decrease, which together with a higher Mg diffusion rate, improve wettability [39].
![Materials 17 01302 g009]()
Figure 9.
Schematic view of the SiO2/Mg wetting test at lower temperatures (<1173 K) (a), complete wettability at higher temperatures (>1173 K) (b), and (c) Young’s equation [41].
Figure 9.
Schematic view of the SiO2/Mg wetting test at lower temperatures (<1173 K) (a), complete wettability at higher temperatures (>1173 K) (b), and (c) Young’s equation [41].
4. Conclusions
An investigation of the wetting behavior of Mg on SiO2 substrates showed a reactive wetting system, where the wettability increased with the formation of product phases. The measured contact angles after 5 min of wetting time were 90°, 65°, and 22°, respectively at 973, 1073, and 1123 K. By increasing the temperature to 1173 K and above, wettability improved significantly with the Mg melt drop spreading rapidly on the SiO2 substrate. The higher contact angles were accompanied by a less developed interfacial area between SiO2 and Mg at lower temperatures, i.e., the wetting behavior of the SiO2/Mg system influenced the reaction kinetics through the extent of the interfacial area between the reactants. It can be concluded that reaction kinetics are dependent on temperature, affecting both the wetting behavior between SiO2 and Mg and the diffusion rate of Mg. However, the influence of the Mg diffusion rate appeared to be more pronounced, particularly at higher temperatures.
Furthermore, various microstructures were found at different wetting temperatures. During the wetting test, there were two fluxes of atoms in opposite directions: Mg diffused in a long range towards the reaction zone while Si diffused towards the Mg drop with a diffusion rate depending on temperature. At lower temperatures, Si could only diffuse a short distance, which led to its accumulation as thin layers between the MgO layers and the formation of the periodic layered structure. In contrast, at higher temperatures, Si diffused out through the MgO oxide layer to accumulate in the Mg melt on top. It can be stated that 1173 K represents a borderline temperature where a periodic layered reaction product structure was observed below this temperature. The separation of Si from the MgO-Si phase due to their low wettability occurred over the wetting time, where late-formed MgO-Si layers had a higher Si content compared to earlier-formed layers.
Supplementary Materials
The following supporting information can be downloaded at https://www.mdpi.com/article/10.3390/ma17061302/s1, Figure S1: Variation of right and left contact angles with wetting time at 973 K, 1073 K, and 1123 K.; Figure S2. EDX point analysis at 973 K. Figure S3. EDX point analysis at 1073 K. Figure S4. EDX point analysis at 1123 K. Figure S5. EDX point analysis at 1173 K. videos of the wetting experiment.
Author Contributions
Conceptualization, G.T., J.S. and A.R.; methodology, A.R., A.K. and G.B.; investigation, A.R., A.K., G.B., J.S. and G.T.; writing—original draft preparation, A.R., A.K. and G.B.; writing—review and editing, A.R., A.K., G.B., J.S. and G.T.; supervision, J.S. and G.T.; project administration, G.T.; funding acquisition, J.S. and G.T. All authors have read and agreed to the published version of the manuscript.
Funding
This research was funded by the Research Centre for Sustainable Solar Cell Technology (FME Su-SolTech) co-sponsored by the Norwegian Research Council and industry partners, project number 257639.
Institutional Review Board Statement
Not applicable.
Informed Consent Statement
Not applicable.
Data Availability Statement
Data are contained within the article and Supplementary Materials.
Conflicts of Interest
The authors declare no conflicts of interest.
References
- Tranell, G.; Wallin, M.; Safarian, J. SisAl-A New Process for Production of Silicon. In Proceedings of the Silicon for the Chemical and Solar Industry XV, Trondheim, Norway, 15–18 June 2020. [Google Scholar]
- Barati, M.; Sarder, S.; Mclean, A.; Roy, R. Recovery of Silicon from Silica Fume. J. Non-Cryst. Solids 2011, 357, 18–23. [Google Scholar] [CrossRef]
- Larbi, K.K.; Roy, R.; Barati, M.; Lakshmanan, V.I.; Sridhar, R.; McLean, A. Use of Rice Husk for Emission Neutral Energy Generation and Synthesis of Solar-Grade Silicon Feedstock. Biomass Convers. Biorefinery 2012, 2, 149–157. [Google Scholar] [CrossRef]
- Banerjee, H.D.; Sen, S.; Acharya, H.N. Investigations on the Production of Silicon from Rice Husks by the Magnesium Method. Mater. Sci. Eng. 1982, 52, 173–179. [Google Scholar] [CrossRef]
- Sandhage, K.H.; Dickerson, M.B.; Huseman, P.M.; Caranna, M.A.; Clifton, J.D.; Bull, T.A.; Heibel, T.J.; Overton, W.R.; Schoenwaelder, M.E.A. Novel, Bioclastic Route to Self-Assembled, 3D, Chemically Tailored Meso/Nanostructures: Shape-Preserving Reactive Conversion of Biosilica (Diatom) Microshells. Adv. Mater. 2002, 14, 429–433. [Google Scholar] [CrossRef]
- Cai, Y.; Allan, S.M.; Sandhage, K.H.; Zalar, F.M. Three-Dimensional Magnesia-Based Nanocrystal Assemblies via Low- Temperature Magnesiothermic Reaction of Diatom Microshells. J. Am. Ceram. Soc. 2005, 88, 2005–2010. [Google Scholar] [CrossRef]
- Bao, Z.; Weatherspoon, M.R.; Shian, S.; Cai, Y.; Graham, P.D.; Allan, S.M.; Ahmad, G.; Dickerson, M.B.; Church, B.C.; Kang, Z.; et al. Chemical Reduction of Three-Dimensional Silica Micro-Assemblies into Microporous Silicon Replicas. Nature 2007, 446, 172–175. [Google Scholar] [CrossRef]
- Liu, N.; Huo, K.; McDowell, M.T.; Zhao, J.; Cui, Y. Rice Husks as a Sustainable Source of Nanostructured Silicon for High Performance Li-Ion Battery Anodes. Sci. Rep. 2013, 3, 1919. [Google Scholar] [CrossRef]
- Yan, Z.; Guo, J. High-Performance Silicon-Carbon Anode Material via Aerosol Spray Drying and Magnesiothermic Reduction. Nano Energy 2019, 63, 103845. [Google Scholar] [CrossRef]
- Wynnyckyj, J.R.; Rao, D.B. The Mechanism of Reduction of Silica by Magnesium Vapor. High Temp. Sci. 1976, 8, 203–217. [Google Scholar]
- Shi, L.; Shen, P.; Zhang, D.; Jiang, Q. Reactive Wetting of Amorphous Silica by Molten Al-Mg Alloys and Their Interfacial Structures. Appl. Surf. Sci. 2016, 377, 340–348. [Google Scholar] [CrossRef]
- Shi, L.; Shen, P.; Zhang, D.; Dong, E.; Jiang, Q. Reactive Wetting in Liquid Magnesium/Silica and Magnesium/Silicon Systems. Appl. Surf. Sci. 2013, 274, 124–130. [Google Scholar] [CrossRef]
- Yuan, Z.; Huang, W.L.; Mukai, K. Wettability and Reactivity of Molten Silicon with Various Substrates. Appl. Phys. A 2004, 78, 617–622. [Google Scholar] [CrossRef]
- Shen, P.; Fujii, H.; Matsumoto, T.; Nogi, K. Wetting and Reaction of MgO Single Crystals by Molten Al at 1073–1473 K. Acta Mater. 2004, 52, 887–898. [Google Scholar] [CrossRef]
- Iyer, H.; Tafaghodi Khajavi, L.; Durlik, D.; Danaei, K.; Barati, M. Wettability of Al2O3, MgO, and TiB2 Inclusions with Liquid Silicon. Silicon 2018, 10, 2219–2226. [Google Scholar] [CrossRef]
- Fujii, H.; Yamamoto, M.; Hara, S.; Nogi, K. Effect of Gas Evolution at Solid-Liquid Interface on Contact Angle between Liquid Si and SiO2. J. Mater. Sci. 1999, 34, 3165–3168. [Google Scholar] [CrossRef]
- Li, J.G.; Hausner, H. Wetting and Adhesion in Liquid Silicon/Ceramic Systems. Mater. Lett. 1992, 14, 329–332. [Google Scholar] [CrossRef]
- Marumo, C.; Pask, J.A. Reactions and Wetting Behaviour in the Aluminium-Fused Silica System. J. Mater. Sci. 1977, 12, 223–233. [Google Scholar] [CrossRef]
- Shen, P.; Fujii, H.; Matsumoto, T.; Nogi, I. Reactive Wetting of SiO2 Substrates by Molten Al. Metall. Mater. Trans. A 2004, 35A, 583–588. [Google Scholar] [CrossRef]
- Zhou, X.B.; De Hosson, J.T.M. De Reactive Wetting of Liquid Metals on Ceramic Substrates. Acta Mater. 1996, 44, 421–426. [Google Scholar] [CrossRef]
- Laurent, V.; Chatain, D.; Eustathopoulos, N. Wettability of SiO2 and Oxidized SiC by Aluminium. Mater. Sci. Eng. A 1991, 135, 89–94. [Google Scholar] [CrossRef]
- Aksay, I.A.; Hoge, C.E.; Pask, J.A. Wetting under Chemical Equilibrium and Nonequilibrium Conditions. J. Phys. Chem. 1974, 78, 1178–1183. [Google Scholar] [CrossRef]
- Rasouli, A.; Herstad, K.E.; Safarian, J.; Tranell, G. Magnesiothermic Reduction of Natural Quartz. Metall. Mater. Trans. B 2022, 53, 2132–2142. [Google Scholar] [CrossRef]
- Rasouli, A.; Tsoutsouva, M.; Safarian, J.; Tranell, G. Kinetics of Magnesiothermic Reduction of Natural Quartz. Materials 2022, 15, 6535. [Google Scholar] [CrossRef] [PubMed]
- Jusnes, K.F. Phase Transformations and Thermal Degradation in Industrial Quartz. Doctoral Dissertation, Norwegian University of Science and Tehnology, Trondheim, Norway, 2020. [Google Scholar]
- Kudyba, A.; Sobczak, N.; Budzioch, J.; Polkowski, W.; Giuranno, D. Improvements in Experimental Investigation of Molten Mg-Based Materials. Mater. Des. 2018, 160, 915–917. [Google Scholar] [CrossRef]
- Kudyba, A.; Sobczak, N.; Polkowski, W.; Bruzda, G.; Polkowska, A.; Giuranno, D. Improved Methodological Concepts for Processing Liquid Mg at High Temperature. J. Magnes. Alloys 2021, 9, 183–191. [Google Scholar] [CrossRef]
- Eustathopoulos, N.; Sobczak, N.; Passerone, A.; Nogi, K. Measurement of Contact Angle and Work of Adhesion at High Temperature. J. Mater. Sci. 2005, 40, 2271–2280. [Google Scholar] [CrossRef]
- Kudyba, A.; Polkowski, W.; Bruzda, G.; Polkowska, A.; Giuranno, D. Enhancement of Wettability in AZ91/B4C System by a Mechanical Purification of Liquid Alloy. J. Magnes. Alloys 2022, 10, 3133–3142. [Google Scholar] [CrossRef]
- Sobczak, N.; Singh, M.; Asthana, R. High-Temperature Wettability Measurements in Metal/Ceramic Systems—Some Methodological Issues. Curr. Opin. Solid State Mater. Sci. 2005, 9, 241–253. [Google Scholar] [CrossRef]
- Liggieri, L.; Passerone, A. ASTRA Reference Book, IENI Report; National Research Council of Italy: Genova, Italy, 2007. [Google Scholar]
- FactSage. Available online: https://www.factsage.com (accessed on 15 May 2023).
- Gutman, I.; Klinger, L.; Gotman, I.; Shapiro, M. Experimental Observation of Periodic Structure Formation in SiO2 ± Mg System. Scr. Mater. 2001, 45, 363–367. [Google Scholar] [CrossRef]
- Gutman, I.; Gotman, I.; Shapiro, M. Kinetics and Mechanism of Periodic Structure Formation at SiO2/Mg Interface. Acta Mater. 2006, 54, 4677–4684. [Google Scholar] [CrossRef]
- Gutman, I.; Klinger, L.; Gotman, I.; Shapiro, M. Model for Evolution of Periodic Layered Structure in the SiO2/Mg System. Solid State Ion. 2009, 180, 1350–1355. [Google Scholar] [CrossRef]
- Chen, Y.C.; Xu, J.; Fan, X.H.; Zhang, X.F.; Han, L.; Lin, D.Y.; Li, Q.H.; Uher, C. The Mechanism of Periodic Layer Formation during Solid-State Reaction between Mg and SiO2. Intermetallics 2009, 17, 920–926. [Google Scholar] [CrossRef]
- Guo, X.L.; Liu, Z.G.; Chen, X.Y.; Zhu, S.N.; Xiong, S.B.; Hu, W.S.; Lin, C.Y. Pulsed Laser Deposition of Pulsed Laser Deposition of SrxBa1−x Nb2O6/MgO Bilayered Films on Si Wafer in Waveguide Form. J. Phys. D Appl. Phys. 1996, 29, 1632–1635. [Google Scholar] [CrossRef]
- Dezellus, O.; Eustathopoulos, N. Fundamental Issues of Reactive Wetting by Liquid Metals. J. Mater. Sci. 2010, 45, 4256–4264. [Google Scholar] [CrossRef]
- Gale, W.F.; Totemeier, T.C. (Eds.) Chapter 14. General Physical Properties. In Smithells Metals Reference Book; Butterworth-Heinemann: Oxford, UK, 2004; ISBN 9780750675093. [Google Scholar]
- Chase, M.W. Journal of Physical and Chemical Reference Data: No. 9 Pt. 2: Monograph NIST-JANAF Thermochemical Tables Cr-Zr: Vol. No. 9 Pt. 2, 4th ed.; American Chemical Society and the American Institute of Physics for the National Institute of Standards and Technology: New York, NY, USA, 1998. [Google Scholar]
- Young, T., III. An Essay on the Cohesion of Fluids. Philos. Trans. R. Soc. Lond. 1805, 95, 171–172. [Google Scholar] [CrossRef]
Figure 1.
The scheme shows the separate heating of the tested couple of materials and the mechanical purification of a metal drop from the oxide film by squeezing a drop from the capillary in the capillary purification procedure [27].
Figure 1.
The scheme shows the separate heating of the tested couple of materials and the mechanical purification of a metal drop from the oxide film by squeezing a drop from the capillary in the capillary purification procedure [27].
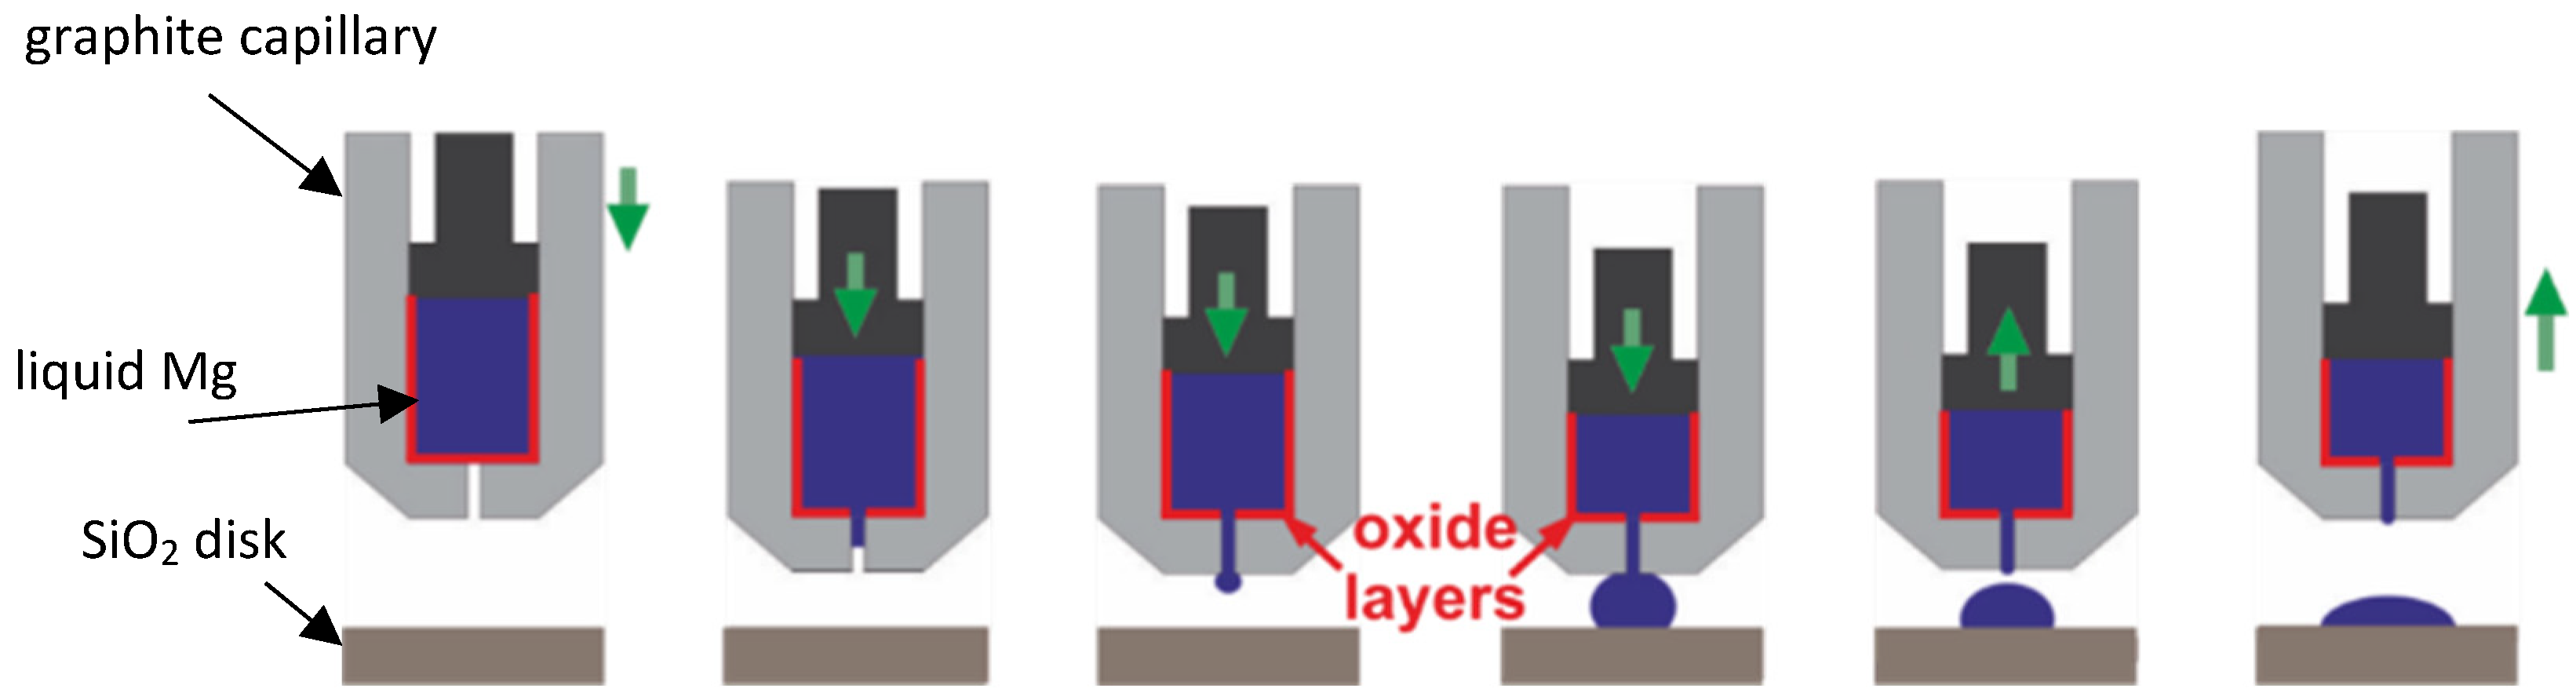
Figure 2.
The recorded images and sample images after the wetting test at various temperatures; 973 K (a,f), 1073 K (b,g), 1123 K (c,h), 1223K (d,i), and 1273 K (e,j).
Figure 2.
The recorded images and sample images after the wetting test at various temperatures; 973 K (a,f), 1073 K (b,g), 1123 K (c,h), 1223K (d,i), and 1273 K (e,j).
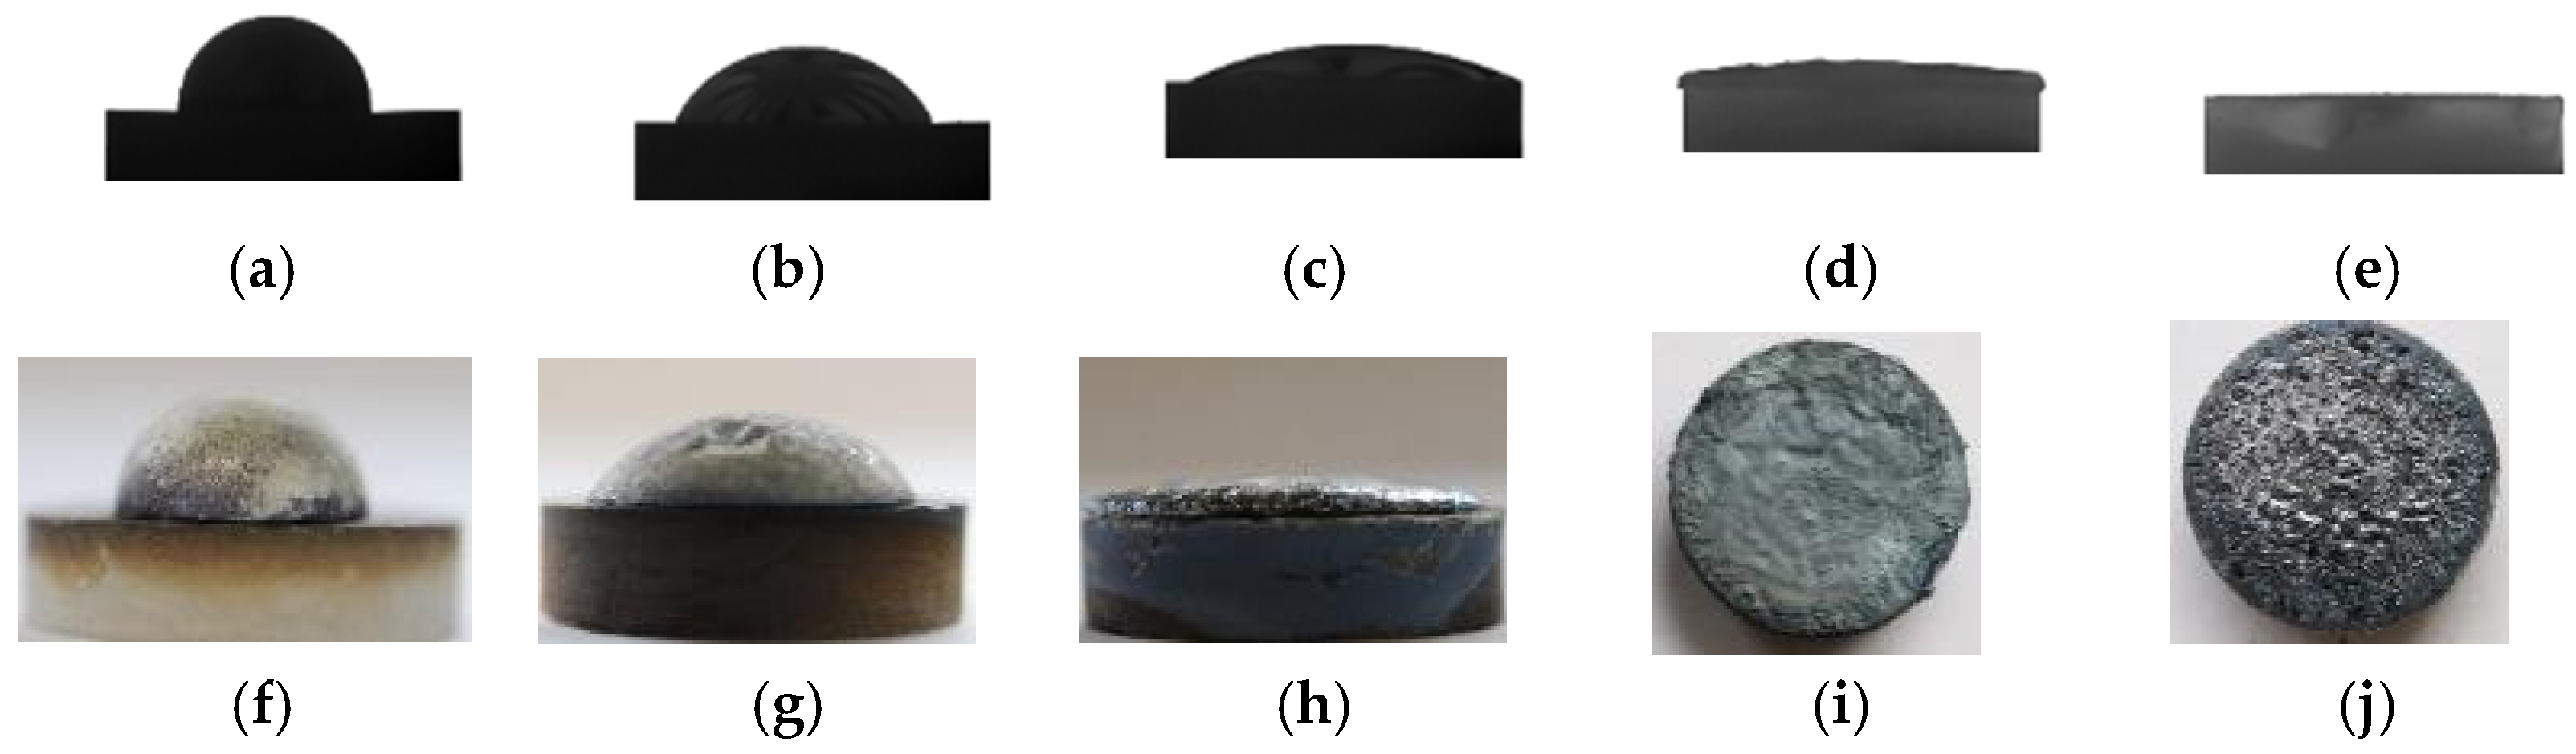
Figure 3.
Variation of the left and right contact angles immediately after the deposition of Mg drops at 973 K (a), 1073 K (b), 1123 K (c), and 1173 K (d).
Figure 3.
Variation of the left and right contact angles immediately after the deposition of Mg drops at 973 K (a), 1073 K (b), 1123 K (c), and 1173 K (d).

Figure 4.
Variation of the average contact angles over time at 973 K, 1073 K, and 1123 K.
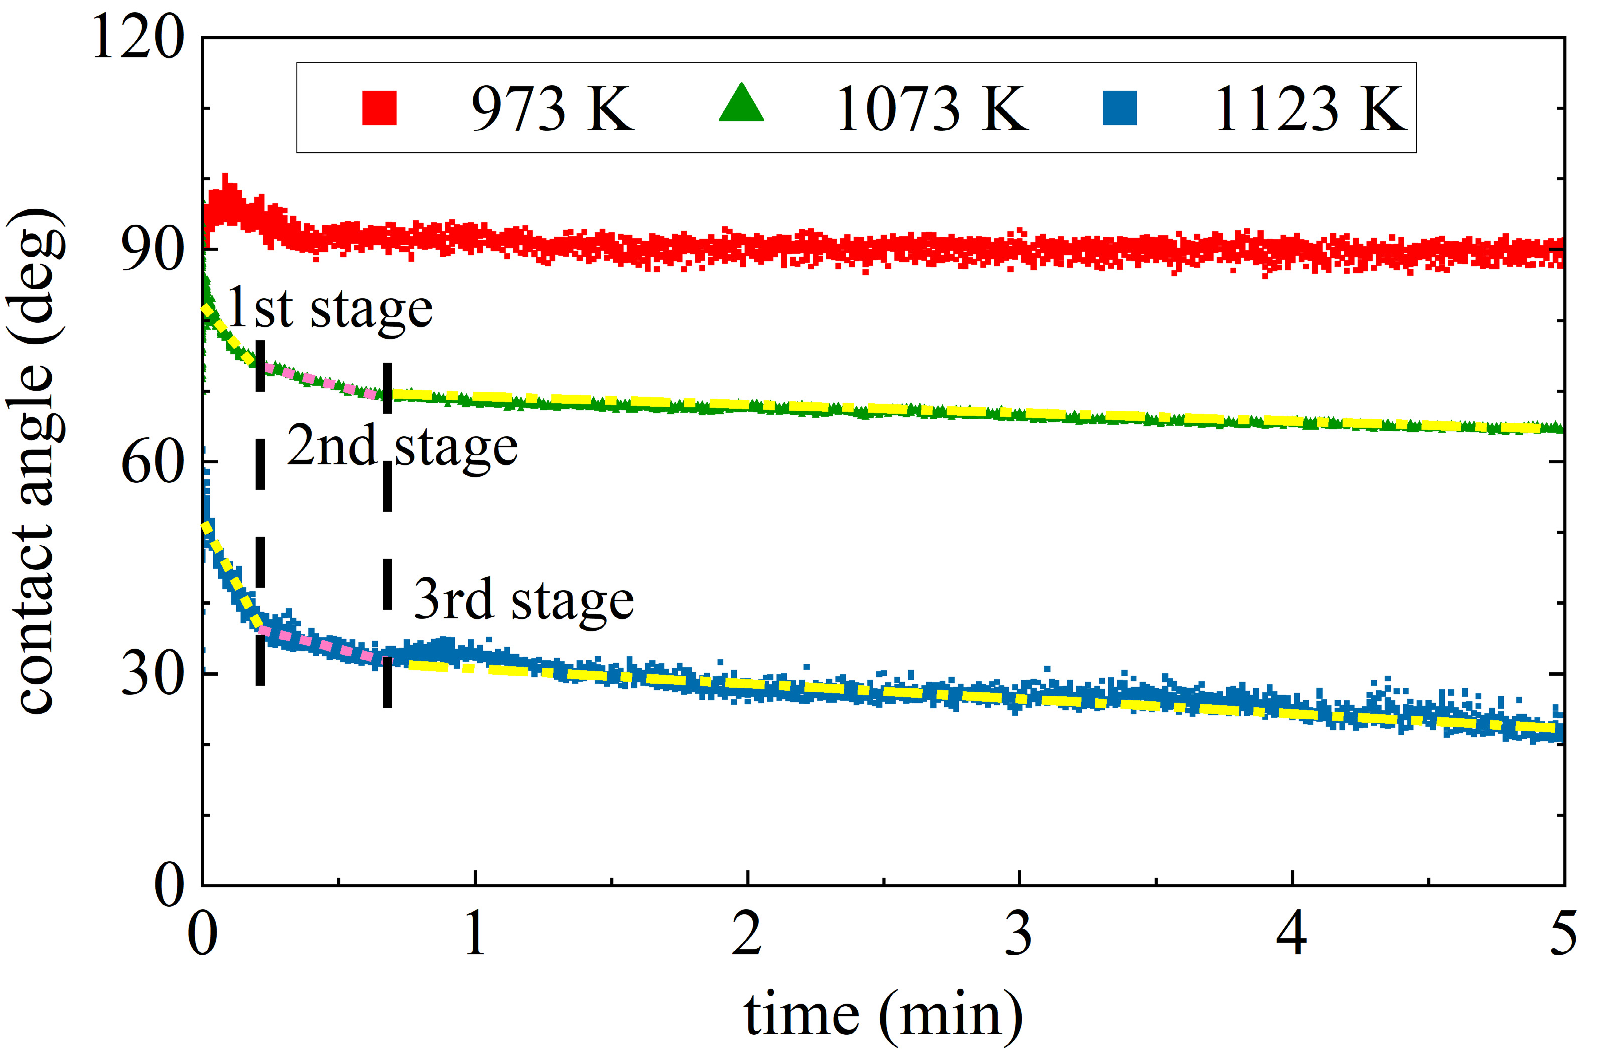
Figure 5.
The Gibbs energy of the reaction between SiO2 and Mg to form Si-MgO and Mg2Si-MgO depends on the Mg available during the reduction reaction, calculated by FactSage 8.1 [32].
Figure 5.
The Gibbs energy of the reaction between SiO2 and Mg to form Si-MgO and Mg2Si-MgO depends on the Mg available during the reduction reaction, calculated by FactSage 8.1 [32].
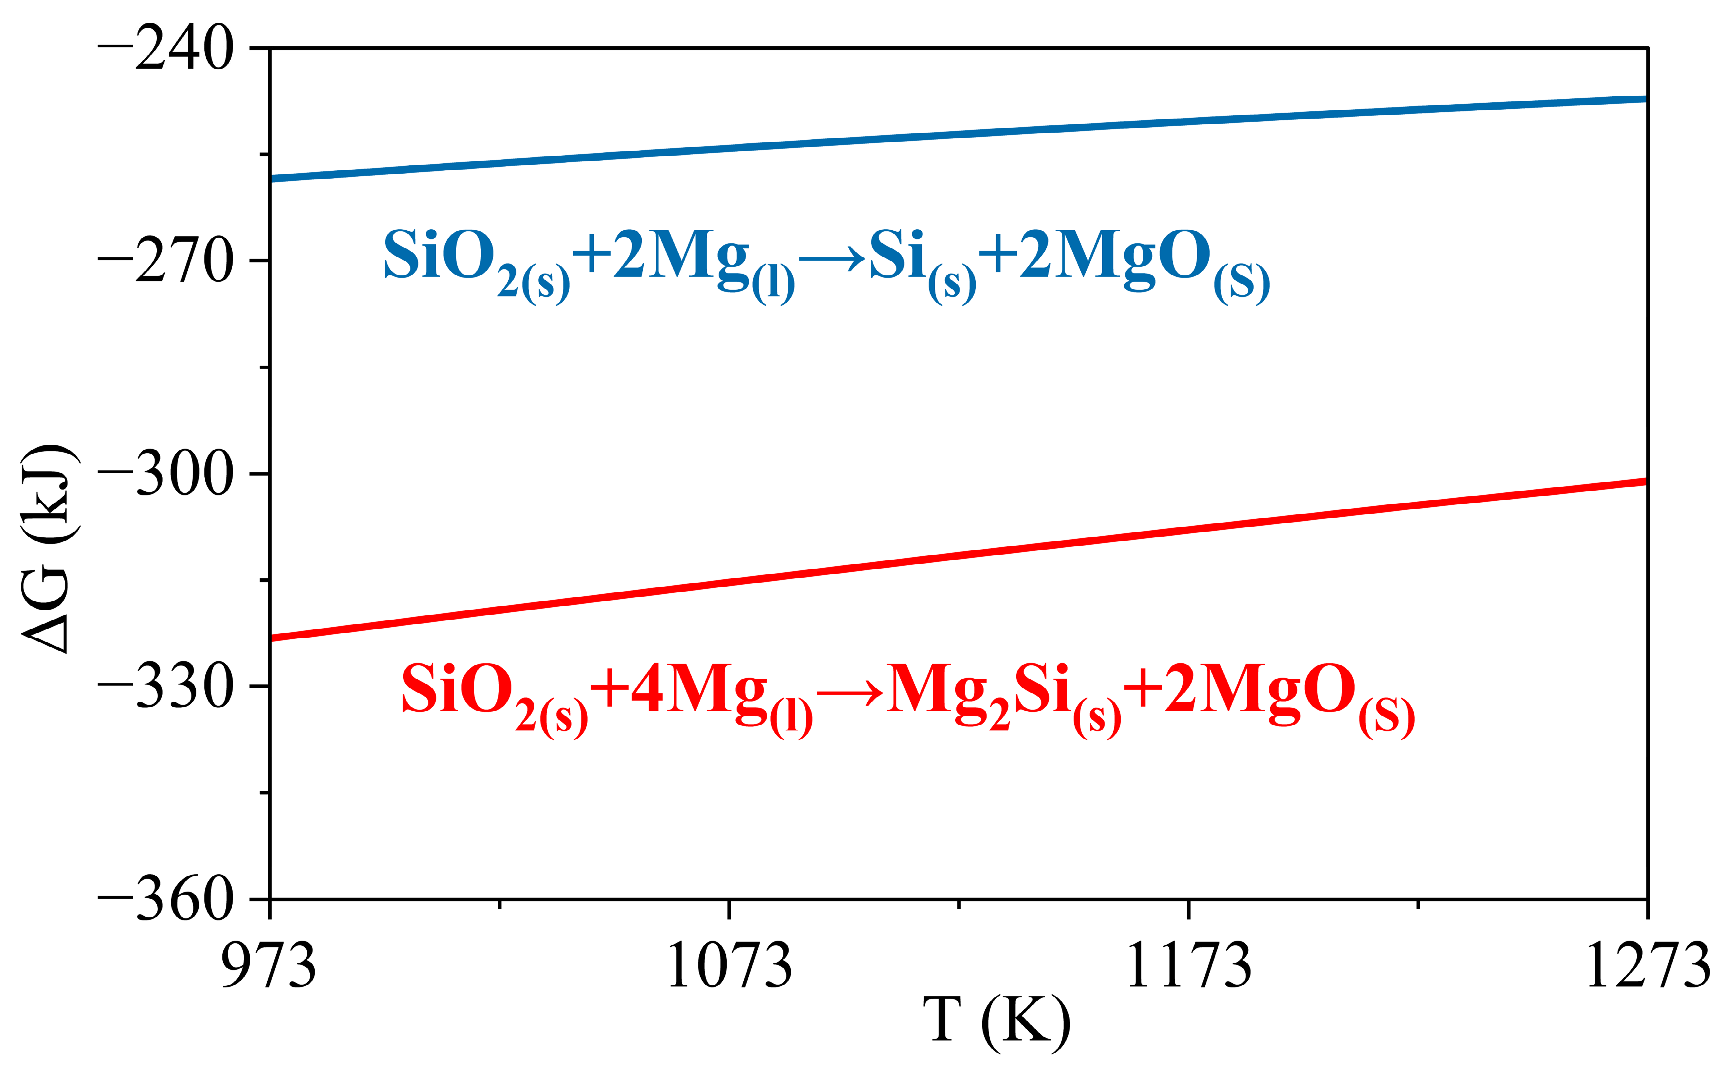
Figure 6.
Backscattered electron images of Mg drops and substrates at 973 K (a), 1073 K (b), and 1123 K (c).
Figure 6.
Backscattered electron images of Mg drops and substrates at 973 K (a), 1073 K (b), and 1123 K (c).

Figure 7.
Backscattered electron images and elemental mapping of substrates at 973 K (a–d) and 1073 K (e–h).
Figure 7.
Backscattered electron images and elemental mapping of substrates at 973 K (a–d) and 1073 K (e–h).
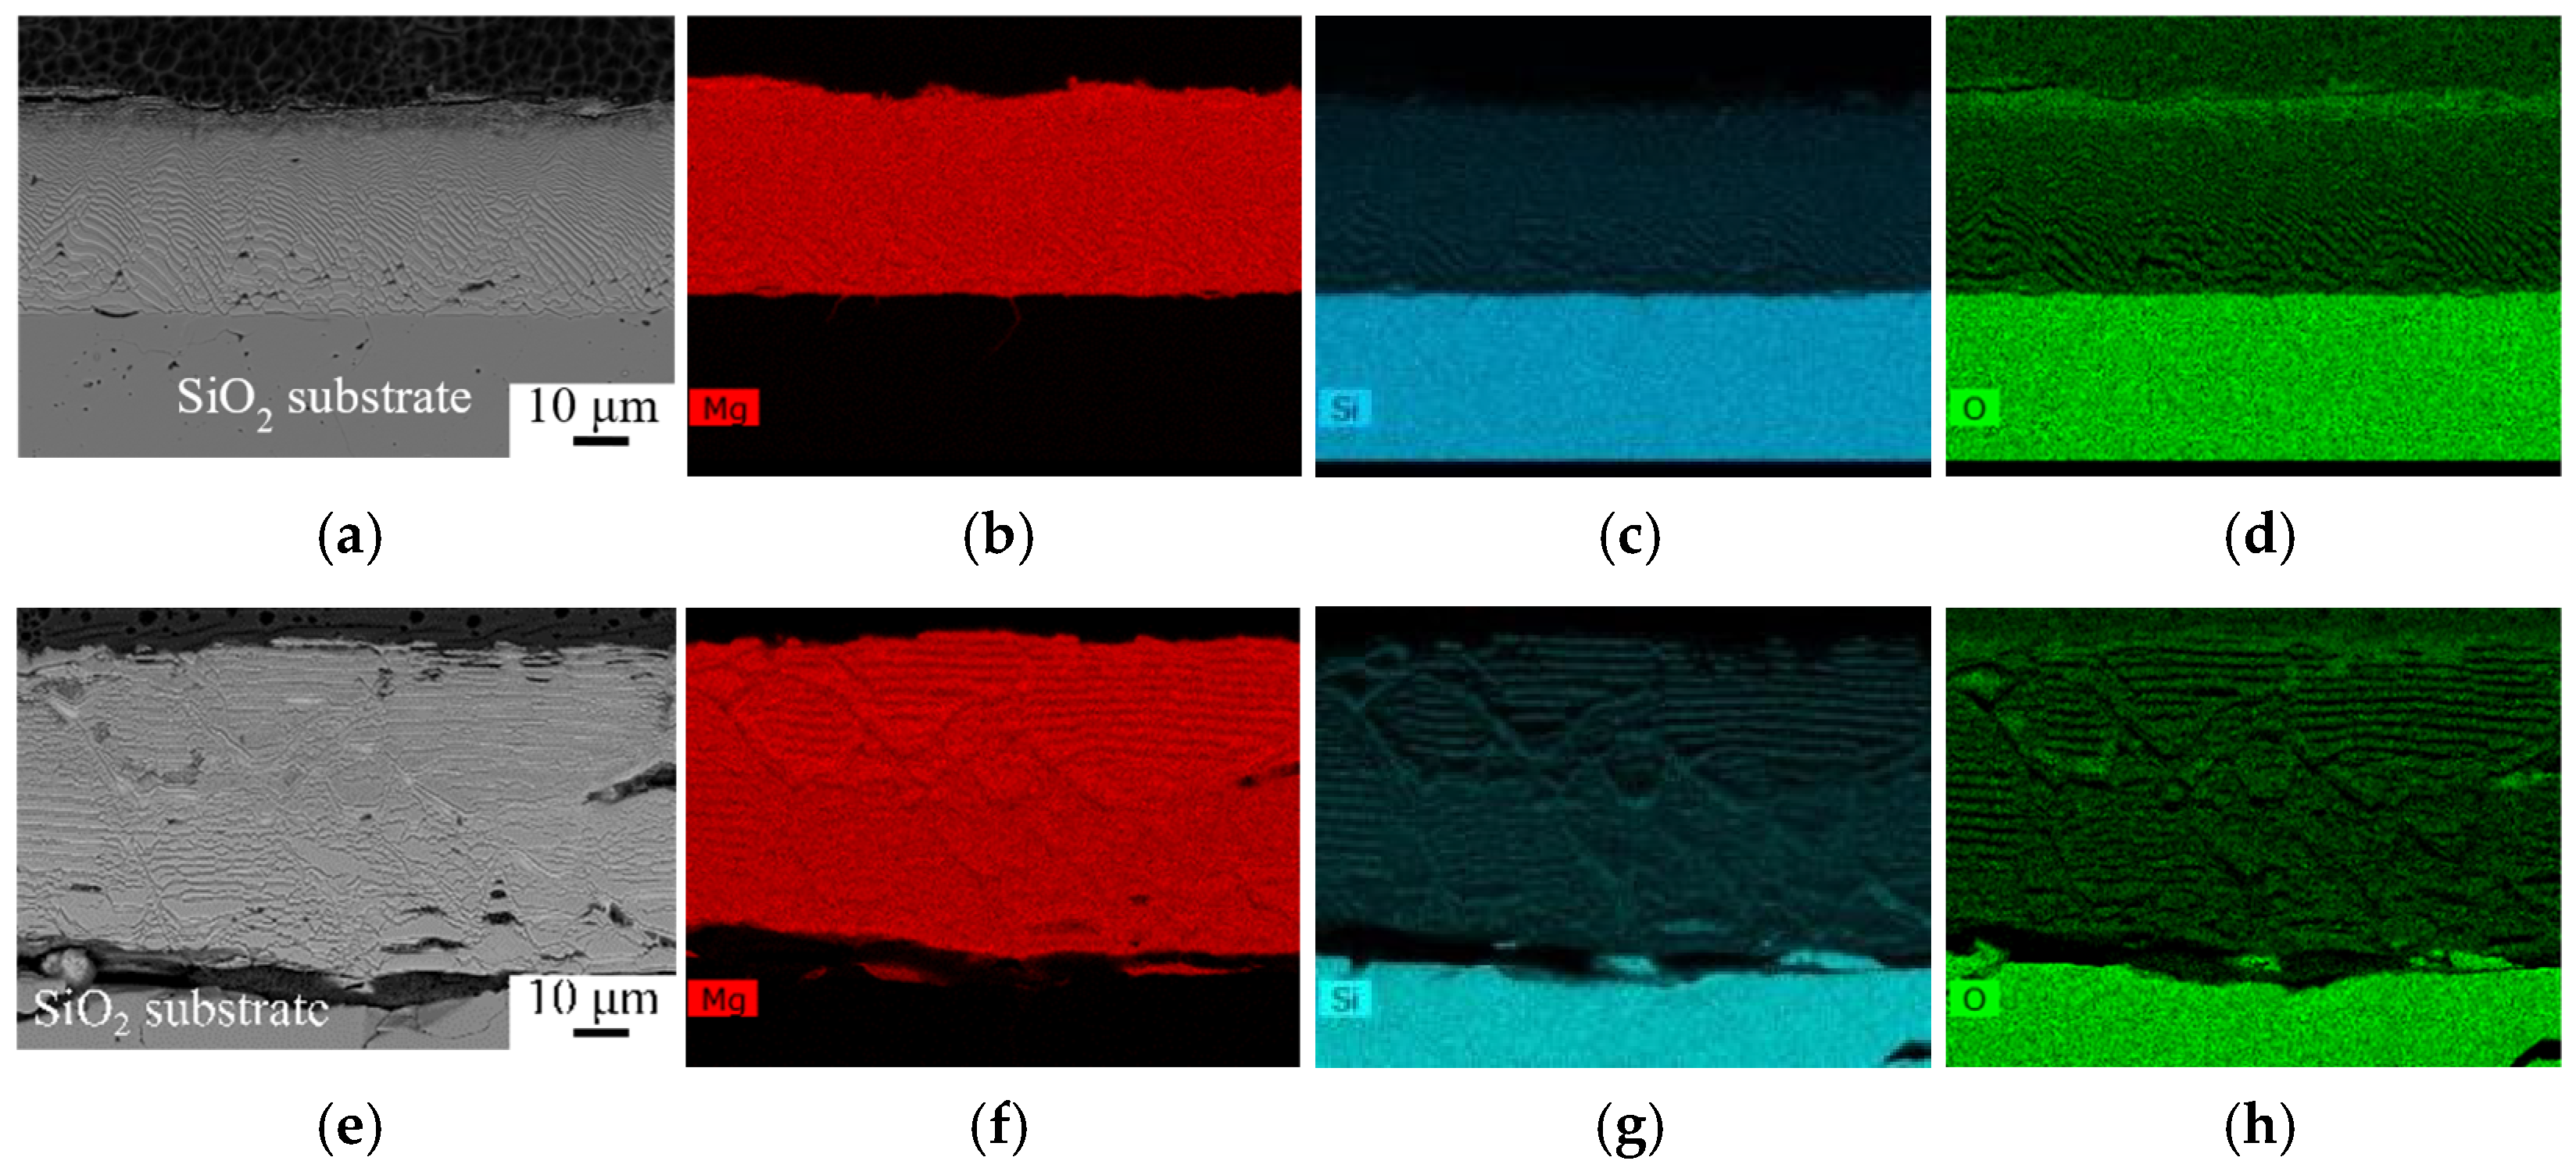
Figure 8.
Backscattered electron images and elemental mapping at 1173 K (a–d), 1223 K (e–h), and 1273 K (i–l).
Figure 8.
Backscattered electron images and elemental mapping at 1173 K (a–d), 1223 K (e–h), and 1273 K (i–l).
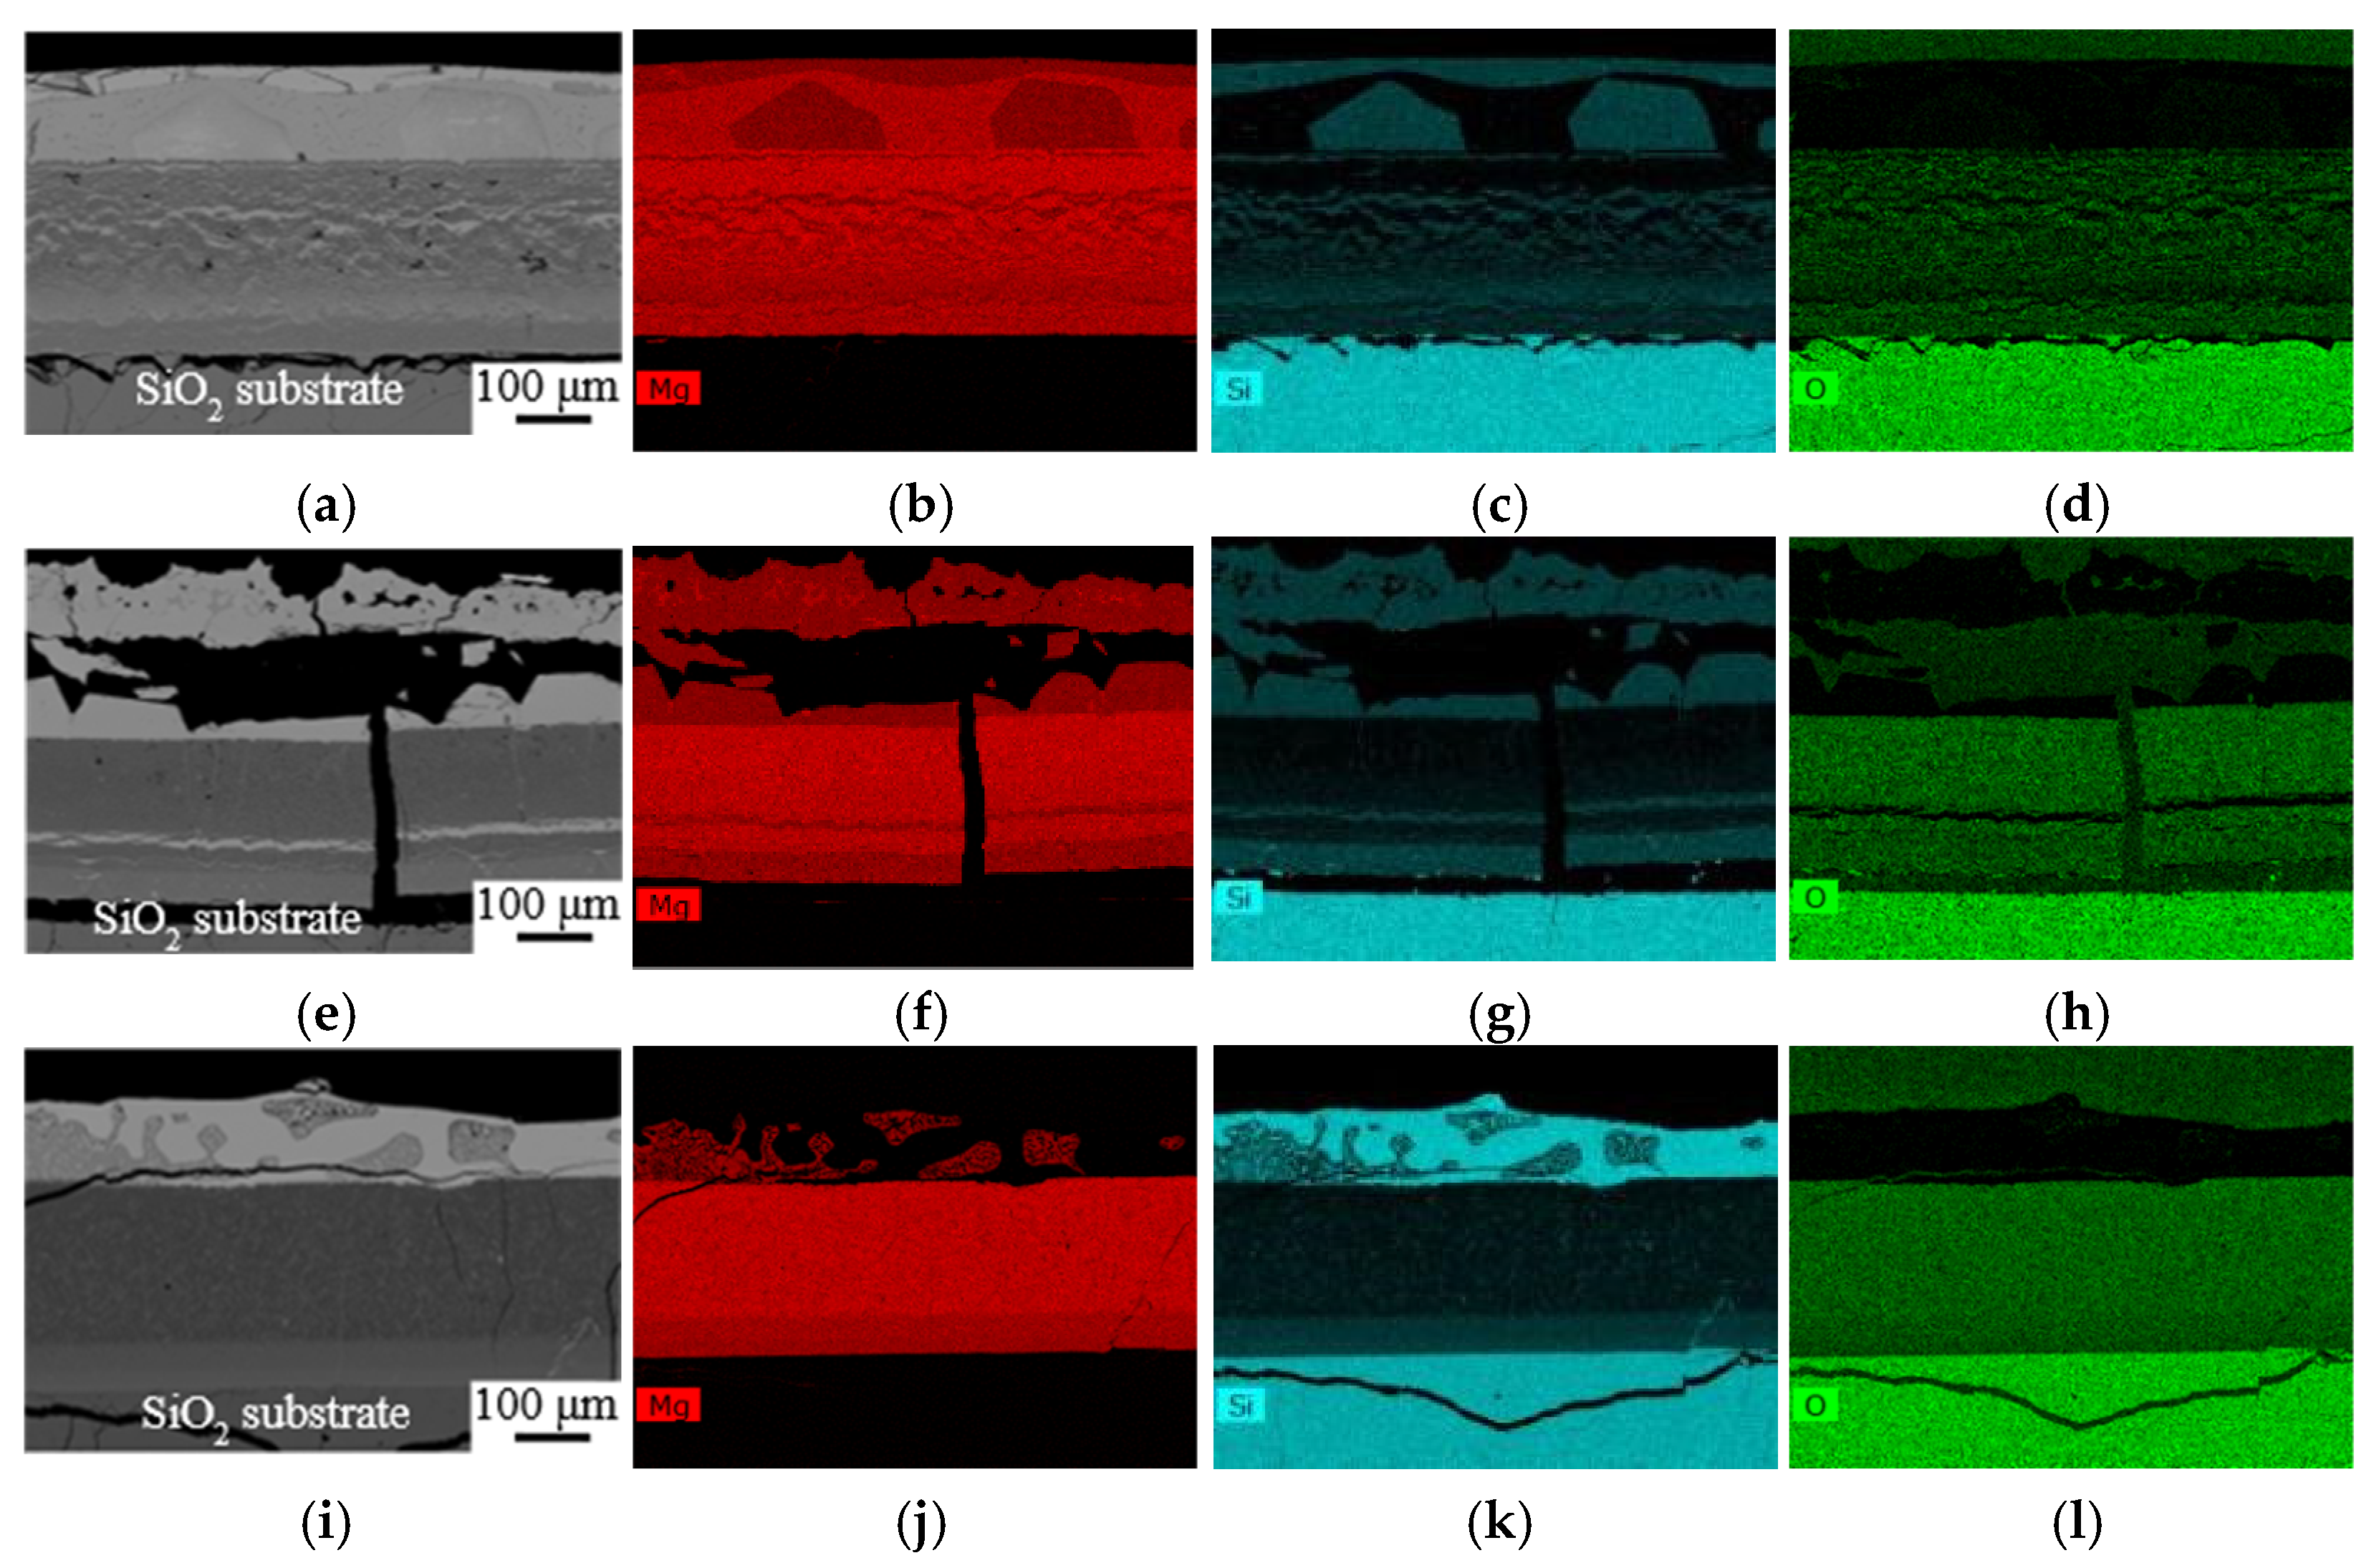
Figure 10.
The binary phase diagram of Mg-Si, plotted by FactSage 8.1 [32].
Figure 10.
The binary phase diagram of Mg-Si, plotted by FactSage 8.1 [32].

Table 1.
Vapor pressure of Mg at different wetting temperatures, calculated by FactSage 8.1.
| Temperature (K) | 973 | 1073 | 1123 | 1173 | 1223 | 1273 |
|---|---|---|---|---|---|---|
| Vapor pressure (atm) | 9.4 × 10⁻³ | 4.3 × 10⁻² | 8.4 × 10⁻² | 1.5 × 10⁻¹ | 2.6 × 10⁻¹ | 4.32 × 10⁻¹ |
Disclaimer/Publisher’s Note: The statements, opinions and data contained in all publications are solely those of the individual author(s) and contributor(s) and not of MDPI and/or the editor(s). MDPI and/or the editor(s) disclaim responsibility for any injury to people or property resulting from any ideas, methods, instructions or products referred to in the content. |
© 2024 by the authors. Licensee MDPI, Basel, Switzerland. This article is an open access article distributed under the terms and conditions of the Creative Commons Attribution (CC BY) license (https://creativecommons.org/licenses/by/4.0/).
Share and Cite
MDPI and ACS Style
Rasouli, A.; Kudyba, A.; Bruzda, G.; Safarian, J.; Tranell, G. High-Temperature Reactive Wetting of Natural Quartz by Liquid Magnesium. Materials 2024, 17, 1302. https://doi.org/10.3390/ma17061302
AMA Style
Rasouli A, Kudyba A, Bruzda G, Safarian J, Tranell G. High-Temperature Reactive Wetting of Natural Quartz by Liquid Magnesium. Materials. 2024; 17(6):1302. https://doi.org/10.3390/ma17061302
Chicago/Turabian StyleRasouli, Azam, Artur Kudyba, Grzegorz Bruzda, Jafar Safarian, and Gabriella Tranell. 2024. "High-Temperature Reactive Wetting of Natural Quartz by Liquid Magnesium" Materials 17, no. 6: 1302. https://doi.org/10.3390/ma17061302
Note that from the first issue of 2016, this journal uses article numbers instead of page numbers. See further details here.