

The Surface Roughness of Contemporary Indirect CAD/CAM Restorative Materials That Are Glazed and Chair-Side-Finished/Polished

 ,
,
Abstract
1. Introduction
2. Materials and Methods
- All the specimens were mounted in a mold as shown in Figure 2a.
- A handpiece was mounted in a dental surveyor in order to control the movement and strokes of the burs to the surfaces of the specimens (Figure 2b,c).
- Finishing was performed using a diamond-impregnated system (DIASYNT®Plus; EVE Ernst Vetter GmbH, Neureutstr. 6, 75210 Keltern, Germany) in one direction for 60 s to the full surface (Figure 2d).
- Smoothening was performed using DIAPOL® Set HP 310 (EVE Ernst Vetter GmbH, Neureutstr. 6, 75210 Keltern, Germany) coarse grit in one direction for 60 s to the full surface (Figure 2d).
- Pre-polishing was performed using DIAPOL® Set HP 310 (EVE Ernst Vetter GmbH, Neureutstr. 6, 75210 Keltern, Germany) medium grit in one direction for 60 s to the full surface (Figure 2d).
- Lastly, high-shine polishing was performed using DIAPOL® Set HP 310 (EVE Ernst Vetter GmbH, Neureutstr. 6, 75210 Keltern, Germany) fine grit in one direction for 60 s to the full surface (Figure 2d).
3. Results
4. Discussion
5. Conclusions
- significant variations in the surface roughness (Ra) were found between the finished/polished and glazed surfaces of the five test materials;
- hybrid ceramics exhibited the highest Ra values for the finished/polished surfaces as compared to other test materials;
- zirconia exhibited the highest Ra values among the glazed surfaces of the test materials;
- the Ra values of both the finished/polished or glazed surfaces of the tested materials were within the clinically acceptable range (0.2–0.5 μm), except for the glazed surface of the zirconia ceramics (0.84 μm).
Author Contributions
Funding
Institutional Review Board Statement
Informed Consent Statement
Data Availability Statement
Acknowledgments
Conflicts of Interest
References
- Sakaguchi, R.L.; Powers, J.M. Craig’s Restorative Dental Materials, 13th ed.; Elsevier: Amsterdam, The Netherlands, 2012. [Google Scholar]
- Guess, P.C.; Schultheis, S.; Bonfante, E.A.; Coelho, P.G.; Ferencz, J.L.; Silva, N.R. All-Ceramic Systems: Laboratory and Clinical Performance. Dent. Clin. N. Am. 2011, 55, 333–352. [Google Scholar] [CrossRef] [PubMed]
- Vichi, A.; Zhao, Z.; Paolone, G.; Scotti, N.; Mutahar, M.; Goracci, C.; Louca, C. Factory Crystallized Silicates for Monolithic Metal-Free Restorations: A Flexural Strength and Translucency Comparison Test. Materials 2022, 15, 7834. [Google Scholar] [CrossRef] [PubMed]
- Zarone, F.; Russo, S.; Sorrentino, R. From porcelain- fused-to-metal to Zr: Clinical and experimental considerations. Dent. Mater. 2011, 27, 83–96. [Google Scholar] [CrossRef] [PubMed]
- Mallineni, S.K.; Nuvvula, S.; Matinlinna, J.P.; Yiu, C.K.; King, N.M. Biocompatibility of various dental materials in contemporary dentistry: A narrative insight. J. Investig. Clin. Dent. 2012, 4, 9–19. [Google Scholar] [CrossRef]
- Kelly, J.R.; Benetti, P. Ceramic materials in dentistry: Historical evolution and current practice. Aust. Dent. J. 2011, 56, 84–96. [Google Scholar] [CrossRef] [PubMed]
- Griggs, J.A. Recent Advances in Materials for All-Ceramic Restorations. Dent. Clin. N. Am. 2007, 51, 713–727. [Google Scholar] [CrossRef] [PubMed]
- Li, R.W.K.; Chow, T.W.; Matinlinna, J.P. Ceramic dental biomaterials and CAD/CAM technology: State of the art. J. Prosthodont. Res. 2014, 58, 208–216. [Google Scholar] [CrossRef]
- Bahgat, S.A.; Basheer, R.R.; El Sayed, S.M. Effect of Zr addition to lithium disilicate ceramic on translucency and bond strength using different adhesive strategies. Dent. J. 2015, 61, 4519–4533. [Google Scholar]
- Coldea, A.; Swain, M.V.; Thiel, N. Mechanical properties of polymer-infiltrated-ceramic-network materials. Dent. Mater. 2013, 29, 419–426. [Google Scholar] [CrossRef]
- Mota, E.G.; Smidt, L.N.; Fracasso, L.M.; Burnett, L.H., Jr.; Spohr, A.M. The effect of milling and postmilling procedures on the surface roughness of CAD/CAM materials. J. Esthet. Restor. Dent. 2017, 29, 450–458. [Google Scholar] [CrossRef]
- Chang, C.W.; Waddell, J.N.; Lyons, K.M.; Swain, M.V. Cracking of Porcelain Surfaces Arising from Abrasive Grinding with a Dental Air Turbine. J. Prosthodont. 2011, 20, 613–620. [Google Scholar] [CrossRef]
- Vila-Nova, T.E.L.; de Carvalho, I.H.G.; Moura, D.M.D.; Batista, A.U.D.; Zhang, Y.; Paskocimas, C.A.; Bottino, M.A.; Souza, R.O.d.A.e. Effect of finishing/polishing techniques and low temperature degradation on the surface topography, phase transformation and flexural strength of ultra- translucent ZrO2 ceramic. Dent. Mater. 2020, 36, 126–139. [Google Scholar] [CrossRef]
- Silva, F.P.; Vilela, A.L.R.; Almeida, M.M.G.; Oliveira, A.R.F.; Raposo, L.H.A.; Menezes, M.S. Topography, Gloss and Flexural Strength of Pressable Ceramic After Finishing- Polishing Protocols. Braz. Dent. J. 2019, 30, 164–170. [Google Scholar] [CrossRef]
- Flury, S.; Peutzfeldt, A.; Lussi, A. Influence of Surface Roughness on Mechanical Properties of Two Computer-aided Design/Computer-aided Manufacturing (CAD/CAM) Ceramic Materials. Oper. Dent. 2012, 37, 617–624. [Google Scholar] [CrossRef] [PubMed]
- Mohammadibassir, M.; Rezvani, M.B.; Golzari, H.; Salehi, E.M.; Fahimi, M.A.; Fard, M.J.K. Effect of Two Polishing Systems on Surface Roughness, Topography, and Flexural Strength of a Monolithic Lithium Disilicate Ceramic. J. Prosthodont. 2017, 28, E172–E180. [Google Scholar] [CrossRef] [PubMed]
- Vieira, A.C.; Oliveira, M.C.S.; Lima, E.M.C.X.; Rambob, I.; Leite, M. Evaluation of the Surface Roughness in Dental Ceramics Submitted to Different Finishing and Polishing Methods. J. Indian Prosthodont. Soc. 2013, 13, 290–295. [Google Scholar] [CrossRef] [PubMed]
- Aravind, P.; Razak, P.A.; Francis, P.G.; Issac, J.K.; Shanoj, R.P.; Sasikumar, T.P. Comparativeevaluation of the efficiency of four ceramic finishing systems. J. Int. Oral Health 2013, 5, 59–64. [Google Scholar] [PubMed]
- Contreras, L.P.C.C.; Dal Piva, A.M.O.; Ribeiro, F.C.; Anami, L.C.; Camargo, S.E.A.A.; Jorge, A.O.C.; Bottino, M.A. Effects of Manufacturing and Finishing Techniques of Feldspathic Ceramics on Surface Topography, Biofilm Formation, and Cell Viability for Human Gingival Fibroblasts. Oper. Dent. 2018, 43, 593–601. [Google Scholar] [CrossRef] [PubMed]
- Alhabdan, A.A.; El-Hejazi, A.A. Comparison of surface roughness of ceramics after polishing with different intraoral polishing systems using profilometer and SEM. J. Dent. Health Oral Disord. Ther. 2015, 2, 1–11. [Google Scholar] [CrossRef][Green Version]
- Karan, S.; Toroglu, M.S. Porcelain Refinishing with Two Different Polishing Systems after Orthodontic Debonding. Angle Orthod. 2008, 78, 947–953. [Google Scholar] [CrossRef]
- Carrabba, M.; Vichi, A.; Vultaggio, G.; Pallari, S.; Paravina, R. Effect of Finishing and Polishing on the Surface Roughness and Gloss of Feldspathic Ceramic for Chairside CAD/CAM Systems. Oper. Dent. 2017, 42, 175–184. [Google Scholar] [CrossRef]
- Dutra, D.; Pereira, G.; Kantorski, K.; Exterkate, R.; Kleverlaan, C.; Valandro, L.; Zanatta, F. Grinding with Diamond Burs and Hydrothermal Aging of a Y-TZP Material: Effect on the Material Surface Characteristics and Bacterial Adhesion. Oper. Dent. 2017, 42, 669–678. [Google Scholar] [CrossRef]
- Haralur, S.B. Evaluation of efficiency of manual polishing over autoglazed and overglazed porcelain and its effect on plaque accumulation. J. Adv. Prosthodont. 2012, 4, 179–186. [Google Scholar] [CrossRef] [PubMed]
- Matzinger, M.; Hahnel, S.; Preis, V.; Rosentritt, M. Polishing effects and wear performance of chairside CAD/CAM materials. Clin. Oral Investig. 2018, 23, 725–737. [Google Scholar] [CrossRef] [PubMed]
- Jefferies, S.R. Abrasive Finishing and Polishing in Restorative Dentistry: A State-of-the-Art Review. Dent. Clin. N. Am. 2007, 51, 379–397. [Google Scholar] [CrossRef] [PubMed]
- Martínez-Gomis, J.; Bizar, J.; Anglada, J.M.; Samsó, J.; Peraire, M. Comparative evaluation of four finishing systems on one ceramic surface. Int. J. Prosthodont. 2003, 16, 74–77. [Google Scholar]
- ISO. ISO 21920-2: 2021; Geometrical Product Specifications (GPS) Surface Texture: Profile Part 2: Terms, Definitions and Surface Texture Parameters. International Organization for Standardization: Geneva, Switzerland, 2021. Available online: https://www.iso.org/standard/72226.html (accessed on 15 February 2022).
- Tonietto, L.; Gonzaga, L., Jr.; Veronez, M.R.; de Souza Kazmierczak, C.; Arnold, D.C.M.; da Costa, C.A. New Method for Evaluating Surface Roughness Parameters Acquired by Laser Scanning. Sci. Rep. 2019, 9, 15038. [Google Scholar] [CrossRef]
- Ružbarský, J. The Difficulty of Measuring the Roughness of Glossy Surfaces Using the Triangulation Principle. Appl. Sci. 2023, 13, 5155. [Google Scholar] [CrossRef]
- Shulev, A.; Roussev, I.; Karpuzov, S.; Stoilov, G.; Ignatova, D.; von See, C.; Mitov, G. Roughness Measurement of Dental Materials. J. Theor. Appl. Mech. 2016, 46, 27–36. [Google Scholar] [CrossRef]
- Pumpaluk, P.; Kulvarangkun, A.; Panyayong, W. Experimental study of surface roughness of dental ceramics after polishing with three types of polishing systems. J. Int. Soc. Prev. Community Dent. 2022, 12, 540–546. [Google Scholar] [CrossRef]
- Tholt de Vasconcellos, B.; Miranda-Júnior, W.G.; Prioli, R.; Thompson, J.; Oda, M. Surface roughness in ceramics with different finishing techniques using atomic force microscope and profilometer. Oper. Dent. 2006, 31, 442–449. [Google Scholar] [CrossRef] [PubMed]
- Marchesi, G.; Piloni, A.C.; Nicolin, V.; Turco, G.; Di Lenarda, R. Chairside CAD/CAM Materials: Current Trends of Clinical Uses. Biology 2021, 10, 1170. [Google Scholar] [CrossRef] [PubMed]
- Rashid, H. The effect of surface roughness on ceramics used in dentistry: A review of literature. Eur. J. Dent. 2014, 8, 571–579. [Google Scholar] [CrossRef] [PubMed]
- Pawlus, P.; Reizer, R.; Wieczorowski, M. Functional Importance of Surface Texture Parameters. Materials 2021, 14, 5326. [Google Scholar] [CrossRef] [PubMed]
- Moncayo, A.M.A.; Peñate, L.; Arregui, M.; Giner-Tarrida, L.; Cedeño, R. State of the Art of Different Zirconia Materials and Their Indications According to Evidence-Based Clinical Performance: A Narrative Review. Dent. J. 2023, 11, 18. [Google Scholar] [CrossRef]
- Jitwirachot, K.; Rungsiyakull, P.; Holloway, J.A.; Jia-Mahasap, W. Wear Behavior of Different Generations of Zirconia: Present Literature. Int. J. Dent. 2022, 2022, 9341616. [Google Scholar] [CrossRef]
- Caglar, I.; Ates, S.M.; Yesil Duymus, Z. The effect of various polishing systems on surface roughness and phase transformation of monolithic zirconia. J. Adv. Prosthodont. 2018, 10, 132–137. [Google Scholar] [CrossRef]
- Jorquera, G.; Mahn, E.; Sanchez, J.P.; Berrera, S.; Prado, M.J.; Stange, V.B. Hybrid Ceramics in Dentistry: A Literature Review. J. Clin. Res. Dent. 2018, 1, 1–5. [Google Scholar] [CrossRef]
- Baroudi, K.; Kaminedi, R.R.; Penumatsa, N.V.; Priya, T. The influence of finishing/polishing time and cooling system on surface roughness and microhardness of two different types of composite resin restorations. J. Int. Soc. Prev. Community Dent. 2014, 4, S99–S104. [Google Scholar] [CrossRef]
- Hegde, S.; Madhyastha, P.S.; Srikant, N.; Kotian, R.; Iyer, S.S. Effect of finishing/polishing techniques and time on surface roughness of esthetic restorative materials. Dent. Res. J. 2017, 14, 326–330. [Google Scholar] [CrossRef] [PubMed]
- Wheeler, J.; Deb, S.; Millar, B.J. Evaluation of the effects of polishing systems on surface roughness and morphology of dental composite resin. Br. Dent. J. 2020, 228, 527–532. [Google Scholar] [CrossRef]
- Mittal, S.; Rani, V.; Sukhija, U. An In vitro evaluation to compare the surface roughness of glazed, reglazed and chair side polished surfaces of dental porcelain. Contemp. Clin. Dent. 2021, 12, 164–168. [Google Scholar] [CrossRef]
- Al-Wahadni, A.; Martin, D.M. Glazing and finishing dental porcelain: A literature review. J. Can. Dent. Assoc. 1998, 64, 580–583. [Google Scholar] [PubMed]
- Daou, E.E. The Zirconia Ceramic: Strengths and Weaknesses. Open Dent. J. 2014, 8, 33–42. [Google Scholar] [CrossRef] [PubMed]
- Dikicier, S.; Korkmaz, C.; Atay, A. Surface roughness and characteristics of CAD/CAM zirconia and glass ceramics after combined treatment procedures. BMC Oral Health 2022, 22, 524. [Google Scholar] [CrossRef] [PubMed]
- Verdi, C.; Kasai, F.; Liu, P.; Jinnouchi, R.; Kresse, G. Thermal transport and phase transitions of zirconia by on-the-fly machine-learned interatomic potentials. Npj Comput. Mater. 2021, 7, 156. [Google Scholar] [CrossRef]
- Paolone, G.; Moratti, E.; Goracci, C.; Gherlone, E.; Vichi, A. Effect of Finishing Systems on Surface Roughness and Gloss of Full-Body Bulk-Fill Resin Composites. Materials 2020, 13, 5657. [Google Scholar] [CrossRef] [PubMed]
- Shi, H.Y.; Pang, R.; Yang, J.; Fan, D.; Cai, H.; Jiang, H.B.; Han, J.; Lee, E.-S.; Sun, Y. Overview of Several Typical Ceramic Materials for Restorative Dentistry. BioMed Res. Int. 2022, 2022, 8451445. [Google Scholar] [CrossRef] [PubMed]
- Wright, M.D.; Masri, R.; Driscoll, C.F.; Romberg, E.; Thompson, G.A.; Runyan, D.A. Comparison of three systems for the polishing of an ultra-low fusing dental porcelain. J. Prosthet. Dent. 2004, 92, 486–490. [Google Scholar] [CrossRef] [PubMed]
- Chu, F.C.; Frankel, N.; Smales, R.J. Surface roughness and flexural strength of self-glazed, polished, and reglazed In-Ceram/Vitadur Alpha porcelain laminates. Int. J. Prosthodont. 2000, 13, 66–71. [Google Scholar]
- Schuh, C.; Kinast, E.J.; Mezzomo, E.; Kapczinski, M.P. Effect of glazed and polished surface finishes on the friction coefficient of two low-fusing ceramics. J. Prosthet. Dent. 2005, 93, 245–252. [Google Scholar] [CrossRef] [PubMed]
- Rashid, H. Comparing Glazed and Polished Ceramic Surfaces Using Confocal Laser Scanning Microscopy. J. Adv. Microsc. Res. 2012, 7, 208–213. [Google Scholar] [CrossRef]
- Patterson, C.; McLundie, A.; Stirrups, D.; Taylor, W. Refinishing of porcelain by using a refinishing kit. J. Prosthet. Dent. 1991, 65, 383–388. [Google Scholar] [CrossRef] [PubMed]


| Test Material | Abbreviation | Brand | Manufacturer | Composition | LOT Number |
|---|---|---|---|---|---|
| Composite | TC | Tetric® CAD | Ivoclar Vivadent, Schaan, Lichtenstein | 64% Barium glass, 7.1% SiO2, 28.4% Dimethacrylates and 0.5% Pigments | Y28816 |
| Lithium-Disilicate-Glass-ceramics | LS2 | IPS e.max® CAD | Ivoclar Vivadent, Schaan, Lichtenstein | 5.0–11.0% P2O5, 0.0–8.0% ZnO, 0.0–5.0% Al2O3, 0.0–5.0% MgO, 11.0–19.0% Li2O, 0.0–13.0% K2O, 57.0–80.0% SiO2, 0.0–8.0% ZrO2 Coloring Oxides | Z02JYZ |
| Zirconium Oxide ceramics | ZrO2 | IPS e.max® ZirCAD | Ivoclar Vivadent, Schaan, Lichtenstein | 88.0–95.5% ZrO2, >4.5%–≤7.0% Y2O3, ≤5.0% HfO2, ≤1.0% Al2O3, ≤1.5%; Other oxides | X16329 |
| Zr-reinforced, Lithium Silicate | ZLS | CELTRA® Duo | Dentsply-Sirona, Bensheim, Germany | 10% ZrO2, 90% Lithium Disilicate | 16010732 |
| Hybrid-Ceramic | HC | Vita Enamic® | VITA, Zahnfabrik, Germany | 86% Ceramic, 14% Polymer | 98520 |
| Type of Material | Surface Conditioning | |||
|---|---|---|---|---|
| Finished/Polished (μm) | Glazed (μm) | |||
| Mean (Sd.,) | Median (IQR) | Mean (Sd.,) | Median (IQR) | |
| Tetric CAD | 0.1801 (0.029) | 0.1887 (0.026) | 0.0860 (0.054) | 0.0740 (0.085) |
| IPS e.max CAD | 0.1922 (0.024) | 0.1930 (0.037) | 0.1191 (0.031) | 0.1223 (0.063) |
| IPS e.max ZirCAD | 0.2910 (0.082) | 0.3090 (0.140) | 0.8493 (0.604) | 0.4897 (1.064) |
| Celtra Due | 0.1828 (0.024) | 0.1930 (0.041) | 0.0830 (0.083) | 0.0573 (0.020) |
| Vita Enamic | 0.4644 (0.137) | 0.4343 (0.202) | 0.0937 (0.050) | 0.0813 (0.062) |
| Type of Material | Mean Ranks (μm) | p-Value |
|---|---|---|
| Tetric CAD | 21.60 | <0.0001 |
| IPS e.max CAD | 27.47 | |
| IPS e.max ZirCAD | 50.33 * | |
| Celtra Due | 24.40 | |
| Vita Enamic | 66.20 ** |
| Type of Material | Mean Ranks (μm) | p-Value |
|---|---|---|
| Tetric CAD | 27.87 | <0.0001 |
| IPS e.max CAD | 41.63 * | |
| IPS e.max ZirCAD | 67.73 ** | |
| Celtra Due | 21.53 | |
| Vita Enamic | 31.23 |
| Type of Material | Type of Treatment | p-Value | |
|---|---|---|---|
| Finished/Polished (μm) | Glazed (μm) | ||
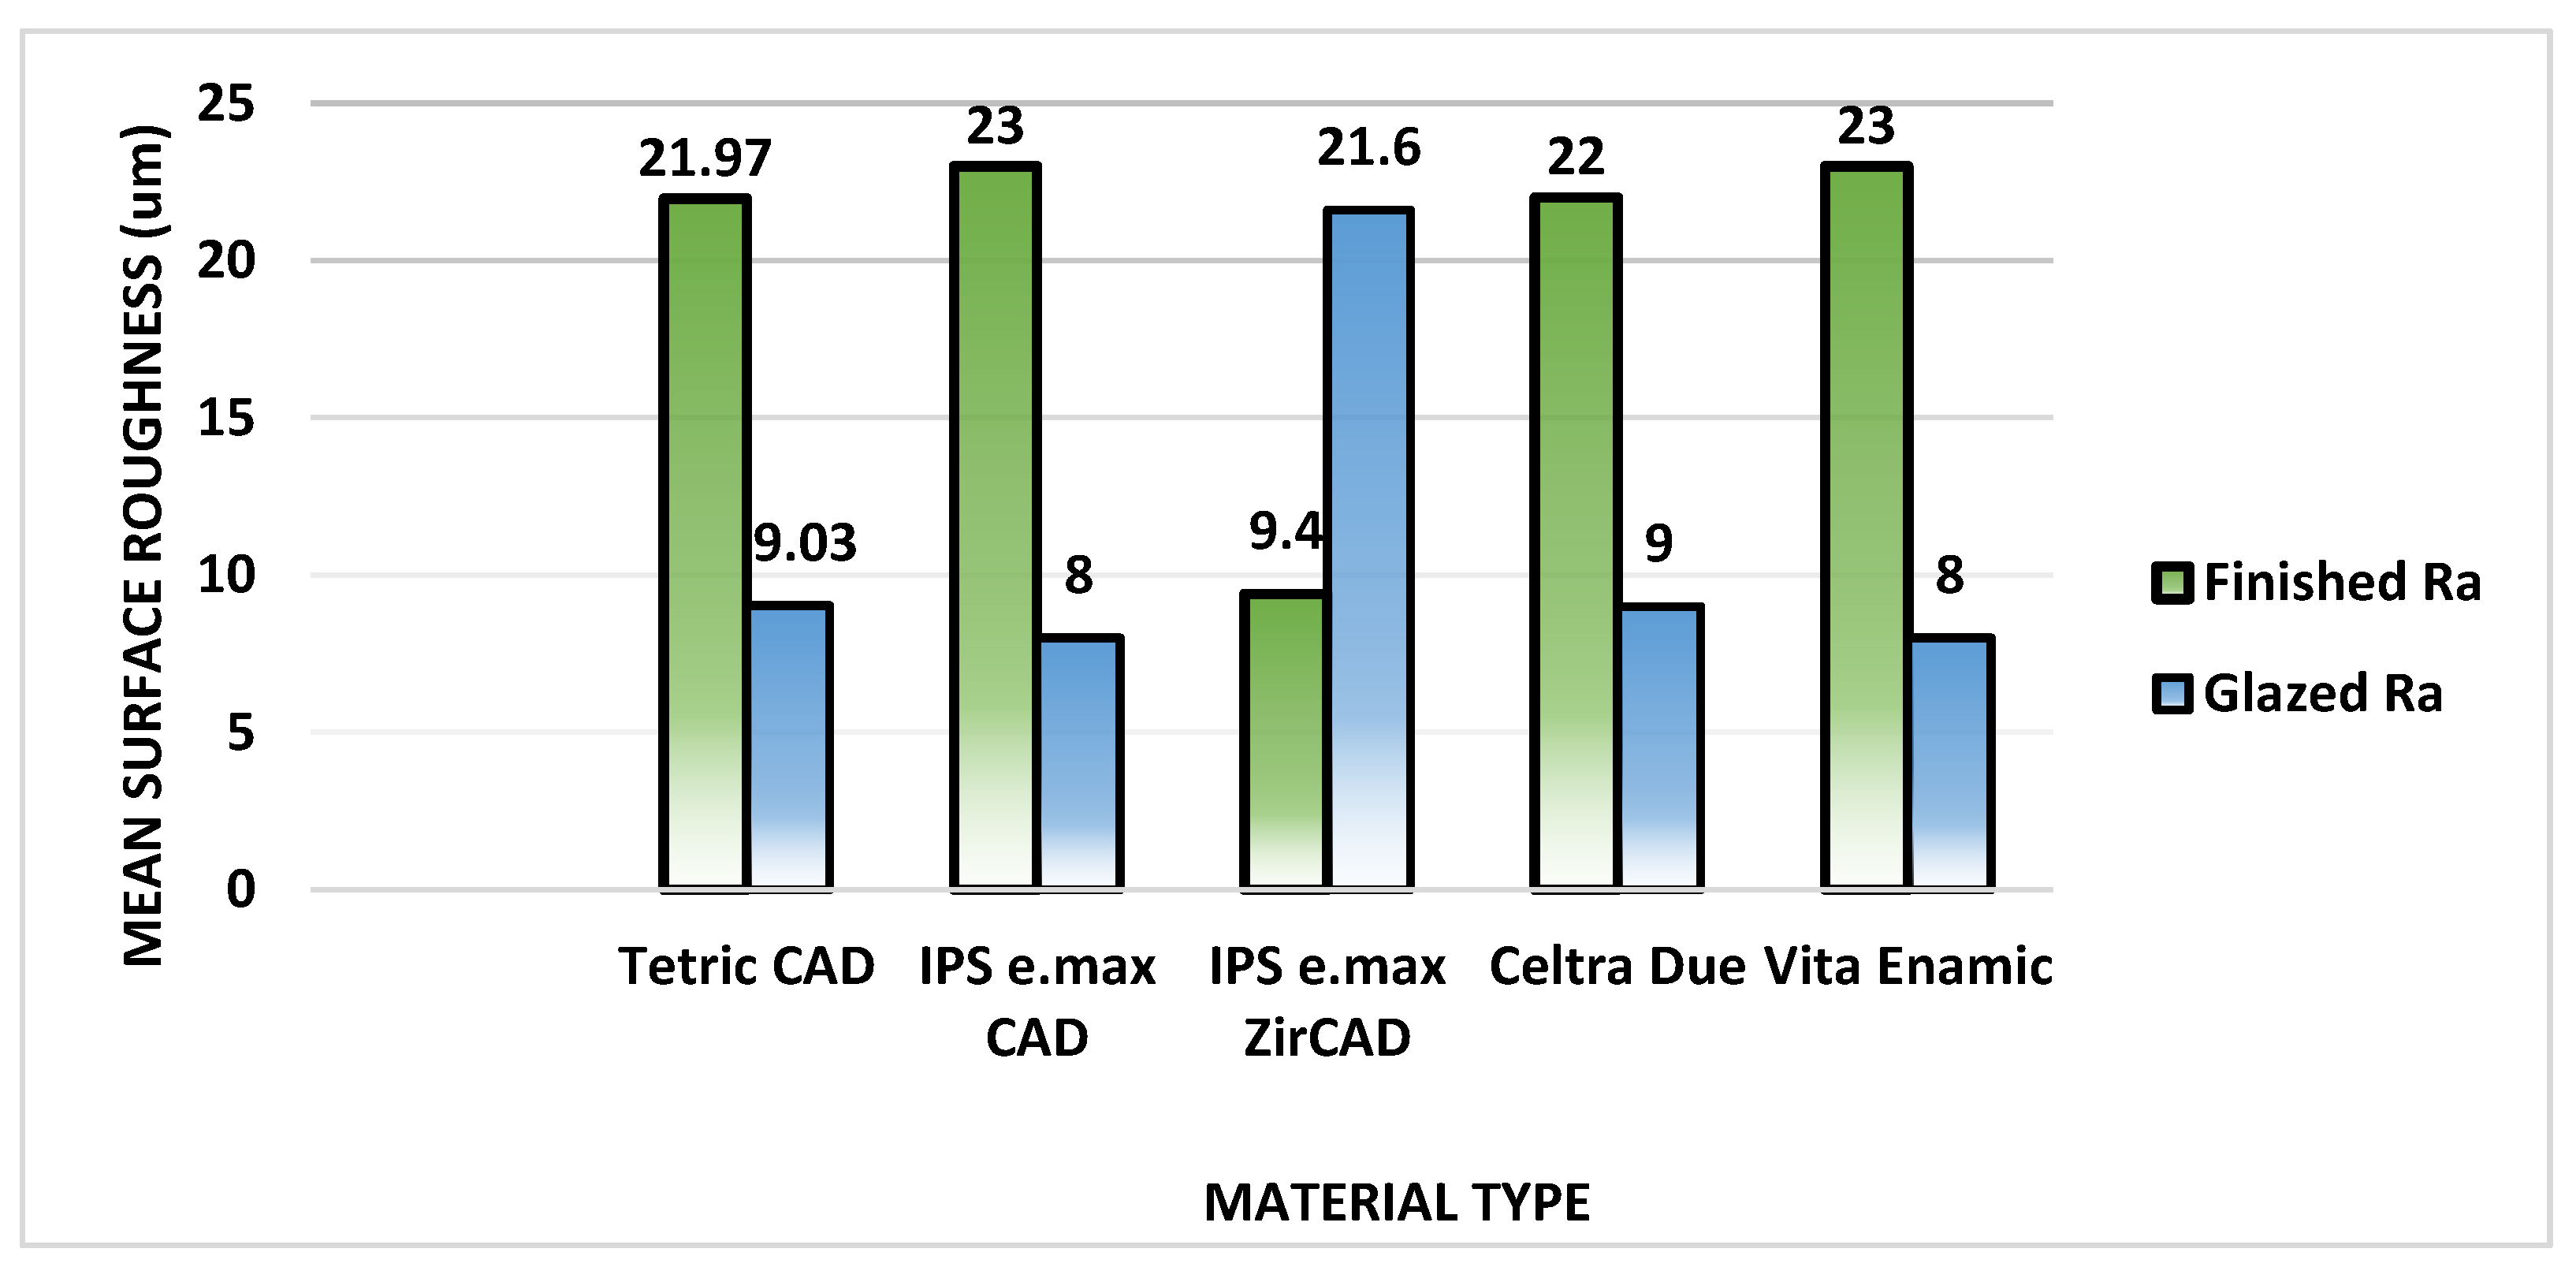
| Tetric CAD | 21.97 | 9.03 | <0.0001 |
| IPS e.max CAD | 23.00 | 8.00 | <0.0001 |
| IPS e.max ZirCAD | 9.40 | 21.60 | <0.0001 |
| Celtra Due | 22.00 | 9.00 | <0.0001 |
| Vita Enamic | 23.00 | 8.00 | <0.0001 |
Disclaimer/Publisher’s Note: The statements, opinions and data contained in all publications are solely those of the individual author(s) and contributor(s) and not of MDPI and/or the editor(s). MDPI and/or the editor(s) disclaim responsibility for any injury to people or property resulting from any ideas, methods, instructions or products referred to in the content. |
© 2024 by the authors. Licensee MDPI, Basel, Switzerland. This article is an open access article distributed under the terms and conditions of the Creative Commons Attribution (CC BY) license (https://creativecommons.org/licenses/by/4.0/).
Share and Cite
Albani, R.; Habib, S.R.; AlQahtani, A.; AlHelal, A.A.; Alrabiah, M.; Anwar, S. The Surface Roughness of Contemporary Indirect CAD/CAM Restorative Materials That Are Glazed and Chair-Side-Finished/Polished. Materials 2024, 17, 997. https://doi.org/10.3390/ma17050997
Albani R, Habib SR, AlQahtani A, AlHelal AA, Alrabiah M, Anwar S. The Surface Roughness of Contemporary Indirect CAD/CAM Restorative Materials That Are Glazed and Chair-Side-Finished/Polished. Materials. 2024; 17(5):997. https://doi.org/10.3390/ma17050997
Chicago/Turabian StyleAlbani, Ragad, Syed Rashid Habib, Abdulaziz AlQahtani, Abdulaziz A. AlHelal, Mohammed Alrabiah, and Saqib Anwar. 2024. "The Surface Roughness of Contemporary Indirect CAD/CAM Restorative Materials That Are Glazed and Chair-Side-Finished/Polished" Materials 17, no. 5: 997. https://doi.org/10.3390/ma17050997
APA StyleAlbani, R., Habib, S. R., AlQahtani, A., AlHelal, A. A., Alrabiah, M., & Anwar, S. (2024). The Surface Roughness of Contemporary Indirect CAD/CAM Restorative Materials That Are Glazed and Chair-Side-Finished/Polished. Materials, 17(5), 997. https://doi.org/10.3390/ma17050997