
A Study on the Nanostructural Evolution of Bi/C Anode Materials during Their First Charge/Discharge Processes


Abstract
1. Introduction
2. Experimental Section
2.1. Materials
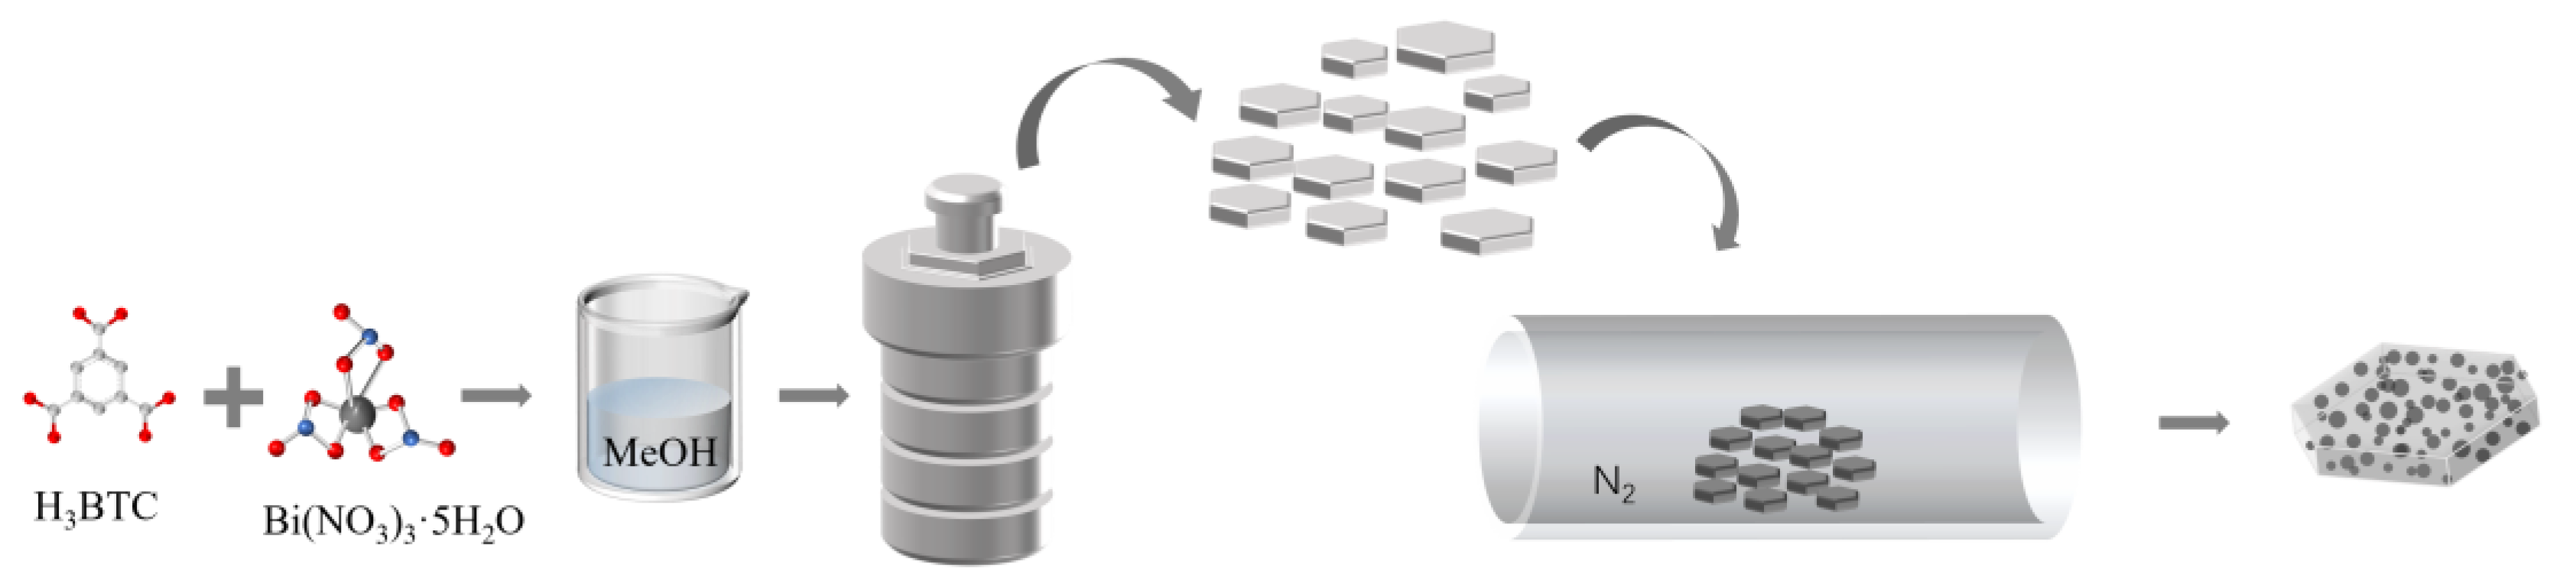
2.2. Preparation of Bi-Based MOFs
2.3. Preparation of Bi/C Composite
2.4. Material Characterization
2.5. Electrochemical Measurements
2.6. In Situ SAXS Experiment
3. Results and Discussion
4. Conclusions
Author Contributions
Funding
Institutional Review Board Statement
Informed Consent Statement
Data Availability Statement
Acknowledgments
Conflicts of Interest
Nomenclature
| SR | synchrotron radiation |
| SAXS | small angle X-ray scattering |
| SEI | solid electrolyte interface |
| GISAXS | grazing-incidence small-angle X-ray scattering |
| GIXD | grazing-incidence X-ray diffraction |
| TEM | transmission electron microscopy |
| SEM | scanning electron microscopy |
| XRD | X-ray diffraction patterns |
| XPS | X-ray photoelectron spectroscopy |
| TG | thermogravimetric analysis |
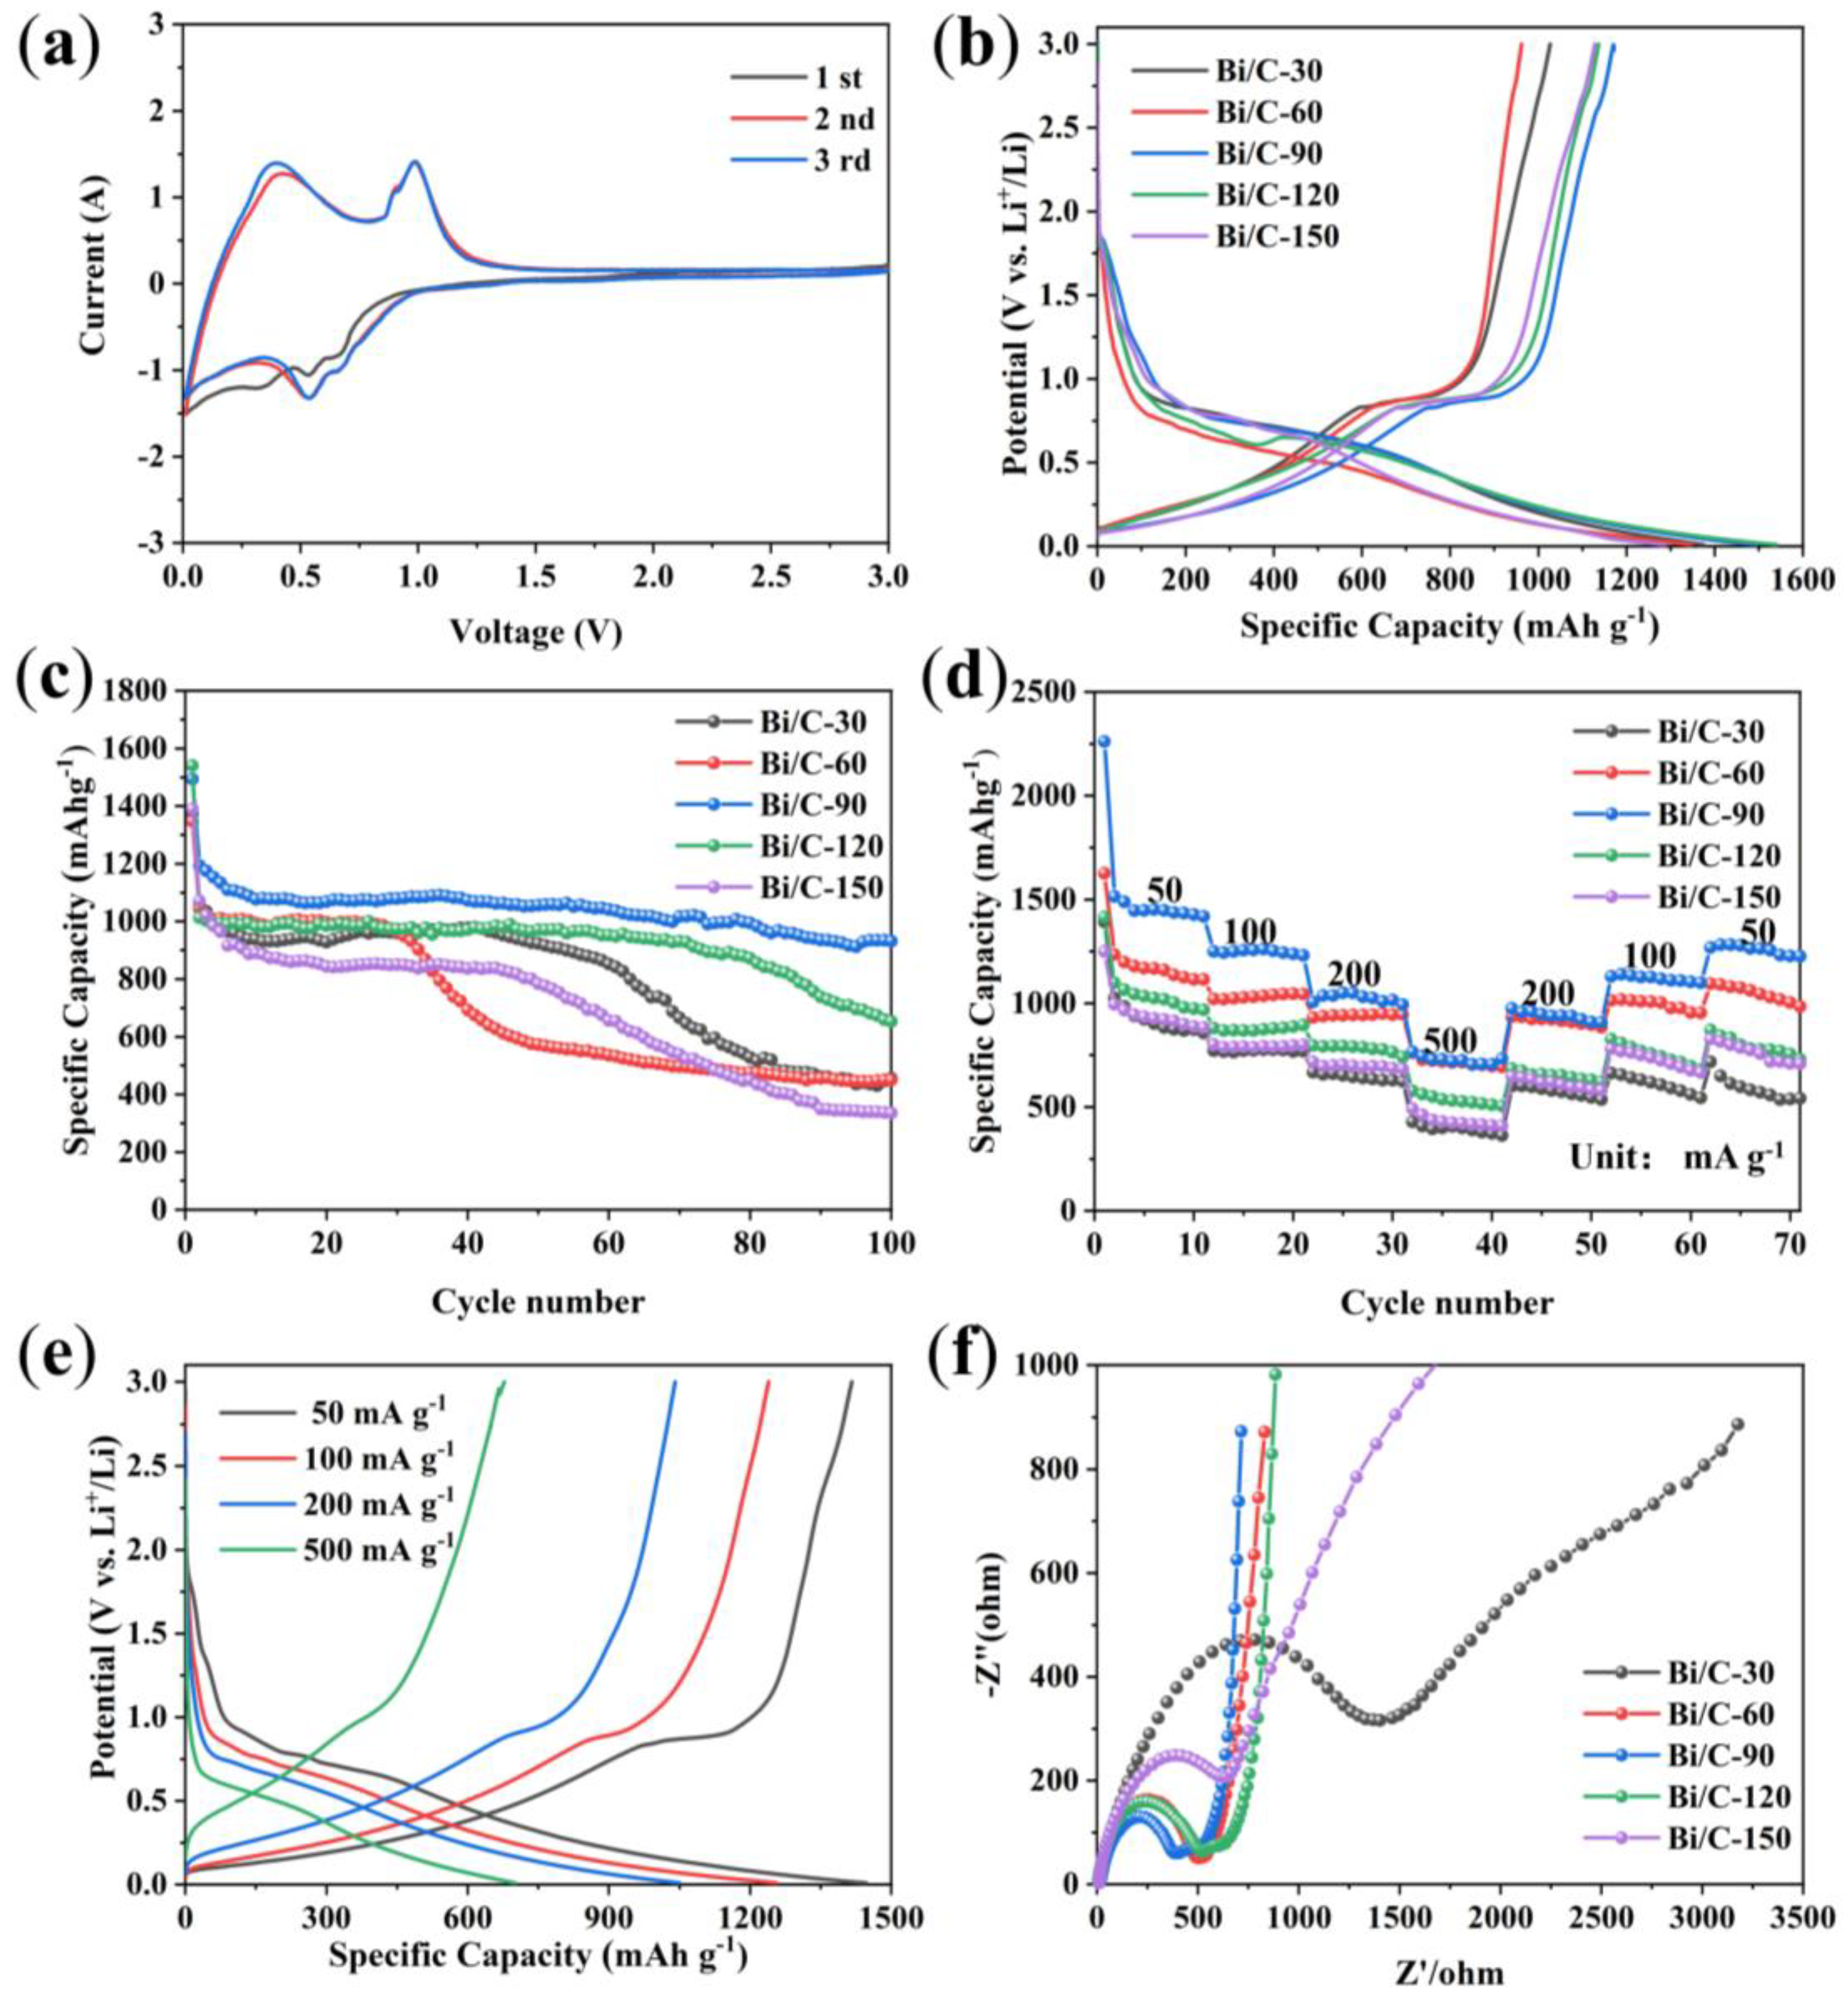
| CV | cyclic voltammetry |
| EIS | AC impedance spectrum |
| BET | Brunauer–Emmett–Teller |
| BJH | Barrett–Joyner–Halenda |
| Bi/C-30; Bi/C-60; Bi/C-90; Bi/C-120; Bi/C-150 | material calcined for 30 min, 60 min, 90 min, 120 min, and 150 min |
| TBT | Tangent-by-Tangent |
| Rg | radius of gyration |
| NVFs | normalized volume fractions |
References
- Chang, J.H.; Pin, M.W.; Kim, I.; Kim, S.; Kim, S.; Moon, S.; Cho, J.; Choi, S.; Heo, B.; Chandio, Z.A.; et al. Binder migration: Frequently observed yet overlooked phenomena in electrode processing for lithium-ion batteries. J. Energy Storage 2024, 83, 110729. [Google Scholar] [CrossRef]
- Divakaran, A.M.; Minakshi, M.; Bahri, P.A.; Paul, S.; Kumari, P.; Divakaran, A.M.; Manjunatha, K.N. Rational design on materials for developing next generation Lithium-ion secondary battery. Prog. Solid. State Chem. 2021, 62, 100298. [Google Scholar] [CrossRef]
- Kim, Y.; Kim, H.; Manthiram, A. A kinetic study on cobalt-free high-nickel layered oxide cathode materials for practical lithium-ion batteries. J. Power Sources 2023, 558, 232633. [Google Scholar] [CrossRef]
- Chavan, S.; Venkateswarlu, B.; Prabakaran, R.; Salman, M.; Joo, S.W.; Choi, G.S.; Kim, S.C. Thermal runaway and mitigation strategies for electric vehicle lithium-ion batteries using battery cooling approach: A review of the current status and challenges. J. Energy Storage 2023, 72, 108569. [Google Scholar] [CrossRef]
- Na, S.; Park, C.; An, H.; Park, K. Reliable test by accelerating for gas evolution in cathode materials of lithium-ion batteries. Sustain. Mater. Technol. 2024, 39, e00852. [Google Scholar] [CrossRef]
- Li, P.; Kim, H.; Myung, S.T.; Sun, Y.K. Diverting exploration of silicon anode into practical way: A review focused on silicon-graphite composite for lithium ion batteries. Energy Storage Mater. 2021, 35, 550–576. [Google Scholar] [CrossRef]
- Safie, N.E.; Azam, M.A.; Chiew, C.K.; Aziz, M.F.A.; Sairi, M.N.F.M.; Takasaki, A. Structural characterizations and electrochemical performances of rGO-based anode materials for lithium-ion battery. J. Mater. Sci: Mater. Electron. 2023, 34, 2028. [Google Scholar] [CrossRef]
- Xu, C.M.; Sun, H.R.; Li, H.J.; Han, X.L.; Wang, X.J.; He, Y.; Liu, M.Z. Preparation of Bi/Bi2O3 composite carbon nanofibers and their lithium storage properties. J. South. Chin. Norm. Univ. Nat. Sci. Ed. 2022, 54, 34–42. [Google Scholar]
- Sadan, M.K.; Song, E.; Yu, H.; Yun, J.; Kim, T.; Ahn, J.; Cho, K.; Ahn, H. Extended cycling performance of micron-sized bismuth anodes for lithium-ion batteries: Self-healing of an alloy-type anode for lithium batteries. J. Mater. Chem. A 2023, 11, 15466–15474. [Google Scholar] [CrossRef]
- Oli, N.; Lago, W.O.; Tripathi, B.; Bhattarai, M.; Weiner, B.R.; Morell, G.; Katiyar, R.S. Enhanced electrochemical performance of Bi2O3 via facile synthesis as anode material for ultra-long cycle lifespan lithium-ion batteries. Electrochem. Commun 2024, 159, 107656. [Google Scholar] [CrossRef]
- Sarofil, A.D.M.; Devina, W.; Park, H.S.; Ko, T.; Kim, J. Silicon oxycarbide-encapsuled bismuth for superior lithium storage. J. Alloys Compd. 2023, 466, 142965. [Google Scholar] [CrossRef]
- Liu, X.H.; Xie, J.; Tang, Y.K.; Guo, J.; Lu, Z.J.; Liu, B.L.; Zhang, H.Y.; Cao, Y.L. Bi@C sandwiched carbon nanolayers enables remarkable cyclability at high current density for lithium-ion batteries. Appl. Surf. Sci. 2023, 613, 155996. [Google Scholar] [CrossRef]
- Sarofil, A.D.M.; Devina, W.; Albertina, I.; Chandra, C.; Kim, J. Toad egg-like bismuth nanoparticles encapsulated in an N-doped carbon microrod via supercritical acetone as anodes in lithium-ion batteries. J. Ind. Eng. Chem. 2022, 106, 128–141. [Google Scholar] [CrossRef]
- Xu, X.J.; Zhang, D.C.; Wang, Z.S.; Zuo, S.Y.; Shen, J.D.; Liu, Z.B.; Liu, J. Facile Synthesis of Yolk–Shell Bi@C Nanospheres with Superior Li-ion Storage Performances. Acta Metall. Sin. 2021, 34, 347–353. [Google Scholar] [CrossRef]
- Shi, C.H.; Fu, H.; Nie, J.J.; Yao, S.W. Bi@C fibre synthesized by electrostatic spinning as high-performance anode material for Li-ion batteries. Ionics 2022, 28, 4977–4987. [Google Scholar] [CrossRef]
- Yin, H.; Li, Q.W.; Cao, M.L.; Zhang, W.; Zhao, H.; Li, C.; Huo, K.F.; Zhu, M.Q. Nanosized-bismuth-embedded 1D carbon nanofibers as high-performance anodes for lithium-ion and sodium-ion batteries. Nano Res. 2017, 10, 2156–2167. [Google Scholar] [CrossRef]
- Kim, M.; Kim, M.; Park, J.H.; Kim, J.; Ahn, C.; Jin, A.; Mun, J.; Sung, Y. Bi-MOF derived micro/meso-porous Bi@C nanoplates for high performance lithium-ion batteries. Nanoscale 2020, 12, 15214–15221. [Google Scholar] [CrossRef]
- Xu, X.J.; Wang, Z.S.; Zhang, D.C.; Zuo, S.Y.; Liu, J.; Zhu, M. Scalable One-Pot Synthesis of Hierarchical Bi@C Bulk with Superior Lithium-Ion Storage Performances. ACS Appl. Mater. Interfaces 2020, 12, 51478–51487. [Google Scholar] [CrossRef]
- Yuan, H.C.; Jin, Y.Q.; Chen, X.N.; Lan, J.L.; Yu, Y.H.; Yang, X.P. Large-Scale Fabrication of Egg-Carton-Inspired Bi/C Composite toward High Volumetric Capacity and Long-Life Lithium Ion Batteries. ACS Sustain. Chem. Eng. 2019, 7, 6033–6042. [Google Scholar] [CrossRef]
- Zhou, J.K.; Gao, J.P.; Xu, X.Y.; Hong, W.; Song, Y.H.; Xue, R.N.; Zhao, H.L.; Liu, Y.; Qiu, H.X. Synthesis of porous Bi@Cs networks by a one-step hydrothermal method and their superior catalytic activity for the reduction of 4-nitrophenol. J. Alloys Compd. 2017, 709, 206–212. [Google Scholar] [CrossRef]
- Hong, W.W.; Wang, A.N.; Li, L.; Qiu, T.Y.; Li, J.Y.; Jiang, Y.L.; Zou, G.Q.; Peng, H.J.; Hou, H.S.; Ji, X.B. Bi Dots Confined by Functional Carbon as High-Performance Anode for Lithium Ion Batteries. Adv. Funct. Mater. 2021, 31, 2000756. [Google Scholar] [CrossRef]
- Li, C.; Sarapulova, A.; Zhao, Z.; Fu, Q.; Trouillet, V.; Missiul, A.; Welter, E.; Dsoke, S. Understanding the Lithium Storage Mechanism in Core–Shell Fe2O3@C Hollow Nanospheres Derived from Metal–Organic Frameworks: An In operando Synchrotron Radiation Diffraction and in operando X-ray Absorption Spectroscopy Study. Chem. Mater. 2019, 31, 5633–5645. [Google Scholar] [CrossRef]
- Evmenenko, G.; Fister, T.; Castro, F.; Chen, X.Q.; Lee, B.; Buchholz, D.; Dravid, V.; Fenter, P.; Bedzyk, M. Structural analysis of the initial lithiation of NiO thin film electrodes. Phys. Chem. Chem. Phys. 2019, 21, 8897–8905. [Google Scholar] [CrossRef] [PubMed]
- Bhaway, S.; Qiang, Z.; Xia, Y.F.; Xia, X.H.; Lee, B.; Yager, K.; Zhang, L.H.; Kisslinger, K.; Chen, Y.M.; Liu, K.; et al. Operando Grazing Incidence Small-Angle X-ray Scattering/X-ray Diffraction of Model Ordered Mesoporous Lithium-Ion Battery Anodes. ACS Nano 2017, 11, 1443–1454. [Google Scholar] [CrossRef] [PubMed]
- Wang, X.X.; Liu, X.X.; Liu, Y.F.; Jia, H.G.; Gu, X.H.; Li, S.H.; Zhang, X.H.; Xing, X.Q.; Wu, Z.H.; Wu, Z.J.; et al. The study on nanostructural evolution of SnO2-carbon aerogel nanocomposite during the first discharge process. J. Phys. Chem. Solids 2021, 154, 110052. [Google Scholar] [CrossRef]
- Cheng, W.D.; He, H.L.; Liu, X.X.; Liu, Y.F.; Zhang, Z.F.; Li, S.H.; Zhang, R.; Wang, X.X.; Wu, Z.H.; Wu, Z.J. The study on nanostructural evolution of CuO/Graphene oxide nanocomposite during the first discharge processes. Mater. Chem. Phys. 2021, 260, 124157. [Google Scholar] [CrossRef]
- Berhaut, C.L.; Dominguez, D.Z.; Tomasi, D.; Vincens, C.; Haon, C.; Reynier, Y.; Porcher, W.; Boudet, N.; Blanc, N.; Chahine, G.A.; et al. Prelithiation of silicon/graphite composite anodes: Benefits and mechanisms for long-lasting Li-Ion batteries. Energy Stor. Mater. 2020, 29, 190–197. [Google Scholar] [CrossRef]
- Zou, X.X.; Mei, Z.Y.; Jiang, J.W.; Guo, H. MOFs-derived Bi2O3@C with rich oxygen vacancies through rapid thermal annealing technology for photodegradation of tetracycline hydrochloride. Appl. Surf. Sci. 2022, 586, 152813. [Google Scholar] [CrossRef]
- Mcnulty, D.; Geaney, H.; Armstrong, E.; O’Dwyer, C. High Performance Inverse Opal Li-ion Battery with Paired Intercalation and Conversion Mode Electrodes. J. Mater. Chem. A 2016, 4, 4448. [Google Scholar] [CrossRef]
- Divya, J.; Shivaramu, N.J.; Purcell, W.; Roos, W.D.; Swart, H.C. Multifunction applications of Bi2O3:Eu3+ nanophosphor for red light emission and photocatalytic activity. Appl. Surf. Sci. 2019, 497, 143748. [Google Scholar] [CrossRef]
- Urbonaite, S.; Hälldahl, L.; Svensson, G. Raman spectroscopy studies of carbide derived carbons. Carbon 2008, 46, 1942–1947. [Google Scholar] [CrossRef]
- Wang, X.M.; Tatsuo, N.; Isamu, U. Lithium alloy formation at bismuth thin layer electrode and its kinetics in propylene carbonate electrolyte. J. Power Sources 2002, 104, 90–96. [Google Scholar]
- Crosnier, O.; Brousse, T.; Devaux, X.; Fragnaud, P.; Schleich, D.M. New anode systems for lithium ion cells. J. Power Sources 2002, 94, 169–174. [Google Scholar] [CrossRef]
- Ruud, A.; Sottmann, J.; Vajeestona, P.; Fjellvåg, H. Direct observation of reversible conversion and alloying reactions in a Bi2(MoO4)3-based lithium-ion battery anode. J. Mater. Chem. A 2019, 7, 17906–17913. [Google Scholar] [CrossRef]


Disclaimer/Publisher’s Note: The statements, opinions and data contained in all publications are solely those of the individual author(s) and contributor(s) and not of MDPI and/or the editor(s). MDPI and/or the editor(s) disclaim responsibility for any injury to people or property resulting from any ideas, methods, instructions or products referred to in the content. |
© 2024 by the authors. Licensee MDPI, Basel, Switzerland. This article is an open access article distributed under the terms and conditions of the Creative Commons Attribution (CC BY) license (https://creativecommons.org/licenses/by/4.0/).
Share and Cite
Zhao, M.; Cheng, W.; Wang, X.; Liu, H.; Chen, X.; Wang, C.; You, Y.; Wu, Z.; Wang, B.; Wu, Z.; et al. A Study on the Nanostructural Evolution of Bi/C Anode Materials during Their First Charge/Discharge Processes. Materials 2024, 17, 1140. https://doi.org/10.3390/ma17051140
Zhao M, Cheng W, Wang X, Liu H, Chen X, Wang C, You Y, Wu Z, Wang B, Wu Z, et al. A Study on the Nanostructural Evolution of Bi/C Anode Materials during Their First Charge/Discharge Processes. Materials. 2024; 17(5):1140. https://doi.org/10.3390/ma17051140
Chicago/Turabian StyleZhao, Mengyuan, Weidong Cheng, Xin Wang, Huanyan Liu, Xiang Chen, Chaohui Wang, Yuan You, Zhaojun Wu, Bing Wang, Zhonghua Wu, and et al. 2024. "A Study on the Nanostructural Evolution of Bi/C Anode Materials during Their First Charge/Discharge Processes" Materials 17, no. 5: 1140. https://doi.org/10.3390/ma17051140
APA StyleZhao, M., Cheng, W., Wang, X., Liu, H., Chen, X., Wang, C., You, Y., Wu, Z., Wang, B., Wu, Z., & Xing, X. (2024). A Study on the Nanostructural Evolution of Bi/C Anode Materials during Their First Charge/Discharge Processes. Materials, 17(5), 1140. https://doi.org/10.3390/ma17051140