
Effects of Laser Defocusing on Bead Geometry in Coaxial Titanium Wire-Based Laser Metal Deposition


Abstract

1. Introduction
2. Materials and Methods
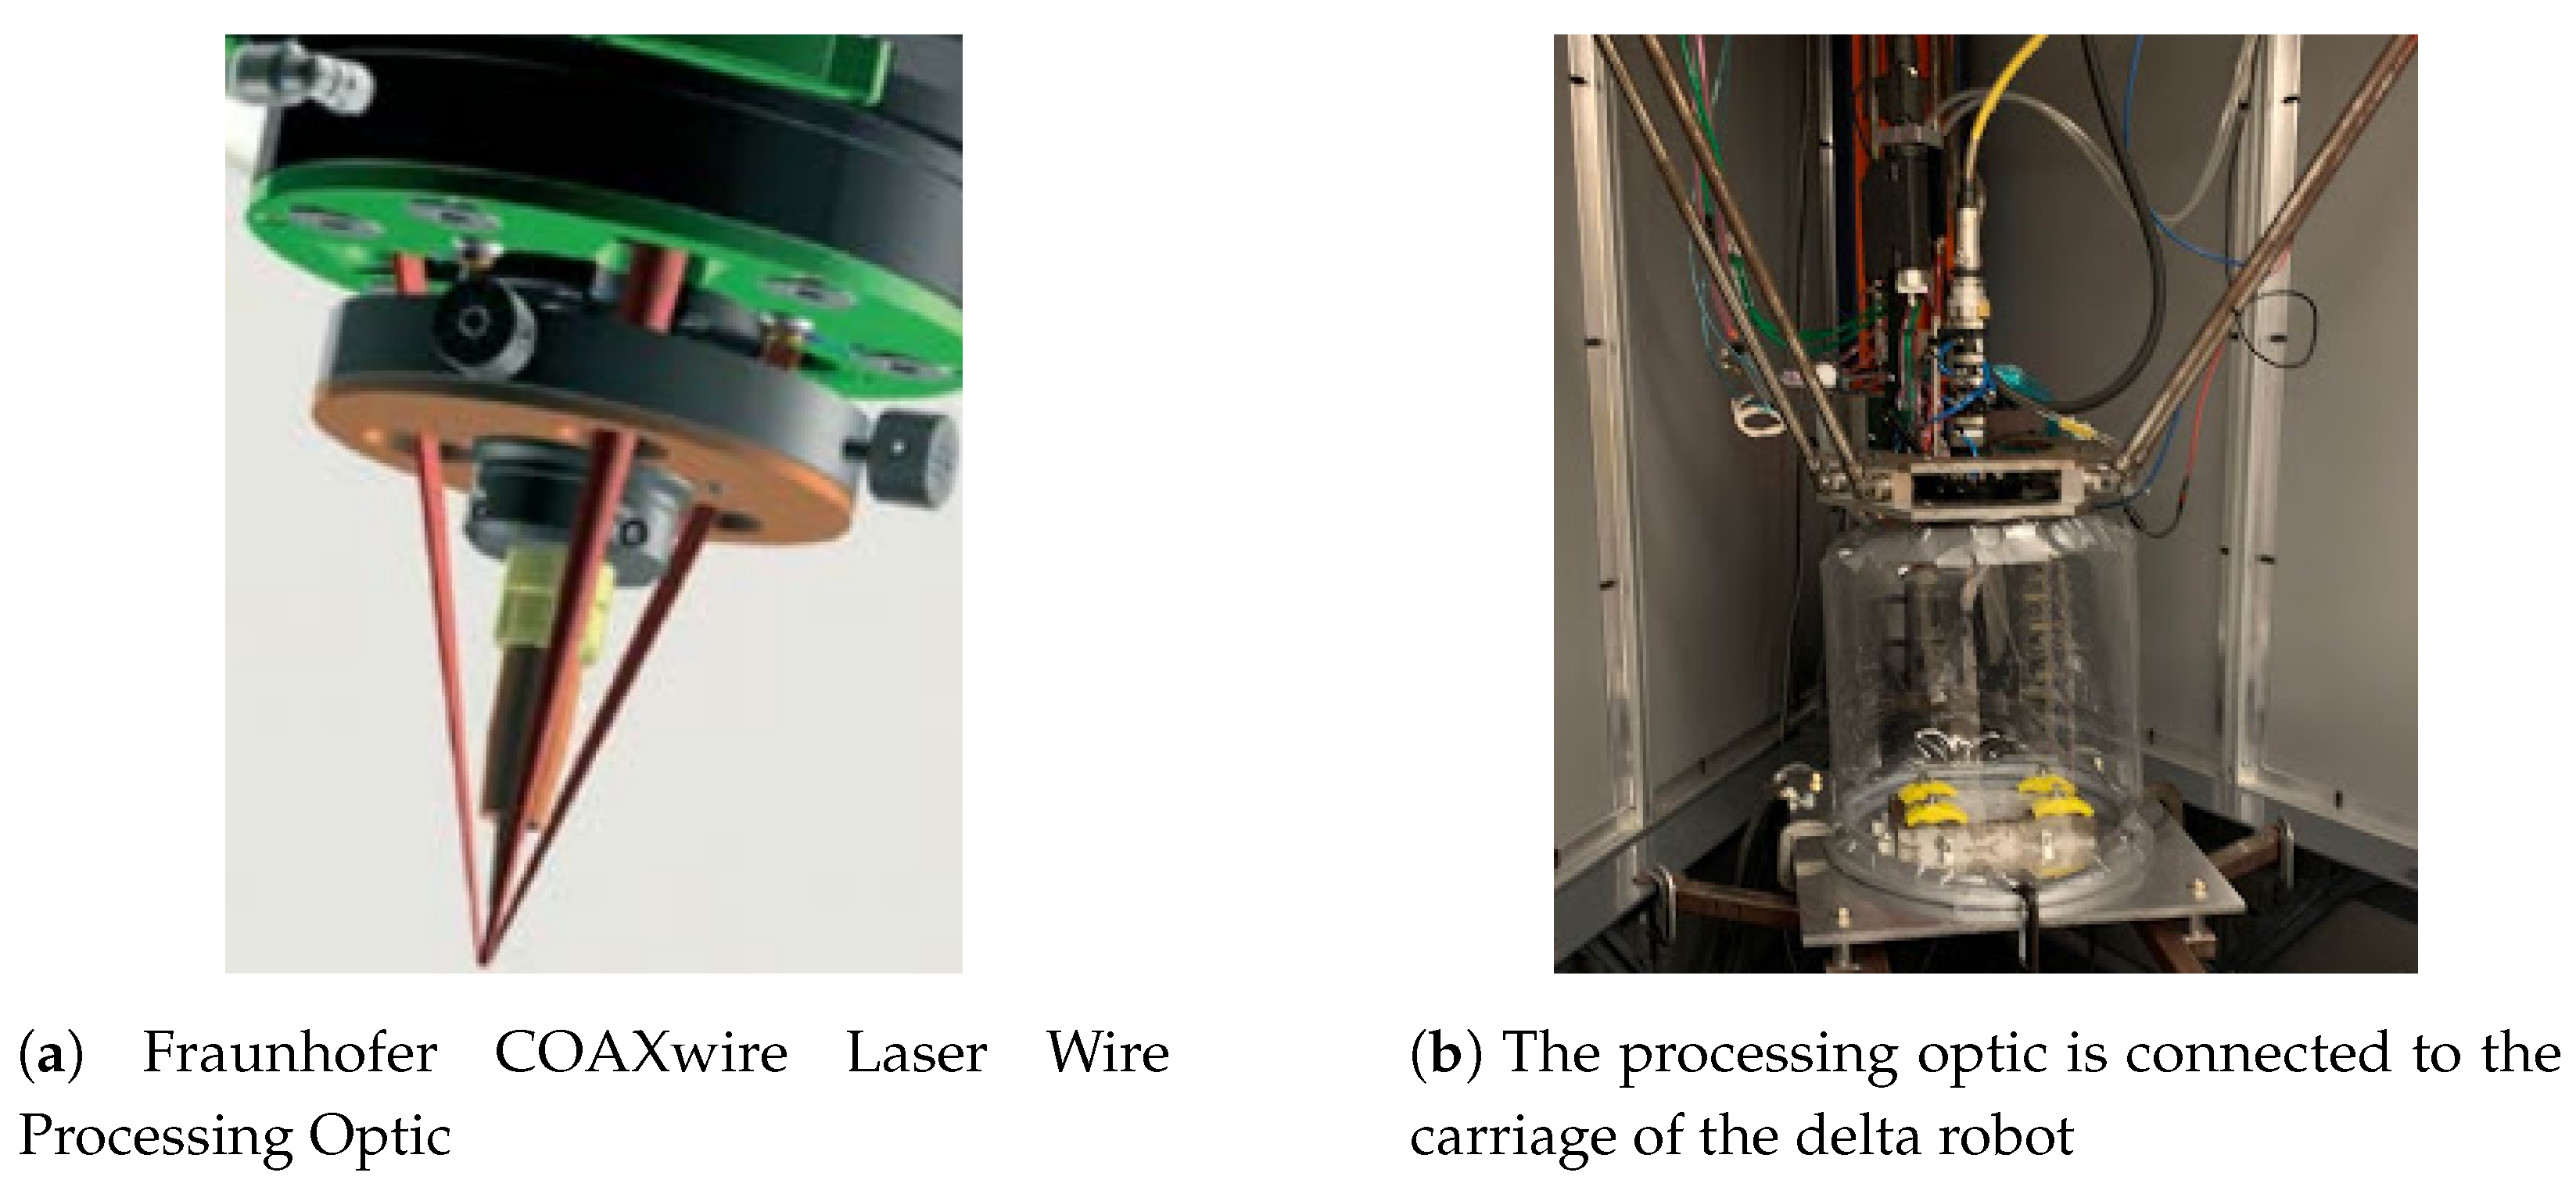
2.1. Experimental Setup
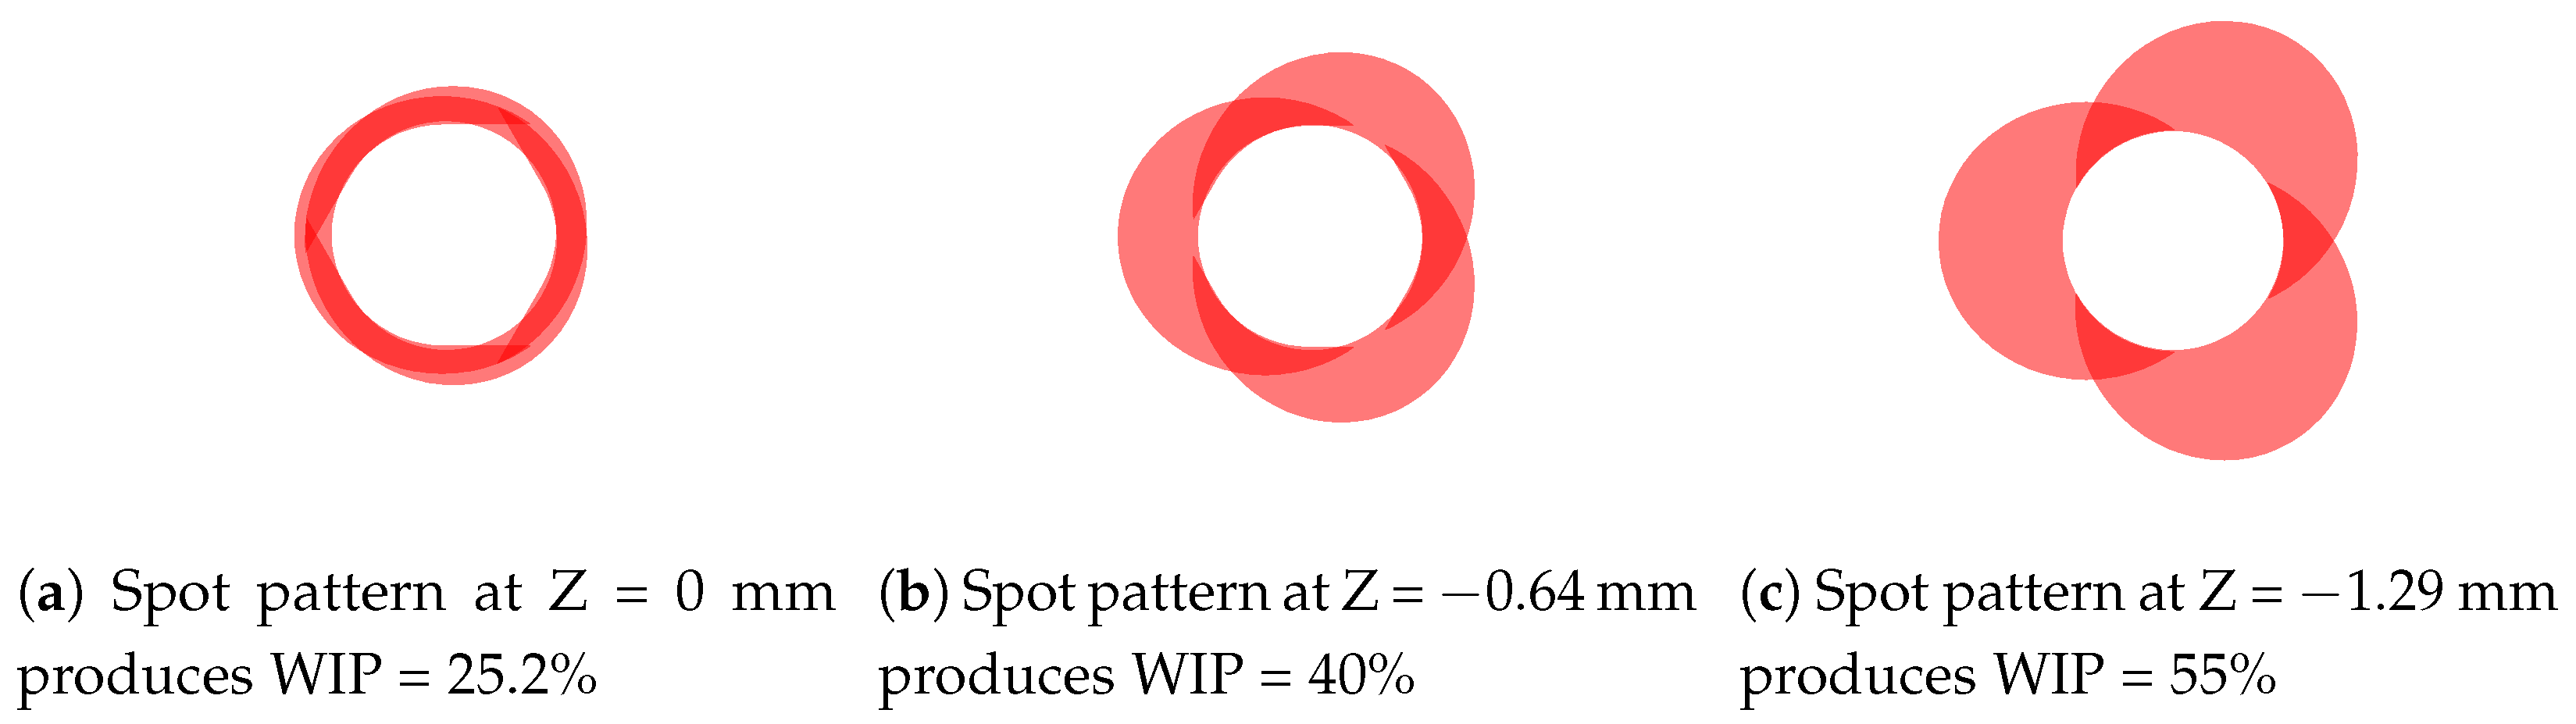
2.2. Experimental Design
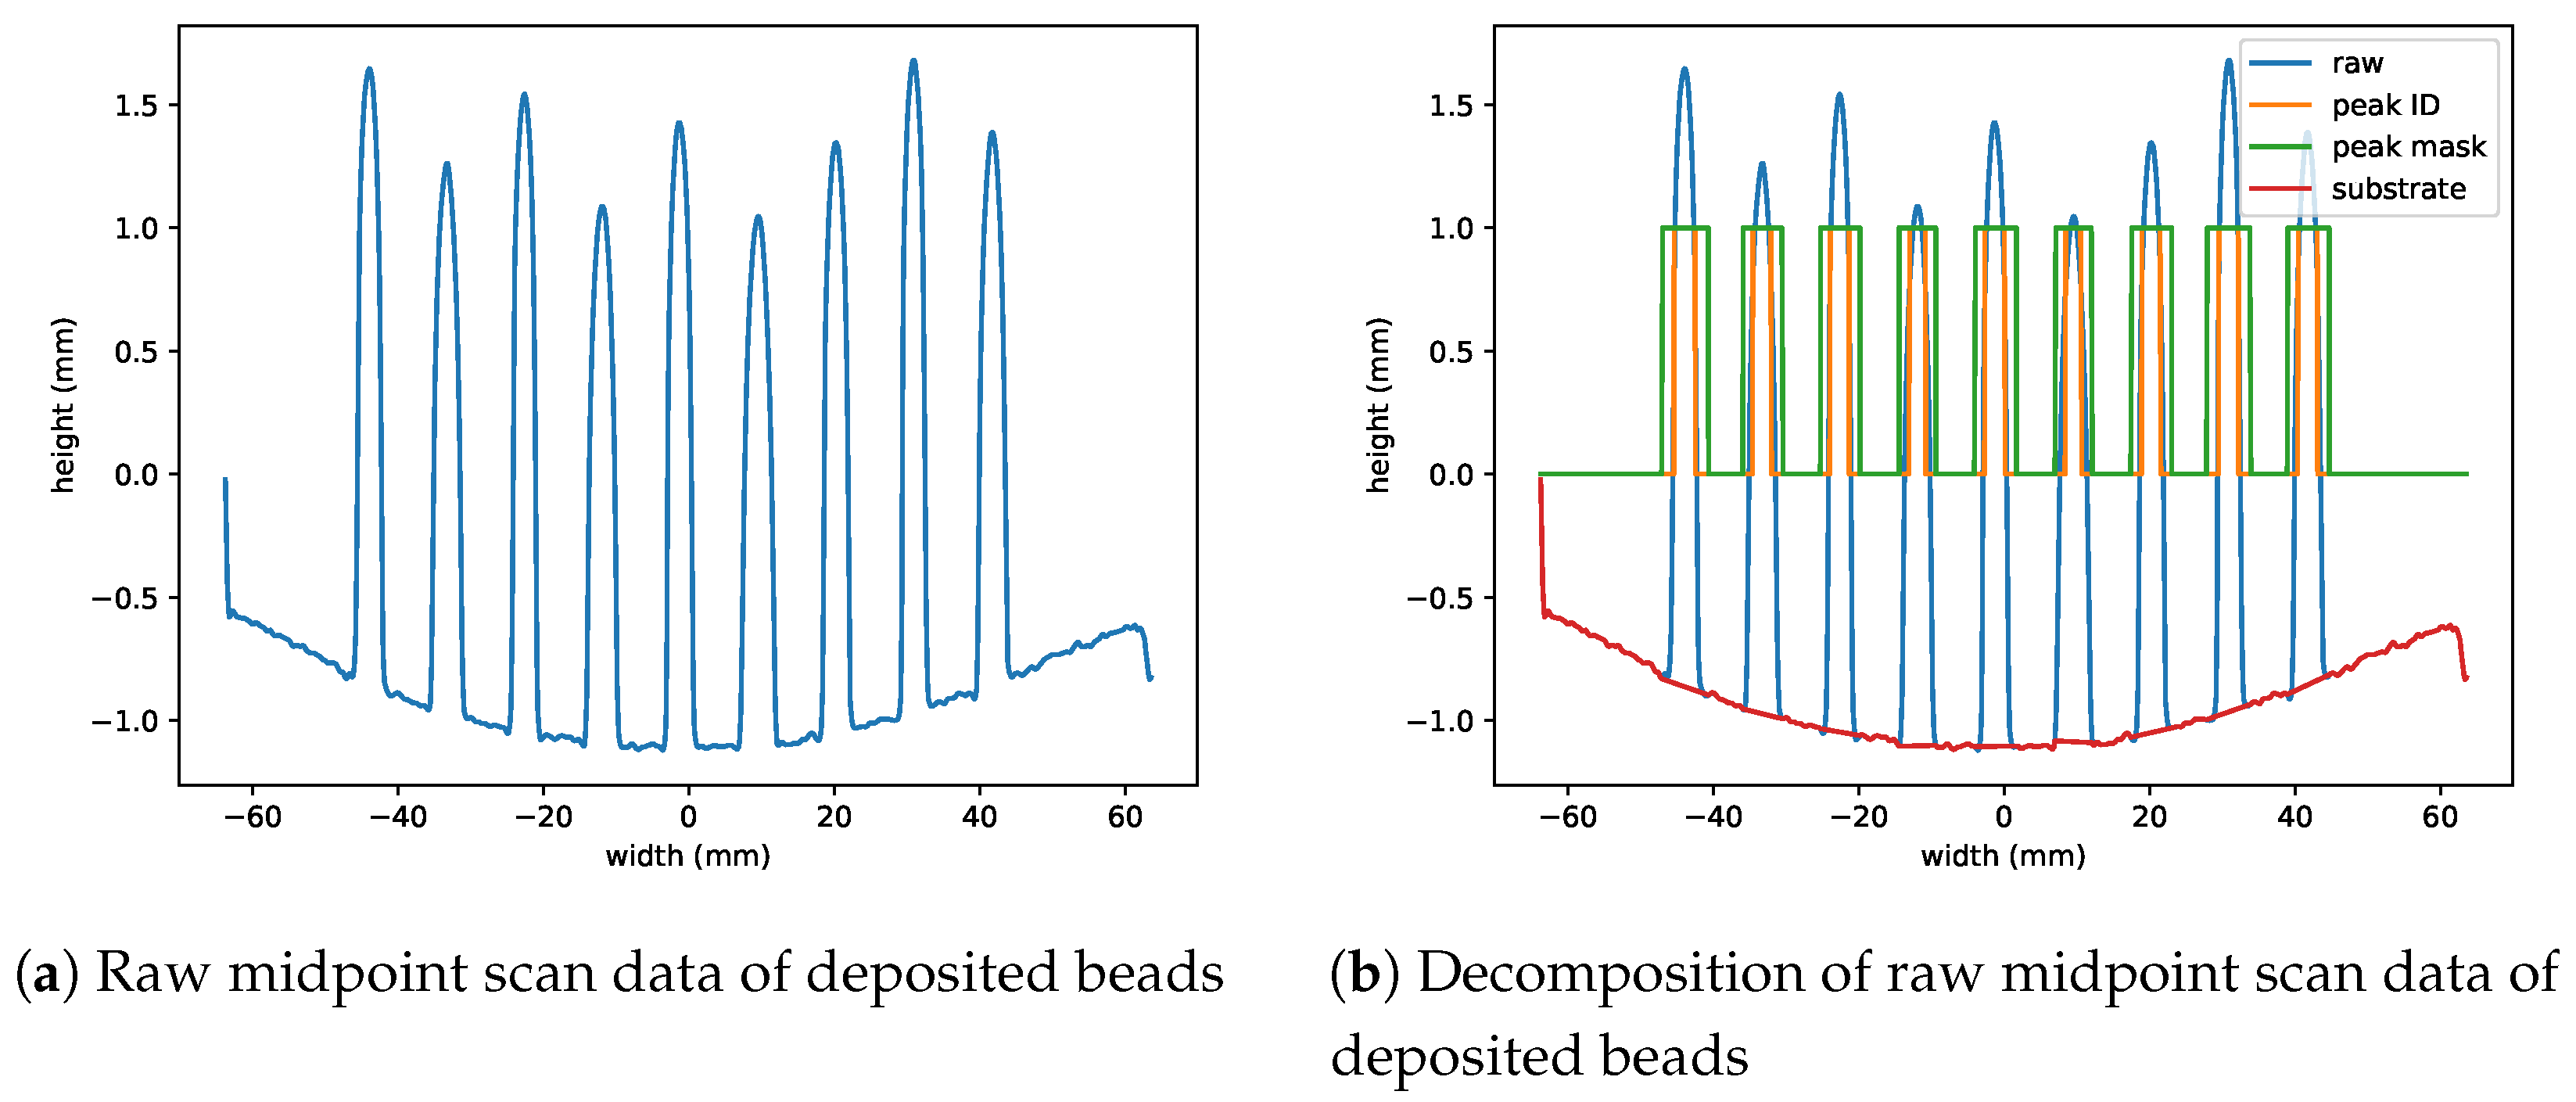
2.3. Experimental Procedure
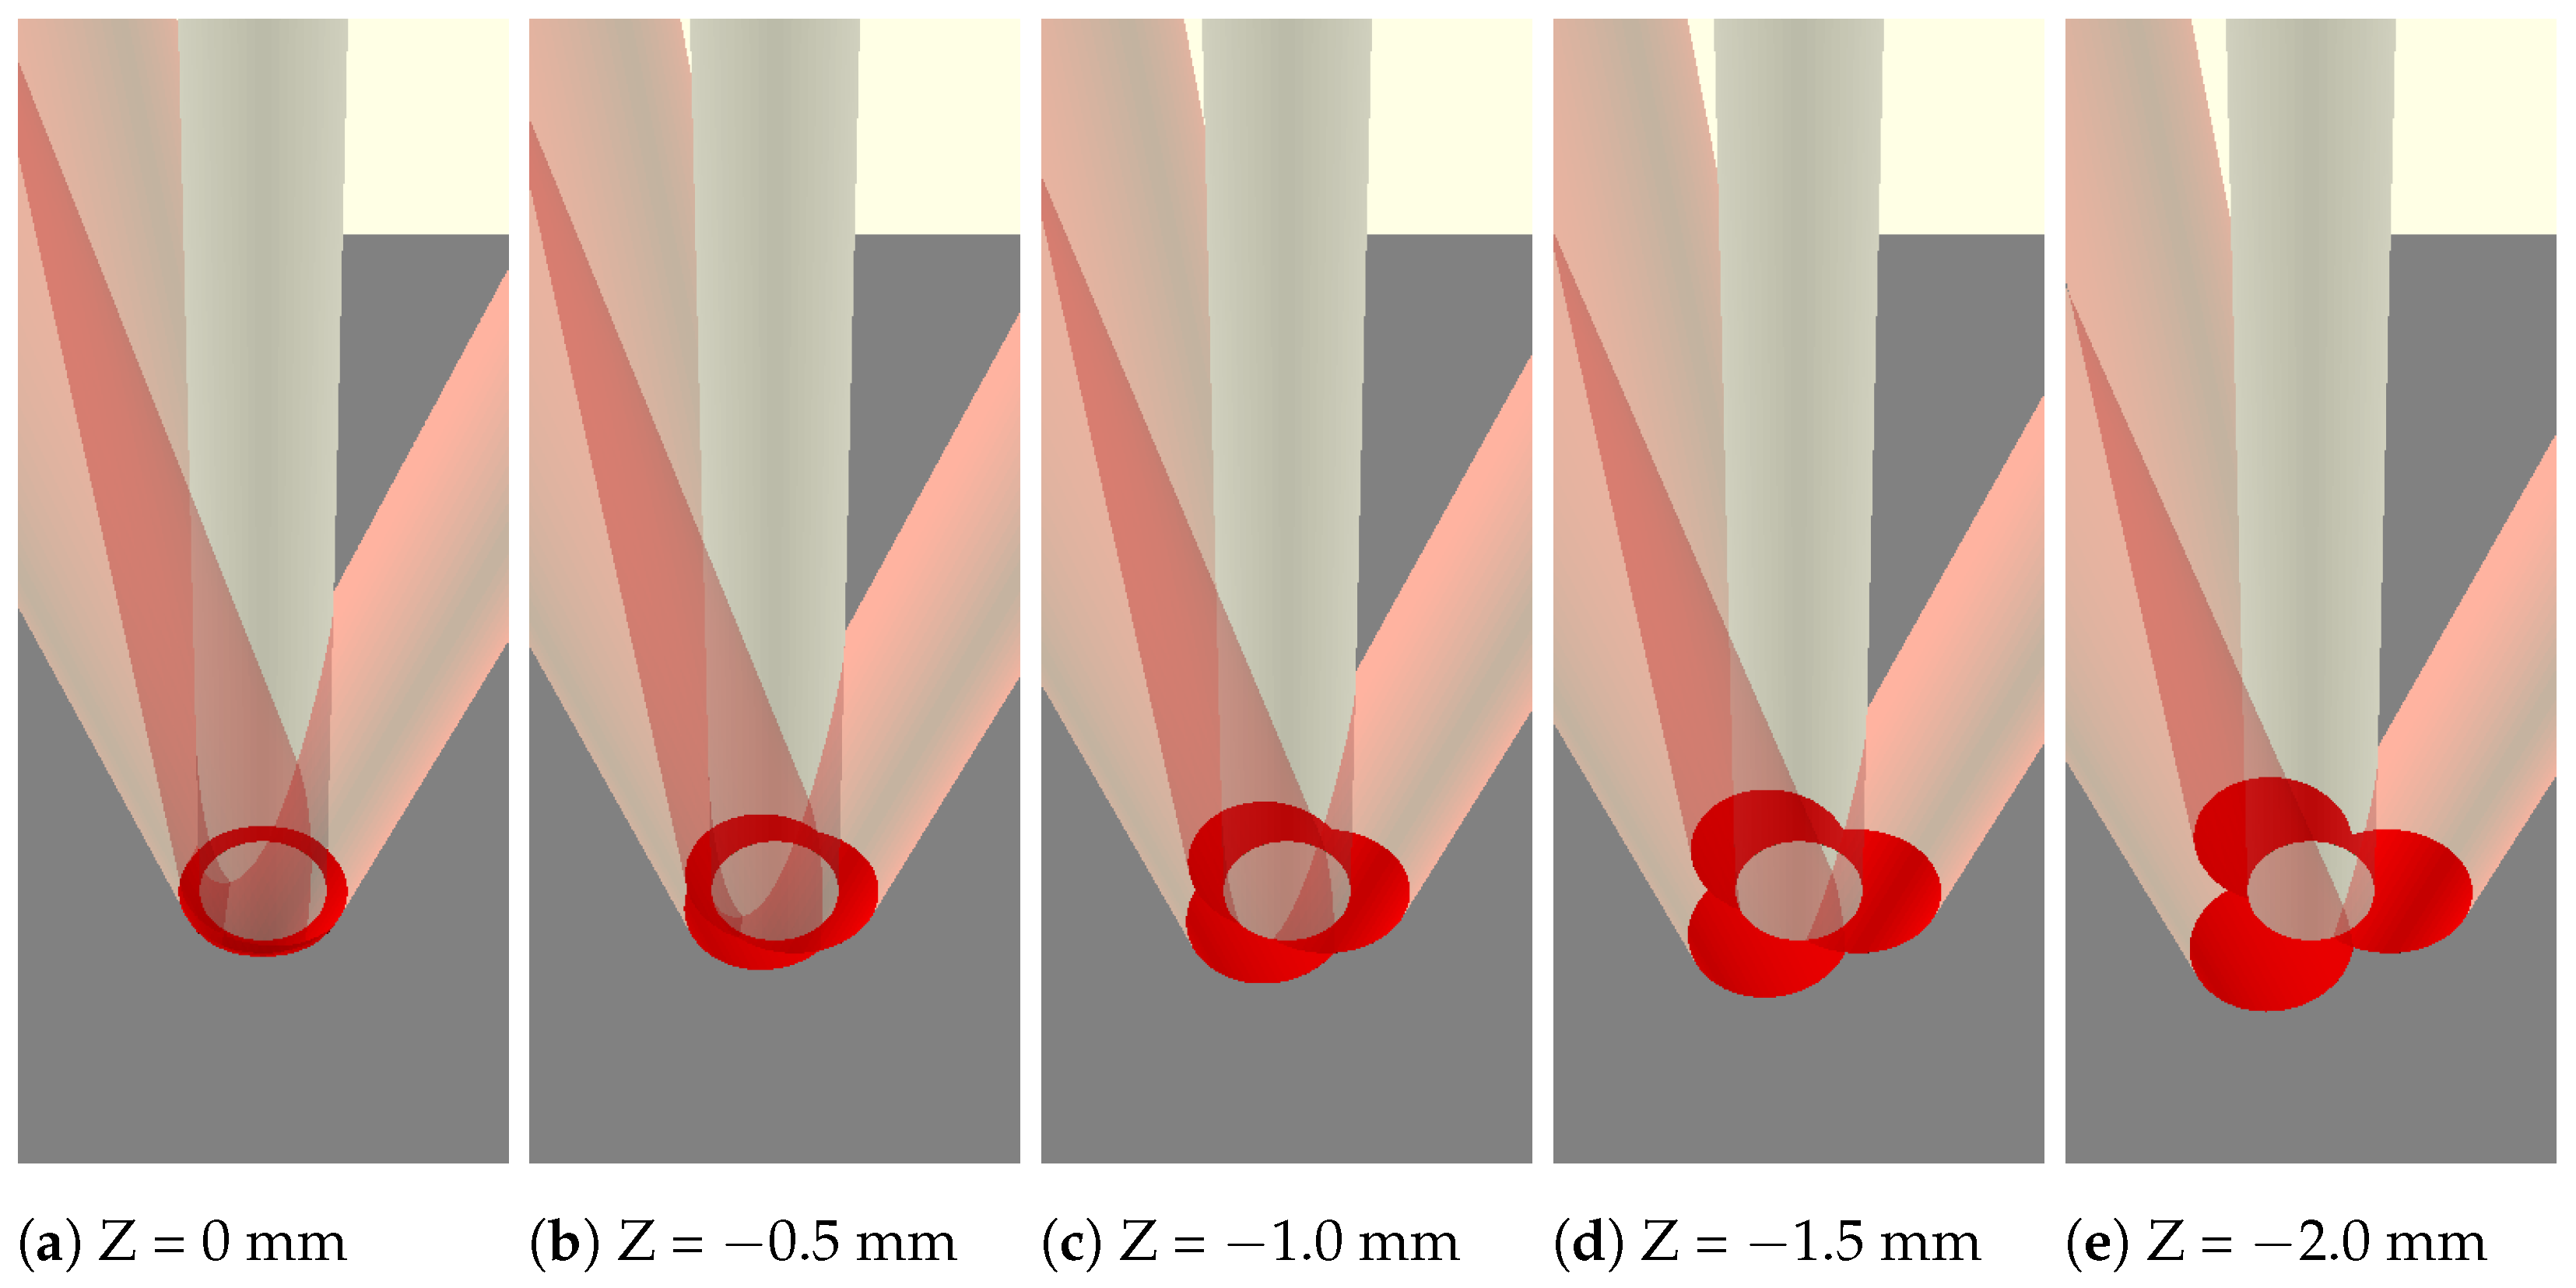
2.4. Simulation Description
3. Results
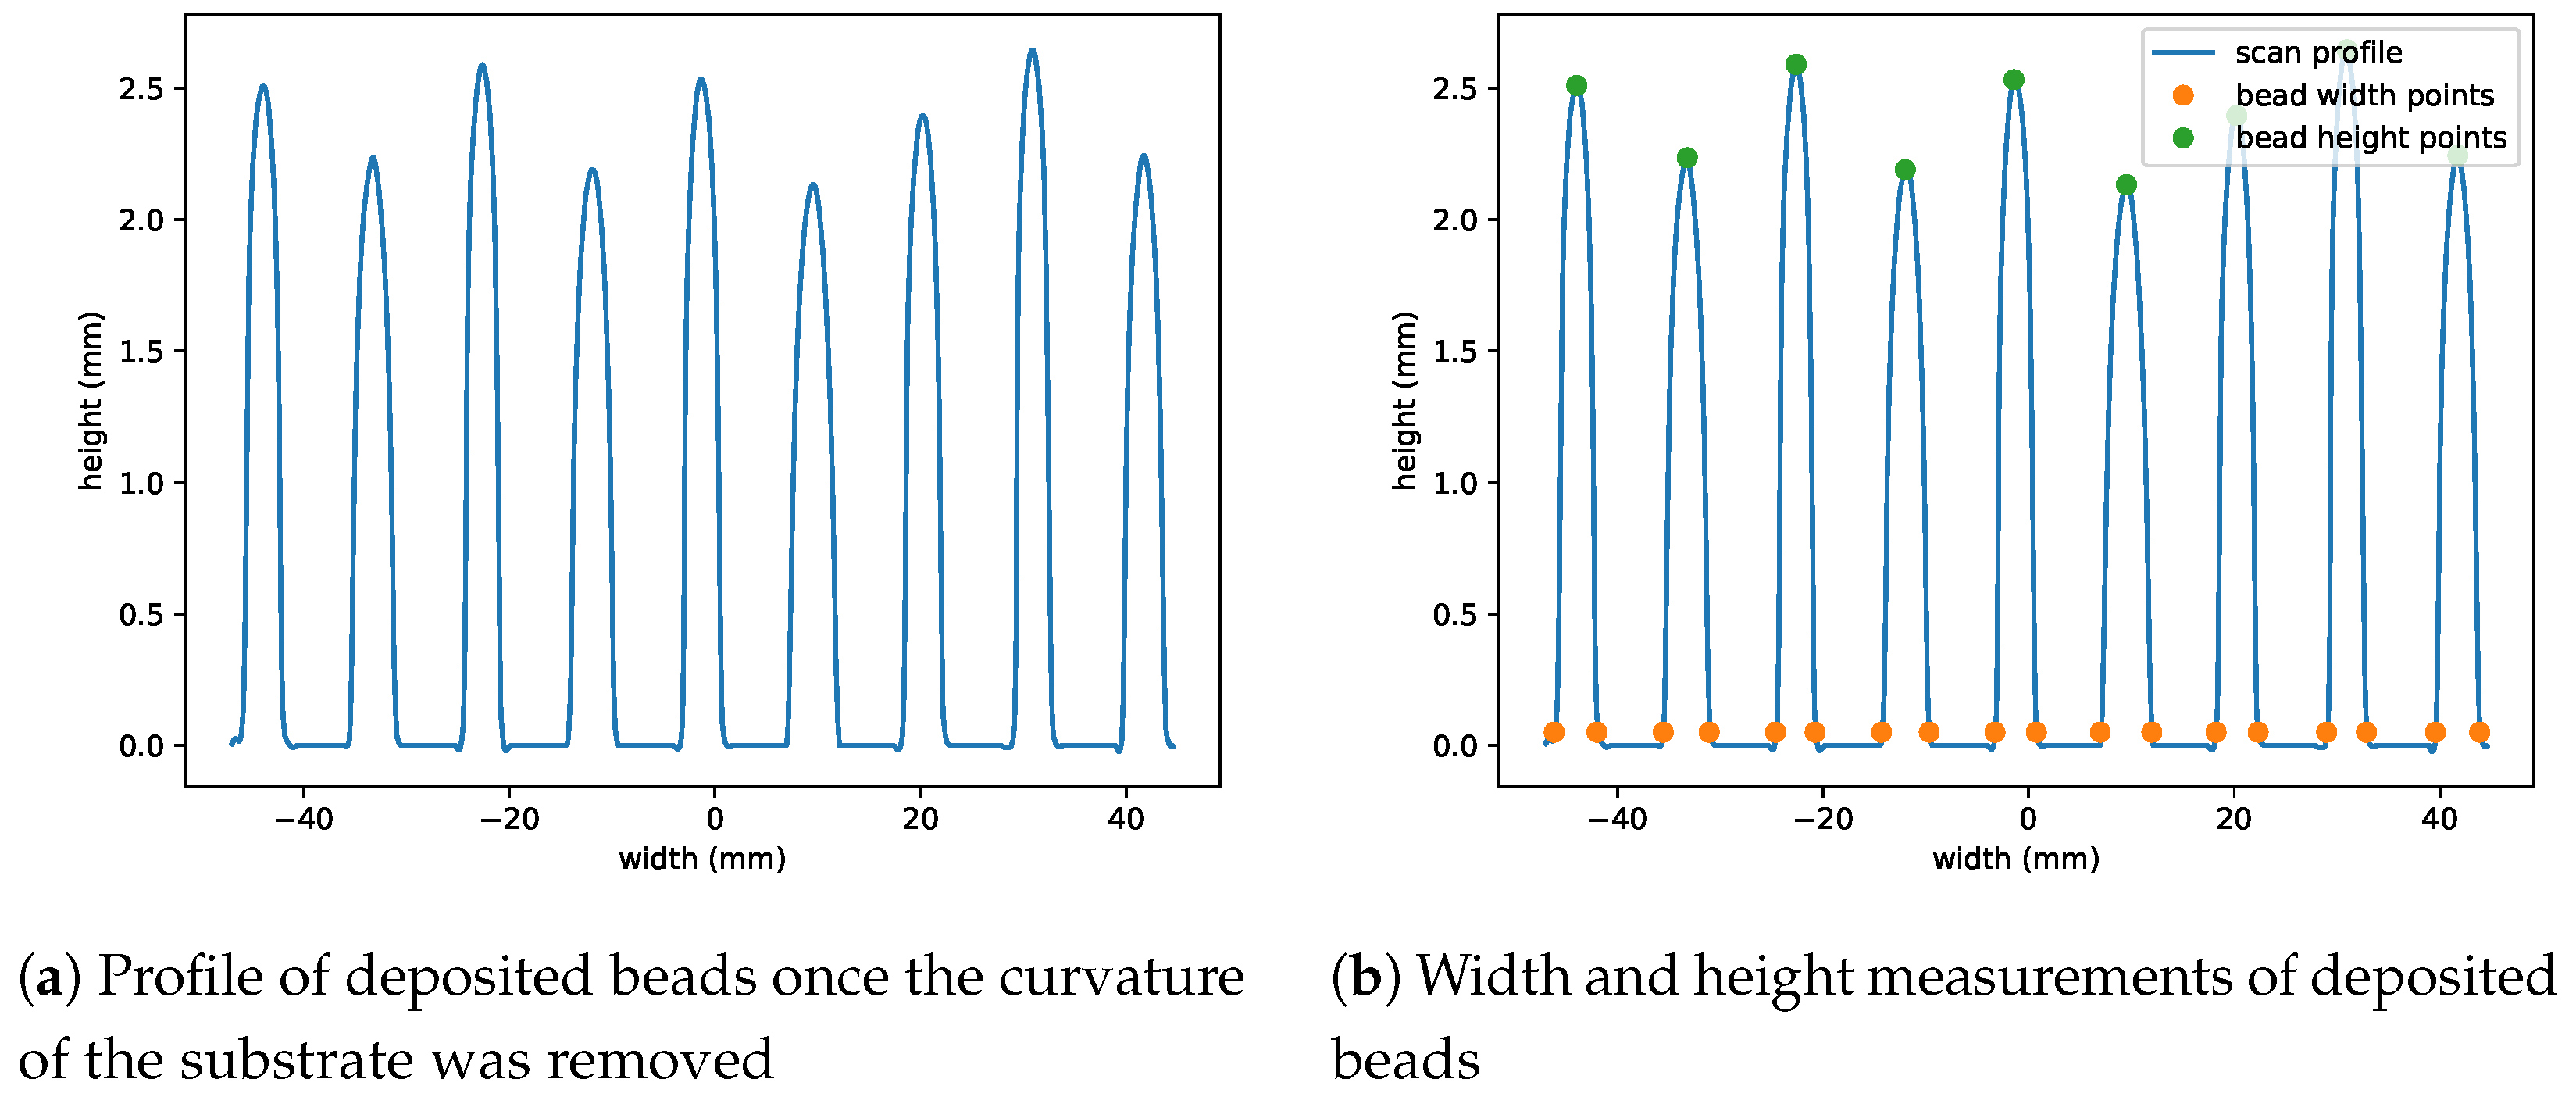
3.1. Experimental Results
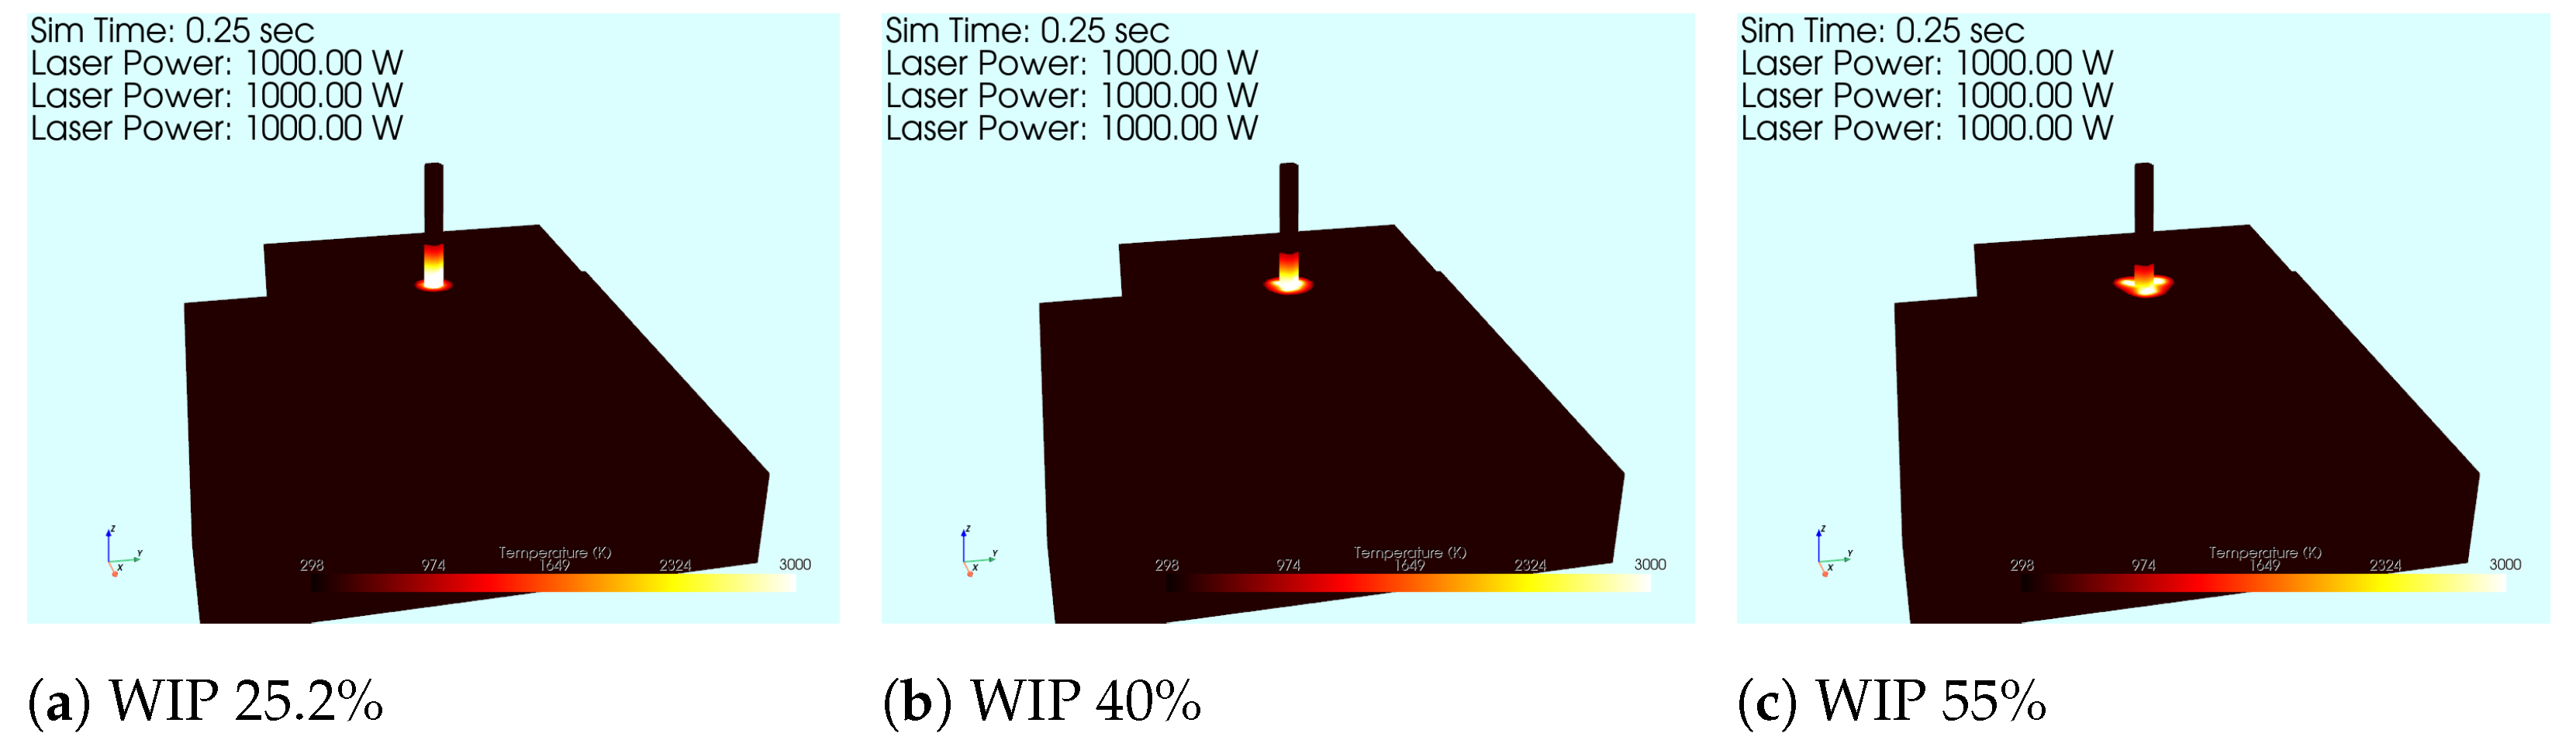
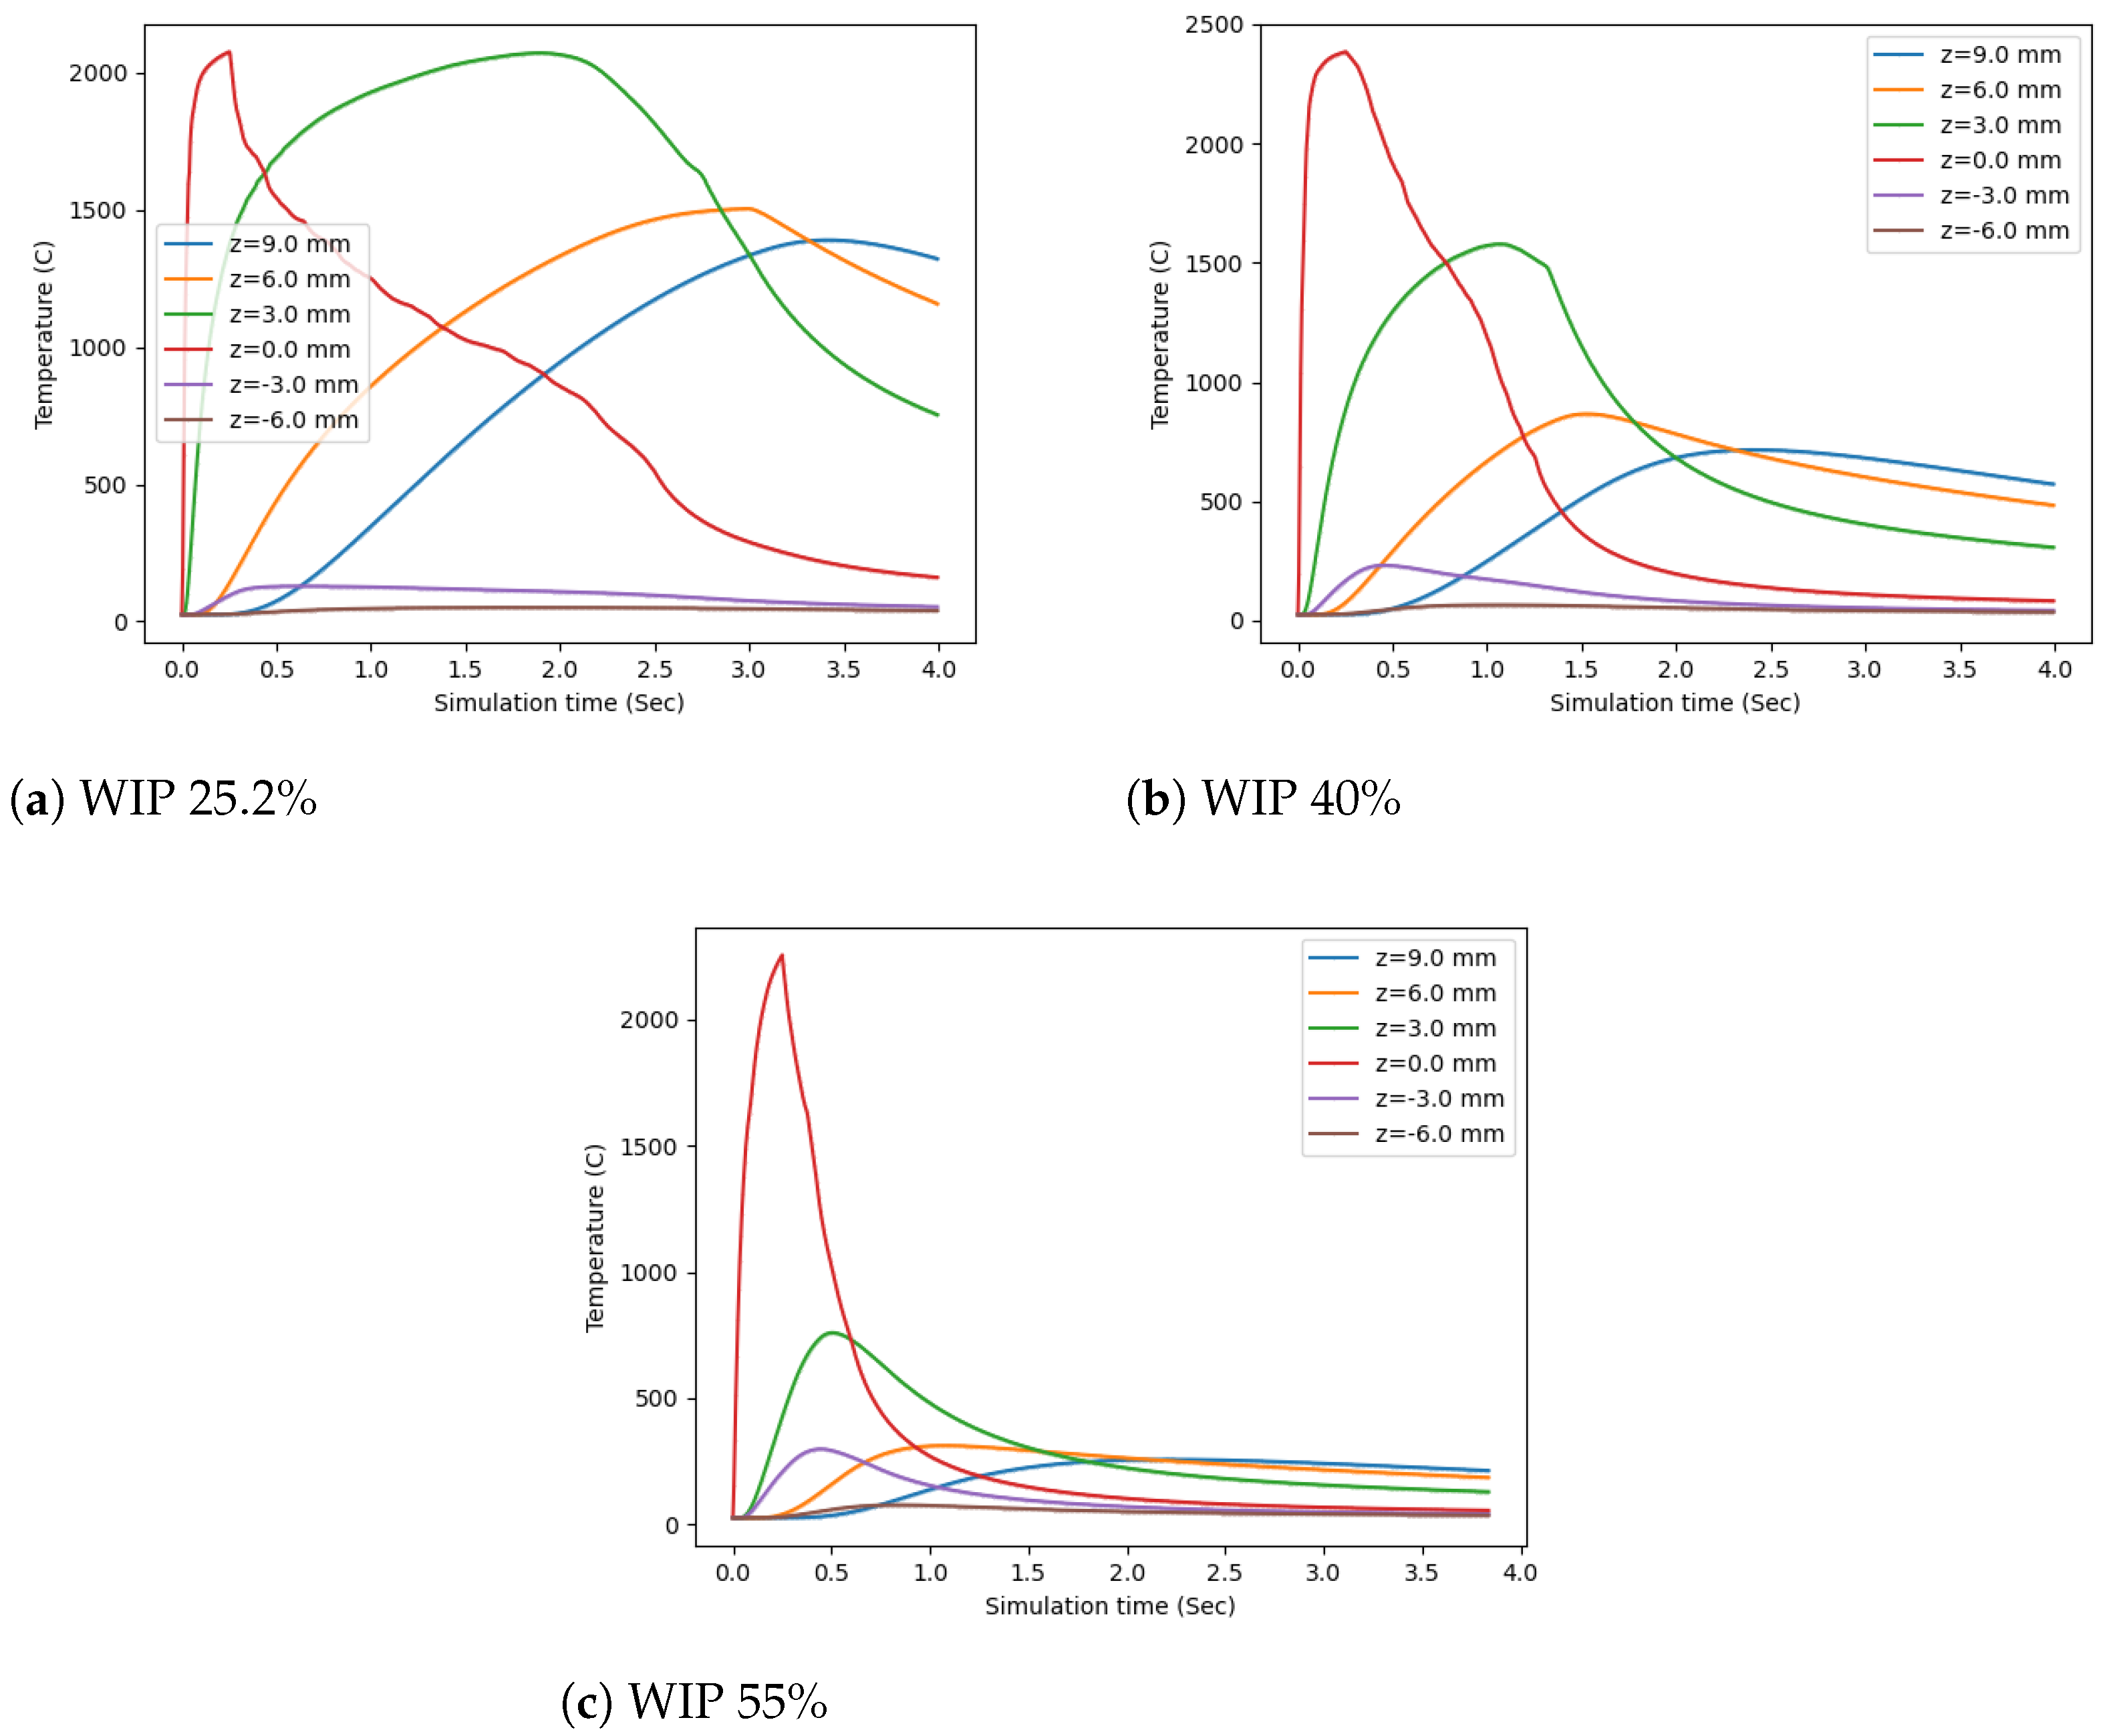
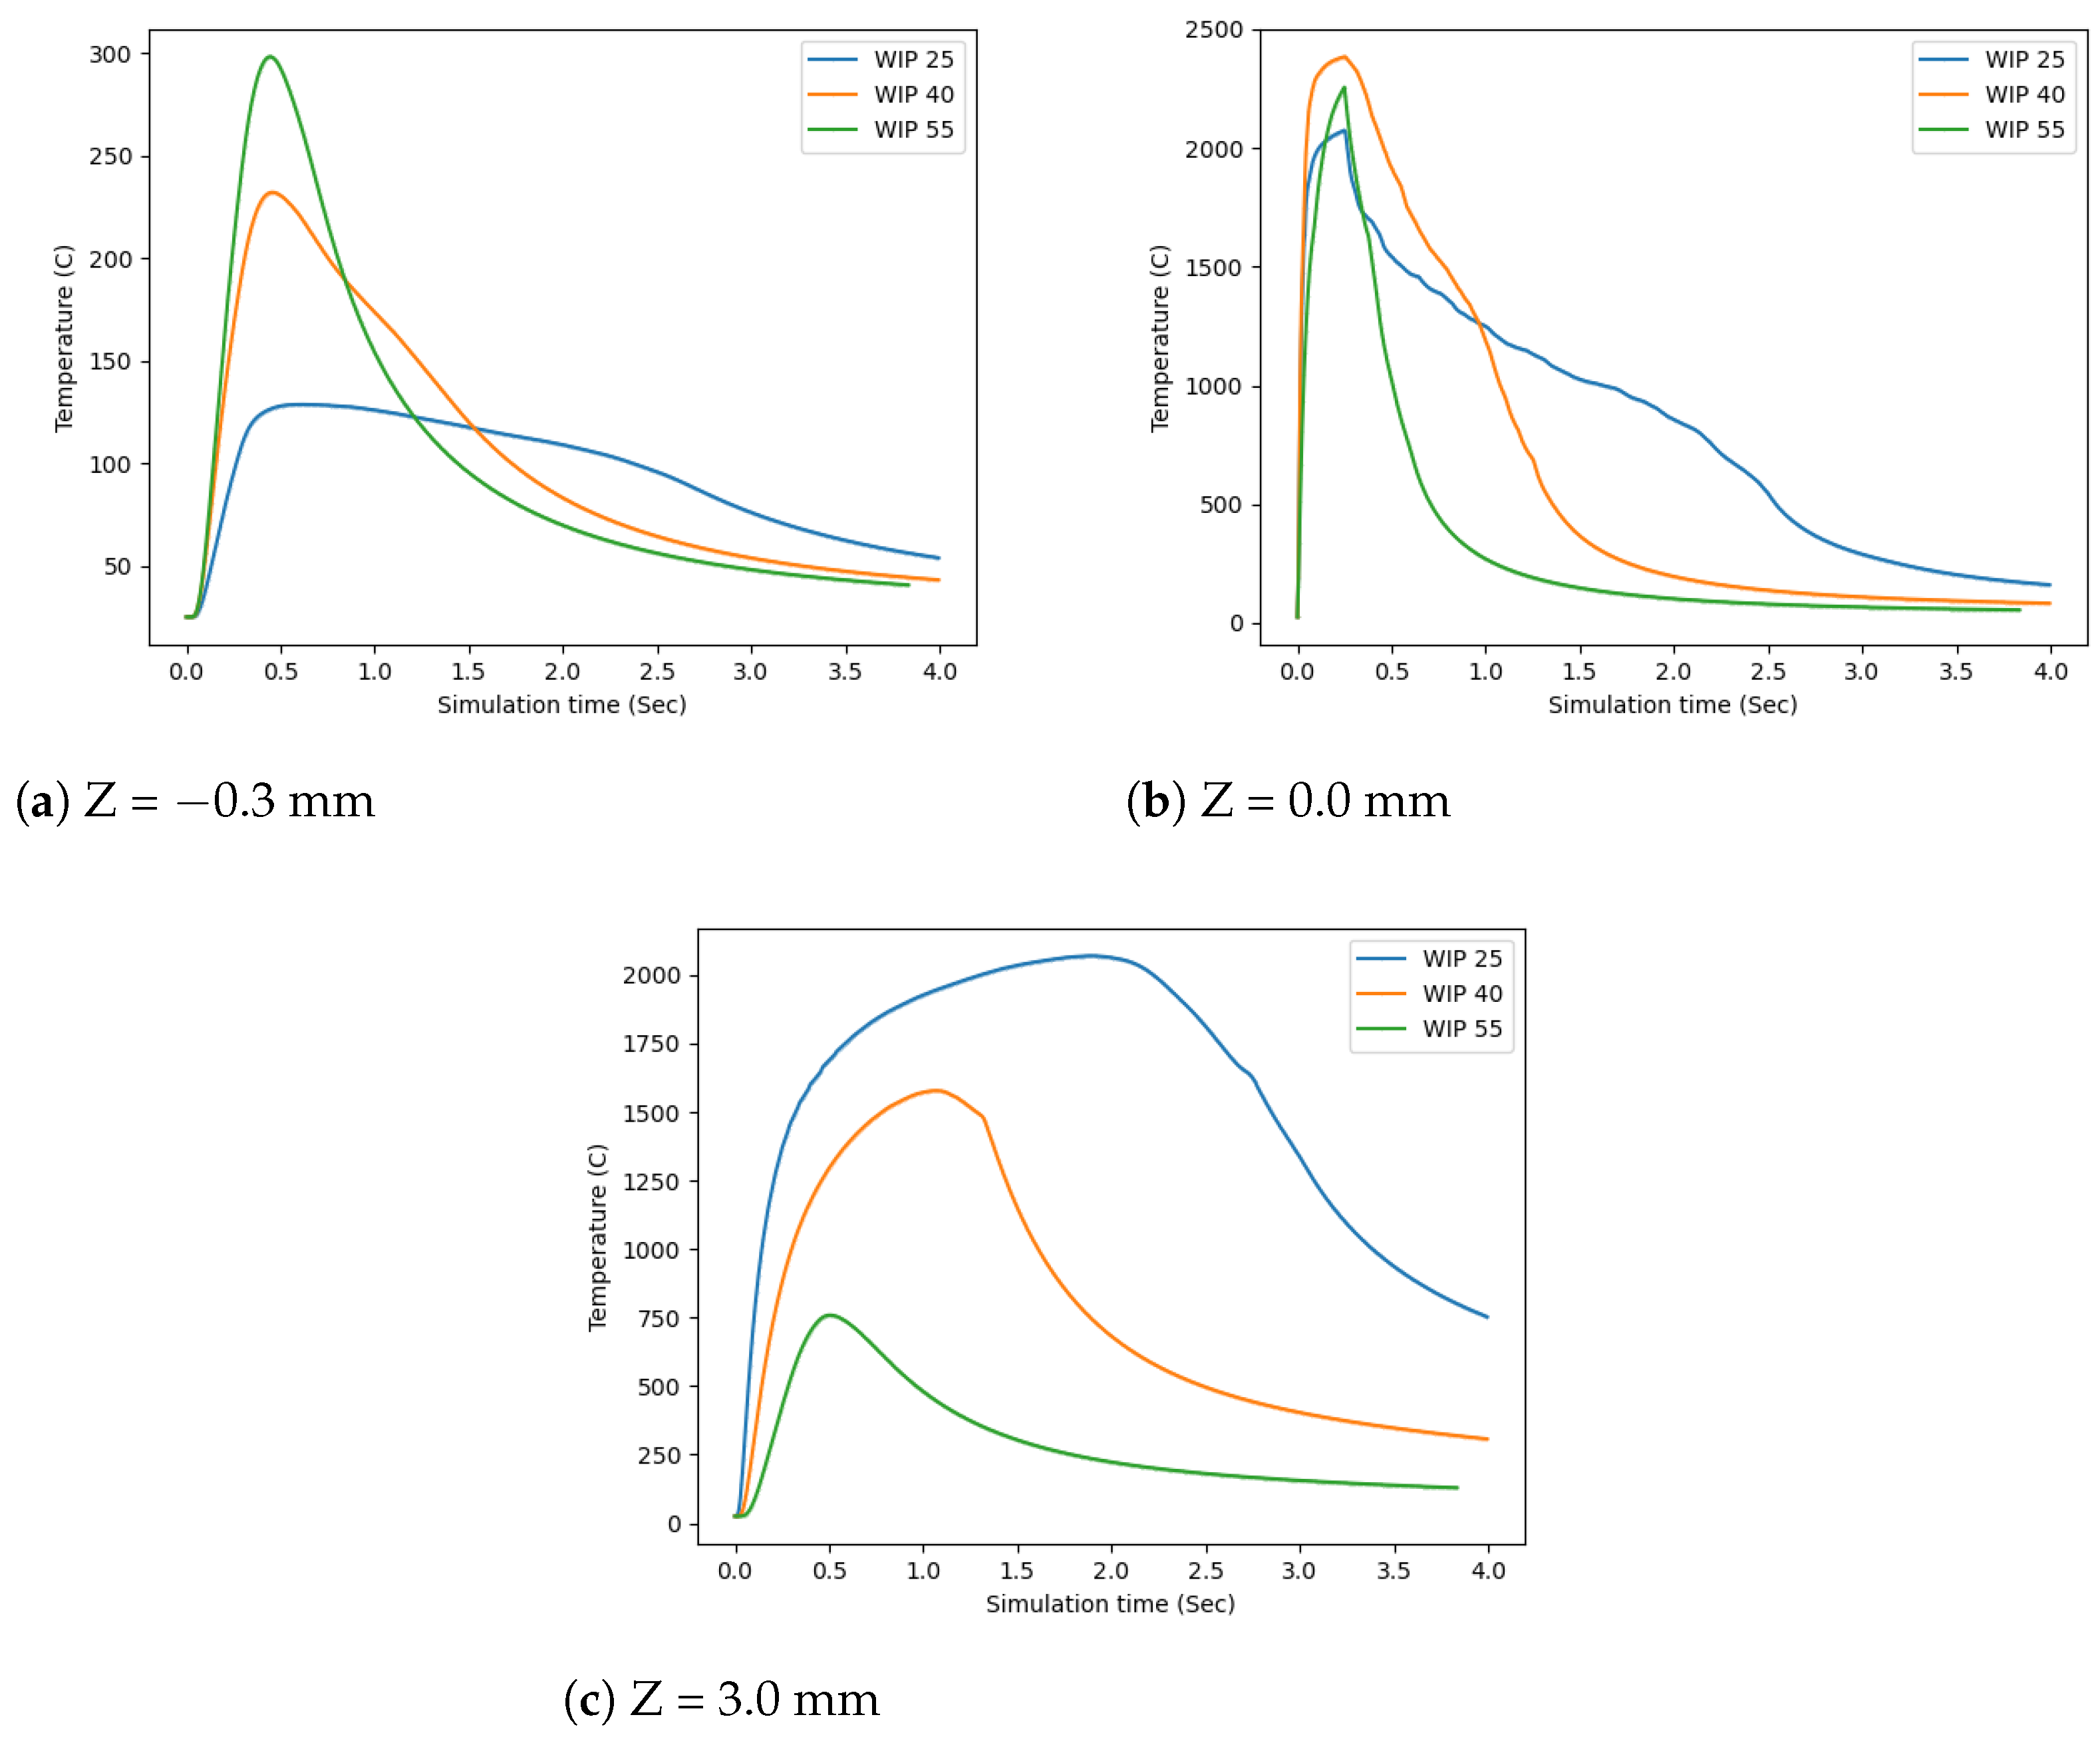
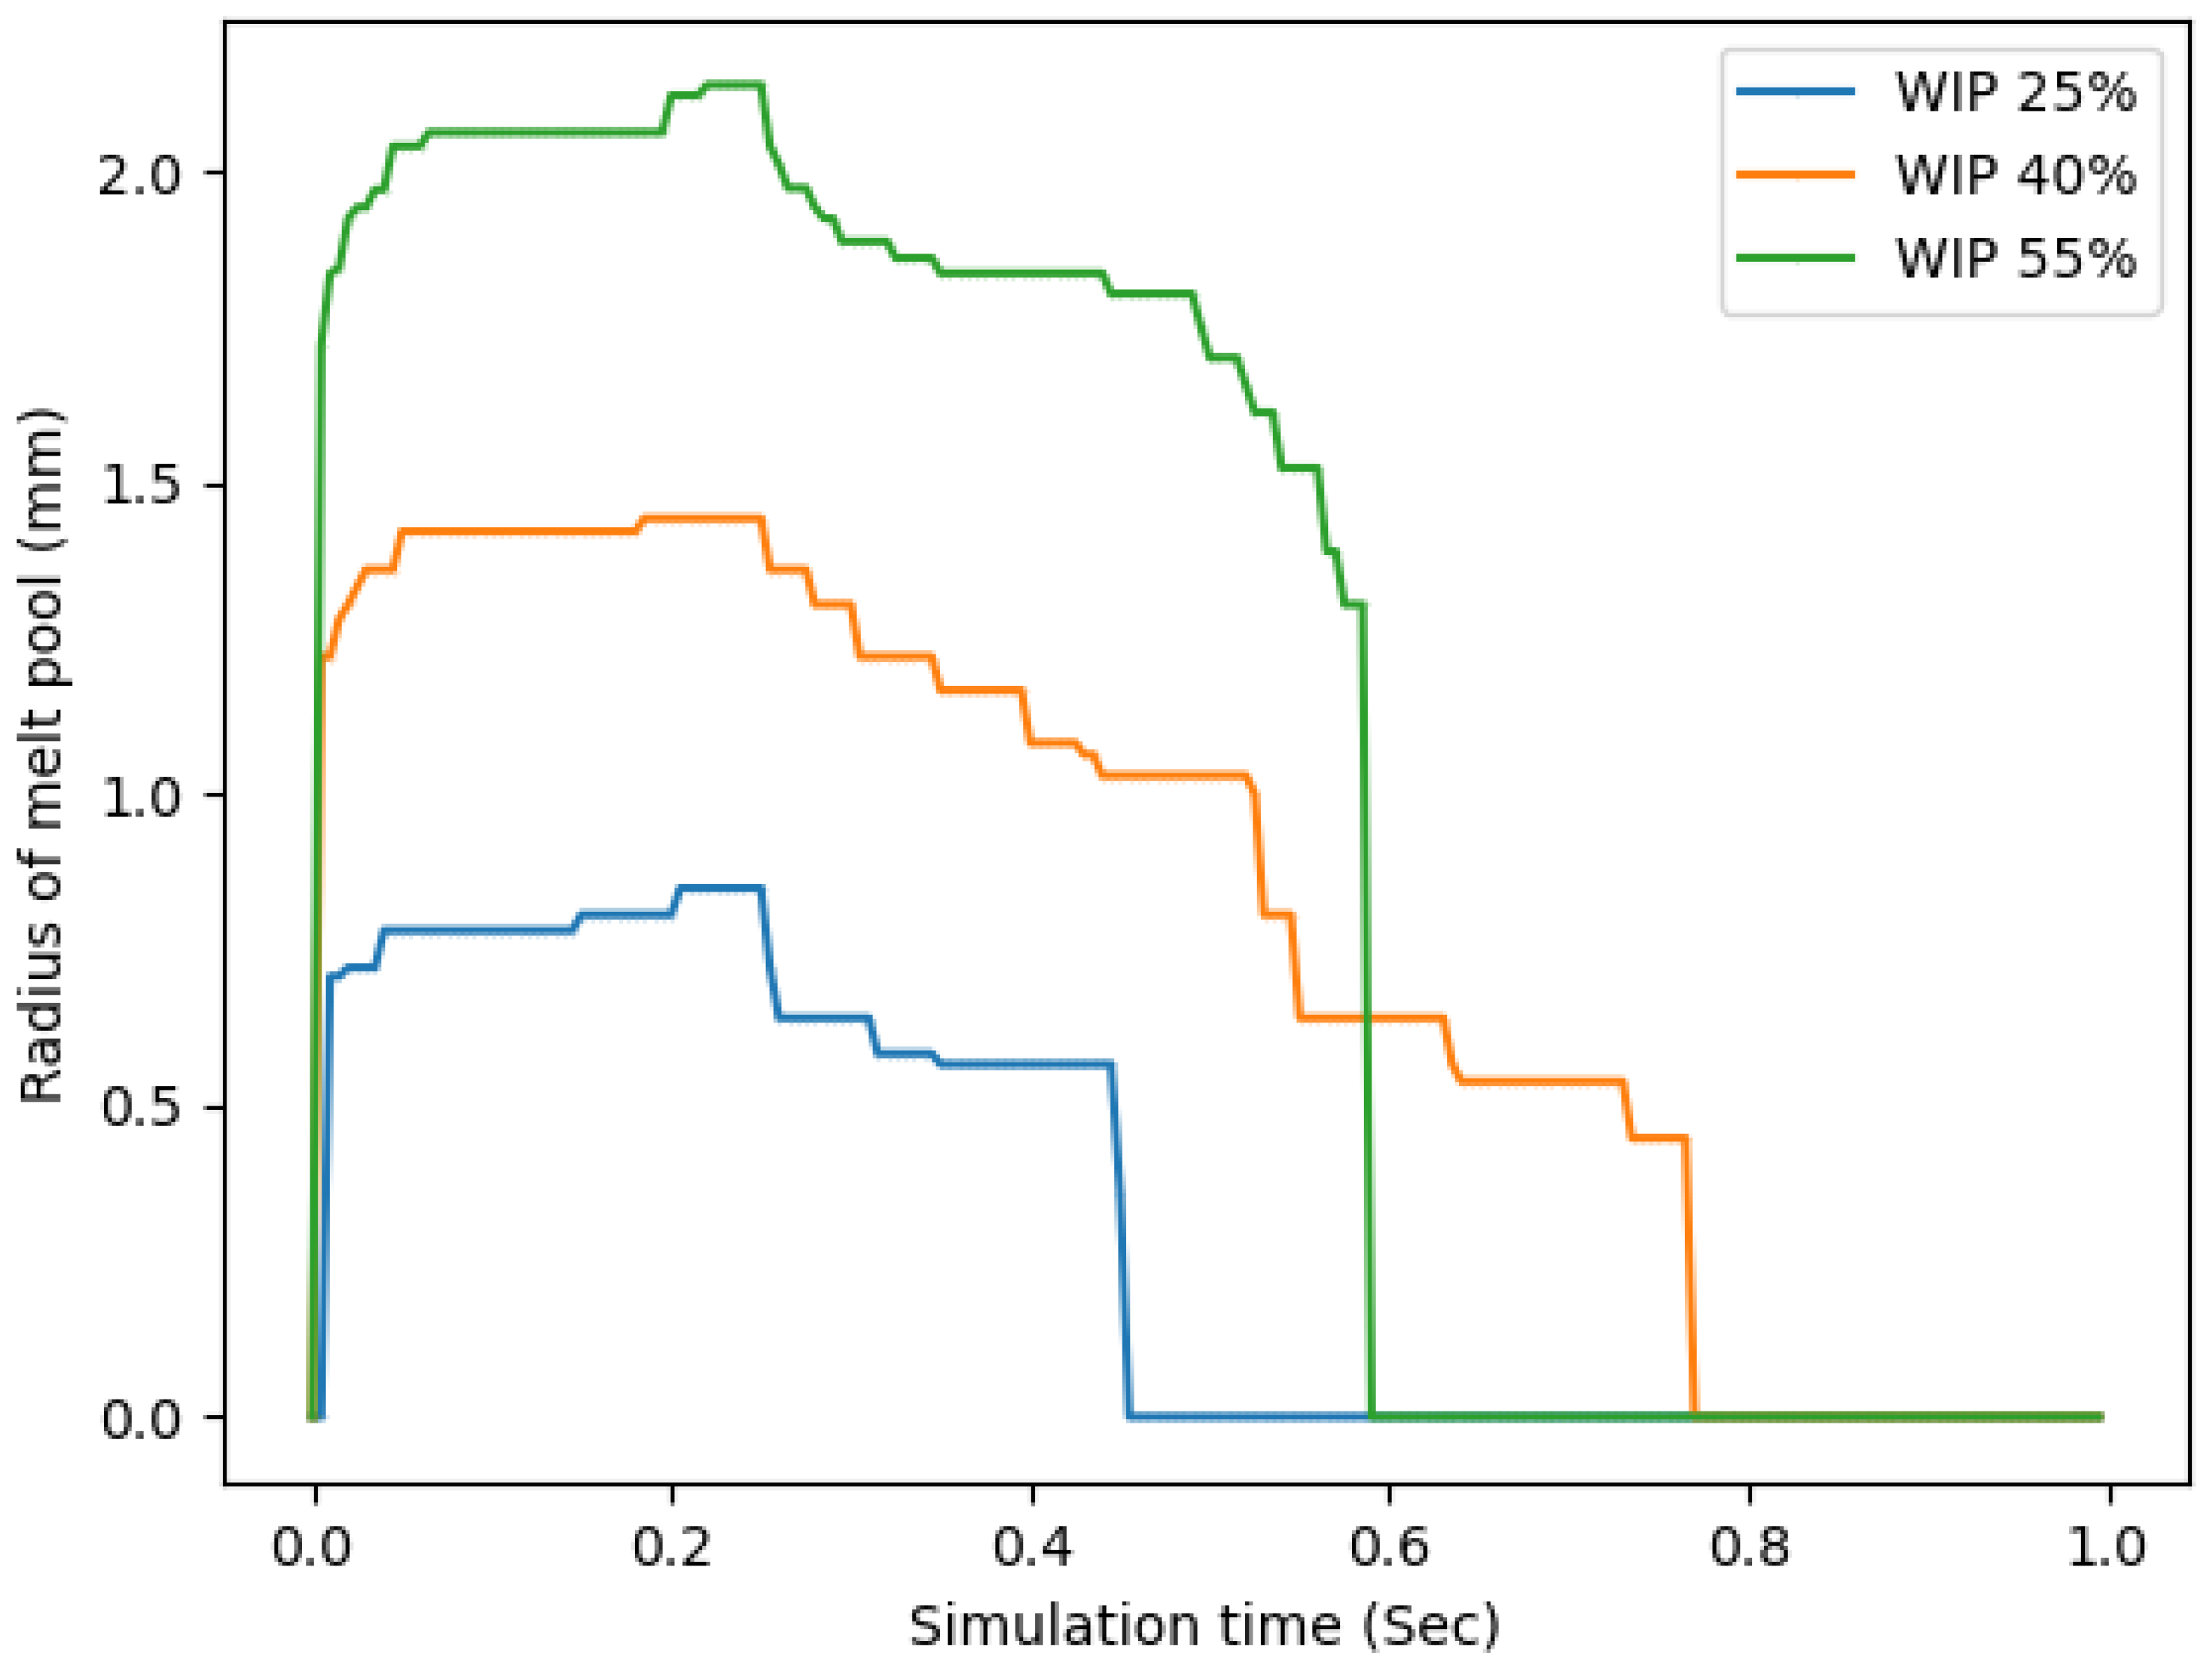
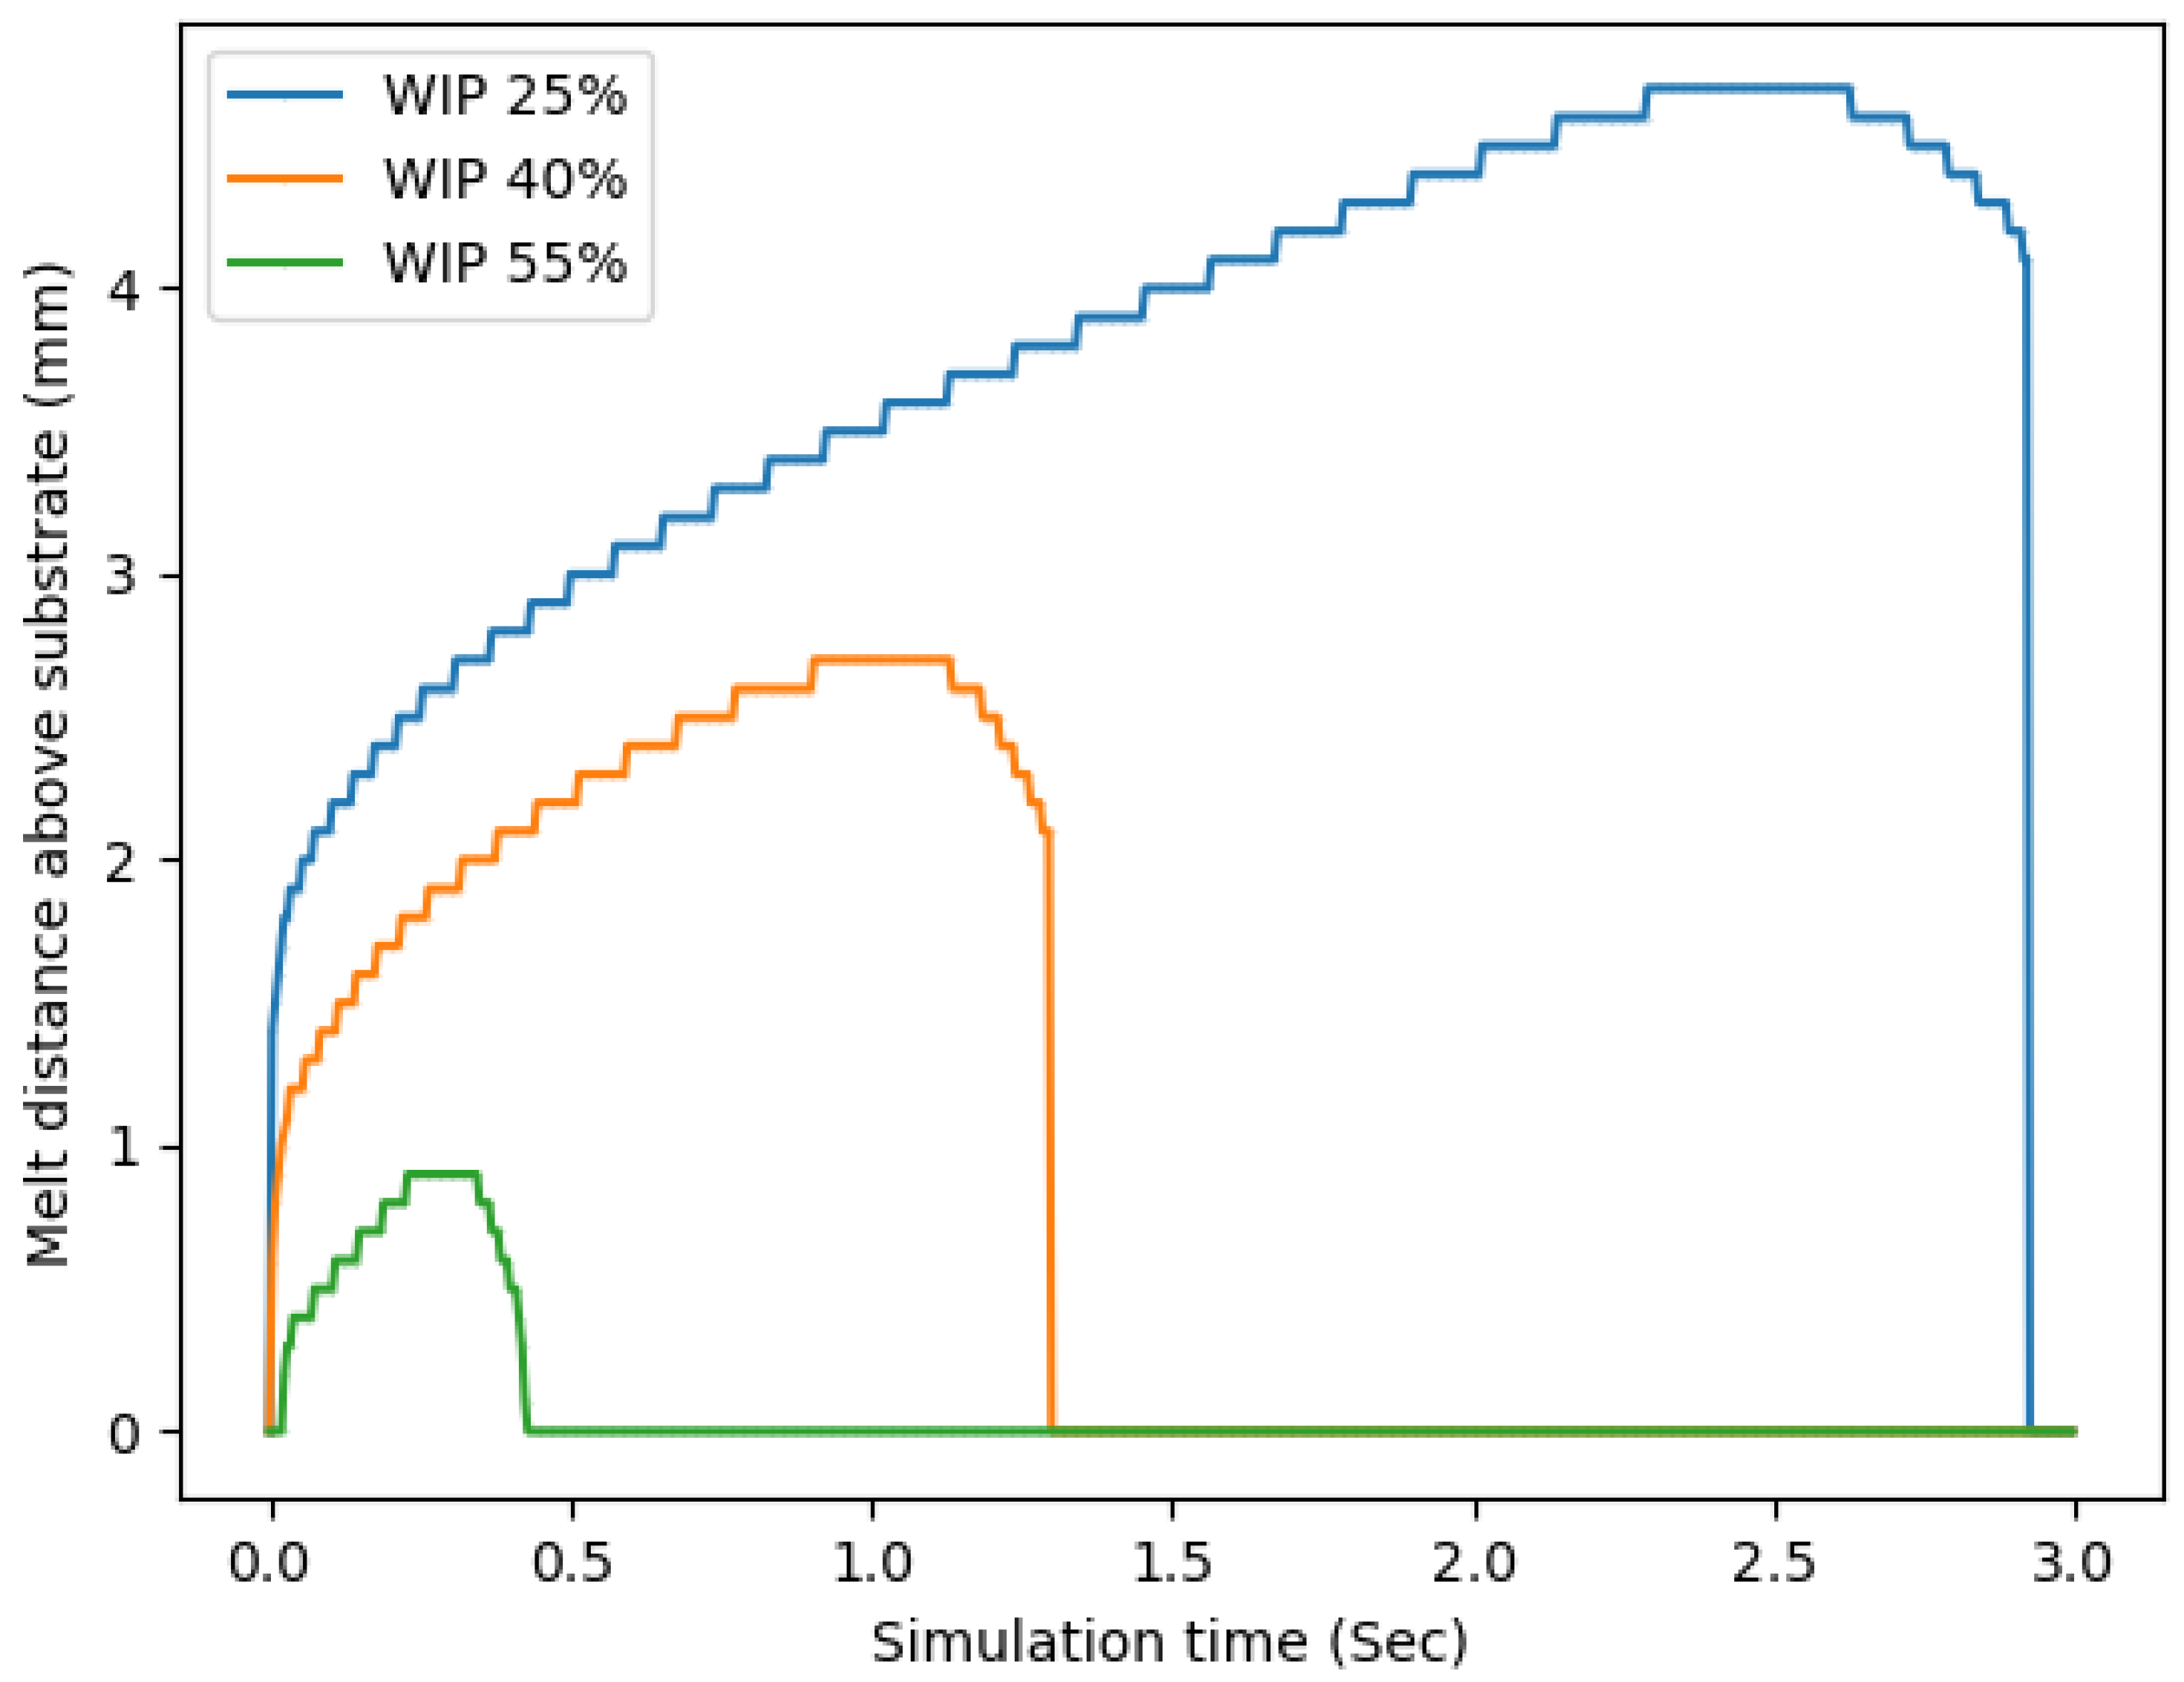
3.2. Simulation Results
4. Discussion
4.1. Experimental Discussion
4.2. Simulation Discussion
5. Conclusions
- The workpiece illumination proportion (WIP), as set by standoff distance, has an important role in determining the heat distribution, melt pool size, amount of melted material, and bead height and width.
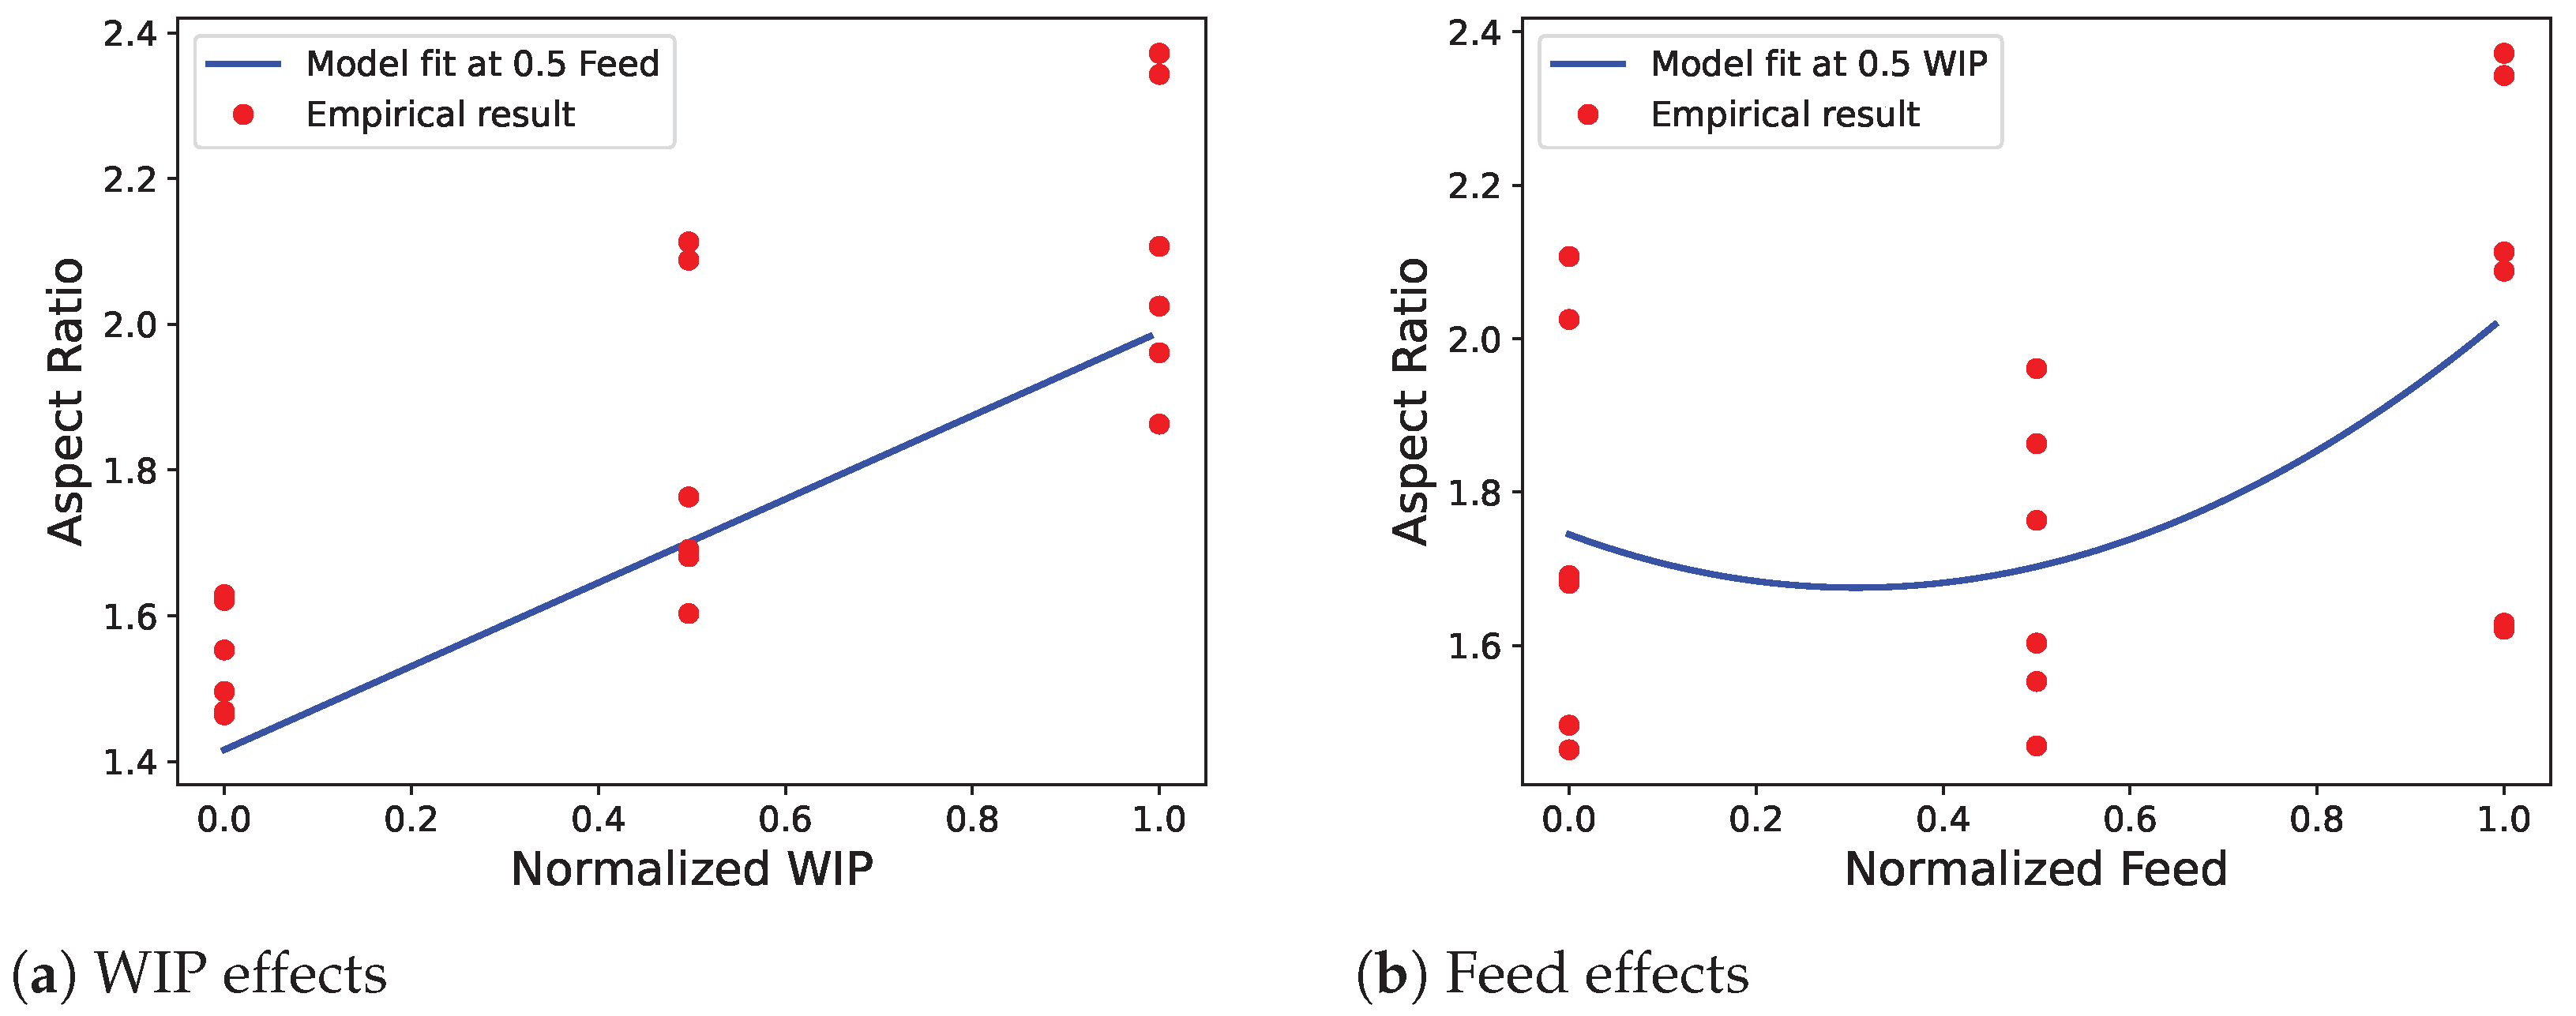
- For a given bead size, the deposition rate has a significant impact on the resulting bead shape. At the highest experimental settings of traverse feed rate and wire feed speed, the bead aspect ratio was noticeably increased as melt pool solidification kinetics are less dominated by the surface tension effect.
- A statistical regression model that predicts bead aspect ratio was presented and validated for the experimental study of WIP and deposition rate in coaxial wire-based laser metal deposition. Although the specific values in the model might only apply to the specific sizes, beam arrangement, and materials in the experiment, the general trends can provide insight into phenomena of other laser additive setups.
- The physics-based simulation provided a framework for the analysis of the coaxial wire-based laser metal deposition process. The calculation and analysis of the radius of the melt pool, the amount and location of melted wire, and the temperature of regions of interest can help to have a better understanding of important deposition characteristics like stability and bead geometry.
Author Contributions
Funding
Data Availability Statement
Conflicts of Interest
Abbreviations
| AM | additive manufacturing |
| AR | aspect ratio |
| DED | directed energy deposition |
| NIR | near-infrared |
| LP | laser power |
| MST | Missouri University of Science and Technology |
| PINE | Product Innovation and Engineering LLC |
| Ti64 | Ti-6Al-4V |
| TC | treatment combination |
| WFS | wire feed speed |
| WIP | workpiece illumination proportion |
References
- Thompson, S.M.; Bian, L.; Shamsaei, N.; Yadollahi, A. An overview of Direct Laser Deposition for additive manufacturing; Part I: Transport phenomena, modeling and diagnostics. Addit. Manuf. 2015, 8, 36–62. [Google Scholar] [CrossRef]
- Abdulrahman, K.O.; Akinlabi, E.T.; Mahamood, R.M. Laser metal deposition technique: Sustainability and environmental impact. Procedia Manuf. 2018, 21, 109–116. [Google Scholar] [CrossRef]
- Dass, A.; Moridi, A. State of the Art in Directed Energy Deposition: From Additive Manufacturing to Materials Design. Coatings 2019, 9, 418. [Google Scholar] [CrossRef]
- Ding, D.; Pan, Z.; Cuiuri, D.; Li, H. Wire-feed additive manufacturing of metal components: Technologies, developments and future interests. Int. J. Adv. Manuf. Technol. 2015, 81, 465–481. [Google Scholar] [CrossRef]
- Ocylok, S.; Leichnitz, M.; Thieme, S.; Nowotny, S. Investigations on laser metal deposition of stainless steel 316L with coaxial wire feeding. In Proceedings of the 9th International Conference on Photonic Technologies (LANE 2016), Furth, Germany, 19–22 September 2016. [Google Scholar]
- Kuznetsov, A.; Jeromen, A.; Levy, G.; Fujishima, M.; Govekar, E. Annular Laser Beam Cladding Process Feasibility Study. Phys. Procedia 2016, 83, 647–656. [Google Scholar] [CrossRef]
- Zapata, A.; Bernauer, C.; Stadter, C.; Kolb, C.G.; Zaeh, M.F. Investigation on the Cause-Effect Relationships between the Process Parameters and the Resulting Geometric Properties for Wire-Based Coaxial Laser Metal Deposition. Metals 2022, 12, 455. [Google Scholar] [CrossRef]
- Wang, Y.K.; Shi, S.H.; Fu, G.Y.; Li, C.S. Research on the Key Process Parameters in Direct Laser Deposition Using Coaxial Inside-Beam Wire Feeding. In Advance in Mechatronics Technology (Applied Mechanics and Materials); Trans Tech Publications Ltd.: Zurich, Switzerland, 2011; Volume 43, pp. 401–404. [Google Scholar] [CrossRef]
- Kotar, M.; Govekar, E. The influence of the workpiece illumination proportion in annular laser beam wire deposition process. Procedia CIRP 2018, 74, 228–232. [Google Scholar] [CrossRef]
- Govekar, E.; Jeromen, A.; Kuznetsov, A.; Kotar, M.; Kondo, M. Annular laser beam based direct metal deposition. Procedia CIRP 2018, 74, 222–227. [Google Scholar] [CrossRef]
- Kotar, M.; Fujishima, M.; Levy, G.; Govekar, E. Initial transient phase and stability of annular laser beam direct wire deposition. CIRP Ann. 2019, 68, 233–236. [Google Scholar] [CrossRef]
- Kotar, M.; Fujishima, M.; Levy, G.N.; Govekar, E. Advances in the understanding of the annular laser beam wire cladding process. J. Mater. Process. Technol. 2021, 294, 117105. [Google Scholar] [CrossRef]
- Motta, M.; Demir, A.G.; Previtali, B. High-speed imaging and process characterization of coaxial laser metal wire deposition. Addit. Manuf. 2018, 22, 497–507. [Google Scholar] [CrossRef]
- Ji, S.; Liu, F.; Shi, T.; Fu, G.; Shi, S. Effects of Defocus Distance on Three-Beam Laser Internal Coaxial Wire Cladding. Chin. J. Mech. Eng. 2021, 34, 45. [Google Scholar] [CrossRef]
- Wire-Based Laser Metal Deposition (LMD-w)—ipt.fraunhofer.de. Available online: https://www.ipt.fraunhofer.de/en/technologies/additive-manufacturing/wire-based-laser-metal-deposition.html (accessed on 21 December 2023).
- Flood, A.; Liou, F. Sensitivity Analysis of Directed Energy Deposition Simulation Results to Aluminum Material Properties. In 3D Printing and Additive Manufacturing; Mary Ann Liebert: New York, NY, USA, 2023. [Google Scholar] [CrossRef]
- Flood, A.; Boillat, R.; Isanaka, S.P.; Liou, F. Searching for Unknown Material Properties for AM Simulations. Metals 2023, 13, 1798. [Google Scholar] [CrossRef]


| Treatment Combination | Feed (mm/s) | WFS (mm/s) | WIP (%) | LP (W) |
|---|---|---|---|---|
| 1 | 5.9 | 38.3 | 25.2% | 1029 |
| 2 | 5.9 | 38.3 | 40.0% | 1283 |
| 3 | 5.9 | 38.3 | 55.0% | 1711 |
| 4 | 7.2 | 46.6 | 25.2% | 1250 |
| 5 | 7.2 | 46.6 | 40.0% | 1558 |
| 6 | 7.2 | 46.6 | 55.0% | 2078 |
| 7 | 8.5 | 54.8 | 25.2% | 1471 |
| 8 | 8.5 | 54.8 | 40.0% | 1833 |
| 9 | 8.5 | 54.8 | 55.0% | 2444 |
| Parameter | Value |
|---|---|
| Resolution | 10 |
| Laser Power (per laser) | 1000 W |
| Laser Profile | Top Hat |
| Laser Diameter (per laser) | 1.5 mm |
| Laser Pulse Duration | 250 ms |
| Rotational angle separating lasers | 120° |
| Angle between laser path and wire axis | 20° |
| Substrate dimensions | 25 mm × 25 mm × 8 mm |
| Wire Diameter | 1.2 mm |
| Block 1 | Block 2 | ||||||||
|---|---|---|---|---|---|---|---|---|---|
| TC | AR 40% | AR 50% | AR 60% | Mean AR | TC | AR 40% | AR 50% | AR 60% | Mean AR |
| 5 | 1.582 | 1.654 | 1.572 | 1.603 | 7 | 1.638 | 1.581 | 1.643 | 1.621 |
| 3 | 2.156 | 2.000 | 1.919 | 2.025 | 6 | 1.896 | 2.039 | 1.948 | 1.961 |
| 4 | 1.585 | 1.483 | 1.590 | 1.553 | 1 | 1.482 | 1.528 | 1.477 | 1.496 |
| 8 | 2.089 | 2.118 | 2.057 | 2.088 | 9 | 2.250 | 2.411 | 2.368 | 2.343 |
| 7 | 1.577 | 1.589 | 1.721 | 1.629 | 8 | 2.247 | 1.967 | 2.125 | 2.113 |
| 9 | 2.402 | 2.349 | 2.364 | 2.372 | 3 | 2.005 | 2.216 | 2.099 | 2.107 |
| 2 | 1.638 | 1.711 | 1.695 | 1.681 | 2 | 1.709 | 1.721 | 1.643 | 1.691 |
| 1 | 1.430 | 1.465 | 1.497 | 1.464 | 4 | 1.445 | 1.475 | 1.488 | 1.469 |
| 6 | 1.863 | 1.915 | 2.014 | 1.931 | 5 | 1.762 | 1.850 | 1.676 | 1.763 |
| Source | Degrees of Freedom | Sum of Squares | Mean Square | F-Ratio |
|---|---|---|---|---|
| Model | 6 | 1.3988 | 0.2331 | 31.6574 |
| Error | 11 | 0.0810 | 0.0074 | p-Value |
| C. Total | 17 | 1.4798 | <0.0001 |
| Source | Degrees of Freedom | Sum of Squares | F-Ratio | p-Value |
|---|---|---|---|---|
| Feed | 1 | 0.2414 | 32.7794 | 0.0001 |
| WIP | 1 | 1.0246 | 139.1303 | <0.0001 |
| Feed × WIP | 1 | 0.0106 | 1.4395 | 0.2554 |
| Feed × Feed | 1 | 0.1190 | 16.1622 | 0.0020 |
| WIP × WIP | 1 | 0.0001 | 0.0180 | 0.8956 |
| Block | 1 | 0.0026 | 0.3585 | 0.5615 |
| Term | Estimate | Std Error | t Ratio | p-Value |
|---|---|---|---|---|
| Intercept | 1.4581 | 0.044 | 33.213 | <0.001 |
| WIP | 0.5732 | 0.051 | 11.299 | <0.001 |
| Feed | −0.4517 | 0.183 | −2.469 | 0.027 |
| Feed × Feed | 0.7353 | 0.176 | 4.184 | 0.001 |
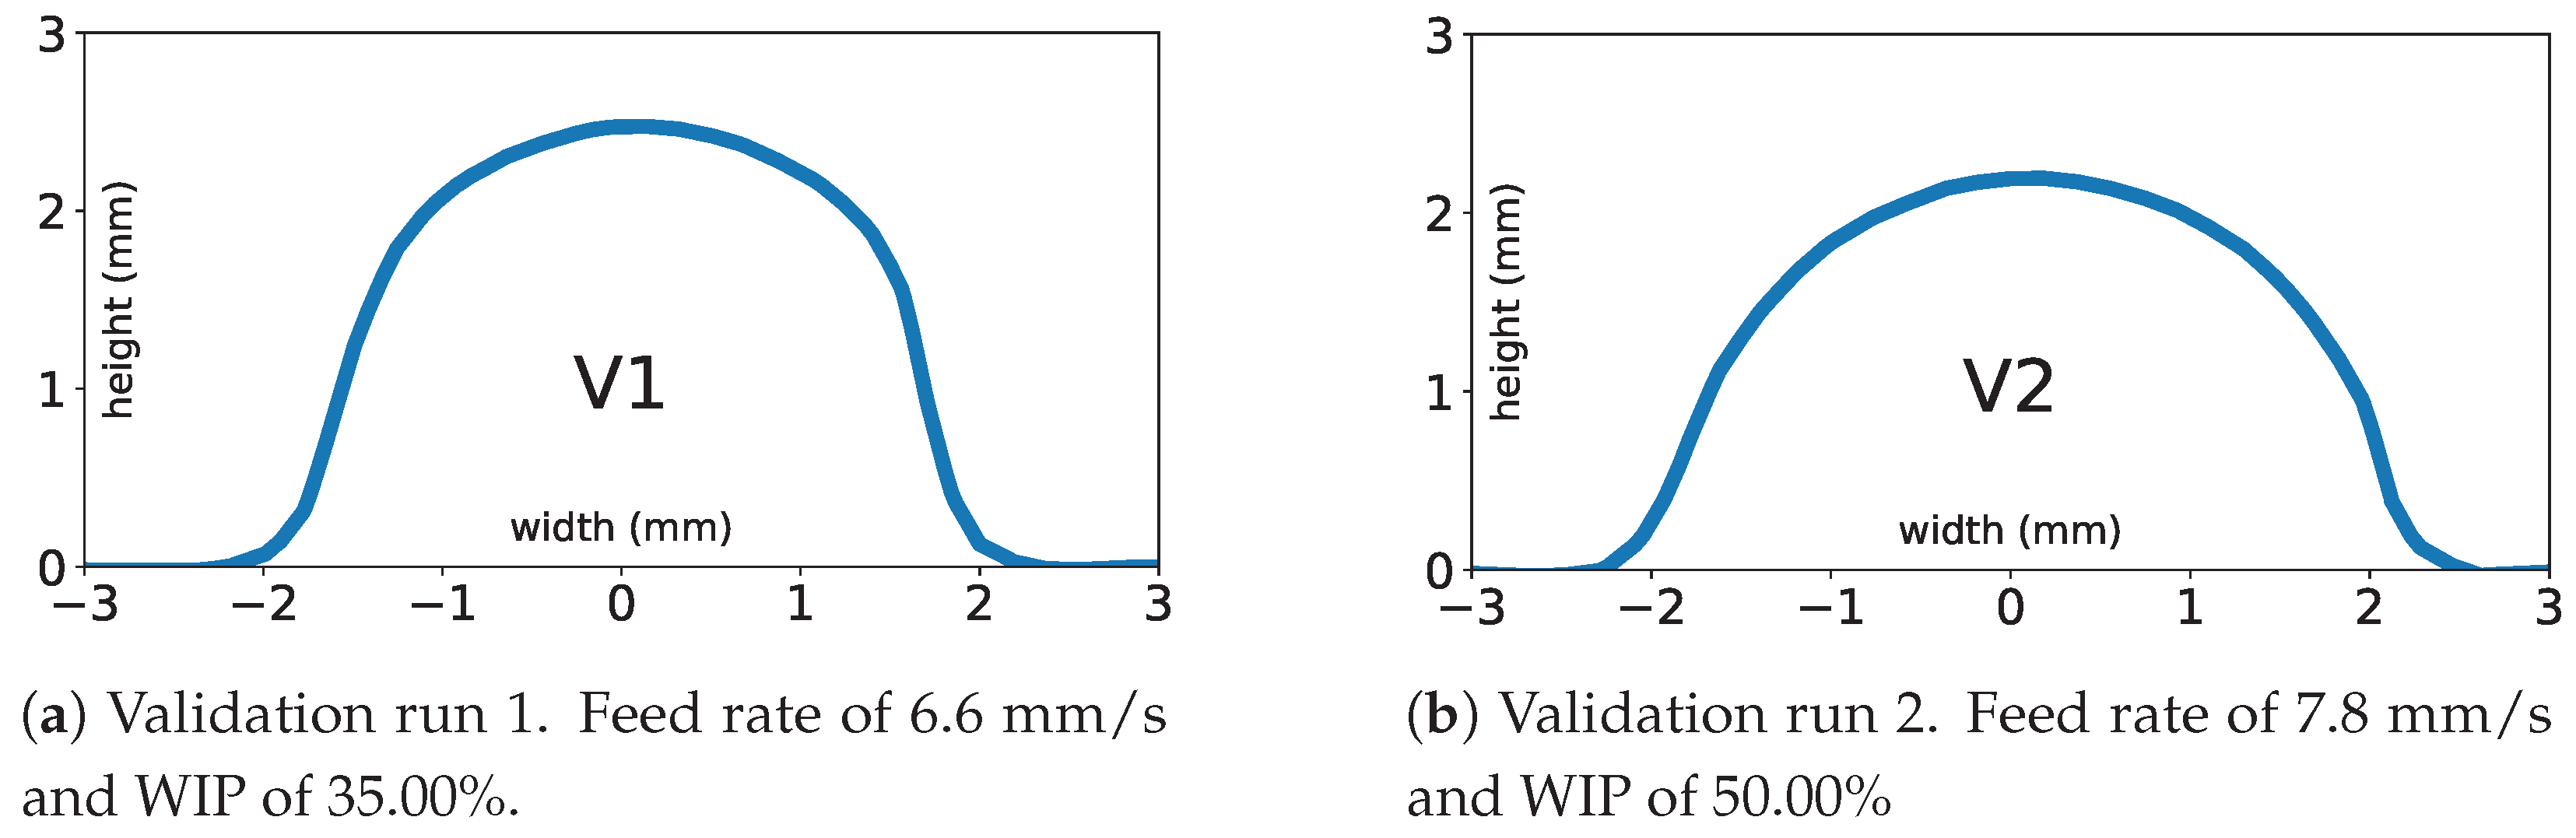
| TC | Feed (mm/s) | WFS (mm/s) | WIP (%) | LP (W) | AR 40% | AR 50% | AR 60% | Mean AR | Model AR |
|---|---|---|---|---|---|---|---|---|---|
| V1 | 6.6 | 42.5 | 35.00% | 1312 | 1.633 | 1.686 | 1.623 | 1.647 | 1.581 |
| V2 | 7.8 | 50.7 | 50.00% | 2035 | 2.129 | 2.068 | 2.080 | 2.092 | 2.002 |
Disclaimer/Publisher’s Note: The statements, opinions and data contained in all publications are solely those of the individual author(s) and contributor(s) and not of MDPI and/or the editor(s). MDPI and/or the editor(s) disclaim responsibility for any injury to people or property resulting from any ideas, methods, instructions or products referred to in the content. |
© 2024 by the authors. Licensee MDPI, Basel, Switzerland. This article is an open access article distributed under the terms and conditions of the Creative Commons Attribution (CC BY) license (https://creativecommons.org/licenses/by/4.0/).
Share and Cite
Mathenia, R.; Flood, A.; McLain, B.; Sparks, T.; Liou, F. Effects of Laser Defocusing on Bead Geometry in Coaxial Titanium Wire-Based Laser Metal Deposition. Materials 2024, 17, 889. https://doi.org/10.3390/ma17040889
Mathenia R, Flood A, McLain B, Sparks T, Liou F. Effects of Laser Defocusing on Bead Geometry in Coaxial Titanium Wire-Based Laser Metal Deposition. Materials. 2024; 17(4):889. https://doi.org/10.3390/ma17040889
Chicago/Turabian StyleMathenia, Remy, Aaron Flood, Braden McLain, Todd Sparks, and Frank Liou. 2024. "Effects of Laser Defocusing on Bead Geometry in Coaxial Titanium Wire-Based Laser Metal Deposition" Materials 17, no. 4: 889. https://doi.org/10.3390/ma17040889
APA StyleMathenia, R., Flood, A., McLain, B., Sparks, T., & Liou, F. (2024). Effects of Laser Defocusing on Bead Geometry in Coaxial Titanium Wire-Based Laser Metal Deposition. Materials, 17(4), 889. https://doi.org/10.3390/ma17040889