
The Effect of Doping on the Electrical and Dielectric Properties of Hydroxyapatite for Medical Applications: From Powders to Thin Films


Abstract
1. Introduction
2. Literature Survey
3. Cation- and Anion-Substituted Hydroxyapatite
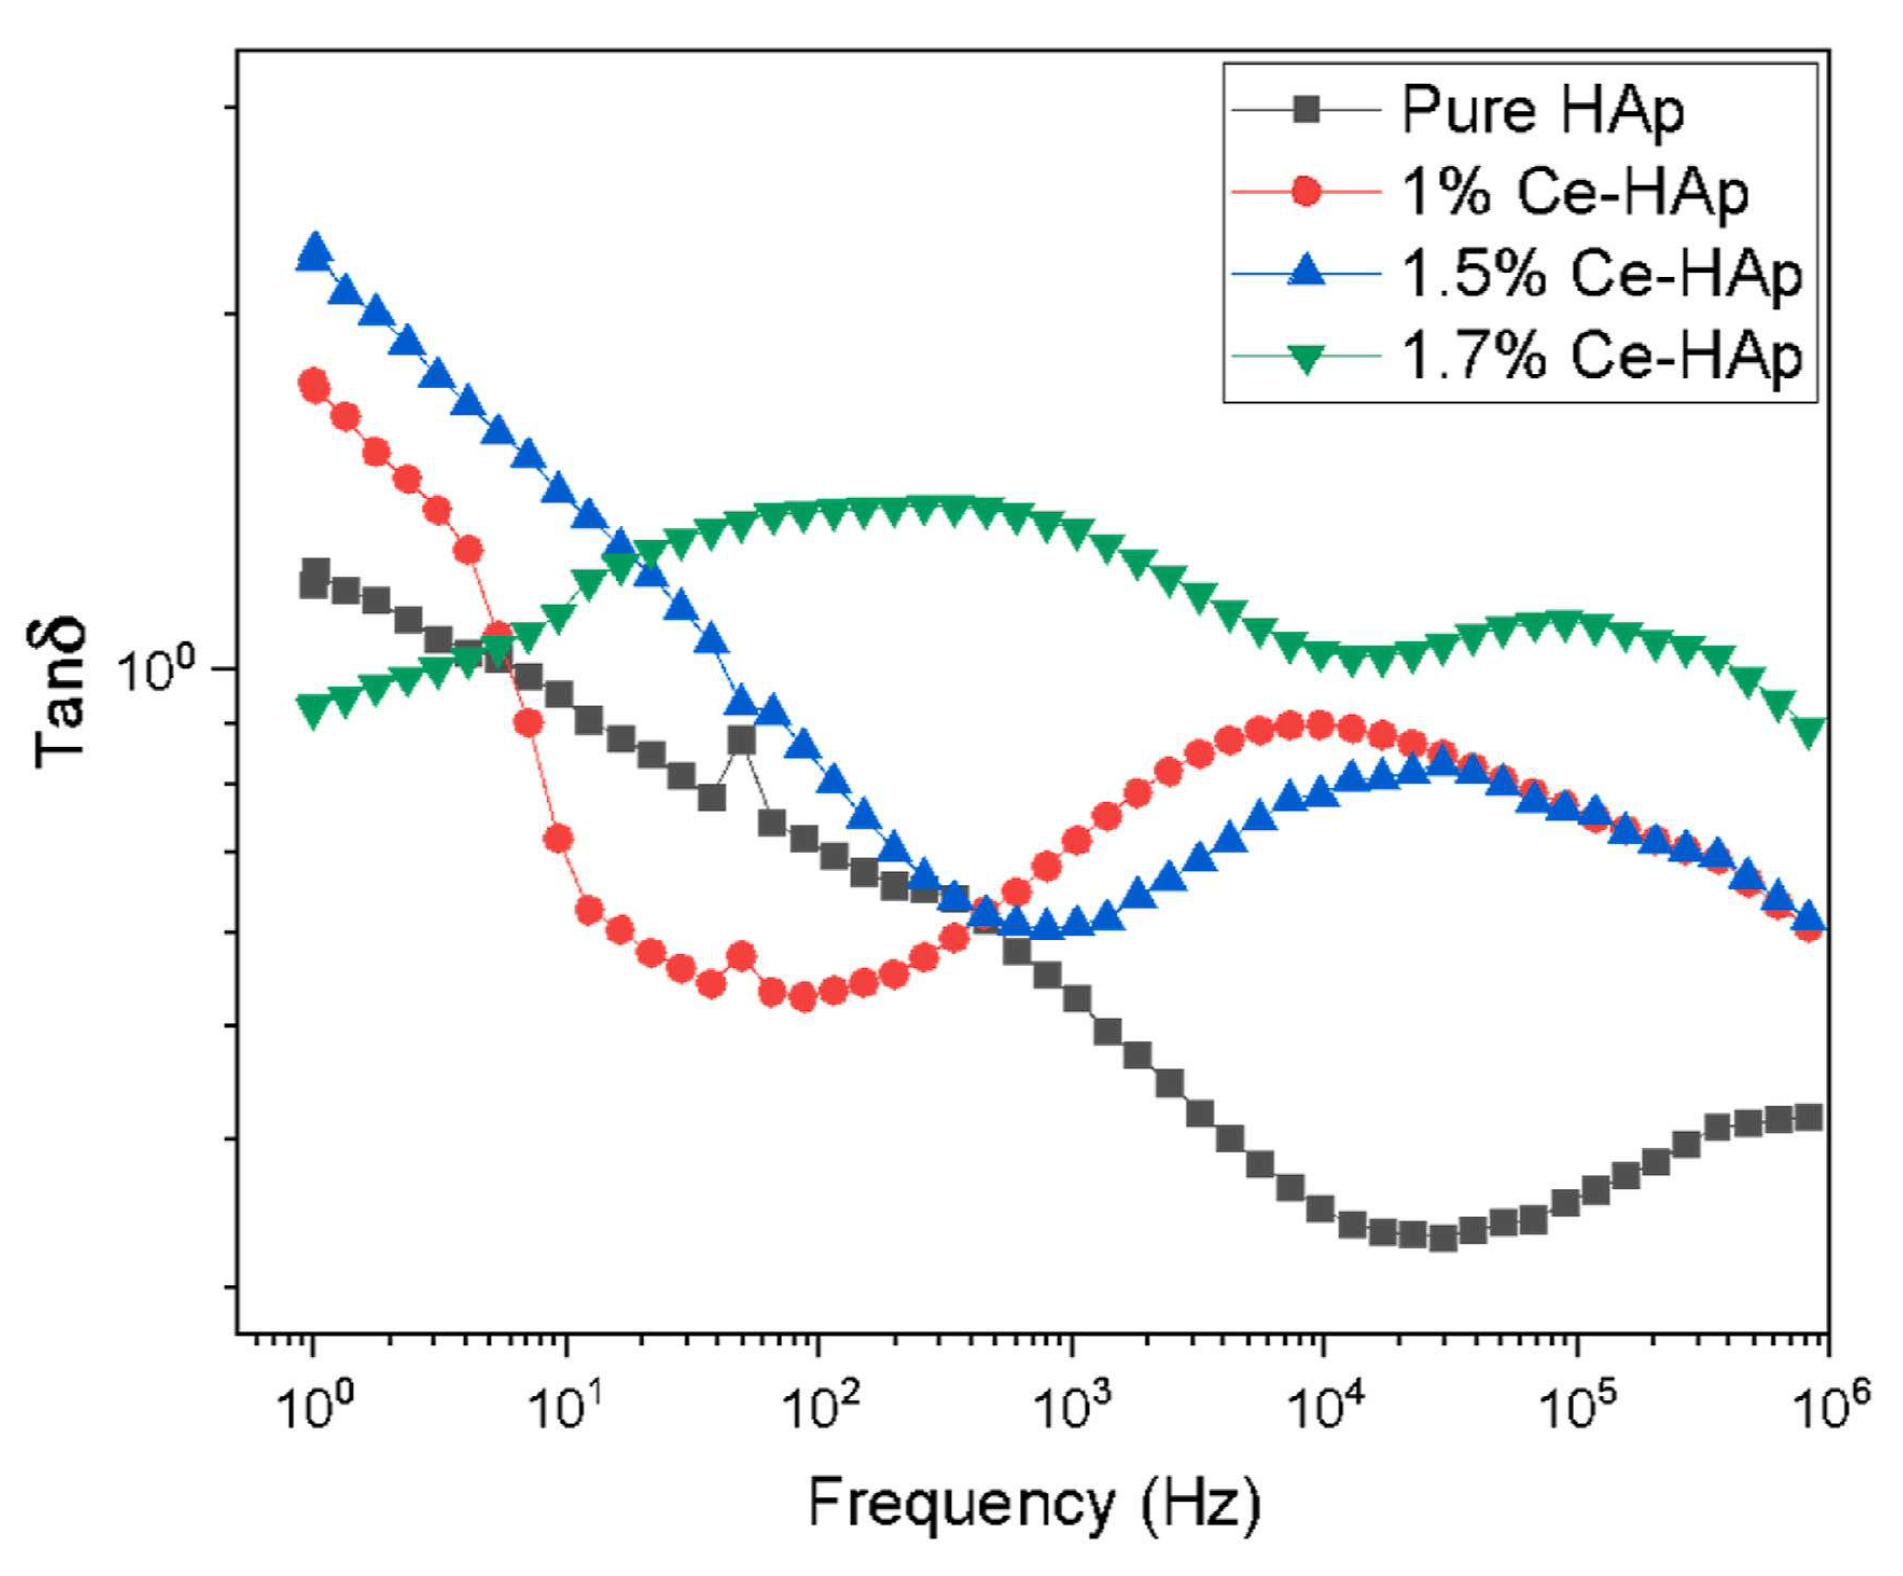
3.1. Cerium
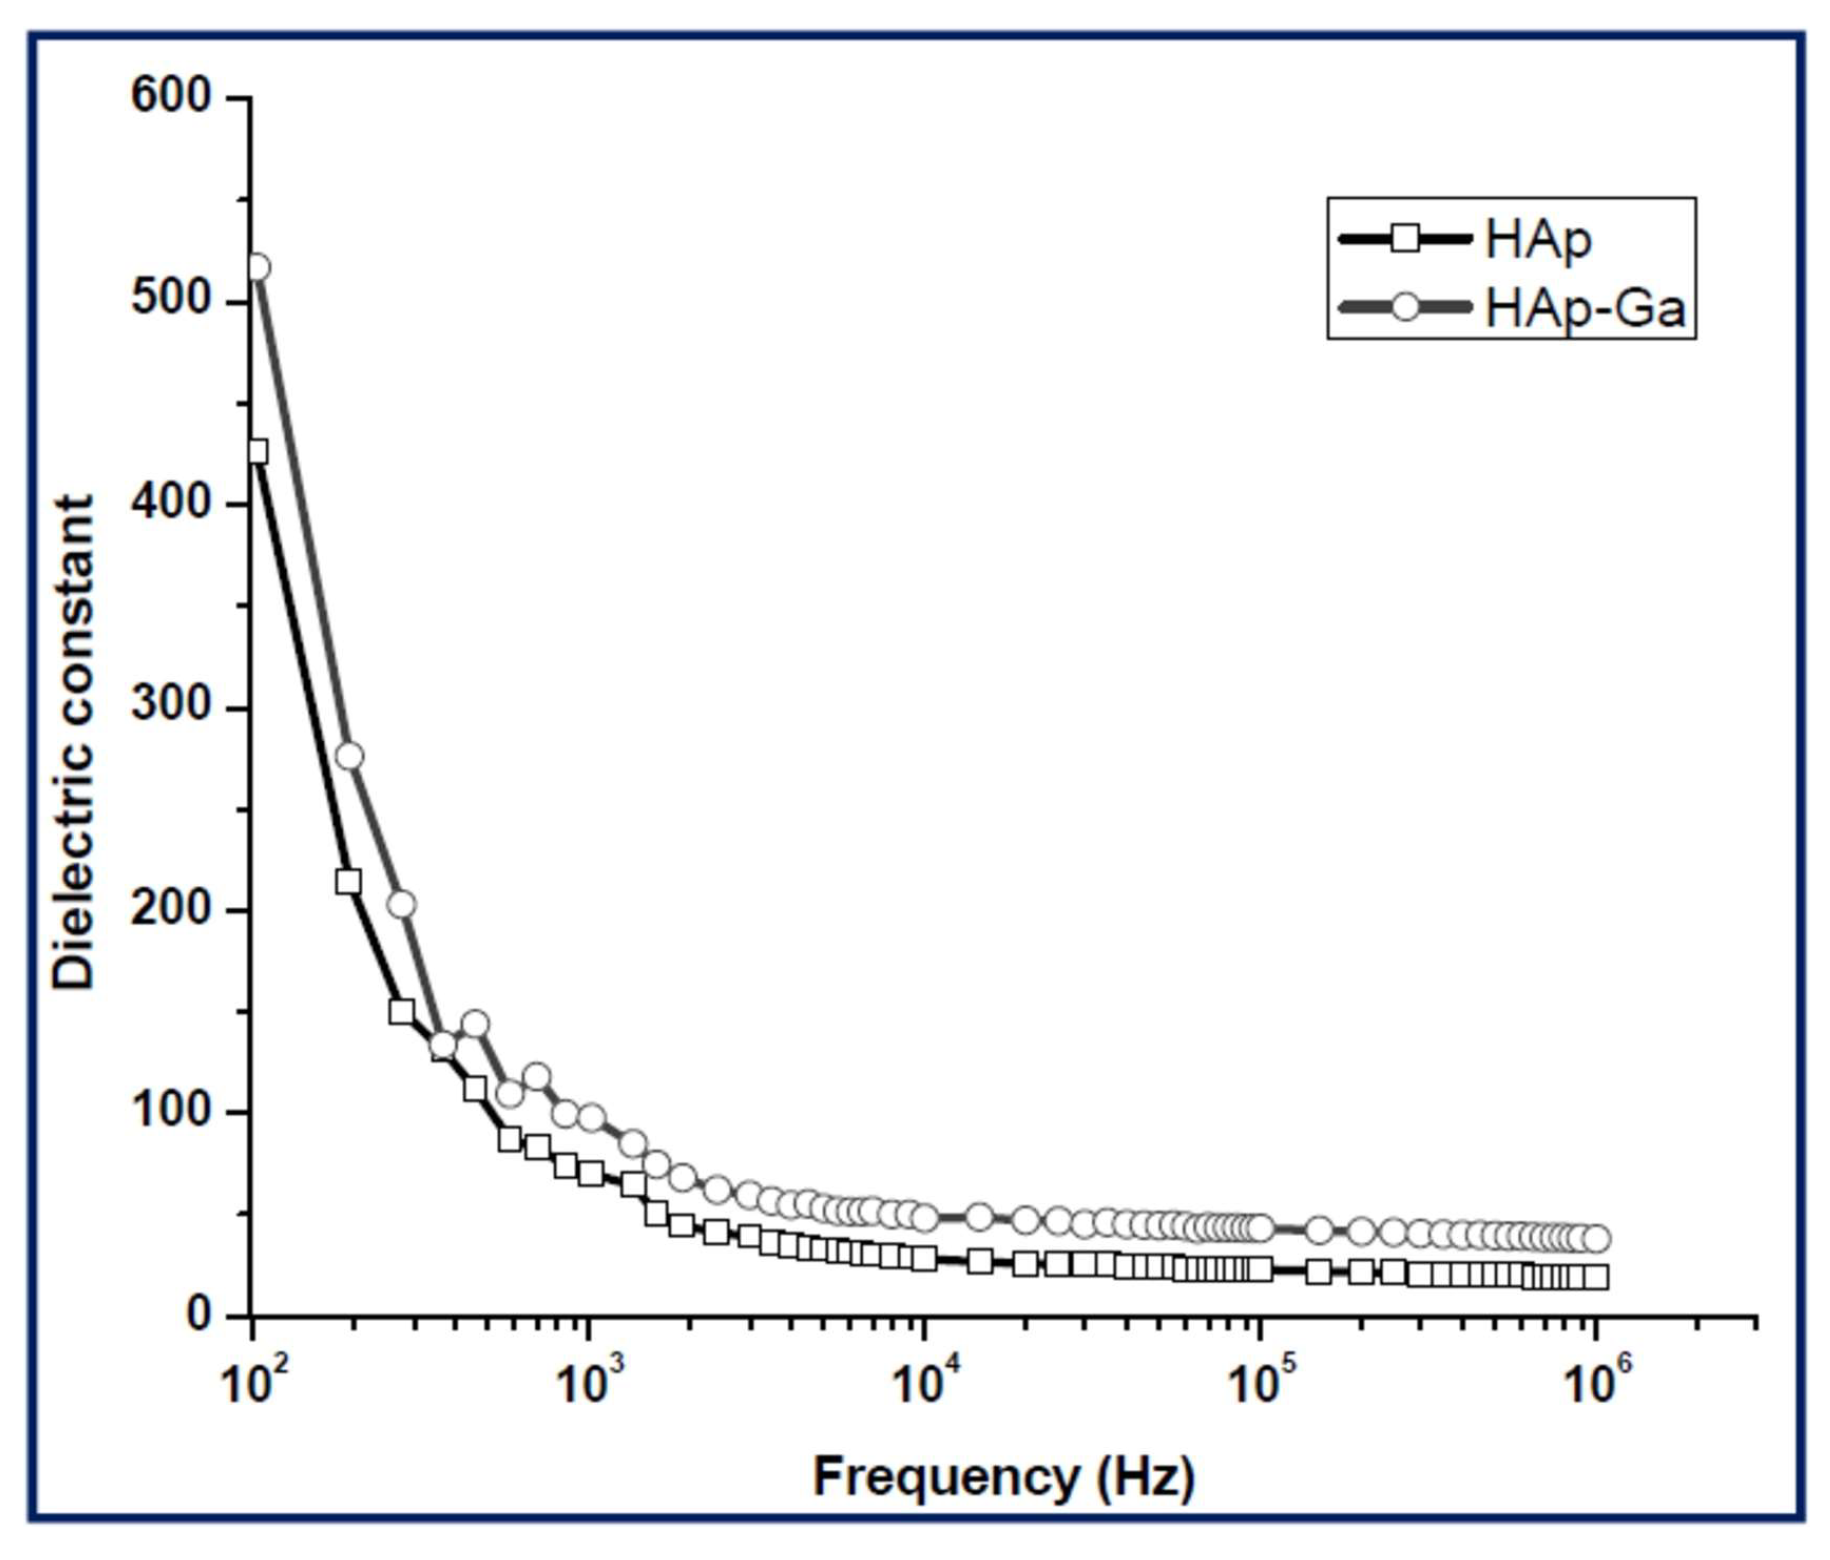
3.2. Gallium
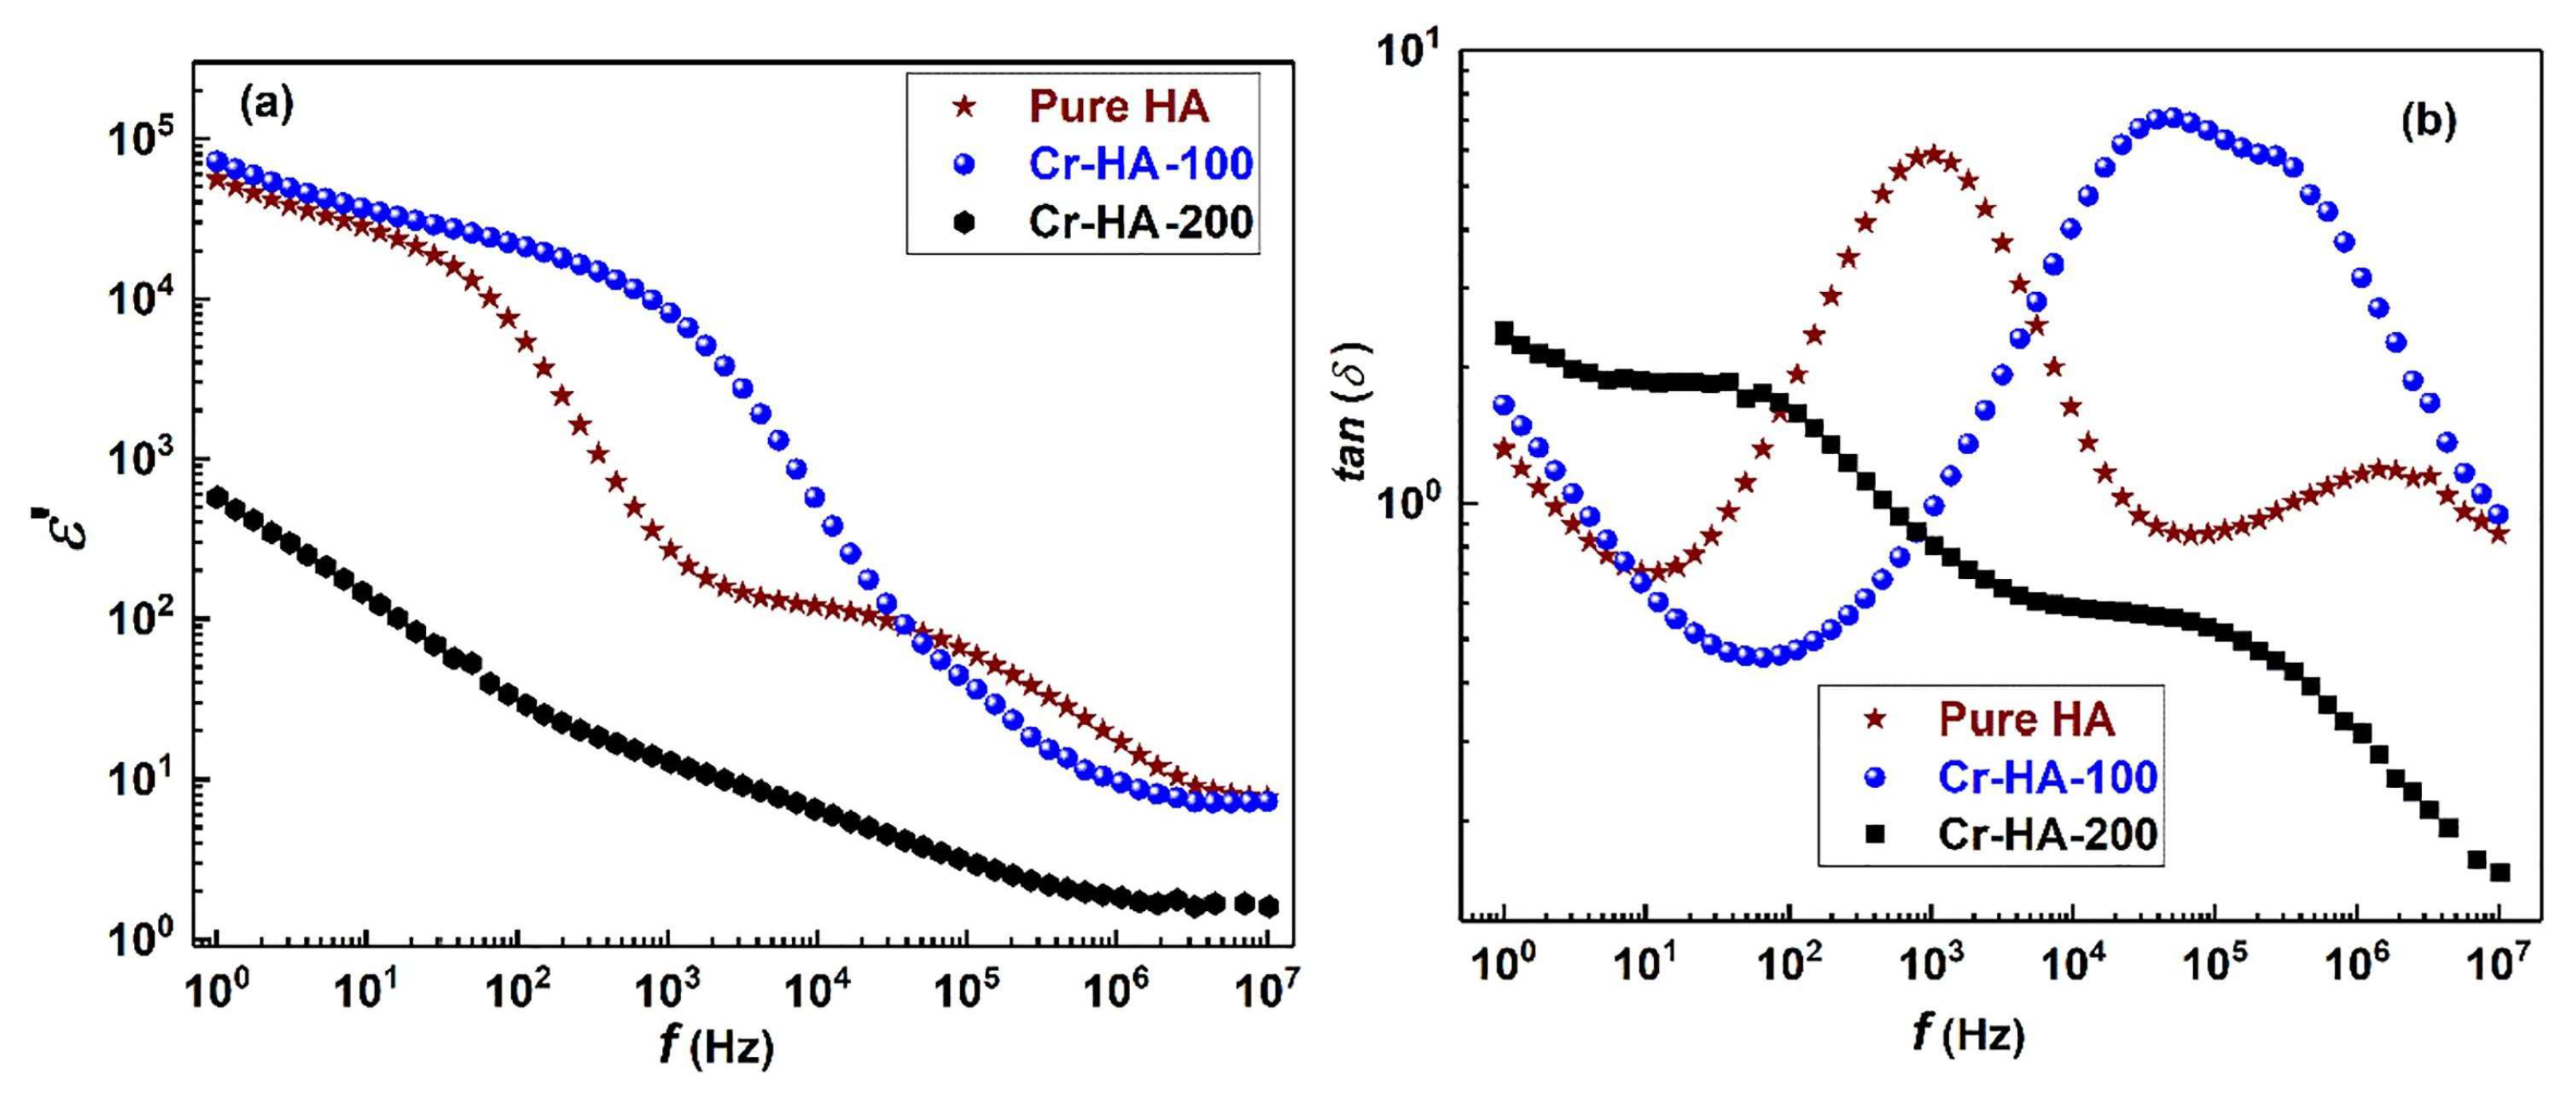
3.3. Chromium
3.4. Barium Titanate/Barium Strontium Titanate
3.5. Zinc
3.6. Silver
3.7. Magnesium
3.8. Strontium
3.9. Vanadium
3.10. Copper/Copper Oxide
3.11. Nickel
3.12. Tantalum Pentoxide
3.13. Alumina
3.14. Lithium
3.15. Iron
4. Polymer/Hydroxyapatite Blends
4.1. Polymethylmethacrylate
4.2. Polyvinyl Alcohol/Carboxymethyl Cellulose
4.3. Chitosan
4.4. Conductive Polymers
5. Electrical and Dielectric Properties
5.1. Impedance
5.2. Conductivity
5.3. Dielectric Analysis
5.4. Permittivity
5.5. Simple and Doped Hydroxyapatite Powders/Nanoparticles
5.5.1. Impedance Spectroscopy
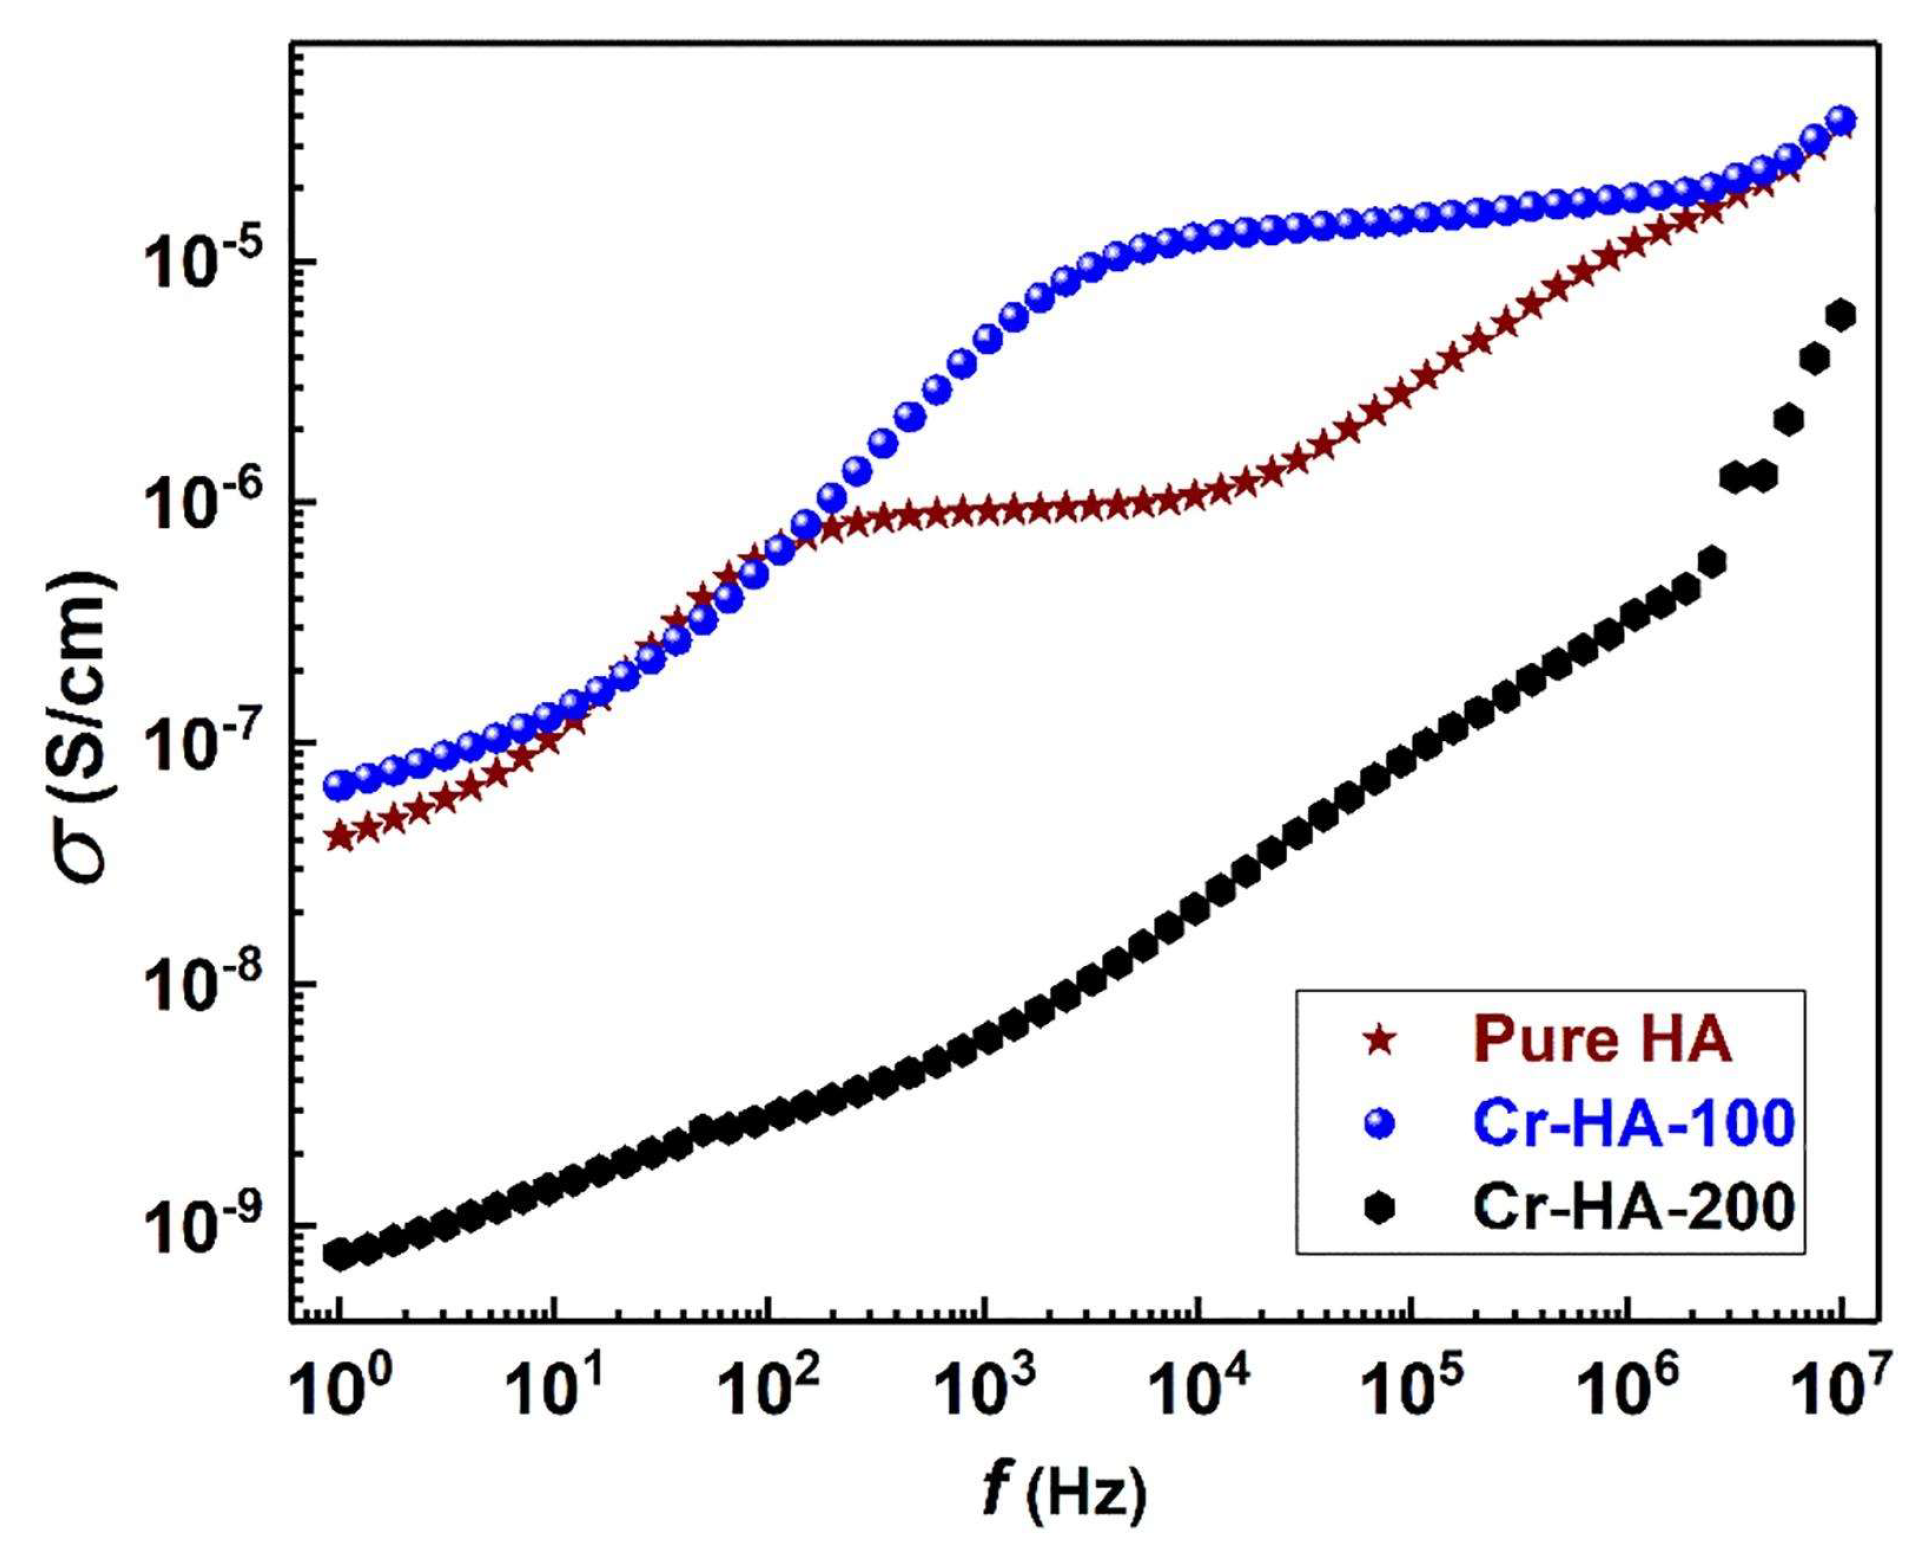
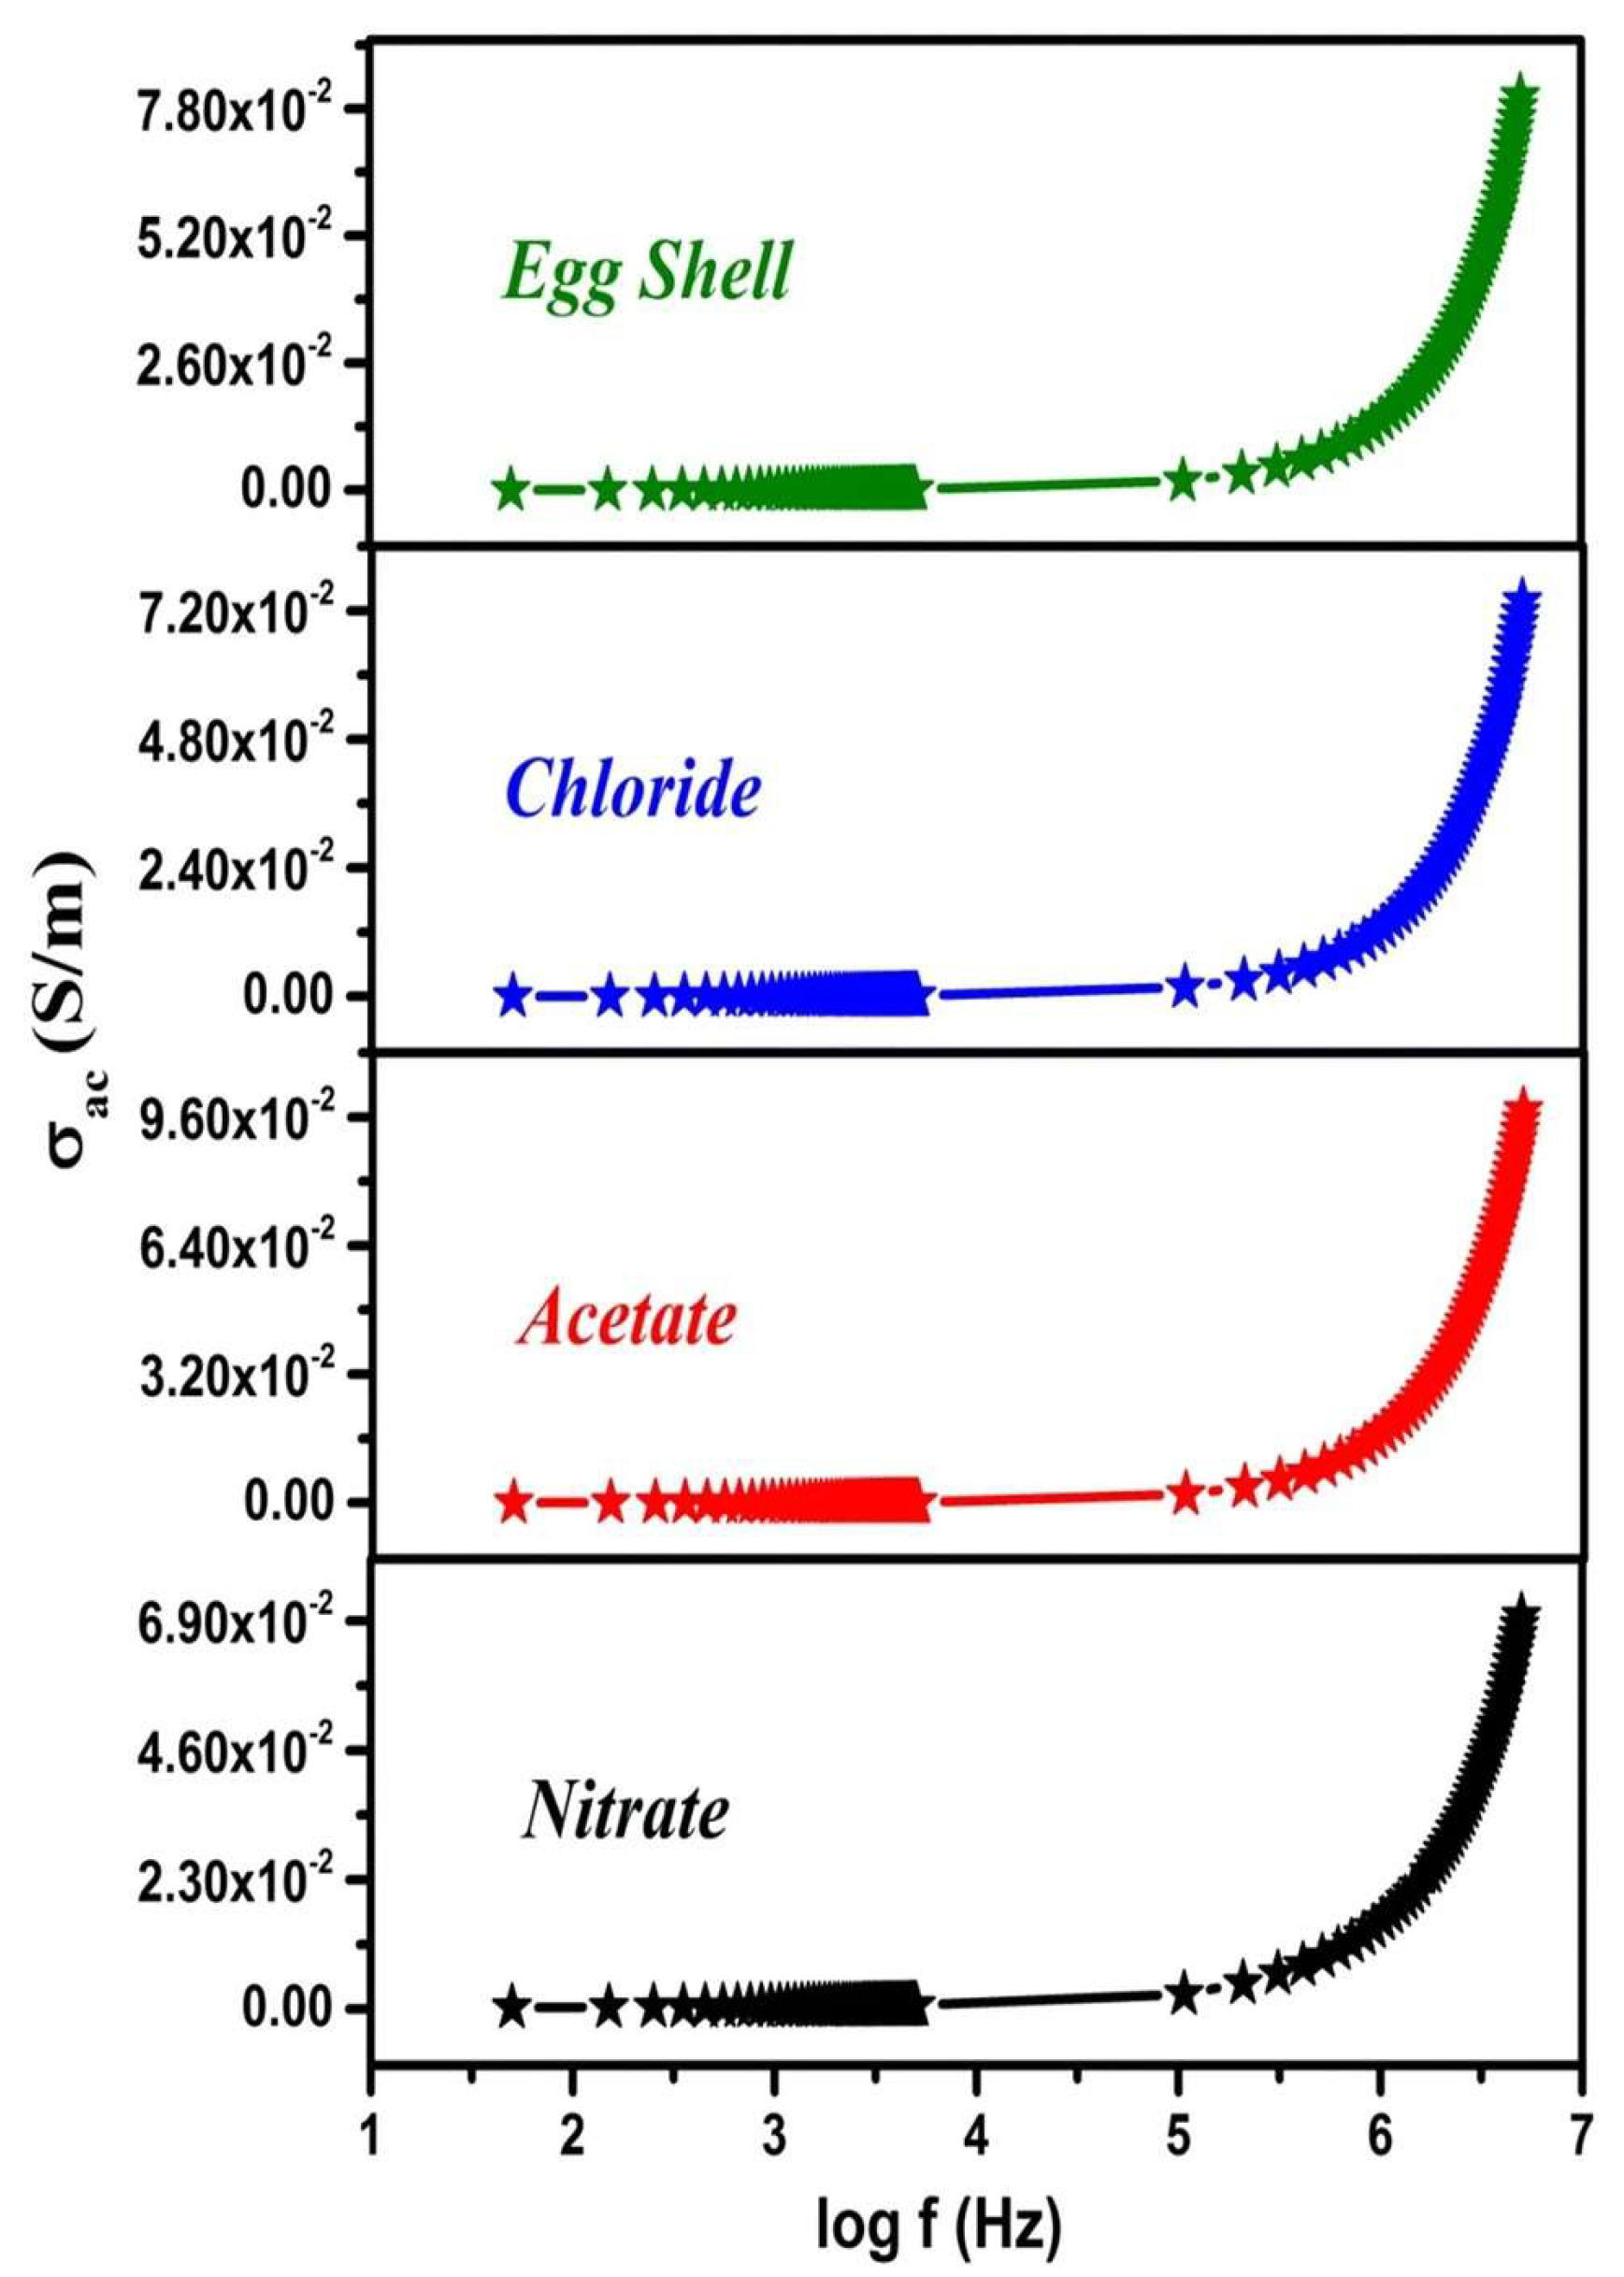
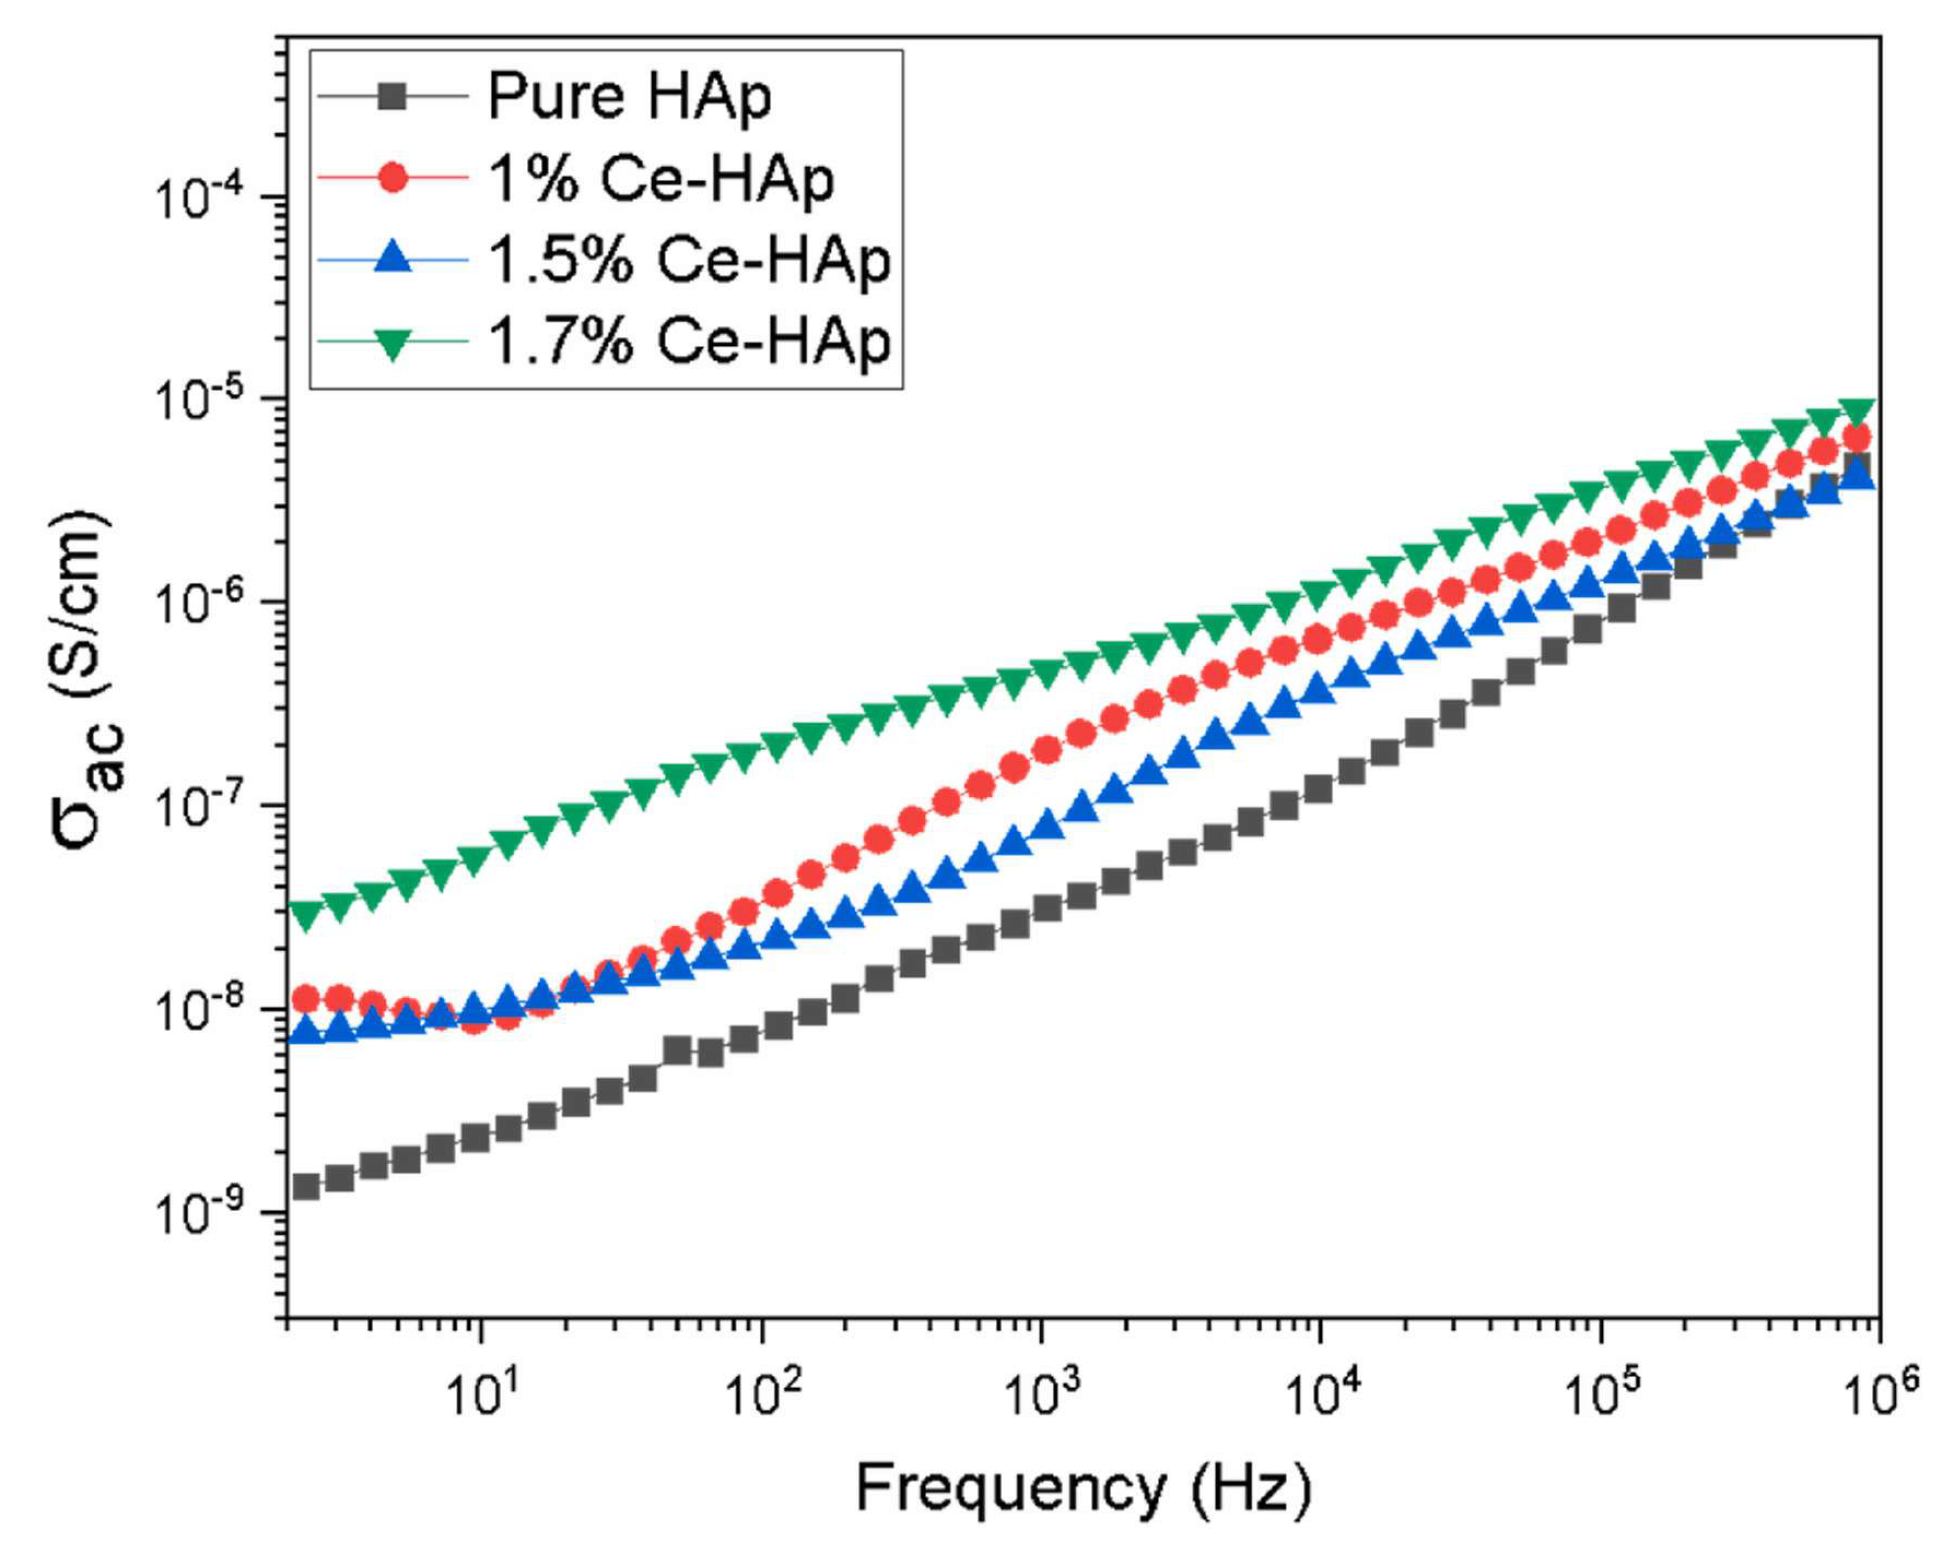
5.5.2. AC Conductivity
5.5.3. Dielectric Analysis
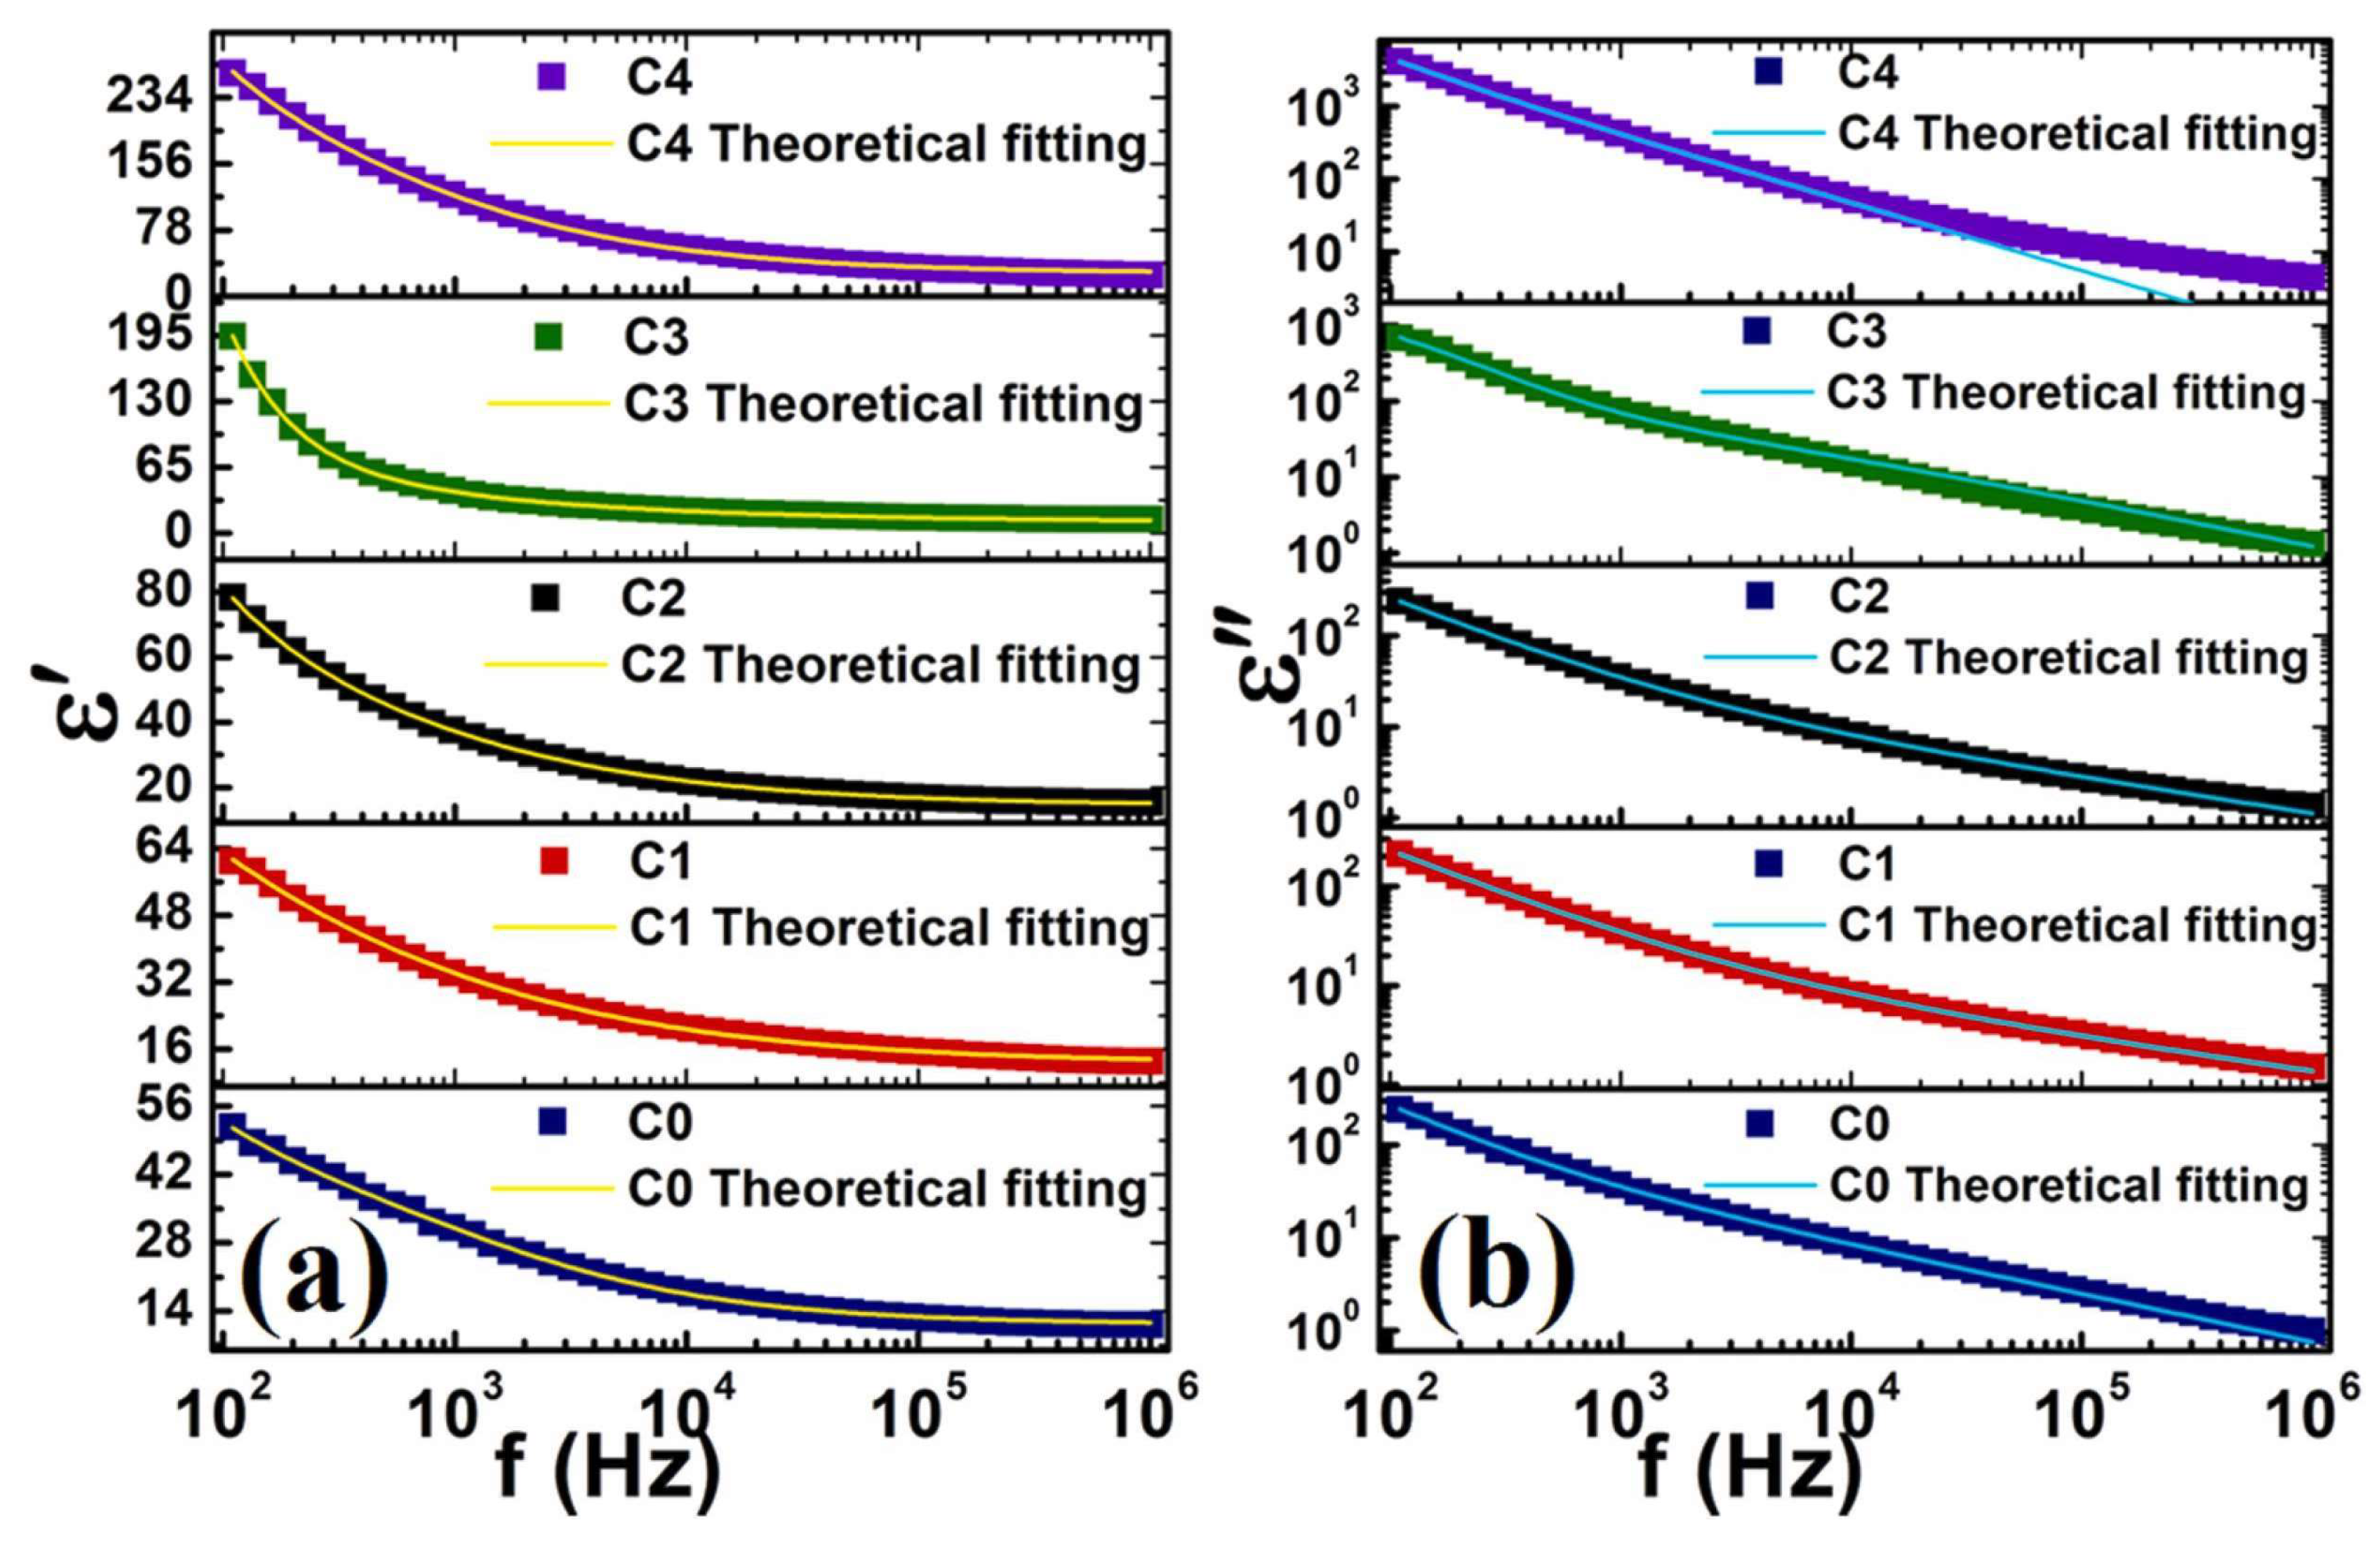
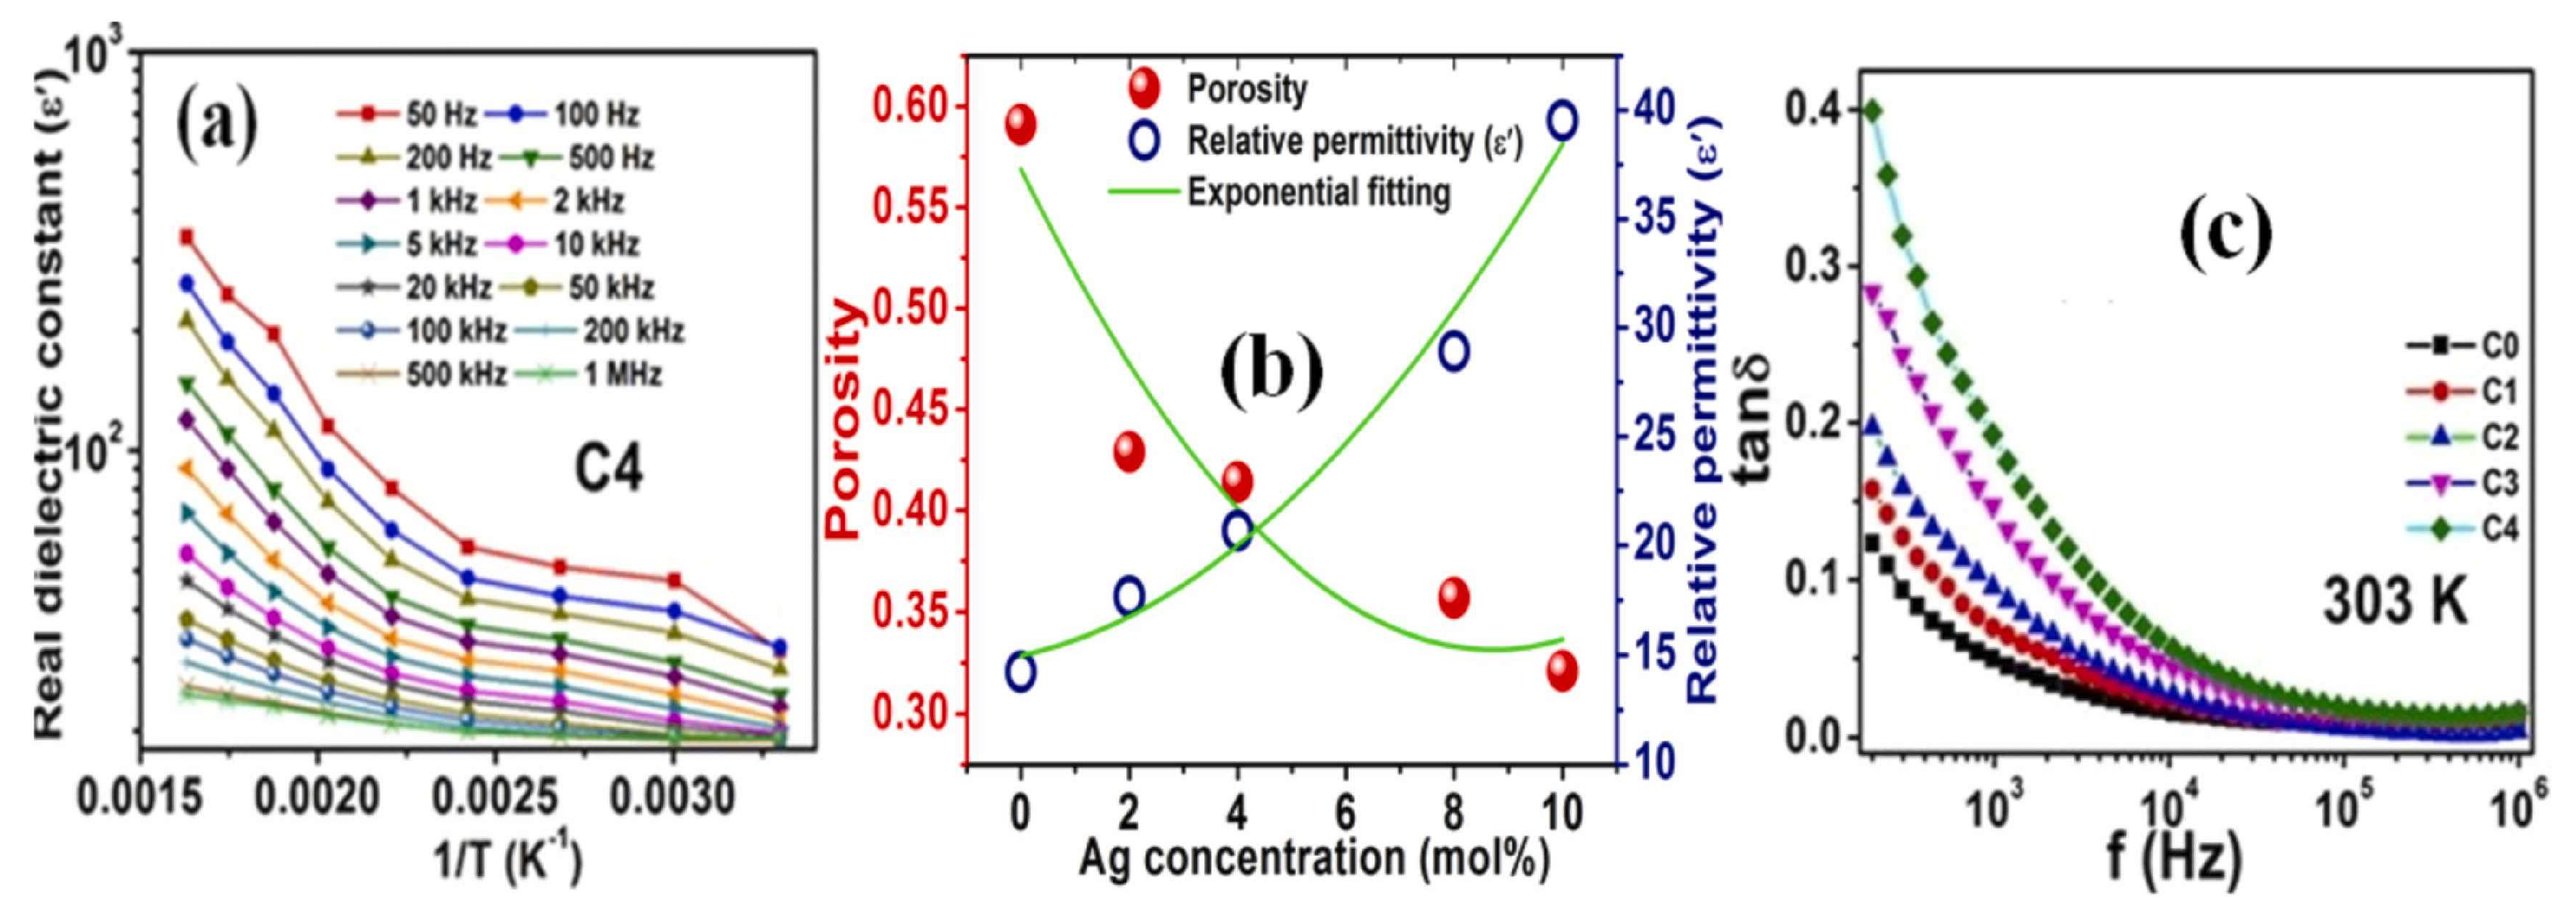
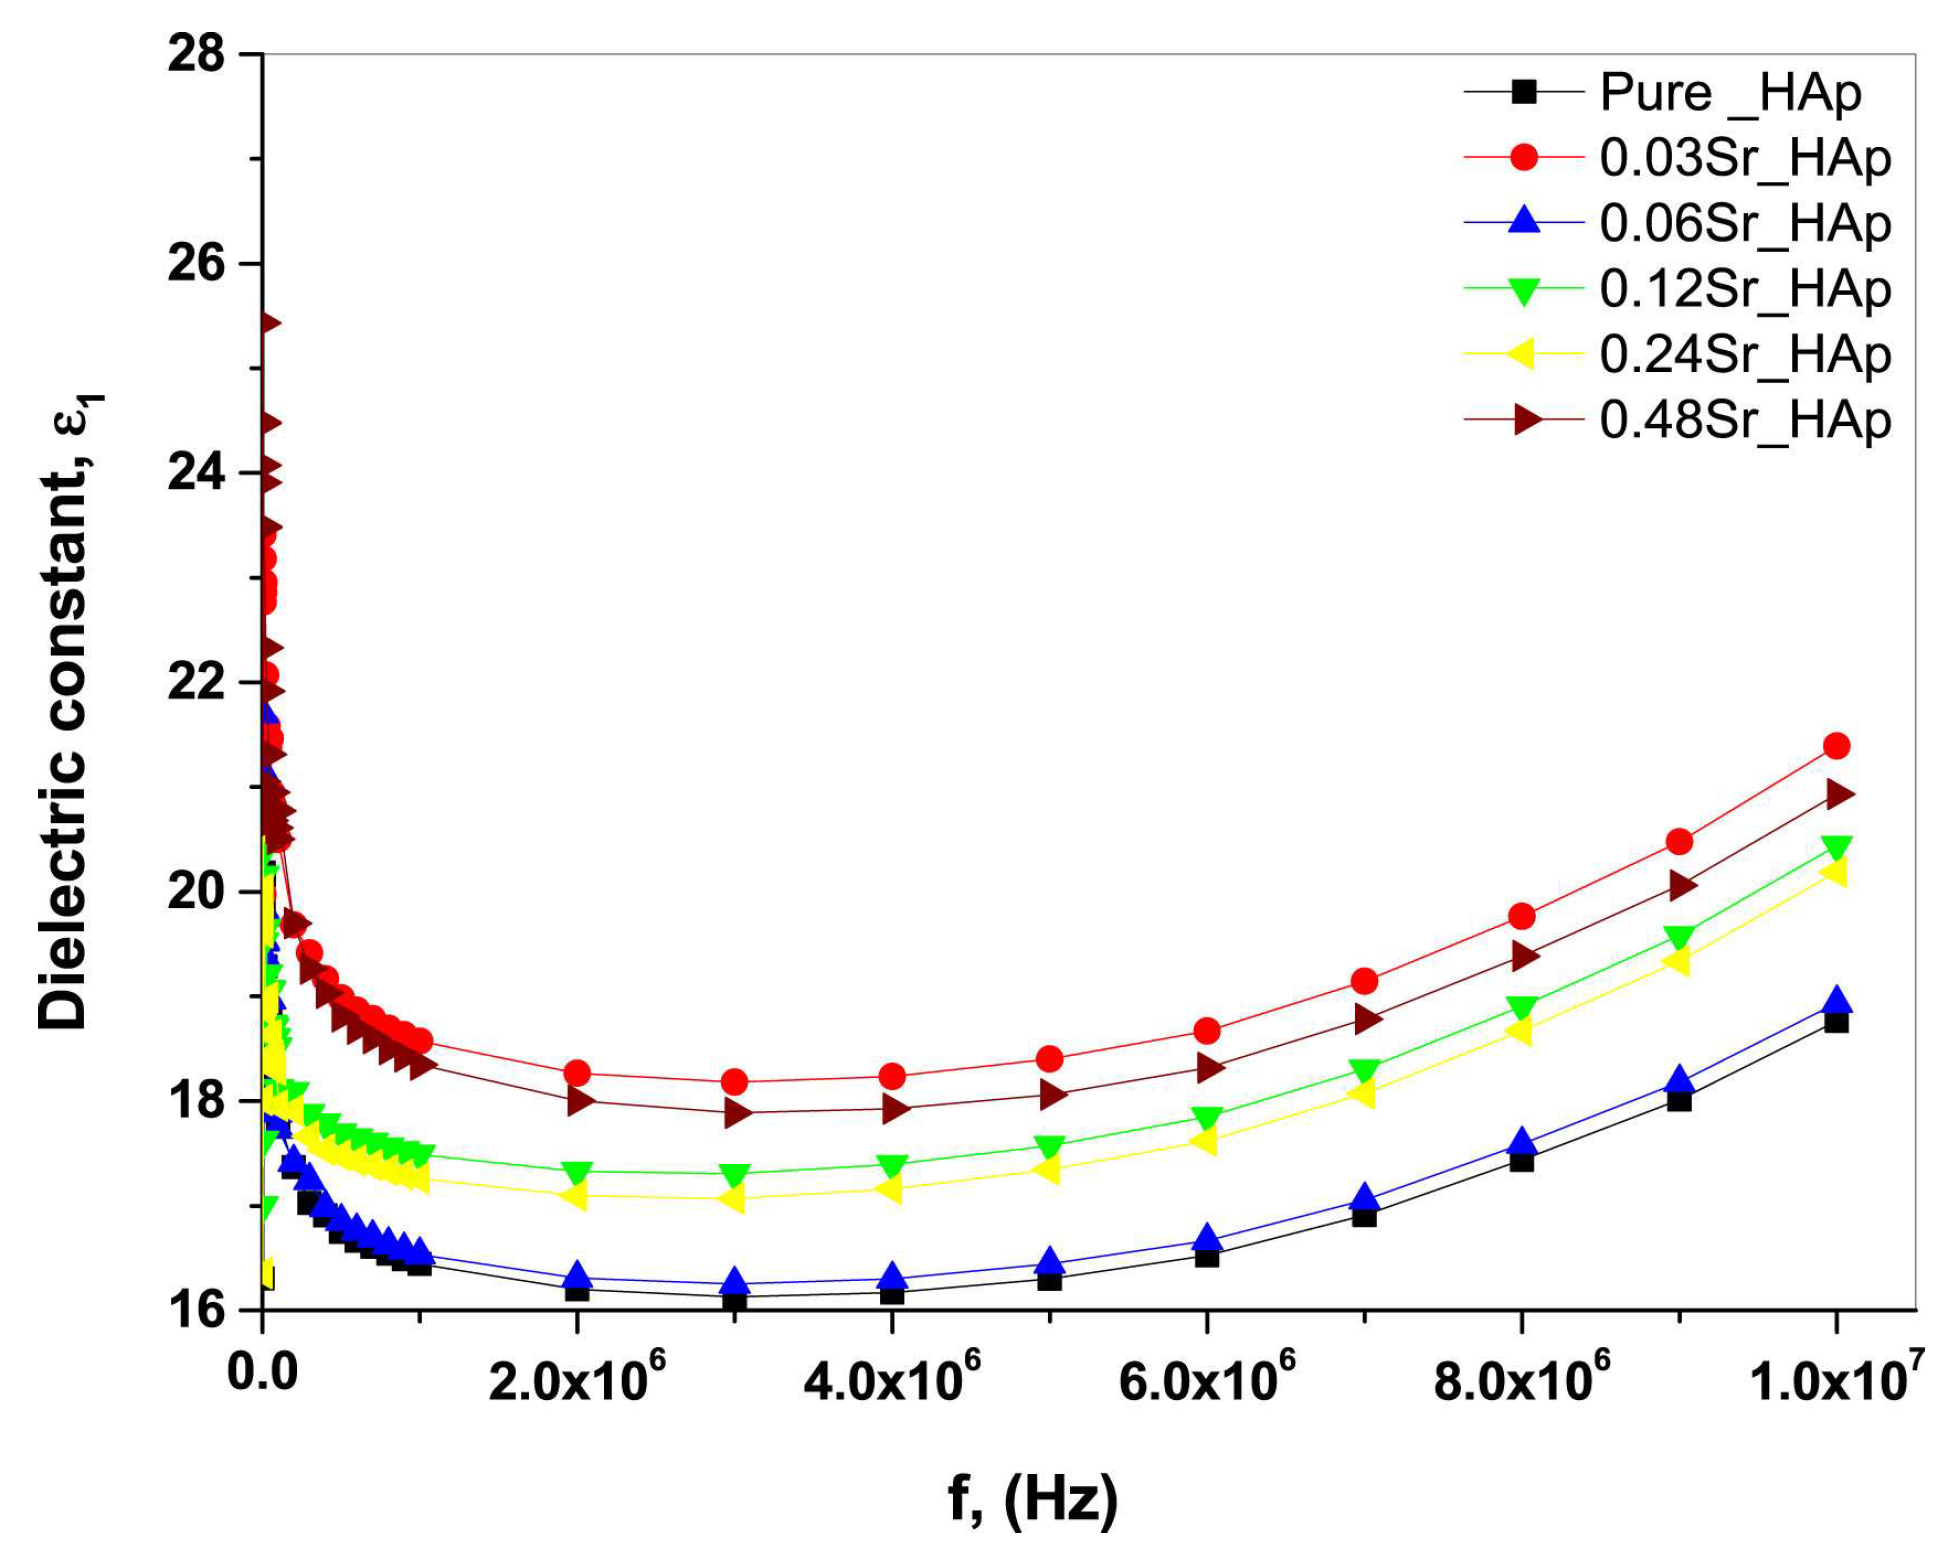
Dielectric Constant
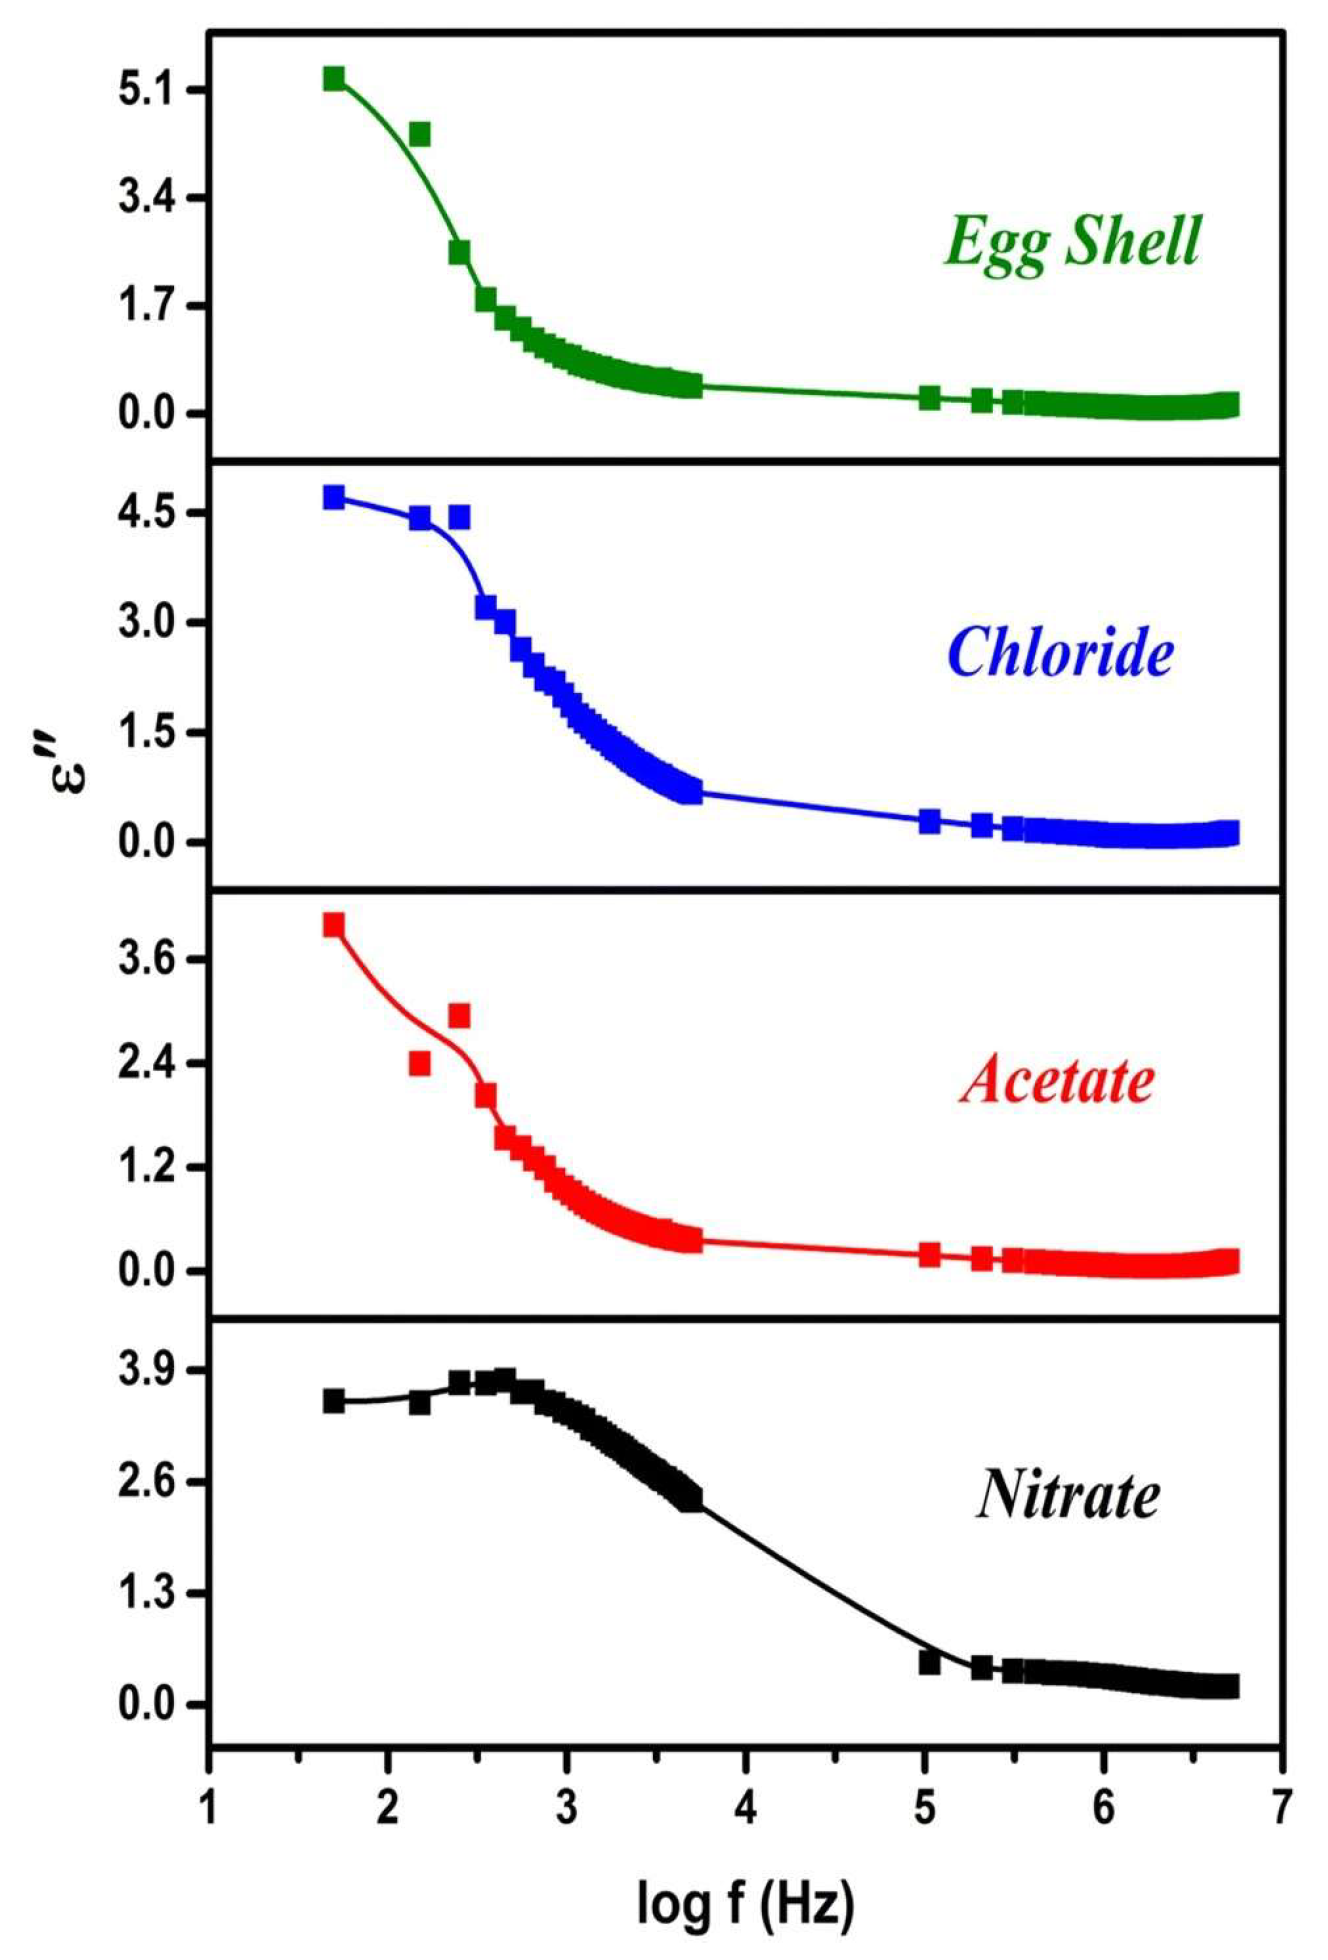
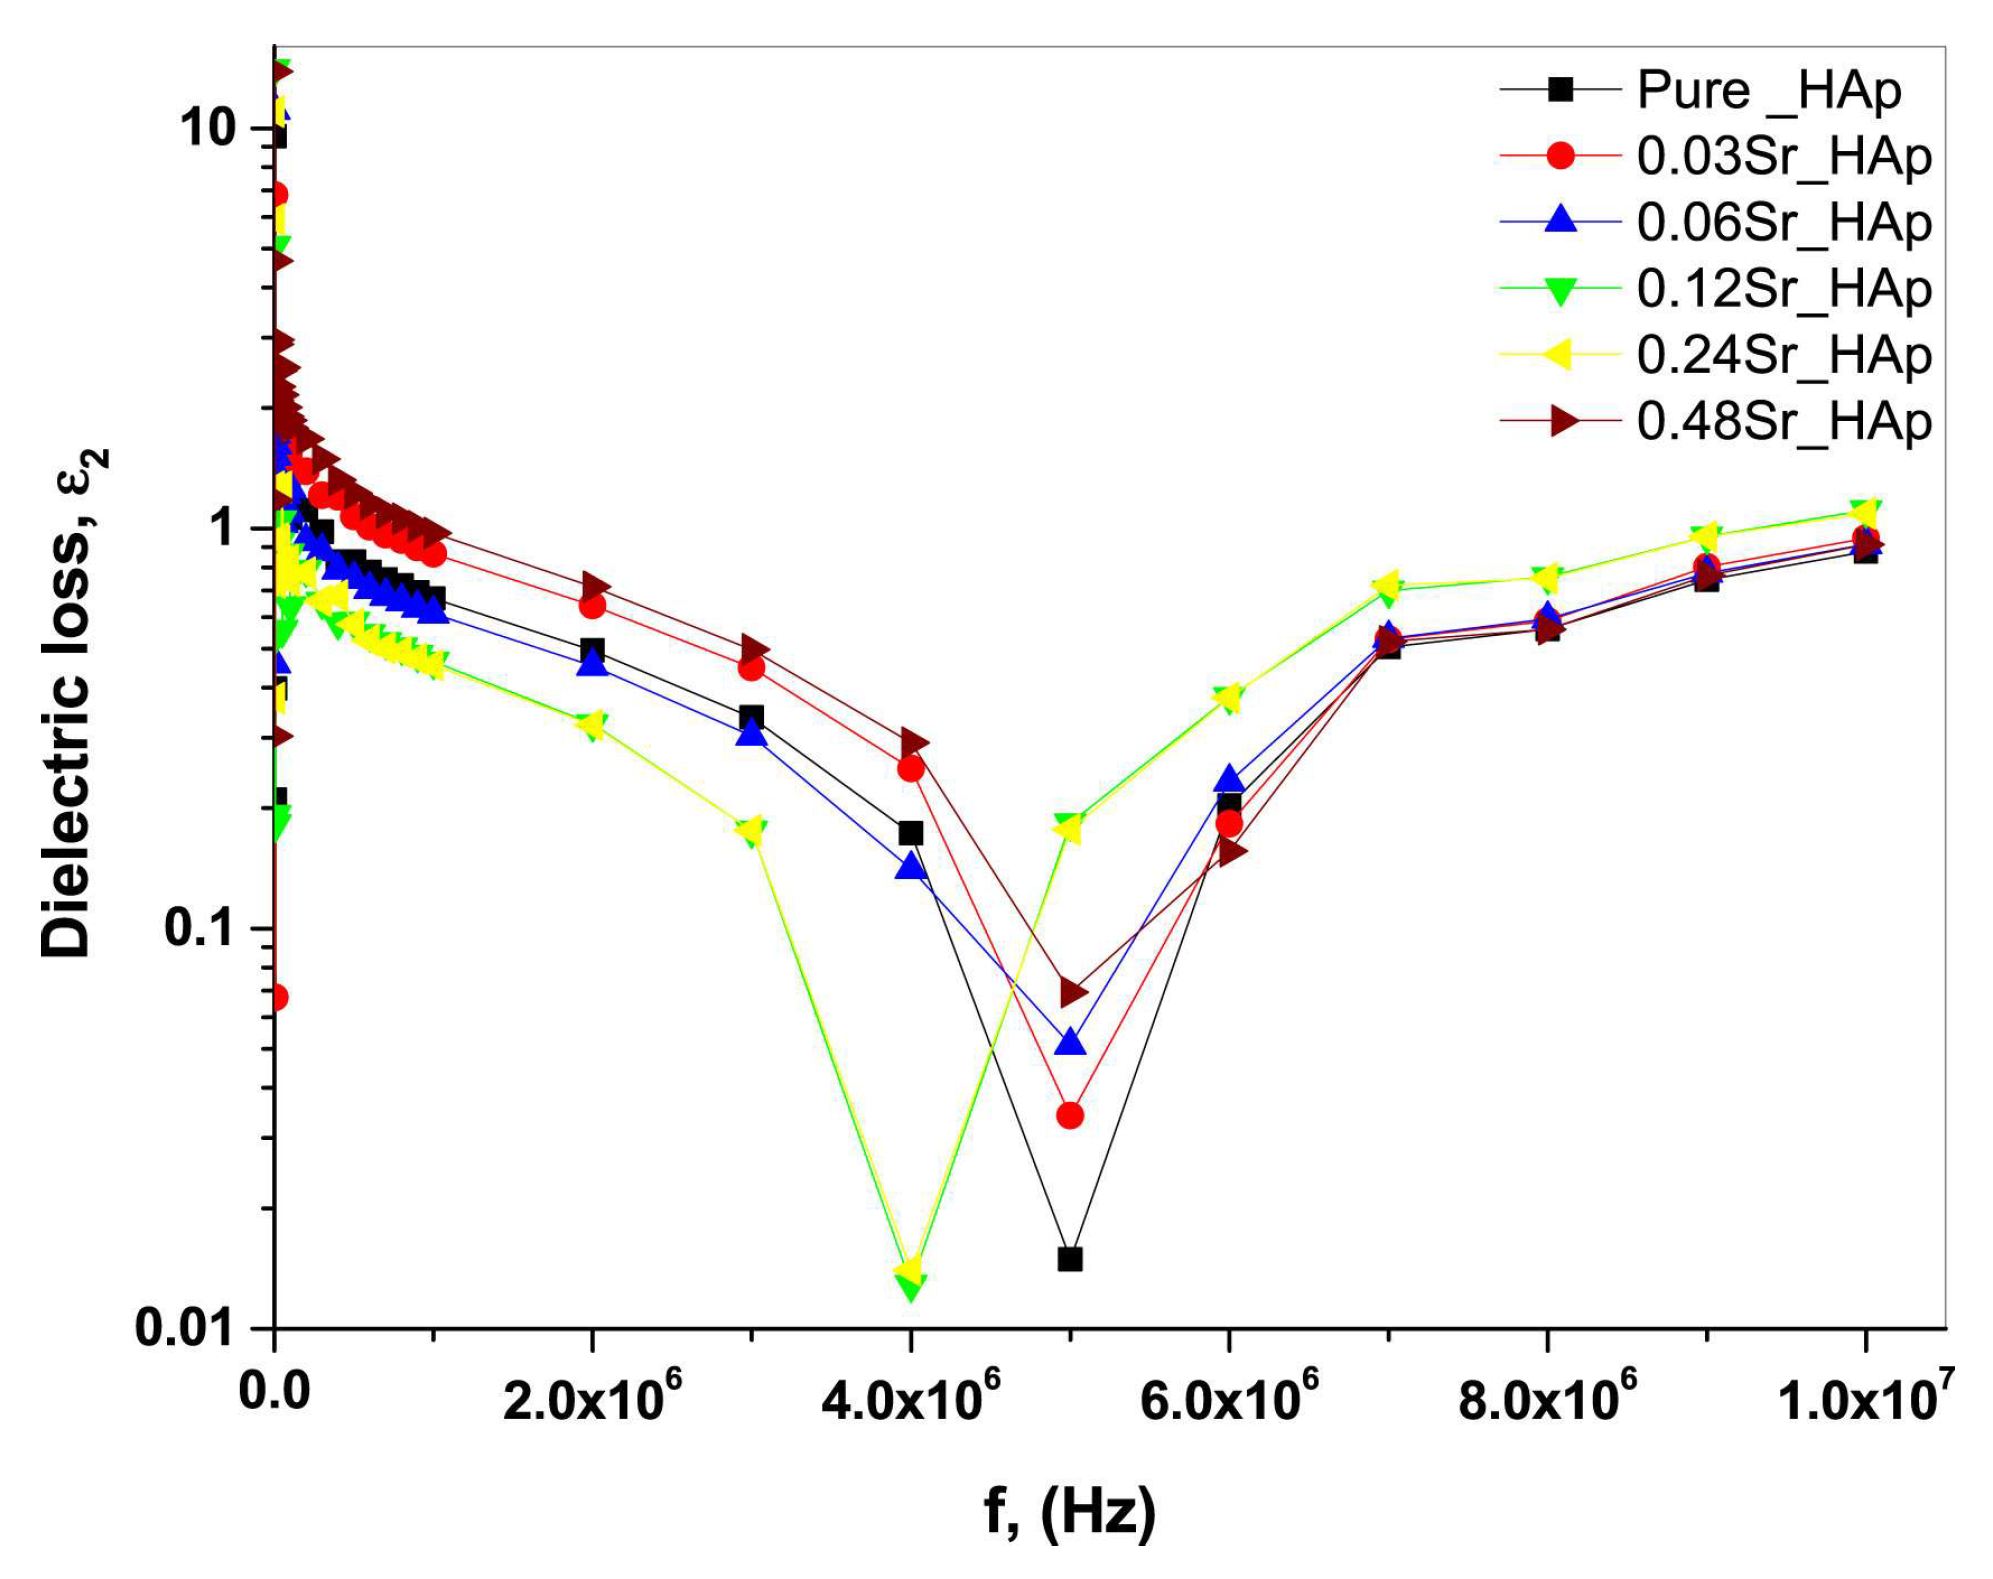
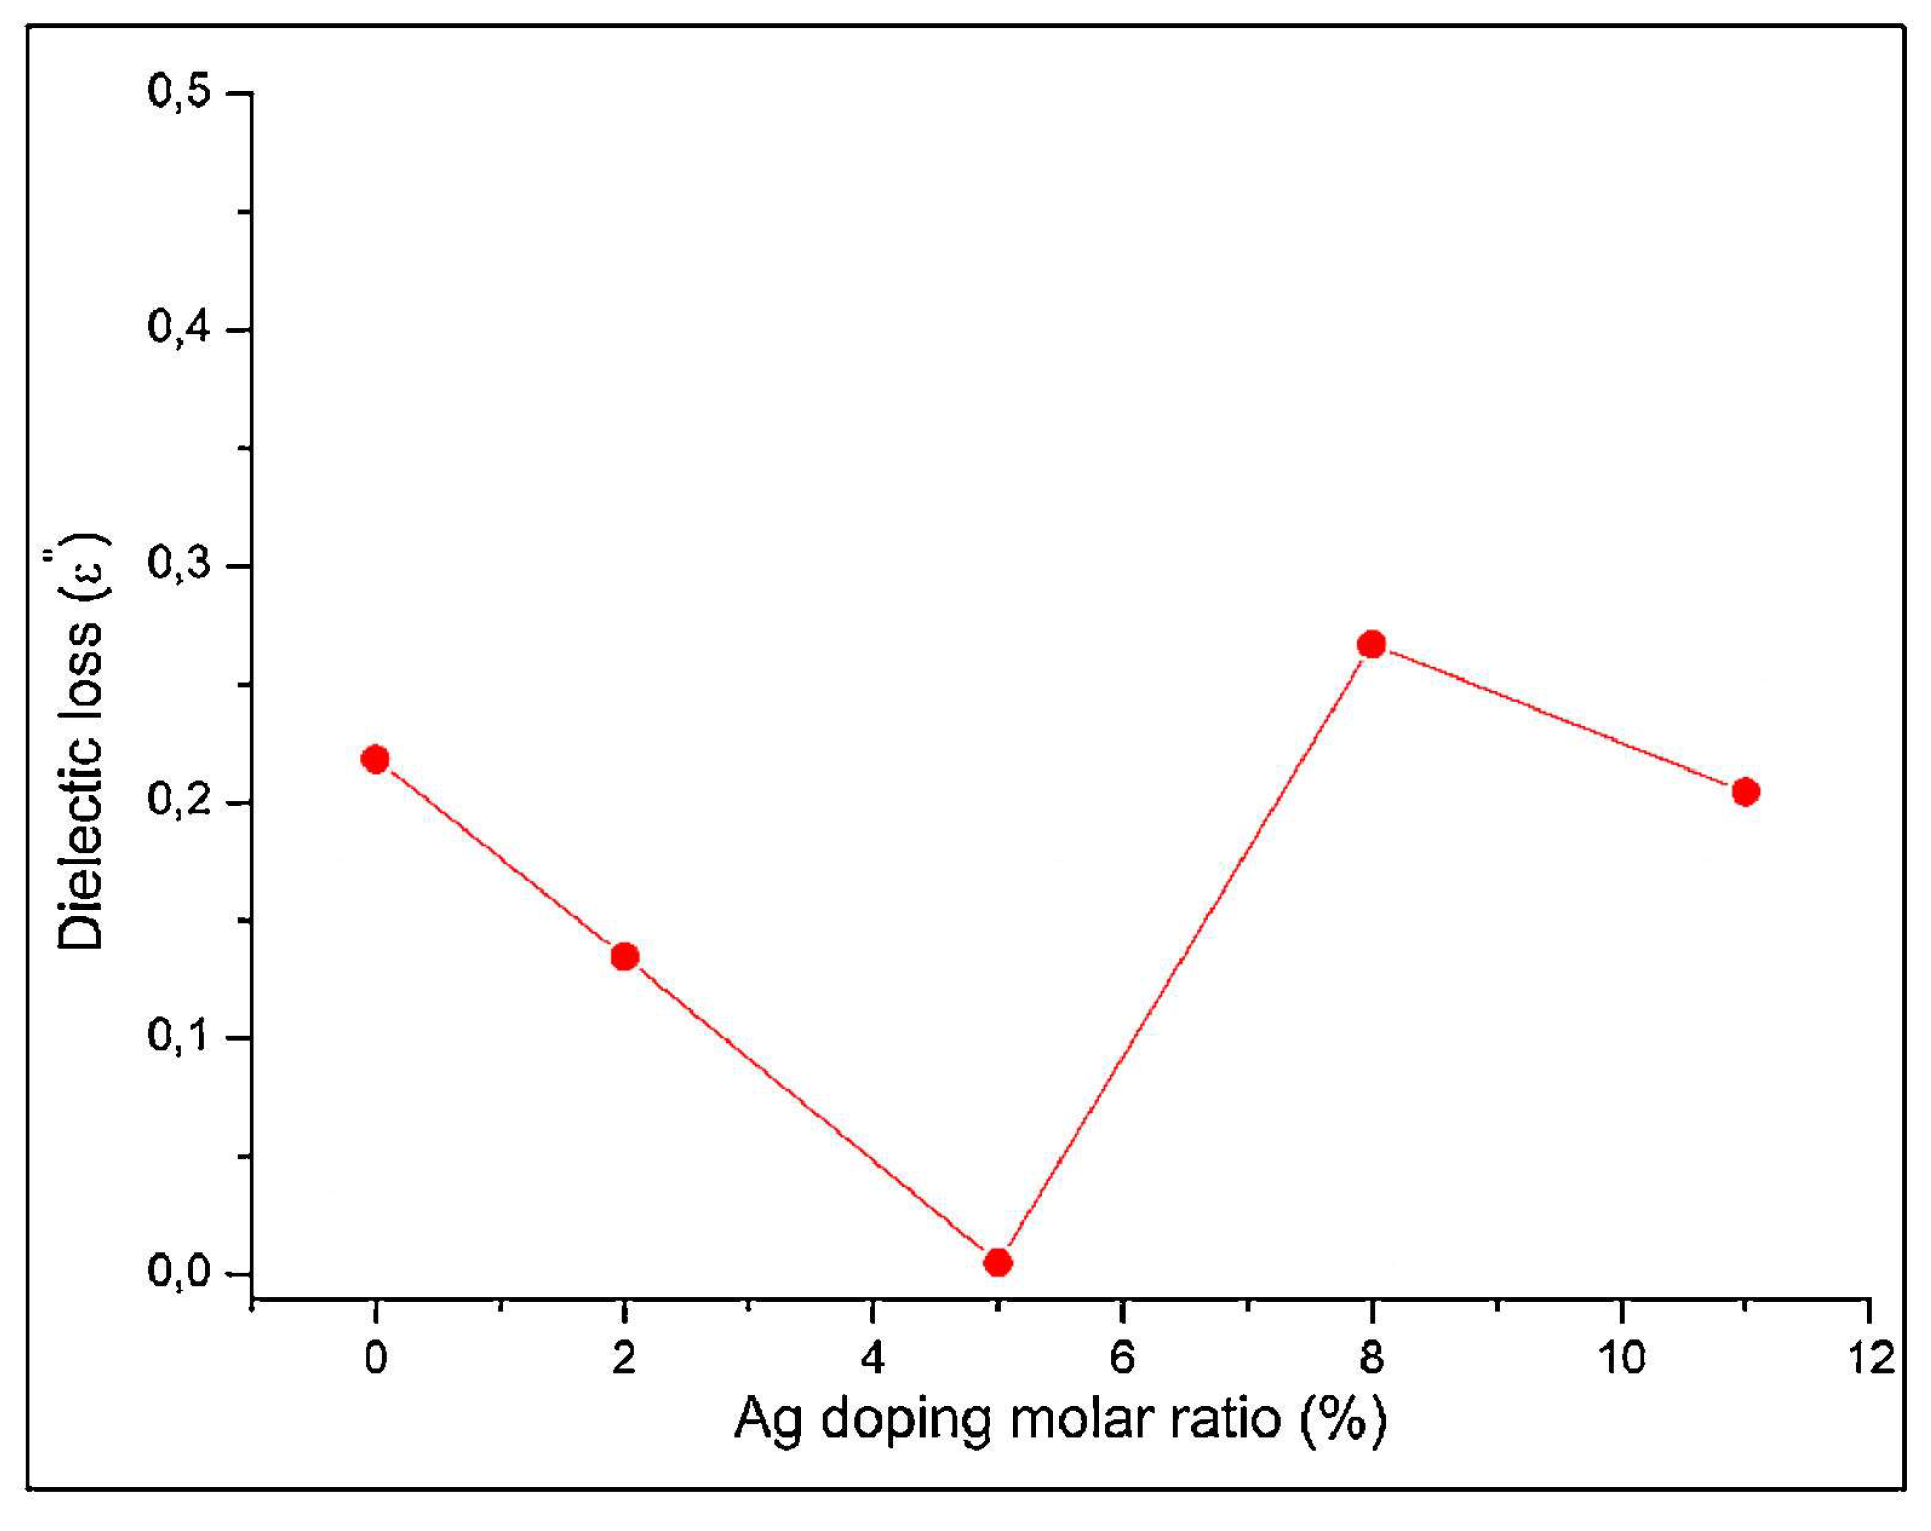
Dielectric Loss
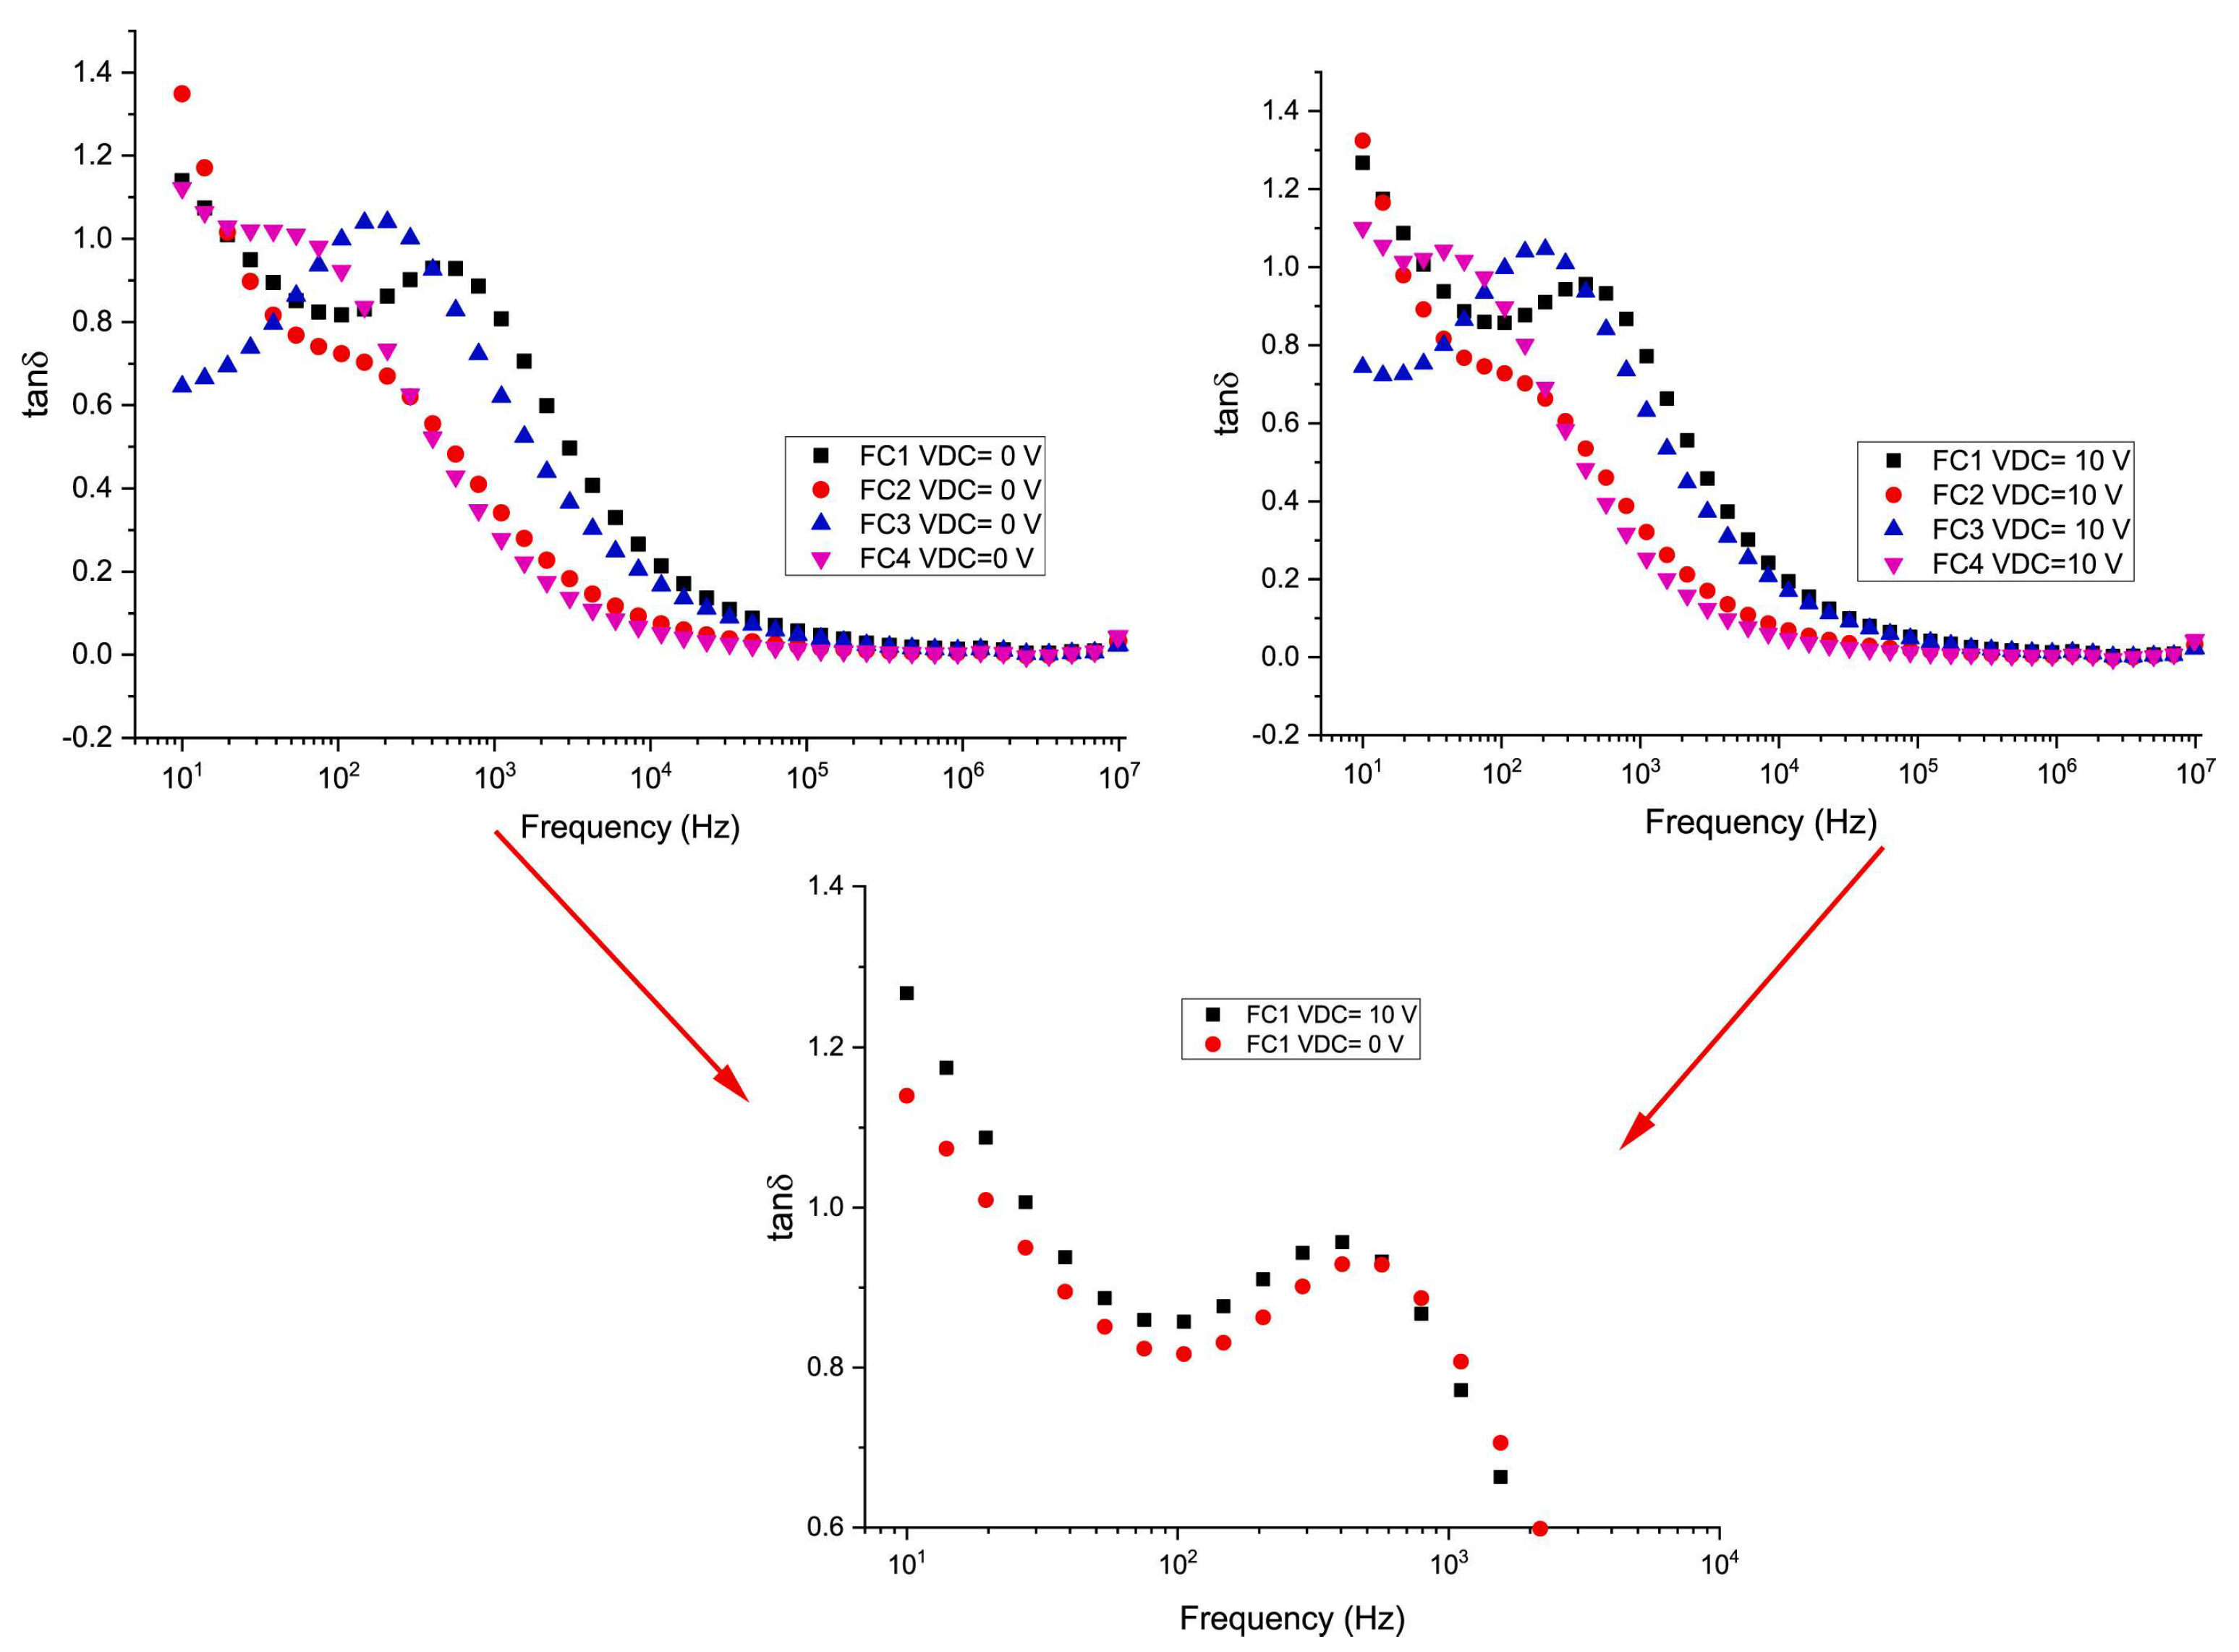
Tangent Loss
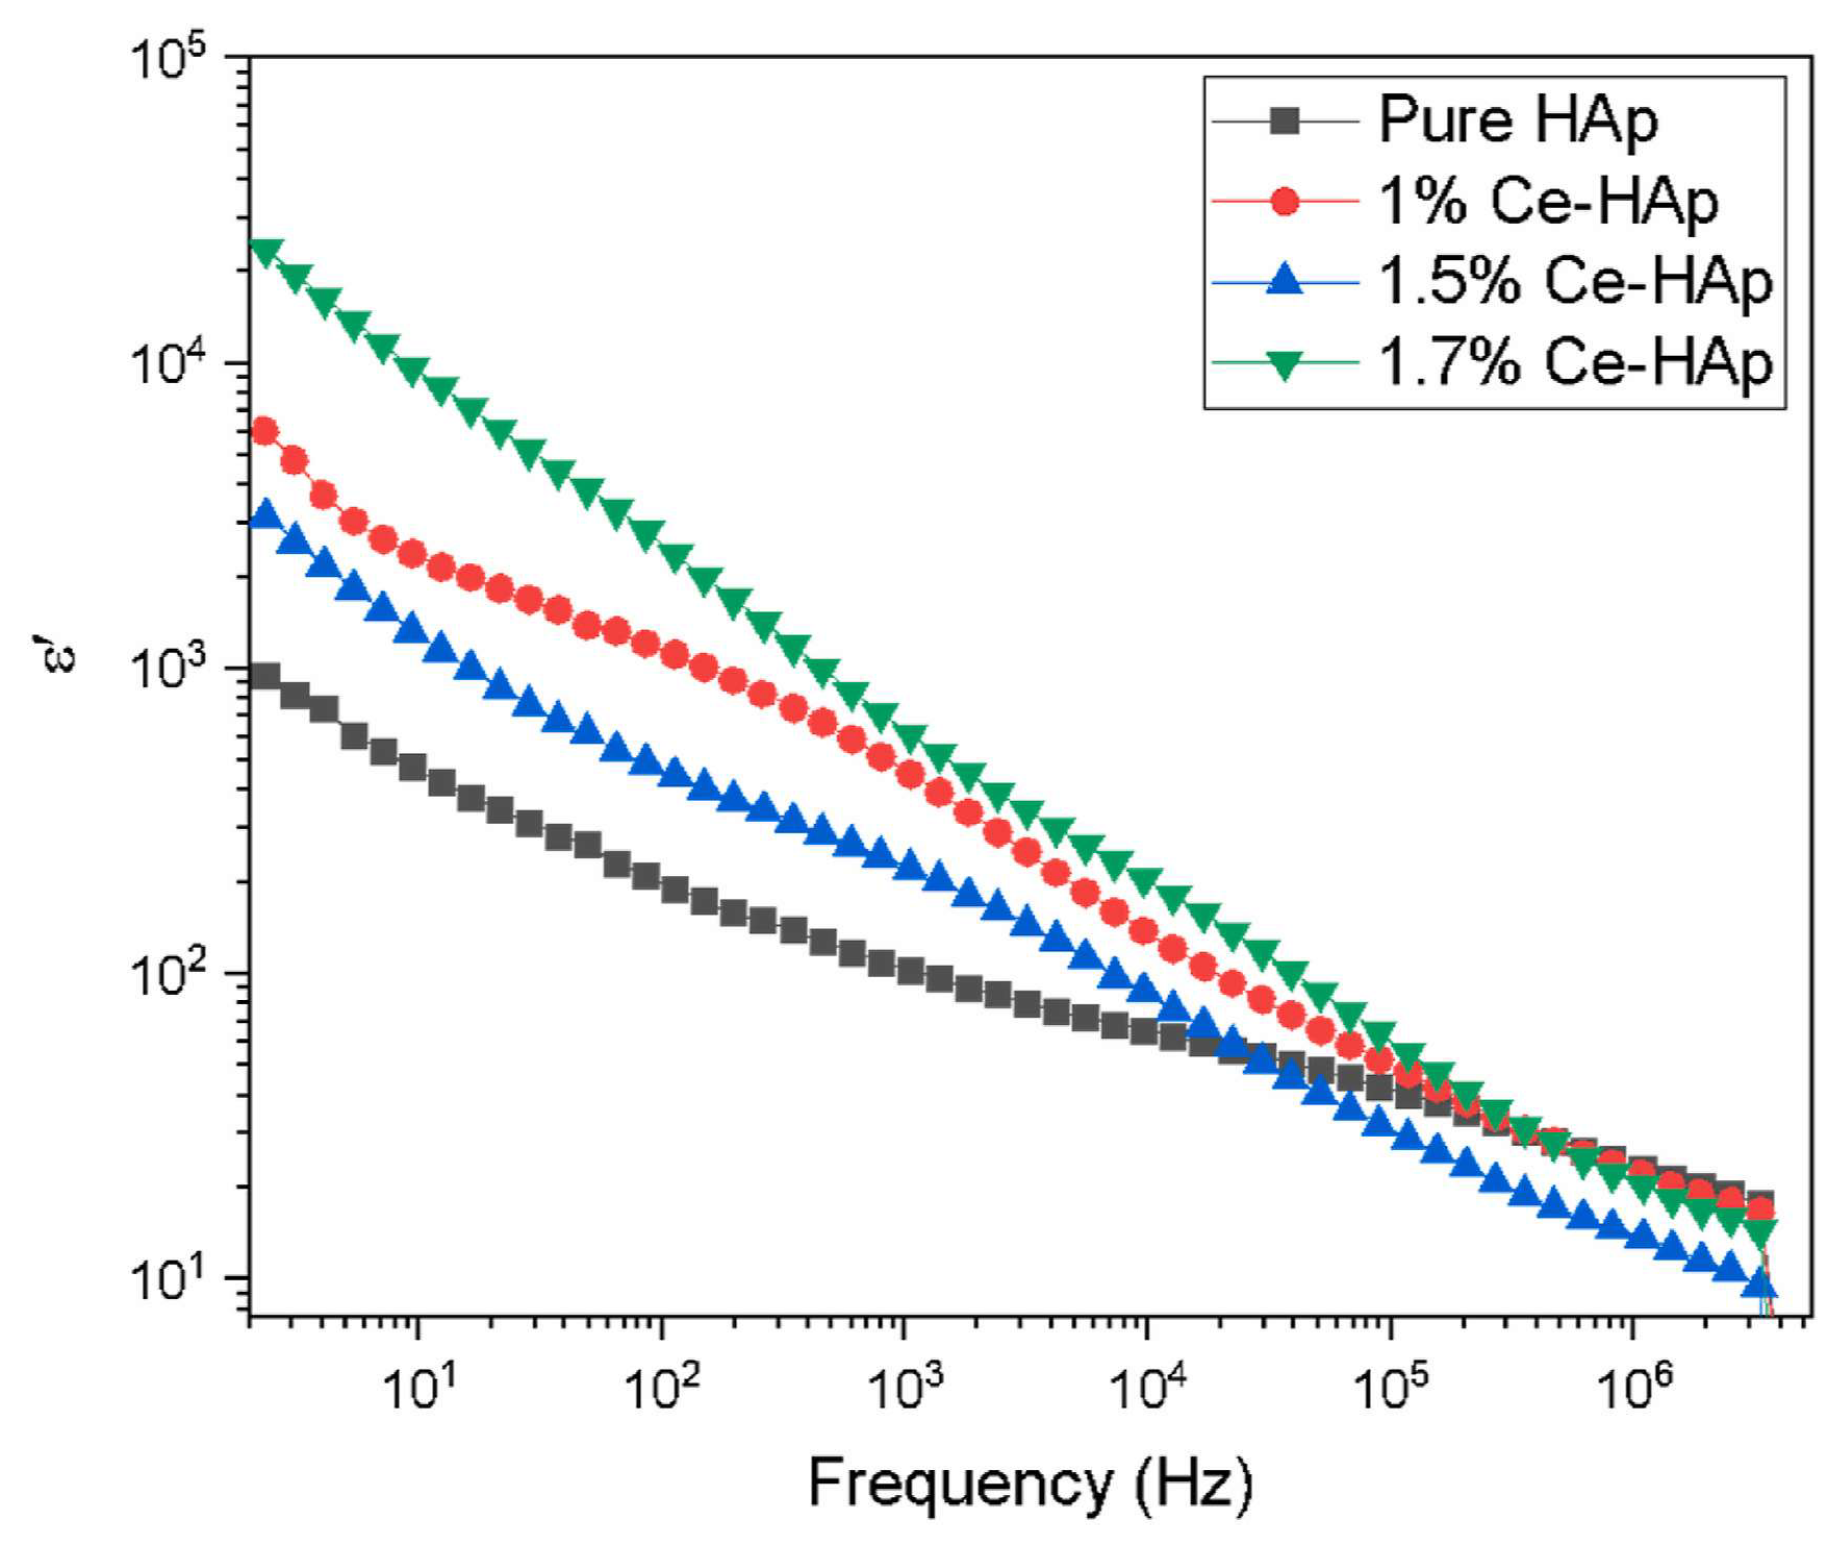
5.5.4. Permittivity
5.6. Simple and Doped Hydroxyapatite Pellets
5.6.1. Impedance Spectroscopy
5.6.2. AC Conductivity Analysis
5.6.3. Dielectric Studies
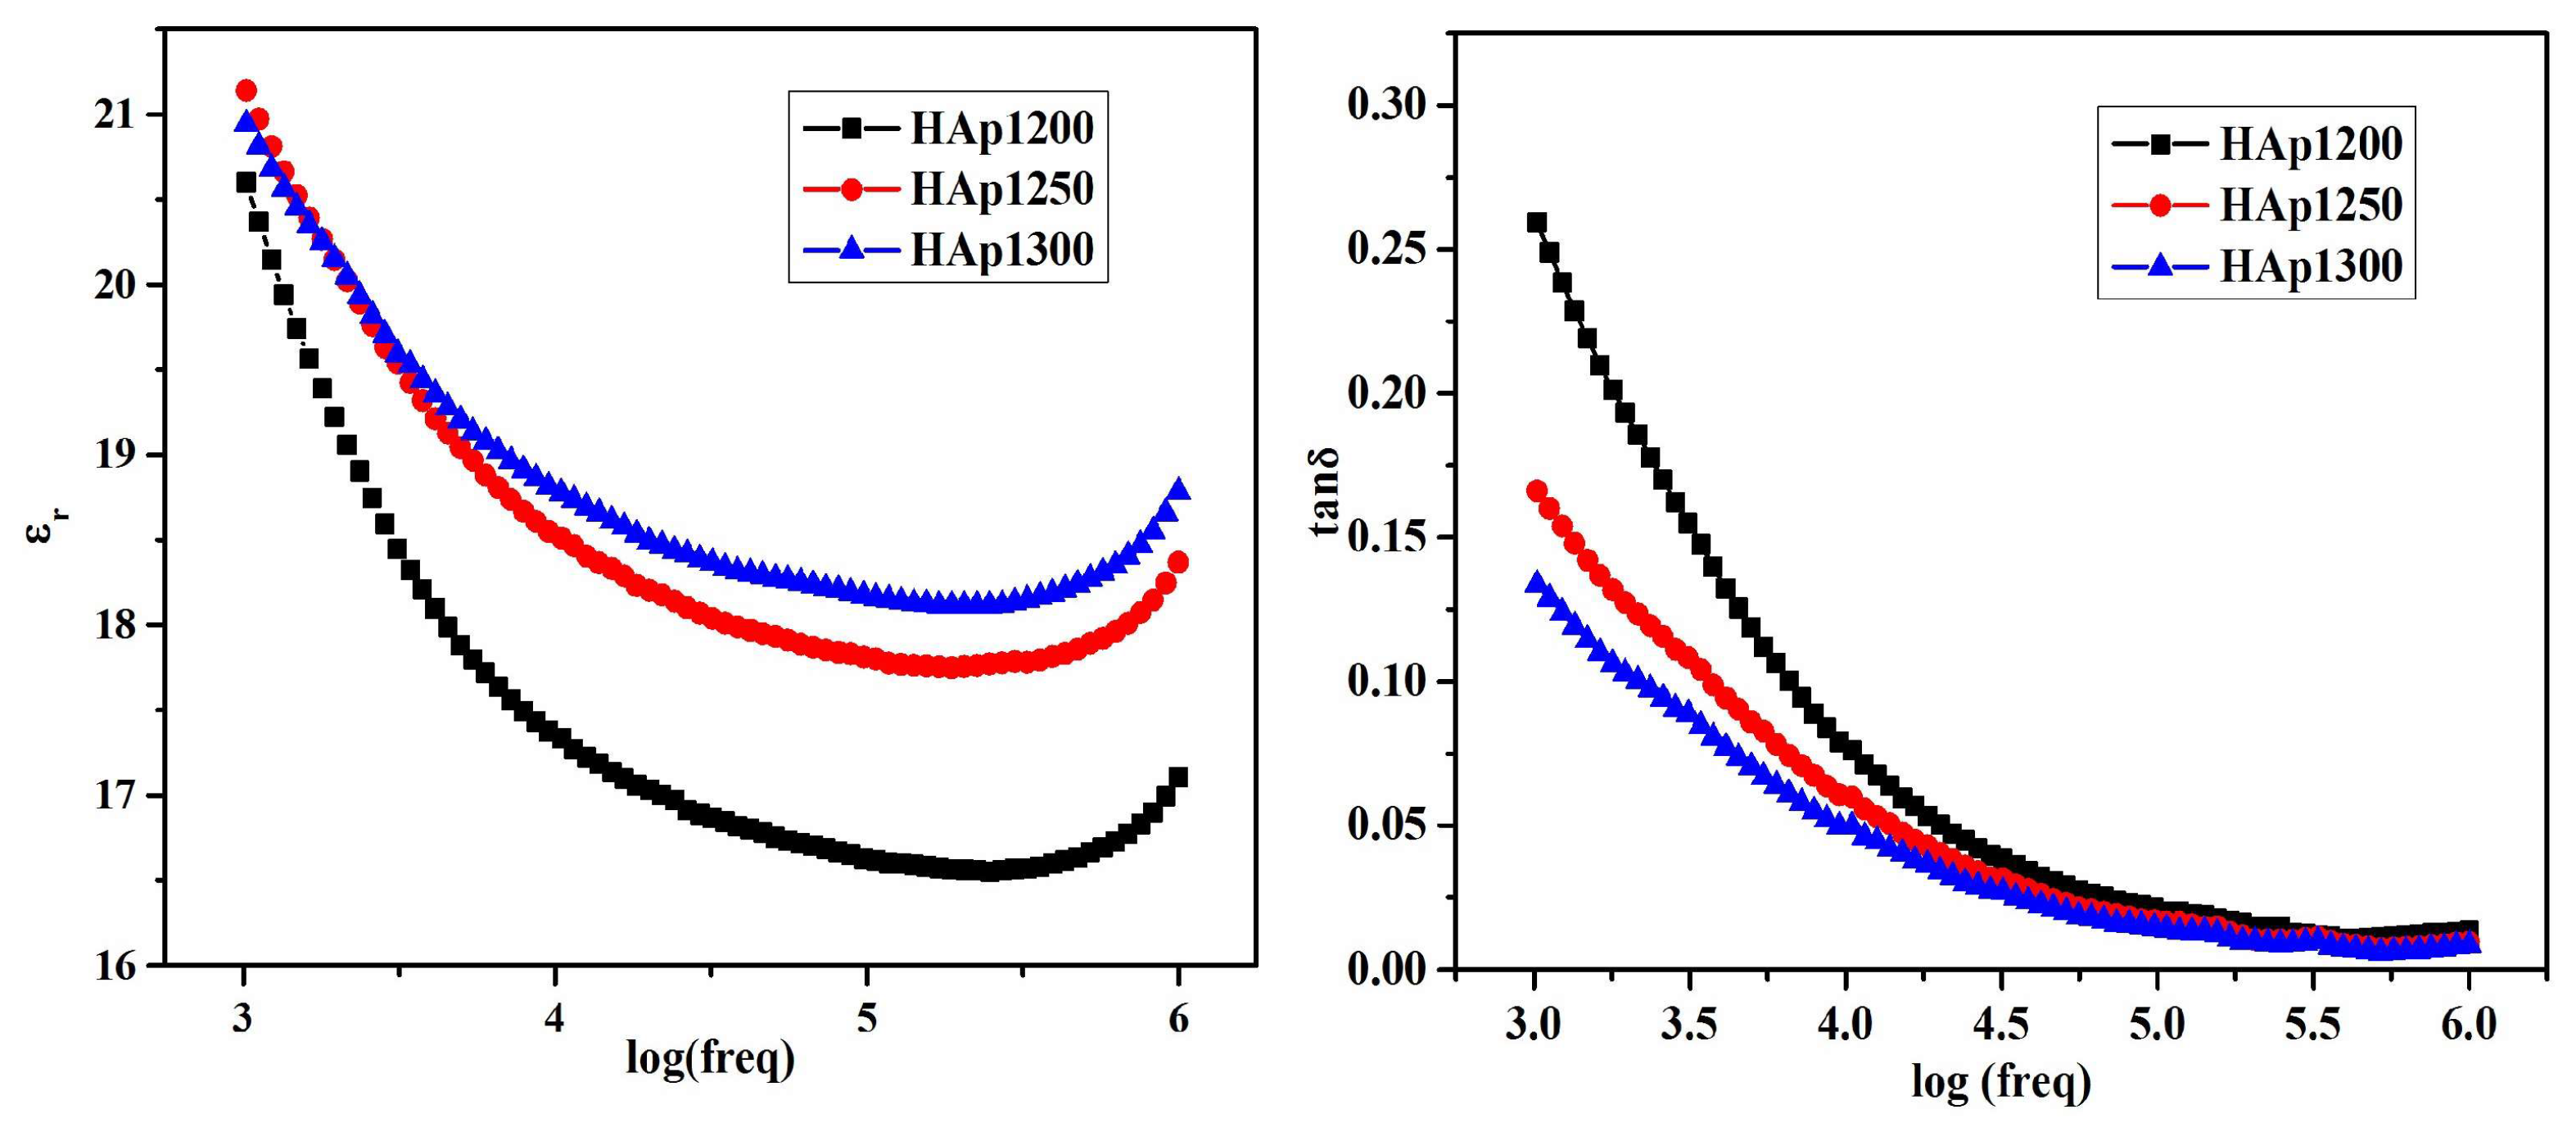
Dielectric Constant
Dielectric Loss
Dielectric Loss Tangent
5.7. Simple, Doped, and Blended Hydroxyapatite Thin Films
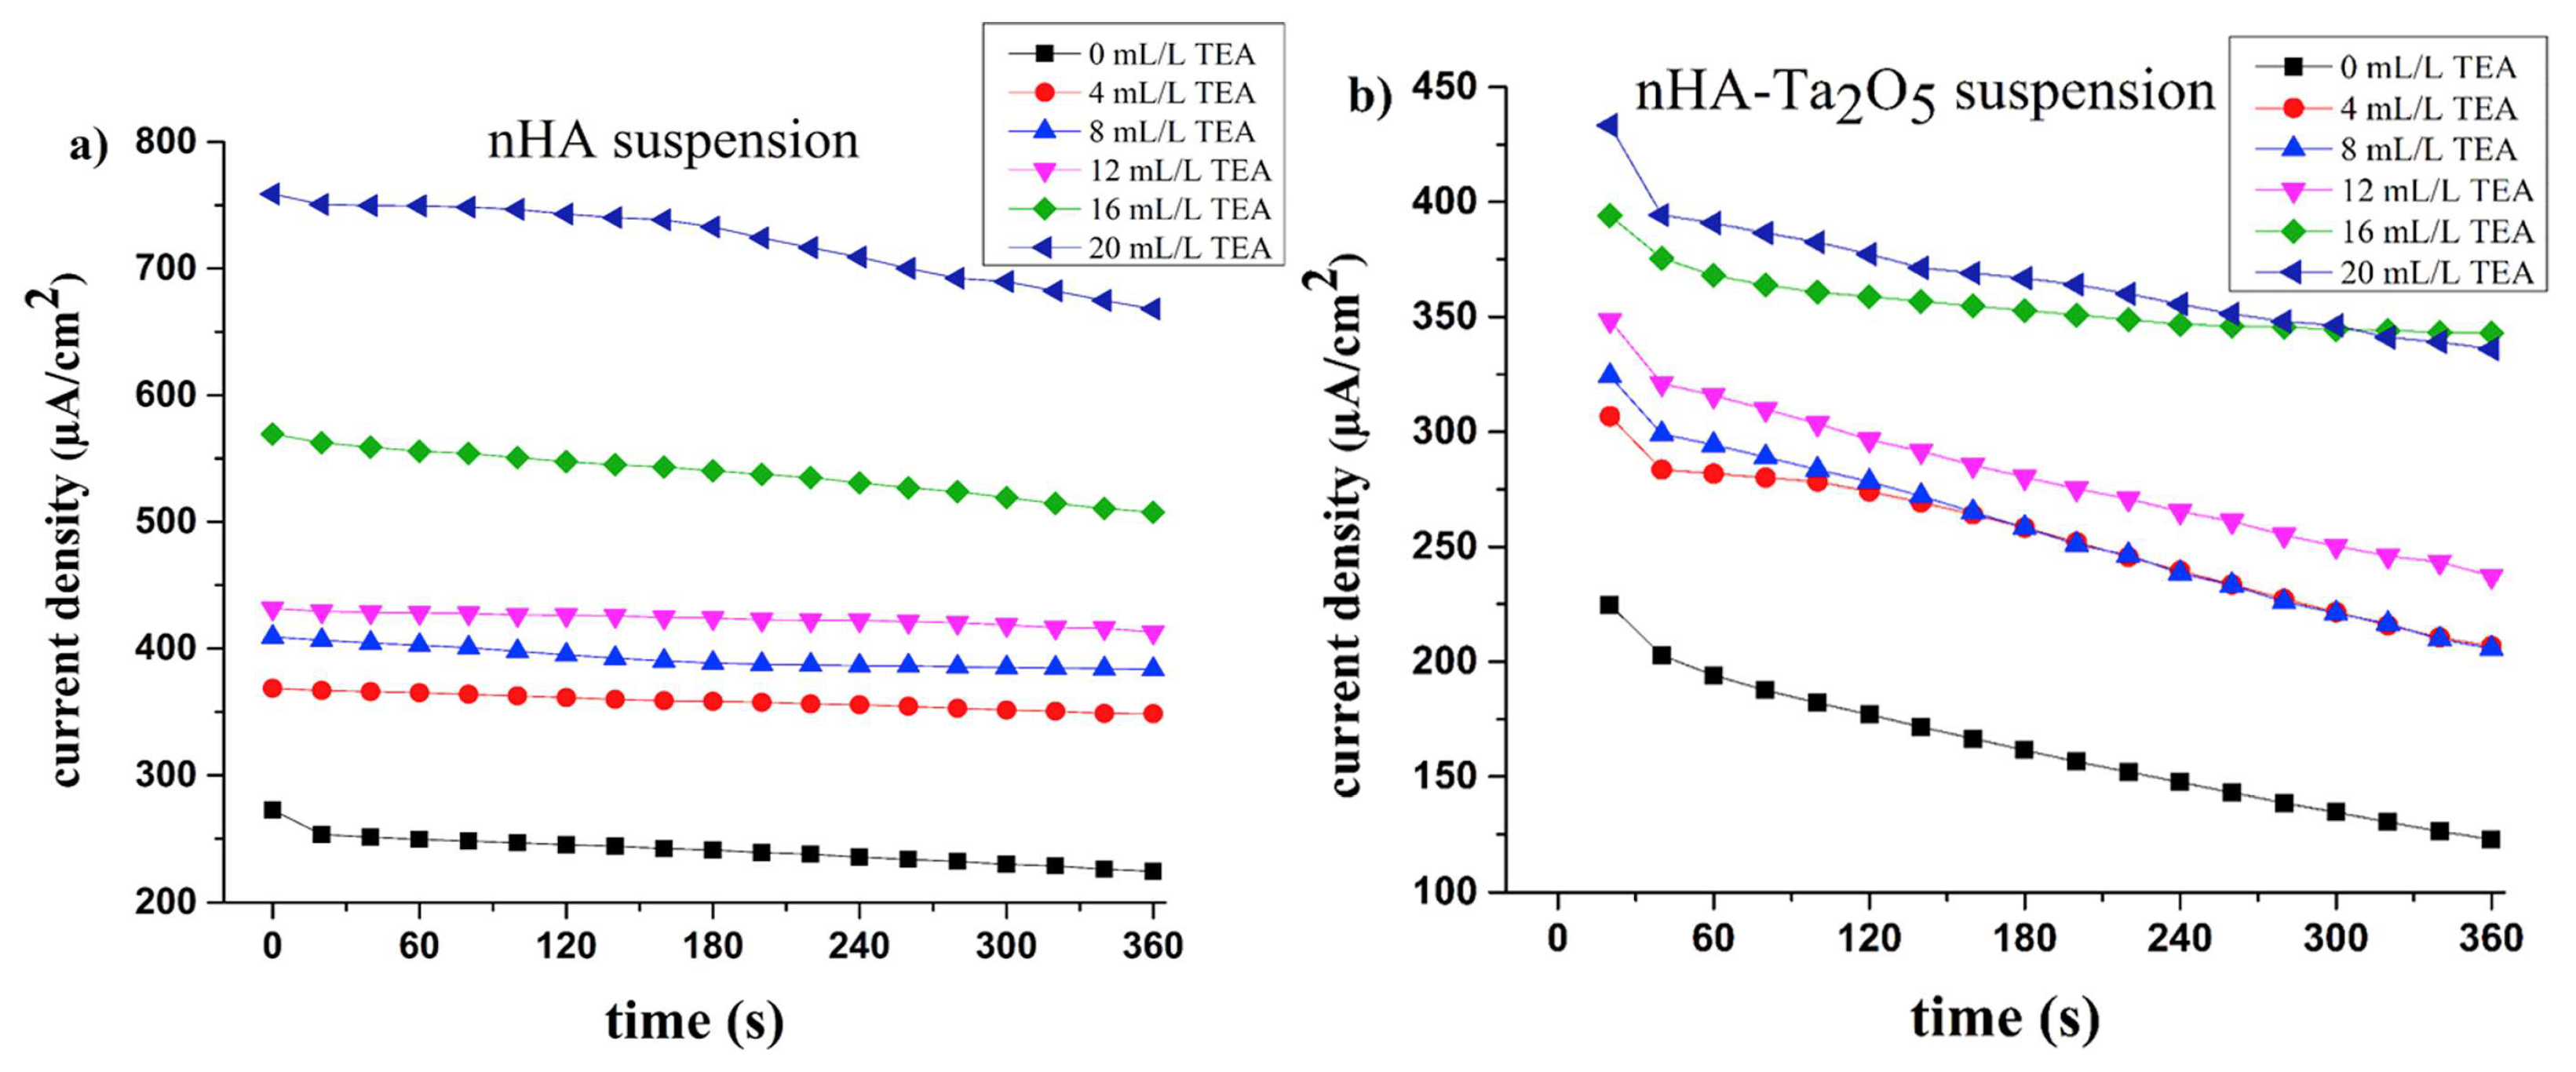
5.7.1. Conductivity
5.7.2. Dielectric Measurements
Dielectric Constant
Tangent Loss
6. Conclusions and Future Perspectives
Funding
Data Availability Statement
Acknowledgments
Conflicts of Interest
References
- Lett, J.A.; Sagadevan, S.; Kaliaraj, G.S.; Alagarsamy, K.; Arumugam, S.; Sivaprakash, P.; Muthukumaran, S.; Paiman, S.; Mohammad, F.; Al-Lohedan, H.A.; et al. Synthesis, characterization, and electrical properties of alkali earth metal-doped bioceramics. Mater. Chem. Phys. 2020, 249, 123141. [Google Scholar] [CrossRef]
- Thanigai Arul, K.; Ramana Ramya, J.; Narayana Kalkura, S. Impact of Dopants on the Electrical and Optical Properties of Hydroxyapatite. In Biomaterials; Vizureanu, P., Da Cunha Ferreira Botelho, C.M., Eds.; IntechOpen: London, UK, 2020. [Google Scholar] [CrossRef]
- Zipkin, I. The inorganic composition of bones and teeth. In Biological Calcification: Cellular and Molecular Aspects; Schraer, H., Ed.; Springer: Boston, MA, USA, 1970; pp. 69–103. [Google Scholar] [CrossRef]
- Palmer, L.C.; Newcomb, C.J.; Caltz, S.R.; Spoerk, E.D.; Stupp, S.I. Biomimetic systems for hydroxyapatite mineralization inspired by bone and enamel. Chem. Rev. 2008, 147, 4754–4783. [Google Scholar] [CrossRef] [PubMed]
- Piccirillo, C.; Castro, P.M.L. Calcium hydroxyapatite-based photocatalysts for environment remediation: Characteristics, performances and future perspectives. J. Environ. Manag. 2017, 193, 79–91. [Google Scholar] [CrossRef] [PubMed]
- Rodríguez-González, C.; Cid-Luna, H.E.; Salas, P.; Castaño, V.M. A new hybrid nanomaterial. J. Nanomater. 2014, 2014, 940903. [Google Scholar] [CrossRef]
- Badran, H.; Yahia, I.S.; Hamdy, M.S.; Awwad, N.S. Lithium-doped hydroxyapatite nano-composites: Synthesis, characterization, gamma attenuation coefficient and dielectric properties. Radiat. Phys. Chem. 2017, 130, 85–91. [Google Scholar] [CrossRef]
- Lu, Y.; Dong, W.; Ding, J.; Wang, W.; Wang, A. Hydroxyapatite Nanomaterials: Synthesis, Properties, and Functional Applications. In Micro and Nano Technologies, Nanomaterials from Clay Minerals; Wang, A., Wang, W., Eds.; Elsevier: Amsterdam, The Netherlands, 2019; pp. 485–536. [Google Scholar] [CrossRef]
- Dorcioman, G.; Grumezescu, V.; Stan, G.E.; Chifiriuc, M.C.; Gradisteanu, G.P.; Miculescu, F.; Matei, E.; Popescu-Pelin, G.; Zgura, I.; Craciun, V.; et al. Hydroxyapatite Thin Films of Marine Origin as Sustainable Candidates for Dental Implants. Pharmaceutics 2023, 15, 1294. [Google Scholar] [CrossRef] [PubMed]
- Tank, K.P.; Sharma, P.; Kanchan, D.K.; Joshi, M.J. FTIR, powder XRD, TEM and dielectric studies of pure and zinc doped nano-hydroxyapatite. Cryst. Res. Technol. 2011, 46, 1309–1316. [Google Scholar] [CrossRef]
- Bystrov, V.; Bystrova, N.; Dekhtyar, Y.; Karlov, A.; Katashev, A.; Meissner, C.; Paramonova, E.; Polyaka, N.; Sapronova, A. Size Depended Electrical Properties of Hydroxyapatite Nanoparticles BT—World Congress on Medical Physics and Biomedical Engineering; Dossel, O., Schlegel, W.C., Eds.; Springer: Berlin/Heidelberg, Germany, 2010; pp. 230–232. [Google Scholar]
- Kaygili, O.; Keser, S.; Ates, T.; Al-Ghamdi, A.A.; Yakuphanoglu, F. Controlling of dielectrical and optical properties of hydroxyapatite based bioceramics by Cd content. Powder Technol. 2013, 245, 1–6. [Google Scholar] [CrossRef]
- Rajesh, A.; Sairam, T.; Sahoo, P.; Kamruddin, M.; Mangamma, G. PFM studies of hydroxyapatite-reduced graphene oxide nanocomposite. Ferroelectrics 2017, 519, 164–169. [Google Scholar] [CrossRef]
- Silva, C.; Valente, M.; Graça, M.; Sombra, A. The modulus formalism used in the dielectric analysis of hydroxyapatite and calcium phosphate with titanium formed by dry ball milling. J. Non-Cryst. Solids 2005, 351, 2945–2950. [Google Scholar] [CrossRef]
- Baxter, R.; Turner, G.; Bowen, R.; Gittings, P.; Chaudhuri, J. An in vitro study of electrically active hydroxyapatite-barium titanate ceramics using Saos-2 cells. J. Mater. Sci. Mater. Med. 2009, 20, 1697–1708. [Google Scholar] [CrossRef] [PubMed]
- Baxter, F.; Bowen, C.; Turner, I.G.; Dent, A.C.E. Electrically active bioceramics: A review of interfacial responses. Ann. Biomed. Eng. 2010, 38, 2079–2092. [Google Scholar] [CrossRef]
- Maiti, M.; Sarkar, M.; Liu, D.; Xu, S.; Maiti, S.; Paul, B.K.; Das, S. Tungsten doped hydroxyapatite processed at different temperatures: Dielectric behaviour and anti-microbial properties. New J. Chem. 2018, 42, 16948–16959. [Google Scholar] [CrossRef]
- Razali, K.R.; Mohd Nasir, N.F.; Cheng, E.M.; Tan, M.K.; Zakaria, A.; Mamat, N. Preliminary analysis of nHA based tissue engineering scaffold dielectric characteristics. ARPN J. Eng. Appl. Sci. 2016, 11, 4987–4990. [Google Scholar]
- Dev, S.R.S.; Raghavan, G.S.V.; Gariepy, Y. Dielectric properties of egg components and microwave heating for in-shell pasteurization of eggs. J. Food Eng. 2008, 86, 207–214. [Google Scholar] [CrossRef]
- Kaygilia, O.; Dorozhkinb, S.V.; Atesa, T.; Al-Ghamdic, A.A.; Yakuphanoglua, F. Dielectric properties of Fe doped hydroxyapatite prepared by sol–gel method. Ceram. Int. 2014, 40, 9395–9402. [Google Scholar] [CrossRef]
- Davey, C.L.; Davey, H.M.; Kell, D.B. On the dielectric properties of cell suspensions at high volume fractions. Bioelectrochem. Bioenerg. 1992, 28, 319–340. [Google Scholar] [CrossRef]
- Al Hammad, M.S. Nanostructure hydroxyapatite based ceramics by sol gel method. J. Alloys Compd. 2016, 661, 251–256. [Google Scholar] [CrossRef]
- Windisch, C.; Kolb, W.; Rohner, E.; Wagner, M.; Roth, A.; Matziolis, G.; Wagner, A. Invasive electromagnetic field treatment in osteonecrosis of the femoral head: A prospective cohort study. Open Orthop. J. 2014, 8, 125–129. [Google Scholar] [CrossRef]
- van Nguyen, J.; Marks, R. Pulsed Electromagnetic Fields for Treating Osteo-arthritis. Physiotherapy 2002, 88, 458–470. [Google Scholar] [CrossRef]
- Gittings, J.P.; Bowen, C.R.; Dent, A.C.E.; Turner, I.G.; Baxter, F.R.; Chaudhuri, J.B. Electrical characterization of hydroxyapatite-based bioceramics. Acta Biomater. 2009, 5, 743–754. [Google Scholar] [CrossRef]
- Helen, S.; Ruban Kumar, A. Study of structural, mechanical and dielectrical properties of ions doped apatite for antibacterial activity. Mater. Chem. Phys. 2019, 237, 121867. [Google Scholar] [CrossRef]
- Ressler, A.; Žužić, A.; Ivanišević, I.; Kamboj, N.; Ivanković, H. Ionic substituted hydroxyapatite for bone regeneration applications: A review. Open Ceram. 2021, 6, 100122. [Google Scholar] [CrossRef]
- Al-Hazmi, F.E. Synthesis and electrical properties of Bi doped hydroxyapatite ceramics. J. Alloys Comp. 2016, 665, 119–123. [Google Scholar] [CrossRef]
- Fernández, J.F.; de Frutos Vaquerizo, J. Introducción a la Electrocerámica; Fundación Rogelio Segovia para el Desarrollo de las Telecomunicaciones: Madrid, Spain, 2003; p. 295. ISBN 84-7402-305-X. [Google Scholar]
- Bur, A.J. Measurements of the dynamic piezoelectric properties of bone as a function of temperature and humidity. J. Biomech. 1976, 9, 495–507. [Google Scholar] [CrossRef] [PubMed]
- Lakes, R.S.; Harper, R.A.; Katz, J.L. Dielectric relaxation in cortical bone. J. Appl. Phys. 1977, 48, 808–811. [Google Scholar] [CrossRef]
- Hoepfner, T.P.; Case, E.D. The porosity dependence of the dielectric constant for sintered hydroxyapatite. J. Biomed. Mater. Res. 2002, 60, 643–650. [Google Scholar] [CrossRef]
- Das, A.; Pamu, D. A comprehensive review on electrical properties of hydroxyapatite based ceramic composites. Mater. Sci. Eng. C 2019, 101, 539–563. [Google Scholar] [CrossRef] [PubMed]
- Tite, T.; Popa, A.C.; Balescu, L.M.; Bogdan, I.M.; Pasuk, I.; Ferreira, J.M.F.; Stan, G.E. Cationic substitutions in hydroxyapatite: Current status of the derived biofunctional effects and their in vitro interrogation methods. Materials 2018, 11, 2081. [Google Scholar] [CrossRef] [PubMed]
- Oledzka, E.; Sobczak, M.; Kolmas, J.; Nalecz-Jawecki, G. Selenium-Substituted Hydroxyapatite/Biodegradable Polymer/Pamidronate Combined Scaffold for the Therapy of Bone Tumour. Int. J. Mol. Sci. 2015, 16, 22205–22222. [Google Scholar] [CrossRef]
- Meisel, C.L.; Bainbridge, P.; Mitsouras, D.; Wong, J.Y. Targeted nanoparticle binding to hydroxyapatite in a high serum environment for early detection of heart disease. ACS Appl. Nano Mater. 2018, 1, 4927–4939. [Google Scholar] [CrossRef] [PubMed]
- Predoi, D.; Iconaru, S.L.; Predoi, M.V.; Groza, A.; Gaiaschi, S.; Rokosz, K.; Raaen, S.; Negrila, C.C.; Prodan, A.-M.; Costescu, A.; et al. Development of Cerium-Doped Hydroxyapatite Coatings with Antimicrobial Properties for Biomedical Applications. Coatings 2020, 10, 516. [Google Scholar] [CrossRef]
- Ciobanu, C.S.; Popa, C.L.; Predoi, D. Cerium-doped hydroxyapatite nanoparticles synthesized by the co-precipitation method. J. Serb. Chem. Soc. 2016, 81, 433–446. [Google Scholar] [CrossRef]
- Iconaru, S.L.; Predoi, M.V.; Chapon, P.; Gaiaschi, S.; Rokosz, K.; Raaen, S.; Motelica-Heino, M.; Predoi, D. Investigation of Spin Coating Cerium-Doped Hydroxyapatite Thin Films with Antifungal Properties. Coatings 2021, 11, 464. [Google Scholar] [CrossRef]
- Ciobanu, G.; Harja, M. Cerium-doped hydroxyapatite/collagen coatings on titanium for bone implants. Ceram. Int. 2019, 45, 2852–2857. [Google Scholar] [CrossRef]
- Chaudhary, S.; Sharma, P.; Renu; Kumar, R. Hydroxyapatite doped CeO2 nanoparticles: Impact on biocompatibility and dye adsorption properties. RSC Adv. 2016, 6, 62797–62809. [Google Scholar] [CrossRef]
- Chang, S.P.; Chen, K.J. Beta-Gallium oxide nanowire extended gate field effect transistor pH sensors prepared using furnace-oxidized gallium nitride thin films. Nanosci. Nanotechnol. Lett. 2014, 6, 914–917. [Google Scholar] [CrossRef]
- Becerra, D.L.; Cohen, D.A.; Mehari, S.; DenBaars, S.P.; Nakamura, S. Compensation effects of high oxygen levels in semipolar AlGaN electron blocking layers and their mitigation via growth optimization. J. Cryst. Growth 2019, 507, 118–123. [Google Scholar] [CrossRef]
- Lee, D.; Lee, S.; Kim, G.; Kim, J.; Jang, J.; Oh, J.; Moon, D.; Park, Y.; Yoon, E. Epitaxial lateral overgrowth of GaN on nano-cavity patterned sapphire substrates. J. Cryst. Growth 2019, 507, 103–108. [Google Scholar] [CrossRef]
- Leyland-Jones, B. Treatment of cancer-related hypercalcemia: The role of gallium nitrate. Semin. Oncol. 2003, 30, 13–19. [Google Scholar] [CrossRef]
- Kurtjak, M.; Vukomanovic, M.; Krajnc, A.; Kramer, L.; Turk, B.; Suvorov, D. Designing Ga (iii)-containing hydroxyapatite with antibacterial activity. RSC Adv. 2016, 6, 112839–112852. [Google Scholar] [CrossRef]
- Bernstein, L.R. Mechanisms of therapeutic activity of gallium. Pharmacol. Rev. 1998, 50, 665–682. [Google Scholar] [PubMed]
- Blumenthal, N.C.; Cosma, V.; Levine, S. Effect of gallium on the in vitro formation, growth, and solubility of hydroxyapatite. Calcif. Tissue Int. 1989, 45, 81–87. [Google Scholar] [CrossRef]
- Aal, N.A.; Bououdina, M.; Hajry, A.; Chaudhry, A.A.; Darr, J.A.; Al-Ghamdi, A.A.; El-Mossalamy, E.H.; Al-Ghamdi, A.A.; Sung, Y.K.; El-Tantawy, F. Synthesis, characterization and electrical properties of hydroxyapatite nanoparticles from utilization of biowaste eggshells. Biomater. Res. 2011, 15, 52–59. [Google Scholar]
- Donnelly, R.; Boskey, A. The effect of gallium on seeded hydroxyapatite growth. Calcif. Tissue Int. 1989, 44, 138–142. [Google Scholar] [CrossRef] [PubMed]
- Ogawa, K.; Ishizaki, A.; Takai, K.; Kitamura, Y.; Makino, A.; Kozaka, T.; Kiyono, Y.; Shiba, K.; Odani, A. Evaluation of Ga-DOTA-(D-Asp)n as bone imaging agents: Daspartic acid peptides as carriers to bone. Sci. Rep. 2017, 7, 13971. [Google Scholar] [CrossRef] [PubMed]
- Repetto, G.; Peso, A. Gallium, Indium, and Thallium. In Patty’s Toxicology, 6th ed.; Bingham, E., Cohrssen, B., Eds.; John Wiley & Sons: New York, NY, USA, 2012; pp. 257–354. [Google Scholar]
- Ibrahim, M.; Dawood, A. Influence of doping chromium ions on the electrical properties of hydroxyapatite. Egypt. J. Basic Appl. Sci. 2020, 7, 35–46. [Google Scholar] [CrossRef]
- McCarty, M.F. Anabolic effects of insulin on bone suggest a role for chromium picolinate in preservation of bone density. Med. Hypotheses 1995, 45, 241–246. [Google Scholar] [CrossRef]
- Chen, W.Y.; Chen, C.J.; Liu, C.H.; Mao, F.C. Chromium supplementation enhances insulin signalling in skeletal muscle of obese KK/HlJ diabetic mice. Diabetes Obes. Metab. 2009, 11, 293–303. [Google Scholar] [CrossRef]
- Oje, A.M.; Ogwu, A.A. Chromium oxide coatings with the potential for eliminating the risk of chromium ion release in orthopaedic implants. R. Soc. Open Sci. 2017, 4, 170218. [Google Scholar] [CrossRef]
- Zeidler-Erdely, P.C.; Battelli, L.A.; Salmen-Muniz, R.; Li, Z.; Erdely, A.; Kashon, M.L.; Simeonova, P.P.; Antonini, J.M. Lung tumor production and tissue metal distribution after exposure to manual metal ARC-stainless steel welding fume in A/J and C57BL/6J mice. J. Toxicol. Environ. Health A 2011, 74, 728–736. [Google Scholar] [CrossRef]
- Jacob, J.; More, N.; Kalia, K.; Kapusetti, G. Piezoelectric smart biomaterials for bone and cartilage tissue engineering. Inflamm. Regen. 2018, 38, 2. [Google Scholar] [CrossRef]
- Swain, S.; Bhaskar, R.; Mishra, B.; Gupta, M.K.; Sonia; Dasgupta, S.; Kumar, P. Microstructural, dielectric, mechanical, and biological properties of hydroxyapatite (HAp)/BZT-BCT (0.5Ba(Zr0.2Ti0.8)O3-0.5(Ba0.7Ca0.3)TiO3) bio-composites with improved mechano-electrical properties for bone repair. Ceram. Int. 2022, 48, 24505–24516. [Google Scholar] [CrossRef]
- Manohar, C.S.; Kumar, B.S.; Sadhu, S.P.P.; Srimadh, S.K.; Muthukumar, V.S.; Venketesh, S.; Varma, K.B.R. Novel Lead-free biocompatible piezoelectric Hydroxyapatite (HA)-BCZT (Ba0.85Ca0.15Zr0.1Ti0.9O3) nanocrystal composites for bone regeneration. Nanotechnol. Rev. 2019, 8, 61–78. [Google Scholar] [CrossRef]
- Acosta, M.; Novak, N.; Rojas, V.; Patel, S.; Vaish, R.; Koruza, J.; Rossetti, G.A.; Rodel, J. BaTiO3-based piezoelectrics: Fundamentals, current status, and perspectives. Appl. Phys. Rev. 2017, 4, 041305. [Google Scholar] [CrossRef]
- Vouilloz, F.J.; Castro, M.S.; Vargas, G.E.; Gorustovich, A.; Fanovich, M.A. Reactivity of BaTiO3-Ca10(PO4)6(OH)2 phases in composite materials for biomedical applications. Ceram. Int. 2017, 43, 4212–4221. [Google Scholar] [CrossRef]
- Caballero, A.; Fernández, J.; Duran, P.; Moure, C. Titanato de bario cerámico. Bol. Soc. Esp. Ceram. Vidr. 1994, 33, 5–21. [Google Scholar]
- Perdomo, C.; Figueroa, E.; Páez, J. BaTiO3 obtenido por el método de coprecipitación. DYNA 2008, 75, 223–230. [Google Scholar]
- Almeida, A.; Fechine, P.; Sasaki, J.; Ayala, A.; Góes, J.; Pontes, D.; Sombra, A. Optical and electrical properties of barium titanate-hydroxyapatite composite screen-printed thick films. Solid State Sci. 2004, 6, 267–278. [Google Scholar] [CrossRef]
- Tang, Y.; Wu, C.; Wu, Z.; Hu, L.; Zhang, W.; Zhao, K. Fabrication and in vitro biological properties of piezoelectric bioceramics for bone regeneration. Sci. Rep. 2017, 7, 43360. [Google Scholar] [CrossRef]
- Cannillo, V.; Sola, A. Different approaches to produce coatings with bioactive glasses: Enamelling vs. plasma spraying. J. Eur. Cerma. Soc. 2010, 30, 2031–2039. [Google Scholar] [CrossRef]
- Das, A.; Dobbidi, P. Impedance Spectroscopy and ac Conductivity in Ba0.5Sr0.5TiO3-Ca10(PO4)6(OH)2 Ceramic Composites: An Electrical Approach to Unveil Biocomposites. ACS Biomater. Sci. Eng. 2021, 7, 2296–2308. [Google Scholar] [CrossRef] [PubMed]
- Yu, S.-W.; Kuo, S.-T.; Tuan, W.-H.; Tsai, Y.-Y.; Su, C.-H. Ion release from three lead-free piezoelectric ceramics and their physical and cytotoxicity characteristics. Mater. Lett. 2011, 65, 3522–3524. [Google Scholar] [CrossRef]
- Kravchenko, J.; Darrah, T.H.; Miller, R.K.; Lyerly, H.K.; Vengosh, A. A review of the health impacts of barium from natural and anthropogenic exposure. Environ. Geochem. Health 2014, 36, 797–814. [Google Scholar] [CrossRef]
- Uysal, I.; Severcan, F.; Tezcaner, A.; Evis, Z. Co-doping of hydroxyapatite with zinc and fluoride improves mechanical and biological properties of hydroxyapatite. Prog. Nat. Sci. Mater. Int. 2014, 24, 340–349. [Google Scholar] [CrossRef]
- Uysal, I.; Yilmaz, B.; Evis, Z. Zn-Doped Hydroxyapatite in Biomedical Applications. J. Aust. Ceram. Soc. 2021, 57, 869–897. [Google Scholar] [CrossRef]
- Uysal, I.; Severcan, F.; Evis, Z.J.C.I. Characterization by Fourier Transform Infrared Spectroscopy of Hydroxyapatite Co-Doped with Zinc and Fluoride. Ceram. Int. 2013, 39, 7727–7733. [Google Scholar] [CrossRef]
- Groza, A.; Ciobanu, C.S.; Popa, C.L.; Iconaru, S.L.; Chapon, P.; Luculescu, C.; Ganciu, M.; Predoi, D. Structural Properties and Antifungal Activity against Candida albicans Biofilm of Different Composite Layers Based on Ag/Zn Doped Hydroxyapatite-Polydimethylsiloxanes. Polymers 2016, 8, 131. [Google Scholar] [CrossRef]
- Yang, H.; Qu, X.; Lin, W.; Wang, C.; Zhu, D.; Dai, K.; Zheng, Y. In Vitro and In Vivo Studies on Zinc-Hydroxyapatite Composites as Novel Biodegradable Metal Matrix Composite for Orthopedic Applications. Acta Biomater. 2018, 71, 200–214. [Google Scholar] [CrossRef] [PubMed]
- Predoi, D.; Iconaru, S.L.; Deniaud, A.; Chevallet, M.; Michaud-Soret, I.; Buton, N.; Prodan, A.M. Textural, Structural and Biological Evaluation of Hydroxyapatite Doped with Zinc at Low Concentrations. Materials 2017, 10, 229. [Google Scholar] [CrossRef] [PubMed]
- Jaiswal, S.; McHale, P.; Duffy, B. Preparation and rapid analysis of antibacterial silver, copper and zinc doped sol–gel surfaces. Colloids Surf. B 2012, 94, 170–176. [Google Scholar] [CrossRef] [PubMed]
- Radovanović, Ž.; Jokić, B.; Veljović, D.; Dimitrijević, S.; Kojić, V.; Petrović, R.; Janaćković, D. Antimicrobial activity and biocompatibility of Ag+- and Cu2+-doped biphasic hydroxyapatite/α-tricalcium phosphate obtained from hydrothermally synthesized Ag+- and Cu2+-doped hydroxyapatite. Appl. Surf. Sci. 2014, 307, 513–519. [Google Scholar] [CrossRef]
- Riaz, M.; Zia, R.; Ijaz, A.; Hussain, T.; Mohsin, M.; Malik, A. Synthesis of monophasic Ag doped hydroxyapatite and evaluation of antibacterial activity. Mater. Sci. Eng. C 2018, 90, 308–313. [Google Scholar] [CrossRef] [PubMed]
- Ciobanu, C.; Iconaru, S.; Pasuk, I.; Vasile, B.; Lupu, A.; Hermenean, A.; Dinischiotu, A.; Predoi, D. Structural properties of silver doped hydroxyapatite and their biocompatibility. Mater. Sci. Eng. C 2013, 33, 1395–1402. [Google Scholar] [CrossRef] [PubMed]
- Marques, C.F.; Olhero, S.; Abrantes, J.; Marote, A.; Ferreira, S.; Vieira, S.I.; Ferreira, J.M. Biocompatibility and antimicrobial activity of biphasic calcium phosphate powders doped with metal ions for regenerative medicine. Ceram. Int. 2017, 43, 15719–15728. [Google Scholar] [CrossRef]
- Shi, C.; Gao, J.; Wang, M.; Fu, J.; Wang, D.; Zhu, Y. Ultra-trace silver-doped hydrox-yapatite with non-cytotoxicity and effective antibacterial activity. Mater. Sci. Eng. C 2015, 55, 497–505. [Google Scholar] [CrossRef]
- Mirzaee, M.; Vaezi, M.; Palizdar, Y. Synthesis and characterization of silver doped hydroxyapatite nanocomposite coatings and evaluation of their antibacterial and corrosion resistance properties in simulated body fluid. Mater. Sci. Eng. C 2016, 69, 675–684. [Google Scholar] [CrossRef]
- Abdulsada, F.W.; Hammood, A.S. Characterization of corrosion and antibacterial resistance of hydroxyapatite/silver nano particles powder on 2507 duplex stainless steel. Mater. Today Proc. 2021, 42, 2301–2307. [Google Scholar] [CrossRef]
- Chatterjee, T.; Ghosh, M.; Maji, M.; Ghosh, M.; Pradhan, S.K.; Meikap, A.K. Study of microstructural and electrical properties of silver substituted hydroxyapatite for drug delivery applications. Mater. Today Commun. 2022, 31, 103360. [Google Scholar] [CrossRef]
- Ferdous, Z.; Nemmar, A. Health Impact of Silver Nanoparticles: A Review of the Biodistribution and Toxicity Following Various Routes of Exposure. Int. J. Mol. Sci. 2020, 21, 2375. [Google Scholar] [CrossRef]
- Farzadi, A.; Bakhshi, F.; Solati-Hashjin, M.; Asadi-Eydivand, M.; abu Osman, N.A. Magnesium incorporated hydroxyapatite: Synthesis and structural properties characterization. Ceram Int. 2014, 40, 6021–6029. [Google Scholar] [CrossRef]
- Singh, J.; Singh, H.; Batra, U. Magnesium doped hydroxyapatite: Synthesis, characterization and bioactivity evaluation. In Biomaterials Science: Processing, Properties, and Applications V: Ceramic Transactions; Narayan, R., Bose, S., Bandyopadhyay, A., Eds.; The American Ceramic Society: Columbus, OH, USA, 2015; Volume 254, pp. 161–174. [Google Scholar] [CrossRef]
- Yang, C.-W.; Wang, G.-K. Effect of Hydrothermal (Sr)-Hydroxyapatite Coatings on the Corrosion Resistance and Mg2+ Ion Release to Enhance Osteoblastic Cell Responses of AZ91D Alloy. Materials 2020, 13, 591. [Google Scholar] [CrossRef]
- Mahanty, A.; Shikha, D. Calcium substituted with magnesium, silver and zinc in hydroxyapatite: A review. Int. J. Mater. Res. 2021, 112, 922–930. [Google Scholar] [CrossRef]
- Ma, X.; Liu, Y.; Zhu, B. Synthesis and characterization of pure strontium apatite particles and nanoporous scaffold prepared by dextrose-templated method. Mater. Res. Express 2018, 5, 025002. [Google Scholar] [CrossRef]
- Raucci, M.G.; Giugliano, D.; Alvarez-Perez, M.; Ambrosio, L. Effects on growth and osteogenic differentiation of mesenchymal stem cells by the strontium-added sol–gel hydroxyapatite gel materials. J. Mater. Sci. Mater. Med. 2015, 26, 90. [Google Scholar] [CrossRef] [PubMed]
- Feng, Q.L.; Kim, T.N.; Wu, J.; Park, E.S.; Kim, J.O.; Lim, D.Y.; Cui, F.Z. Antibacterial effects of Ag-HAp thin films on alumina substrates. Thin Solid Film. 1998, 335, 214–219. [Google Scholar] [CrossRef]
- Anwar, A.; Asghar, M.N.; Kanwal, Q.; Kazmi, M.; Sadiqa, A. Low temperature syn-thesis and characterization of carbonated hydroxyapatite nanocrystals. J. Mol. Struct. 2016, 1117, 283–286. [Google Scholar] [CrossRef]
- Miao, S.; Weng, W.; Cheng, K.; Du, P.; Shen, G.; Han, G.; Zhang, S. Sol–gel preparation of Zn-doped fluoridated hydroxyapatite films. Surf. Coat. Technol. 2005, 198, 223–226. [Google Scholar] [CrossRef]
- O’Donnell, M.; Fredholm, Y.; De Rouffignac, A.; Hill, R. Structural analysis of a series of strontium-substituted apatites. Acta Biomater. 2008, 4, 1455–1464. [Google Scholar] [CrossRef]
- Reem, A.-W.; Jafer, R.; Yahia, I.; Al-Ghamdi, A.A.; Al-ghamdi, M.A.; El-Naggar, A. Fast and easy synthesis of novel Strontium apatite nanostructured phase: Structure, spectroscopy, and dielectric analysis. Ceram. Int. 2017, 43, 17153–17159. [Google Scholar] [CrossRef]
- Li, Z.; Lam, W.; Yang, C.; Xu, B.; Ni, G.; Abbah, S.; Cheung, K.; Luk, K.; Lu, W. Chemical composition, crystal size and lattice structural changes after incorporation of strontium into biomimetic apatite. Biomaterials 2007, 28, 1452–1460. [Google Scholar] [CrossRef]
- Özbek, Y.Y.; Bastan, F.E.; Üstel, F. Synthesis and characterization of strontium–doped hydroxyapatite for biomedical applications. J. Therm. Anal. Calorim. 2016, 125, 745–750. [Google Scholar] [CrossRef]
- Jayasree, R.; Kumar, T.S.S.; Mahalaxmi, S.; Abburi, S.; Rubaiya, Y.; Doble, M. Dentin remineralizing ability and enhanced antibacterial activity of strontium and hydroxyl ion co-releasing radiopaque hydroxyapatite cement. J. Mater. Sci. Mater. Med. 2017, 28, 95. [Google Scholar] [CrossRef] [PubMed]
- Ercan, F.; Kayed, T.S.; Kaygili, O.; Bulut, N.; Almohazey, D.; Ates, T.; Al-Ahmari, F.S.; Ay, I.; Demirci, T.; Kirat, G.; et al. Investigation of structural, spectroscopic, dielectric, magnetic, and in vitro biocompatibility properties of Sr/Ni co-doped hydroxyapatites. Ceram. Int. 2022, 48, 26585–26607. [Google Scholar] [CrossRef]
- Ricci, G.; Bae, A.S.; Catoe, B.; Watson, B.C. End-Stage Tibiotalar Osteoarthritis and Chronic Strontium Toxicity. Cureus 2021, 13, e16866. [Google Scholar] [CrossRef]
- Waters, M.D.; Gardner, D.E.; Aranyl, C.; Coffin, D.L. Metal toxicity for rabbit macrophages in vitro. Environ. Res. 1975, 9, 32–49. [Google Scholar] [CrossRef]
- Barrio, D.A.; Etcheverry, S.B. Vanadium and bone development: Putative signaling pathways. Can. J. Physiol. Pharmacol. 2007, 84, 677–686. [Google Scholar] [CrossRef]
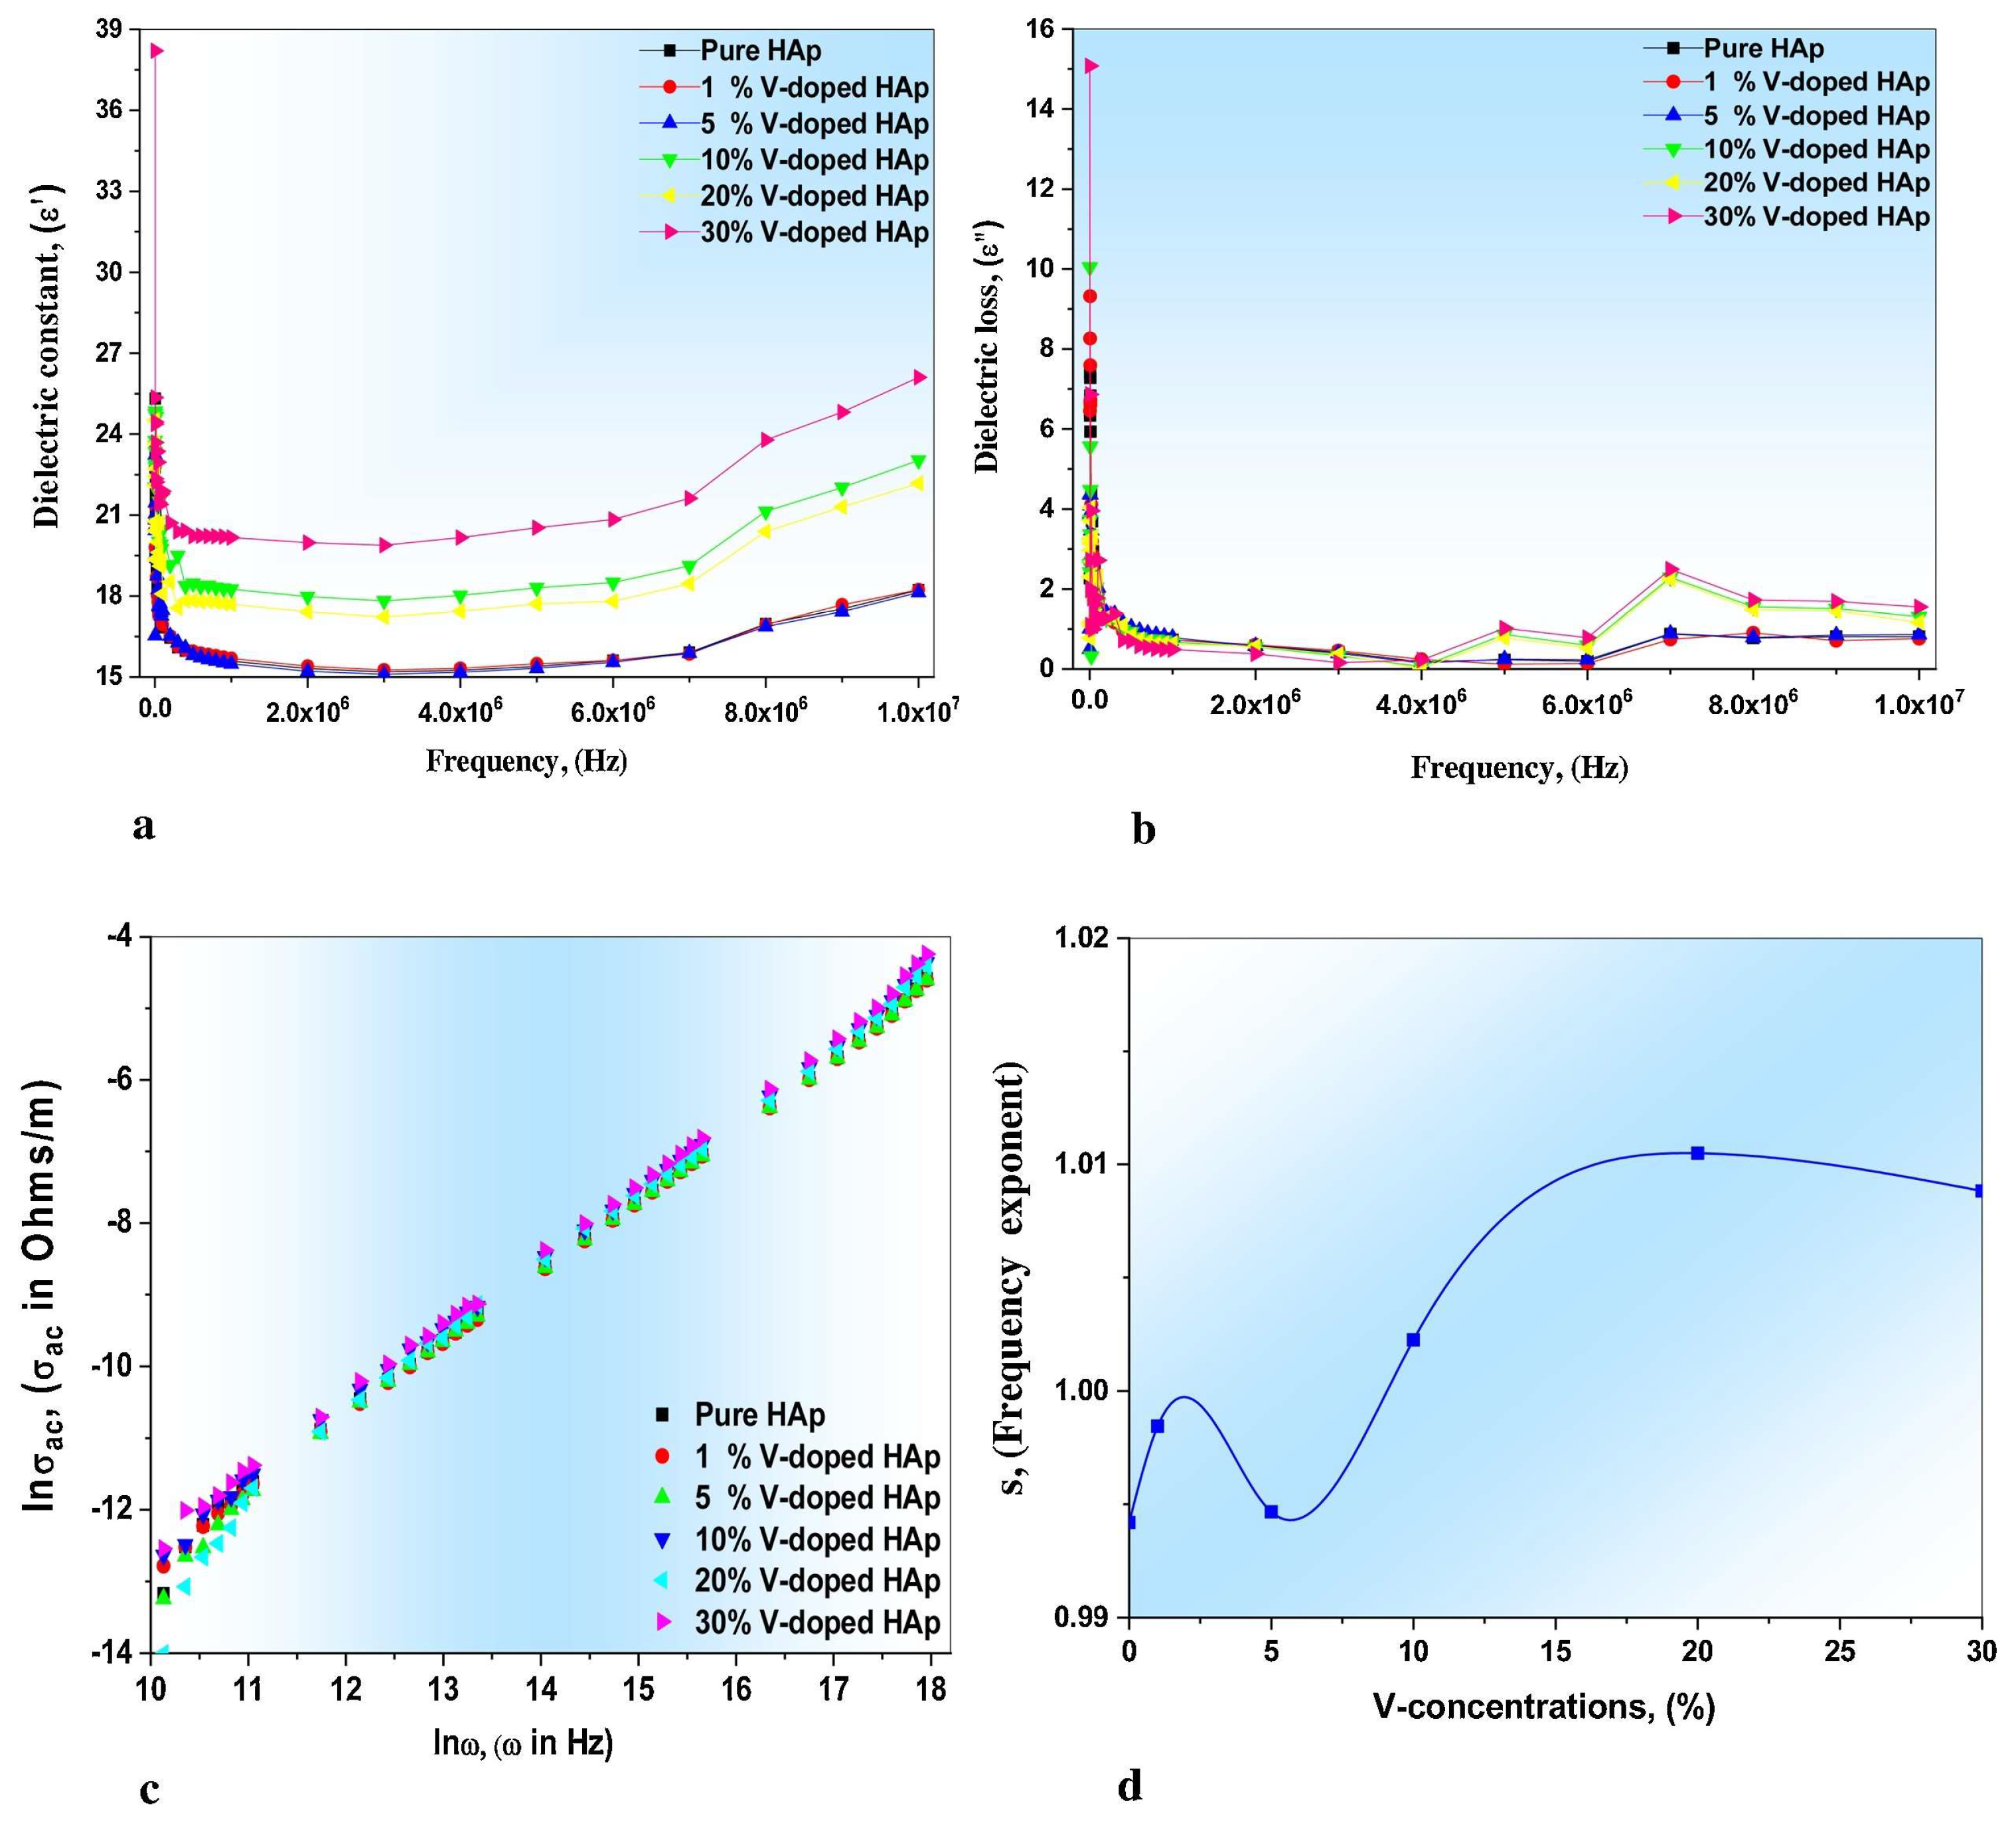
- Rajhi, F.Y.; Yahia, I.S.; Zahran, H.Y.; Kilany, M. Synthesis, structural, optical, dielectric properties, gamma radiation attenuation, and antimicrobial activity of V-doped hydroxyapatite nanorods. Mater. Today Commun. 2021, 26, 101981. [Google Scholar] [CrossRef]
- Al Jahdaly, B.A.; Khalil, A.M.; Ahmed, M.K.; Shoueir, K.R. Tuning the compositional configuration of hydroxyapatite modified with vanadium ions including thermal stability and antibacterial properties. J. Mol. Struct. 2021, 1242, 130713. [Google Scholar] [CrossRef]
- Willsky, G.R.; Halvorsen, K.; Godzala 3rd, M.E.; Chi, L.-H.; Most, M.J.; Kaszynski, P.; Crans, D.C.; Goldfine, A.B.; Kostyniak, P.J. Coordination chemistry may explain pharmacokinetics and clinical response of vanadyl sulfate in type 2 diabetic patients. Metallomics 2013, 5, 1491–1502. [Google Scholar] [CrossRef]
- Levina, A.; McLeod, A.I.; Kremer, L.E.; Aitken, J.B.; Glover, C.J.; Johannessen, B.; Lay, P.A. Reactivity–activity relationships of oral anti-diabetic vanadium complexes in gastrointestinal media: An X-ray absorption spectroscopic study. Metallomics 2014, 6, 1880–1888. [Google Scholar] [CrossRef]
- Yang, H.; Xiao, B.; Xu, K.W. Synthesis and characterization of Ag/Cu/HAP with platelet morphology. J. Mater. Sci. Mater. Med. 2009, 20, 785–792. [Google Scholar] [CrossRef]
- Zhao, C.X.; Zheng, W.D.; Mai, A.P.; Huang, X.M.; Ouyang, Y.S. Synthesis and characterization of waterborne polyurethane/Cu(II)-loaded hydroxyapatite nanocomposites with antibacterial activity. J. Nanosci. Nanotechnol. 2011, 11, 6779–6787. [Google Scholar] [CrossRef]
- Muthulakshmi, L.; Rajalu, A.V.; Kaliaraj, G.S.; Siengchin, S.; Parameswaranpillai, J.; Saraswathi, R. Preparation of cellulose/copper nanoparticles bionanocomposite films using a bioflocculant polymer as reducing agent for antibacterial and anticorrosion applications. Compos. B 2019, 175, 107177. [Google Scholar] [CrossRef]
- Roy, S.; Rhim, J.-W. Melanin-mediated synthesis of copper oxide nanoparticles and preparation of functional agar/CuO NP nanocomposite films. J. Nanomater. 2019, 2019, 2840517. [Google Scholar] [CrossRef]
- Tomaszewska, E.; Dobrowolski, P.; Kwiecien, M.; Winiarska-Mieczan, A.; Tomczyk, A.; Muszynski, S. The influence of the dietary Cu-glycine complex on the histomorphology of cancellous bone, articular cartilage, and growth plate as well as bone mechanical and geometric parameters is dose dependent. Biol. Trace Elem. Res. 2017, 178, 54–63. [Google Scholar] [CrossRef] [PubMed]
- Wang, Y.; Zhang, W.; Yao, Q. Copper-based biomaterials for bone and cartilage tissue engineering. J. Orthop. Transl. 2021, 29, 60–71. [Google Scholar] [CrossRef] [PubMed]
- Youness, R.A.; Ibrahim, M.A.; Taha, M.A. Evaluation of the electrical and dielectric behavior of the apatite layer formed on the surface of hydroxyapatite/hardystonite/copper oxide hybrid nanocomposites for bone repair applications. Ceram. Int. 2022, 48, 19837–19850. [Google Scholar] [CrossRef]
- Hans, M.; Mathews, S.; Mucklich, F.; Solioz, M. Physicochemical properties of copper important for its antibacterial activity and development of a unified model. Biointerphases 2016, 11, 018902. [Google Scholar] [CrossRef]
- Hans, M.; Erbe, A.; Mathews, S.; Chen, Y.; Solioz, M.; Muecklich, F. Role of Copper Oxides in Contact Killing of Bacteria. Langmuir 2013, 29, 16160–16166. [Google Scholar] [CrossRef]
- Priya, B.A.; Senthilguru, K.; Agarwal, T.; Narayana, S.N.G.H.; Giri, S.; Pramanik, K.; Pal, K.; Banerjee, I. Nickel doped nanohydroxyapatite: Vascular endothelial growth factor inducing biomaterial for bone tissue engineering. RSC Adv. 2015, 5, 72515–72528. [Google Scholar] [CrossRef]
- Baradaran, S.; Moghaddam, E.; Nasiri-Tabrizi, B.; Basirun, W.J.; Mehrali, M.; Sookhakian, M.; Hamdi, M.; Alias, Y. Characterization of nickel-doped biphasic calcium phosphate/graphene nanoplatelet composites for biomedical application. Mater. Sci. Eng. C 2015, 49, 656–668. [Google Scholar] [CrossRef]
- Lü, X.; Bao, X.; Huang, Y.; Qu, Y.; Lu, H.; Lu, Z. Mechanisms of cytotoxicity of nickelions based on gene expression profiles. Biomaterials 2009, 30, 141–148. [Google Scholar] [CrossRef]
- Ates, T.; Dorozhkin, S.V.; Kaygili, O.; Kom, M.; Ercan, I.; Bulut, N.; Firdolas, F.; Keser, S.; Gursoy, N.C.; Ozercan, I.H.; et al. The effects of Mn and/or Ni dopants on the in vitro/in vivo performance, structural and magnetic properties of β-tricalcium phosphate bioceramics. Ceram. Int. 2019, 45, 22752–22758. [Google Scholar] [CrossRef]
- Ince, T.; Kaygili, O.; Tatar, C.; Bulut, N.; Koytepe, S.; Ates, T. The effects of Ni-addition on the crystal structure, thermal properties and morphology of Mg-based hydroxyapatites synthesized by a wet chemical method. Ceram. Int. 2018, 44, 14036–14043. [Google Scholar] [CrossRef]
- Fadlallah, S.A.; El-Bagoury, N.; Sanaa, M.F.; El-Rab, G.; Ahmed, R.A.; El-Ousamii, G. An overview of NiTi shape memory alloy: Corrosion resistance and antibacterial inhibition for dental application. J. Alloys Compd. 2014, 583, 455–464. [Google Scholar] [CrossRef]
- Kanerva, L.; Forstrom, L. Allergic nickel and chromate hand dermatitis induced by orthopaedic metal implant. Contact Dermat. 2001, 44, 103–104. [Google Scholar] [CrossRef] [PubMed]
- Horandghadim, N.; Khalil-Allafi, J. Characterization of hydroxyapatite-tantalum pentoxide nanocomposite coating applied by electrophoretic deposition on Nitinol superelastic alloy. Ceram. Int. 2019, 45, 10448–10460. [Google Scholar] [CrossRef]
- Spriano, S.; Verne, E.; Faga, M.G.; Bugliosi, S.; Maina, G. Surface treatment on an implant cobalt alloy for high biocompatibility and wear resistance. Wear 2005, 259, 919–925. [Google Scholar] [CrossRef]
- Huang, H.L.; Chang, Y.Y.; Chen, H.J.; Chou, Y.K.; Lai, C.H.; Chen, M.Y.C. Antibacterial properties and cytocompatibility of tantalum oxide coatings with different silver content. J. Vac. Sci. Technol. A 2014, 32, 02B117. [Google Scholar] [CrossRef]
- Rudnev, V.S.; Medkov, M.A.; Nedozorov, P.M.; Lukiyanchuk, I.V.; Belobeletskaya, M.V.; Adigamova, M.V. Tantalum oxide-modified calcium phosphate coatings on titanium for biomedical applications. Russ. J. Appl. Chem. 2013, 86, 119–123. [Google Scholar] [CrossRef]
- Levine, B.R.; Sporer, S.; Poggie, R.A.; Della Valle, C.J.; Jacobs, J.J. Experimental and clinical performance of porous tantalum in orthopaedic surgery. J. Biomater. 2006, 27, 4671–4681. [Google Scholar] [CrossRef] [PubMed]
- Minagar, S.; Berndt, C.C.; Wen, C. Fabrication and characterization of nanoporous niobia and nanotubular tantala, titania and zirconia via anodization. J. Funct. Biomater. 2015, 6, 153–170. [Google Scholar] [CrossRef] [PubMed]
- Dhal, J.; Bose, S.; Banyopadhyay, A. Influence of pentavalent dopant addition to polarization and bioactivity of hydroxyapatite. J. Mater. Sci. Eng. C 2013, 33, 3061–3068. [Google Scholar] [CrossRef] [PubMed]
- Chang, Y.Y.; Huang, H.L.; Chen, H.J.; Lai, C.H.; Wen, C.Y. Antibacterial properties and cytocompatibility of tantalum oxide coatings. J. Surf. Coat. Technol. 2014, 259, 193–198. [Google Scholar] [CrossRef]
- Köse, C.; Kacar, R. In vitro bioactivity and corrosion properties of laser beam welded medical grade AISI 316L stainless steel in simulated body fluid. Int. J. Electrochem. Sci. 2016, 11, 2762–2777. [Google Scholar] [CrossRef]
- Wu, L.; Dong, Y.; Yao, L.; Liu, C.; Al-Bishari, A.M.; Ru Yie, K.H.; Zhang, H.; Liu, J.; Wu, G. Nanoporous Tantalum Coated Zirconia Implant Improves Osseointegration. Ceram. Int. 2020, 46, 17437–17448. [Google Scholar] [CrossRef]
- Rahmati, M.; Mozafari, M. Biocompatibility of Alumina-Based Biomaterials—A Review. J. Cell. Physiol. 2019, 234, 3321–3335. [Google Scholar] [CrossRef]
- Savarino, L.; Cenni, E.; Stea, S.; Donati, M.E.; Paganetto, G.; Moroni, A.; Toni, A.; Pizzoferrato, A. X-ray diffraction of newly formed bone close to alumina- or hydroxyapatite-coated femoral stem. Biomaterials 1993, 14, 900–905. [Google Scholar] [CrossRef]
- Kaygili, O.; Keser, S.; Ates, T.; Yakuphanoglu, F. Synthesis and characterization of lithium calcium phosphate ceramics. Ceram. Int. 2013, 39, 7779–7785. [Google Scholar] [CrossRef]
- Duta, L.; Stan, G.E.; Popescu-Pelin, G.; Zgura, I.; Anastasescu, M.; Oktar, F.N. Influence of Post-Deposition Thermal Treatments on the Morpho-Structural, and Bonding Strength Characteristics of Lithium-Doped Biological-Derived Hydroxyapatite Coatings. Coatings 2022, 12, 1883. [Google Scholar] [CrossRef]
- Duta, L.; Chifiriuc, M.C.; Popescu-Pelin, G.; Bleotu, C.; Gradisteanu, G.; Anastasescu, M.; Achim, A.; Popescu, A. Pulsed Laser Deposited Biocompatible Lithium-Doped Hydroxyapatite Coatings with Antimicrobial Activity. Coatings 2019, 9, 54. [Google Scholar] [CrossRef]
- Florian, P.E.; Duta, L.; Grumezescu, V.; Popescu-Pelin, G.; Popescu, A.C.; Oktar, F.N.; Evans, R.W.; Roseanu Constantinescu, A. Lithium-Doped Biological-Derived Hydroxyapatite Coatings Sustain In Vitro Differentiation of Human Primary Mesenchymal Stem Cells to Osteoblasts. Coatings 2019, 9, 781. [Google Scholar] [CrossRef]
- Li, L.; Peng, X.; Qin, Y.; Wang, R.; Tang, J.; Cui, X.; Wang, T.; Liu, W.; Pan, H.; Li, B. Acceleration of bone regeneration by activating Wnt/β-catenin signalling pathway via lithium released from lithium chloride/calcium phosphate cement in osteoporosis. Sci. Rep. 2017, 7, 45204. [Google Scholar] [CrossRef] [PubMed]
- Duta, L.; Neamtu, J.; Melinte, R.P.; Zureigat, O.A.; Popescu-Pelin, G.; Chioibasu, D.; Oktar, F.N.; Popescu, A.C. In Vivo Assessment of Bone Enhancement in the Case of 3D-Printed Implants Functionalized with Lithium-Doped Biological-Derived Hydroxyapatite Coatings: A Preliminary Study on Rabbits. Coatings 2020, 10, 992. [Google Scholar] [CrossRef]
- Gitlin, M. Lithium side effects and toxicity: Prevalence and management strategies. Int. J. Bipolar. Disord. 2016, 4, 27. [Google Scholar] [CrossRef]
- Pankhurst, Q.A.; Thanh, N.T.K.; Jones, S.K.; Dobson, J. Progress in applications of magnetic nanoparticles in biomedicine. J. Phys. D Appl. Phys. 2009, 42, 224001. [Google Scholar] [CrossRef]
- Kramer, E.; Zilm, M.; Wei, M. A comparative study of the sintering behavior of pure and iron substituted hydroxyapatite. Bioceram. Dev. Appl. 2013, 3, 1. [Google Scholar] [CrossRef]
- Singh, S.; Singh, G.; Bala, N. Synthesis and characterization of iron oxide-hydroxyapatite-chitosan composite coating and its biological assessment for biomedical applications. Prog. Org. Coat. 2021, 150, 106011. [Google Scholar] [CrossRef]
- Sarath Chandra, V.; Baskar, G.; Suganthi, R.V.; Elayaraja, K.; Ahymah Joshy, M.I.; Sofi Beaula, W.; Mythili, R.; Venkatraman, G.; Narayana Kalkura, S. Blood compatibility of iron-doped nanosize hydroxyapatite and its drug release. ACS Appl. Mater. Interfaces 2012, 4, 1200–1210. [Google Scholar] [CrossRef]
- Abraham, R.; Walton, J.; Russell, L.; Wolman, R.; Wardley-Smith, B.; Green, J.R.; Mitchell, A.; Reeve, J. Dietary determinants of post-menopausal bone loss at the lumbar spine: A possible beneficial effect of iron. Osteoporos. Int. 2006, 17, 1165–1173. [Google Scholar] [CrossRef]
- Panseri, S.; Cunha, C.; D’Alessandro, T.; Sandri, M.; Giavaresi, G.; Marcacci, M.; Hung, C.T.; Tampieri, A. Intrinsically superparamagnetic Fe-hydroxyapatite nanoparticles positively influence osteoblast-like cell behaviour. J. Nanobiotechnol. 2012, 10, 32. [Google Scholar] [CrossRef]
- Fouly, A.; Alnaser, I.A.; Assaifan, A.K.; Abdo, H.S. Evaluating the Performance of 3D-Printed PLA Reinforced with Date Pit Particles for Its Suitability as an Acetabular Liner in Artificial Hip Joints. Polymers 2022, 14, 3321. [Google Scholar] [CrossRef]
- Widodo, P.; Mulyawan, W.; Djustiana, N.; Joni, I.M. Synthesis and Characterization of Zirconia–Silica PMMA Nanocomposite for Endodontic Implants. Dent. J. 2023, 11, 57. [Google Scholar] [CrossRef]
- Fouly, A.; Ibrahim, A.M.M.; Sherif, E.-S.M.; FathEl-Bab, A.M.R.; Badran, A.H. Effect of Low Hydroxyapatite Loading Fraction on the Mechanical and Tribological Characteristics of Poly(Methyl Methacrylate) Nanocomposites for Dentures. Polymers 2021, 13, 857. [Google Scholar] [CrossRef] [PubMed]
- Gizer, S.G.; Bhethanabotla, V.R.; Ayyala, R.S.; Sahiner, N. Low-pressure plasma treated polycarbonate and polymethyl methacrylate (PMMA) sheets with different surface patterns to change their surface properties. Surf. Interfaces 2023, 37, 102646. [Google Scholar] [CrossRef]
- Nasrallah, D.A.; Ibrahim, M.A. Enhancement of physico-chemical, optical, dielectric and antimicrobial properties of polyvinyl alcohol/carboxymethyl cellulose blend films by addition of silver doped hydroxyapatite nanoparticles. J. Polym. Res. 2022, 29, 86. [Google Scholar] [CrossRef]
- El Fewaty, N.H.; El Sayed, A.M.; Hafez, R.S. Synthesis, structural and optical properties of tin oxide nanoparticles and its CMC/PEG–PVA nanocomposite films. Polym. Sci. Ser. A 2016, 58, 1004–1016. [Google Scholar] [CrossRef]
- Hashim, A.; Hadi, Q. Structural, electrical and optical properties of (biopolymer blend/titanium carbide) nanocomposites for low cost humidity sensors. J. Mater. Sci. Mater. Electron. 2018, 29, 11598–11604. [Google Scholar] [CrossRef]
- Teotia, A.K.; Raina, D.B.; Singh, C.; Sinha, N.; Isaksson, H. Nano-hydroxyapatite bone substitute functionalized with bone active molecules for enhanced cranial bone regeneration. ACS Appl. Mater. Interfaces 2017, 9, 6816–6828. [Google Scholar] [CrossRef] [PubMed]
- Pang, X.; Zhitomirsky, I. Electrodeposition of composite hydroxyapatite–chitosan films. Mater. Chem. Phys. 2005, 94, 245–251. [Google Scholar] [CrossRef]
- Venkatesan, J.; Kim, S.K. Chitosan composites for bone tissue engineering—An overview. Mar. Drugs 2010, 8, 2252–2266. [Google Scholar] [CrossRef] [PubMed]
- Pighinelli, L.; Kucharska, M. Chitosan–hydroxyapatite composites. Carbohydr. Polym. 2013, 93, 256–262. [Google Scholar] [CrossRef] [PubMed]
- Sun, T.; Khan, T.H.; Sultana, N. Fabrication and in vitro evaluation of nanosized hydroxyapatite/chitosan-based tissue engineering scaffolds. J. Nanomater. 2014, 14, 194680. [Google Scholar] [CrossRef]
- Augustine, R.; Kalappura, U.G.; Mathew, K.T. Biocompatibility study of hydroxyapatite-chitosan composite for medical applications at microwave frequencies. Microw. Opt. Technol. Lett. 2008, 50, 2931–2934. [Google Scholar] [CrossRef]
- Xianmiao, C.; Yubao, L.; Yi, Z.; Li, Z.; Jidong, L.; Huanan, W. Properties and in vitro biological evaluation of nano-hydroxyapatite/chitosan. membranes for bone guided regeneration. Mater. Sci. Eng. C 2009, 29, 29–35. [Google Scholar] [CrossRef]
- Gomez Sanchez, A.; Prokhorov, E.; Luna-Barcenas, G.; Mora-García, A.G.; Kovalenko, Y.; Rivera-Muñoz, E.M.; Raucci, M.G.; Buonocore, G. Chitosan-hydroxyapatite nanocomposites: Effect of interfacial layer on mechanical and dielectric properties. Mater. Chem. Phys. 2018, 217, 151–159. [Google Scholar] [CrossRef]
- Ma, R.; Sask, K.N.; Shi, C.; Brash, J.L.; Zhitomirsky, I. Electrodeposition of polypyrrole-heparin and polypyrrole-hydroxyapatite films. Mater. Lett. 2011, 65, 681–684. [Google Scholar] [CrossRef]
- Nezakati, T.; Seifalian, A.; Tan, A.; Seifalian, A.M. Conductive Polymers: Opportunities and Challenges in Biomedical Applications. Chem. Rev. 2018, 118, 6766–6843. [Google Scholar] [CrossRef]
- Panero, S.; Serra Moreno, J.; Aleandri, P.; Landi, E.; Sprio, S.; Tampieri, A. Porous hydroxyapatite surface-modified by polypyrrole-heparin conducting polymer. Key Eng. Mater. 2008, 361–363, 443–446. [Google Scholar]
- Sebastian, M.T. Measurement of Microwave Dielectric Properties and Factors Affecting Them. In Dielectric Materials for Wireless Communication; Sebastian, M.T., Ed.; Elsevier Science: Amsterdam, The Netherlands, 2008; pp. 11–47. [Google Scholar] [CrossRef]
- Iqbal, S.; Younas, M.; ul Hassan, M.; Ryu, H.J.; Anjum, M.A.R.; Farhan, M.A.; Nadeem, M.; Yun, J.-I. Electronic, electrical and dielectric analysis of Cr-doped hydroxyapatite. Chem. Phys. Lett. 2021, 771, 138507. [Google Scholar] [CrossRef]
- Ercan, I.; Kaygili, O.; Kayed, T.; Bulut, N.; Tombuloğlu, H.; İnce, T.; Ahmari, F.A.; Kebiroglu, H.; Ates, T.; Almofleh, A.; et al. Structural, spectroscopic, dielectric, and magnetic properties of Fe/Cu co-doped hydroxyapatites prepared by a wet-chemical method. Phys. B Condens. Matter 2022, 625, 413486. [Google Scholar] [CrossRef]
- Nayak, B.; Misra, P.K. Exploration of the structural and dielectric characteristics of a potent hydroxyapatite coated gallium bioceramics for the forthcoming biomedical and orthopedic applications. Mater. Chem. Phys. 2020, 239, 121967. [Google Scholar] [CrossRef]
- Choudhury, S.; Sinha, M.; Mandal, M.K.; Pradhan, S.K.; Meikap, A.K. Electrical transport properties of nanocrystalline nonstoichiometric nickel ferrite at and above room temperature. Phys. B Condens. Matter 2015, 457, 225–231. [Google Scholar] [CrossRef]
- Padiyan, D.P.; Marikani, A.; Murali, K. Influence of thickness and substrate temperature on electrical and photoelectrical properties of vacuum-deposited CdSe thin films. Mater. Chem. Phys. 2003, 78, 51–58. [Google Scholar] [CrossRef]
- Mene, R.U.; Mahabole, M.P.; Mohite, K.C.; Khairnar, R.S. Improved gas sensing and dielectric properties of Fe doped hydroxyapatite thick films: Effect of molar concentrations. Mater. Res. Bull. 2014, 50, 227–234. [Google Scholar] [CrossRef]
- Gurgenc, T. Structural characterization and dielectrical properties of Ag-doped nano-strontium apatite particles produced by hydrothermal method. J. Mol. Struct. 2021, 1223, 128990. [Google Scholar] [CrossRef]
- Das, A.; Rabha, S.; Saxena, V.; Bhardwaj, A.; Pandey, L.M.; Emmanuel, K.A.; Dobbidi, P. The role of electrical property in determining the response of 20H-80S composite thin films fabricated for biological applications. J. Mater. Sci. 2022, 57, 13586–13602. [Google Scholar] [CrossRef]
- Mahanty, A.; Shikha, D. Structural Characterization, Dielectric Properties, Corrosion Resistance, and In Vitro Thrombogenicity of Zinc-Fabricated Hydroxyapatite Implants. J. Mater. Eng. Perform. 2023. [Google Scholar] [CrossRef]
- Das, A.; Saxena, V.; Bhardwaj, A.; Rabha, S.; Pandey, L.M.; Dobbidi, P. Microstructural, interfacial, biological and electrical activity in sputtered Hydroxyapatite-Barium strontium titanate bilayered thin films. Surf. Interfaces 2022, 31, 102063. [Google Scholar] [CrossRef]
- Mahanty, A.; Shikha, D. Microstructural, biocompatibility and mechanical investigation of MgHAp and AgHAp: Comparative report. J. Mater. Sci. Mater. Med. 2023, 34, 22. [Google Scholar] [CrossRef] [PubMed]
- Fekry, A.; El-Sherif, R.M. Electrochemical Corrosion Behavior of Magnesium and Titanium Alloys in Simulated Body Fluid. Electrochim. Acta 2009, 54, 7280–7285. [Google Scholar] [CrossRef]
- Wei, G.; Ma, P.X. Structure and Properties of Nano-Hydroxyapatite/Polymer Composite Scaffolds for Bone Tissue Engineering. Biomaterials 2004, 25, 4749–4757. [Google Scholar] [CrossRef] [PubMed]
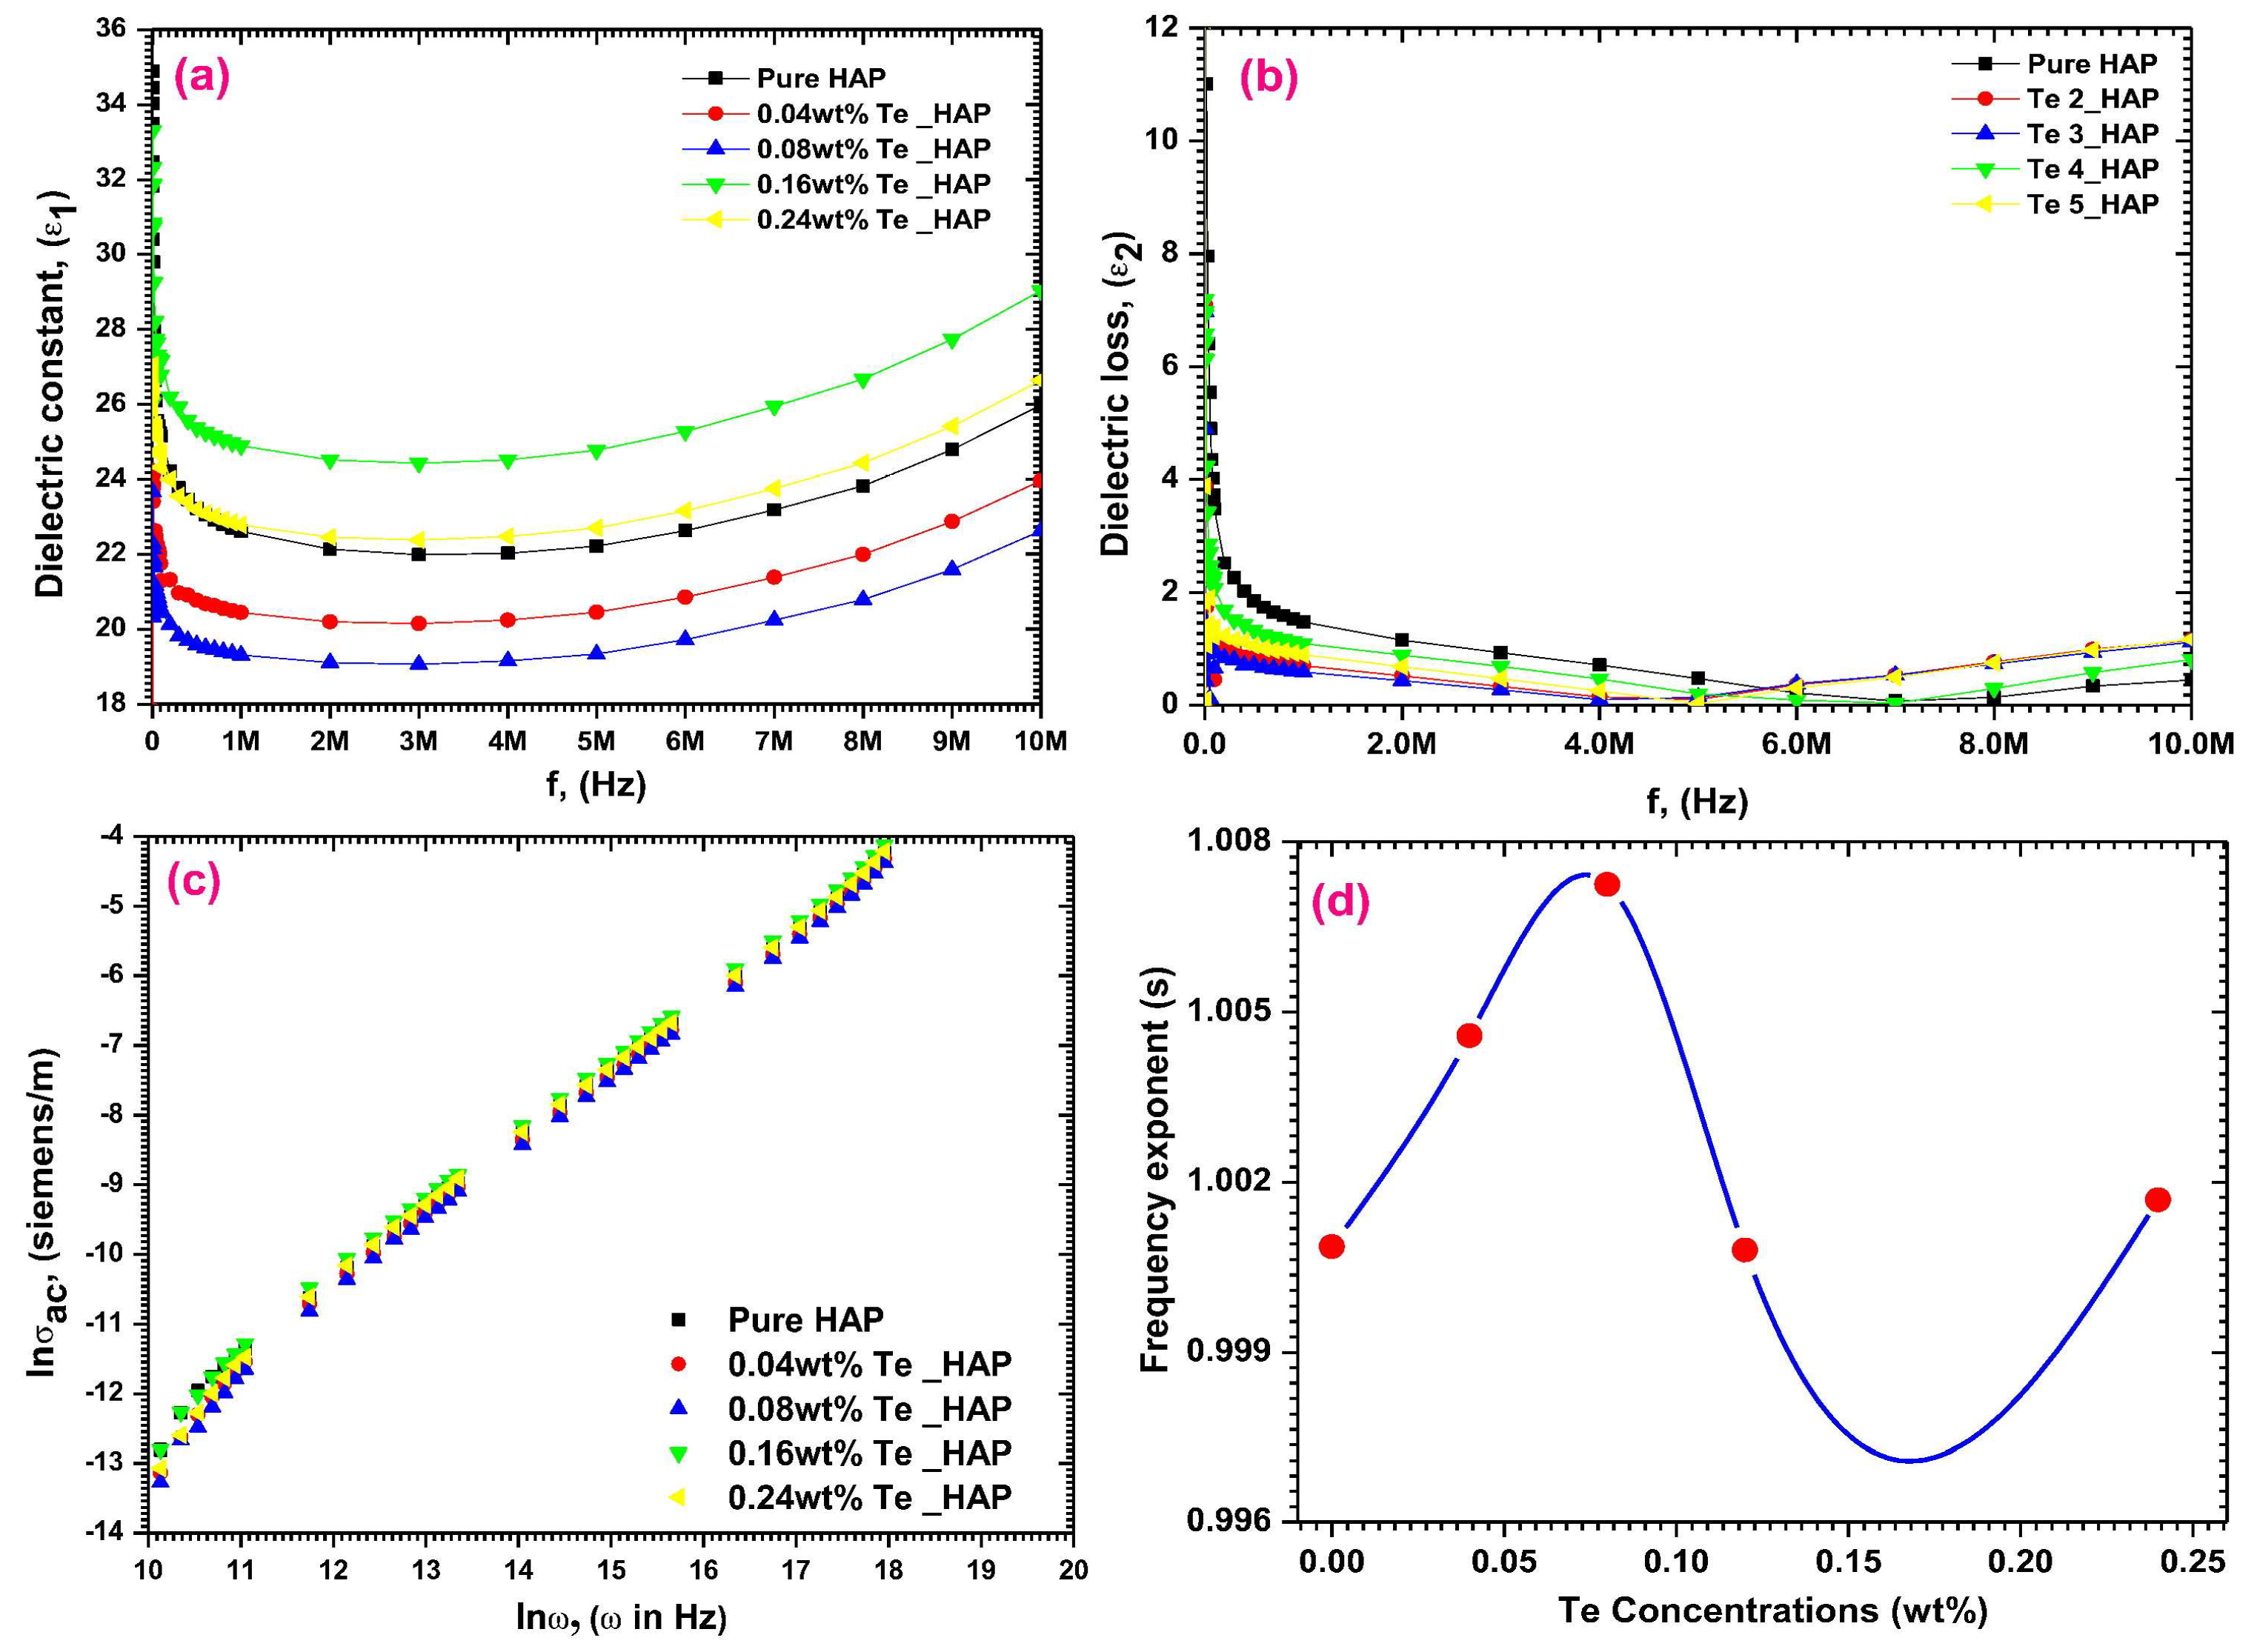
- Yahia, I.S.; Shkir, M.; AlFaify, S.; Ganesh, V.; Zahran, H.Y.; Kilany, M. Facile microwave-assisted synthesis of Te-doped hydroxyapatite nanorods and nanosheets and their characterizations for bone cement applications. Mater. Sci. Eng. C 2017, 72, 472–480. [Google Scholar] [CrossRef]
- Poovendran, K.; Wilson, K.S.J.; Revathy, M.S.; Ayeshamariam, A.; Kaviyarasu, K. Functionalization effect of HAp with copper (Cu) having excellent dielectric applications. Surf. Interfaces 2020, 19, 100474. [Google Scholar] [CrossRef]
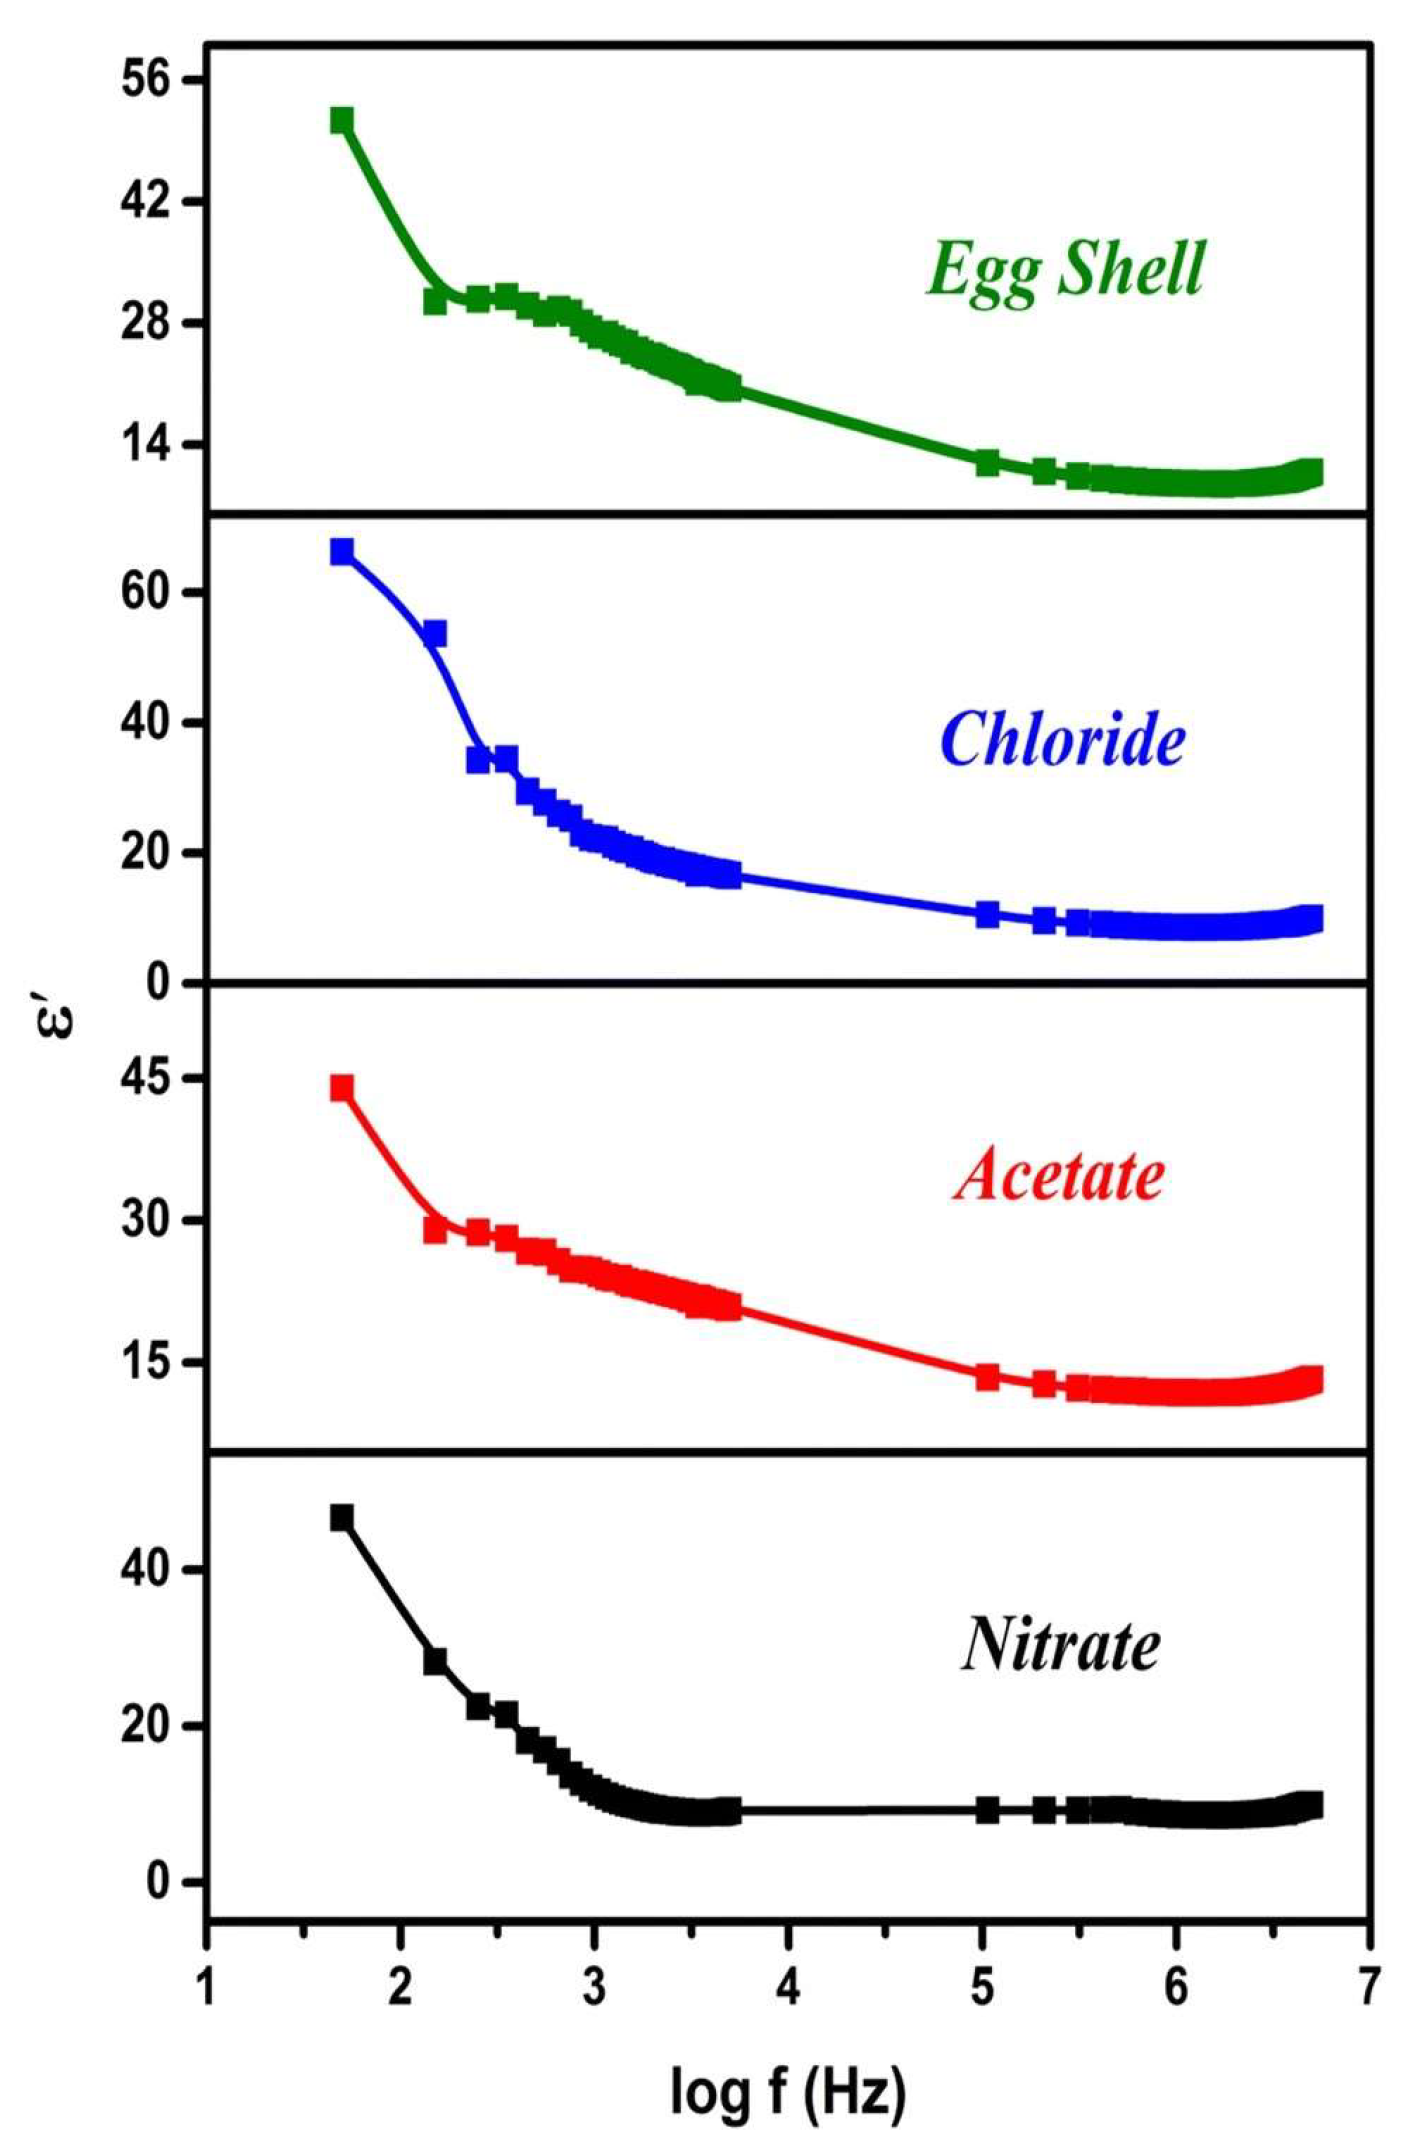
- Sundarabharathi, L.; Ponnamma, D.; Parangusan, H.; Chinnaswamy, M.; Al-Maadeed, M.A.A. Effect of anions on the structural, morphological and dielectric properties of hydrothermally synthesized hydroxyapatite nanoparticles. SN Appl. Sci. 2020, 2, 94. [Google Scholar] [CrossRef]
- Callister, W.C., Jr. Materials Science and Engineering—An Introduction, 7th ed.; John Wiley and Sons: New York, NY, USA, 1997. [Google Scholar]
- Lee, W.; Liu, J.F.; Nowick, A. Limiting behavior of ac conductivity in ionically conducting crystals and glasses: A new universality. Phys. Rev. Lett. 1991, 67, 1559. [Google Scholar] [CrossRef] [PubMed]
- Dubey, A.K.; Mallik, P.K.; Kundu, S.; Basu, B. Dielectric and electrical conductivity properties of multi-stage spark plasma sintered HA–CaTiO3 composites and comparison with conventionally sintered materials. J. Eur. Ceram. Soc. 2013, 33, 3445–3453. [Google Scholar] [CrossRef]
- Kaygili, O.; Tatar, C. The investigation of some physical properties and microstructure of Zn-doped hydroxyapatite bioceramics prepared by sol–gel method. J. Sol-Gel Sci. Technol. 2012, 61, 296–309. [Google Scholar] [CrossRef]
- Jonscher, A.K. The ‘universal’ dielectric response. Nature 1977, 267, 673–679. [Google Scholar] [CrossRef]
- Kaygili, O.; Tatar, C.; Yakuphanoglu, F. Structural and dielectrical properties of Mg3–Ca3(PO4)2 bioceramics obtained from hydroxyapatite by sol-gel method. Ceram. Int. 2012, 38, 5713–5722. [Google Scholar] [CrossRef]
- Shkir, M.; Kilany, M.; Yahia, I.S. Facile microwave-assisted synthesis of tungsten doped hydroxyapatite nanorods: A systematic structural, morphological, dielectric, radiation and microbial activity studies. Ceram. Int. 2017, 43, 14923–14931. [Google Scholar] [CrossRef]
- Funke, K. Jump relaxation in solid electrolytes. Prog. Solid State Chem. 1993, 22, 111–195. [Google Scholar] [CrossRef]
- Hashim, A.; Hadi, Q. Synthesis of novel (polymer blend-ceramics) Nanocomposites: Structural, optical and electrical properties for humidity sensors. J. Inorg. Organomet. Polym. Mater. 2018, 28, 1394–1401. [Google Scholar] [CrossRef]
- Kaygili, O.; Dorozhkin, S.V.; Ates, T.; Gursoy, N.C.; Keser, S.; Yakuphanoglu, F.; Selcuk, A.B. Structural and dielectric properties of yttrium-substituted hydroxyapatites. Mater. Sci. Eng. C 2015, 47, 333–338. [Google Scholar] [CrossRef] [PubMed]
- Xue, D.; Kitamura, K. Dielectric characterization of the defect concentration in lithium niobate single crystals. Solid State Commun. 2002, 122, 537–541. [Google Scholar] [CrossRef]
- Roy, P.; Kalia, V.; Bera, J. Comparison of Electrical Properties between Ca and Sr Hydroxyapatites Materials; Indian Institute of Technology: Kharagpur, West Bengal, India, 2004. [Google Scholar]
- Bamzai, K.; Suri, S.; Singh, V. Synthesis, characterization, thermal and dielectric properties of pure and cadmium doped calcium hydrogen phosphate. Mater. Chem. Phys. 2012, 135, 158–167. [Google Scholar] [CrossRef]
- Mahabole, M.P.; Aiyer, R.C.; Ramakrishna, C.V.; Sreedhar, B.; Khairnar, R.S. Synthesis, characterization and gas sensing property of hydroxyapatite ceramic. Bull. Mater. Sci. 2005, 28, 535–545. [Google Scholar] [CrossRef]
- Biryan, F.; Demirelli, K. Thermal degradation kinetic, electrical and dielec-tric behavior of brush copolymer with a polystyrene backbone and polyacrylate-amide side chains/nanographene-filled composites. J. Mol. Struct. 2019, 1186, 187–203. [Google Scholar] [CrossRef]
- Kaygili, O.; Keser, S.; Dorozhkin, S.V.; Yakuphanoglu, F.; Al-Ghamdi, A.A.; Kirbag, S.; Sertkaya, D.; Ates, T.; Gursoy, N.C. Structural and dielectrical properties of Ag-and Ba-substituted hydroxyapatites. J. Inorg. Organomet. Polym. Mater. 2014, 24, 1001–1008. [Google Scholar] [CrossRef]
- Behera, B.; Nayak, P.; Choudhary, R.N.P. Structural and impedance properties of KBa2V5O15 ceramics. Mater. Res. Bull. 2008, 43, 401–410. [Google Scholar] [CrossRef]
- Kaygili, O.; Dorozhkin, S.V.; Keser, S.; Yakuphanoglu, F. Investigation of the crystal structure, dielectric, electrical and microstructural properties of cobalt-containing calcium orthophosphates. Mater. Sci.-Medzg. 2015, 21, 282–287. [Google Scholar] [CrossRef]
- Panneerselvam, R.; Anandhan, N.; Gopu, G.; Roselin, A.A.; Ganesan, K.P.; Marimuthu, T. Impact of different transition metal ions in the structural, mechanical, optical, chemicophysical and biological properties of nanohydroxyapatite. Appl. Surf. Sci. 2020, 506, 144802. [Google Scholar] [CrossRef]
- Abdullah, O.G.; Aziz, S.B.; Rasheed, M.A. Incorporation of NH4NO3 into MC-PVA blend-based polymer to prepare protonconducting polymer electrolyte films. Ionics 2018, 24, 777–785. [Google Scholar] [CrossRef]
- Mohammed, G.; El Sayed, A.M. Structural, morphological, optical and dielectric properties of M3+/PVA/PEG SPE Films (M = La, Y, Fe or Ir). Polym. Adv. Technol. 2019, 30, 698–712. [Google Scholar] [CrossRef]
- Abdel-Baset, A.; Hassen, A. Dielectric relaxation analysis and Ac conductivity of polyvinyl alcohol/polyacrylonitrile film. Phys. B 2016, 499, 24–28. [Google Scholar] [CrossRef]
- El-Gamal, S.; El Sayed, A.M. Physical properties of the organic polymeric blend (PVA/PAM) modified with MgO nanofillers. J. Compos. Mater. 2019, 53, 2831–2847. [Google Scholar] [CrossRef]
- El-Sayed, S. Optical properties and dielectric relaxation of polyvinylidene fluoride thin films doped with gadolinium chloride. Phys. B 2014, 454, 197–203. [Google Scholar] [CrossRef]
- Lakshmanaperumal, S.; Mahendran, C. Structural, dielectric, cytocompatibility, and in vitro bioactivity studies of yttrium and strontium co-substituted nano-hydroxyapatite by sol–gel method. J. Sol-Gel Sci. Technol. 2018, 88, 296–308. [Google Scholar] [CrossRef]
- Kaygili, O.; Ates, T.; Keser, S.; Al-Ghamdi, A.A.; Yakuphanoglu, F. Controlling of dielectrical properties of hydroxyapatite by ethylenediamine tetraacetic acid (EDTA) for bone healing applications. Spectrochim. Acta Part A Mol. Biomol. Spectrosc. 2014, 129, 268–273. [Google Scholar] [CrossRef]
- Mote, V.; Purushotham, Y.; Dole, B. Structural, morphological, physical and dielectric properties of Mn doped ZnO nanocrystals synthesized by sol–gel method. Mater. Des. 2016, 96, 99–105. [Google Scholar] [CrossRef]
- Biryan, F.; Demirelli, K. Temperature-frequency dependence on electrical properties of EuCI3 based composites, thermal behaviors and preparation of poly (3-acetamido propyl acrylate). Ferroelectrics 2018, 526, 76–94. [Google Scholar] [CrossRef]
- Ahmed, H.; Hashim, A. Fabrication of PVA/NiO/SiC nanocomposites and studying their dielectric properties for antibacterial applications. Egypt. J. Chem. 2020, 63, 805–811. [Google Scholar] [CrossRef]
- Goloshchapov, D.L.; Lenshin, A.S.; Tutov, E.A.; Ponomarev, Y.A.; Maraeva, E.V. Sorption properties of composite materials based on calcium hydroxyapatite. Smart Nanocompos. 2013, 4, 101–104. [Google Scholar]
- Mensah-Darkwa, K.; Gupta, R.K.; Kumar, D. Mechanical and corrosion properties of magnesium-hydroxyapatite (Mg–HA) composite thin films. J. Mater. Sci. Technol. 2013, 29, 788–794. [Google Scholar] [CrossRef]
- Jogiya, B.V.; Jethava, H.O.; Tank, K.P.; Raviya, V.R.; Joshi, M.J. Impedance and modulus spectroscopic study of nano hydroxyapatite. AIP Conf. Proc. 2016, 1728, 020227. [Google Scholar] [CrossRef]
- Lobo, L.S.; Kalainathan, S.; Ruban, K.A. Investigation of electrical studies of spinel FeCo2O4 synthesized by sol gel method. Superlattice Microstruct. 2015, 88, 116–126. [Google Scholar] [CrossRef]
- Nisar, A.; Iqbal, S.; Rehman, M.A.U.; Mahmood, A.; Younas, M.; Hussain, S.Z.; Tayyaba, Q.; Shah, A. Study of physico-mechanical and electrical properties of cerium doped hydroxyapatite for biomedical applications. Mater. Chem. Phys. 2023, 299, 127511. [Google Scholar] [CrossRef]
- Swain, S.; Bhaskar, R.; Gupta, M.K.; Sharma, S.; Dasgupta, S.; Kumar, A.; Kumar, P. Mechanical, Electrical, and Biological Properties of Mechanochemically Processed Hydroxyapatite Ceramics. Nanomaterials 2021, 11, 2216. [Google Scholar] [CrossRef]
- Uribe, R.; Rojas, I.; Riofrio, M.C.; Lascano, L.; González, G. Polarization and biomineralization of hydroxyapatite-barium titanate composites. J. Phys. Conf. Ser. 2022, 2238, 012007. [Google Scholar] [CrossRef]
- Babu, K.V.; Veeraiah, V. Dielectric and impedance analysis of Li0.5La0.5Ti1-xZrxO3(x ¼ 0.05 and 0.1) ceramics as improved electrolyte material for lithium-ion batteries. Mater. Sci. Pol. 2016, 34, 605–616. [Google Scholar] [CrossRef]
- Liu, J.; Duan, C.G.; Yin, W.G.; Mei, W.N.; Smith, R.W.; Hardy, J.R. Large dielectric constant and Maxwell-Wagner relaxation in Bi2/3Cu3Ti4O12. Phys. Rev. B 2004, 70, 144106. [Google Scholar] [CrossRef]
- Barsoukov, E.; Macdonald, J.R. Impedance Spectroscopy: Theory, Experiment, and Applications; John Wiley & Sons Inc.: Hoboken, NJ, USA, 2005. [Google Scholar]
- Iguchi, E.; Nakamura, N.; Aoki, A. Electrical transport properties in semiconducting BaPbxBi1−xO3 using complex-plane impedance analyses. J. Phys. Chem. Solids 1997, 58, 755–763. [Google Scholar] [CrossRef]
- Masataka, H.; Kuromura, T.; Chen, Y.; Kusuda, H. Influence of Porosity and Pore Size on Electrical Resistivity of Porous Aluminum Produced by Spacer Method. Mater. Trans. 2007, 48, 32–36. [Google Scholar]
- Singh, L.; Kim, I.W.; Sin, B.C.; Ullah, A.; Woo, S.K.; Lee, Y. Study of dielectric, AC-impedance, modulus properties of 0.5Bi0.5Na0.5TiO3-0.5CaCu3Ti4O12 nano-composite synthesized by a modified solid state method. J. Mater. Sci. Semicond. Process. 2015, 31, 386–396. [Google Scholar] [CrossRef]
- Khusayfan, N.M. Ferroelectric properties of Ce doped hydroxyapatite nanoceramics. J. Alloys Compd. 2016, 685, 350–354. [Google Scholar] [CrossRef]
- Celardo, I.; Pedersen, J.Z.; Traversa, E.; Ghibelli, L. Pharmacological potential of cerium oxide nanoparticles. Nanoscale 2011, 3, 1411–1420. [Google Scholar] [CrossRef]
- Singh, B.; Kumar, S.; Basu, B.; Gupta, R. Enhanced ionic conduction in hydroxyapatites. Mater. Lett. 2013, 95, 100–102. [Google Scholar] [CrossRef]
- Sahoo, P.S.; Panigrahi, A.; Patri, S.K.; Choudhary, R.N.P. Impedance spectroscopy of Ba3Sr2DyTi3V7O30 ceramic. Bull. Mater. Sci. 2010, 33, 129–134. [Google Scholar] [CrossRef]
- Rout, A.; Agrawal, S. Structural, Morphological and Electrical Properties of New Type Dy Doped Ca6-xNa2Y2(SiO4)6(OH)2 Hydroxyapatite Compound Synthesized by Co–Precipitation Method. J. Electroceram. 2022, 48, 74–94. [Google Scholar] [CrossRef]
- Yamashita, K.; Kitagaki, K.; Umegaki, T. Thermal Instability and Proton Conductivity of Ceramic Hydroxyapatite at High Temperatures. J. Am. Ceram. Soc. 1995, 78, 1191–1197. [Google Scholar] [CrossRef]
- Nagai, M.; Nishino, T. Surface conduction of porous hydroxyapatite ceramics at elevated temperatures. Solid State Ion. 1988, 28–30, 1456–1461. [Google Scholar] [CrossRef]
- Sallam, S.M.; Tohami, K.M.; Sallam, A.M.; Salem, L.I.A.; Mohamed, F.A. Synthesis and characterization of hydroxyapatite contain chromium. J. Biophys. Chem. 2012, 3, 278. [Google Scholar] [CrossRef]
- Sidebottom, D.L. Colloquium: Understanding ion motion in disordered solids from impedance spectroscopy scaling. Rev. Mod. Phys. 2009, 8, 899. [Google Scholar] [CrossRef]
- Gupta, S.; Sharma, A.; Tomar, M.; Gupta, V.; Pal, M. Piezoresponse force microscopy and vibrating sample magnetometer study of single phased Mn induced multiferroic BiFeO3 thin film. J. Appl. Phys. 2012, 111, 064110. [Google Scholar] [CrossRef]
- Raihan, R.; Adkins, J.M.; Baker, J.; Rabbi, F.; Reifsnider, K. Relationship of dielectric property change to composite material state degradation. Compos. Sci. Technol. 2014, 105, 160–165. [Google Scholar] [CrossRef]
- Laghzizil, A.; Elherch, N.; Bouhaouss, A.; Lorente, G.; Coradin, T.; Livage, J. Electrical behavior of hydroxyapatites M10(PO4)6(OH)2 (M ¼ Ca, Pb, Ba). Mater. Res. Bull. 2001, 36, 953–962. [Google Scholar] [CrossRef]
- Chung, S.H.; Jeffrey, K.R.; Stevens, J.R.; Borjesson, L. Dynamics of silver ions in (AgI)x-(Ag2O-nB2O3)1-x glasses: A 109Ag nuclear magnetic resonance study. Phys. Rev. B 1990, 41, 6154–6164. [Google Scholar] [CrossRef] [PubMed]
- Kumar, T.V.; Chary, A.S.; Bhardwaj, S.; Awasthi, A.M.; Reddy, S.N. Dielectric relaxation, Ionic conduction and complex impedance studies on NaNO3 fast ion conductor. Int. J. Mater. Sci. Appl. 2013, 2, 173–178. [Google Scholar] [CrossRef]
- Vainas, B.; Almond, D.P.; Luo, J.; Stevens, R. An evaluation of random R–C networks for modelling the bulk ac electrical response of ionic conductors. Solid State Ion. 1999, 126, 65–80. [Google Scholar] [CrossRef]
- Almond, D.P.; Vainas, B. The dielectric properties of random R–C networks as an explanation of the “universal” power law dielectric response of solids. J. Phys. Condens. Matter 1999, 11, 9081–9094. [Google Scholar] [CrossRef]
- El-Mallah, H.M. AC electrical conductivity and dielectric properties of perovskite (Pb, Ca)TiO3 ceramic. Acta Phys. Pol. A 2012, 122, 174–179. [Google Scholar] [CrossRef]
- Arul, K.T.; Kolanthai, E.; Manikandan, E.; Bhalerao, G.M.; Chandra, V.S.; Ramya, J.R.; Mudali, U.K.; Nair, K.G.M.; Kalkura, S.N. Green synthesis of magnesium ion incorporated nanocrystallinehydroxyapatite and their mechanical, dielectric and photoluminescence properties. Mater. Res. Bull. 2015, 67, 55–62. [Google Scholar] [CrossRef]
- Horiuchi, N.; Endo, J.; Wada, N.; Nozaki, K.; Nakamura, M.; Nagai, A.; Katayama, K.; Yamashita, K. Dielectric properties of fluorine substituted hydroxyapatite: The effect of the substitution on configuration of hydroxide ion chains. J. Mater. Chem. B 2015, 3, 6790–6797. [Google Scholar] [CrossRef]
- Yashima, M.; Yonehara, Y.; Fujimori, H. Experimental Visualization of Chemical Bonding and Structural Disorder in Hydroxyapatite through Charge and Nuclear-Density Analysis. J. Phys. Chem. C 2011, 115, 25077–25087. [Google Scholar] [CrossRef]
- Tank, K.P.; Jogiya, B.V.; Kanchan, D.K.; Joshi, M.J. Dielectric Properties of Pure and Strontium Doped Nano-Hydroxyapatite. Solid State Phenom. 2014, 209, 151–155. [Google Scholar] [CrossRef]
- Mahabole, M.P.; Mene, R.U.; Khairnar, R.S. Gas sensing and dielectric studies on cobalt doped hydroxyapatite thick films. Adv. Mater. Lett. 2013, 4, 46–52. [Google Scholar] [CrossRef]
- Samanta, B.; Kumar, P.; Prakash, C. Effect of sintering temperature and Cu-rich secondary phase on dielectric properties of microwave processed CaCu3Ti4O12 ceramics. Ferroelectrics 2017, 517, 46–57. [Google Scholar] [CrossRef]
- Ikoma, T.; Yamazaki, A. Preparation and dielectric property of sintered monoclinic hydroxyapatite. J. Mater. Sci. Lett. 1999, 8, 1225–1228. [Google Scholar] [CrossRef]
- Swain, S.; Kumar, P.; Sonia. Microstructural, mechanical and electrical properties of BT, BZT-BCT, and BNT-BT-BKT ferroelectrics synthesized by mechanochemical route. Ceram. Int. 2021, 47, 26511–26518. [Google Scholar] [CrossRef]
- Suri, S.; Bamzai, K.K.; Singh, V. Dielectric and conductivity studies on pure and cadmium doped barium phosphate crystals. Ferroelectrics 2011, 423, 94–104. [Google Scholar] [CrossRef]
- Lee, W.S.; Su, C.Y.; Lee, Y.C.; Lin, S.P.; Yang, T. Effects of dopant on the dielectric properties of CaZrO3 ceramic sintered in a reducing atmosphere. Jpn. J. Appl. Phys. 2006, 45, 5853–5858. [Google Scholar] [CrossRef]
- Verma, A.S.; Kumar, D.; Dubey, A.K. Dielectric and electrical response of hydroxyapatite—Na0.5K0.5NbO3 bioceramic composite. Ceram. Int. 2019, 45, 3297–3305. [Google Scholar] [CrossRef]
- Tavangar, M.; Heidari, F.; Hayati, R.; Tabatabaei, F.; Vashaee, D.; Tayebi, L. Manufacturing and characterization of mechanical, biological and dielectric properties of hydroxyapatite-barium titanate nanocomposite scaffolds. Ceram. Int. 2020, 46, 9086–9095. [Google Scholar] [CrossRef]
- Samanta, B.; Nanda, D.; Kumar, P.; Sahu, R.; Swain, S.; Mahapatra, A. Giant dielectric response in microwave processed CaCu3Ti4O12 ceramics: A correlation among microstructure, dielectric and impedance properties. Process. Appl. Ceram. 2019, 13, 387–400. [Google Scholar] [CrossRef]
- Dubey, A.; Anumol, E.A.; Balani, K.; Basu, B. Multifunctional Properties of Multistage Spark Plasma Sintered HA–BaTiO3-Based Piezobiocomposites for Bone Replacement Applications. J. Am. Ceram. Soc. 2013, 96, 3753–3759. [Google Scholar] [CrossRef]
- Horiuchi, N.; Endo, J.; Wada, N.; Nozaki, K.; Nakamura, M.; Nagai, A.; Katayama, K.; Yamashita, K. Dielectric properties of stoichiometric and defect-induced hydroxyapatite. J. Appl. Phys. 2013, 113, 134905. [Google Scholar] [CrossRef]
- Kahn, M.L.; Zhang, Z.J. Synthesis and magnetic properties of CoFe2O4 spinel ferrite nanoparticles doped with lanthanide ions. Appl. Phys. Lett. 2001, 78, 3651–3653. [Google Scholar] [CrossRef]
- Koops, C.G. On the Dispersion of Resistivity and Dielectric Constant of Some Semiconductors at Audiofrequencies. Phys. Rev. 1951, 83, 121–124. [Google Scholar] [CrossRef]
- Julian, J.G.; Neuhaus, N.; Bernemann, M.; Silva, J.P.D.; Laptev, A.; Bram, M. Unveiling the mechanisms of cold sintering of ZnO at 250 °C by varying applied stress and characterizing grain boundaries by Kelvin Probe Force Microscopy. Acta. Mater. 2018, 144, 116–128. [Google Scholar] [CrossRef]
- Sun, L.; Shi, Z.; Liang, L.; Wei, S.; Wang, H.; Davoud, D.; Sun, K.; Fan, R. Layer-structured BaTiO3/P(VDF–HFP) composites with concurrently improved dielectric permittivity and breakdown strength toward capacitive energy-storage applications. J. Mater. Chem. C 2020, 8, 10257–10265. [Google Scholar] [CrossRef]
- Sun, L.; Shi, Z.; Wang, H.; Zhang, K.; Davoud, D.; Sun, K.; Fan, R. Ultrahigh discharge efficiency and improved energy density in rationally designed bilayer polyetherimide–BaTiO3/P(VDF-HFP) composites. J. Mater. Chem. A 2020, 8, 5750–5757. [Google Scholar] [CrossRef]
- Yang, J.; Xiaotong, Z.; Wang, H.; Wang, X.; Hao, C.; Fan, R.; Dastan, D.; Shi, Z. Achieving excellent dielectric performance in polymer composites with ultralow filler loadings via constructing hollow-structured filler frameworks. Compos. Part A 2020, 131, 105814. [Google Scholar] [CrossRef]
- Iqbal, N.; Kadir, M.R.A.; Malek, N.A.N.N.; Mahmood, N.H.B.; Murali, M.R.; Kamarul, T. Characterization and antibacterial properties of stable silver substituted hydroxyapatite nanoparticles synthesized through surfactant assisted microwave process. Mater. Res. Bull. 2013, 48, 3172–3177. [Google Scholar] [CrossRef]
- Burtfoot, J.C. Ferroelectrics: An Introduction to the Physical Principles; Van Nostrand-Reinbold: London, UK, 1967. [Google Scholar]
- Joshi, J.H.; Kanchan, D.K.; Joshi, M.J.; Jethva, H.O.; Parikh, K.D. Dielectric relaxation, complex impedance and modulus spectroscopic studies of mix phase rod like cobalt sulfide nanoparticles. Mater. Res. Bull. 2017, 93, 63–73. [Google Scholar] [CrossRef]
- Das, A.; Chikkala, A.K.; Bharti, G.P.; Behera, R.R.; Mamilla, R.S.; Khare, A.; Dobbidi, P. Effect of thickness on optical and microwave dielectric properties of Hydroxyapatite films deposited by RF magnetron sputtering. J. Alloys Compd. 2018, 739, 729–736. [Google Scholar] [CrossRef]
- Mitra, A.; Mahanty, A.; Kumar, R.; Shikha, D. Microstructure, Corrosion, Dielectric, Thrombogenicity, Wettability and Mechanical Investigation of PMMA/HAp Pellet and PMMA/HAp Coating on Al2O3: A Comparative Study. J. Mater. Eng. Perform. 2023. [Google Scholar] [CrossRef]
- Dubey, A.K.; Kakimoto, K.I. Impedance spectroscopy and mechanical response of porous nanophase hydroxyapatite–barium titanate composite. Mater. Sci. Eng. C 2016, 63, 211–221. [Google Scholar] [CrossRef]
- Zyane, A.; Belfkira, A.; Brouillette, F.; Lucas, R.; Marchet, P. Microcrystalline cellulose as a green way for substituting BaTiO3 in dielectric composites and improving their dielectric properties. Cellul. Chem. Technol. 2015, 49, 783–787. [Google Scholar]
- Ashraf, F.A.; Mohammad, L.H.; Azza, A.W.; Emad, M.E.G. Processing, dynamic mechanical thermal analysis, and dielectric properties of barium titanate/cellulosic polymer nanocomposites. Polym. Compos. 2017, 38, 893–907. [Google Scholar] [CrossRef]
- Zhang, J.; Nie, J.; Zhang, Q.; Li, Y.; Wang, Z.; Hu, Q. Preparation and characterization of bionic bone structure chitosan/hydroxyapatite scaffold for bone tissue engineering. J. Biomater. Sci. Polym. Ed. 2014, 25, 61–74. [Google Scholar] [CrossRef] [PubMed]
- Lee, W.; Kim, H. Microstructure dependence of electrical properties of Ba0.5Sr0.5TiO3 thin films deposited on Pt/SiO2/Si. J. Appl. Phys. 1996, 80, 5891. [Google Scholar] [CrossRef]
- Kao, K.C. , Dielectric Phenomena in Solids; Elsevier Academic Press: Amsterdam, The Netherlands, 2004. [Google Scholar] [CrossRef]
- Thakral, G.; LaFontaine, J.; Najafi, B.; Talal, T.K.; Kim, P.; Lavery, L.A. Electrical stimulation to accelerate wound healing. Diabet. Foot Ankle 2013, 4, 22081. [Google Scholar] [CrossRef] [PubMed]
- Long, Y.; Wei, H.; Li, J.; Yao, G.; Yu, B.; Ni, D.; Gibson, A.L.; Lan, X.; Jiang, Y.; Cai, W.; et al. Effective wound healing enabled by discrete alternative electric fields from wearable nanogenerators. ACS Nano 2018, 12, 12533–12540. [Google Scholar] [CrossRef] [PubMed]
- Goldstein, C.; Sprague, S.; Petrisor, B.A. Electrical stimulation for fracture healing: Current evidence. J. Orthop. Trauma 2010, 24, 62–65. [Google Scholar] [CrossRef] [PubMed]
- Griffin, M.; Bayat, A. Electrical stimulation in bone healing: Critical analysis by evaluating levels of evidence. Eplasty 2011, 11, E34. [Google Scholar]
- Das, A.; Barua, E.; Mushahary, S.M.; Bhardwaj, A.; Saxena, V.; Pandey, L.; Deoghare, A.; Dobbidi, P. A comparative study of microstructural, biological, and mechanical properties in 20H-80B and 20H-80S composite scaffolds. Mater. Lett. 2021, 304, 130668. [Google Scholar] [CrossRef]
- Das, A.; Dobbidi, P.; Bhardwaj, A.; Saxena, V.; Pandey, L.M. Microstructural, electrical and biological activity in Ca10(PO4)6(OH)2 − Ba0.5Sr0.5TiO3 ceramic composites designed for tissue engineering applications. Sci. Rep. 2021, 11, 22304. [Google Scholar] [CrossRef]
- Behera, R.R.; Das, A.; Pamu, D.; Pandey, L.M.; Sankar, M.R. Mechano-tribological properties and in vitro bioactivity of biphasic calcium phosphate coating on Ti-6Al-4V. J. Mech. Behav. Biomed. Mater. 2018, 86, 143. [Google Scholar] [CrossRef]
- Sawase, T.; Jimbo, R.; Baba, K.; Shibata, Y.; Ikeda, T.; Atsuta, M. Photo-induced hydrophilicity enhances initial cell behavior and early bone apposition. Clin. Oral Implant. Res. 2008, 19, 491. [Google Scholar] [CrossRef] [PubMed]
- Schonhals, A.; Kremer, F. Broadband Dielectric Spectroscopy; Springer: Berlin/Heidelberg, Germany, 2003. [Google Scholar]
- Rayssi, C.; El Kossi, S.; Dhahri, J.; Khirouni, K. Frequency and Temperature-Dependence of Dielectric Permittivity and Electric Modulus Studies of the Solid Solution Ca0.85Er0.1Ti1−xCo4x/3O3 (0 ≤ x ≤ 0.1). RSC Adv. 2018, 31, 17139–17150. [Google Scholar] [CrossRef] [PubMed]


| Material | Dopant Concentration | Synthesis Method | Investigated Electrical/Dielectric Parameters | Frequency Range | Temperature [K] | Refs. |
|---|---|---|---|---|---|---|
| Te-doped HA nanorods/nanosheets | 0.04; 0.08; 0.16; 0.24 wt.% | Microwave-assisted technique | Dielectric constant, dielectric loss, AC conductivity | 3 kHz–10 MHz | RT | [182] |
| Sr-doped HA nanorods | 0.03; 0.06; 0.12; 0.24; 0.48 | Microwave/hydrothermal technique | Dielectric constant, dielectric loss, AC conductivity | 3 kHz–10 MHz | RT | [97] |
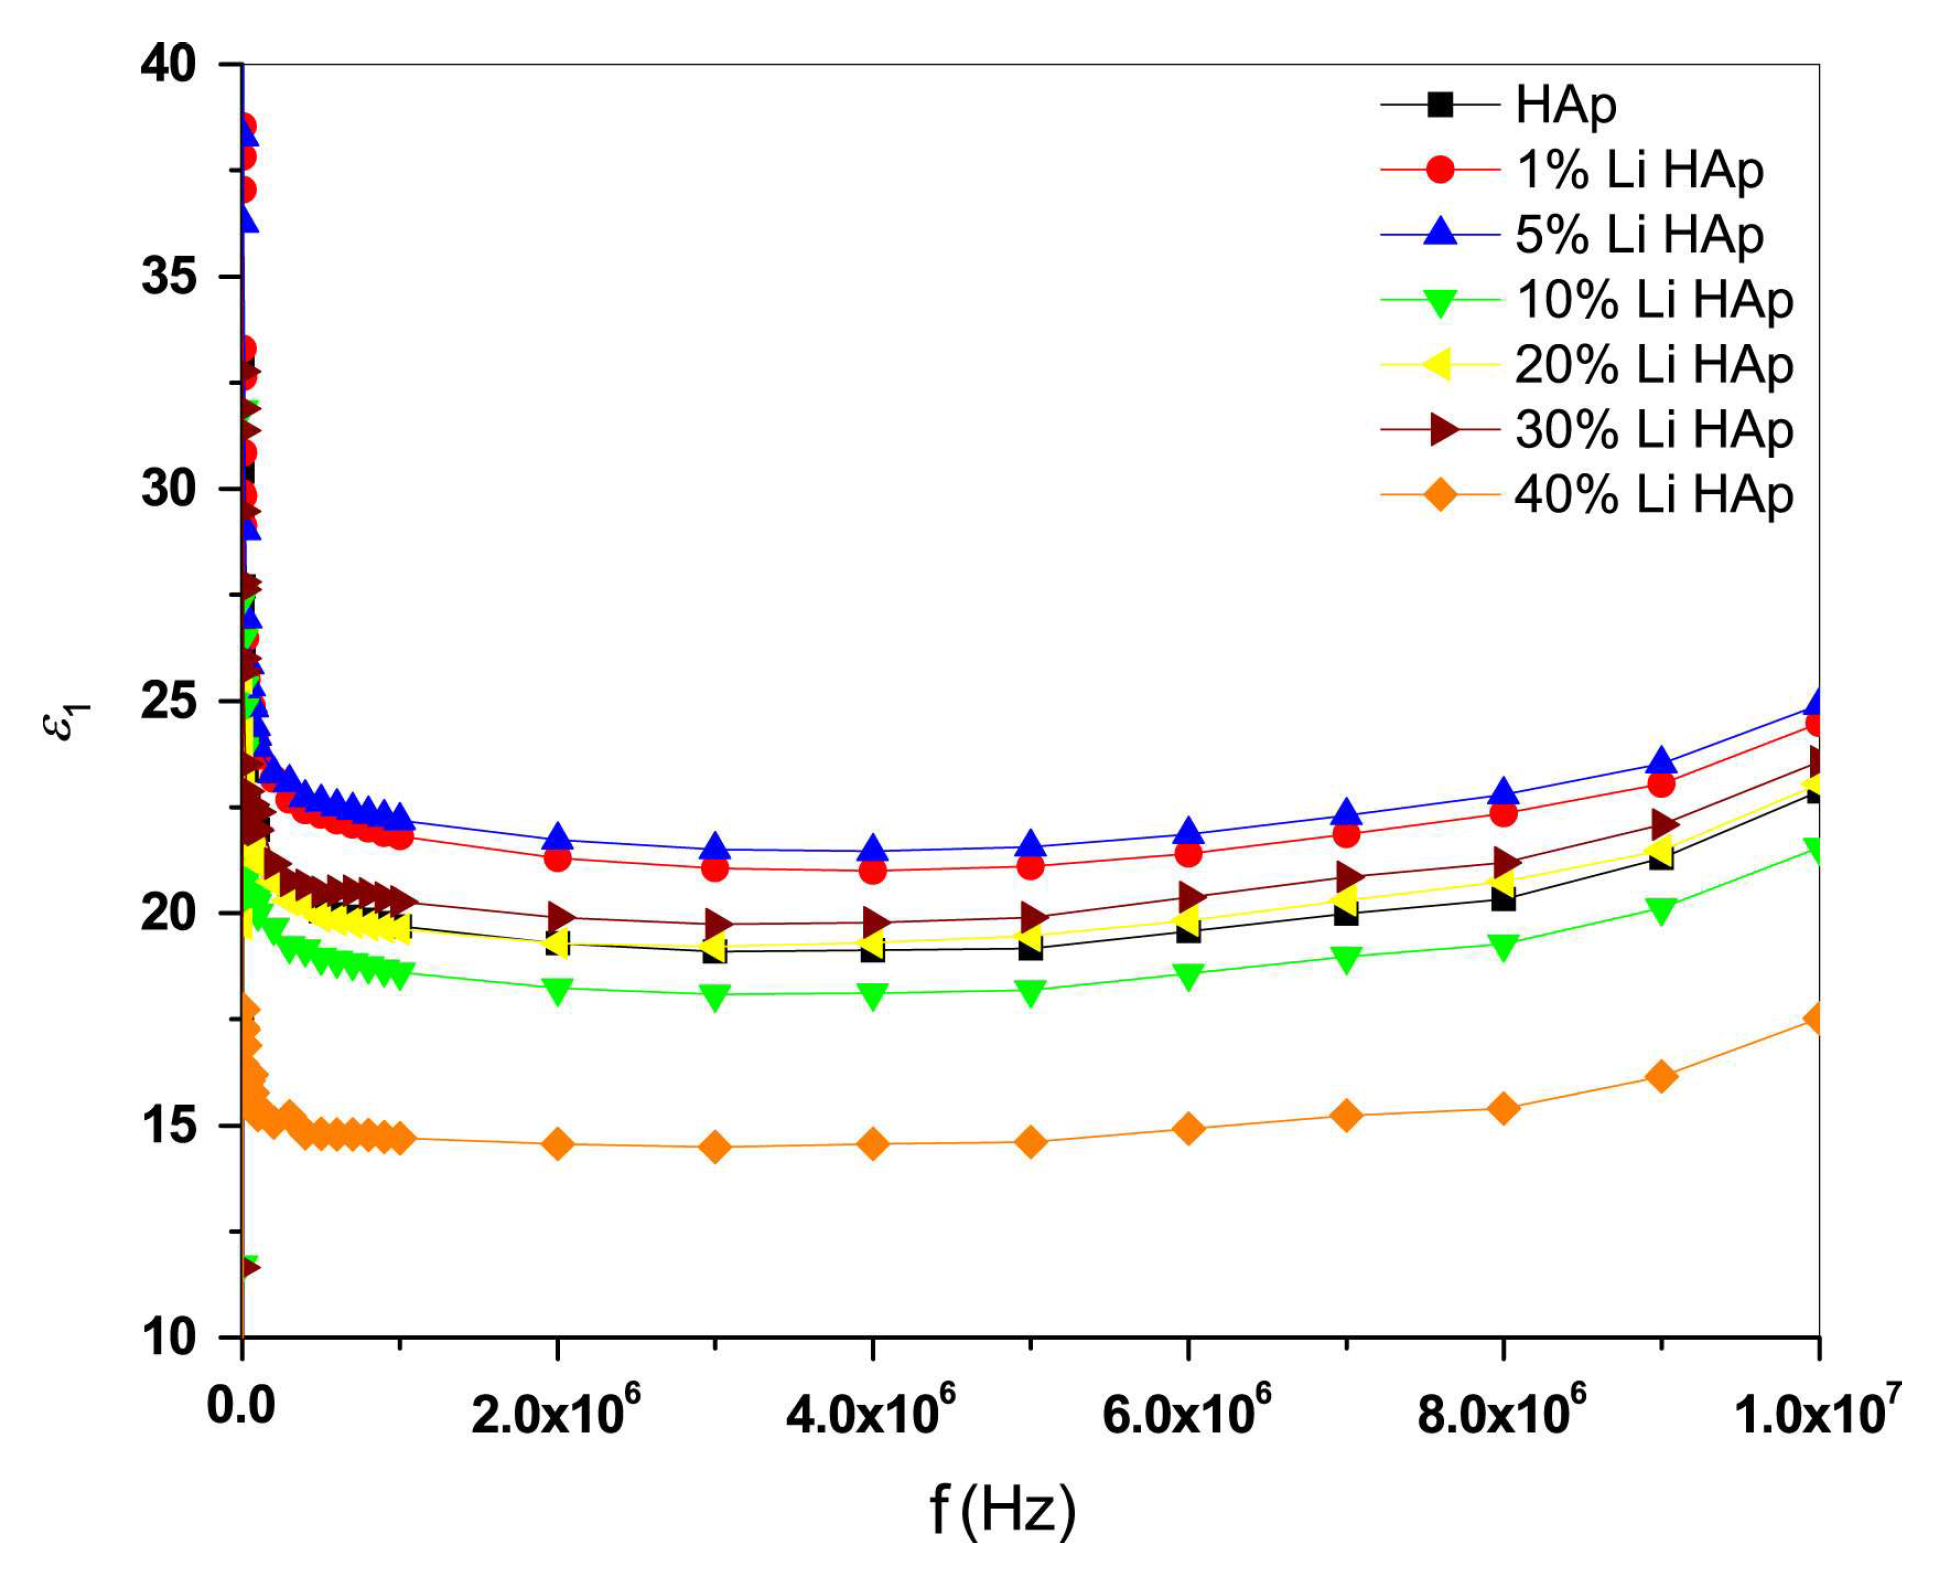
| Li-doped HA nanocomposites | 0; 1; 5; 10; 20; 30; 40 wt.% | Sol-gel technique | Dielectric, AC conductivity | 3 kHz–10 MHz | RT | [7] |
| Cu-doped HA | 0.2; 0.4; 0.6; 0.8 mol | Co-precipitation technique | Impedance, tangent loss, dielectric constant | – | – | [183] |
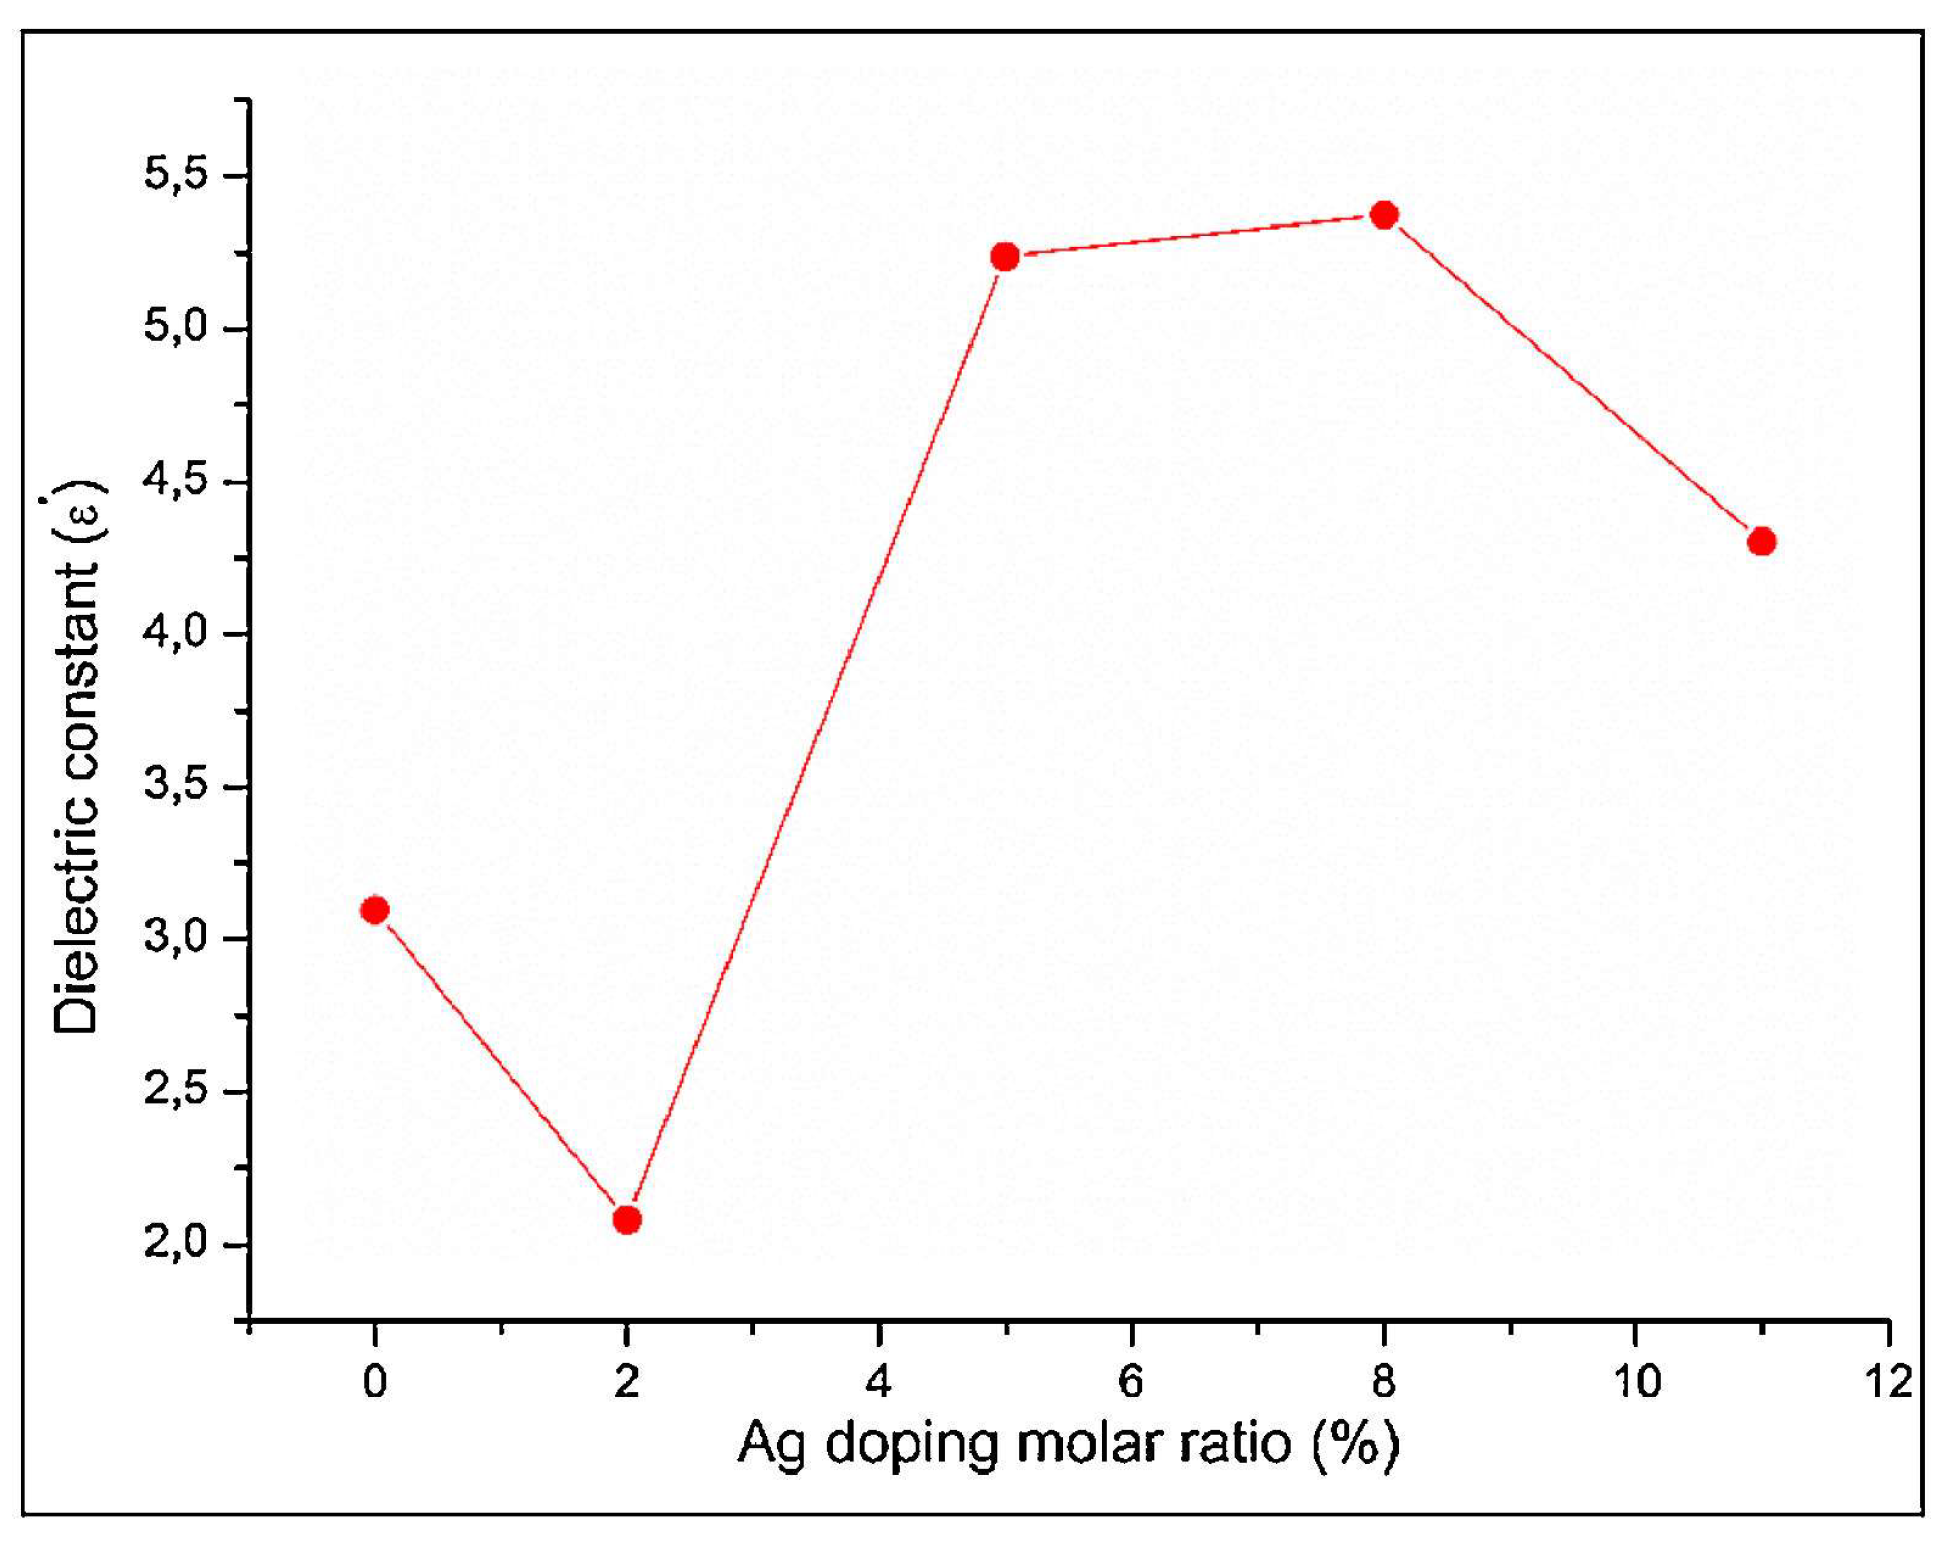
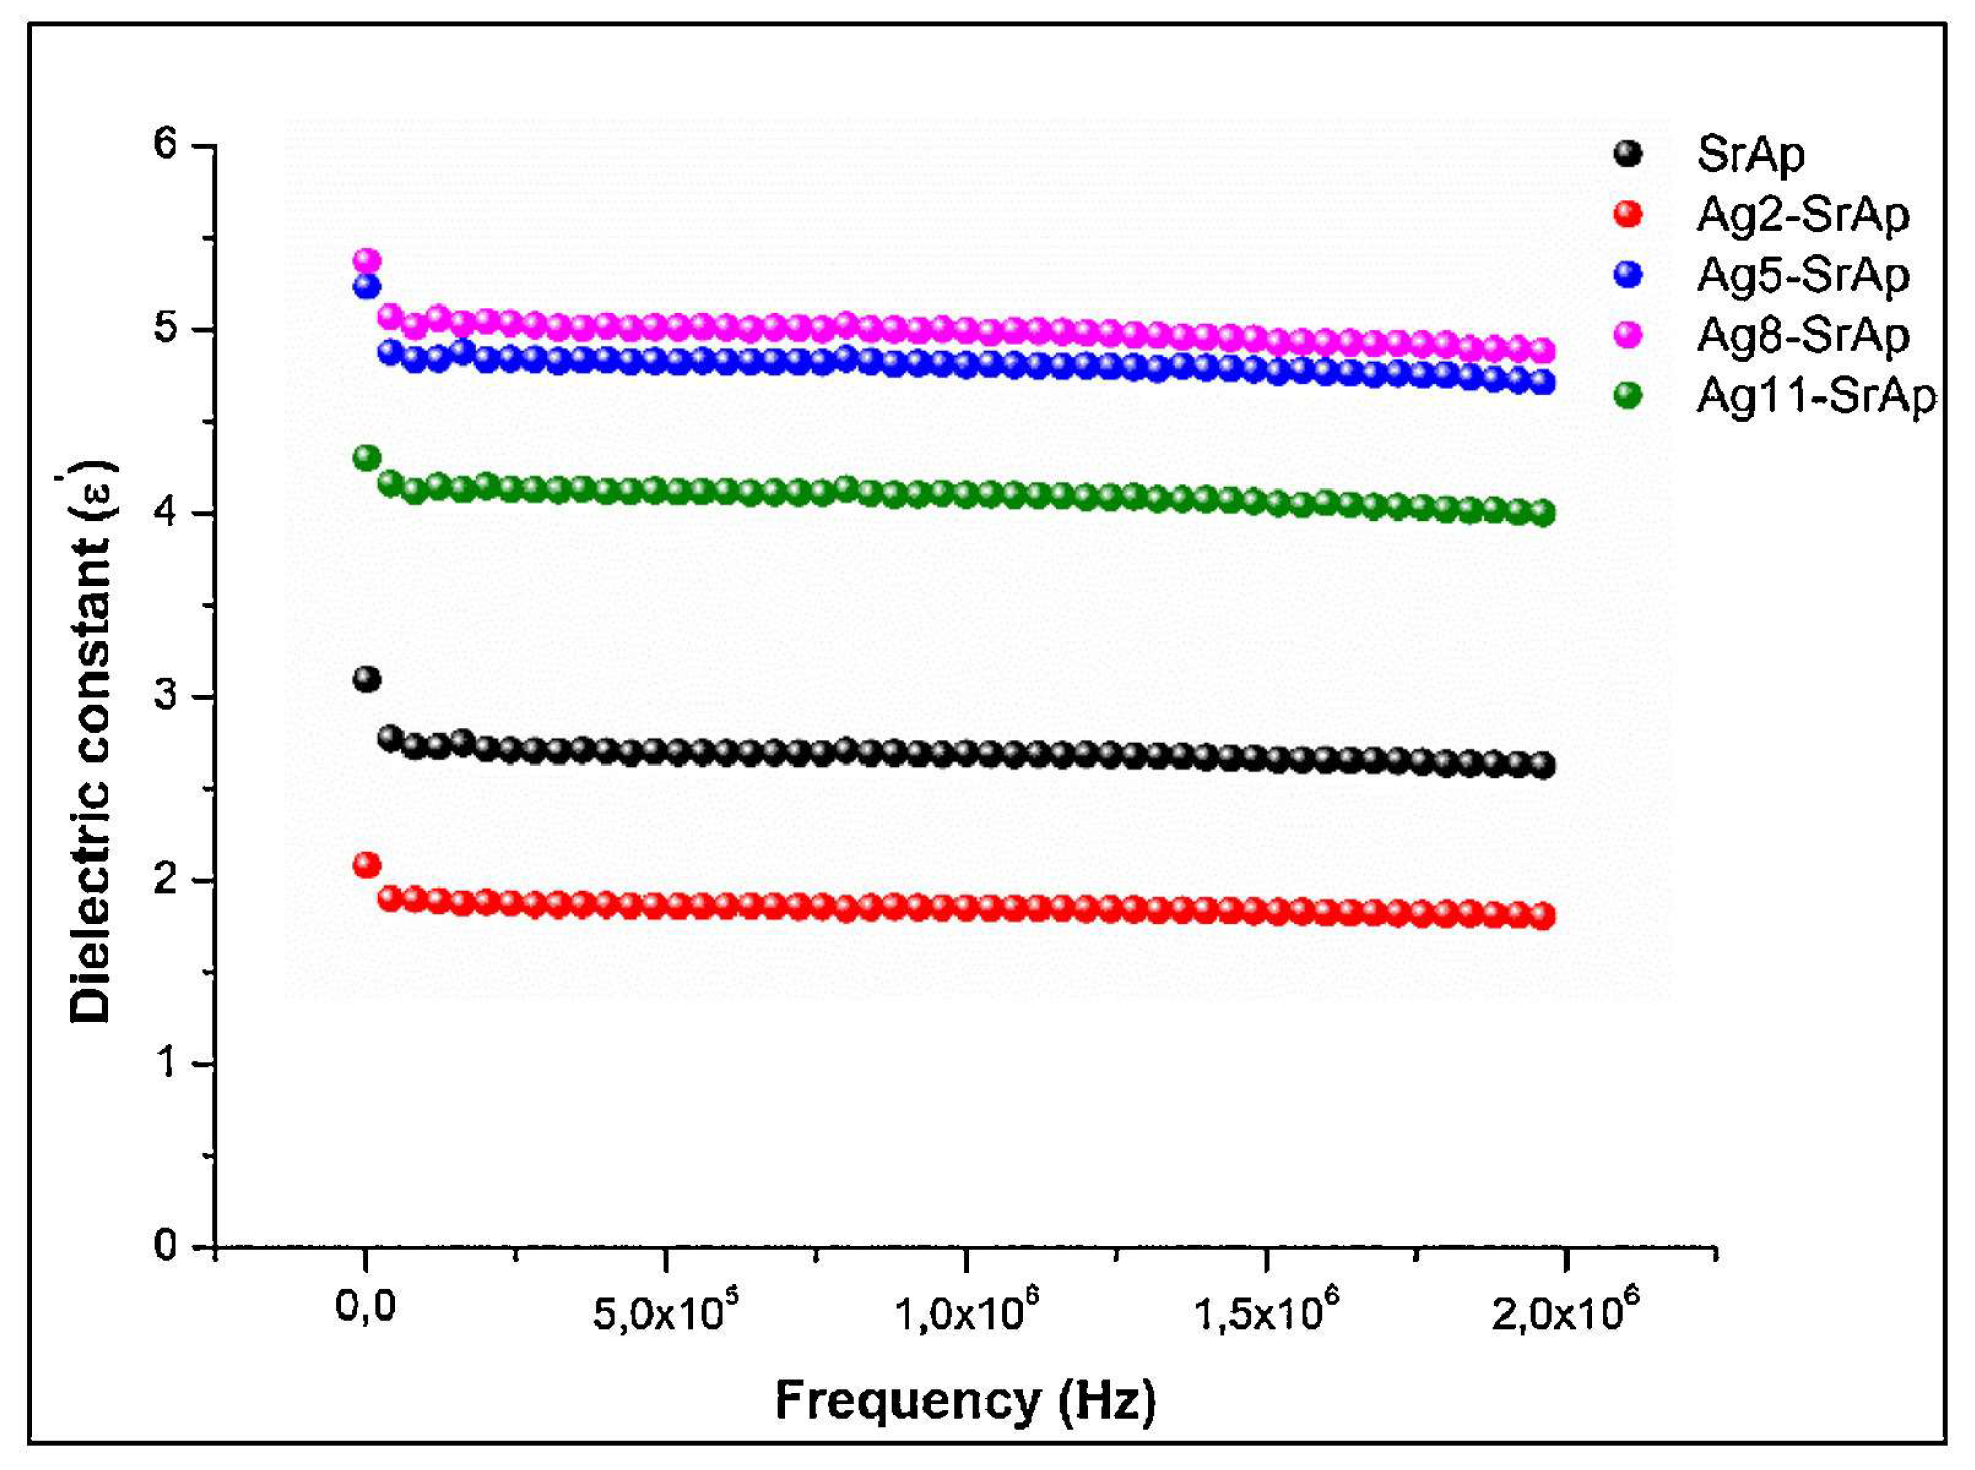
| Ag-doped nano-Sr apatite particles | 2; 5; 8; 11 mol | Hydrothermal technique | Dielectric constant, dielectric loss, AC conductivity | 1 kHz–2 MHz | RT | [175] |
| V-doped HA nanorods | 1; 5; 10; 20; 30% | Sol-gel/ hydrothermal technique | Dielectric constant, AC conductivity | 3 kHz–10 MHz | RT | [105] |
| (La, Ba, Fe, and Zn)-doped HA | 0.02; 0.05% | Sol-gel technique | AC conductivity, impedance | 50 Hz–5 MHz | 309–688 | [26] |
| Ag-doped HA | 0; 0.2; 0.4; 0.8; 1 mol | In situ hydrothermal technique | Dielectric permittivity, ionic conductivity, complex impedance | – | 613 | [85] |
| Fe/Cu-co-doped HA | (0.29 at.%)/0; 0.29; 0.58; 0.87 | Wet-chemical technique | Dielectric constant, dielectric loss, AC conductivity | 10 Hz–10 MHz | RT | [170] |
| HA/hardystonite/copper oxide | 0; 2.5; 5; 7.5 wt.% | Mechanochemical synthesis technique | AC conductivity, dielectric constant, dielectric loss | 1–20 MHz | RT | [115] |
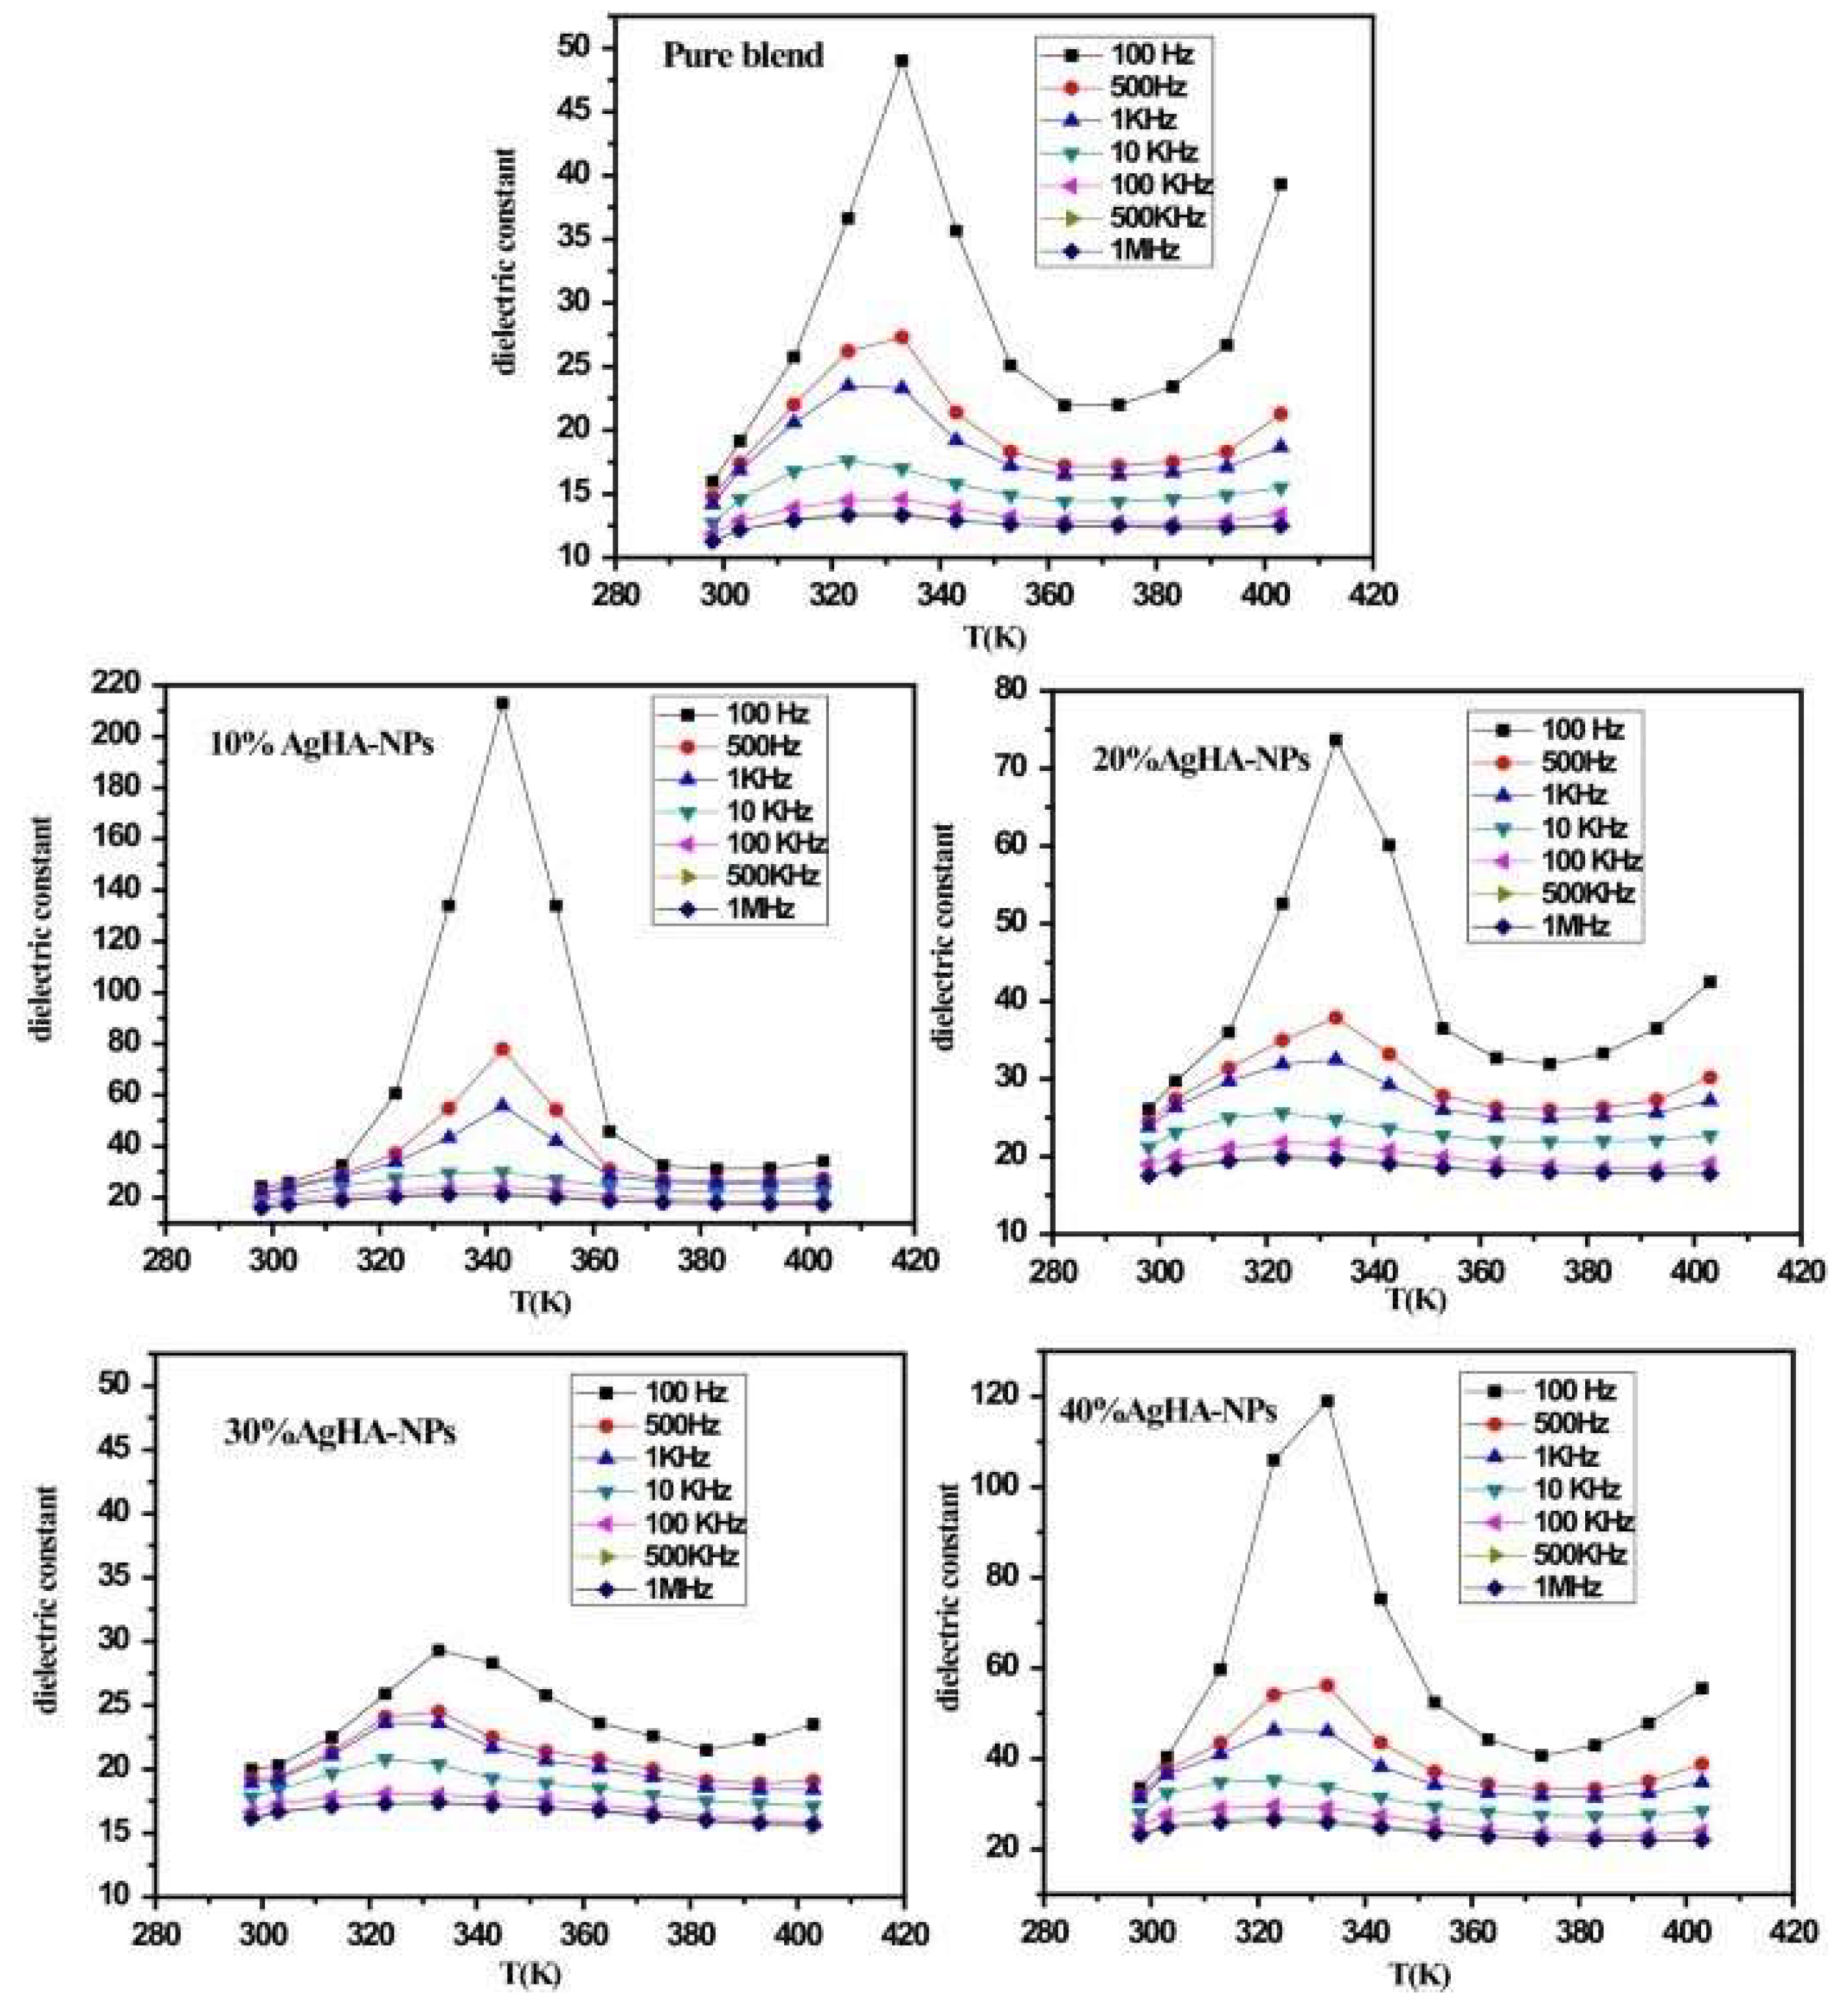
| Ag-doped HA NPs | 10; 20; 30; 40 wt.% | Casting technique | Dielectric constant, AC conductivity | 100 kHz–1 MHz | 303–405 | [154] |
| HA NPs | – | Autoclave assisted hydrothermal technique | Dielectric constant, dielectric loss, AC conductivity | 1 kHz–5 MHz | RT | [184] |
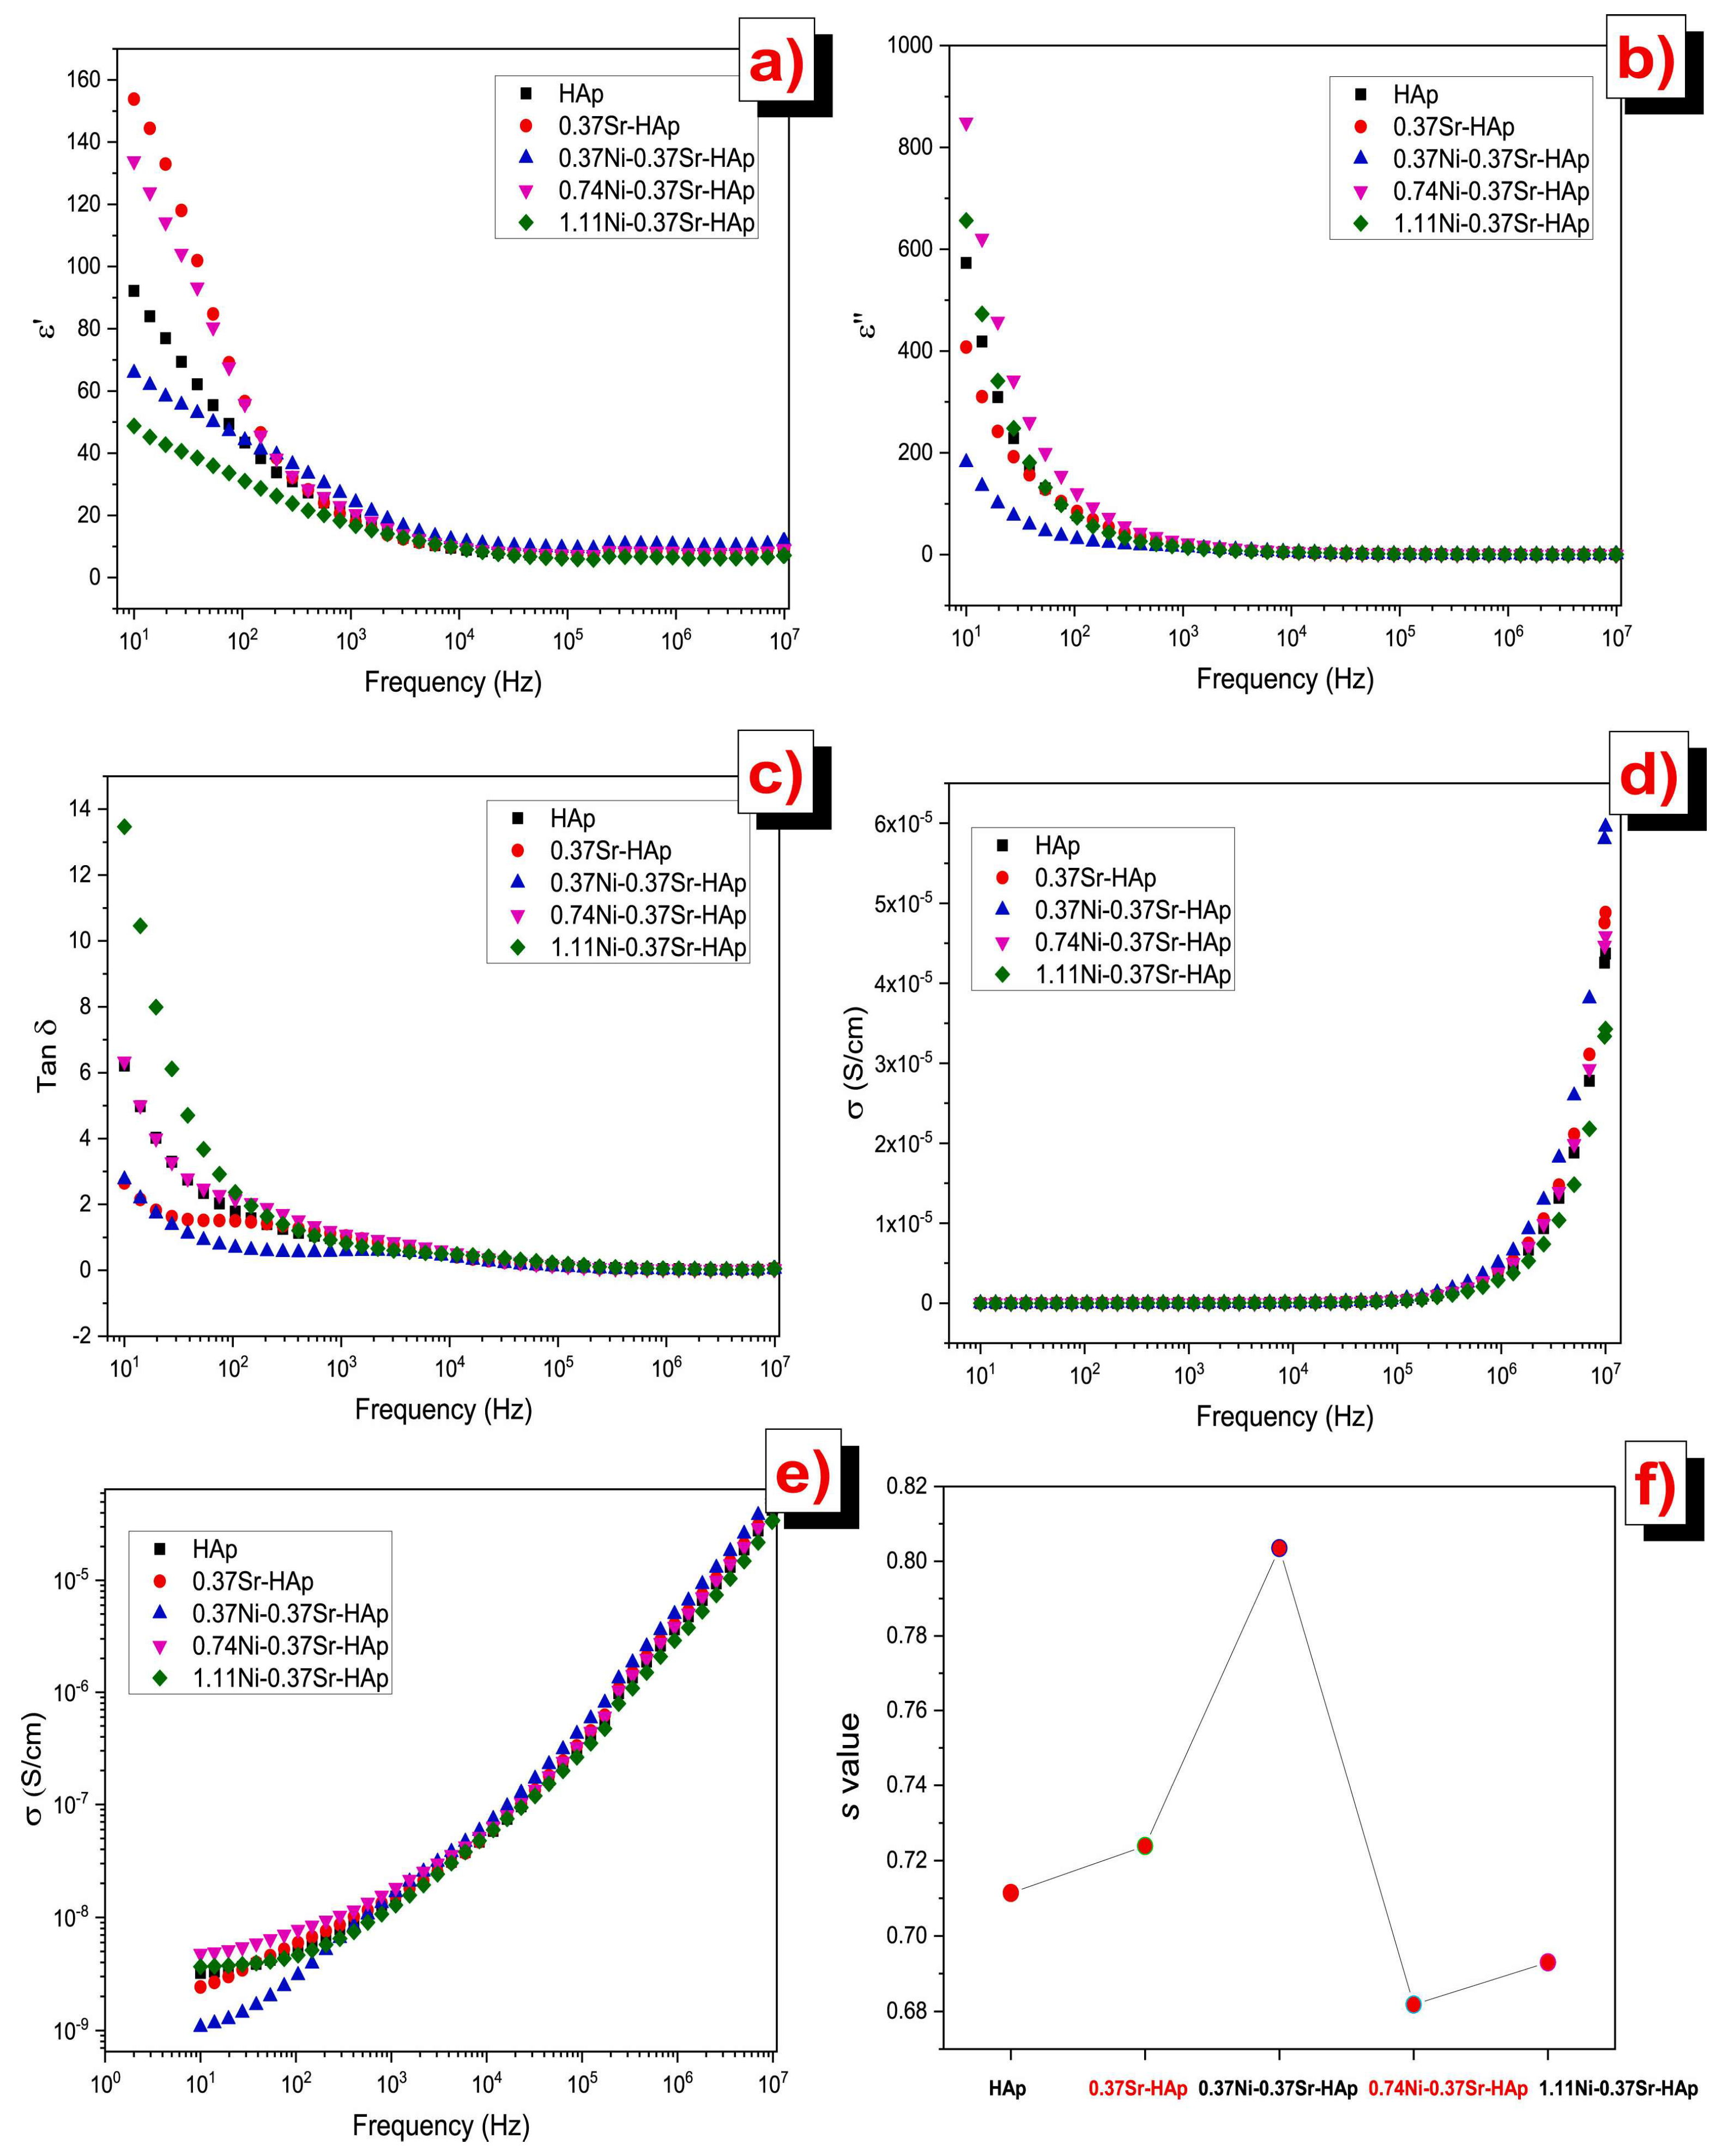
| Sr/Ni co-doped HA | 0; 0.37; 0.74; 1.11 at.% | Wet chemical technique | Dielectric constant, dielectric loss | 1 kHz–2 MHz | 293–473 | [101] |
| Material | Dopant Concentration | Synthesis Method | Investigated Electrical/Dielectric Parameters | Frequency Range | Temperature [K] | Ref. |
|---|---|---|---|---|---|---|
| Ce-doped HA | 1; 1.5; 1.7% | Wet precipitation technique | Dielectric constant, dielectric loss, AC conductivity | 1–10 MHz | RT | [218] |
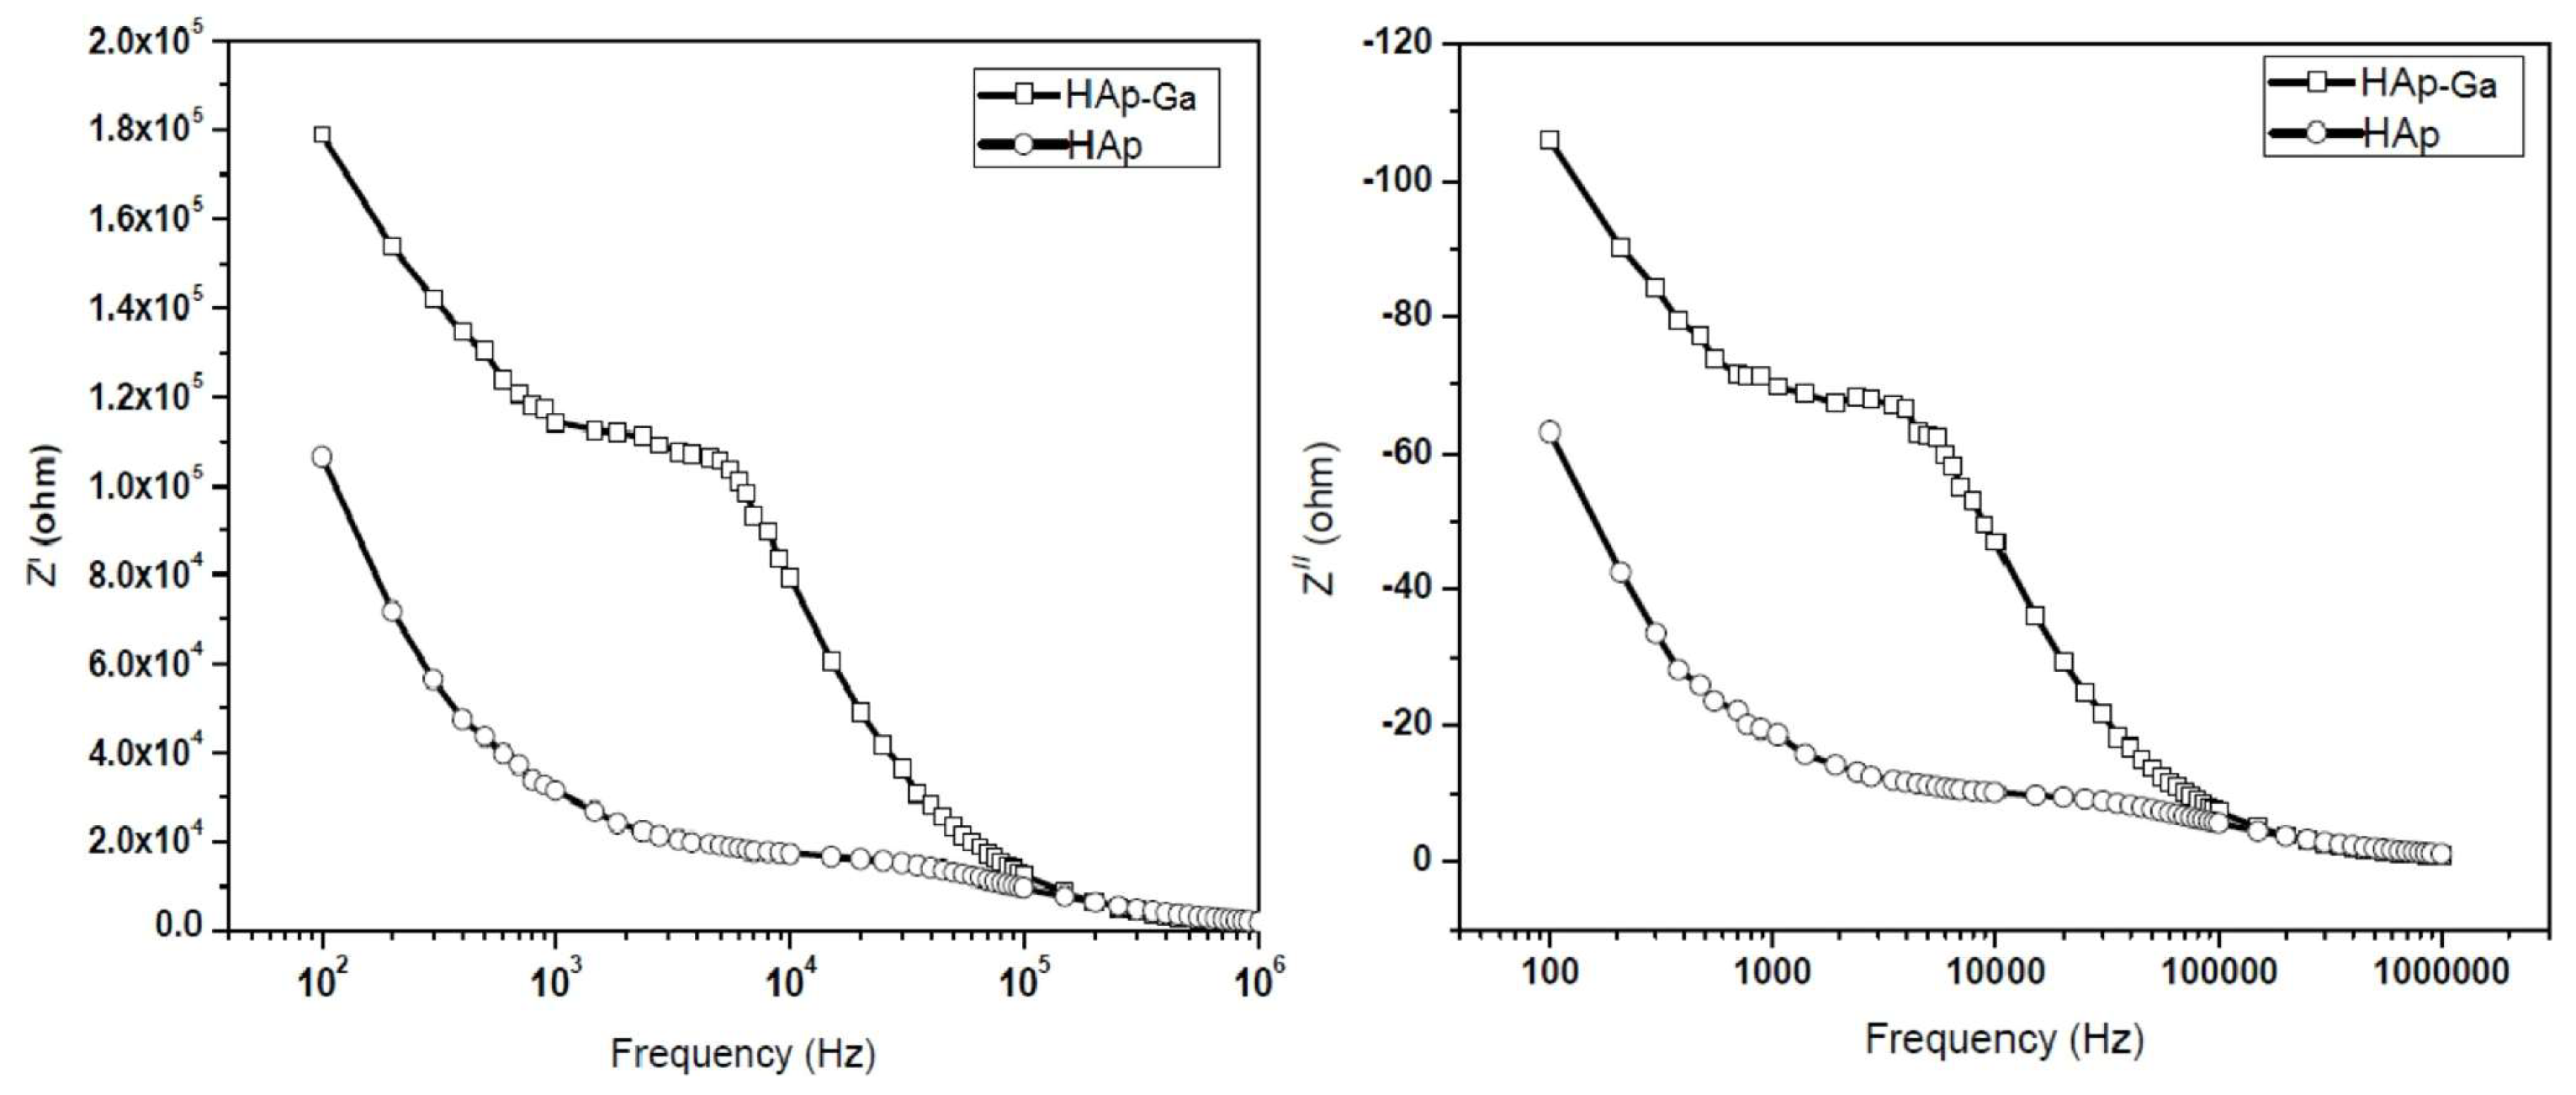
| Ga-doped HA | – | Precipitation technique | Dielectric constant, dielectric loss, AC conductivity | 100 Hz–1 MHz | RT | [171] |
| Cr-doped HA | – | Co-precipitation technique | Dielectric constant, dielectric loss, AC conductivity, permittivity | 1 Hz–10 MHz | RT | [169] |
| HA ceramics | – | Mechanochemical technique | Dielectric constant, dielectric loss | 1 kHz–1 MHz | RT | [219] |
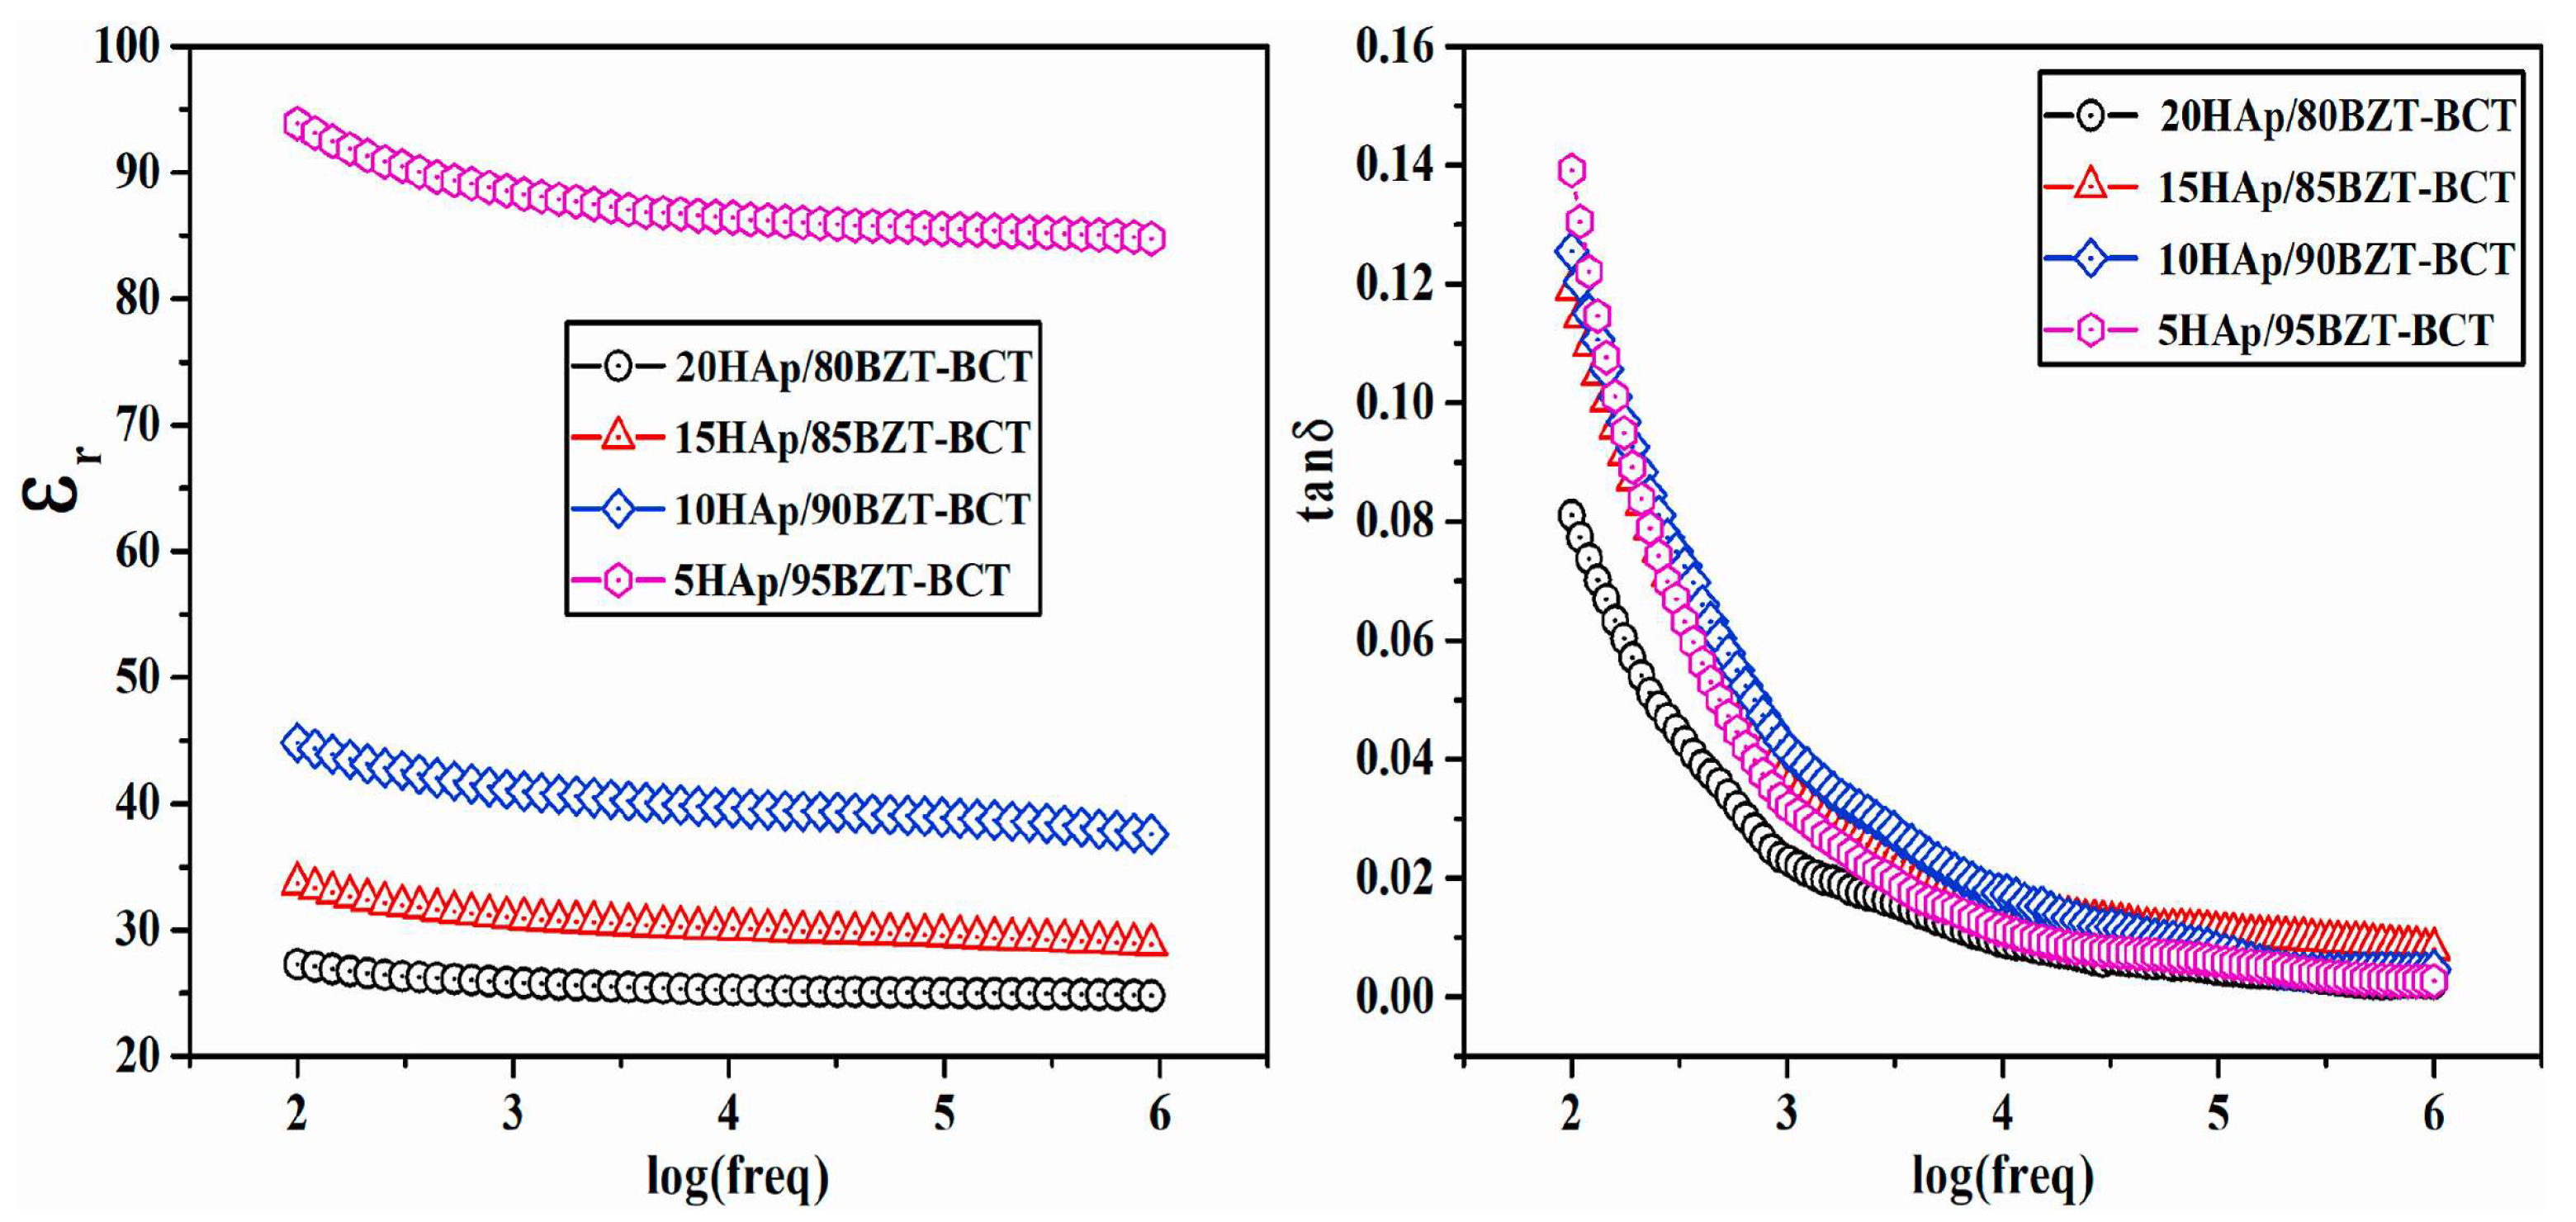
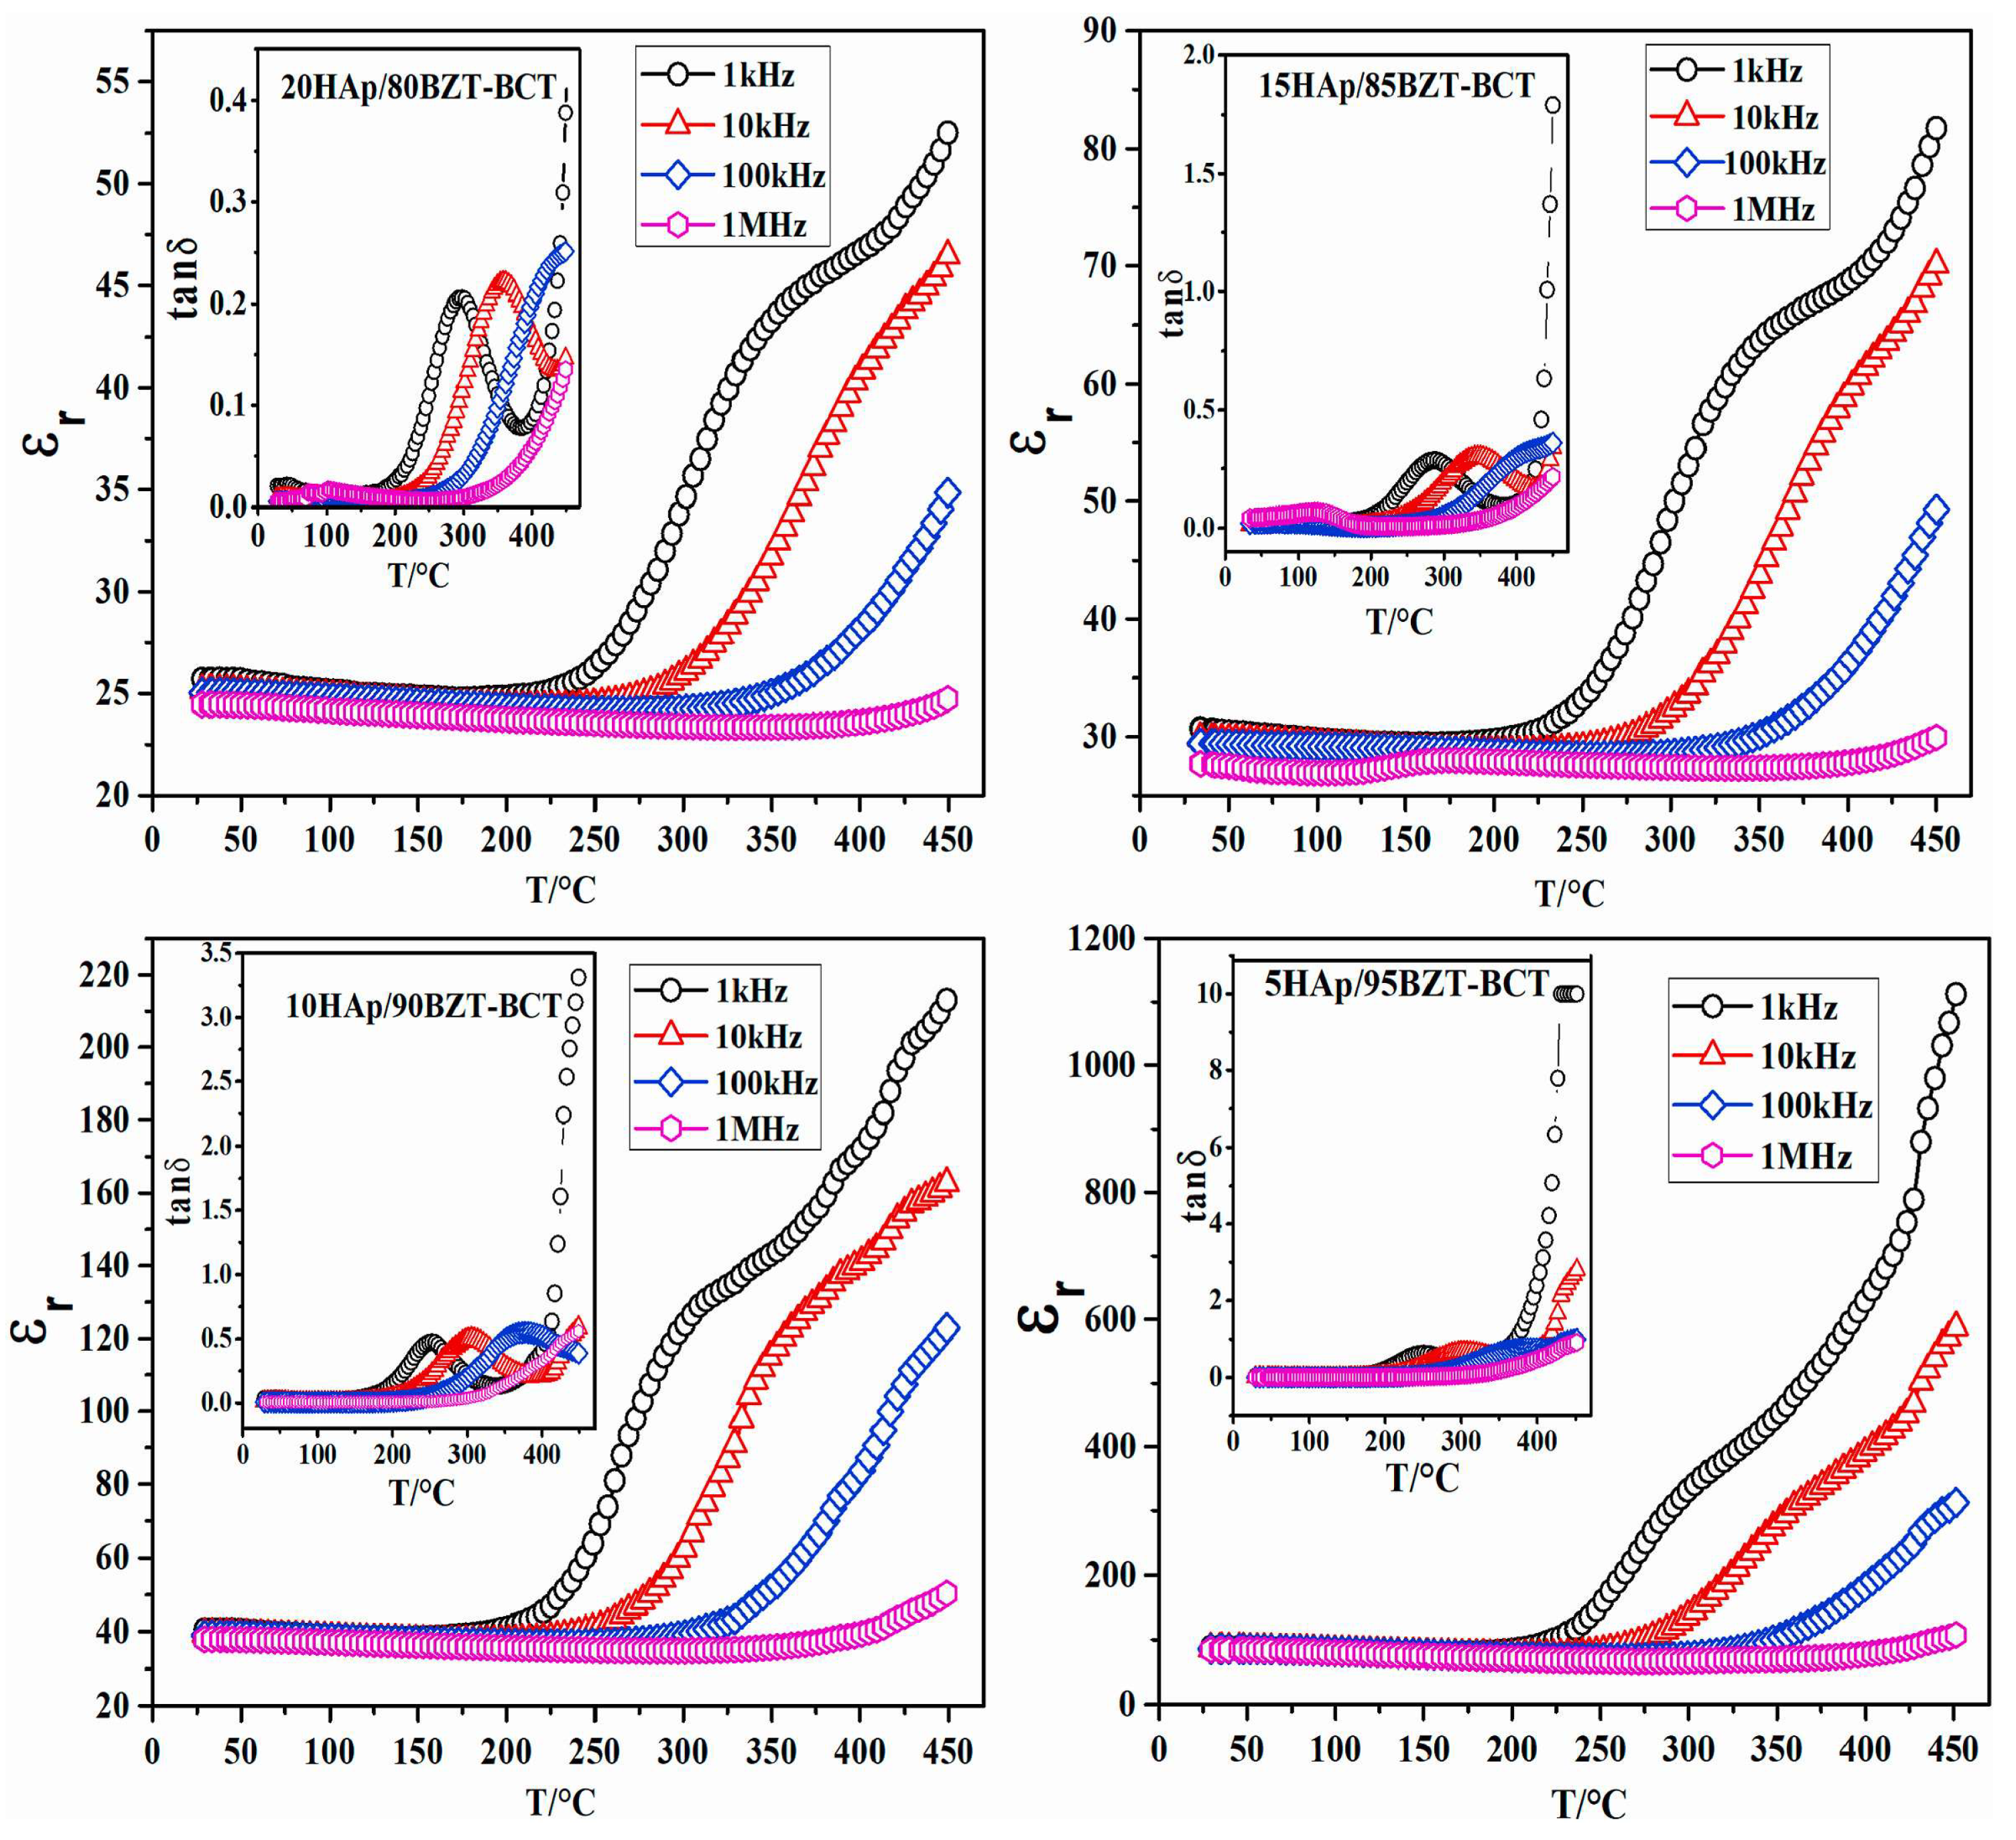
| xHA/(1-x)BZT-BCT | 5; 10; 15; 20 wt.% | High energy ball milling assisted solid-state reaction route | Dielectric constant, dielectric loss | 100 Hz–1 MHz | RT | [59] |
| BaTiO3-doped HA | 100/0; 90/10; 70/30; 50/50; 30/70; 10/90; 0/100 | High-speed mechanical stirring technique | Dielectric constant | 100 Hz–100 kHz | RT | [220] |
| Zn-doped HA | 1; 2; 3; 4 wt.% | Sol-gel technique | Dielectric constant, dielectric loss, Impedance | – | – | [177] |
| Mg- and Ag-doped HA | 1; 2; 3; 4 wt.% | Sol-gel wet chemical technique | Dielectric loss, Impedance | 100 Hz–10 MHz | – | [179] |
| Material | Dopant/Blend Concentration | Synthesis Method | Investigated Electrical/Dielectric Parameters | Frequency Range | Temperature [K] | Ref. |
|---|---|---|---|---|---|---|
| Chitosan–HA | 0; 10; 20; 30; 40; 50; 60; 70; 80 wt.% | Solvent cast technique | Dielectric constant, dielectric loss, conductivity | 40 Hz–110 MHz | 293–473 | [164] |
| T2O5–HA | 20 wt.% | Electrophoretic deposition | Conductivity | – | – | [125] |
| BaSrTiO3–HA | Radio frequency magnetron sputtering | Dielectric constant | 1Hz–1 MHz | – | [178] | |
| SrTiO3–HA | 80 at.% | Radio frequency magnetron sputtering | Dielectric constant | – | – | [176] |
| PMMA–HA | – | Sol gel technique | Dielectric loss, impedance | – | – | [269] |
Disclaimer/Publisher’s Note: The statements, opinions and data contained in all publications are solely those of the individual author(s) and contributor(s) and not of MDPI and/or the editor(s). MDPI and/or the editor(s) disclaim responsibility for any injury to people or property resulting from any ideas, methods, instructions or products referred to in the content. |
© 2024 by the authors. Licensee MDPI, Basel, Switzerland. This article is an open access article distributed under the terms and conditions of the Creative Commons Attribution (CC BY) license (https://creativecommons.org/licenses/by/4.0/).
Share and Cite
Duta, L.; Grumezescu, V. The Effect of Doping on the Electrical and Dielectric Properties of Hydroxyapatite for Medical Applications: From Powders to Thin Films. Materials 2024, 17, 640. https://doi.org/10.3390/ma17030640
Duta L, Grumezescu V. The Effect of Doping on the Electrical and Dielectric Properties of Hydroxyapatite for Medical Applications: From Powders to Thin Films. Materials. 2024; 17(3):640. https://doi.org/10.3390/ma17030640
Chicago/Turabian StyleDuta, Liviu, and Valentina Grumezescu. 2024. "The Effect of Doping on the Electrical and Dielectric Properties of Hydroxyapatite for Medical Applications: From Powders to Thin Films" Materials 17, no. 3: 640. https://doi.org/10.3390/ma17030640
APA StyleDuta, L., & Grumezescu, V. (2024). The Effect of Doping on the Electrical and Dielectric Properties of Hydroxyapatite for Medical Applications: From Powders to Thin Films. Materials, 17(3), 640. https://doi.org/10.3390/ma17030640