

Quality Evaluation of New Types of Core Layers Based on Different Thicknesses of Veneers for Flooring Materials
Abstract
:1. Introduction
- Properties of many important composites are anisotropic—the properties differ depending on the direction in which they are measured;
- Many of the polymer-based composites are subject to attack by chemicals or solvents, just as the polymers themselves are susceptible to attack;
- Composite materials are generally expensive.
- Manufacturing methods for shaping composite materials are often slow and costly.
2. Materials and Methods
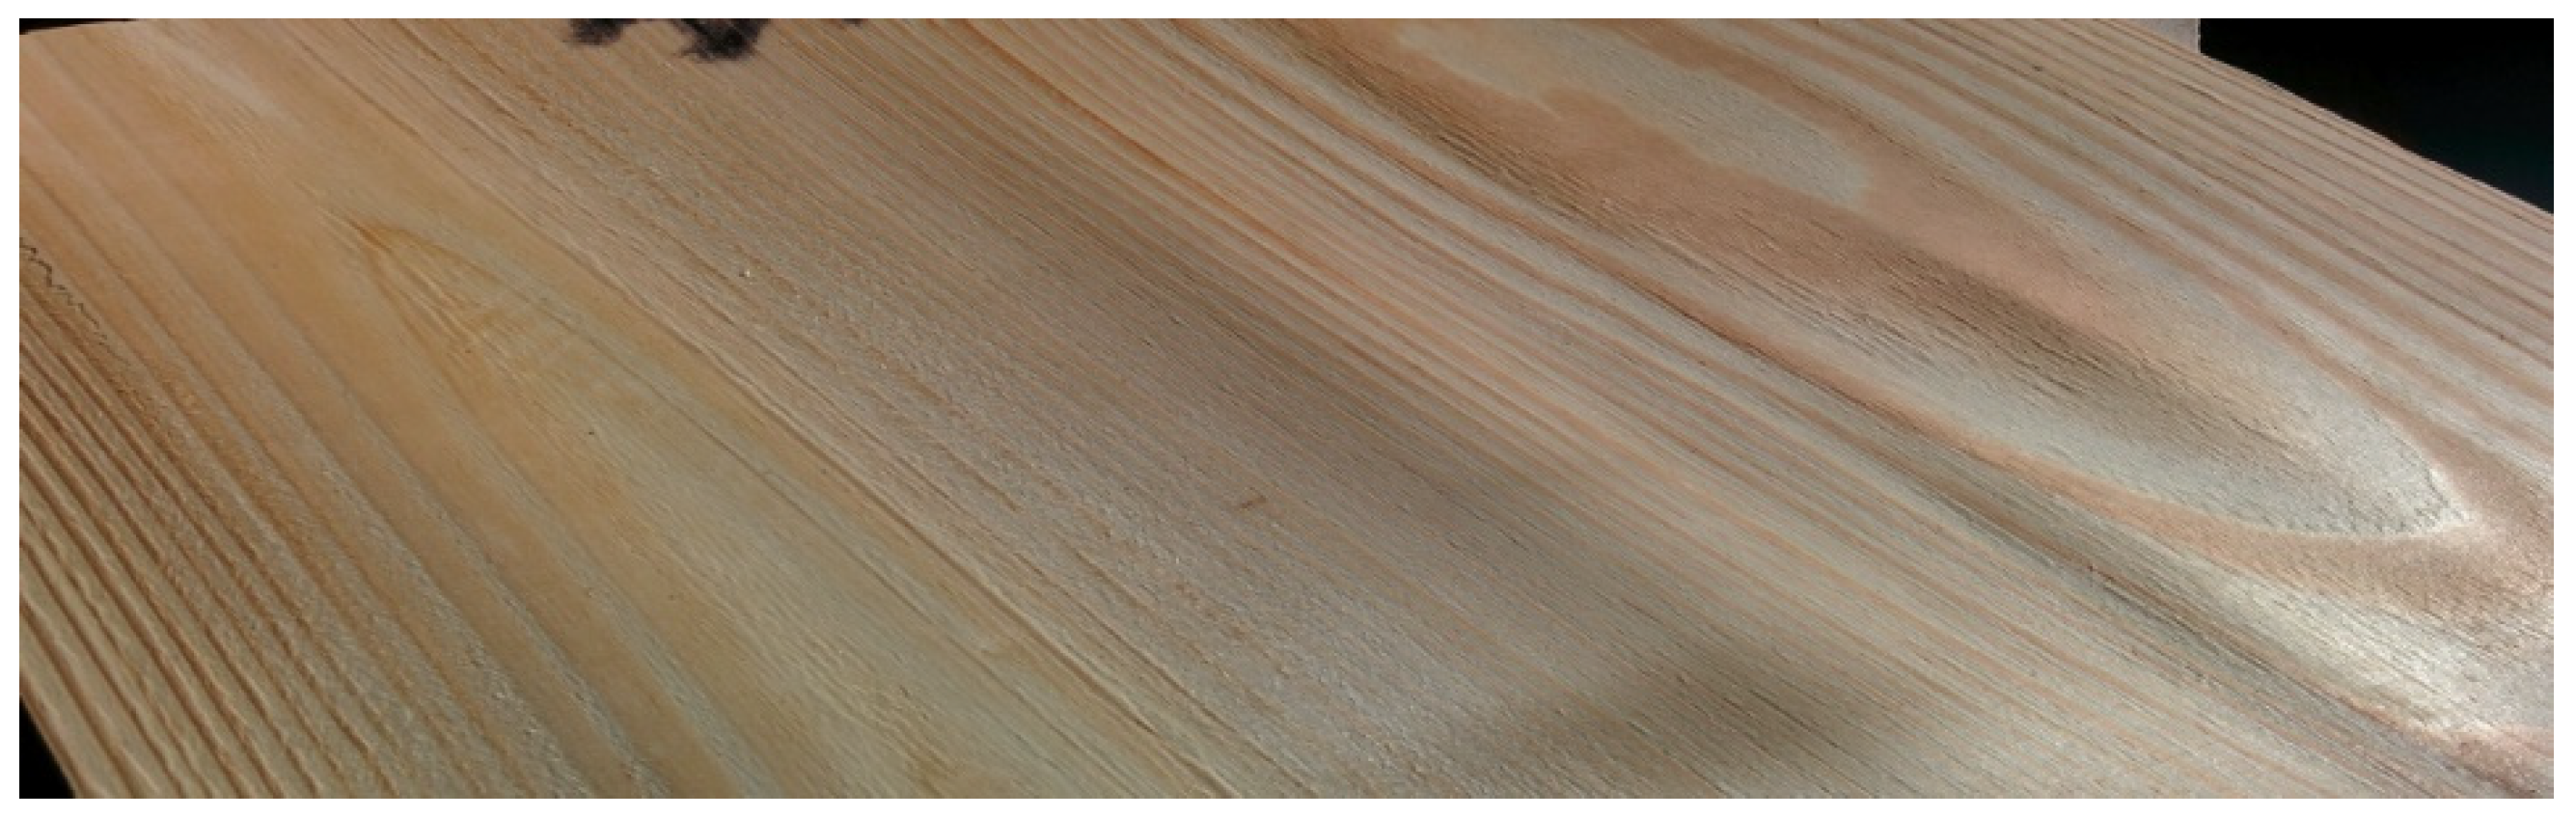
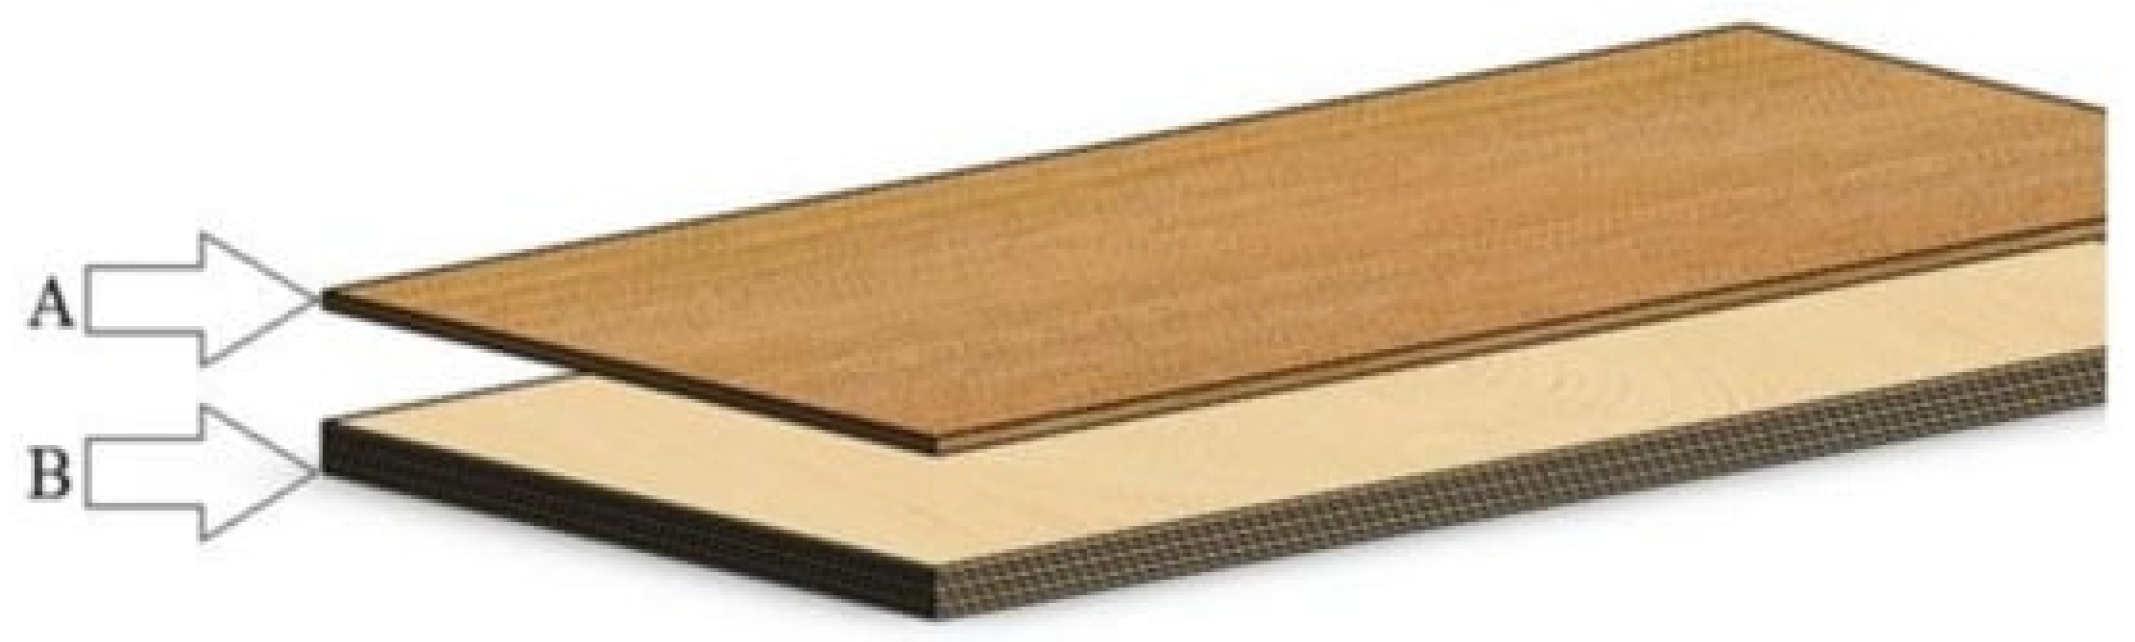
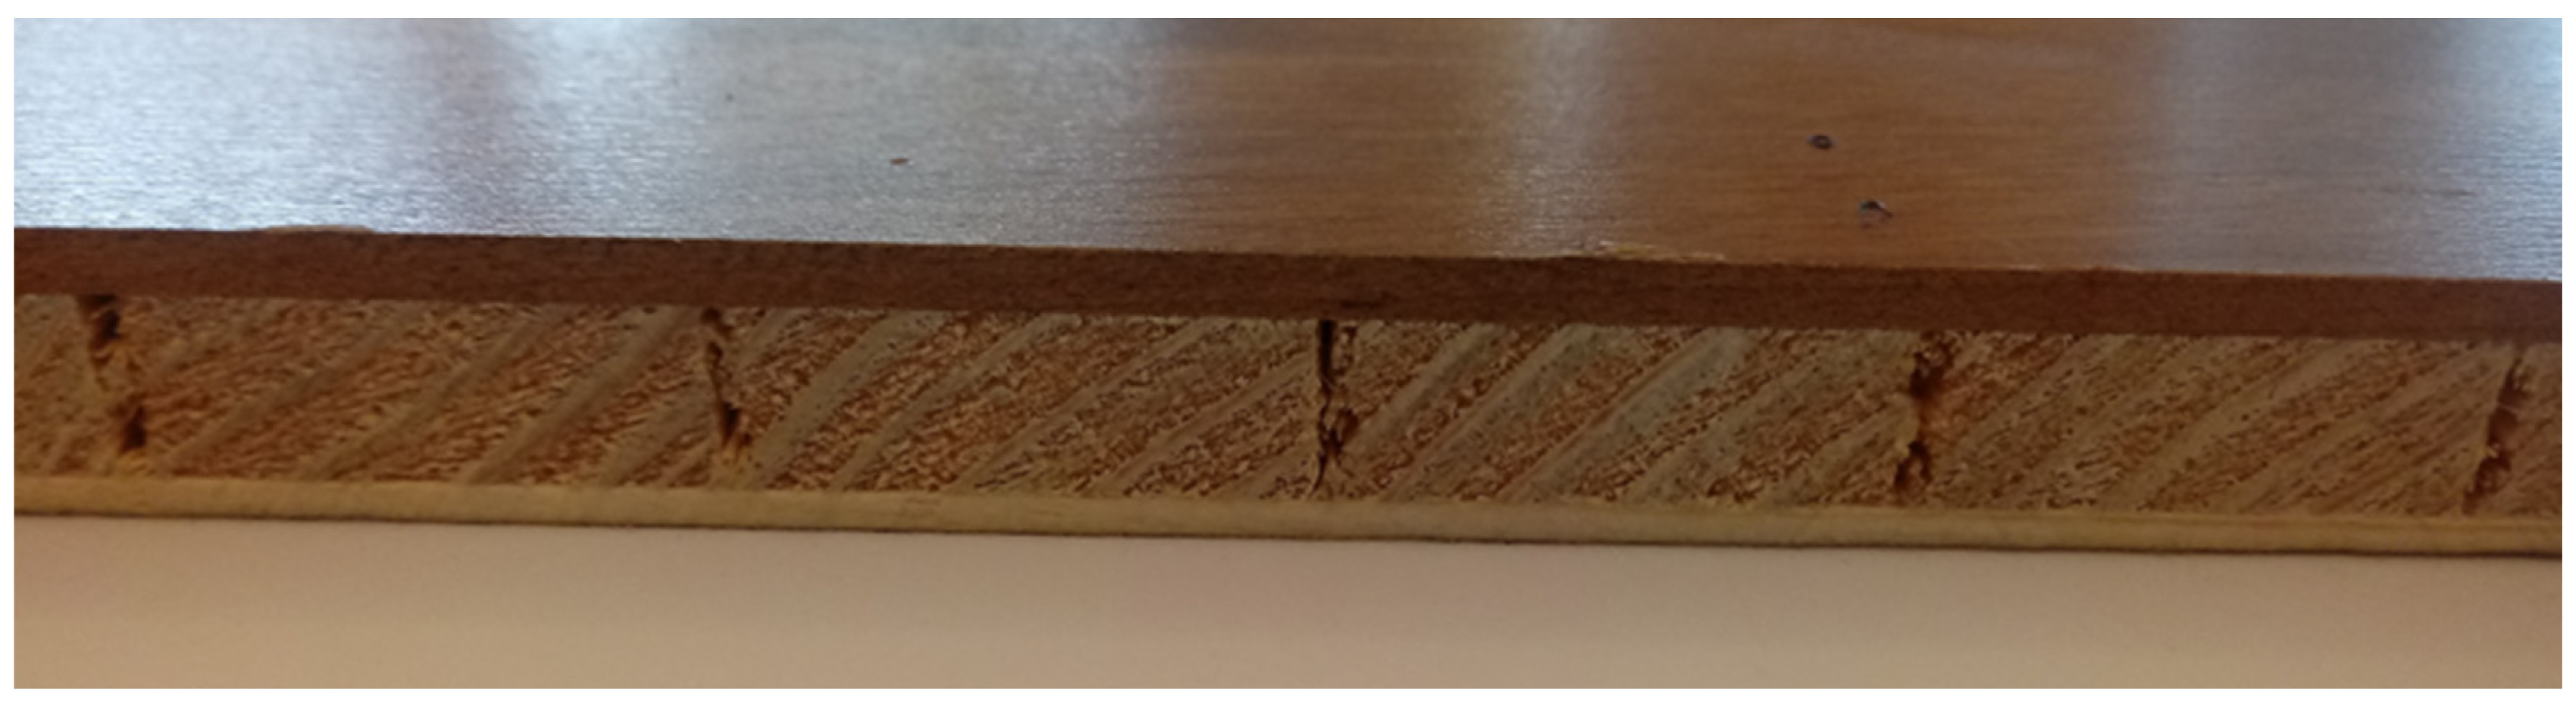
2.1. Materials
- -
- In even-numbered layers, the fibers were positioned perpendicular to the sample length (┴);
- -
- In odd layers, the fibers were positioned parallel to the sample length (=).
2.2. Tests of Static Bending
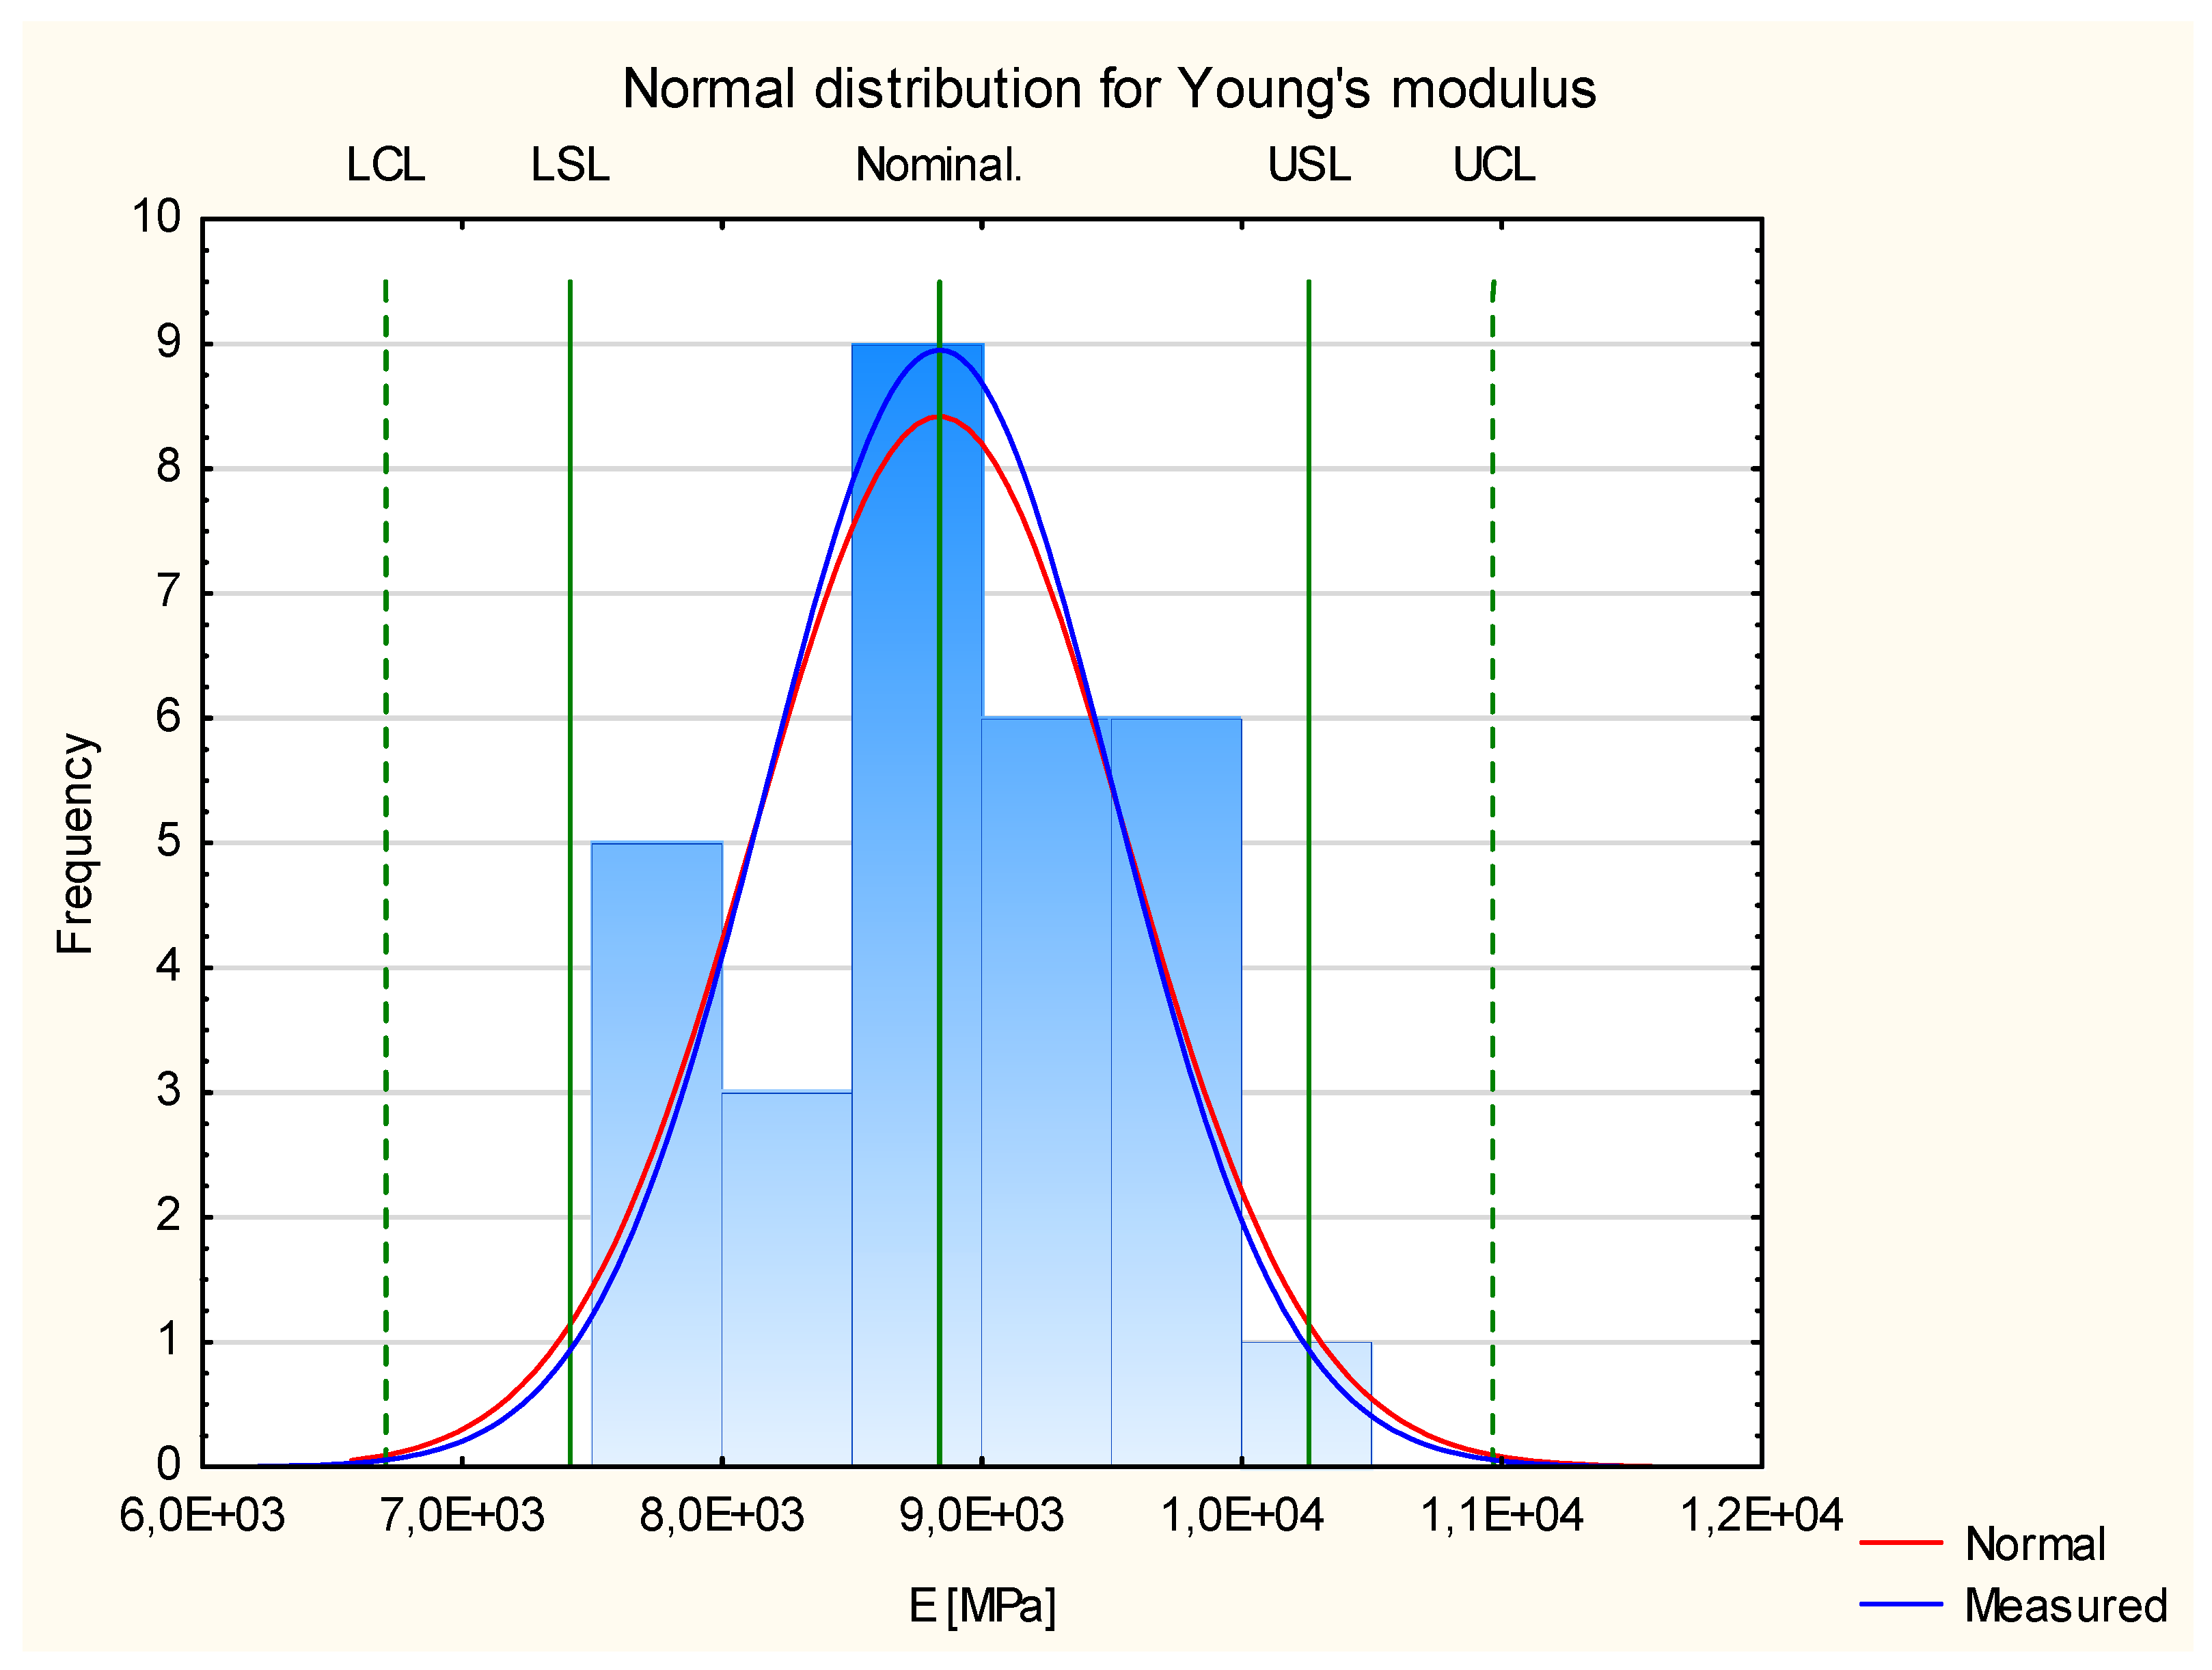
2.3. Shewhart’s Theory Focused on the Subject of the Work
- Analysis of the normal distribution of results obtained for all experimental samples;
- Preparation of control charts for a group of industrial (comparative) samples and for experimental samples;
- Analysis of the control chart prepared for all experimental samples.
- Leptokurticity: kurtosis is greater than 0. The distribution has “heavier” tails compared to those in a normal distribution. This means that outliers are more likely to occur;
- Mesokurticity: kurtosis is equal to 0. The distribution has tails that are balanced compared to a normal distribution. This is a distribution whose kurtosis is the same as a normal distribution;
- Platykurticity: kurtosis is negative. The distribution has “lighter” tails than in a normal distribution. This means that the values cluster closer to the average value.
3. Results and Discussion
3.1. Analysis of Samples Made of Pine Wood
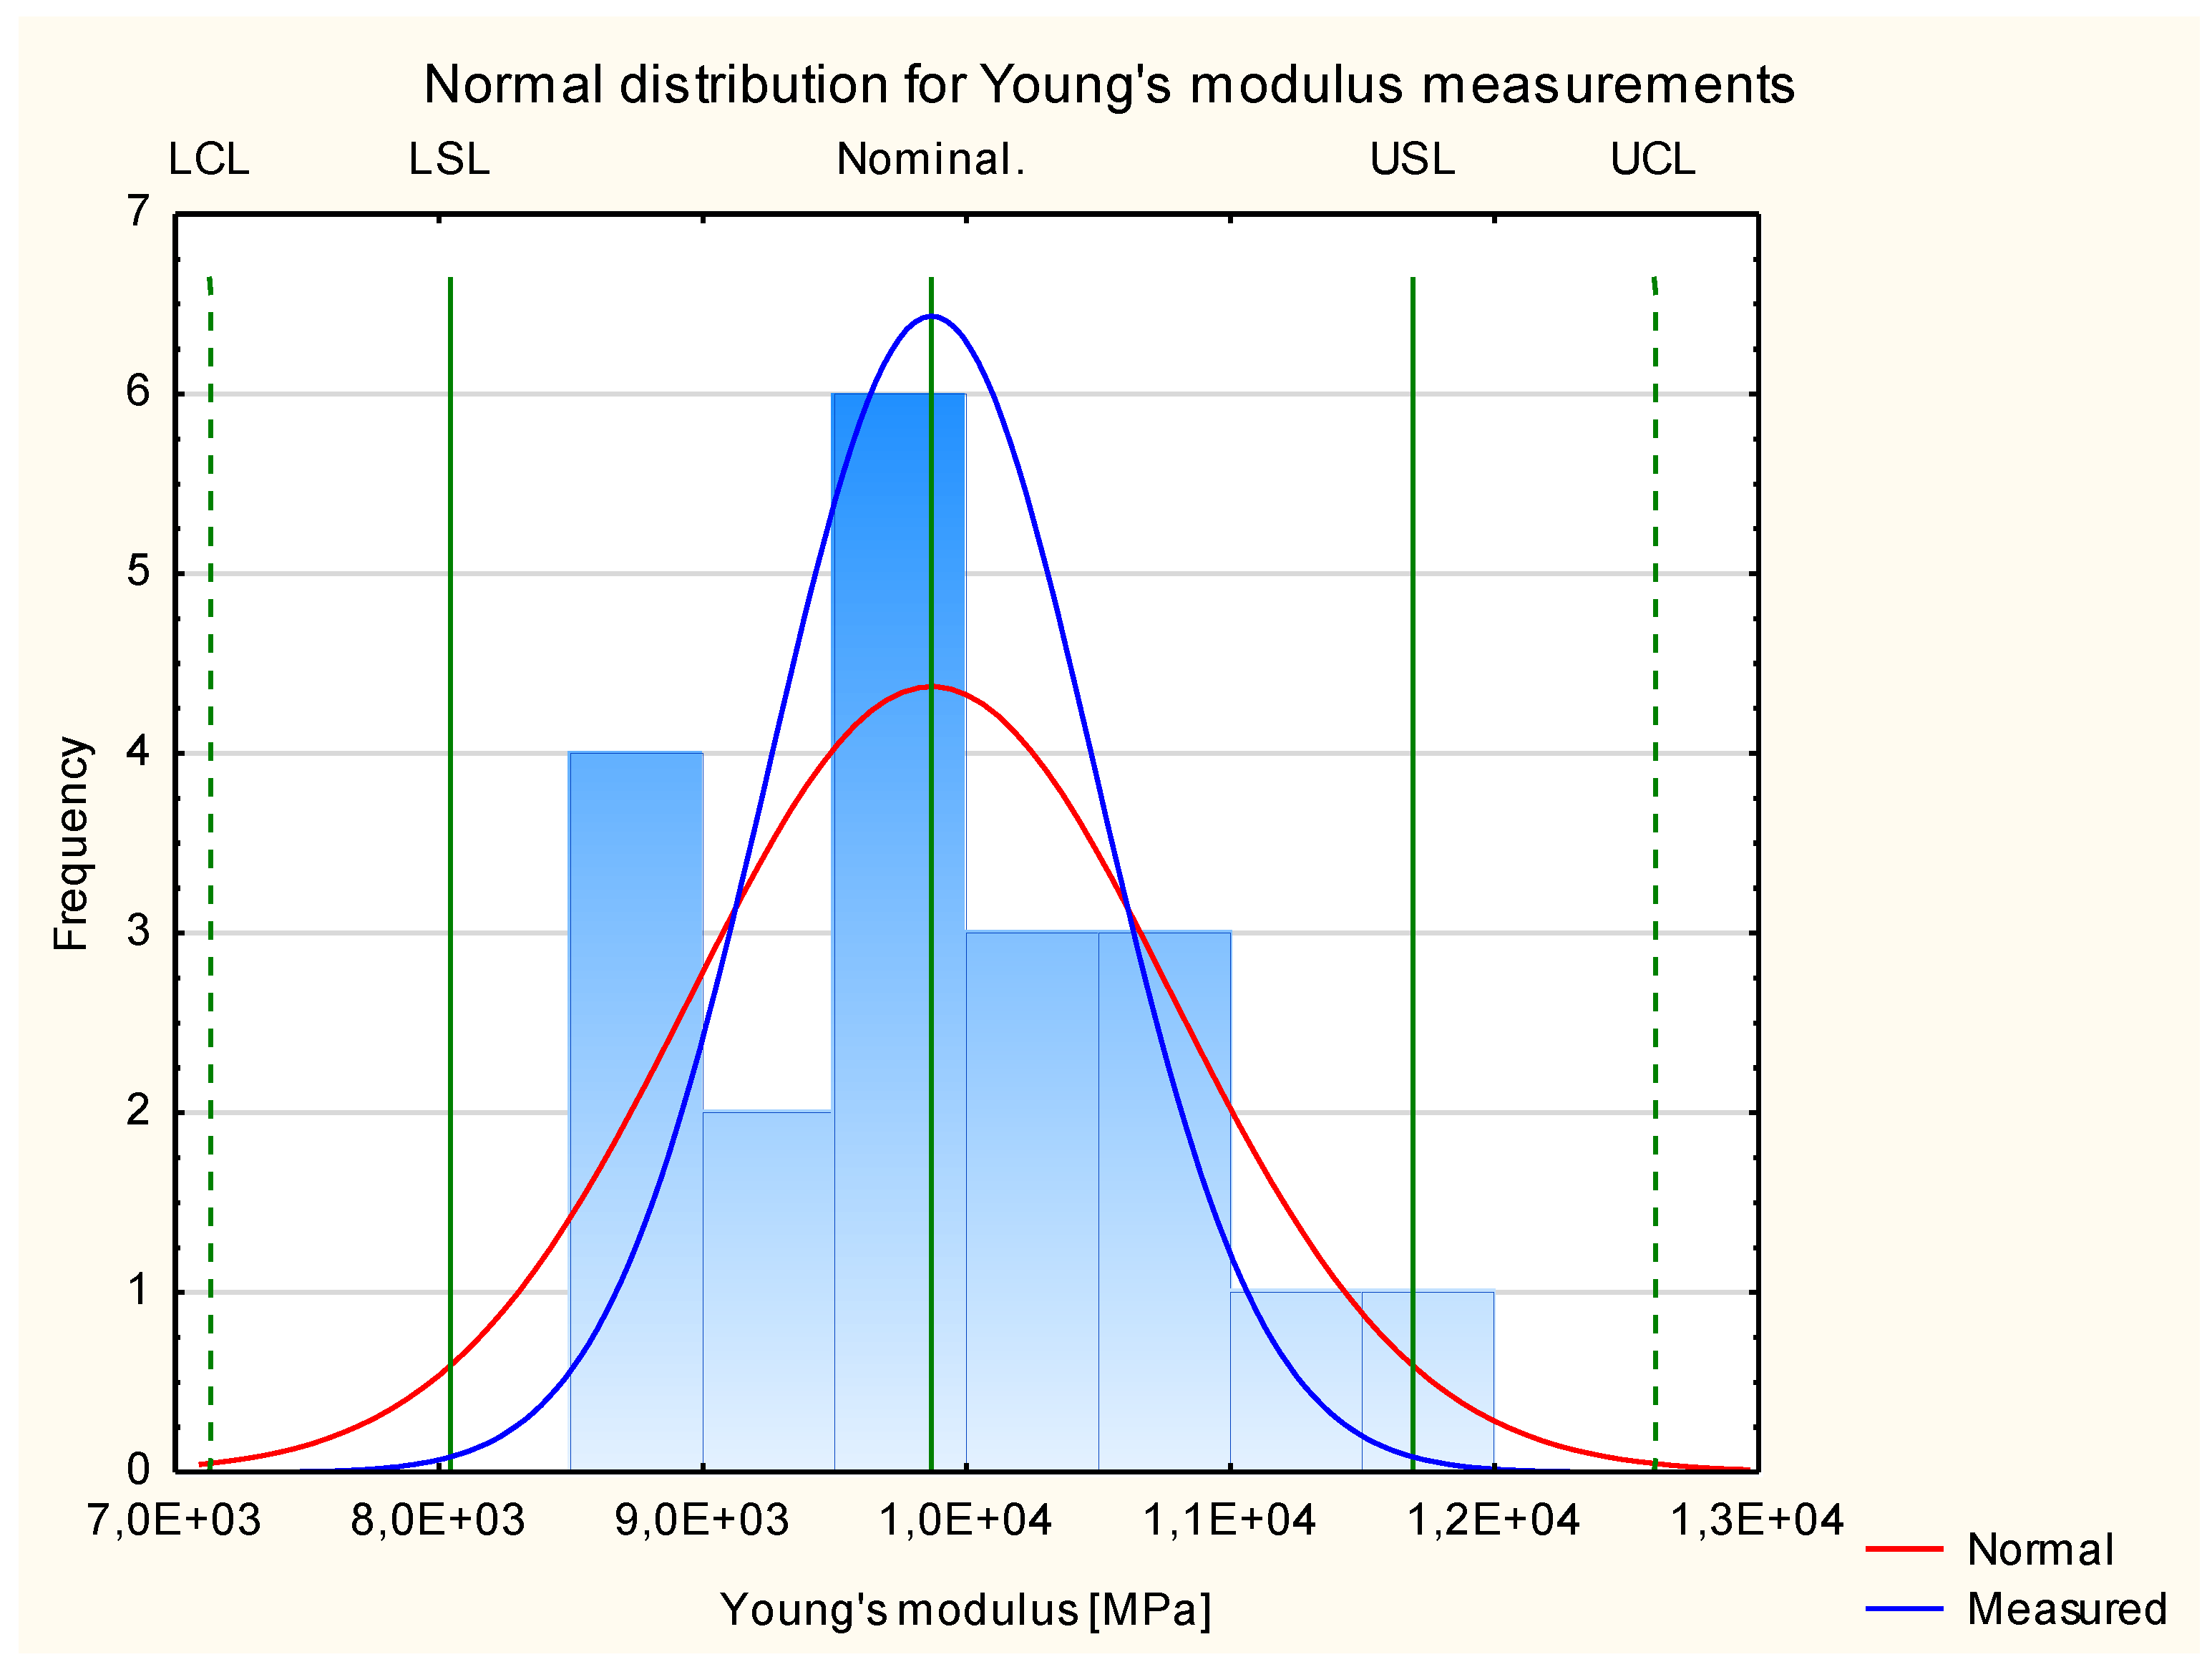
3.1.1. Young’s Modulus
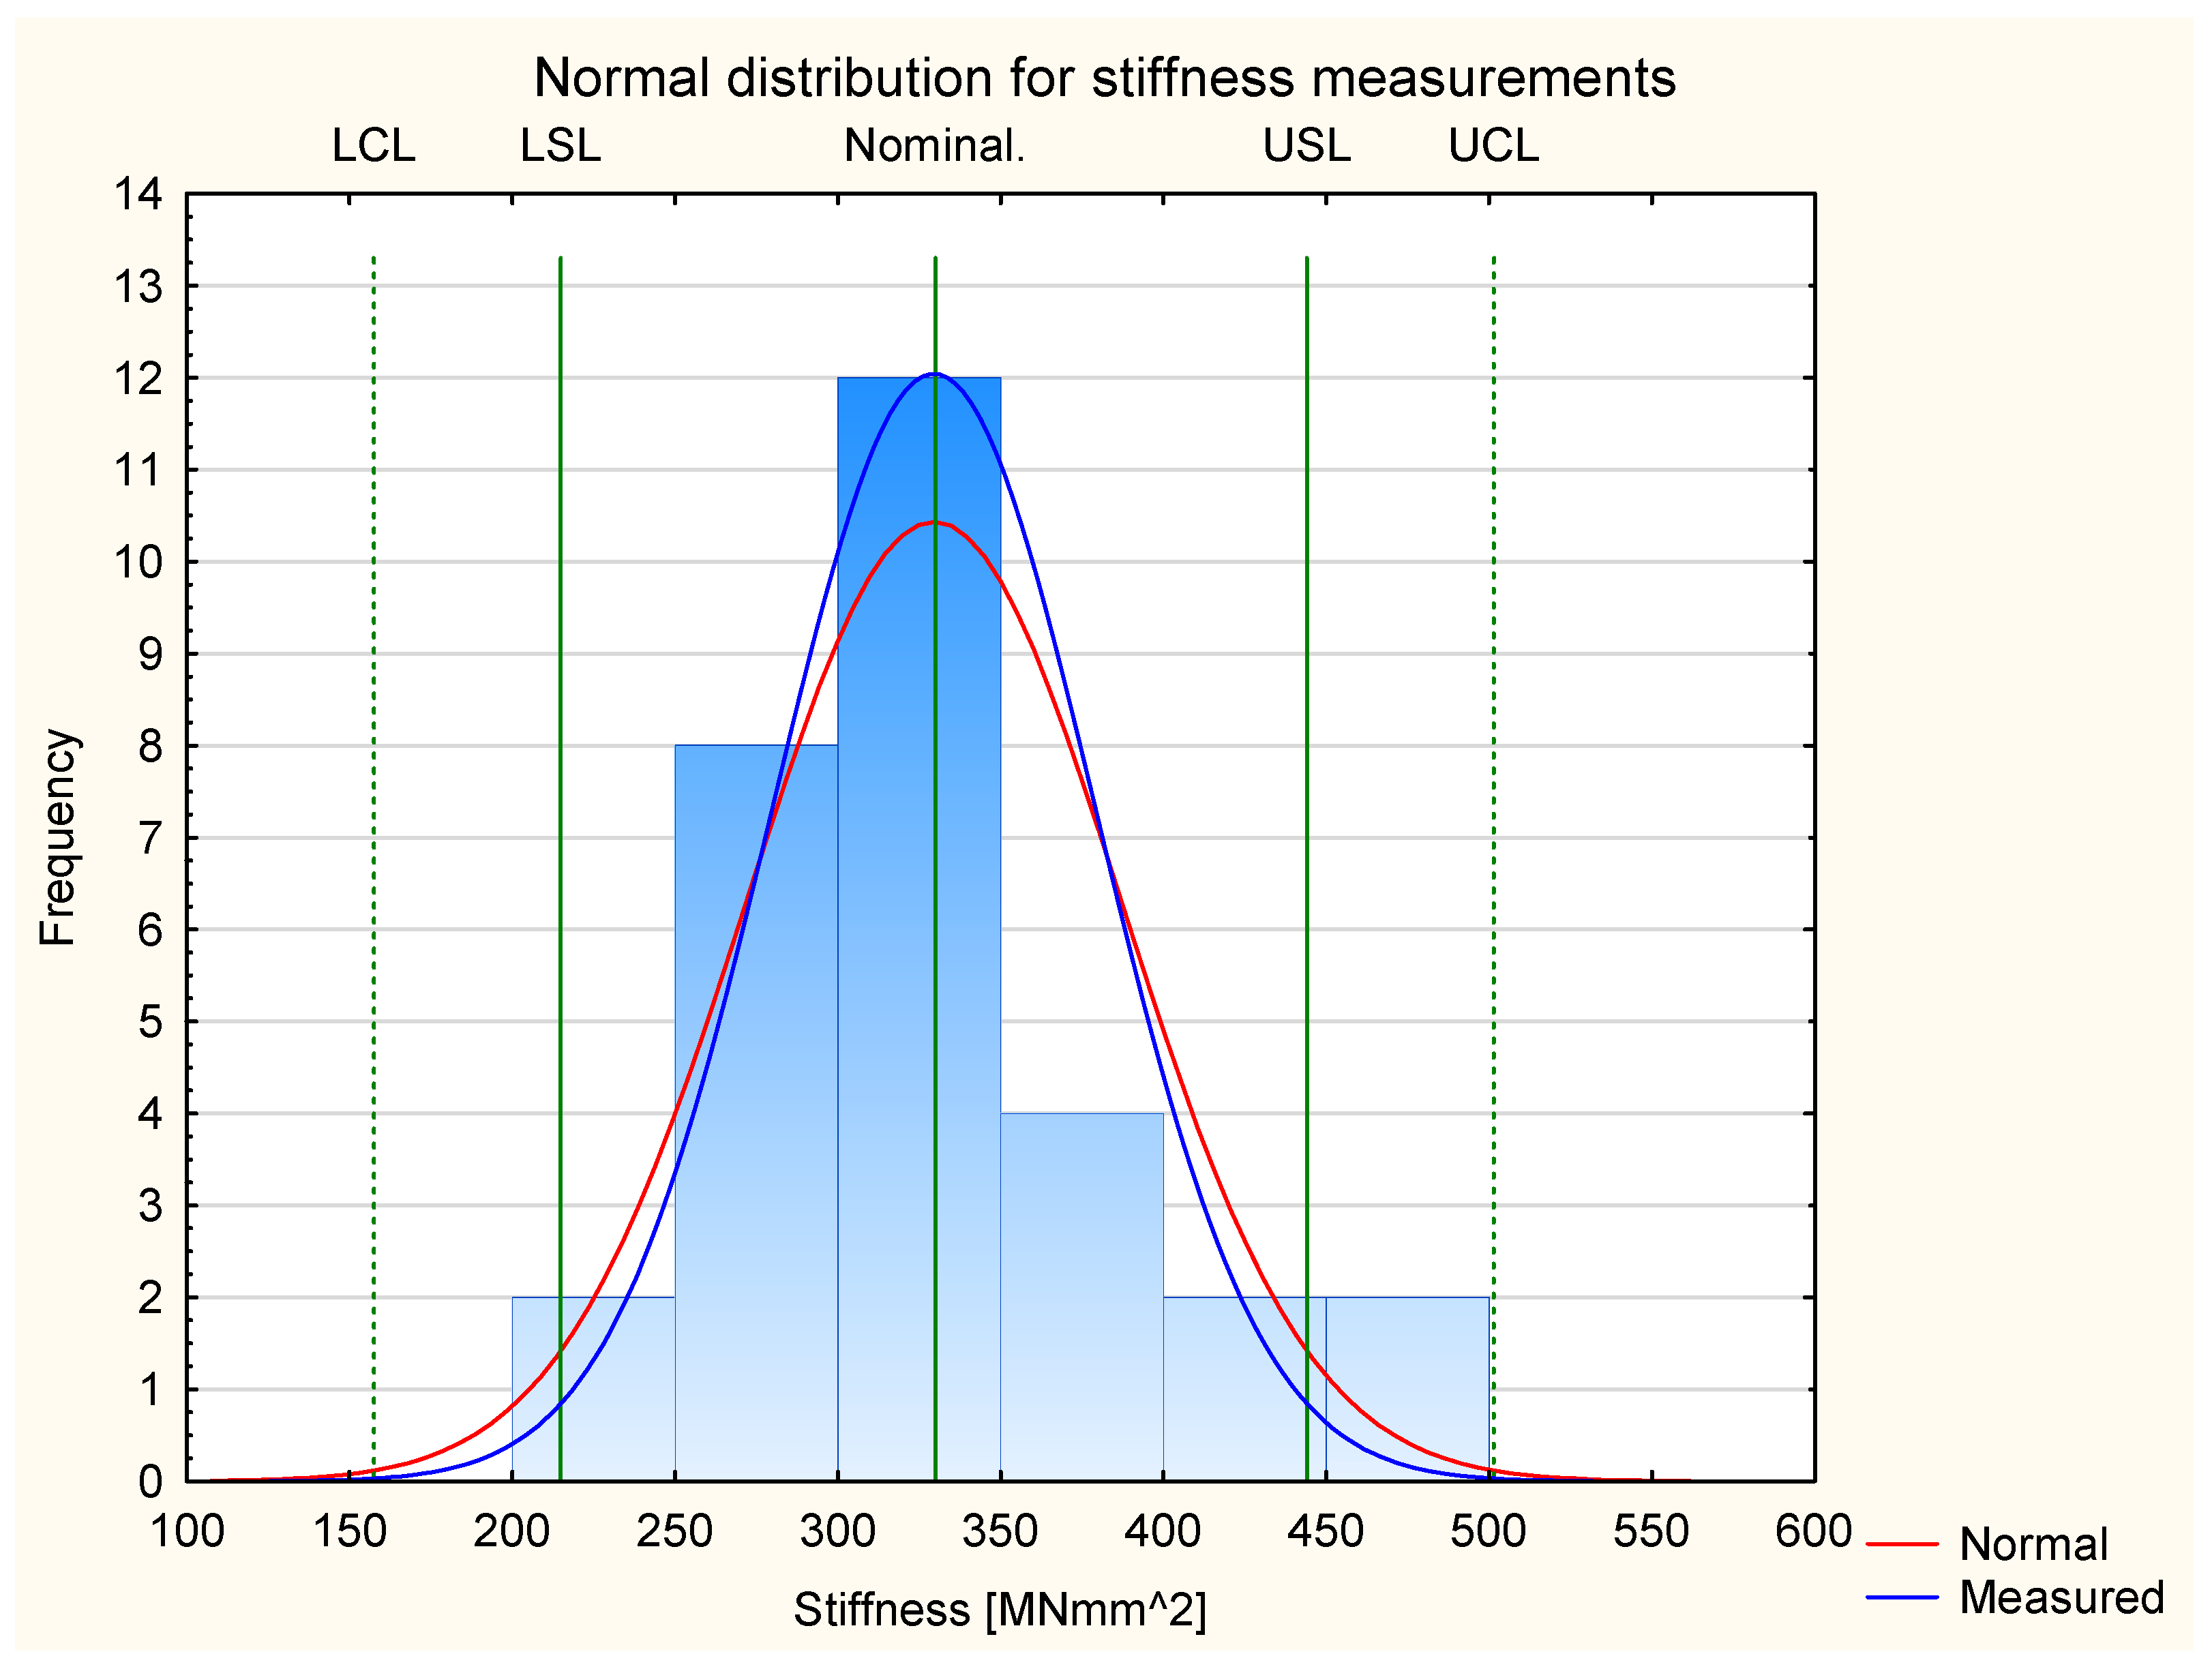
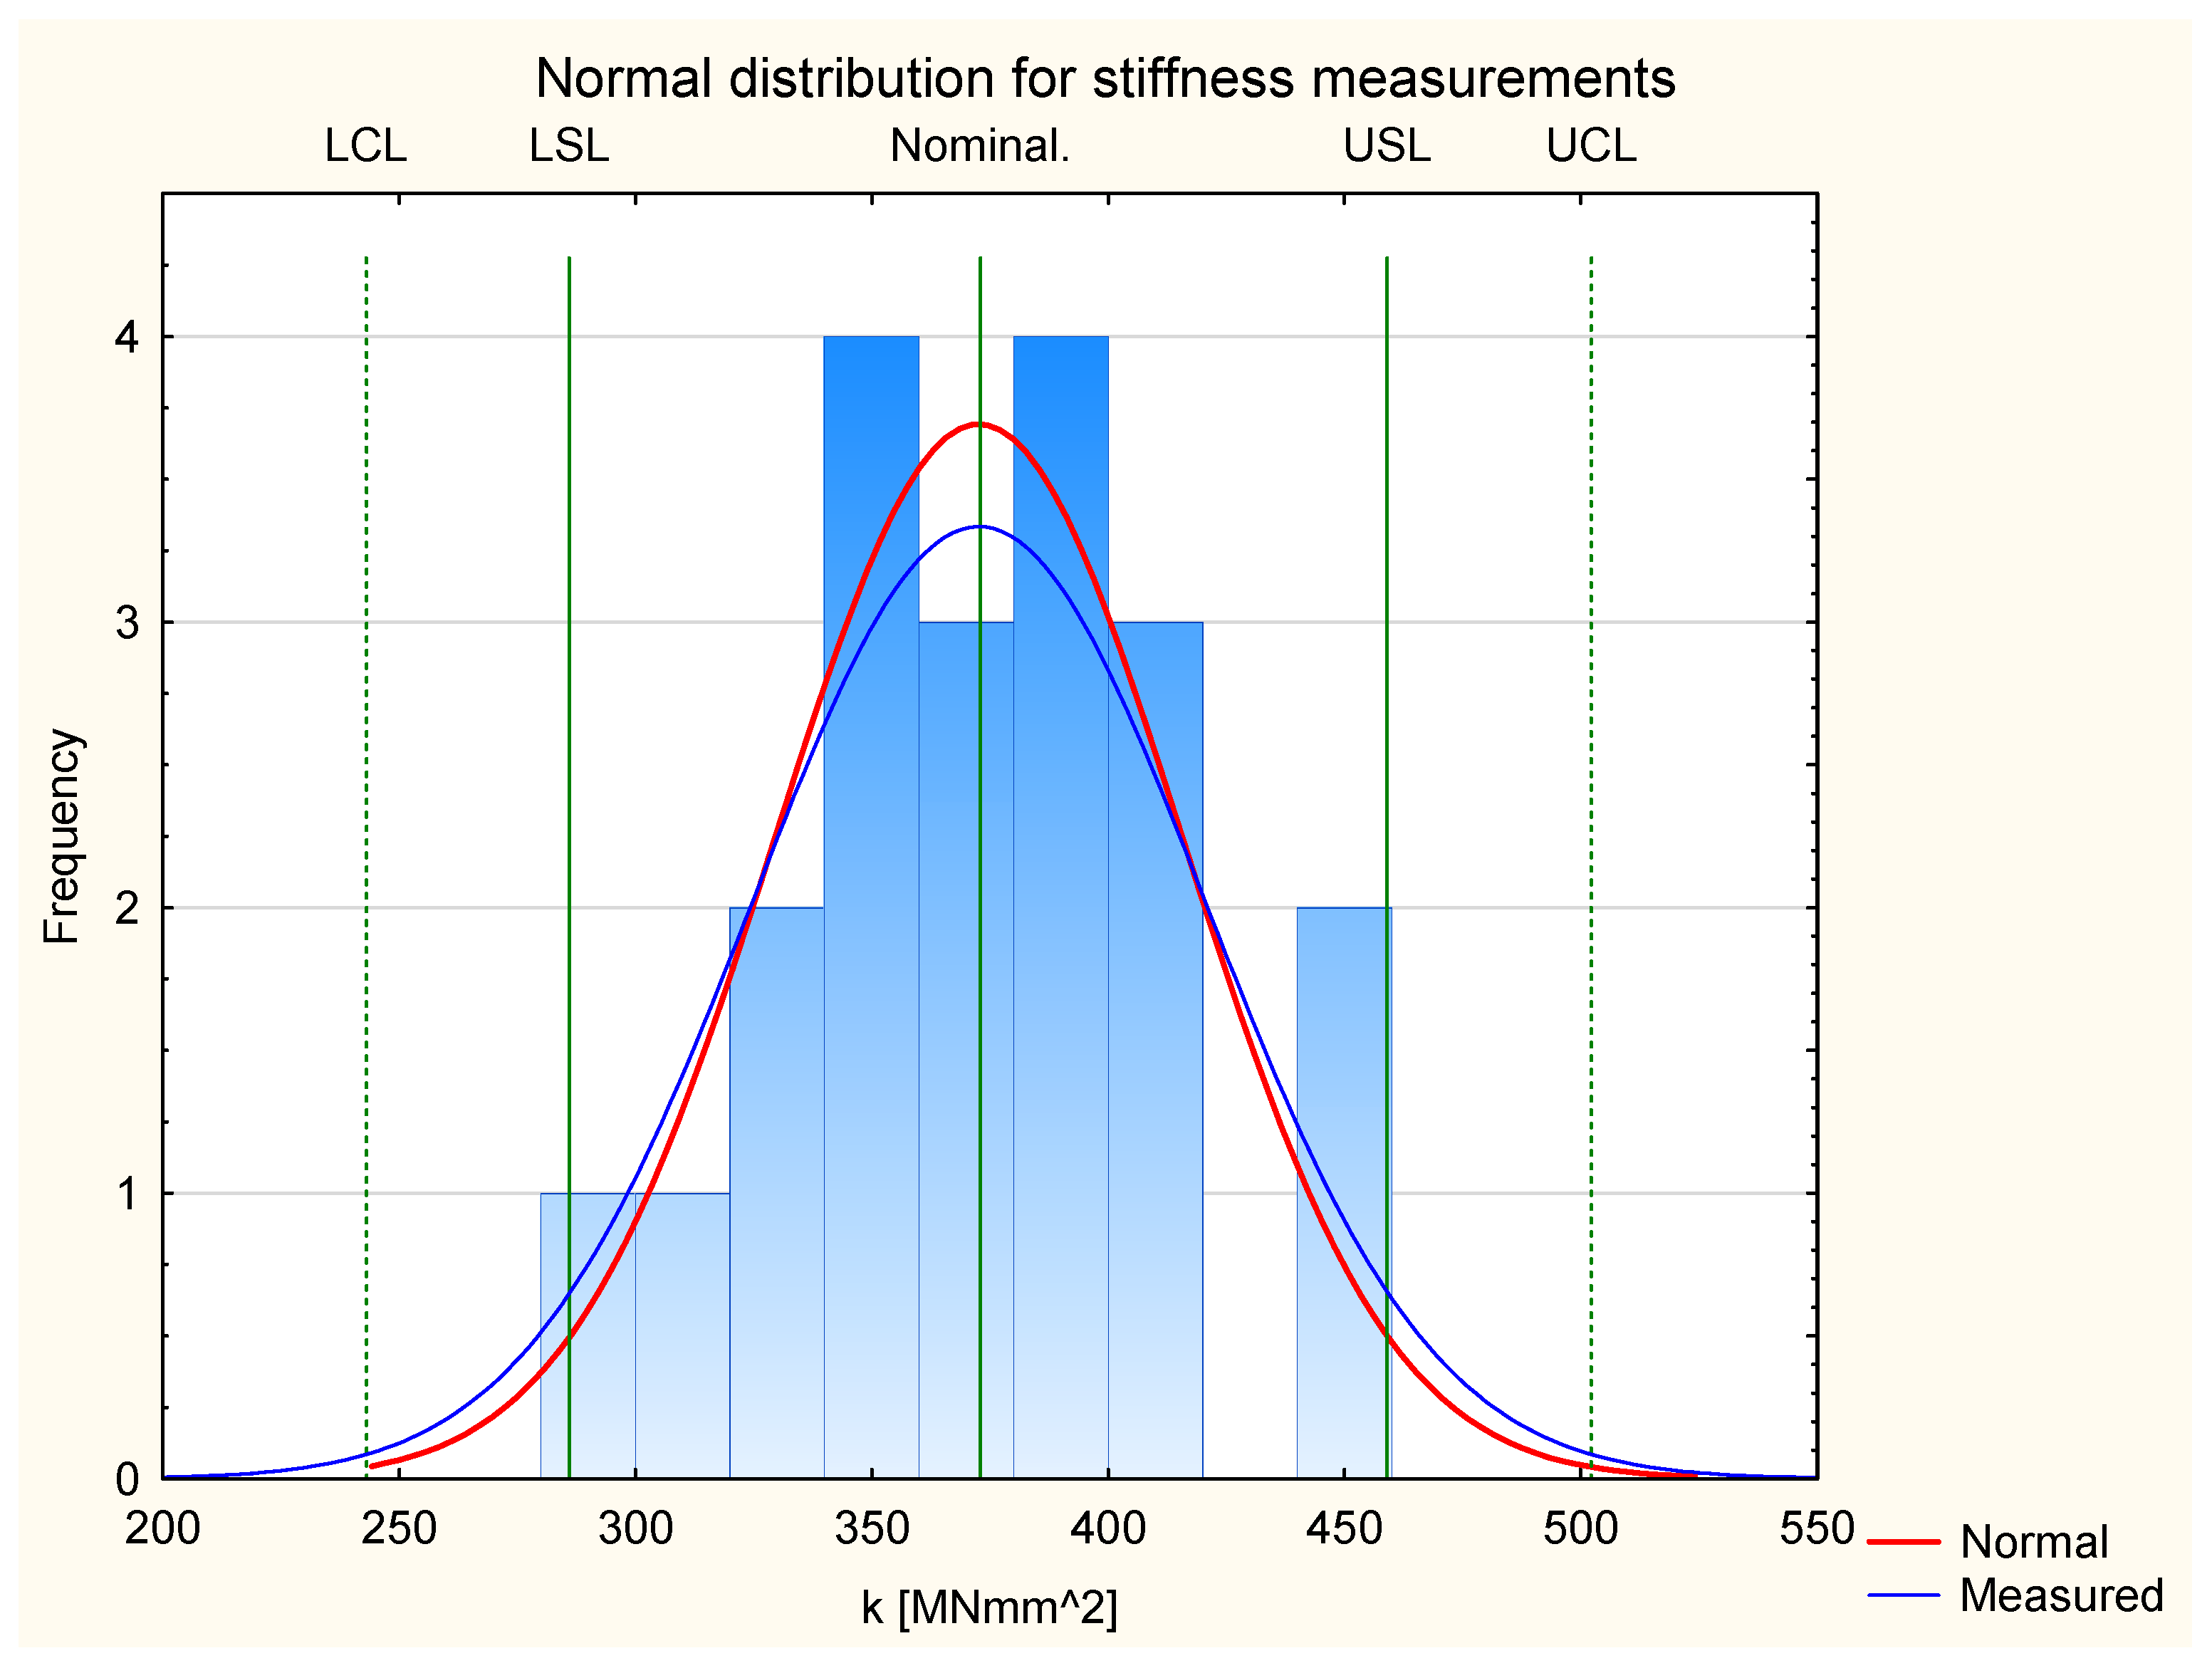
3.1.2. Stiffness
3.2. Analysis of Samples Made of Pine and Alder Wood
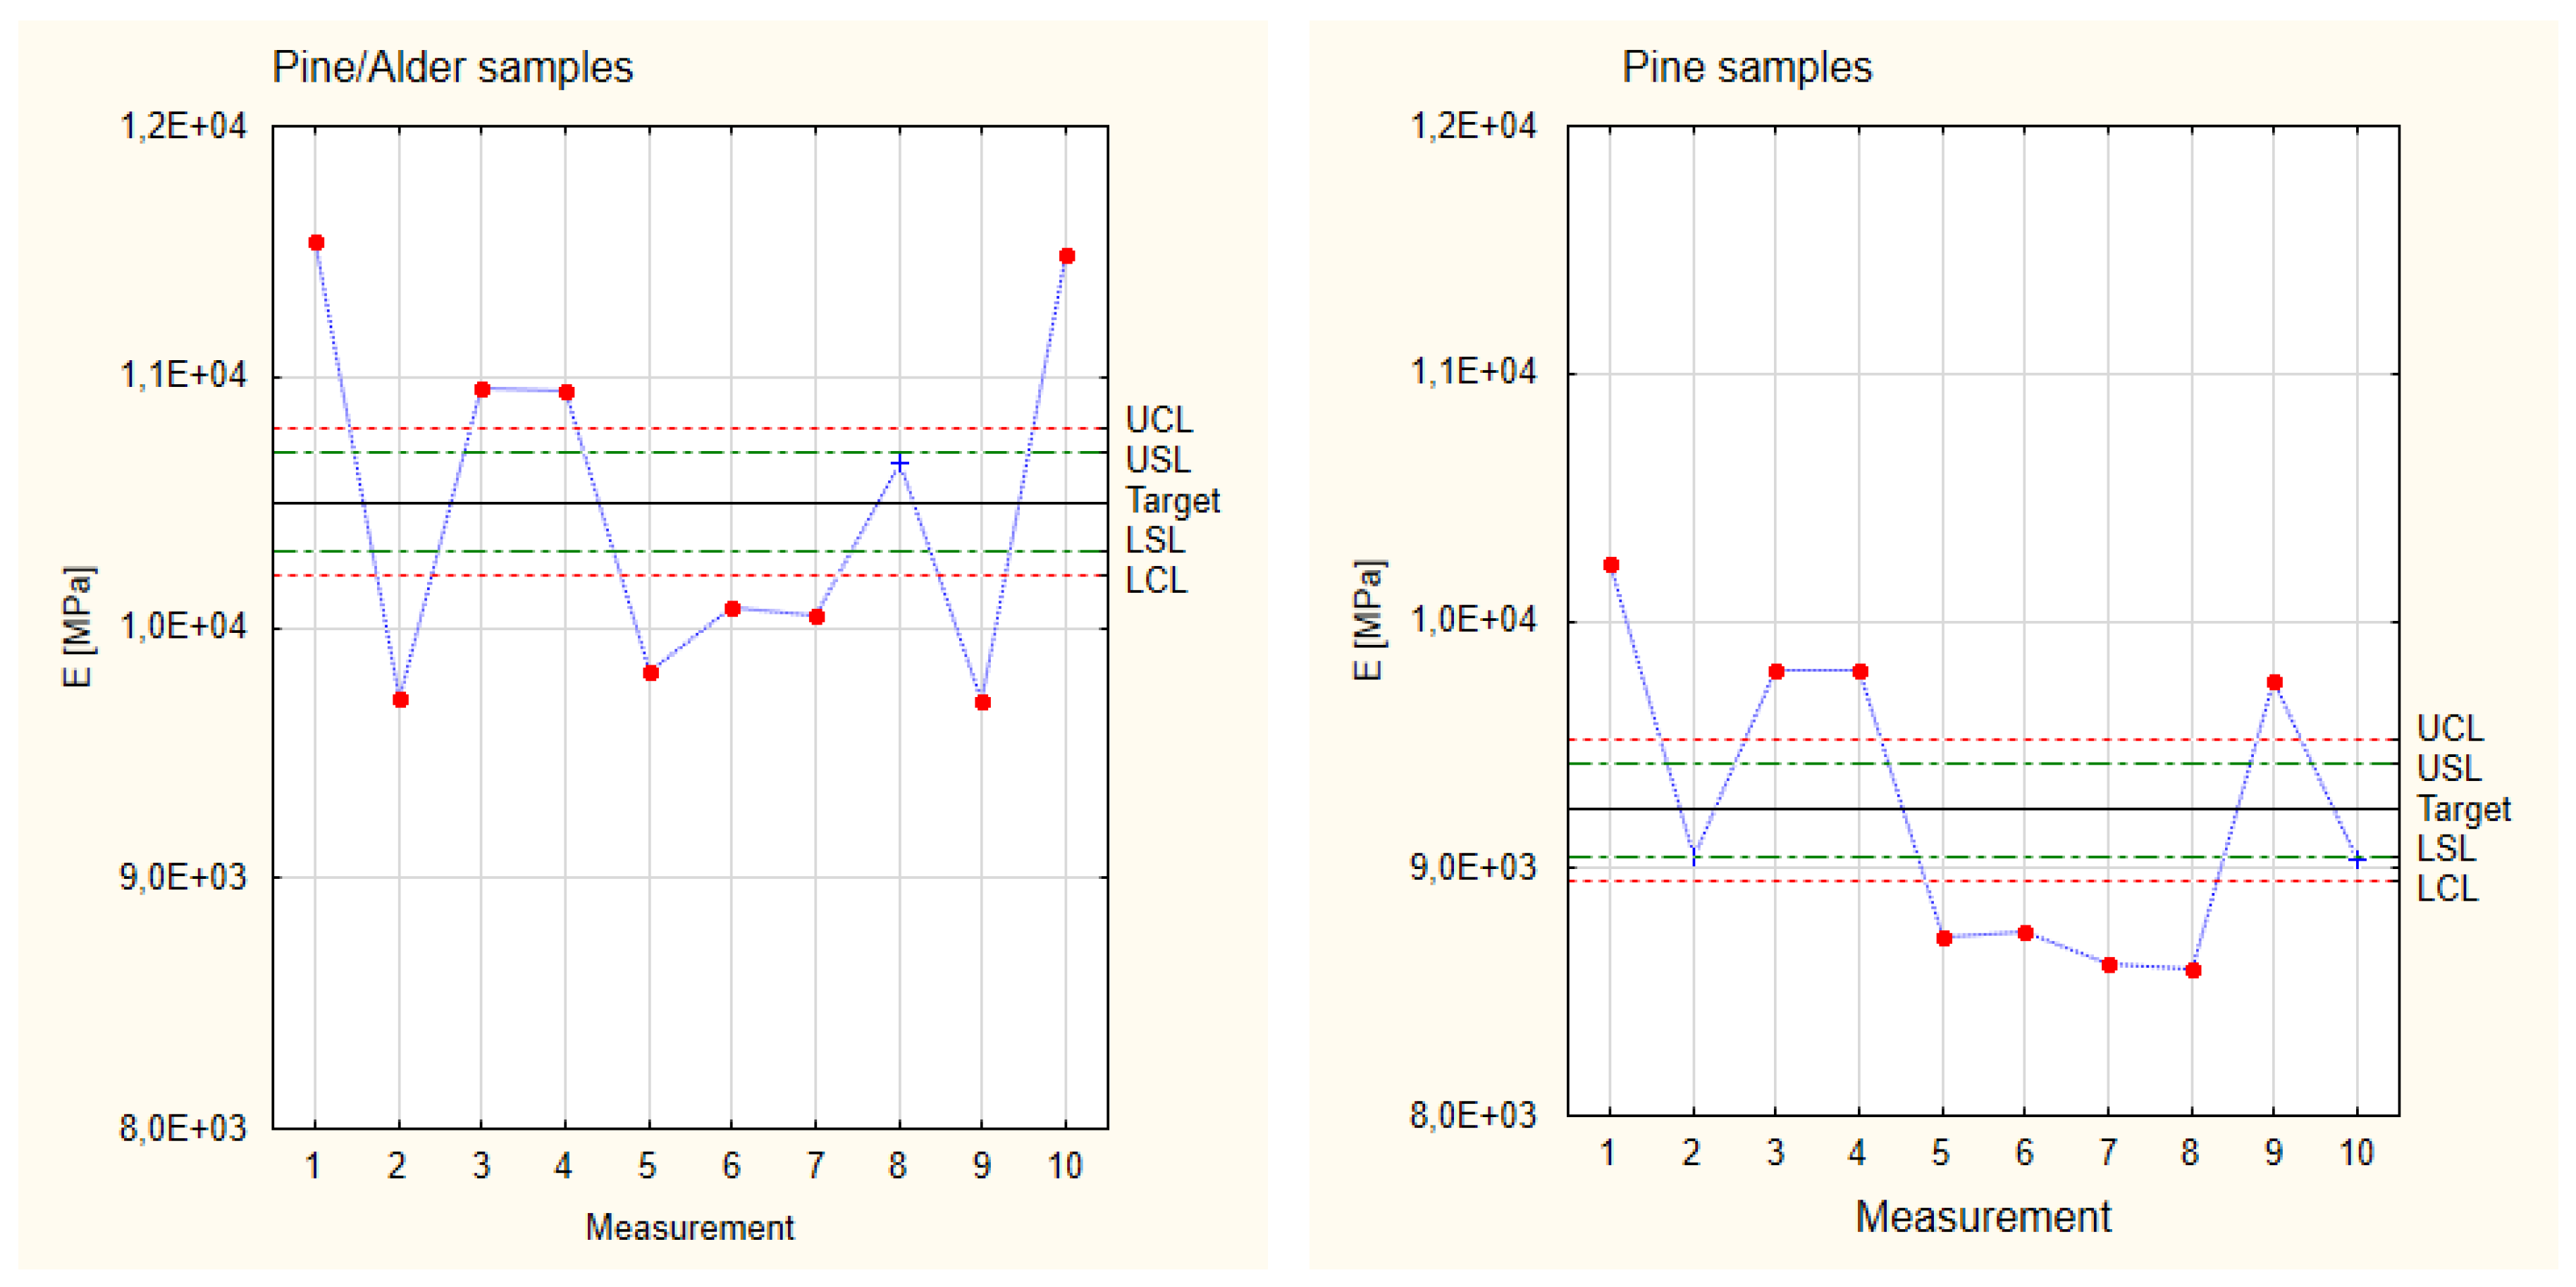
3.2.1. Young’s Modulus
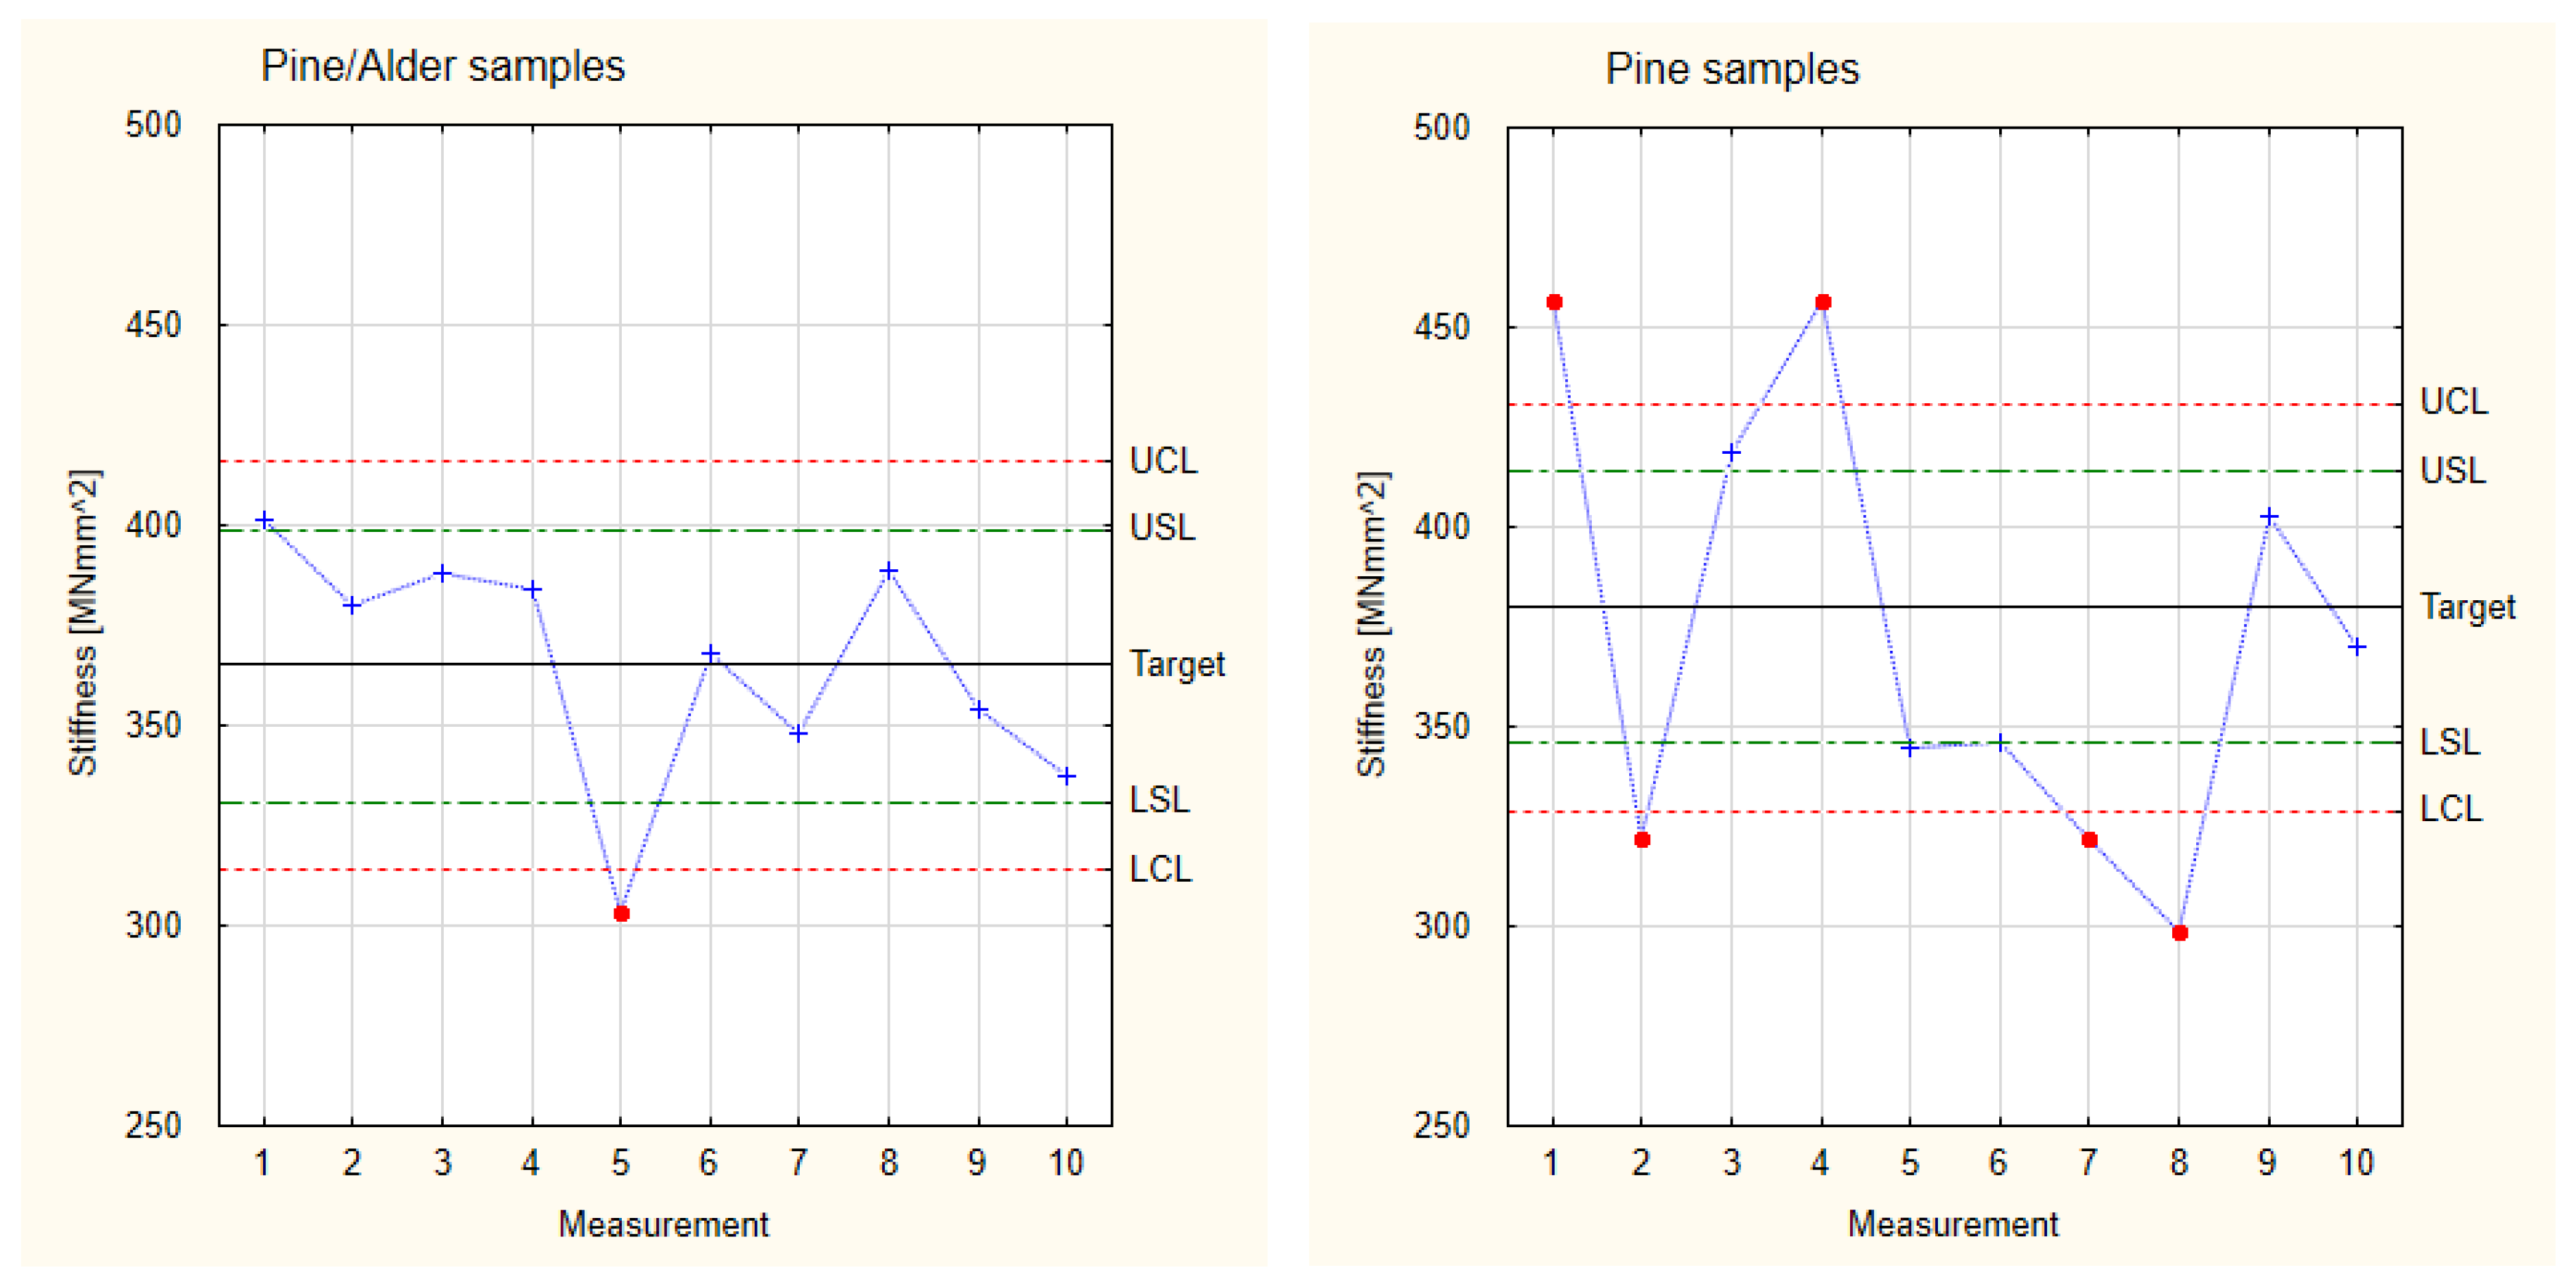
3.2.2. Stiffness
4. Conclusions
Author Contributions
Funding
Institutional Review Board Statement
Informed Consent Statement
Data Availability Statement
Conflicts of Interest
References
- Respondek, T.; Adamowicz, M.; Wiktorski, T. Drewno—Strategiczny surowiec branży meblarskiej. Drew.-Surowiec Strateg. 2012, 57–64. (In Polish) [Google Scholar]
- Kafel, K.; Buda, P. Geneza posadzki pałacowej—Zabytkowej warstwy wykończeniowej. Acta Sci. Pol. Architectura 2019, 18, 43–50. (In Polish) [Google Scholar] [CrossRef]
- Wolski, Z. Parkieciarz. Podstawy Wiedzy i Praktyki Zawodowej; WSIP: Warsaw, Poland, 2007. (In Polish) [Google Scholar]
- Koynov, D.; Antov, P.; Valyova, M.; Savov, V.; Dochev, I.; Hua Lee, S. Properties of Hybrid Plywood Produced by Utilisation of Peeler Cores. Forests 2024, 15, 582. [Google Scholar] [CrossRef]
- Barlinek, S.A. Barlinek Engineered Wood Flooring. Available online: https://www.barlinek.co.uk/products/engineered-wood-flooring/ (accessed on 7 January 2022).
- Available online: https://www.jaf-polska.pl/shop/plyty-i-sklejki~c14207617 (accessed on 16 July 2024).
- Przemysł Drzewny i Meblarski w Polsce. Stan i Perspektywy Rozwoju; Wnorowska, M., Ed.; Polwood: Syracuse, NY, USA, 2007. (In Polish) [Google Scholar]
- Mchta, M.G.; Vadher, J.A. A Study on Different Failures of Composite Materials. Int. J. Adv. Eng. Res. Dev. 2017, 4, 302–307. [Google Scholar]
- Heräjärvi, H. Variation of Basic Density and Brinell Hardness within Mature Finnish Betula pendula and B. pubescens Stems. Wood Fiber Sci. 2004, 36, 216–227. [Google Scholar]
- Holmberg, H. Influence of Grain Angle on Brinell Hardness of Scots Pine (Pinus sylvestris L.). Holz Roh-Und Werkst. 2000, 58, 91–95. [Google Scholar] [CrossRef]
- Wang, S.Y.; Wang, H.L. Effects of Moisture Content and Specific Gravity on Static Bending Properties and Hardness of Six Wood Species. J. Wood Sci. 1999, 45, 127–133. [Google Scholar] [CrossRef]
- Grześkiewicz, M.; Krawiecki, J. Thermally Modified Ash and Oak Wood as Materials for Parquets—Mechanical Properties of the Wood and Its UV Resistance for Different Kinds of Wood Finishing. Ann. WULS—SGGW For. Wood Technol. 2008, 65, 93–97. [Google Scholar]
- Makowski, A.; Noskowiak, A. Empirical verification of a digital model of a basketball to assess elastic properties of sports floors. Ann. WULS—SGGW For. Wood Technol. 2016, 95, 227–230. [Google Scholar]
- Grubii, V.; Johanson, J. The Impact of Top-Layer Sliced Lamella Thickness and Core Type Surface-Checking in Engineered Wood Flooring. Forests 2023, 14, 2250. [Google Scholar] [CrossRef]
- Jonsson, A.; Tillman, A.M.; Svensson, T. Life cycle assessment of flooring materials: Case study. Build. Environ. 1997, 32, 245–255. [Google Scholar] [CrossRef]
- Nyrud, A.Q.; Bringslimark, T. Is interior wood use psychologically beneficial? A review of psychological responses toward wood. Wood Fiber Sci. J. Soc. Wood Sci. Technol. 2010, 42, 202–218. [Google Scholar]
- Jackowska, D. 2013: Drzewne Materiały Posadzkowe do Pomieszczeń o Dużym Natężeniu Ruchu. Engineer Work Performed at the Department of Technology, Organization and Management in the Wood Industry, Warsaw University of Life Sciences. Available online: https://bw.sggw.edu.pl/info/bachelor/WULS1c98bd2837a54304b8ae926d27391561/ (accessed on 19 September 2024). (In Polish).
- PN-EN 13226:2009; Wooden Floors. Solid Flooring Elements with Grooves and/or Tongues. Polski Komitet Normalizacyjny: Warsaw, Poland, 2009.
- Morris, B. The components of the Wired Spanning Forest are recurrent. Probab. Theory Relat. Fields 2003, 125, 259–265. [Google Scholar] [CrossRef]
- European Commission. Reviewing the Contribution of the Land Use, Land Use Change and Forestry Sector to the Green Deal. Available online: https://climate.ec.europa.eu/ (accessed on 19 September 2024).
- Circular Economy Action Plan, for a Cleaner and More Competitive Europe, EU Green Deal. 2019. Available online: https://ec.europa.eu (accessed on 8 March 2024).
- Circular Economy. Available online: https://www.holcim.com/sustainability/ (accessed on 19 September 2024).
- The New European Bauhaus, European Parliament Resolution of September 14, 2022 on the New European Bauhaus (2021/2255(INI)), P9_TA(2022)0319, European Parliament, 2019–2024. Available online: https://new-european-bauhaus.europa.eu/about/about-initiative_en (accessed on 19 September 2024).
- European Commission. Sustainable Product Policy. EU Science Hub. 2018. Available online: https://ec.europa.eu/jrc/en/research-topic/sustainable-product-policy (accessed on 19 September 2024).
- Sustainable Minds. Available online: http://www.sustainableminds.com/ (accessed on 19 September 2024).
- EN 1927-2:2008; Qualitative Classification of Softwood Round Timber—Part 2: Pines. iTeh Standards: Toronto, ON, Canada, 2008.
- Beer, P.; Pacek, P.; Burawska-Kupniewska, I.; Oleńska, S.; Różańska, A. Influence of alder (Alnus glutinosa Gaerthn.) veneers on selected mechanical properties of layered pine (Pinus sylvestris L.) composites. Ann. Wars. Univ. Life Sci.—SGGW. For. Wood Technol. 2019, 108, 13–20. [Google Scholar] [CrossRef]
- Available online: www.drewspan.com.pl (accessed on 19 September 2024).
- EN 310: 1993; Wood-Based Panels—Determination of Modulus of Elasticity in Bending and of Bending Strength. European Committee for Standarization: Brussels, Belgium, 1993.
- Burawska-Kupniewska, I.; Mycka, P.; Beer, P. Influence of Scots Pine (Pinus sylvestris L.) Veneers Quality on Selected Properties of Layered Composite for Flooring Materials. Forests 2021, 12, 1017. [Google Scholar] [CrossRef]
- ISO 9052-1; Determination of Dynamic Stiffness. Part 1: Materials Used Under Floating Floors in Dwellings. International Organization for Standardization: Geneva, Switzerland, 1989.
- Montgomery, D.C. Introduction to Statistical Quality Control, 7th ed.; John Wiley & Sons: Hoboken, NJ, USA, 2013. [Google Scholar]
- Fiori, A.M.; Zenga, M. Karl Pearson and the Origin of Kurtosis. Int. Stat. Rev. 2009, 77, 40–50. [Google Scholar] [CrossRef]
- Pearson, K. “Das Fehlergesetz und Seine Verallgemeinerungen Durch Fechner und Pearson.” A Rejoinder. Biometrika 1905, 4, 169–212. [Google Scholar] [CrossRef]
- Westfall, P.H. Kurtosis as Peakedness, 1905–2014. R.I.P. Am. Stat. 2014, 68, 191–195. [Google Scholar] [CrossRef] [PubMed]
- Kochański, B. Czy kurtoza mierzy spiczastość rozkładu? Wiadomości Statystyczne. Pol. Stat. 2022, 67, 43–61. [Google Scholar]
- Bartkowiak, M. Karty kontrolne obrazem zmienności procesu. Kwart. Nauk. Przedsiębiorstwie 2011, 3, 63–71. (In Polish) [Google Scholar]
- Pande, P.; Neuman, R.P.; Cavanagh, R.R. Six Sigma: Sposób Poprawy Wyników nie Tylko Dla Firm Takich Jak GE Czy Motorola; Wydawnictwo KE Liber: Warsaw, Poland, 2003. [Google Scholar]
- Magaji, A.A.; Yahaya, A.; Asiribo, O.E. Assesing the effects of autocorrelation on the performance of statistical process control charts. Int. J. Math. Stat. Invent. 2015, 3, 15–23. [Google Scholar]
- Klein, M. Two Alternatives to the Shewhart X Control Chart. J. Qual. Technol. 2000, 32, 427–431. [Google Scholar] [CrossRef]
- Oleńska, S.; Beer, P. Quality evaluation of new types of layered composites for flooring materials. Materials 2024, 17, 1892. [Google Scholar] [CrossRef] [PubMed]
- George, D.; Mallery, P. IBM SPSS Statistics 27 Step by Step: A Simple Guide and Reference; Routledge: London, UK, 2021. [Google Scholar]


| Sample Group | Oak Layer [mm] | Scots Pine Veneers in the Base Layer [mm] | |||||
|---|---|---|---|---|---|---|---|
| = | ┴ | = | ┴ | = | ┴ | = | |
| Group 1 | 3 | 2.5 | 3.2 | 2.5 | 3.2 | - | - |
| Group 2 | 3 | 3.2 | 3.2 | 3.2 | 3.2 | - | - |
| Group 3 | 3 | 1.5 | 2.5 | 1.5 | 2.5 | 1.5 | 2.5 |
| Sample Group | Oak Layer [mm] | Alder Veneer [mm] | Pine Veneer [mm] | Alder Veneer [mm] | Pine Veneer [mm] | Alder Veneer [mm] | Pine Veneer [mm] |
|---|---|---|---|---|---|---|---|
| = | ┴ | = | ┴ | = | ┴ | = | |
| Group 4 | 3 | 1.5 | 2.5 | 1.5 | 2.5 | 1.5 | 2.5 |
| Samples Group | Young’s Modulus [MPa] | Stiffness [MNmm2] |
|---|---|---|
| Group 1 | 7735 | 237 |
| 9002 | 322 | |
| 8750 | 319 | |
| 9593 | 395 | |
| 8777 | 320 | |
| 9530 | 351 | |
| 8700 | 315 | |
| 8602 | 256 | |
| 9401 | 339 | |
| 9380 | 330 | |
| Group 2 | 7950 | 276 |
| 7757 | 271 | |
| 9748 | 345 | |
| 7721 | 260 | |
| 8448 | 300 | |
| 9139 | 334 | |
| 8661 | 303 | |
| 7662 | 248 | |
| 8031 | 280 | |
| 8161 | 283 | |
| Group 3 | 10,236 | 457 |
| 9043 | 322 | |
| 9800 | 419 | |
| 9802 | 457 | |
| 8726 | 345 | |
| 8750 | 346 | |
| 8618 | 322 | |
| 8594 | 299 | |
| 9755 | 403 | |
| 9036 | 370 | |
| Standard deviation | 710 | 57 |
| Lower Control Line | 6704 | 158 |
| Lower Specification Line | 7415 | 215 |
| Nominal (average value) | 8836 | 330 |
| Upper Specification Line | 10,258 | 444 |
| Upper Control Line | 10,969 | 501 |
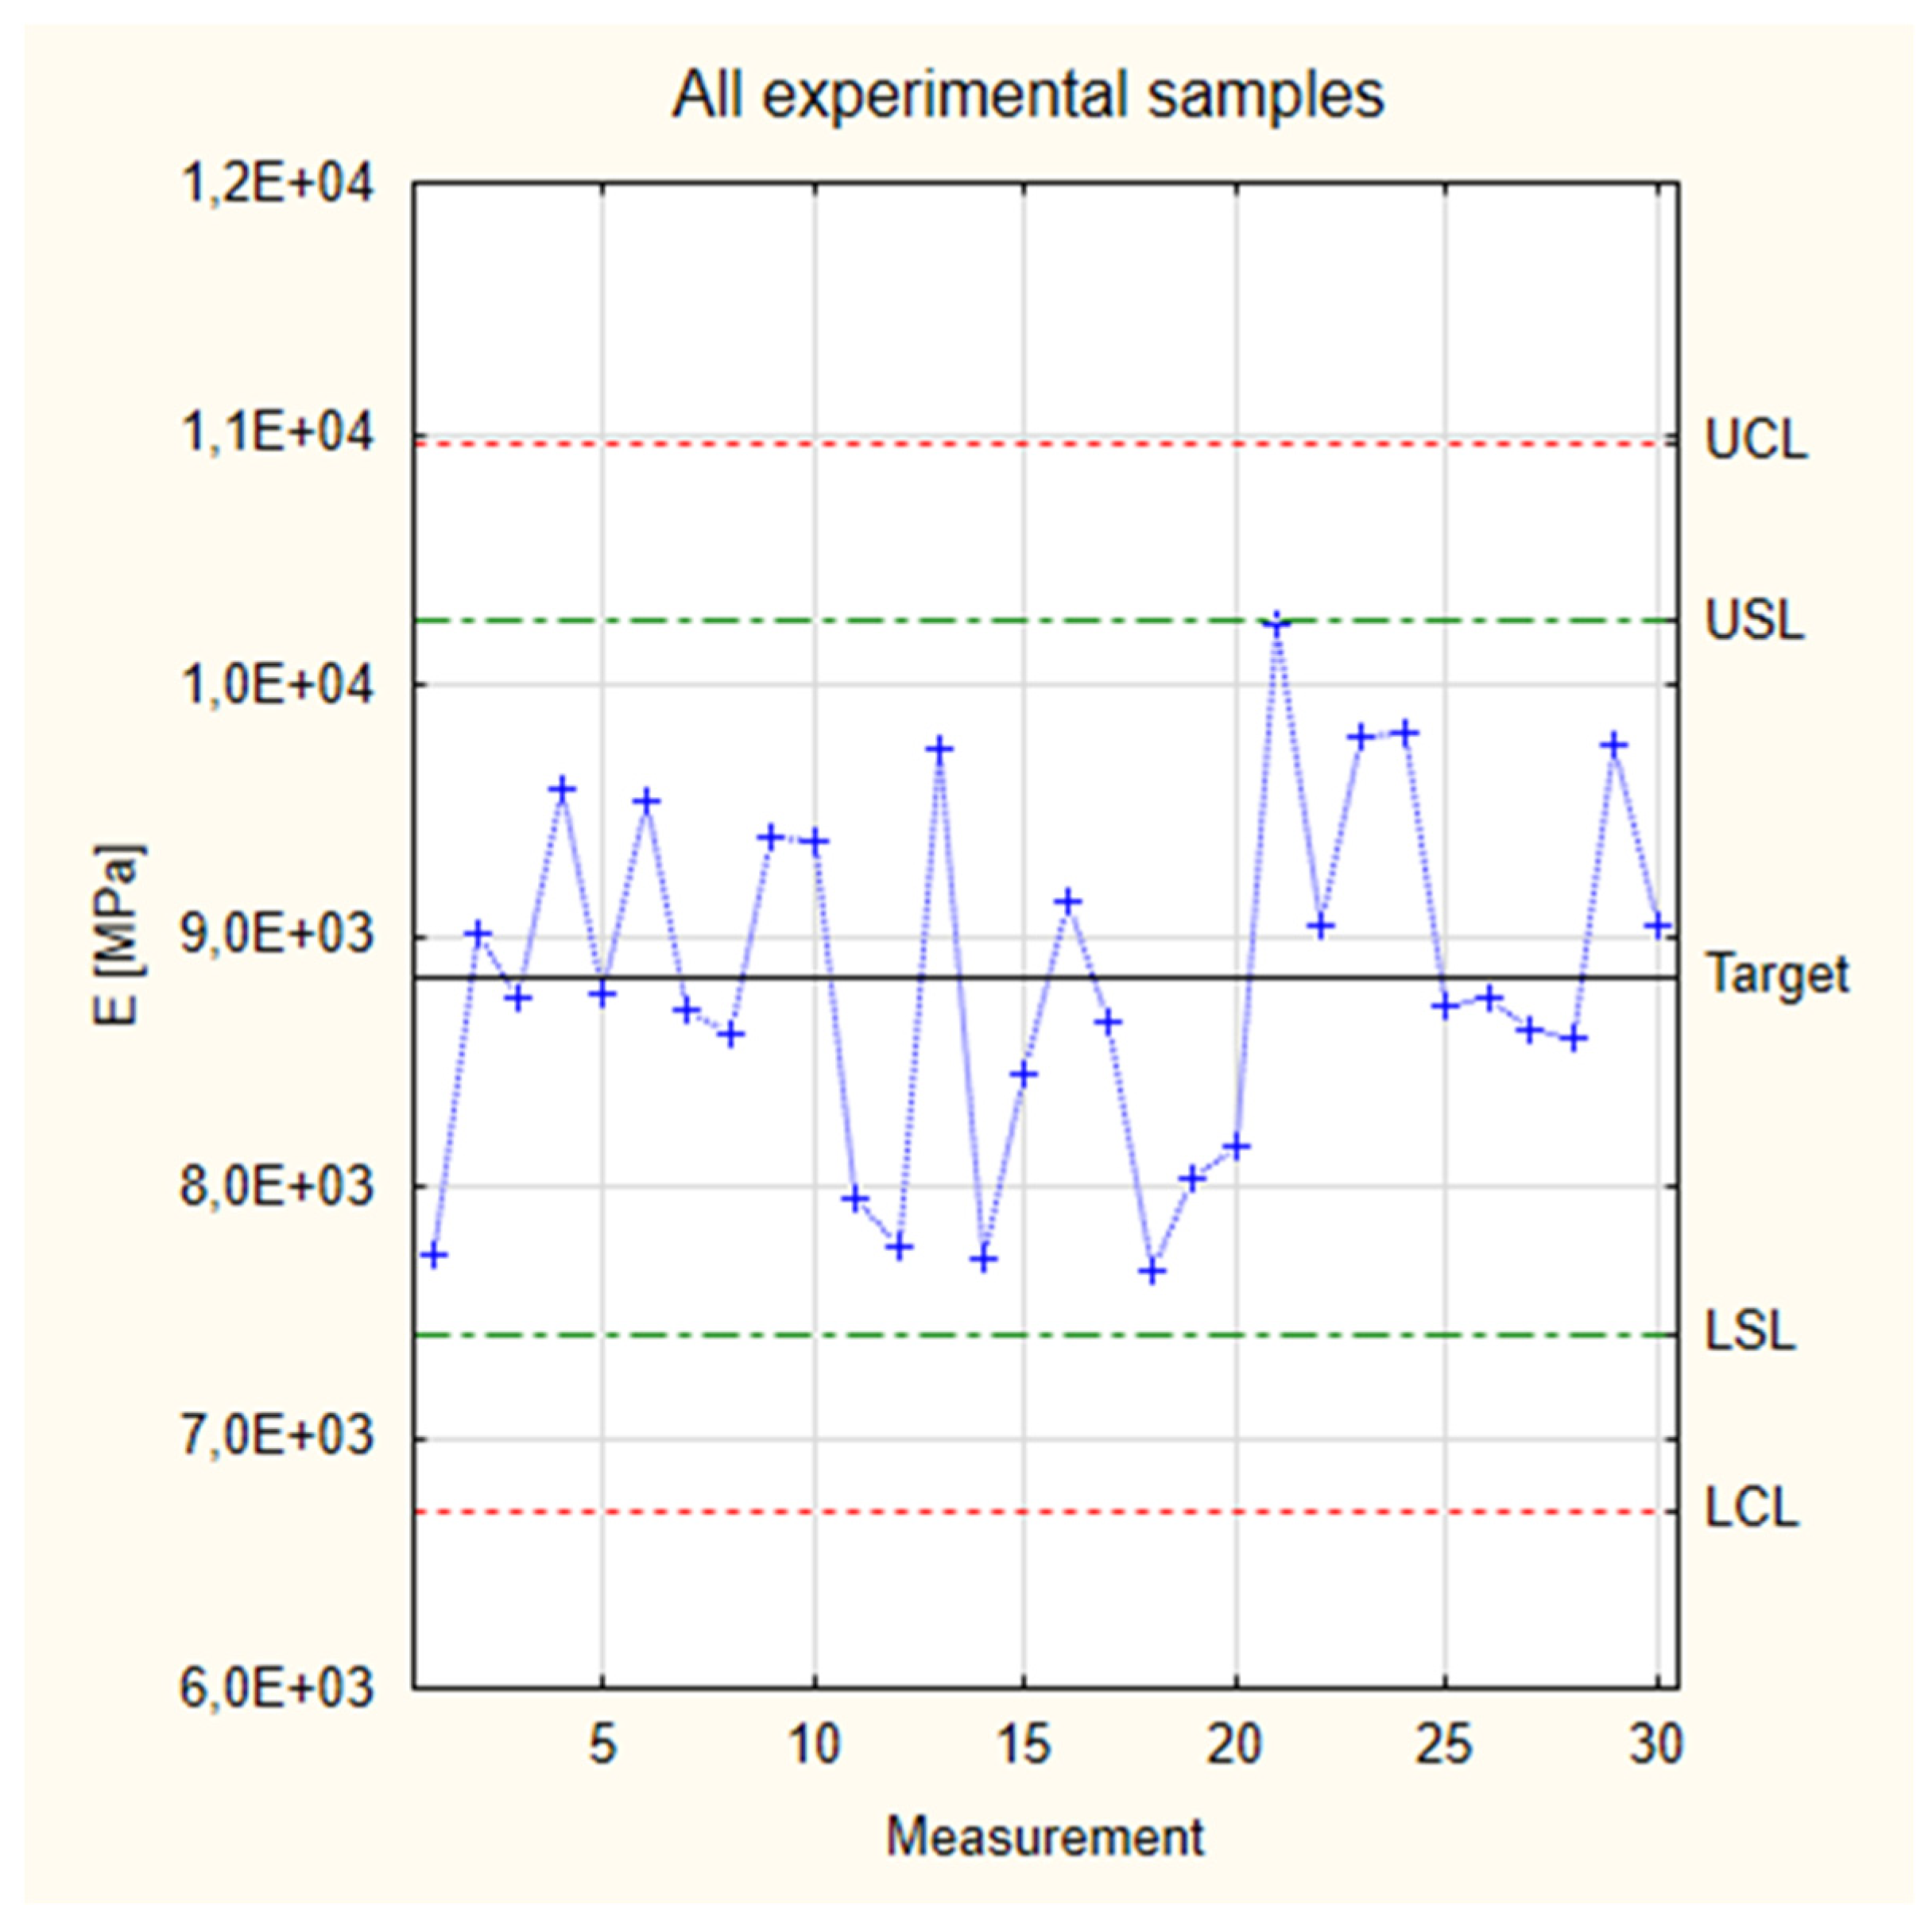
| Sample Group | Standard Deviation | LCL | LSL | Target | USL | UCL |
|---|---|---|---|---|---|---|
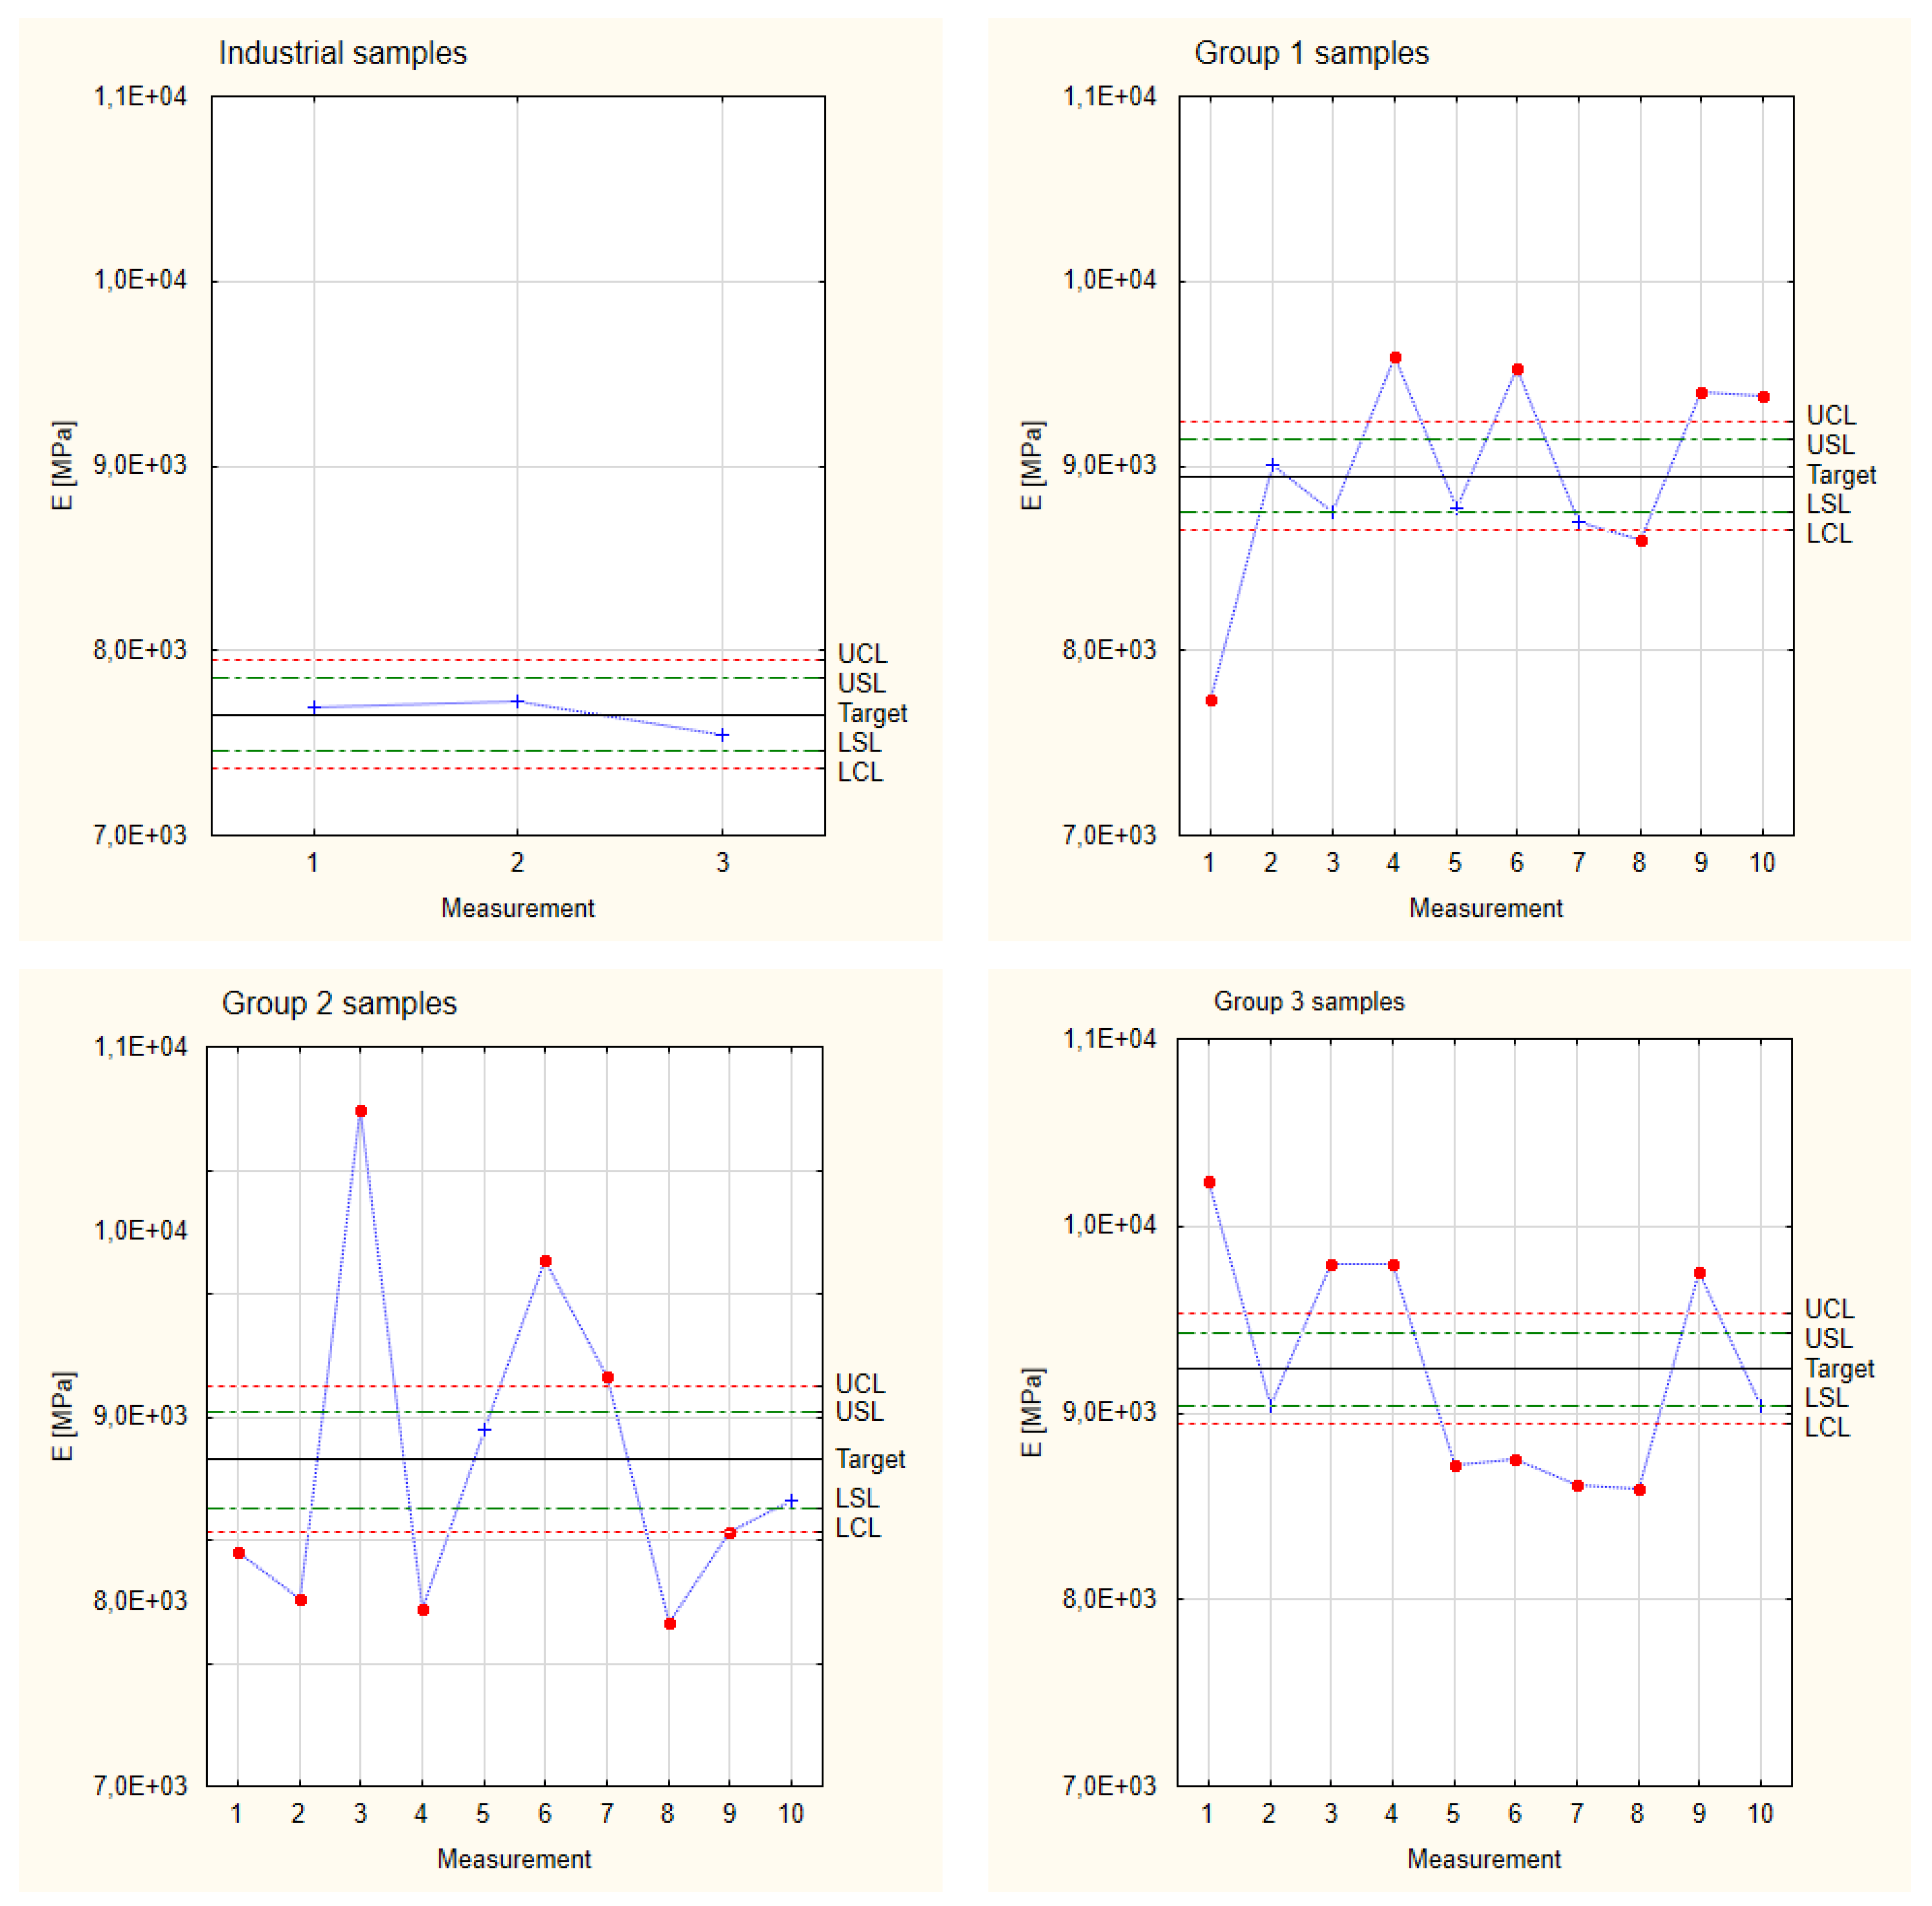
| Industrial | 98 | 7361 | 7459 | 7655 | 7851 | 7949 |
| Group 1 | 8653 | 8751 | 8947 | 9143 | 9241 | |
| Group 2 | 8034 | 8132 | 8328 | 8524 | 8622 | |
| Group 3 | 8942 | 9040 | 9236 | 9432 | 9530 |
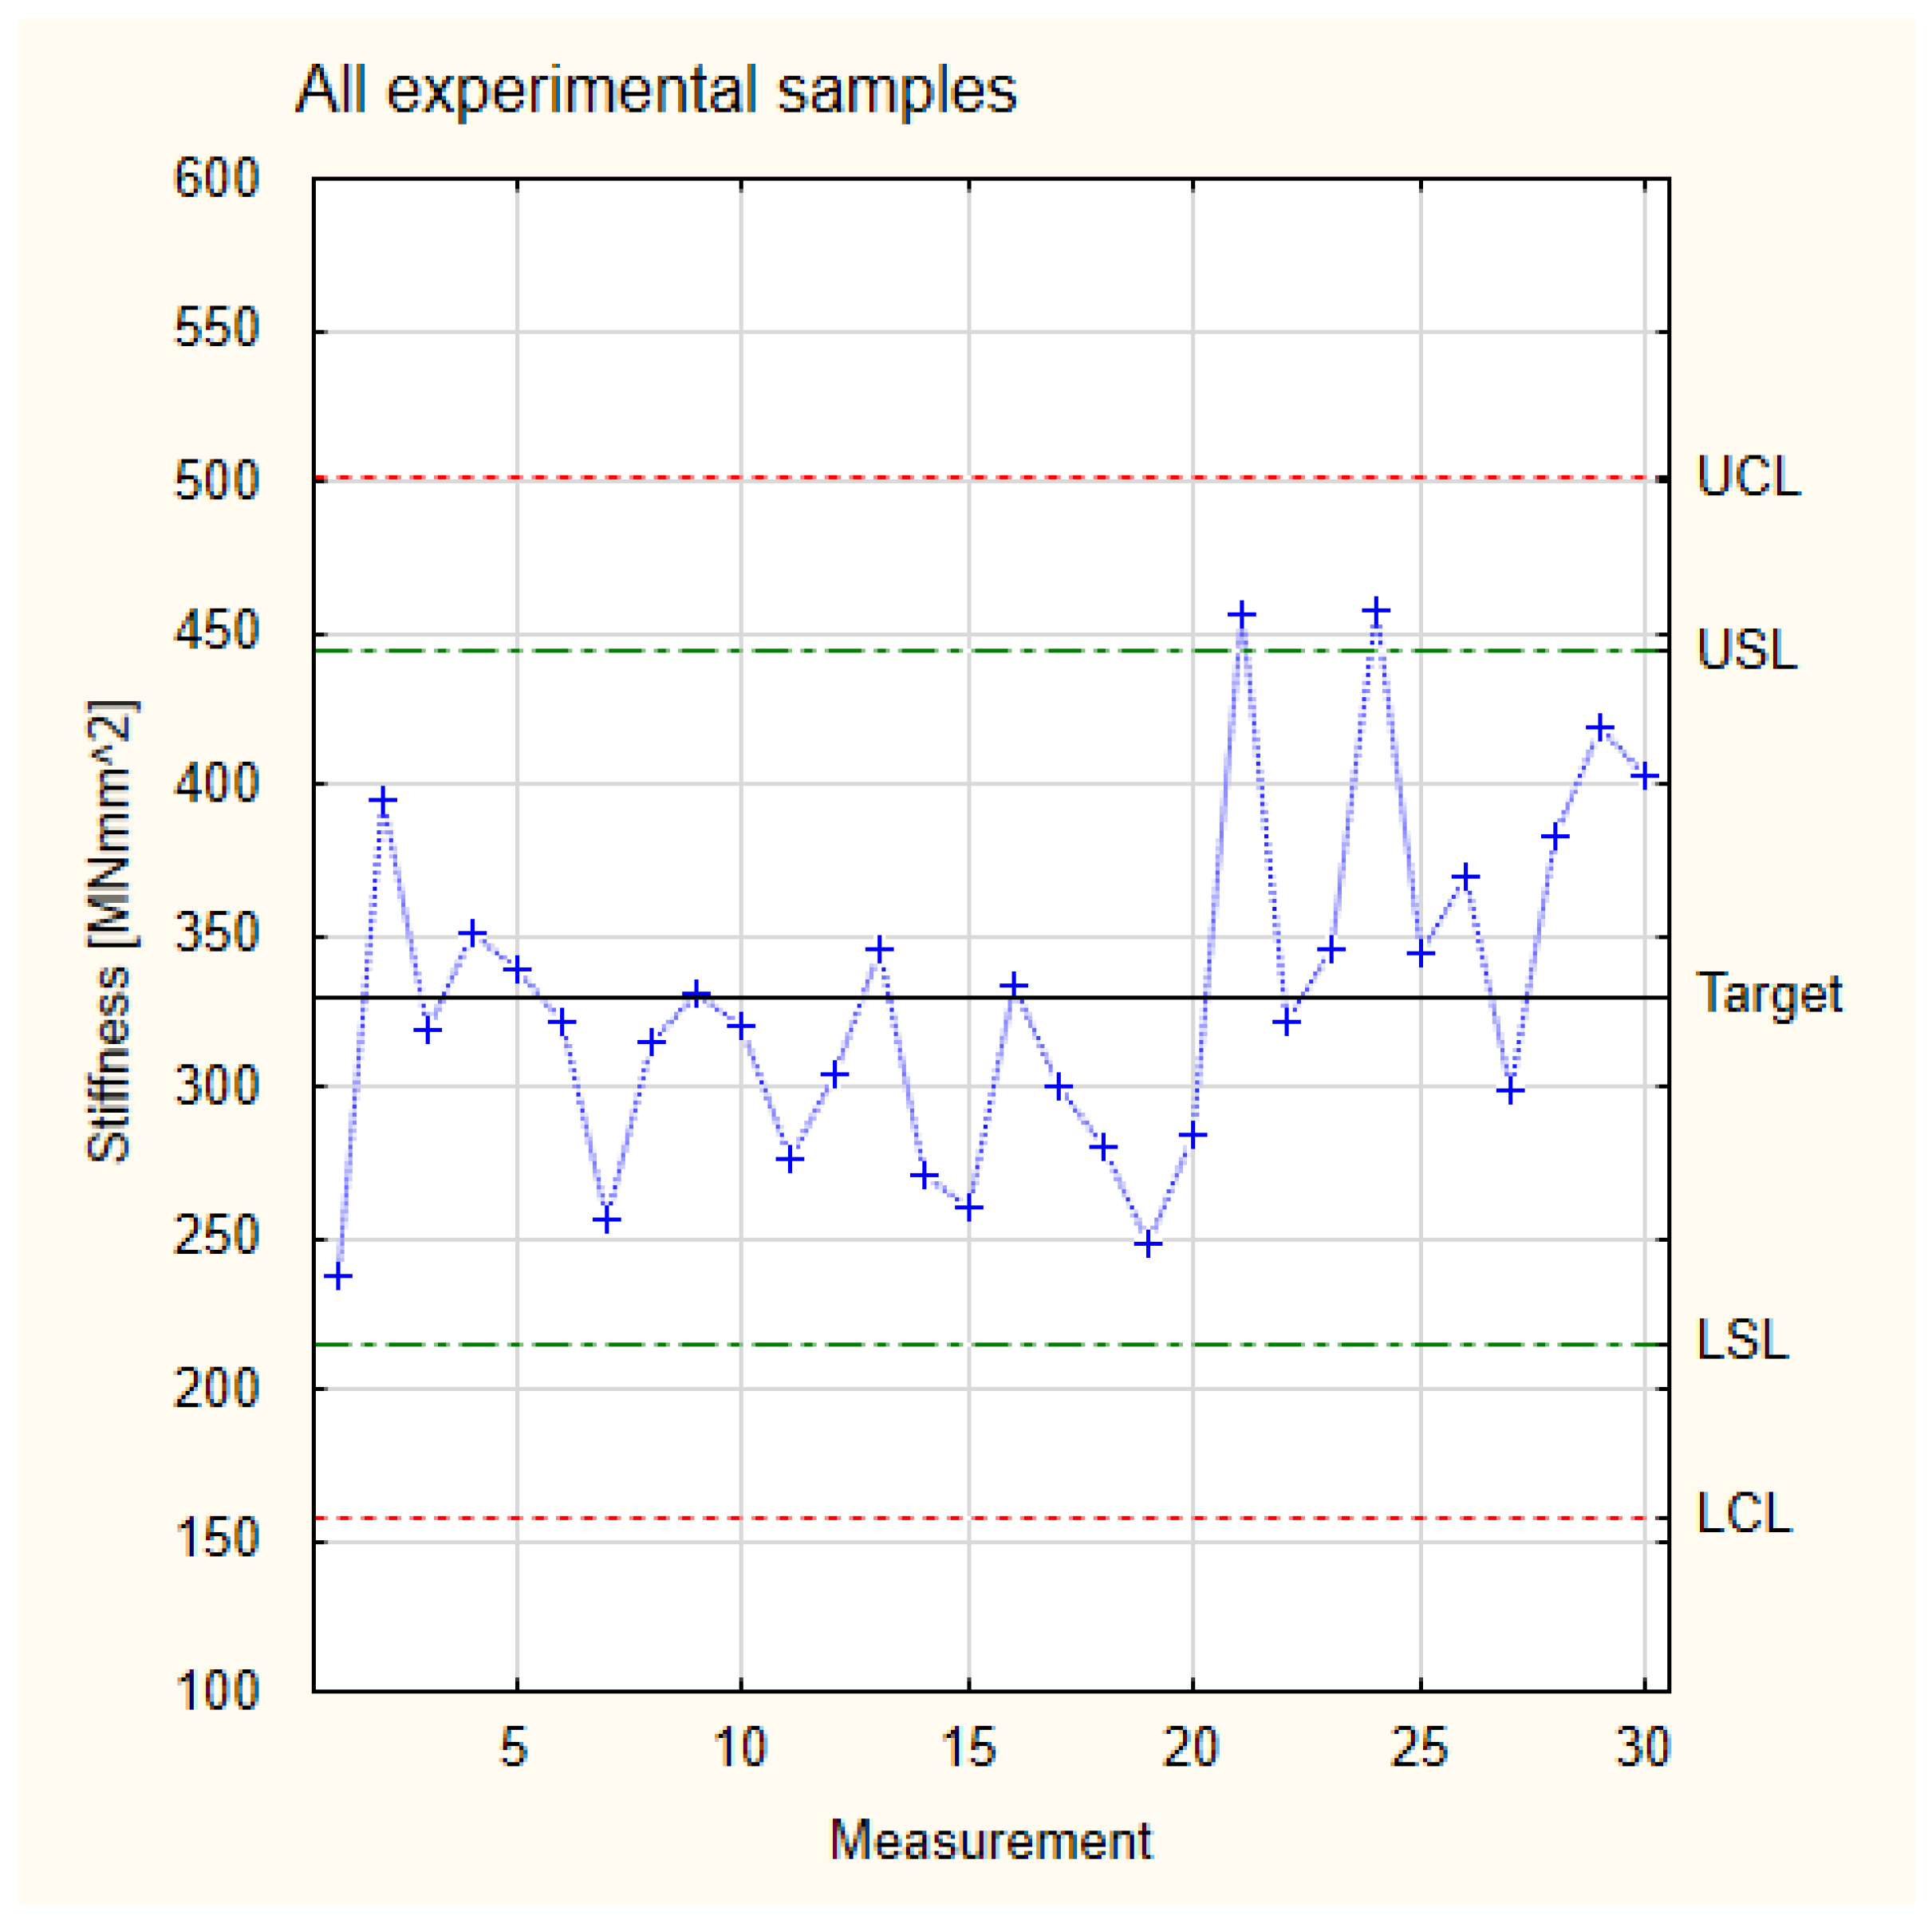
| Sample Group | Standard Deviation | LCL | LSL | Nominal | USL | UCL |
|---|---|---|---|---|---|---|
| Industrial | 17 | 202 | 219 | 252 | 285 | 302 |
| Group 1 | 267 | 284 | 318 | 352 | 369 | |
| Group 2 | 239 | 256 | 290 | 324 | 341 | |
| Group 3 | 329 | 346 | 380 | 414 | 431 |
| Sample Number | Pine/Alder Samples [MPa] | Pine Samples [MPa] |
|---|---|---|
| 1. | 11,547 | 10,236 |
| 2. | 9723 | 9043 |
| 3. | 10,957 | 9800 |
| 4. | 10,943 | 9802 |
| 5. | 9830 | 8726 |
| 6. | 10,076 | 8750 |
| 7. | 10,050 | 8618 |
| 8. | 10,660 | 8594 |
| 9. | 11,492 | 9755 |
| 10. | 9710 | 9036 |
| Kurtosis | −1.73 | −1.71 |
| Total kurtosis | −2.64 | |
| Sample Group | Standard Deviation | LCL | LSL | Target | USL | UCL |
|---|---|---|---|---|---|---|
| Pine/Alder | 98 | 10,205 | 10,303 | 10,499 | 10,695 | 10,793 |
| Pine | 8942 | 9040 | 9236 | 9432 | 9530 |
| Sample Number | Pine/Alder Samples [MPa] | Pine Samples [MPa] |
|---|---|---|
| 1. | 401 | 457 |
| 2. | 380 | 322 |
| 3. | 388 | 419 |
| 4. | 384 | 457 |
| 5. | 303 | 345 |
| 6. | 368 | 346 |
| 7. | 348 | 322 |
| 8. | 389 | 299 |
| 9. | 354 | 403 |
| 10. | 337 | 370 |
| Kurtosis | −0.71 | −1.49 |
| Total kurtosis | −0.88 | |
| Sample Group | Standard Deviation | LCL | LSL | Target | USL | UCL |
|---|---|---|---|---|---|---|
| Pine/Alder | 17 | 314 | 331 | 365 | 399 | 416 |
| Pine | 329 | 346 | 380 | 414 | 431 |
Disclaimer/Publisher’s Note: The statements, opinions and data contained in all publications are solely those of the individual author(s) and contributor(s) and not of MDPI and/or the editor(s). MDPI and/or the editor(s) disclaim responsibility for any injury to people or property resulting from any ideas, methods, instructions or products referred to in the content. |
© 2024 by the authors. Licensee MDPI, Basel, Switzerland. This article is an open access article distributed under the terms and conditions of the Creative Commons Attribution (CC BY) license (https://creativecommons.org/licenses/by/4.0/).
Share and Cite
Olenska, S.; Beer, P. Quality Evaluation of New Types of Core Layers Based on Different Thicknesses of Veneers for Flooring Materials. Materials 2024, 17, 5881. https://doi.org/10.3390/ma17235881
Olenska S, Beer P. Quality Evaluation of New Types of Core Layers Based on Different Thicknesses of Veneers for Flooring Materials. Materials. 2024; 17(23):5881. https://doi.org/10.3390/ma17235881
Chicago/Turabian StyleOlenska, Sylwia, and Piotr Beer. 2024. "Quality Evaluation of New Types of Core Layers Based on Different Thicknesses of Veneers for Flooring Materials" Materials 17, no. 23: 5881. https://doi.org/10.3390/ma17235881
APA StyleOlenska, S., & Beer, P. (2024). Quality Evaluation of New Types of Core Layers Based on Different Thicknesses of Veneers for Flooring Materials. Materials, 17(23), 5881. https://doi.org/10.3390/ma17235881