
Dynamic Mechanical Properties and Damage Morphology Analysis of Concrete with Different Aggregates Based on FDM-DEM Coupling

 and
and
Abstract
1. Introduction
2. Experiment
2.1. Specimen Preparation and Basic Mechanical Properties
2.2. SHPB Test Results
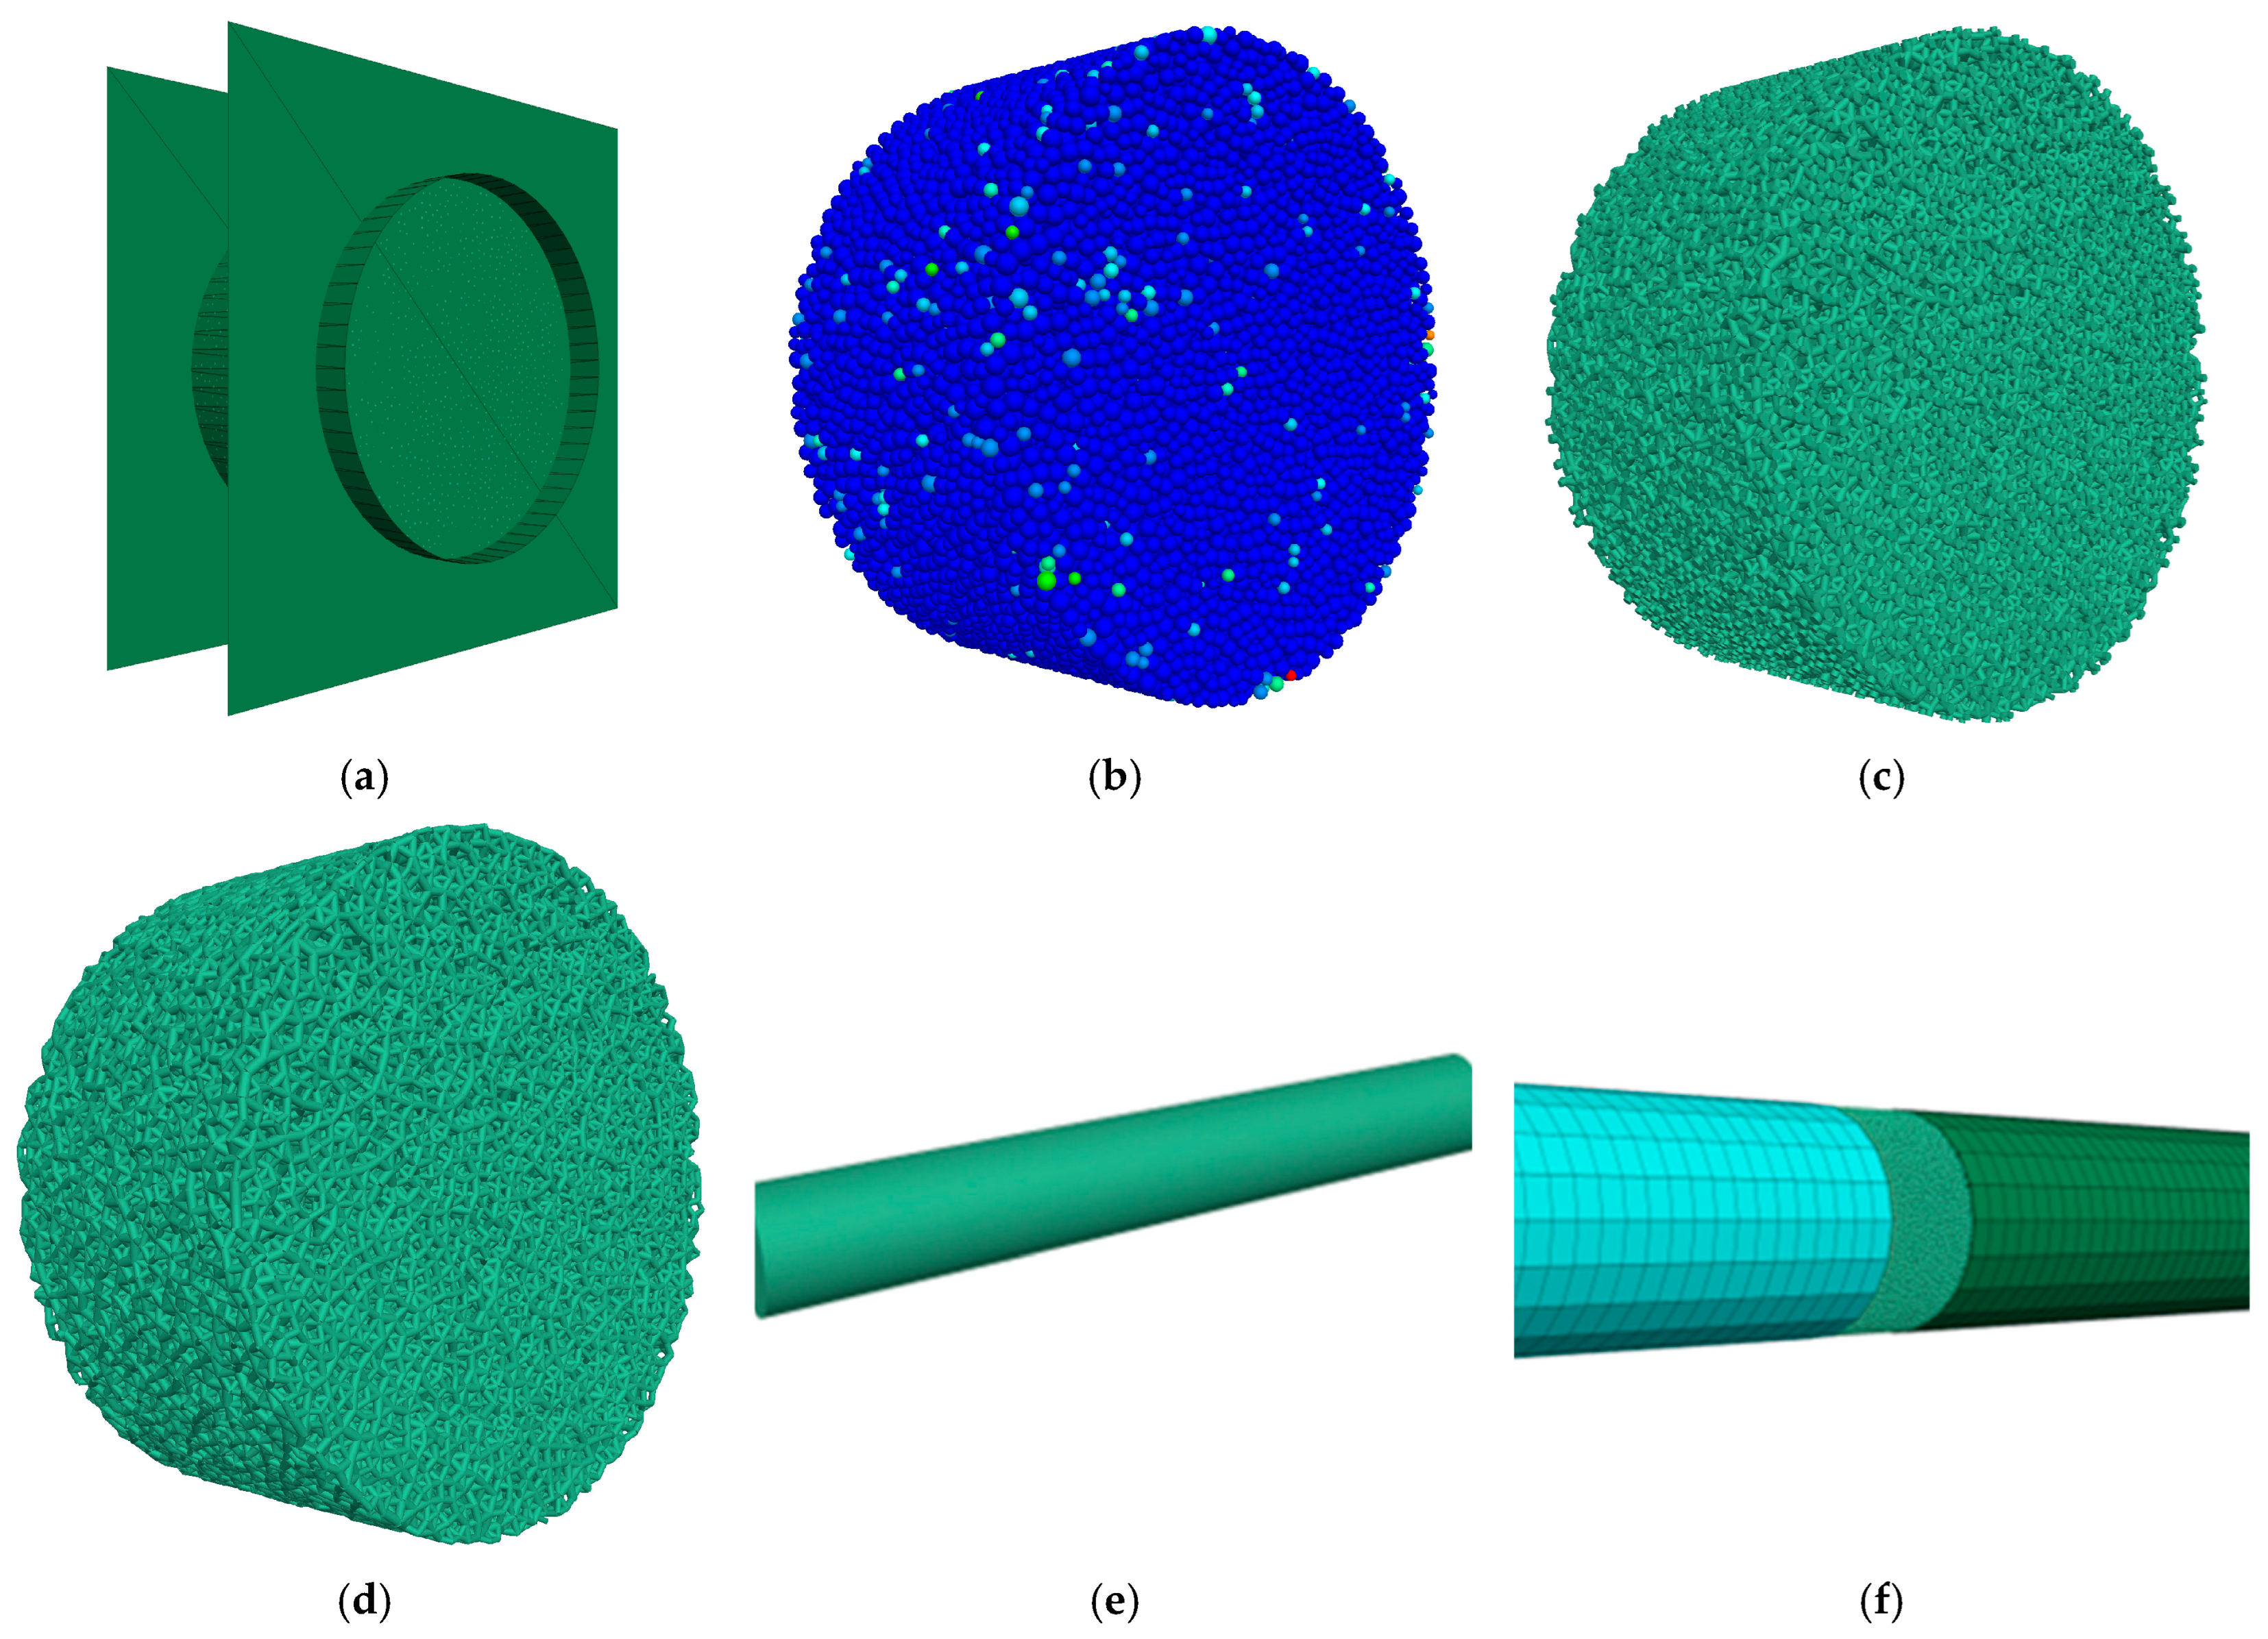
3. Numerical Simulation
3.1. Numerical Modeling
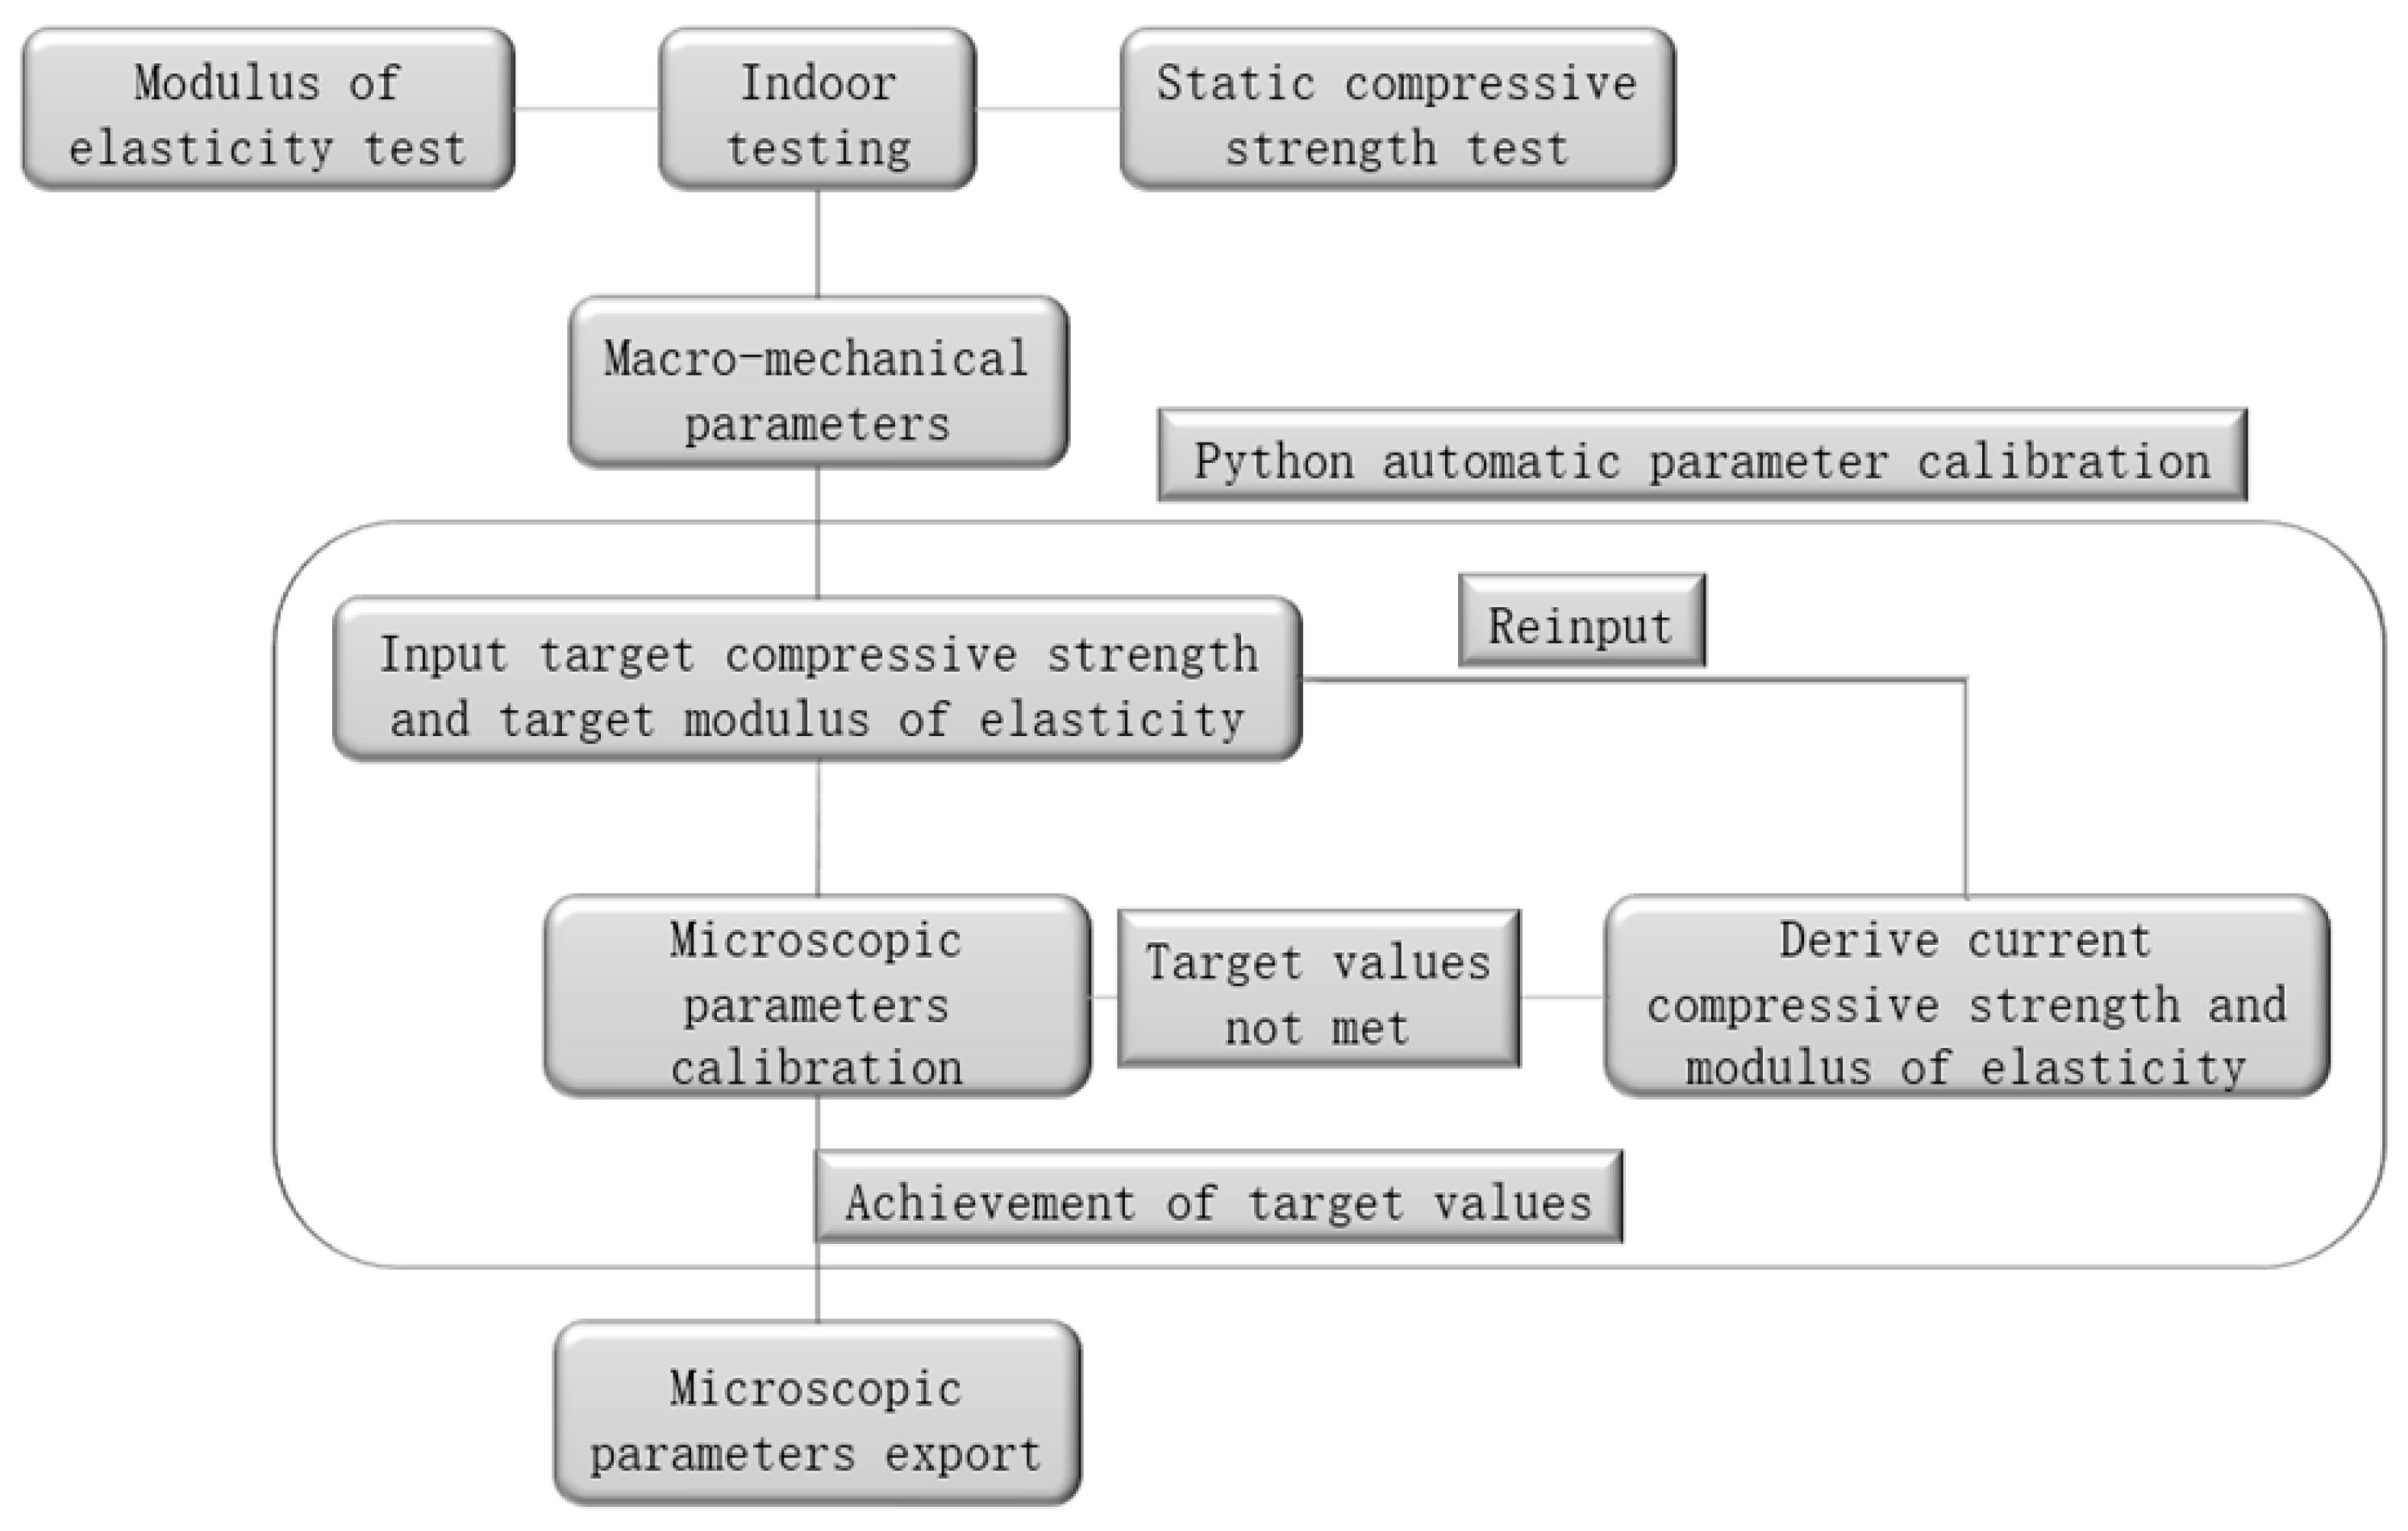
3.2. Microscopic Parameter Calibration
4. Results and Analysis
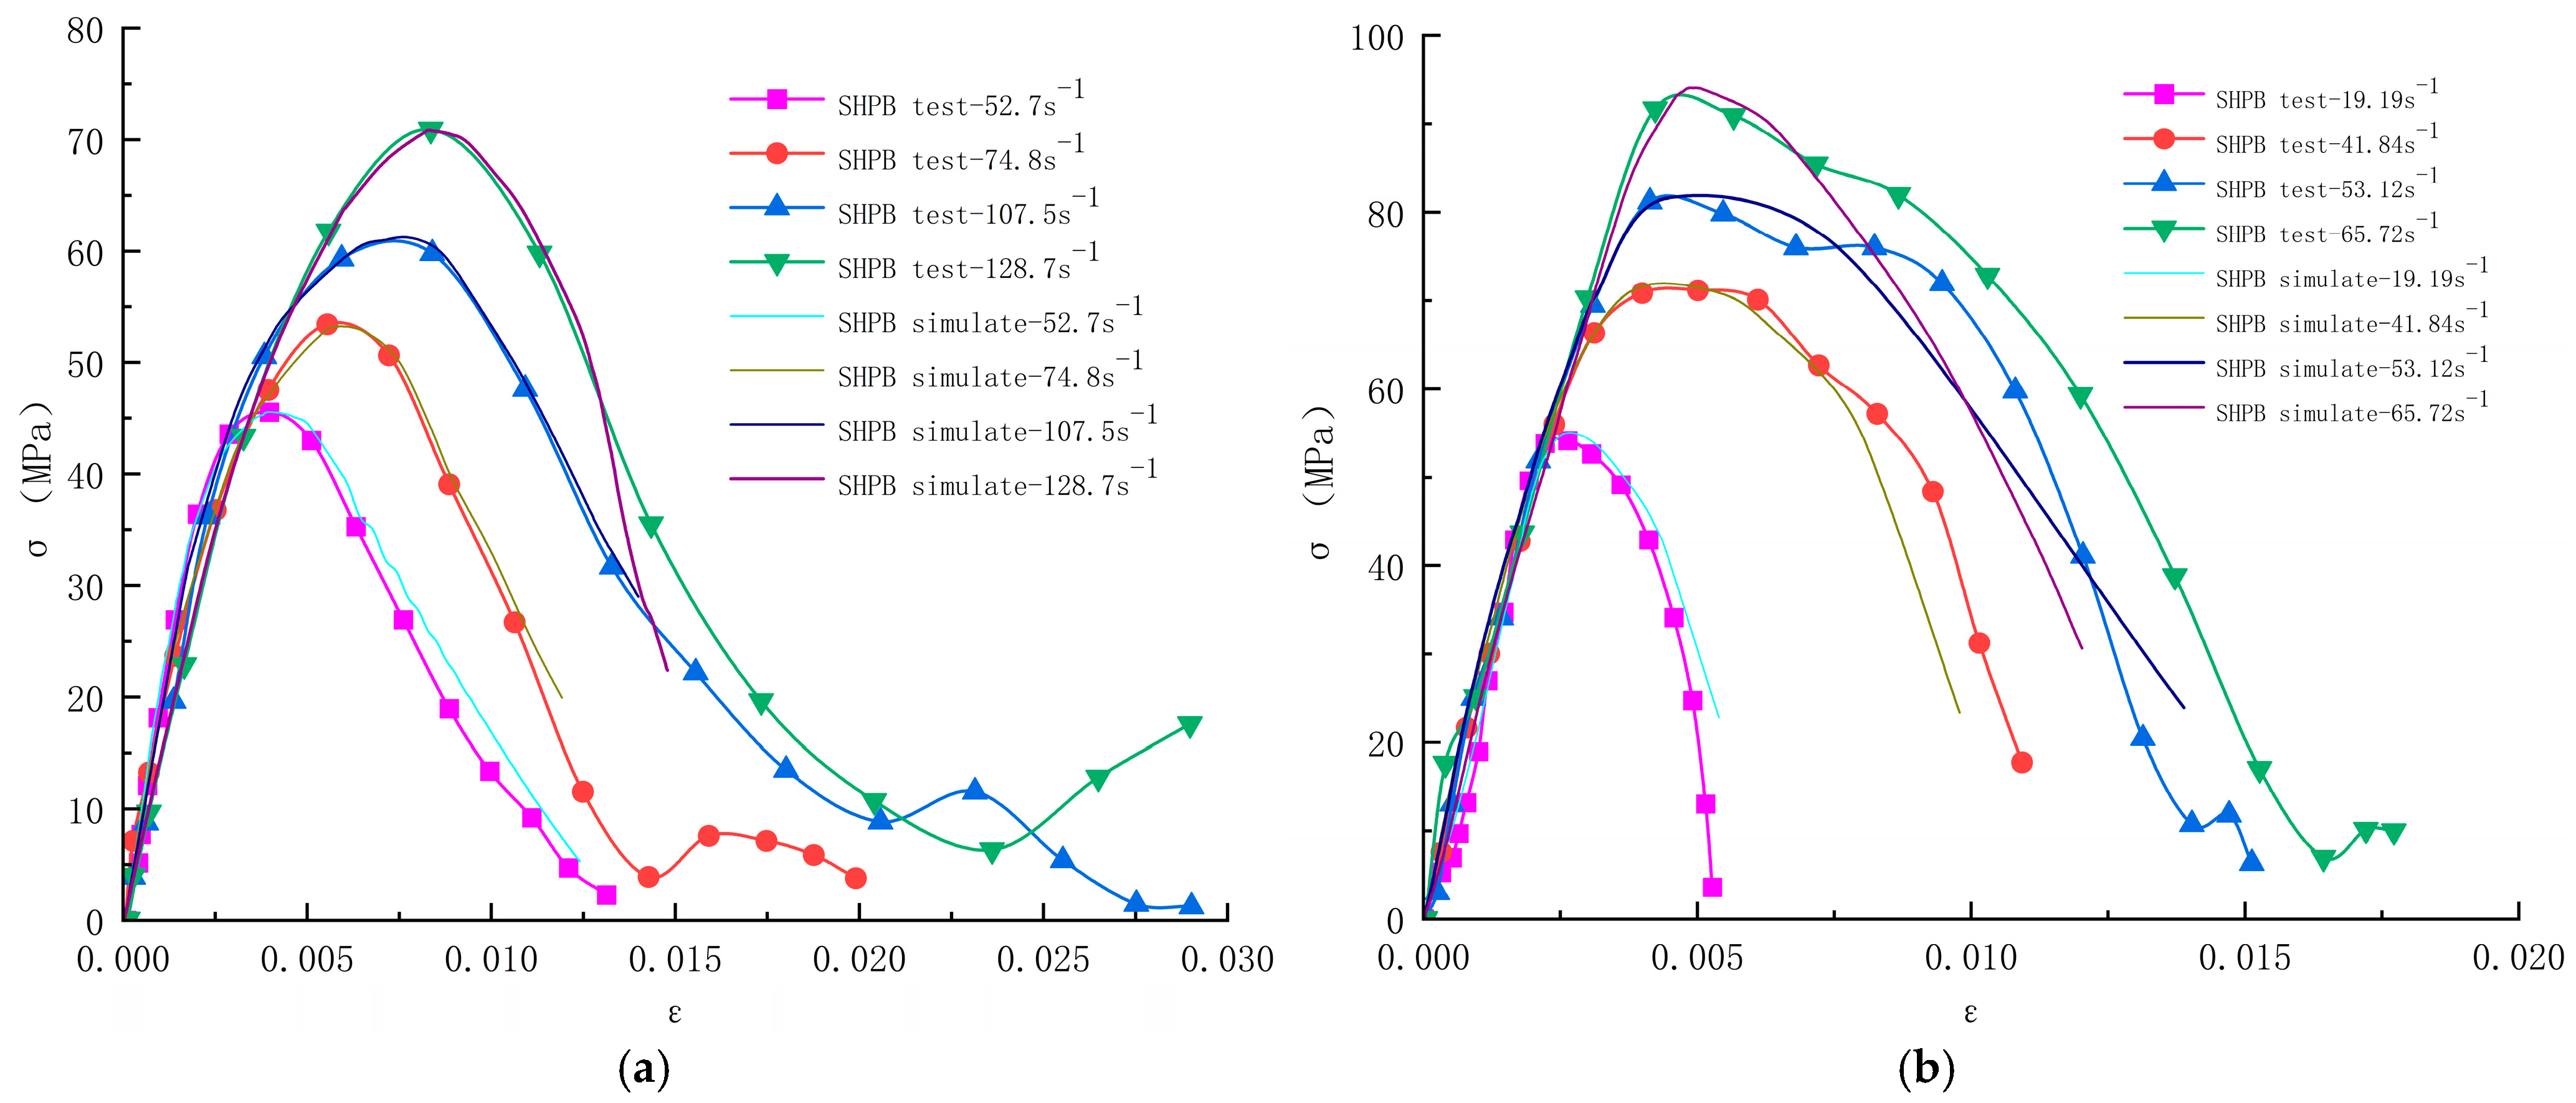
4.1. Model Validation
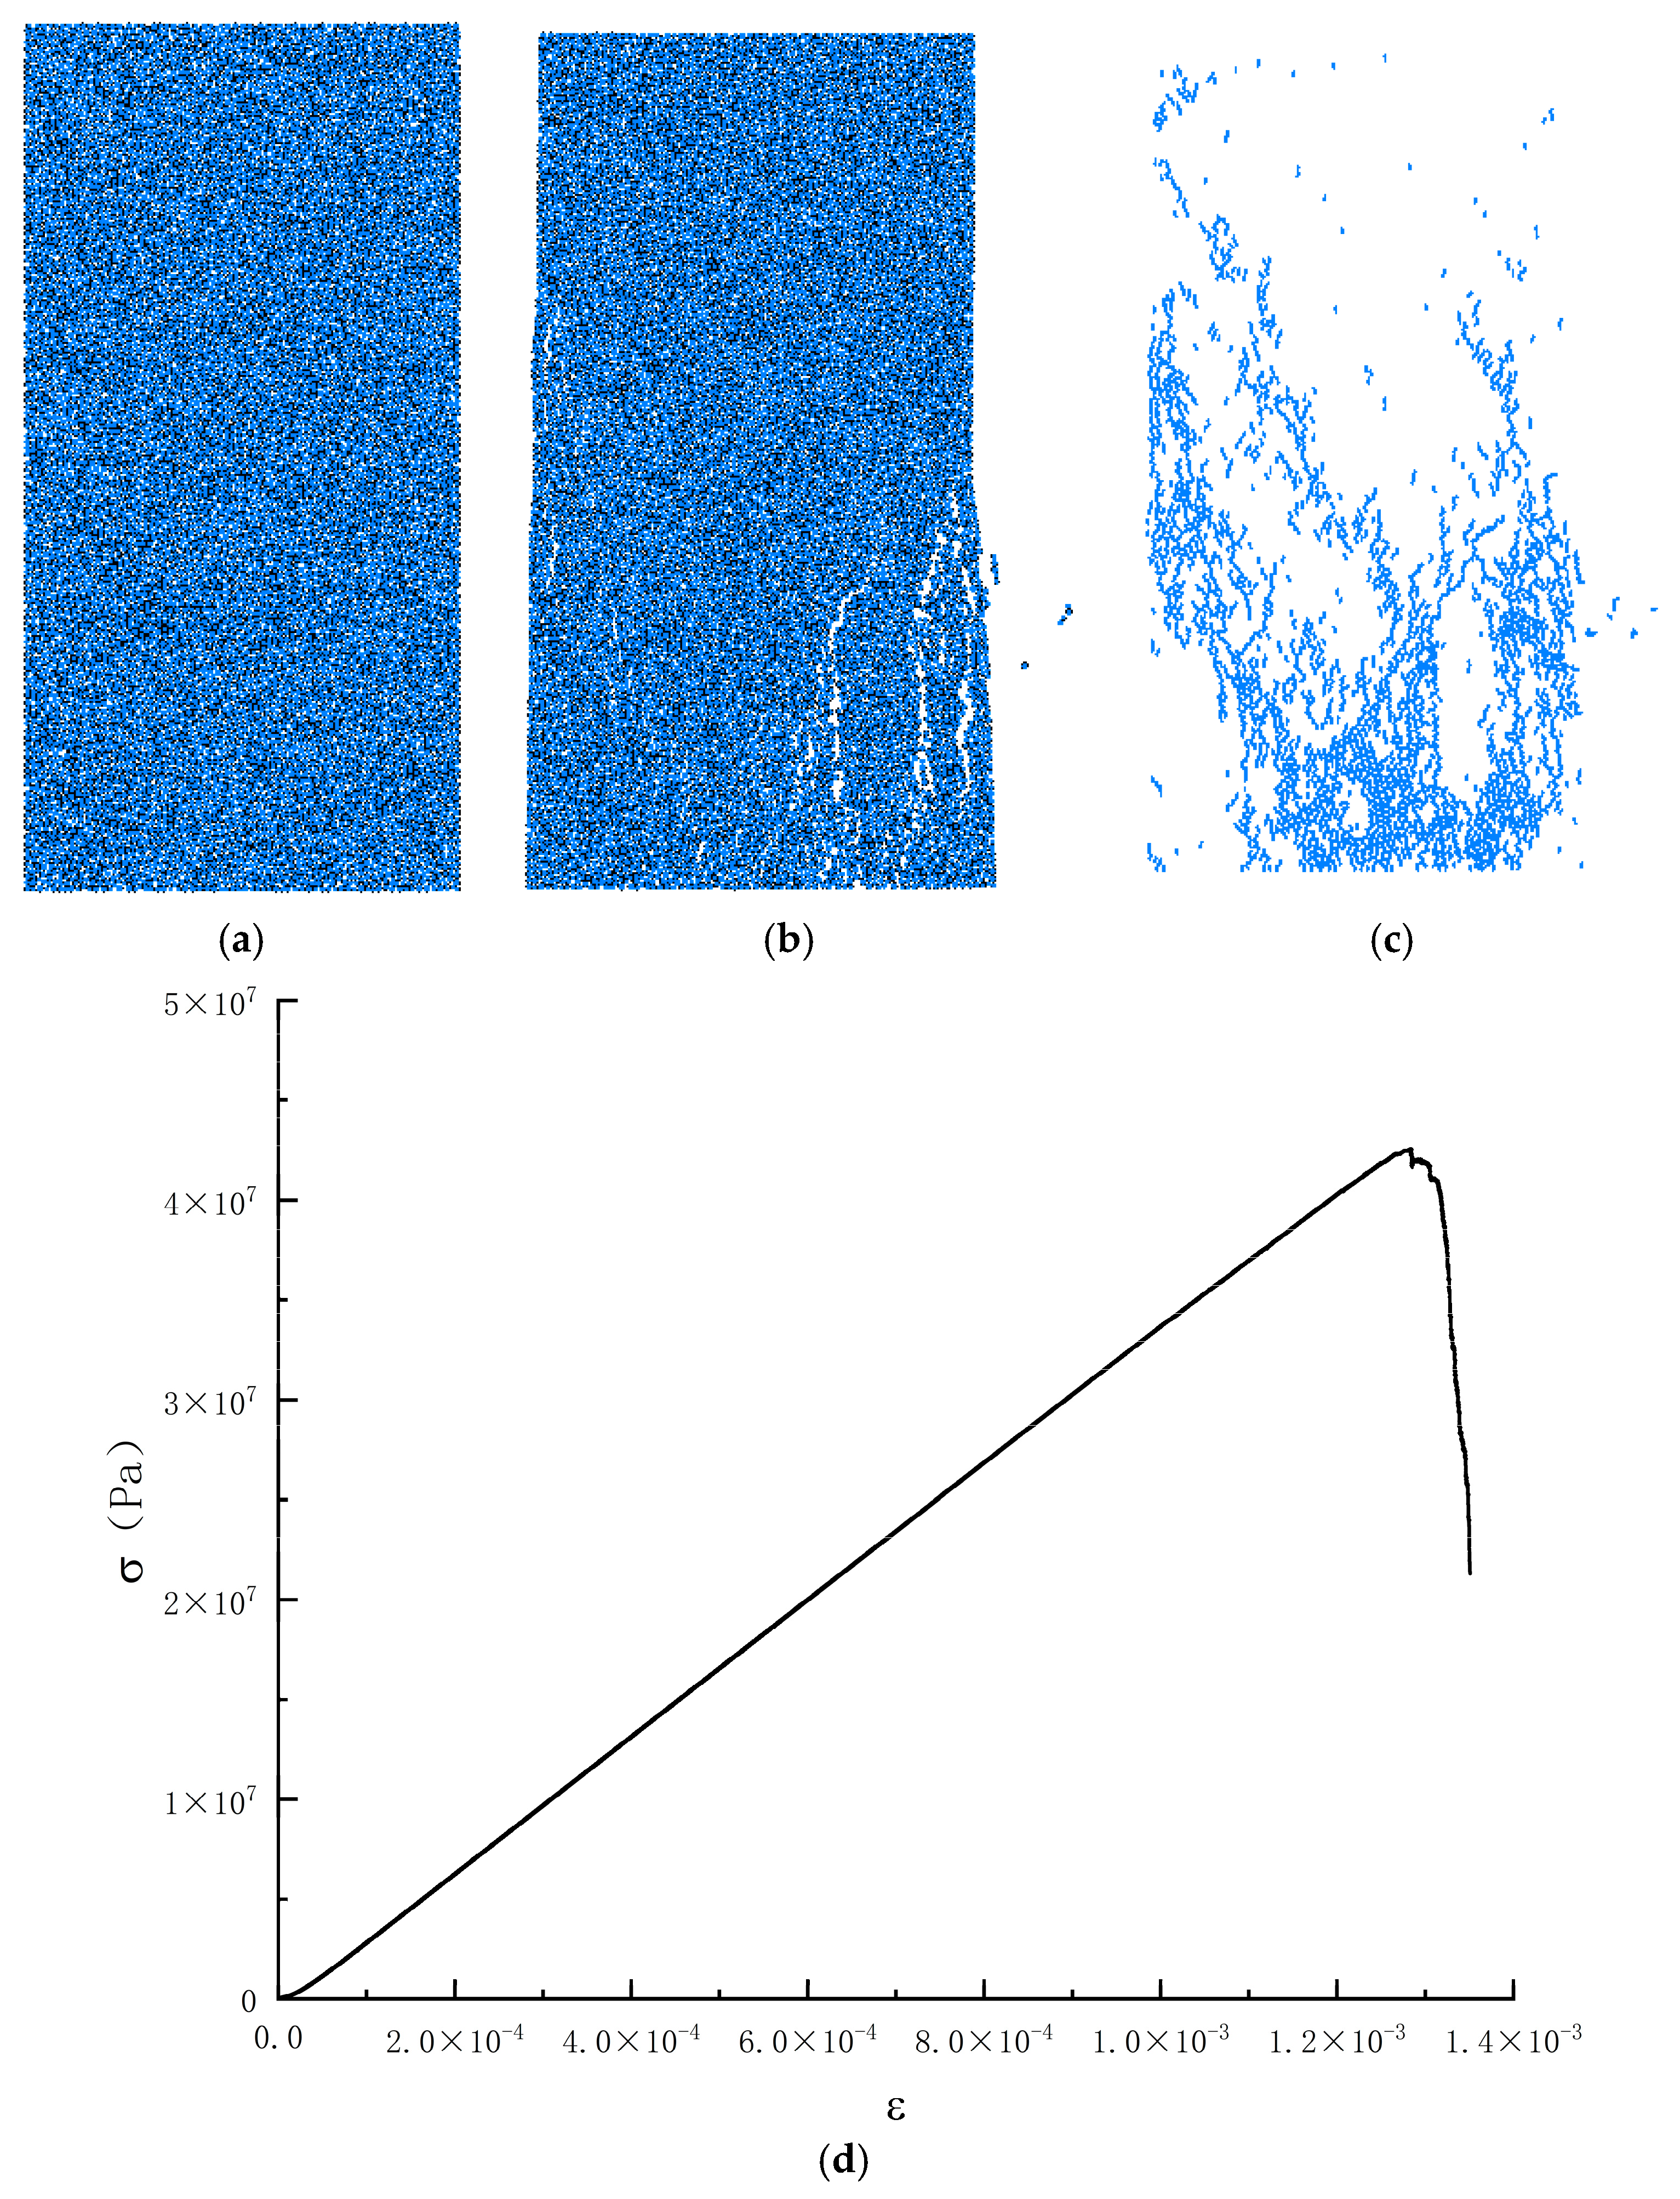
- (1)
- Elastic growth stage. In the initial stage, there is an approximately linear relationship between stress and strain; the stress increases rapidly with the increase of strain, and the slope under the strain rate is similar in all groups; the concrete is in the elastic deformation stage at this stage, the stress inside the specimen gradually begins to homogenize, and the deformation is mainly dependent on the deformation of the cement mortar and aggregate inside the concrete. With the gradual increase of strain rate, the slope of the initial section of the curve increases but is not obvious, indicating that the elastic modulus is unaffected by the strain rate at this stage.
- (2)
- Elastic-plastic deformation stage. With the increasing stress, close to the peak stress point, the stress and strain no longer have a linear relationship; the concrete began to enter the elastic-plastic deformation stage, and the internal pores and cracks began to be extruded, with the continuous expansion of micro-cracks, the concrete produces an irrecoverable deformation, the slope of the curve is a nonlinear decrease in the strain rate, the higher, the greater the peak stress and the peak strain of the concrete. When the peak stress is reached, the concrete is extruded into a dense state, at which time the stress of the concrete reaches the maximum value.
- (3)
- Plastic damage stage. When the peak stress is reached, the concrete reaches the ultimate yield strength, and new cracks are constantly generated within the concrete and rapidly extend and expand to form the damaged surface; these cracks do not have sufficient time to complete the process of re-squeezing, at this time, the stress drops rapidly, the strain continues to increase, the concrete appears to be brittle damage, and the stress-strain curve shows a rapid downward trend.
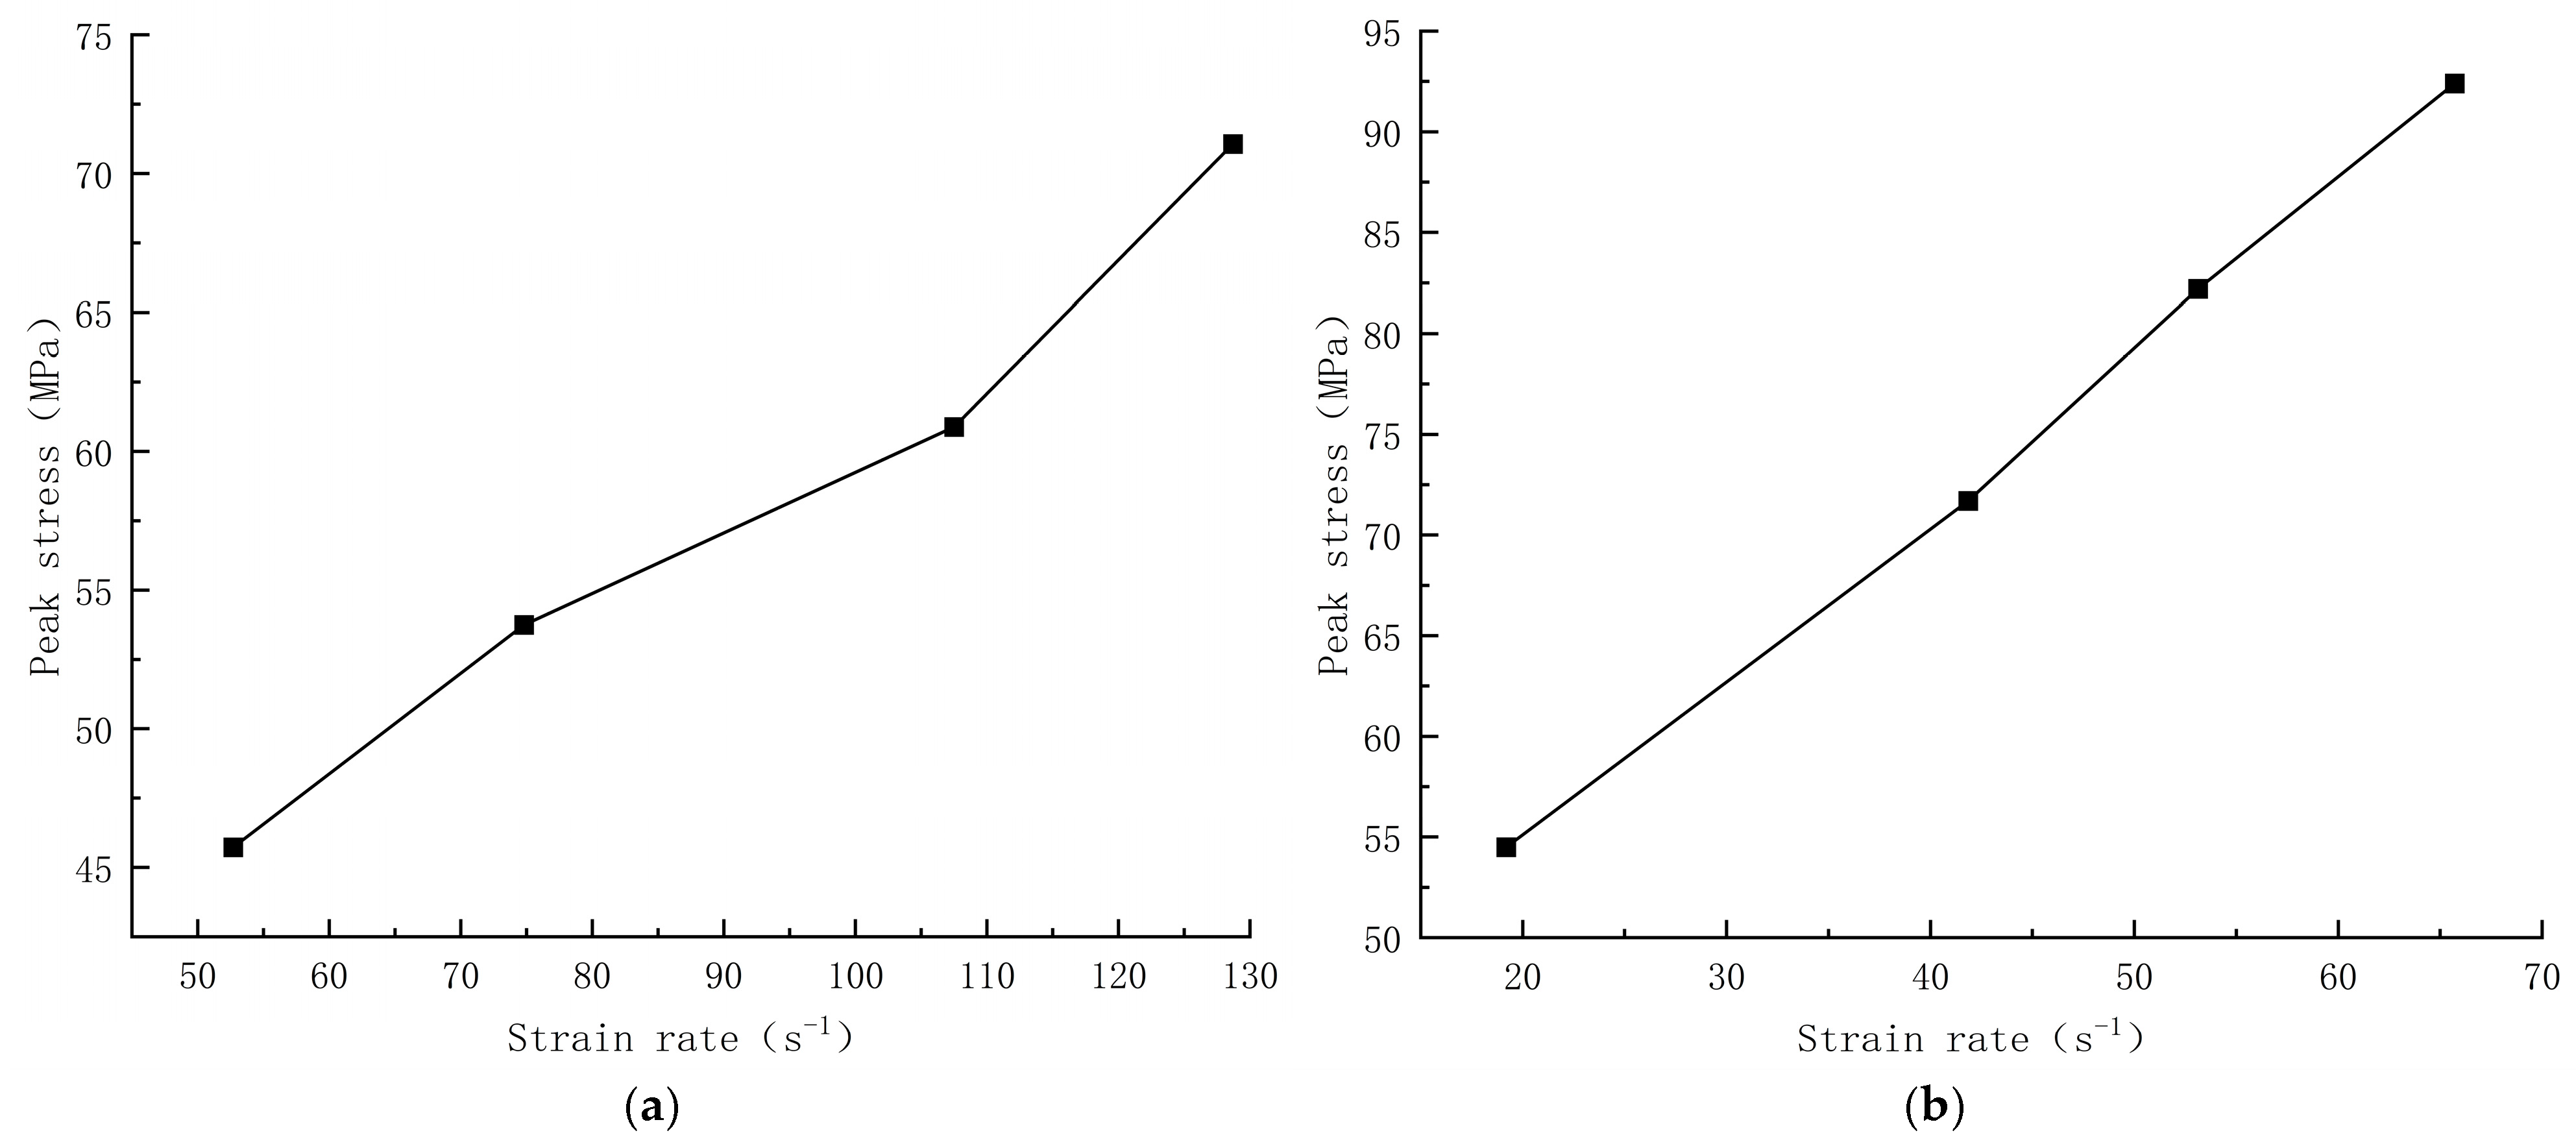
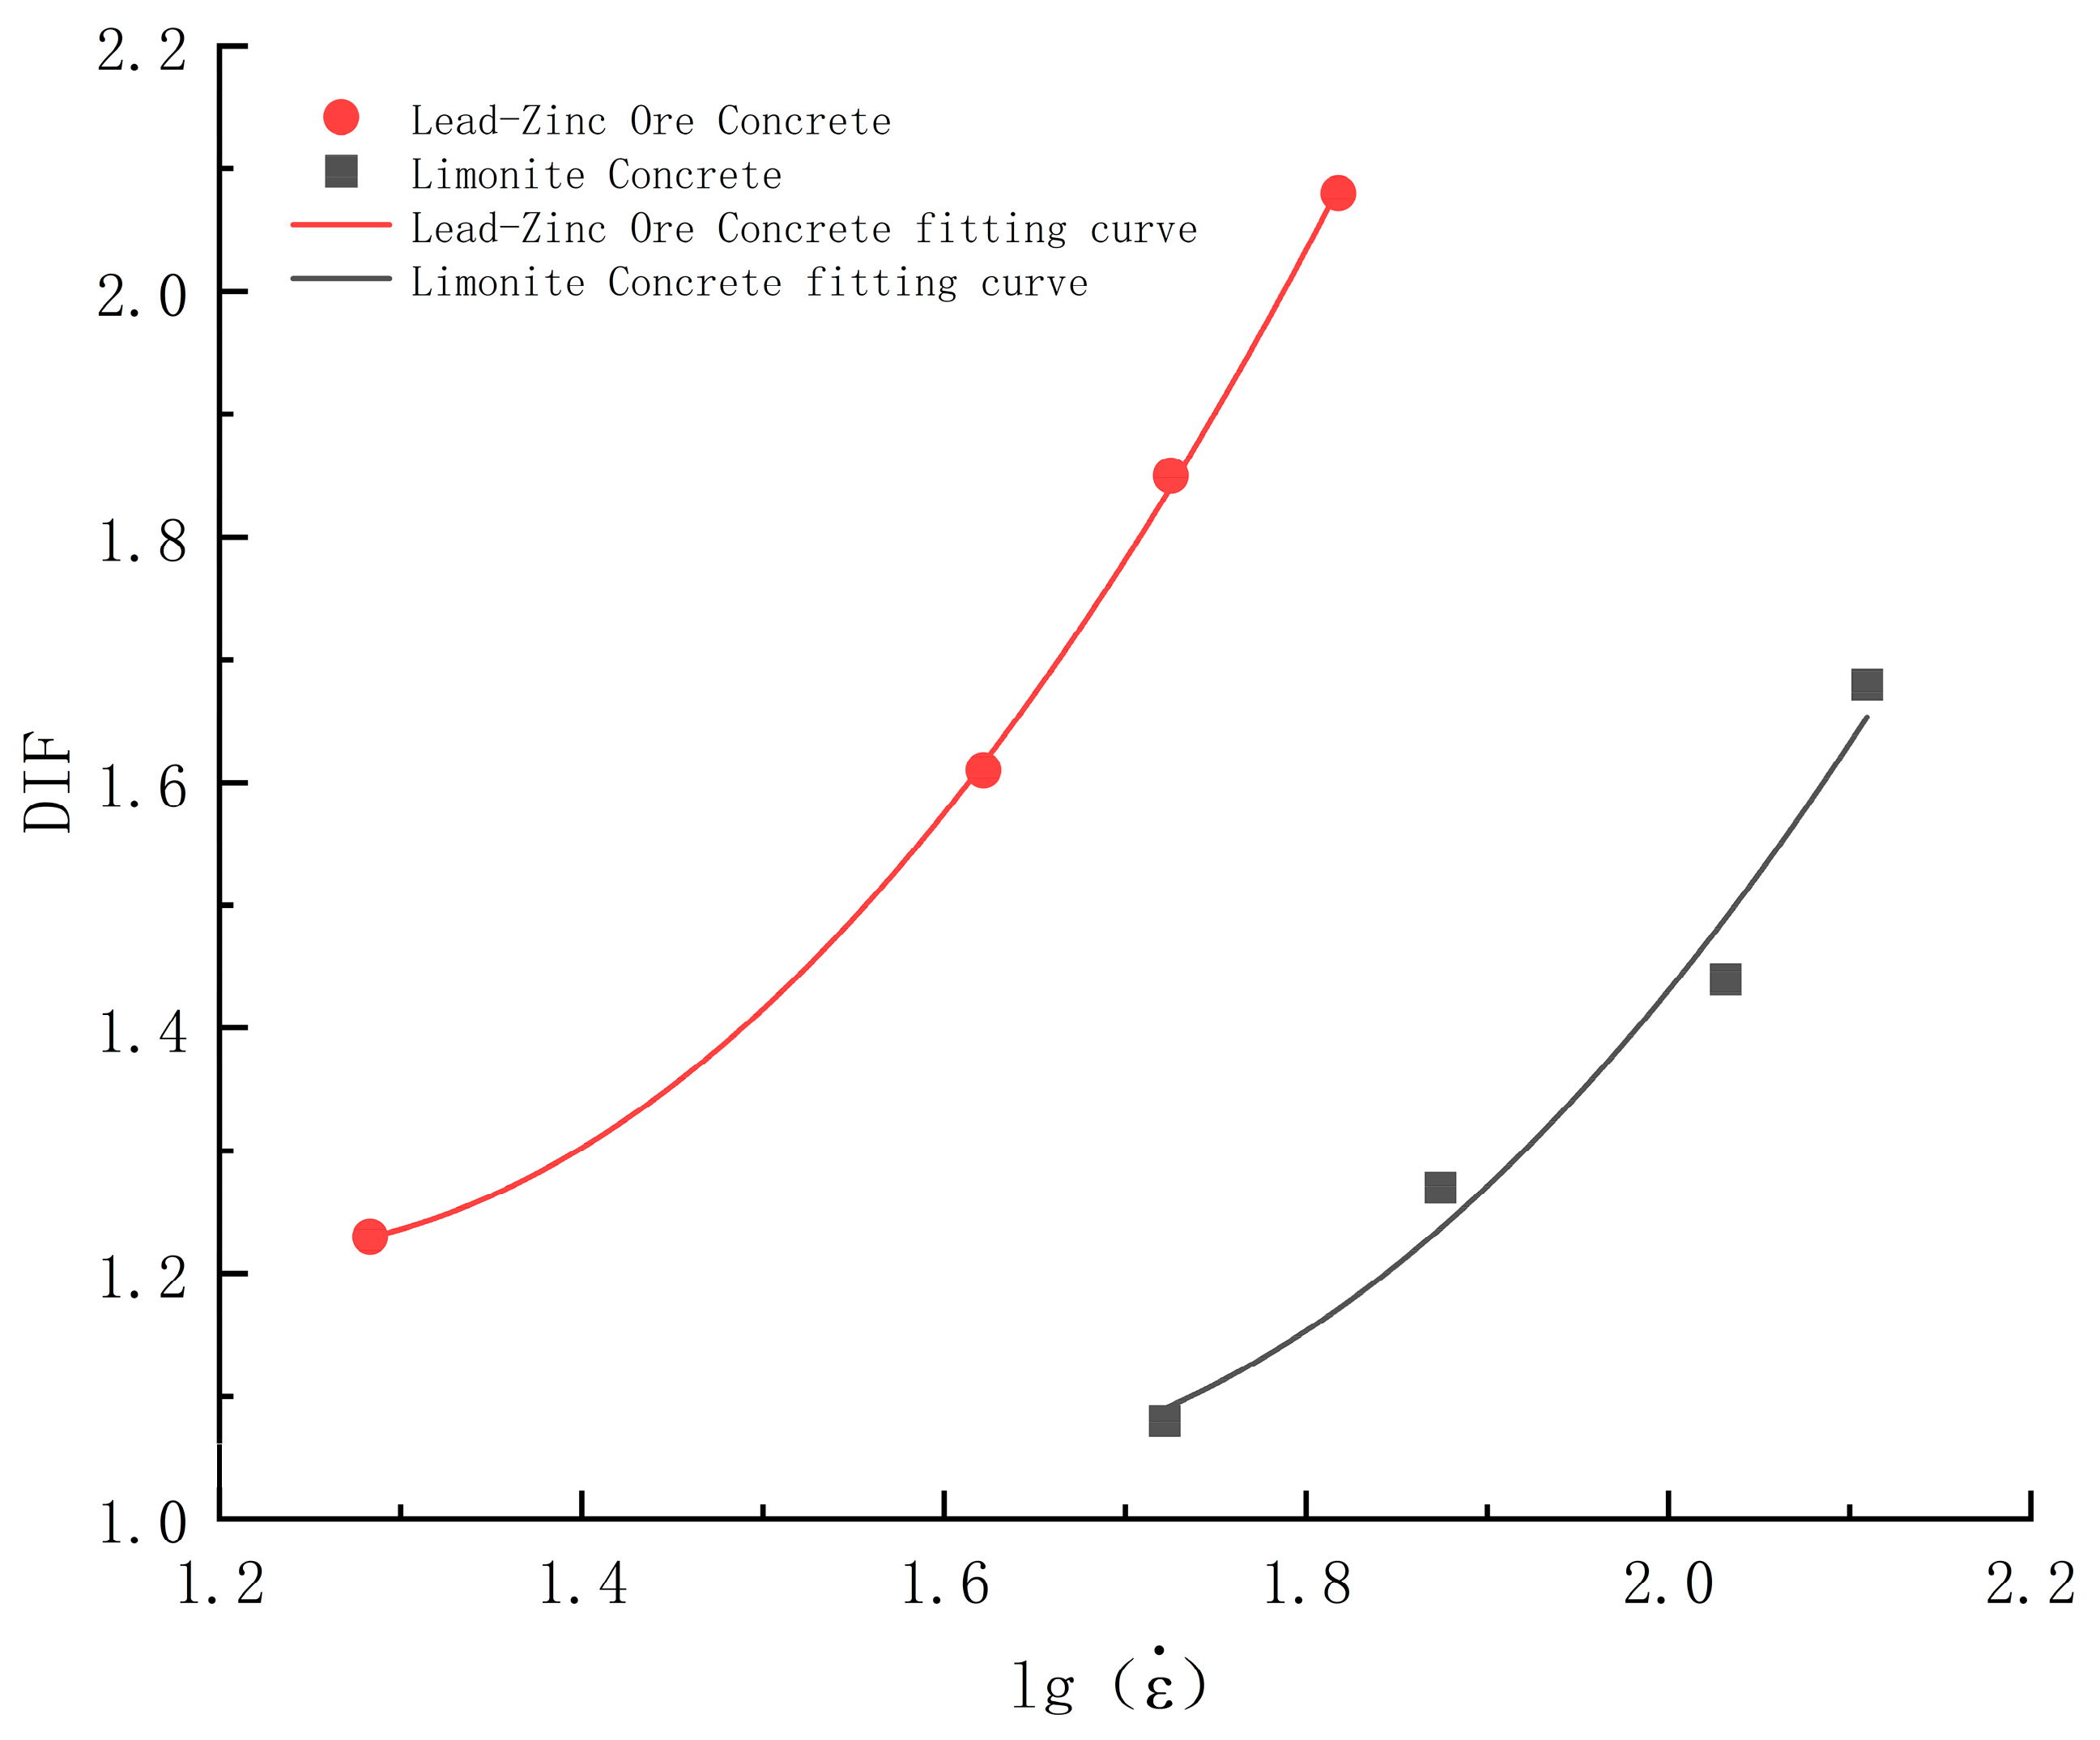
4.2. Strain Rate Effect
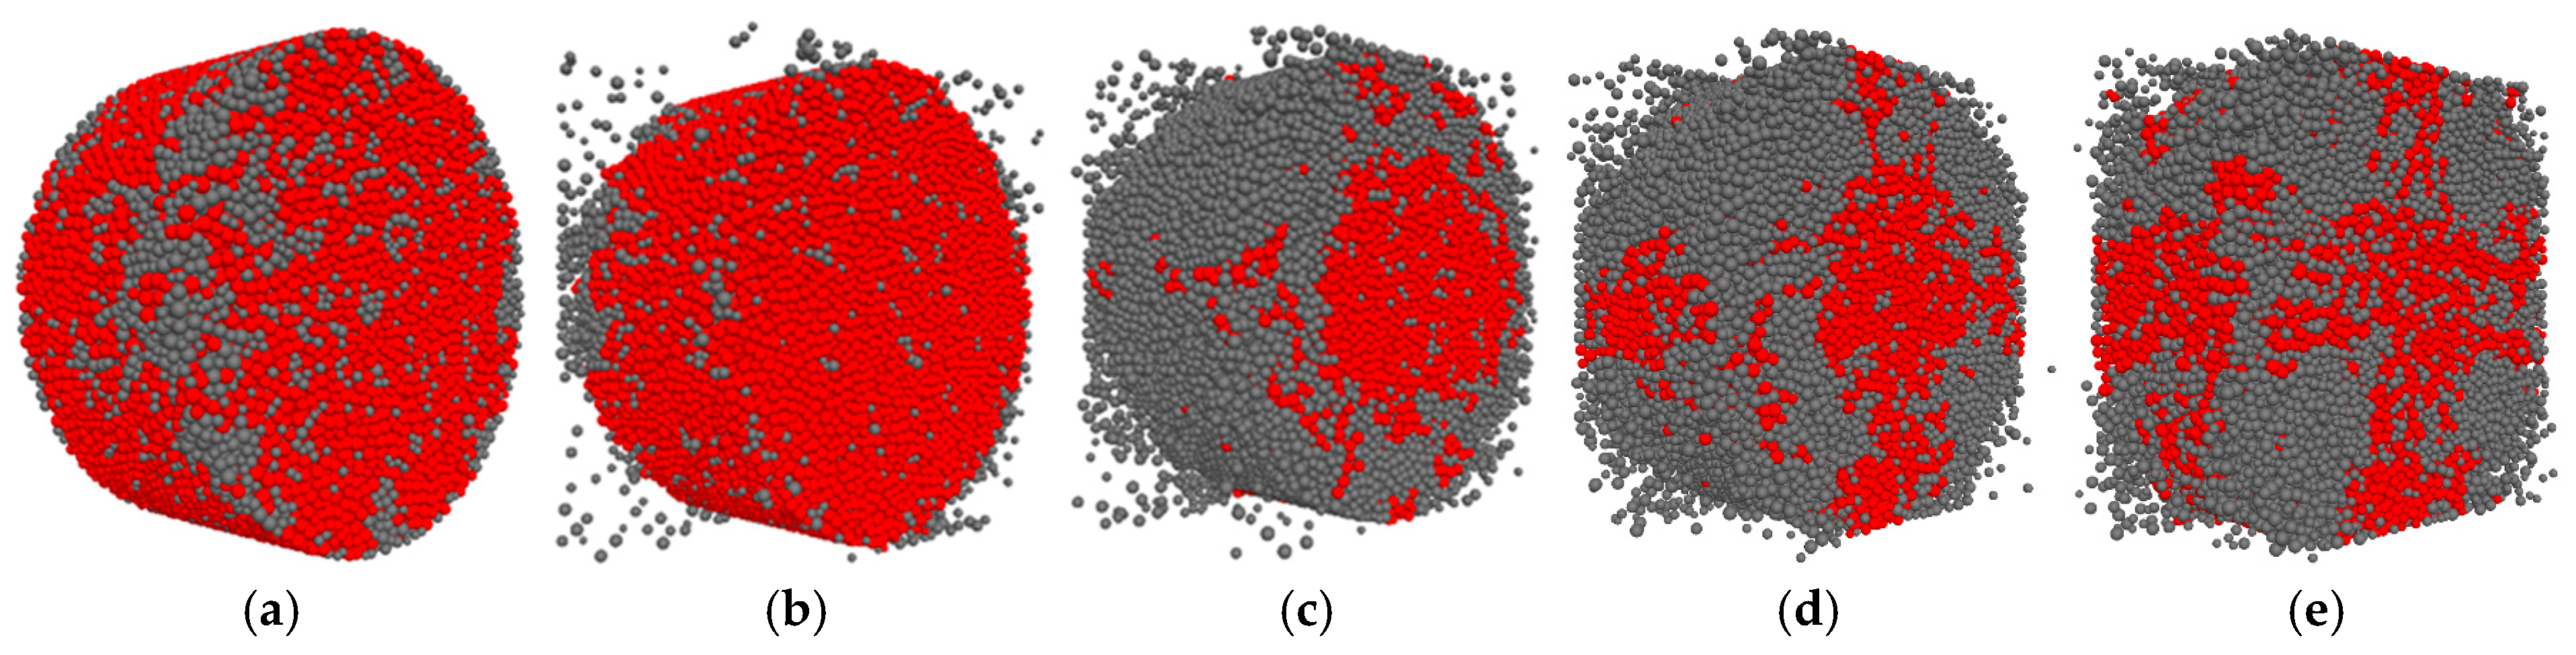
4.3. Damage Patterns
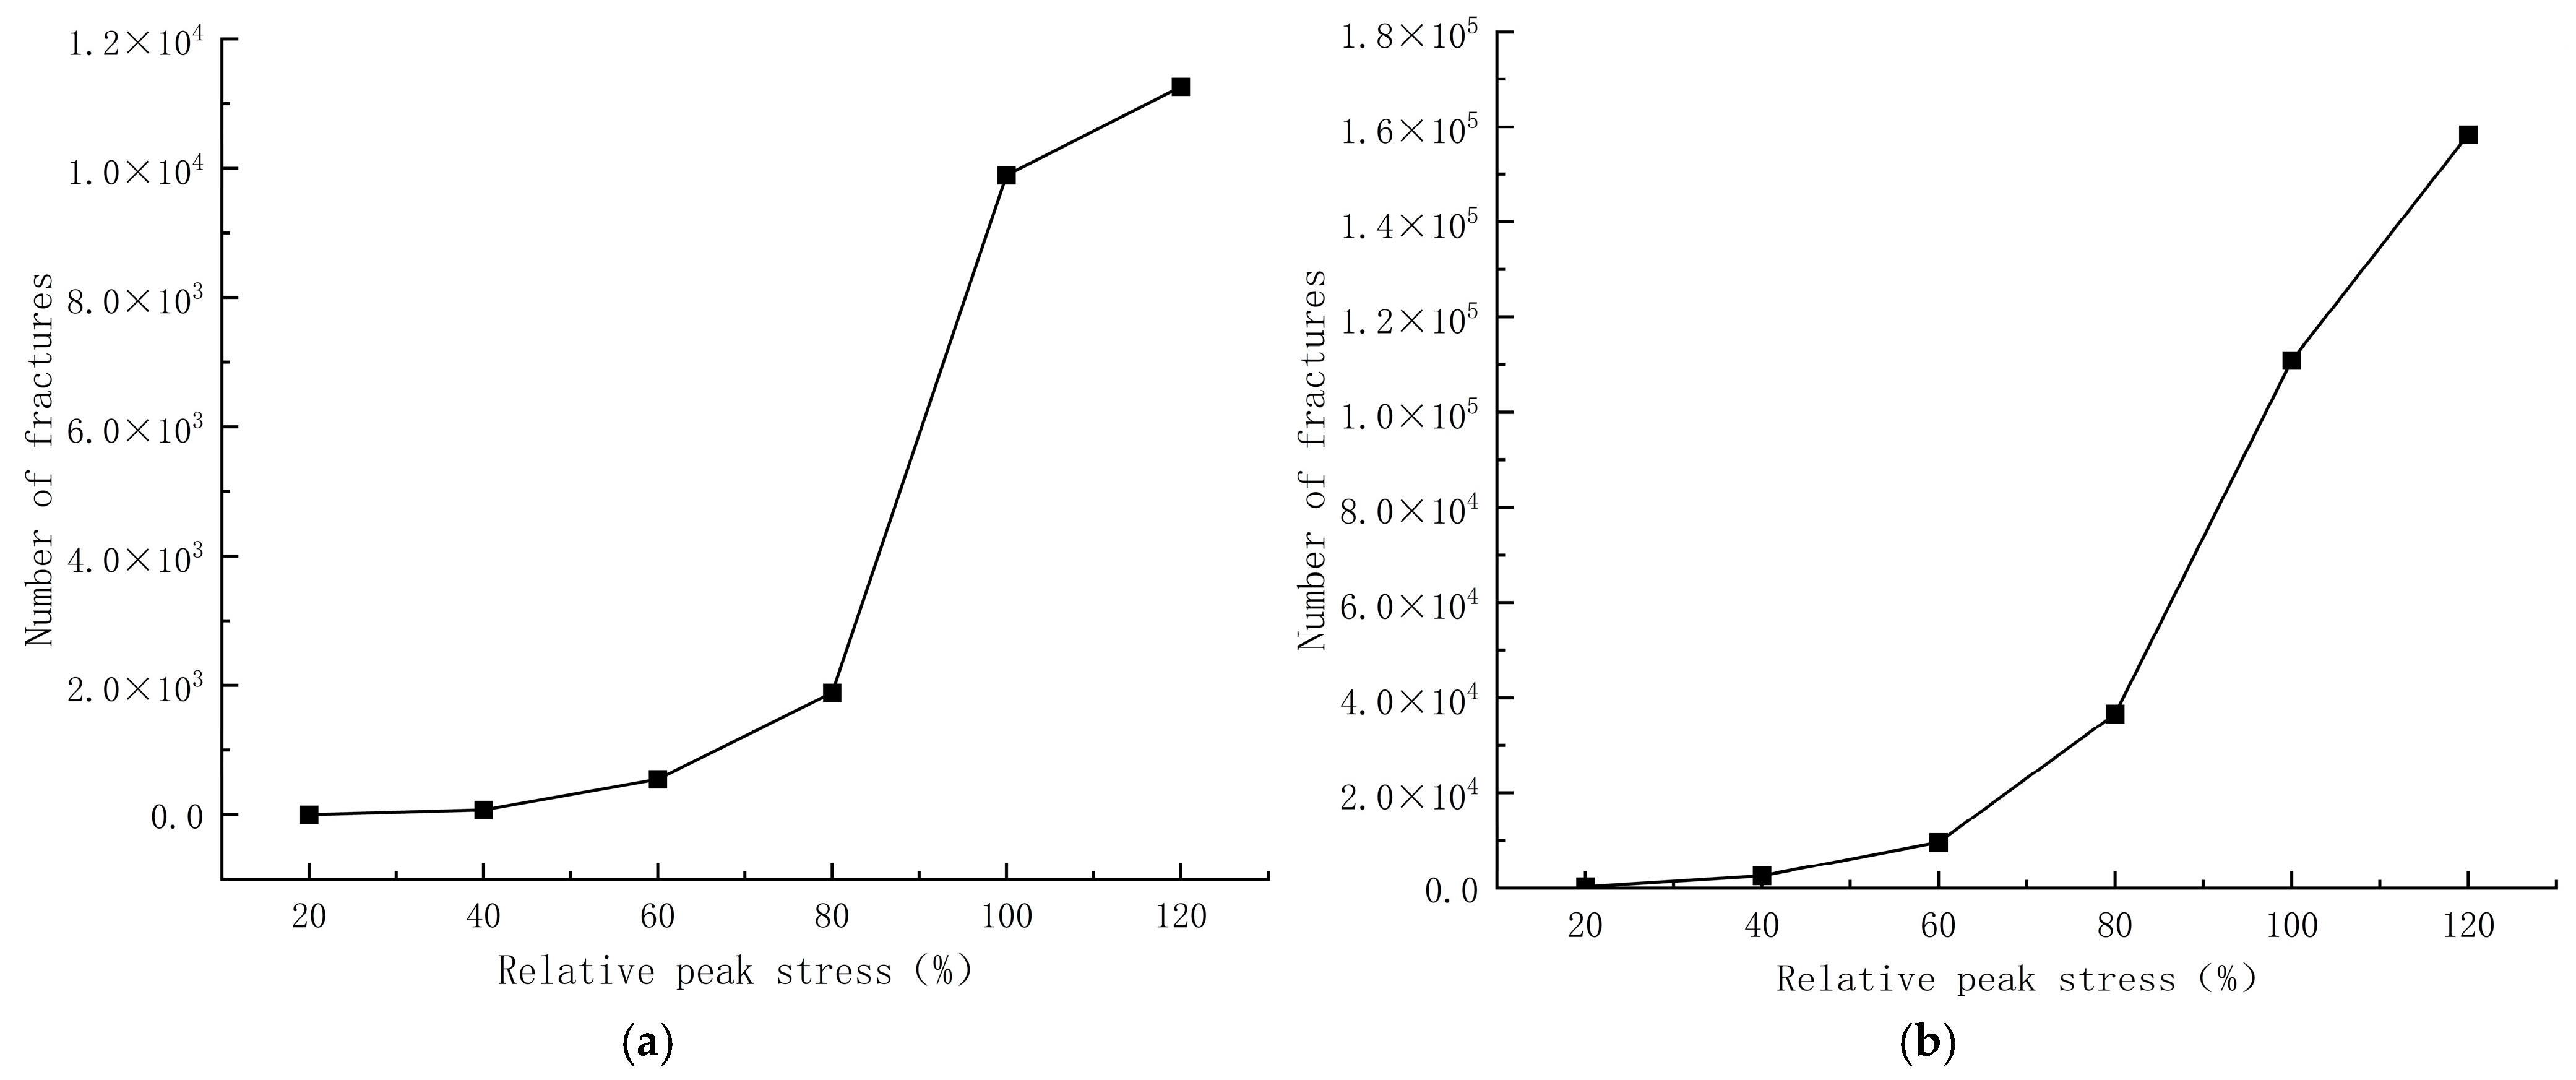
4.4. Crack Evolution Analysis
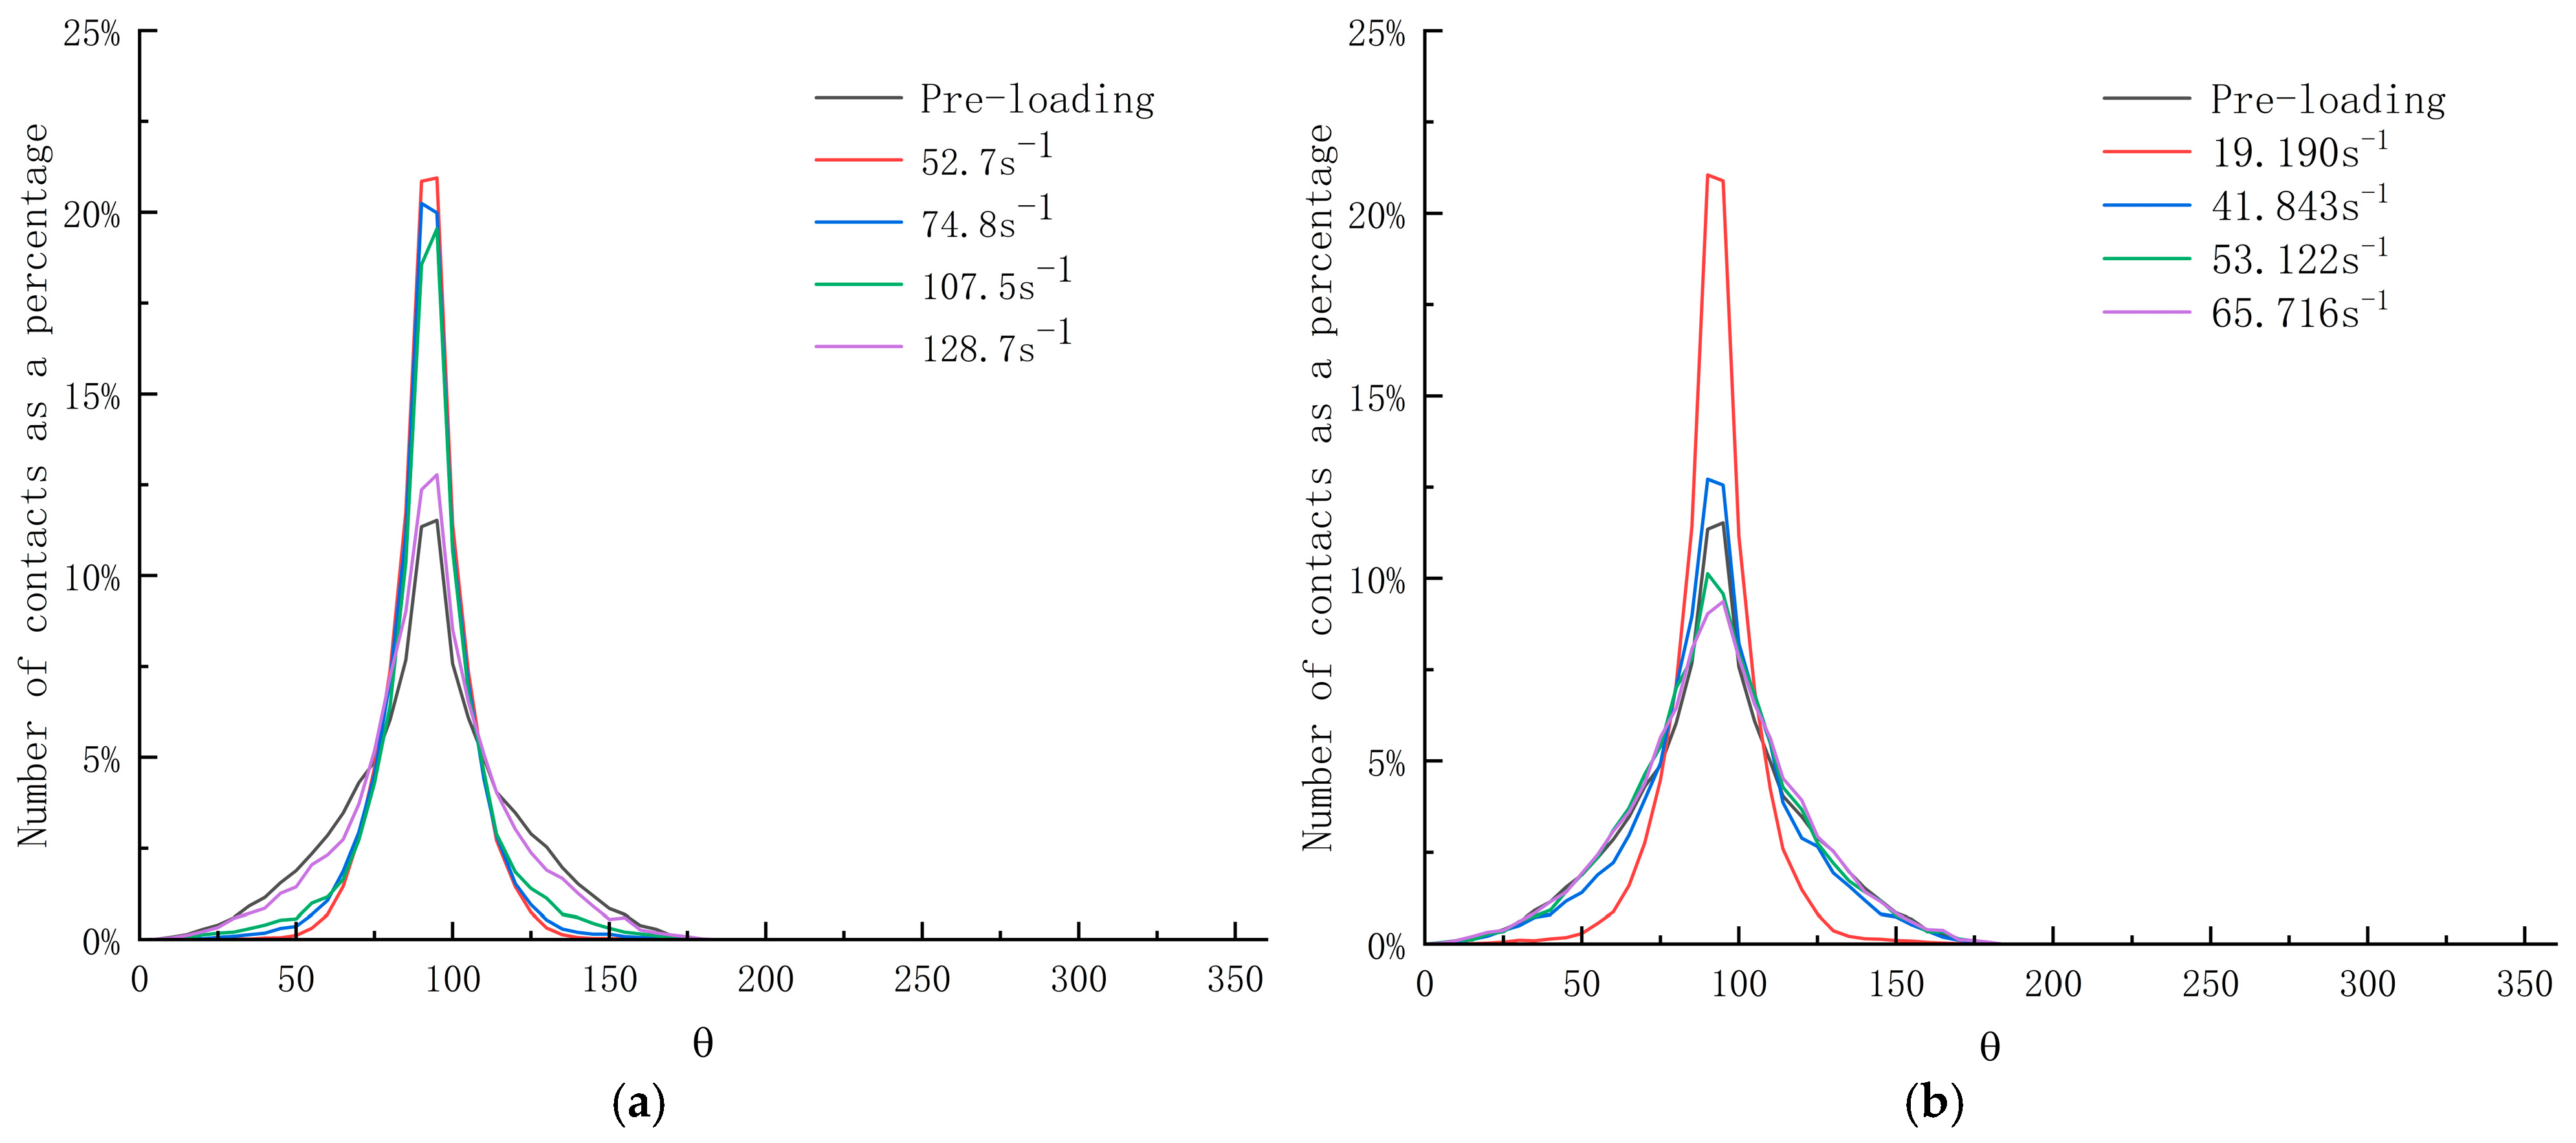
4.5. Analysis of Contact Anisotropy and High Stress Distribution in Specimens
5. Conclusions
- (1)
- Limonite concrete and lead-zinc ore concrete showed a significant strain rate strengthening effect, with peak stress and peak strain increasing with increasing strain rate. The stress-strain curves of the two types of concrete show a similar trend, and the relationship between DIF and strain rate is consistent with the overall existing research pattern. The DIF and dynamic compressive strength growth of lead-zinc ore concrete was greater than that of limonite concrete, and the strain rate sensitivity of lead-zinc ore concrete was stronger than that of limonite concrete.
- (2)
- By constructing a three-dimensional numerical model, the stress-strain curve, damage pattern, and high stress distribution of concrete under dynamic loading can be in good agreement with the test results. The model reproduces the whole damage process of concrete specimens from a microscopic point of view, thus verifying the feasibility and validity of the simulation.
- (3)
- Based on the built-in Python language module of the PFC, a program was written to carry out the parameter calibration process using unconfined uniaxial compression as the unit test. The relative errors of the compressive strength and modulus of elasticity obtained from the calibration with the test values are within 1%, which proves the effectiveness of the automatic calibration procedure for the microscopic parameters. The program greatly simplifies the calibration process of microscopic parameters and improves the computational efficiency.
- (4)
- The degree of destruction of the specimens during the impact of the two types of concrete increased with the increase in strain rate. As the strain rate increases, the damage pattern of concrete evolves from destruction into large pieces to destruction into small pieces and then to destruction into powder. Concrete cracks first appeared at the junction of the specimen and the compression bar, and with the compaction of the specimen, cracks were generated inside the specimen, and eventually, the internal and external cracks extended and intersected with each other until destruction.
Author Contributions
Funding
Institutional Review Board Statement
Informed Consent Statement
Data Availability Statement
Conflicts of Interest
References
- Khosravani, M.R.; Weinberg, K. A Review on Split Hopkinson Bar Experiments on the Dynamic Characterisation of Concrete. Constr. Build. Mater. 2018, 190, 1264–1283. [Google Scholar] [CrossRef]
- Wang, J.; Ding, J.; Wang, X.; Du, Z.; Gao, G. Effect of Coarse Aggregate Size on the Dynamic Compression Behavior of Concrete. Explos. Shock. Waves 2022, 42, 023101. [Google Scholar] [CrossRef]
- Xie, Y.J.; Fu, Q.; Zheng, K.R.; Yuan, Q.; Song, H. Dynamic Mechanical Properties of Cement and Asphalt Mortar Based on SHPB Test. Constr. Build. Mater. 2014, 70, 217–225. [Google Scholar] [CrossRef]
- Chen, Z.; Deng, D.; Cai, S. Experimental Study on Dynamic Compressive Mechanical Properties of Lead-Zine Tailing Concrete under Different Strain Rates. Build. Struct. 2023, 53, 119–125. [Google Scholar] [CrossRef]
- Ma, L.; Li, Z.; Liu, J.; Duan, L.; Wu, J. Mechanical Properties of Coral Concrete Subjected to Uniaxial Dynamic Compression. Constr. Build. Mater. 2019, 199, 244–255. [Google Scholar] [CrossRef]
- Zhang, J.; Shu, Y.; Fang, A.; Qin, R.; Wu, Y.; Zhang, J. Effect of Dry-Wet Cycle on Dynamic Mechanical Characteristics of EPS Cement Soil under Different Chloride Salt Environments. Case Stud. Constr. Mater. 2023, 18, e02151. [Google Scholar] [CrossRef]
- Du, Y.; Lu, S.; XU, J.; Xia, W.; Wang, Z. Study on Dynamic Constitutive Relation and Fiber Pullout Simulation of Modified Carbon Fiber Reinforcement Concrete. Case Stud. Constr. Mater. 2023, 18, e01994. [Google Scholar] [CrossRef]
- Zhao, Z.; Xue, J.; Jin, J.; Tan, L.; Xia, W.; Cai, R. Experimental Research on the Dynamic Constringent Characteristics and Fractal Properties of Sandstone under Impact Loading. Case Stud. Constr. Mater. 2023, 18, e02174. [Google Scholar] [CrossRef]
- Rong, Z.; Sun, W.; Zhang, Y. Dynamic Compression Behavior of Ultra-High Performance Cement Based Composites. Int. J. Impact Eng. 2010, 37, 515–520. [Google Scholar] [CrossRef]
- Wu, Z.; Shi, C.; He, W.; Wang, D. Static and Dynamic Compressive Properties of Ultra-High Performance Concrete (UHPC) with Hybrid Steel Fiber Reinforcements. Cem. Concr. Compos. 2017, 79, 148–157. [Google Scholar] [CrossRef]
- Feng, S.; Zhou, Y.; Wang, Y.; Lei, M. Experimental Research on the Dynamic Mechanical Properties and Damage Characteristics of Lightweight Foamed Concrete under Impact Loading. Int. J. Impact Eng. 2020, 140, 103558. [Google Scholar] [CrossRef]
- Wu, M.; Qin, C.; Zhang, C. High Strain Rate Splitting Tensile Tests of Concrete and Numerical Simulation by Mesoscale Particle Elements. J. Mater. Civ. Eng. 2014, 26, 71–82. [Google Scholar] [CrossRef]
- Feng, W.; Liu, F.; Yang, F.; Jing, L.; Li, L.; Li, H.; Chen, L. Compressive Behaviour and Fragment Size Distribution Model for Failure Mode Prediction of Rubber Concrete under Impact Loads. Constr. Build. Mater. 2021, 273, 121767. [Google Scholar] [CrossRef]
- Xu, X.; Jin, Z.; Yu, Y.; Li, N. Impact Properties of Ultra High Performance Concrete (UHPC) Cured by Steam Curing and Standard Curing. Case Stud. Constr. Mater. 2022, 17, e01321. [Google Scholar] [CrossRef]
- Wang, Z.; Bai, E.; Zhang, T.; Lv, Y. Early-Age Mechanical Properties and Constitutive Model of Polystyrene Concrete under Impact Load. Mater. Today Commun. 2023, 35, 106039. [Google Scholar] [CrossRef]
- Al-Salloum, Y.; Almusallam, T.; Ibrahim, S.M.; Abbas, H.; Alsayed, S. Rate Dependent Behavior and Modeling of Concrete Based on SHPB Experiments. Cem. Concr. Compos. 2015, 55, 34–44. [Google Scholar] [CrossRef]
- Zhao, Y.; Zhang, S.; Yan, X.; Zhang, T.; Peng, S.; Wu, B.; Yu, Z.; Du, X. Experimental Study on Dynamic Compressive Mechanical Properties of Mortar-Concrete Joint Interface. Bull. Chin. Ceram. Soc. 2023, 42, 1987–1995. [Google Scholar] [CrossRef]
- Yang, Y.; Wu, C.; Liu, Z.; Li, J.; Yang, T.; Jiang, X. Characteristics of 3D-Printing Ultra-High Performance Fibre-Reinforced Concrete under Impact Loading. Int. J. Impact Eng. 2022, 164, 104205. [Google Scholar] [CrossRef]
- Xia, W.; Lu, S.; Bai, E.; Zhao, D.; Xu, J.; Du, Y. Research on Dynamic Compression Behavior of Carbon Nanotubes Reinforced Concrete Based on SHPB Test. Explos. Shock. Waves 2024, 129, 104471. [Google Scholar] [CrossRef]
- Jiang, Z.; Li, Z.; Zhang, C. Meso-Study on the Axial Compression Performance of New and Old Concrete Reinforced Members Based on Particle Flow. Chin. J. Appl. Mech. 2022, 39, 342–349. [Google Scholar] [CrossRef]
- Ni, K. Study on the Preparation and Performance of Lead-Zinc Mine Radiation-Proof Concrete. Master’s Thesis, University of South China, Hengyang, China, 2021. [Google Scholar] [CrossRef]
- Wang, Z. Experimental Study on Static and Dynamic Mechanical Properties of Limonite Concrete and Mesoscopic Numerical Simulation. Master’s Thesis, University of South China, Hengyang, China, 2021. [Google Scholar] [CrossRef]
- Mahabadi, O.K.; Cottrell, B.E.; Grasselli, G. An Example of Realistic Modelling of Rock Dynamics Problems: FEM/DEM Simulation of Dynamic Brazilian Test on Barre Granite. Rock. Mech. Rock. Eng. 2010, 43, 707–716. [Google Scholar] [CrossRef]
- Khosravani, M.R.; Silani, M.; Weinberg, K. Fracture Studies of Ultra-High Performance Concrete Using Dynamic Brazilian Tests. Theor. Appl. Fract. Mech. 2018, 93, 302–310. [Google Scholar] [CrossRef]
- Chen, C.; Geng, P.; Yang, Q.; Zhao, Y.; Gu, W.; He, C.; Zhang, J. Dynamic Constitutive Modeling of Steel Fiber Reinforced Concrete Considering Damage Evolution under High Strain Rate. Constr. Build. Mater. 2024, 440, 137433. [Google Scholar] [CrossRef]
- Flores-Johnson, E.A.; Li, Q.M. Structural Effects on Compressive Strength Enhancement of Concrete-like Materials in a Split Hopkinson Pressure Bar Test. Int. J. Impact Eng. 2017, 109, 408–418. [Google Scholar] [CrossRef]
- Zhu, C.; Huo, J.; Wu, D. Experimental and Numerical Studies of the Effects of Micro/Nano Carbon Fibers in the Dynamic Behavior of Cement-Based Grouting Materials for Reinforcement of Sand Layers. Constr. Build. Mater. 2024, 432, 136655. [Google Scholar] [CrossRef]
- Wu, D.; Su, H.; Yu, L.; Zhang, F.; Qin, H.; Wei, C.; Geng, S. Experimental and Numerical Investigation of Dynamic Tensile Behavior of Granite-Concrete Bimaterials with Different Rough Interfaces. J. Build. Eng. 2024, 84, 108565. [Google Scholar] [CrossRef]
- Zhu, C.; Wu, D. Macro- and Micromechanical Characteristics and Energy Evolution Law of Micro/Nano Carbon Fibre Grouting Samples. J. Build. Eng. 2024, 82, 108390. [Google Scholar] [CrossRef]
- Sun, B.; Chen, R.; Ping, Y.; Zhu, Z.; Wu, N.; He, Y. Dynamic Response of Rock-like Materials Based on Shpb Pulse Waveform Characteristics. Materials 2022, 15, 210. [Google Scholar] [CrossRef]
- Liu, P.; Hu, D.; Wu, Q.; Liu, X. Sensitivity and Uncertainty Analysis of Interfacial Effect in SHPB Tests for Concrete-like Materials. Constr. Build. Mater. 2018, 163, 414–427. [Google Scholar] [CrossRef]
- Chen, Z.; Luo, Q.; Jin, D.; Wang, Z. Numerical Study of Fractal Analysis of Crack Propagation in Concrete under Different Strain Rates by Meso-scale Particle Element Modeling. Int. J. Impact. Eng. 2023, 173, 104440. [Google Scholar] [CrossRef]
- Wang, Z.; Yue, G.; Lin, H.; Li, M. Analysis of Damage and Failure Characteristics of Coal under Uniaxial Impact Loading. Saf. Coal Mines 2024, 55, 10–18. [Google Scholar] [CrossRef]
- Li, Y.; Yang, Z.; Wu, W. Simulation of SHPB Impact Tests on Lunar Water Ice Simulants Using FDM-DEM Cou-pling Method. Chin. J. Comput. Mech. 2024, 1–8. Available online: http://kns.cnki.net/kcms/detail/21.1373.O3.20240227.1823.032.html (accessed on 11 November 2024).
- Yang, J.; Song, Y.; Ma, H.; Zheng, J.; Yang, J.; Bao, W. Dynamic Rock Impact Characteristics Based on FDM-DEM Coupling Method. Sci. Technol. Eng. 2023, 4309–4314. Available online: https://kns.cnki.net/kcms2/article/abstract?v=th5-mUcNE0Oqe0jNg7ri4651TAqkF7WGXwI3aNMo_EA8JA7NHhYJBVpwOLH6Qu197rOk5xCshRFOLyIDBniys1nxGLIm_qMPJTZxs_NMT3QxRzuSblhSvkdk8zV9W2jcun8C18eL0_dg-lKEtvXZcSwUsQAfVO3h-mwTjIv7sny-clGECSMakkae8wVOgPYg&uniplatform=NZKPT&language=CHS (accessed on 11 November 2024).
- GBT50081-2002; Standard for Test Method of Mechanical Properties on Ordinary Concrete. Ministry of Construction of the People’s Republic of China: Beijing, China, 2019.
- Luo, K. The Research on Dynamic Mechanical Characteristics of High Performance Recycled Concrete and Strain Rate Effect; China University of Mining & Technology: Beijing, China, 2018. [Google Scholar]
- Shi, C.; Zhang, Q.; Wang, S. Numerical Simulation Technology and Application of Granular Flow (PFC5.0). Rock Soil Mech. 2018, 39, 36. [Google Scholar]
- Deng, S.; Zheng, Y.; Feng, L.; Zhu, P.; Ni, Y. Application of Design of Experiments in Microscopic Parameter Calibration for Hard Rocks of PFC3D Model. Chin. J. Geotech. Eng. 2019, 41, 655–664. [Google Scholar] [CrossRef]
- Instutional Federation for Structural Concrete. Fib Model Code for Concrete Structures 2010; Wilhelm Ernst & Sohn: Berlin, Germany, 2013; ISBN 9783433030615. [Google Scholar]


| Performance Indicators | Specimen Type | |
|---|---|---|
| Limonite | Lead-Zinc Ore | |
| Compressive strength/MPa | 42.4 | 44.4 |
| Elastic modulus/GPa | 33.13 | 36.3 |
| Specimen Diameter (mm) | Specimen Height (mm) | Particle Radius (mm) | Particle Density (kg/m3) | Initial Porosity | Initial Damping Factor |
|---|---|---|---|---|---|
| 100 | 50 | 0.8~1.4 | 2800 | 0.35 | 0.3 |
| Rod | Length (mm) | Diameter (mm) | Elastic Modulus (GPa) | Density (kg/m3) | Poisson’s Ratio |
|---|---|---|---|---|---|
| Bullet | 600 | 100 | 190.3 | 7650 | 0.3 |
| Incident rod | 5000 | ||||
| Transmissive rod | 5000 |
| Category | Compressive Strength | Elastic Modulus | ||||
|---|---|---|---|---|---|---|
| Experimental Value/MPa | Simulated Value/MPa | Inaccuracy/% | Experimental Value/MPa | Simulated Value /MPa | Inaccuracy/% | |
| Limonite Concrete | 42.4 | 42.555 | 0.366 | 33.13 | 33.142 | 0.036 |
| Lead-Zinc Ore Concrete | 44.4 | 44.616 | 0.486 | 36.3 | 36.233 | 0.185 |
| Microscopic Parameters | Aggregate Types | |
|---|---|---|
| Limonite | Lead-Zinc Ore | |
| emod (Effective modulus/GPa) | 0.296 | 0.324 |
| kratio (Normal-Shear Stiffness Ratio) | 1.5 | 1.5 |
| fric (coefficient of friction) | 0.1 | 0.1 |
| Microscopic Parameters | Aggregate Types | |
|---|---|---|
| Limonite | Lead-Zinc Ore | |
| pb_emod (Effective modulus of bond/GPa) | 2.96 | 3.24 |
| pb_kratio (Bond normal-shear stiffness ratio) | 1.5 | 1.5 |
| pb_coh (bonding cohesion/MPa) | 15.6 | 16.5 |
| pb_ten (bonding tensile strength/MPa) | 42 | 44.4 |
| pb_fa (angle of internal friction of cementation) | 50 | 50 |
| Category | Strain Rate | |||
|---|---|---|---|---|
| 52.71 s−1 | 74.8 s−1 | 107.5 s−1 | 128.7 s−1 | |
| Experimental |  | 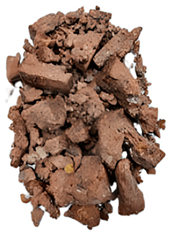 | 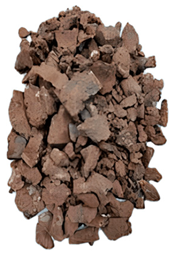 | 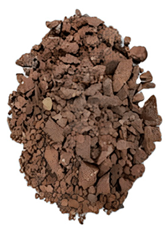 |
| Simulation | 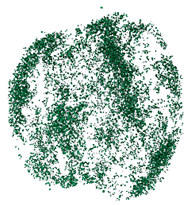 |  | 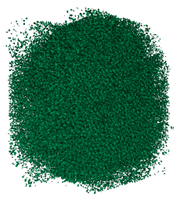 | 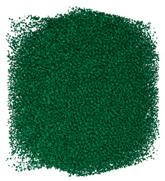 |
| Category | Strain Rate | |||
|---|---|---|---|---|
| 19.19 s−1 | 41.84 s−1 | 53.12 s−1 | 65.72 s−1 | |
| Experimental | 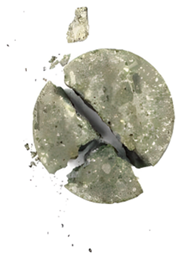 | 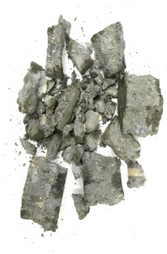 |  | 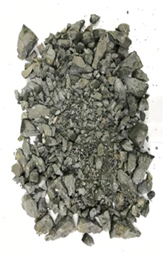 |
| Simulation | 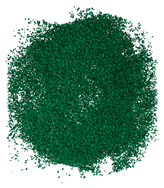 | 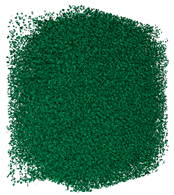 | 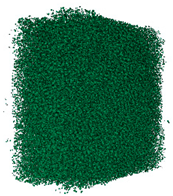 | 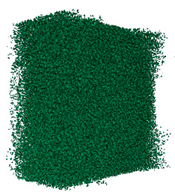 |
| Category | 20% Peak Stress | 40% Peak Stress | 60% Peak Stress | 80% Peak Stress | Peak Stress | Damage |
|---|---|---|---|---|---|---|
| Limonite Concrete (strain rate-52.7 s−1) |  |  |  |  |  |  |
| Lead-Zinc Ore Concrete (strain rate-53.12 s−1) |  |  |  | 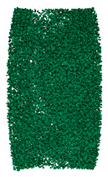 |  |  |
Disclaimer/Publisher’s Note: The statements, opinions and data contained in all publications are solely those of the individual author(s) and contributor(s) and not of MDPI and/or the editor(s). MDPI and/or the editor(s) disclaim responsibility for any injury to people or property resulting from any ideas, methods, instructions or products referred to in the content. |
© 2024 by the authors. Licensee MDPI, Basel, Switzerland. This article is an open access article distributed under the terms and conditions of the Creative Commons Attribution (CC BY) license (https://creativecommons.org/licenses/by/4.0/).
Share and Cite
Liu, K.; Chen, Z.; Tao, Q.; Wu, D.; Wu, Q.; Zou, P.; Wang, M.; Li, Y. Dynamic Mechanical Properties and Damage Morphology Analysis of Concrete with Different Aggregates Based on FDM-DEM Coupling. Materials 2024, 17, 5804. https://doi.org/10.3390/ma17235804
Liu K, Chen Z, Tao Q, Wu D, Wu Q, Zou P, Wang M, Li Y. Dynamic Mechanical Properties and Damage Morphology Analysis of Concrete with Different Aggregates Based on FDM-DEM Coupling. Materials. 2024; 17(23):5804. https://doi.org/10.3390/ma17235804
Chicago/Turabian StyleLiu, Kaixuan, Zhenfu Chen, Qiuwang Tao, Dan Wu, Qiongfang Wu, Pinyu Zou, Minghui Wang, and Yangzi Li. 2024. "Dynamic Mechanical Properties and Damage Morphology Analysis of Concrete with Different Aggregates Based on FDM-DEM Coupling" Materials 17, no. 23: 5804. https://doi.org/10.3390/ma17235804
APA StyleLiu, K., Chen, Z., Tao, Q., Wu, D., Wu, Q., Zou, P., Wang, M., & Li, Y. (2024). Dynamic Mechanical Properties and Damage Morphology Analysis of Concrete with Different Aggregates Based on FDM-DEM Coupling. Materials, 17(23), 5804. https://doi.org/10.3390/ma17235804