Abstract
Dilatancy is commonly defined as the ratio of the rates of plastic volumetric strain to plastic deviatoric strain, denoted as Dp. Owing to the high modulus of elasticity, the elastic volumetric and deviatoric strain rates under shear stress in conventional cohesionless materials are negligible. Therefore, using the ratio of the rates of total volumetric to deviatoric strain (Dt) as an approximation is common in studying stress–dilatancy behavior and calibrating dilatancy model parameters. This approach is also common in the study of rubber-added cohesionless materials (RCM). However, RCM with a common range of rubber content exhibit a significantly lower modulus of elasticity compared to conventional cohesionless materials. Further research is needed to evaluate the potential impact of elastic strain rates in RCM on stress–dilatancy analysis. Therefore, comparisons were conducted on the stress–dilatancy responses of a series of tests on RCM, where dilatancy is calculated by Dp and Dt, respectively. Furthermore, a modified method for calibrating the parameters of a state-dependent dilatancy model considering Dp is presented. It turns out that Dp is better suited and more precise for dilatancy analysis on highly elastic RCM. Additionally, the dilatancy model can more precisely capture the test results of RCM with parameters calibrated by the proposed method.
1. Introduction
The growing abundance of used rubber has brought about widespread attention to its reuse and recycling. Employing it for the creation of rubber-added cohesionless materials (RCM) in geotechnical construction applications is both economically and environmentally friendly, along with contributing towards the establishment of a sustainable society. For example, rubber-cohesionless soil mixtures have been widely and successfully used for lightweight filler of foundations and retaining walls [1,2,3,4,5], seismic isolation and liquefaction potential reduction systems for buildings [6,7,8,9,10,11,12], and as a substitute material for leachate collection systems in landfills [13,14,15]. Additionally, more possible alternative types of RCM, such as rubber–steel furnace slag–coal wash mixtures [16,17,18], rubber–glass mixtures [19,20,21], and rubber–polyurethane urea mixtures [22], have also been suggested for construction applications. However, despite the extensive application potential and prospects of the RCM, statistical data indicates that to date less than 10% of waste rubber has been effectively utilized in construction purpose globally [23]. Therefore, further experimental and theoretical research on RCM remains essential to support and expand the practical applications, aiming to achieve reduced material waste or improved resilience.
Stress–dilatancy is a fundamental aspect of understanding the stress–strain behavior of construction materials [24,25,26]. A typical method for analyzing dilatancy involves formulating a mathematical relationship between the stress ratio, η, and the dilatancy, D. Dilatancy describes the tendency of volume change in the soil element under shear stress, commonly defined as D = d/d [24,27,28]. However, the plastic deformation component cannot be directly measured in triaxial tests; instead, it requires further calculation by subtracting the elastic deformation component from the total deformation. Due to the highly elastic stiffness of conventional cohesionless materials, the elastic deformation component under stress is relatively small. Therefore, when analyzing dilatancy though experimental results and calibrating the parameters for a dilatancy model, it is common practice to ignore the small elastic deformations d and d, and use dεv/dεq as an approximation [24,29,30,31]. Additionally, there are also studies that first calibrate the elastic modulus for the calculation of elastic deformations, then compute the dilatancy using the equation: d/d = (dεv − d)/(dεq − d) [32,33,34,35]. Specially, they define the total ratio dεv/dεq as the dilatancy D, and define d/d as the plastic dilatancy Dp. Although these studies have subtle differences in the definition, they all emphasize that stress–dilatancy is a concept regarding the ratio of plastic strain rates (d/d). Therefore, it can be concluded that the value d/d is crucial in the study of stress–dilatancy. Additionally, it is more preferable to consider total deformation as an approximation (d/ddεv/dεq) only when elastic deformation is minimal. In this paper, to avoid misunderstanding, dεv/dεq is denoted as Dt and d/d is denoted as Dp. To study the stress–dilatancy mechanical properties of RCM, numerous triaxial tests have been conducted (e.g., [16,17,36,37,38,39,40,41,42,43]). Those studies show that the increased rubber content always increases the shear contraction during hardening of RCM samples, and the dilation after the peak strength decreased. Experimental findings encouraged further research into the dilatancy modelling of RCM. The dilatancy behavior of RCM is similar to that of sands, where dilatancy depends not only on stress state but also on density state. Therefore, the state-dependent dilatancy function introduced by Li and Dafalias [24] has been widely adopted as the basic framework for capturing the dilatancy of RCM in several studies (e.g., [16,36,38,42,44]). Similar to the studies on the conventional cohesionless materials, most of the above experimental or theoretical studies used Dt (dεv/dεq) to study the stress–dilatancy responses of RCM or calibrated the parameters of the state-dependent dilatancy model. The symbol d/d was defaulted to denote dilatancy in studies [16,38]; however, total deformation was still used for dilatancy analysis or parameter calibration in their research. For instance, they used the extreme value of total volumetric deformation, where Dt = 0, to determine the phase transformation state. To date, only limited studies have attempted to use the Dp (d/d) for analyzing the stress–dilatancy responses of RCM. Tawk and Indraratna [42] distinguished between the total volumetric strain measured by displacement monitoring devices and the pore volumetric strain measured by the volume of drained water, and represented plastic deformation with pore volumetric strain. Zhang et al. [44] used the data of the residual stage to approximate plastic deformation. Szypcio [34] proposed a method using plastic deformation for the dilatancy analysis of cohesionless sand, which was later applied to rubber–sand mixtures [45]. It can be seen that the analysis of dilatancy in RCM is similar to that in conventional cohesionless materials; it is common to use Dt, and some researchers also attempted to use Dp. In fact, the addition of rubber significantly decreases the elastic stiffness of the RCM [36,46,47].This suggests that the elastic deformation under shear stress of the RCM must increase with the addition of rubber; however, there is a lack of comprehensive and robust quantitative analysis on the difference between Dt and Dp considering this impact. Therefore, the potential impact of elastic strain rates in RCM on stress–dilatancy analysis and whether elastic deformation is still minimal needs further study. Additionally, if Dp is more suitable and precise, modified parameter calibration methods for the state-dependent dilatancy model considering Dp also need further development. Considering practical applications, the comparative analysis in this study focuses on the common range of optimum rubber content derived from the existing literature (approximately between 20% and 40%) [38,48,49,50,51].
In this paper, the comparative analysis between the η–Dt and η–Dp curves of several types of RCM with different rubber contents is conducted (within the common range of optimum rubber content). The comparison results indicate that Dp is more suitable for practice analysis in highly elastic RCM. Furthermore, a novel modified method for calibrating state-dependent dilatancy model parameters, especially proposed for the highly elastic RCM, is presented. The effectiveness of the proposed method is evaluated by simulating the η–Dp and η–Dt responses from a series of tests on RCM, and these simulations are also compared with those computed by parameters calibrated by the original method. The results demonstrate that the dilatancy parameters calibrated by the proposed method can more precisely capture the test results under different values of stresses and rubber contents.
2. Basic Theoretical Background
Within the generalized triaxial compression tests (σ2 = σ3 and ε2 = ε3), the stress and strain variables in the p-q space can be defined as the mean effective pressure, p = (σ1 + 2σ3)/3, deviatoric
stress, q = σ1 − σ3, where σ1 and σ3 are the major and minor principal stresses, respectively, volumetric strain, εv = ε1 + 2ε3, and deviatoric strain, εq = 2(ε1 − ε3)/3, where ε1 and ε3 are the major and minor principal compressive strains, respectively.
According to the critical state soil mechanics [28], the total deformation is the sum of the elastic and plastic components, as given by:
where the superscript ‘e’ and subscript ‘p’ denote the elastic and plastic components of the strain increment, respectively.
The total dilatancy can then be calculated as Dt = dεv/dεq, and the plastic dilatancy Dt can then be obtained by combining Equations (1) and (2) as:
where K and G represent the bulk modulus and shear modulus of elasticity, respectively.
Equation (3) calculates the ratio of differential incremental rates, which is inherently noisy due to the test error and inhomogeneity in sample preparation. For practical use, the central-difference approach suggested by Been and Jefferies [33] is adopted to reduce such noise, as given by:
where the subscript ‘i’ indicates the ith incremental step, spanning from the i − 1th to the i + 1th test points. The elastic bulk modulus Ki and shear modulus Gi are considered constant at the current ith incremental step, and only changes when the step moves to the next.
To model the elastic deformation of RCM, the modified function of shear modulus G dependent on p and e by Li and Dafalias [24] has been successfully applied in several studies [36,37,44].
where the void ratio e is modified as the current value, rather than the initial value e0 as referenced in [52], and G0 represents a dimensionless material constant. The shear modulus at the ith incremental step can then be expressed as Gi = G0 (2.97 − ei)2/(1 + ei) (pipa)1/2. If a complete set of e0, p0 (initial mean stress), εv,i − εq,i, and εq,i − qi data is provided, under a conventional drained stress paths (dq/dp = 3), pi and ei can then be calculated as pi = p0 + qi/3 and ei = (1 + e0)/exp(εv,i) − 1, respectively. Within the framework of elasticity theory [53], the elastic bulk modulus K is equal to:
where ν is Poisson’s ratio, considered a material constant. The ith elastic bulk modulus Ki can then be expressed as Ki = 2/3Gi(1 + v)/(1 − 2v). Although these elastic parameters were used for calculating the elastic deformations in the constitutive model proposed by Li and Dafalias [24], owing to the high elastic modulus of conventional cohesionless materials, the elastic deformations were neglected when calibrating the dilatancy parameters. Studies in [36,37] also followed this approach.
3. Comparative Analysis on η–Dt and η–Dp
The comparison of the η–Dt and η–Dp is evaluated using a series of triaxial drained shear tests conducted on two types of RCM: (i) Rubber–Ayutthaya sand mixtures conducted by Youwai and Bergado [36]. The mixed rubber has the aspect ratio of 1, and the samples were prepared by the under-compaction method. Ayutthaya sand and samples with Rc varying from 20% to 40% (corresponding to the optimum content range summarized in the introduction section), isotopically compressed at effective confining pressures of 50, 100, and 200 kPa, were used for analysis. (ii) Rubber–beach sand mixtures conducted by Mashiri et al. [37,38]. The mixed rubber has the aspect ratio of 2.8, and the specimens were prepared using the dry deposition method in [54]. Samples with Rc = 35% (the optimum rubber content specially suggested in their study), isotopically compressed at 23, 69, and 138 kPa, were employed for analysis in this paper. The elastic parameters needed for the calculations follow those calibrated in [36,37], and are summarized in Table 1. The value of G0 is not directly provided in [37]; instead, the initial shear modulus at pre-shear state (Gin) is given. Therefore, the parameter G0 in Table 1 of [37] is further calculated using the following equation:
where the Gin denotes initial shear modulus, e0 denotes the initial void ratio. The above equation is a variation of Equation (5).

Table 1.
Summary of testing conditions and elastic parameters.
3.1. Negligible Elastic Deformation in the Dilatancy of Conventional Cohesionless Materials
Figure 1 shows the η–Dt and the η–Dp curves calculated from the drained shear tests on Ayutthaya sand with confining stress p0 = 100 kPa (the host sand used in Youwai and Bergado [36] for RCM specimen preparation). The η–Dt curve is very close to the η–Dp curve. This result is consistent with the generally accepted assumption that the small elastic deformations of conventional cohesionless materials can be ignored for dilatancy analysis, and the use of η–Dt is an approximation.
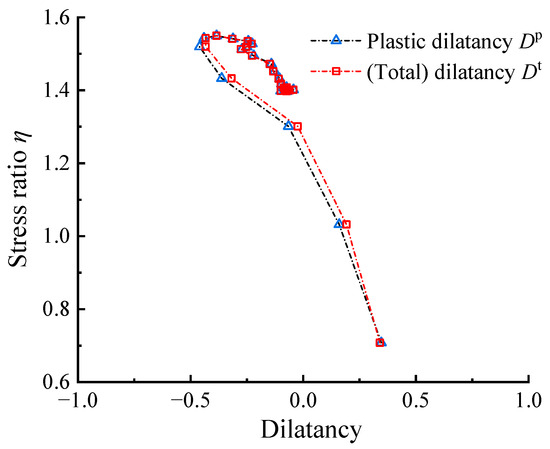
Figure 1.
Comparison of the η–Dp and the η–Dt curves of Ayutthaya sand with p0 = 100 kPa (εv,i–εq,i and εq,i–qi data set needed for calculating the η–D responses were obtained from Youwai and Bergado [36] using GetData Graph Digitizer 2.22).
3.2. Impact of Elastic Deformation in the Dilatancy of Highly Elastic Cohesionless Materials
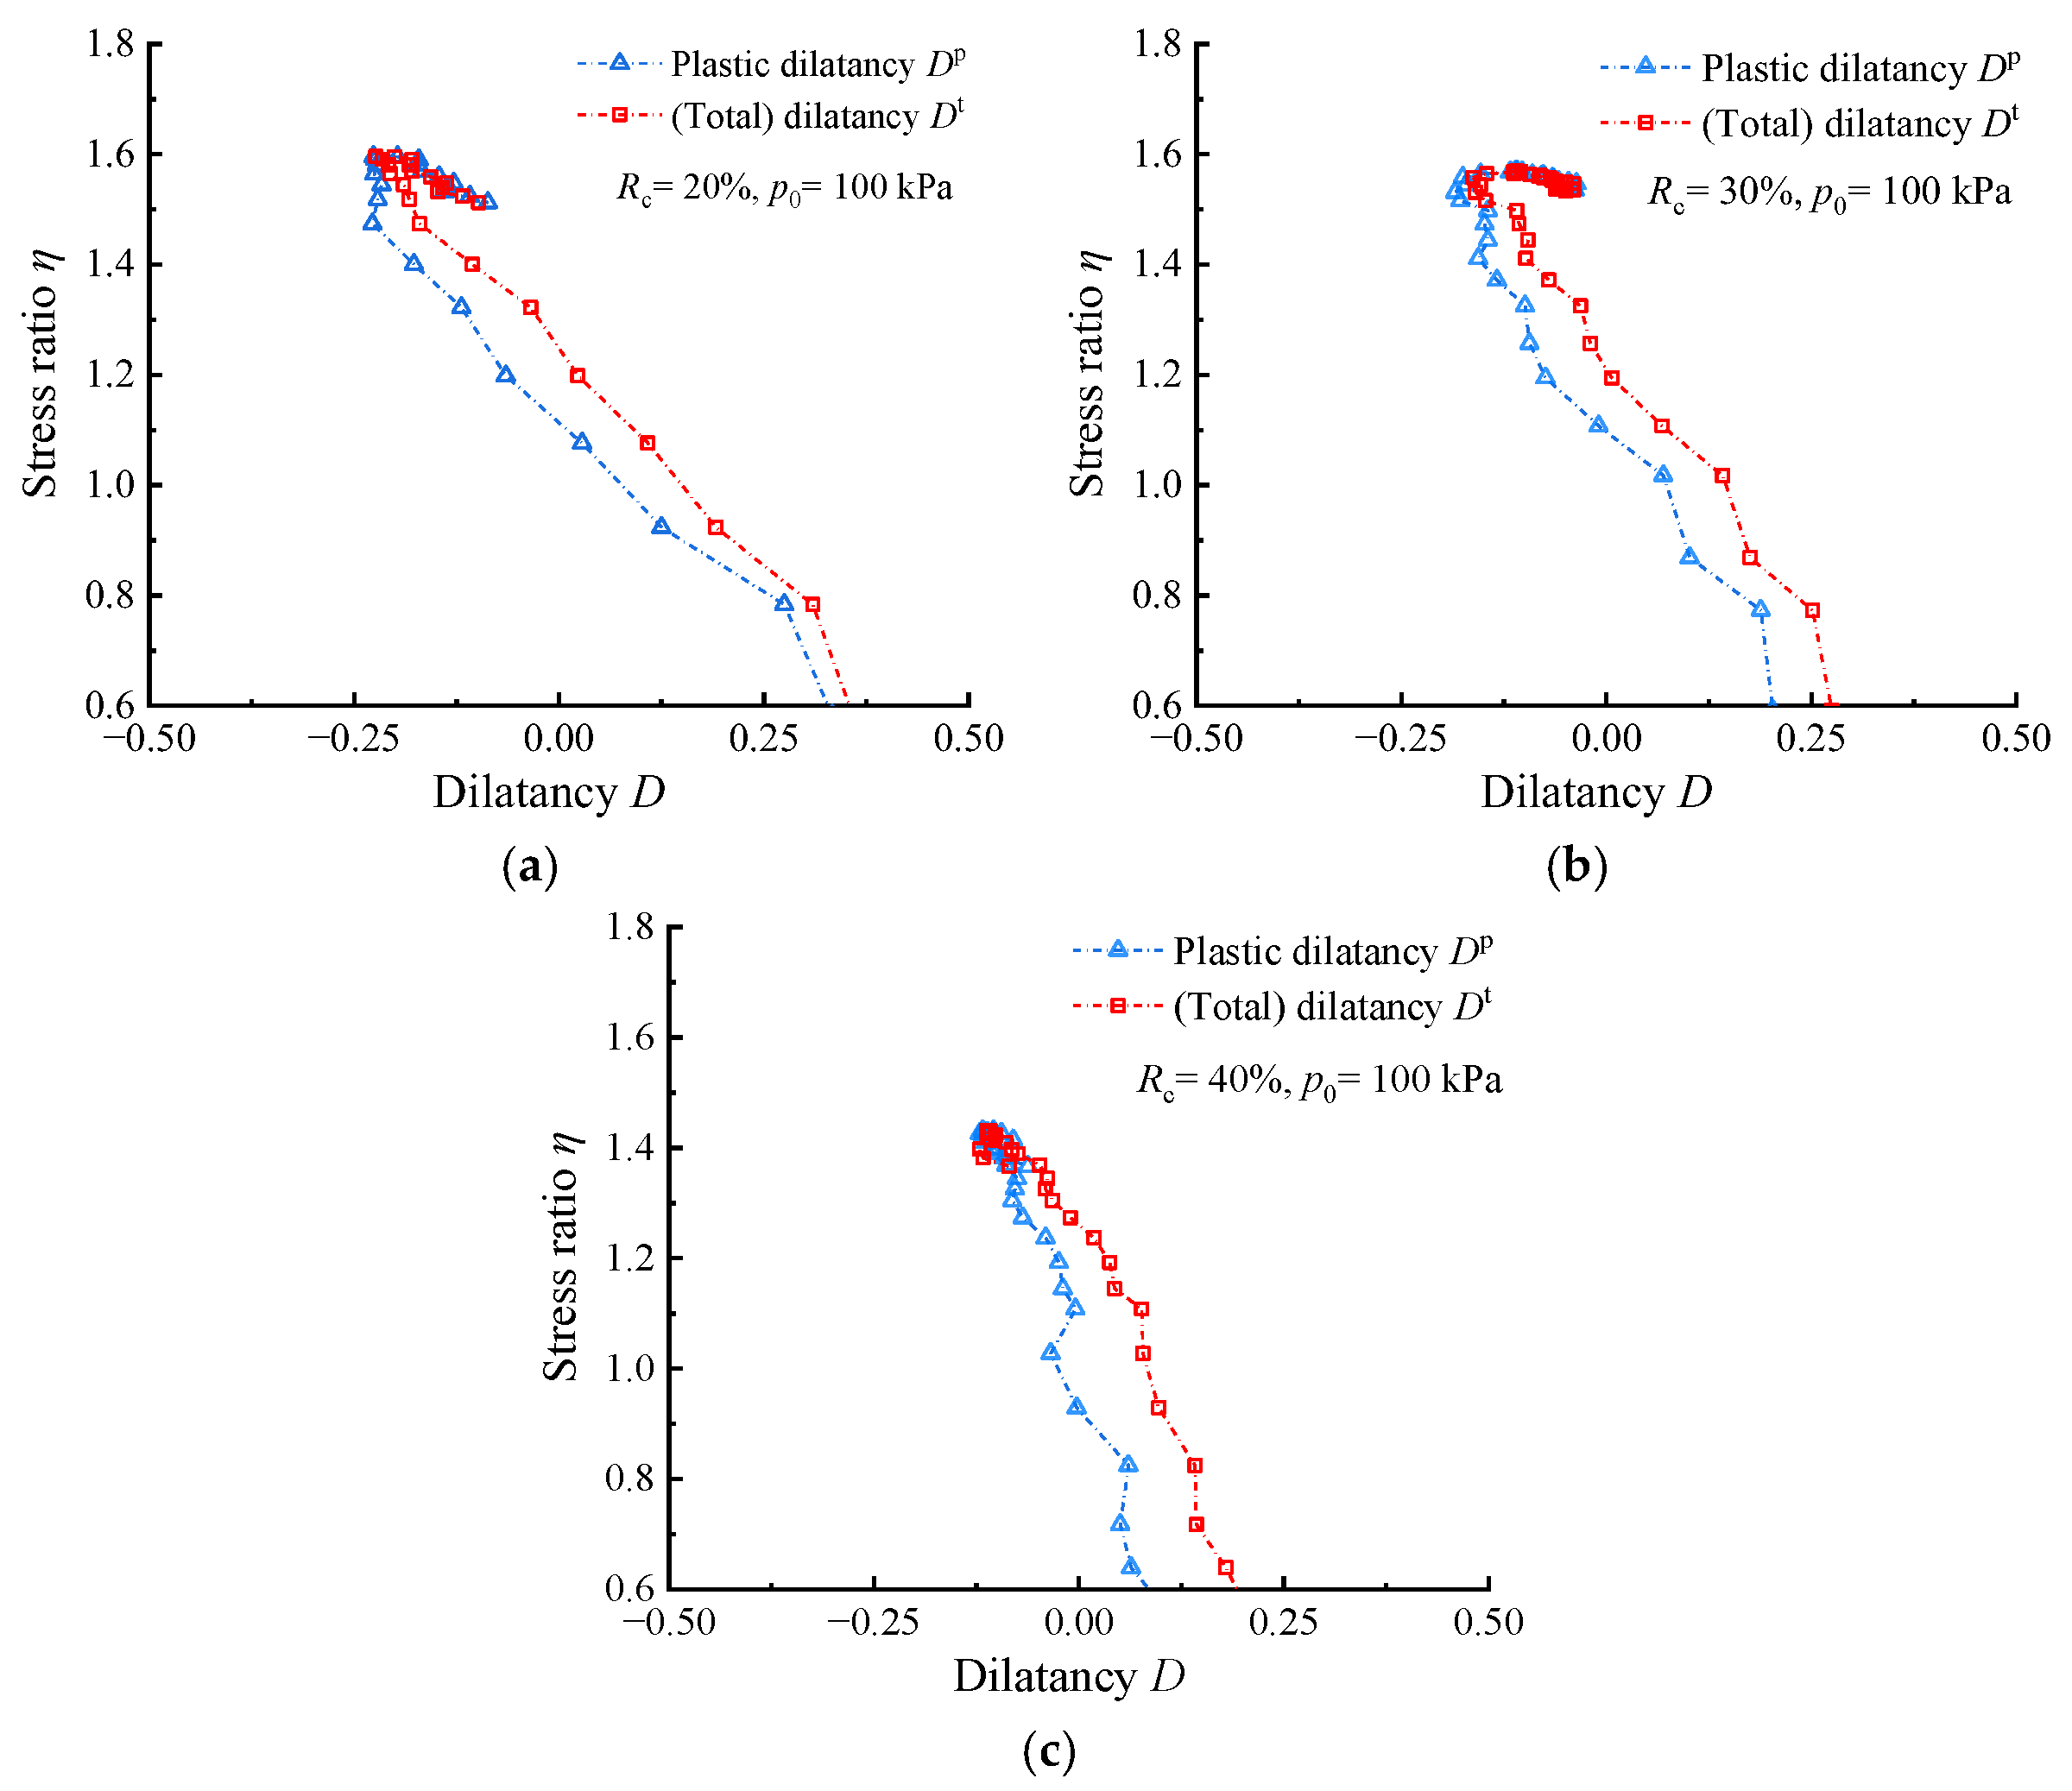
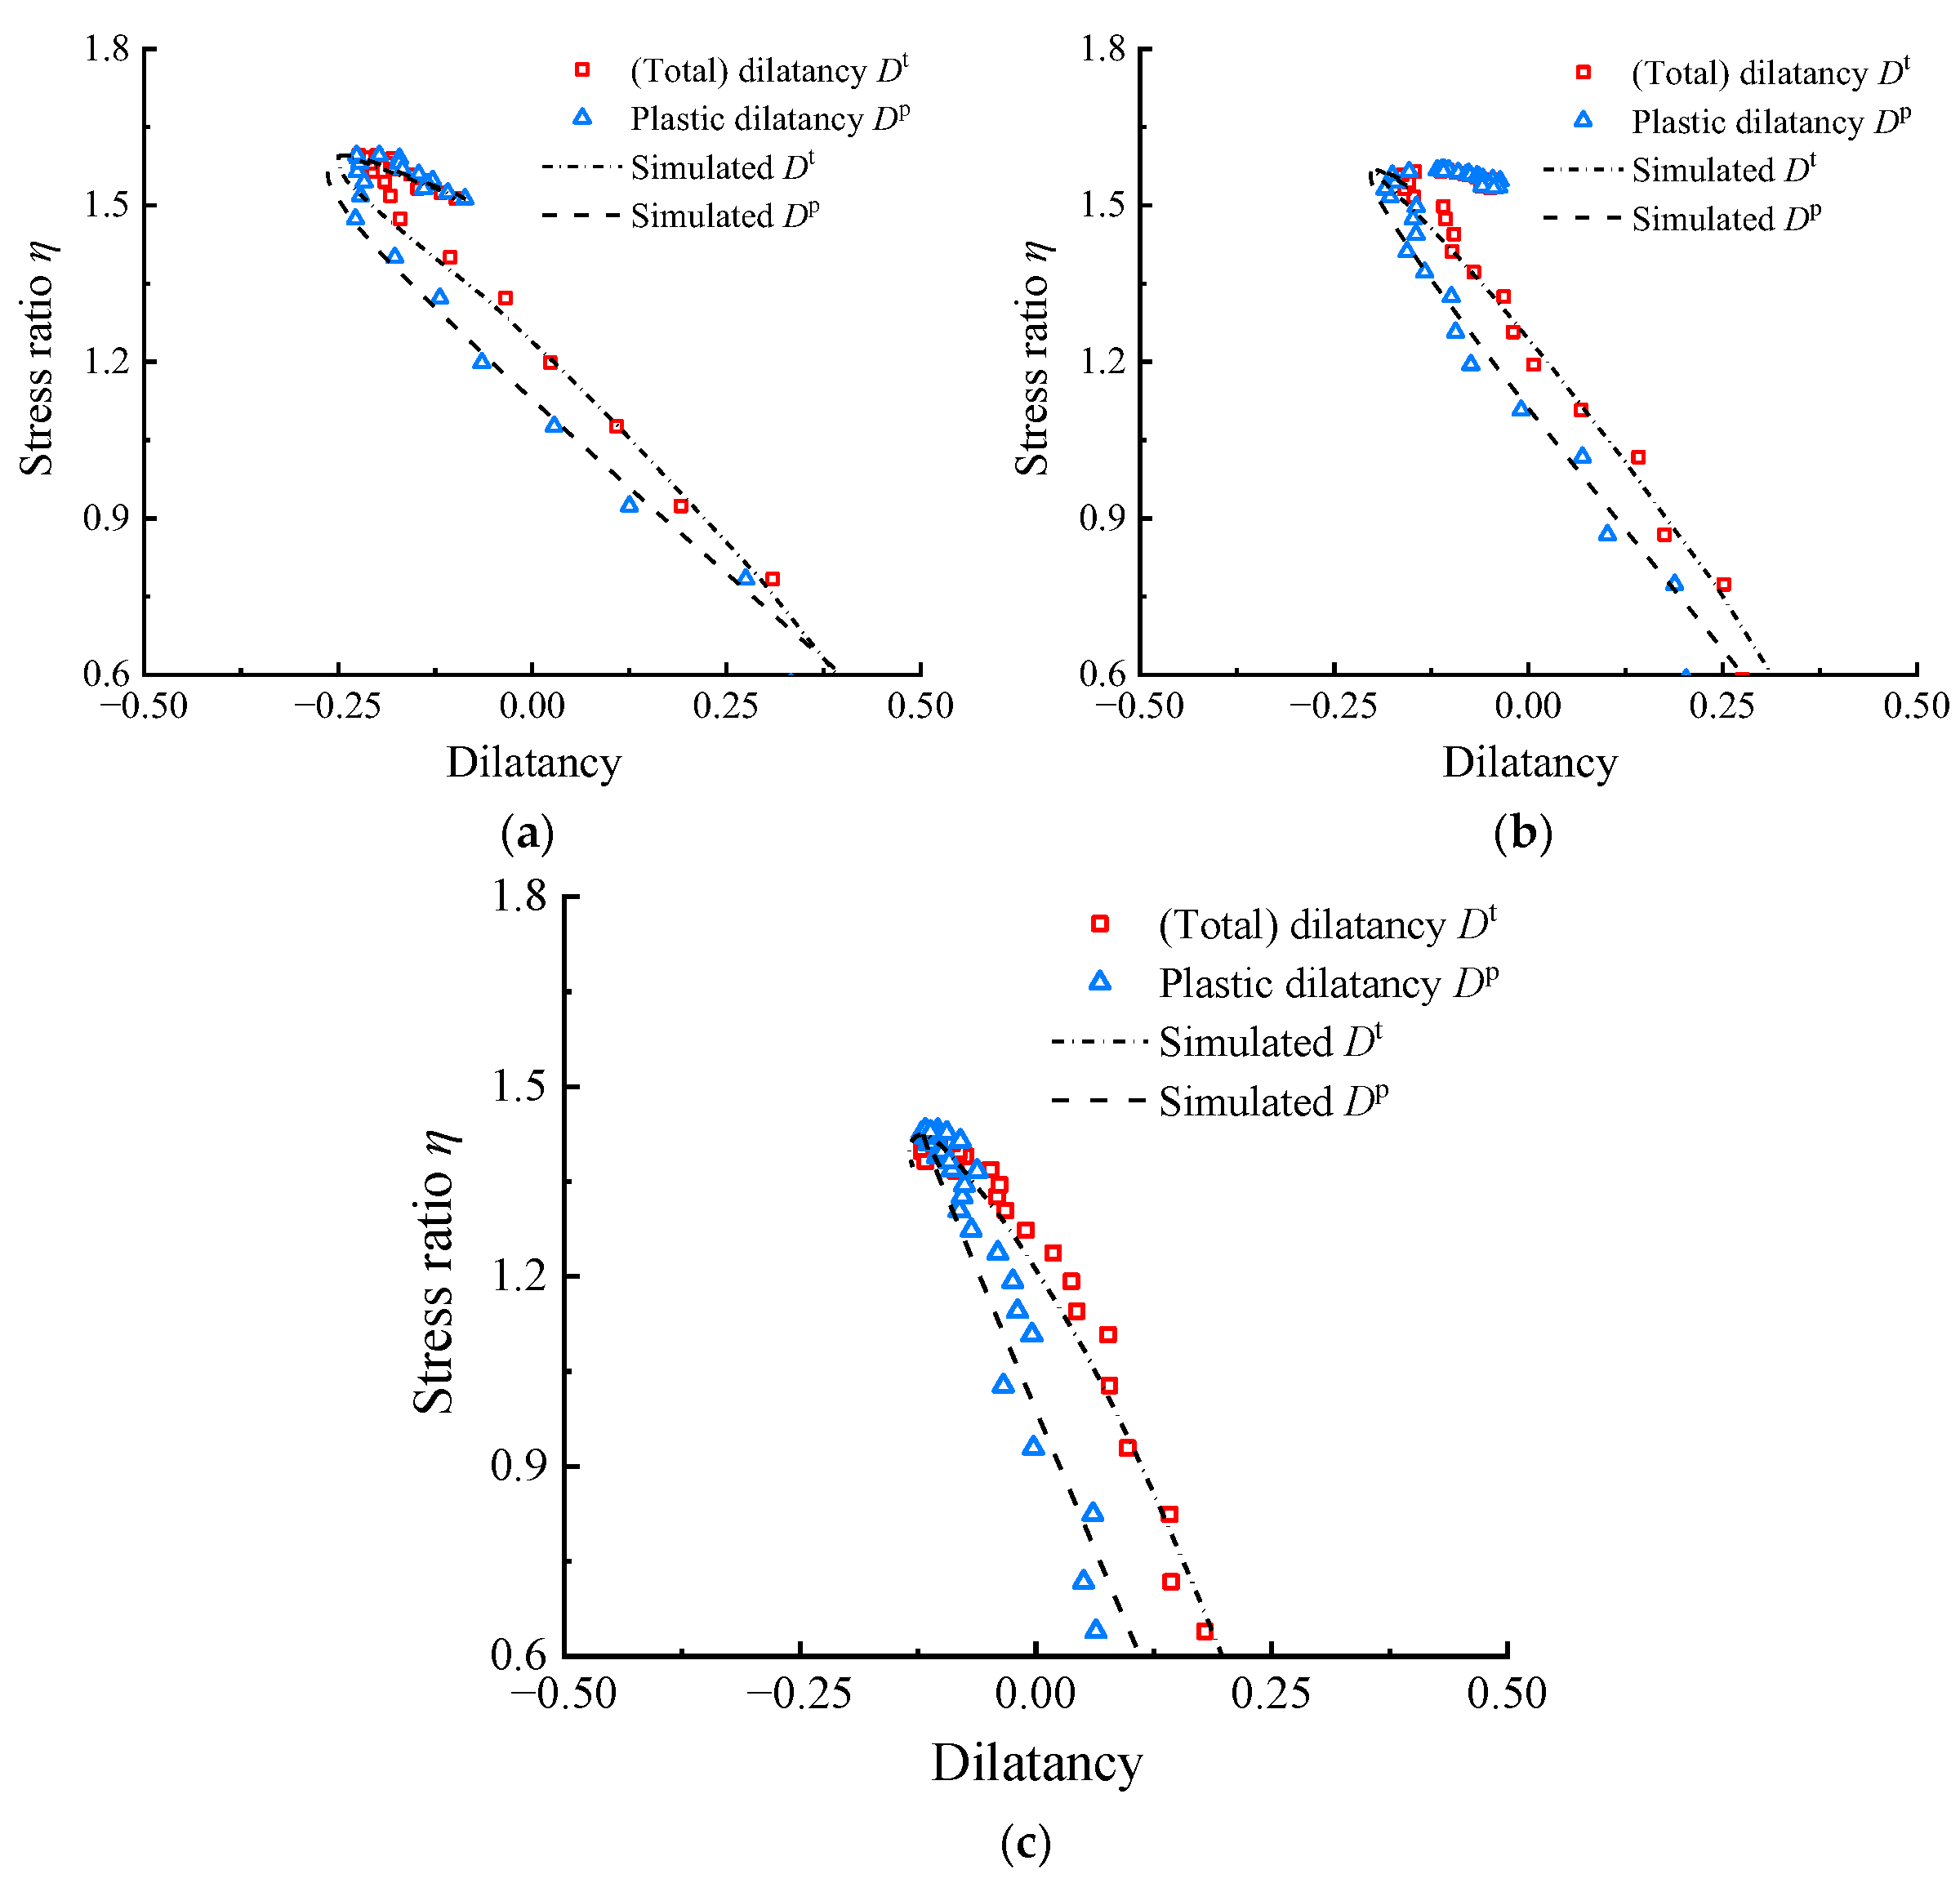
The impact of the highly elastic characters on dilatancy analysis was initially assessed using the test data from drained shear tests on rubber–sand mixtures conducted by Youwai and Bergado [36] with a confining pressure p0 of 100 kPa. Figure 2a shows that once the Rc reaches 20%, a noticeable gap emerges between the two curves in stress hardening. Furthermore, as illustrated in Figure 2b,c, the aforementioned gap becomes more pronounced with the increase in Rc.
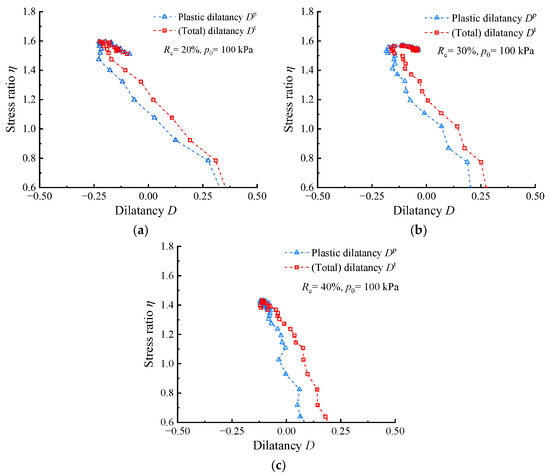
Figure 2.
Comparison of η–Dp and η–Dt curves for RCM at different Rc values with p0 = 100 kPa: (a) Rc = 20%; (b) Rc = 30%; (c) Rc = 40% (εv,i–εq,i and εq,i–qi data set needed for calculating the η–D responses were obtained from Youwai and Bergado [36] using GetData Graph Digitizer 2.22).
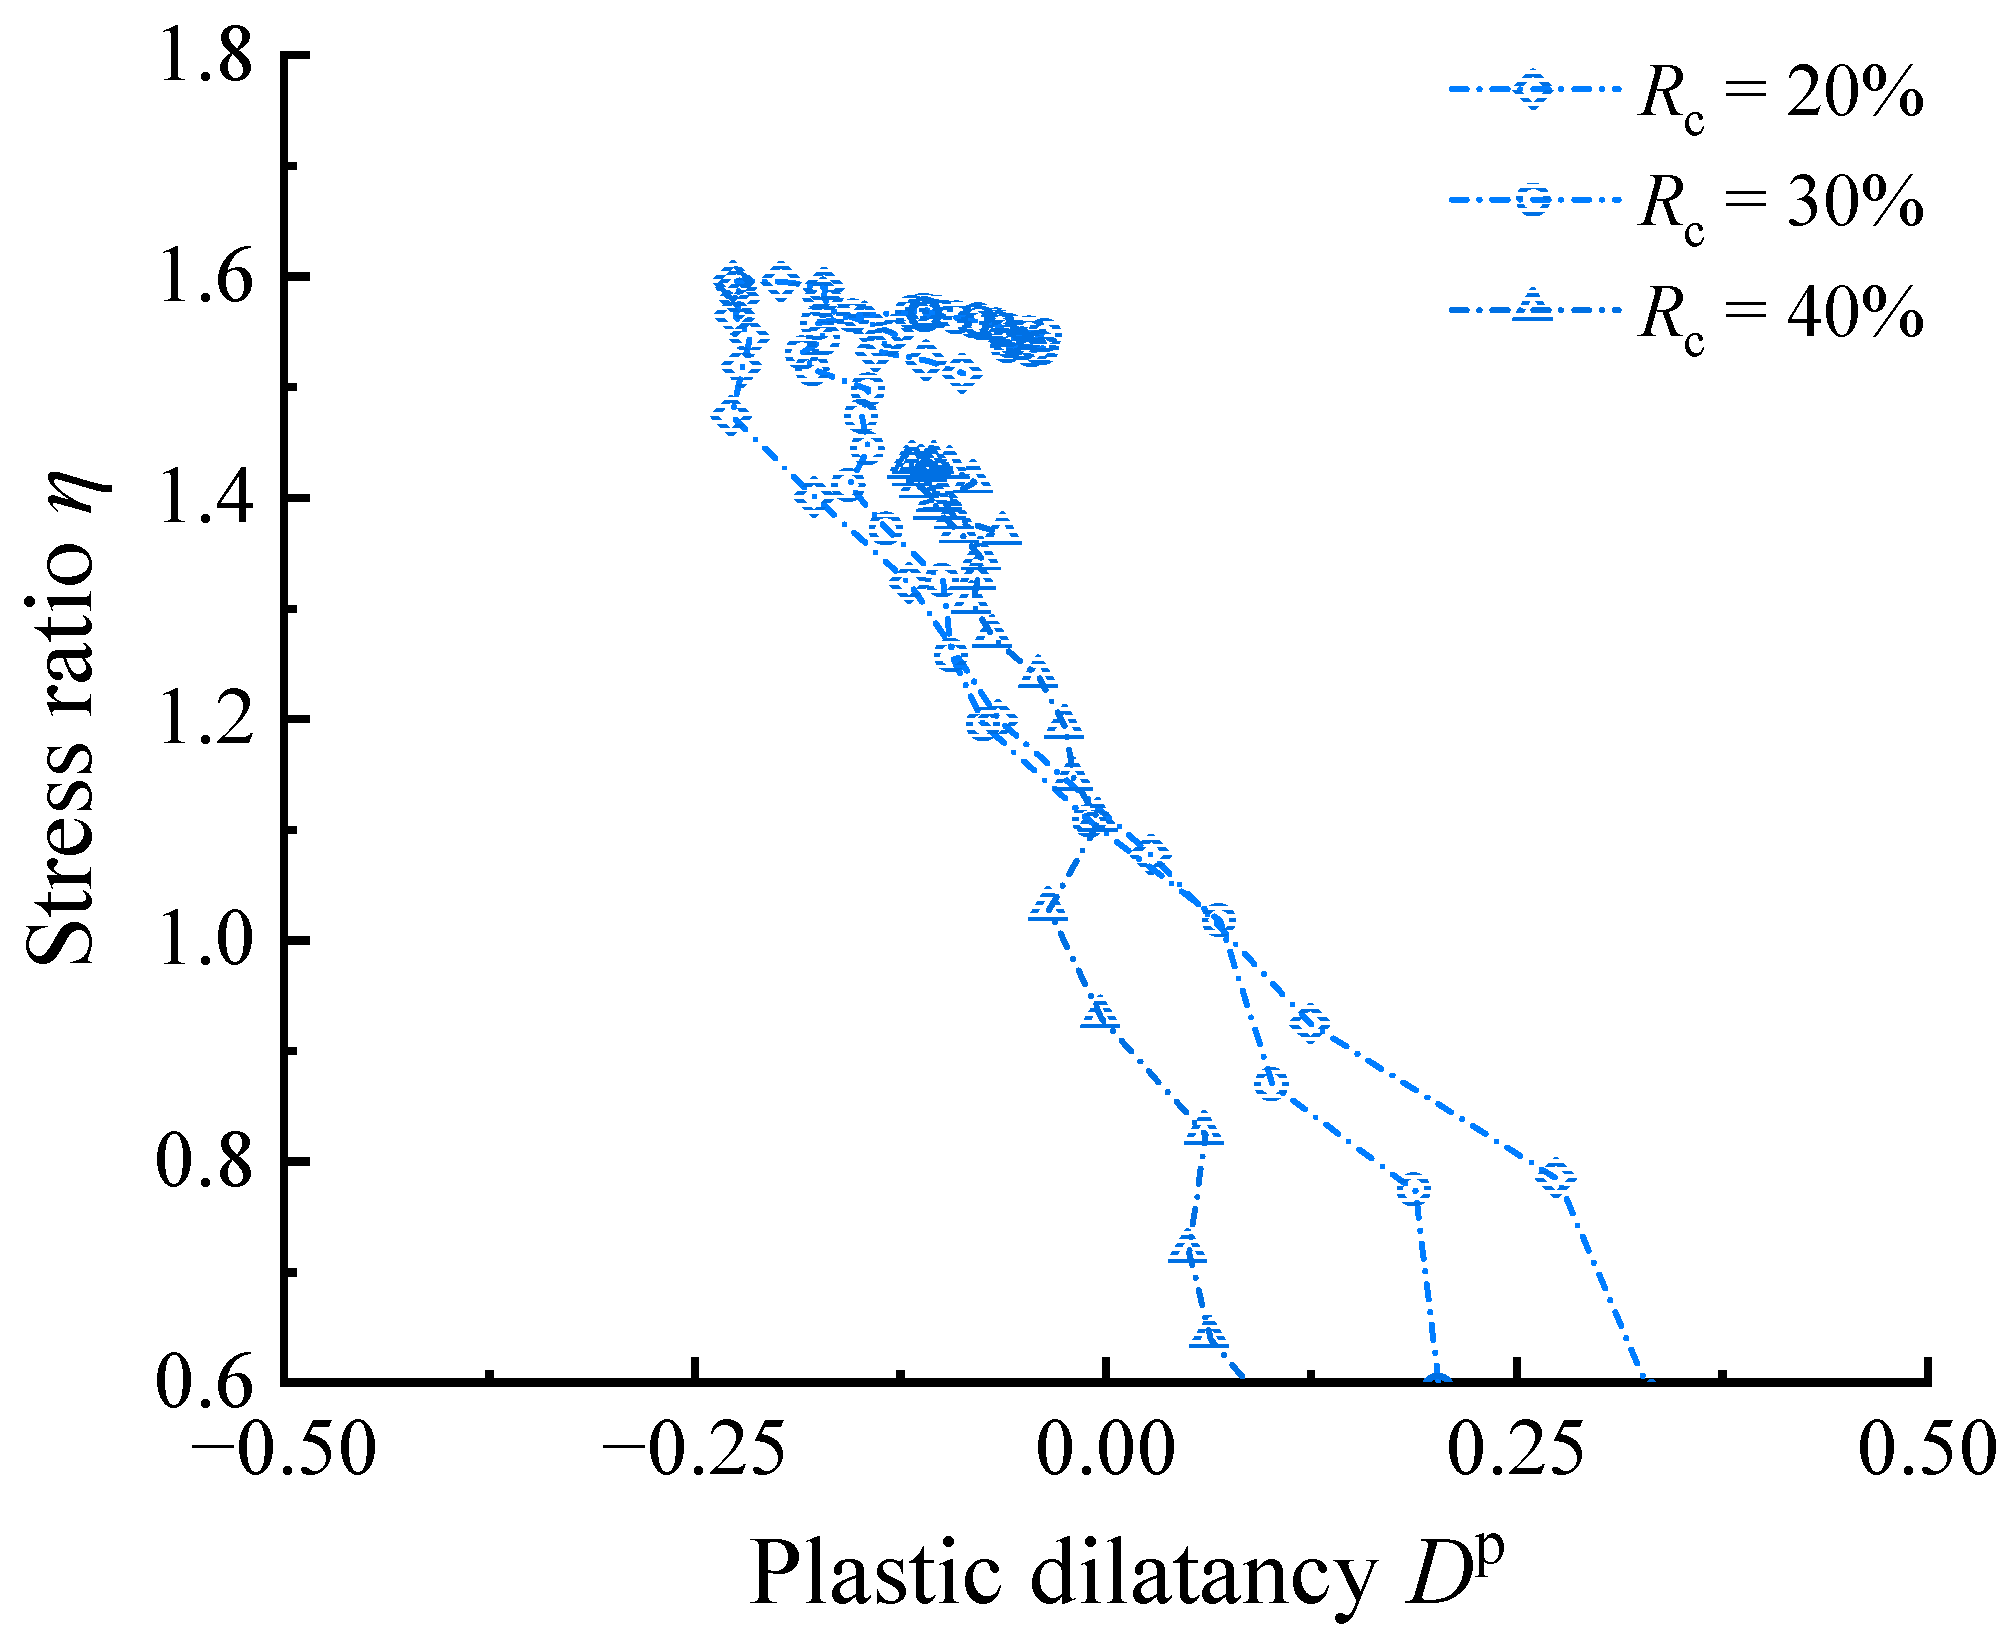
The specific effects of using η–D instead of η–Dp for dilatancy analysis need further discussion. Figure 2 shows that the η–D curves in the strength hardening (dη > 0) is generally located on the right side of the η–Dp curves (Dt > Dp, at the same η), which indicates that the high elastic deformation of the RCM makes a great contribution to the higher shear volume shrinkage and smaller shear volume expansion in the shear test. Therefore, ignoring the elastic deformation will exaggerate the resistance to shear expansion in RCM. In addition, Figure 2 shows that the phase transformation (dilatancy) stress ratio Md calibrated by η–Dt overestimates the actual value relative to that calibrated by η–Dp. This is because the existence of elastic volume contraction deformation offsets the part of the plastic volume dilatation deformation, thus the state that Dt = 0 is later than Dp = 0; since the samples are in the hardening stage, the later points have higher stress ratios. Therefore, within the common optimum range of rubber content, η–Dp is more recommended for analyzing stress–dilatancy for RCM. Figure 3 compares the η–Dp curves of RCM at different Rc values. It can be observed that as the Rc increases, the absolute value of Dp decreases, indicating that both plastic contraction and dilation are diminishing.

Figure 3.
Comparison of η–Dp curves for RCM at different Rc values with p0 = 100 kPa.
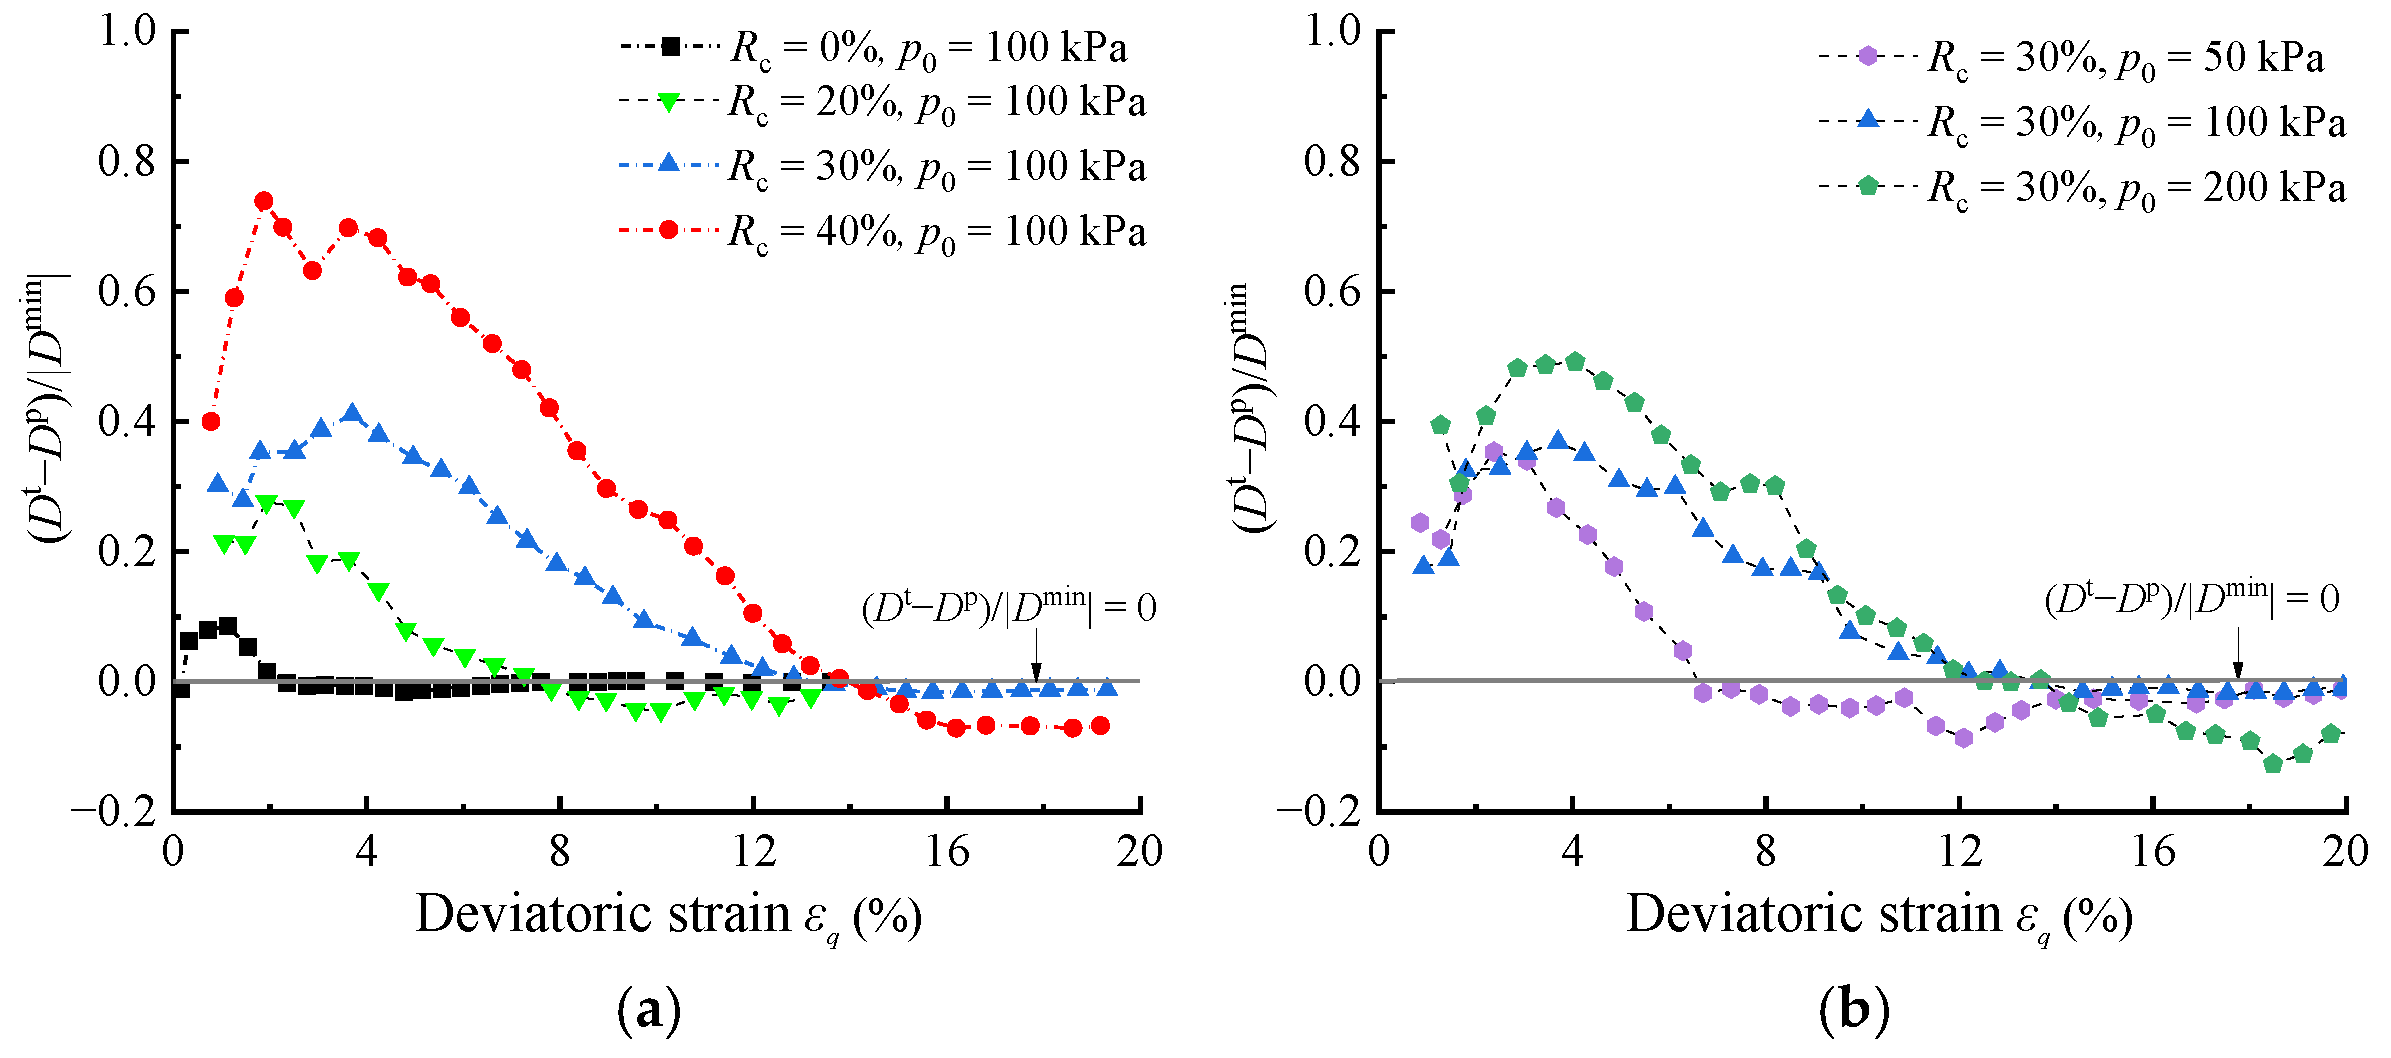
The previous analysis provided a general overview. To further quantify the estimated error arising from replacing Dp with Dt in shear, the modified relative error: (Dt − Dp)/|| versus εq under varying p0 and Rc conditions are further analyzed. Here, Dp was replaced with || to prevent the denominator from being zero. Overall, Figure 4a,b depict that (Dt − Dp)/|| values increase with the increase in Rc and p0, and the influence of Rc is much more significant. Notably, when the curves in Figure 4 intersect the x-axis, samples reach their peak stress state, characterized by dq = dp = 0. According to Equation (3), Dt = Dp and (Dt − Dp)/|| = 0 can be derived when dq = dp = 0. Using the peak stress state as a reference point, the region above the x-axis corresponds to the stress hardening, while the region under the x-axis corresponds to the stress softening. During the stress hardening, the modified relative error of all tests first increases and then decreases to 0 at the peak stress state. During stress softening, the modified relative error of host sand (Rc = 0) is almost zero. However, the error of RCM in stress softening gradually increases with increasing p0 and Rc, but it is still much smaller than that in stress hardening. The maximum (Dt − Dp)/|| value in RCM with Rc = 40% approaches eight times greater than that with Rc = 0%.

Figure 4.
(Dt − Dp)/|| under different triaxial test conditions: (a) different Rc; (b) different p0.
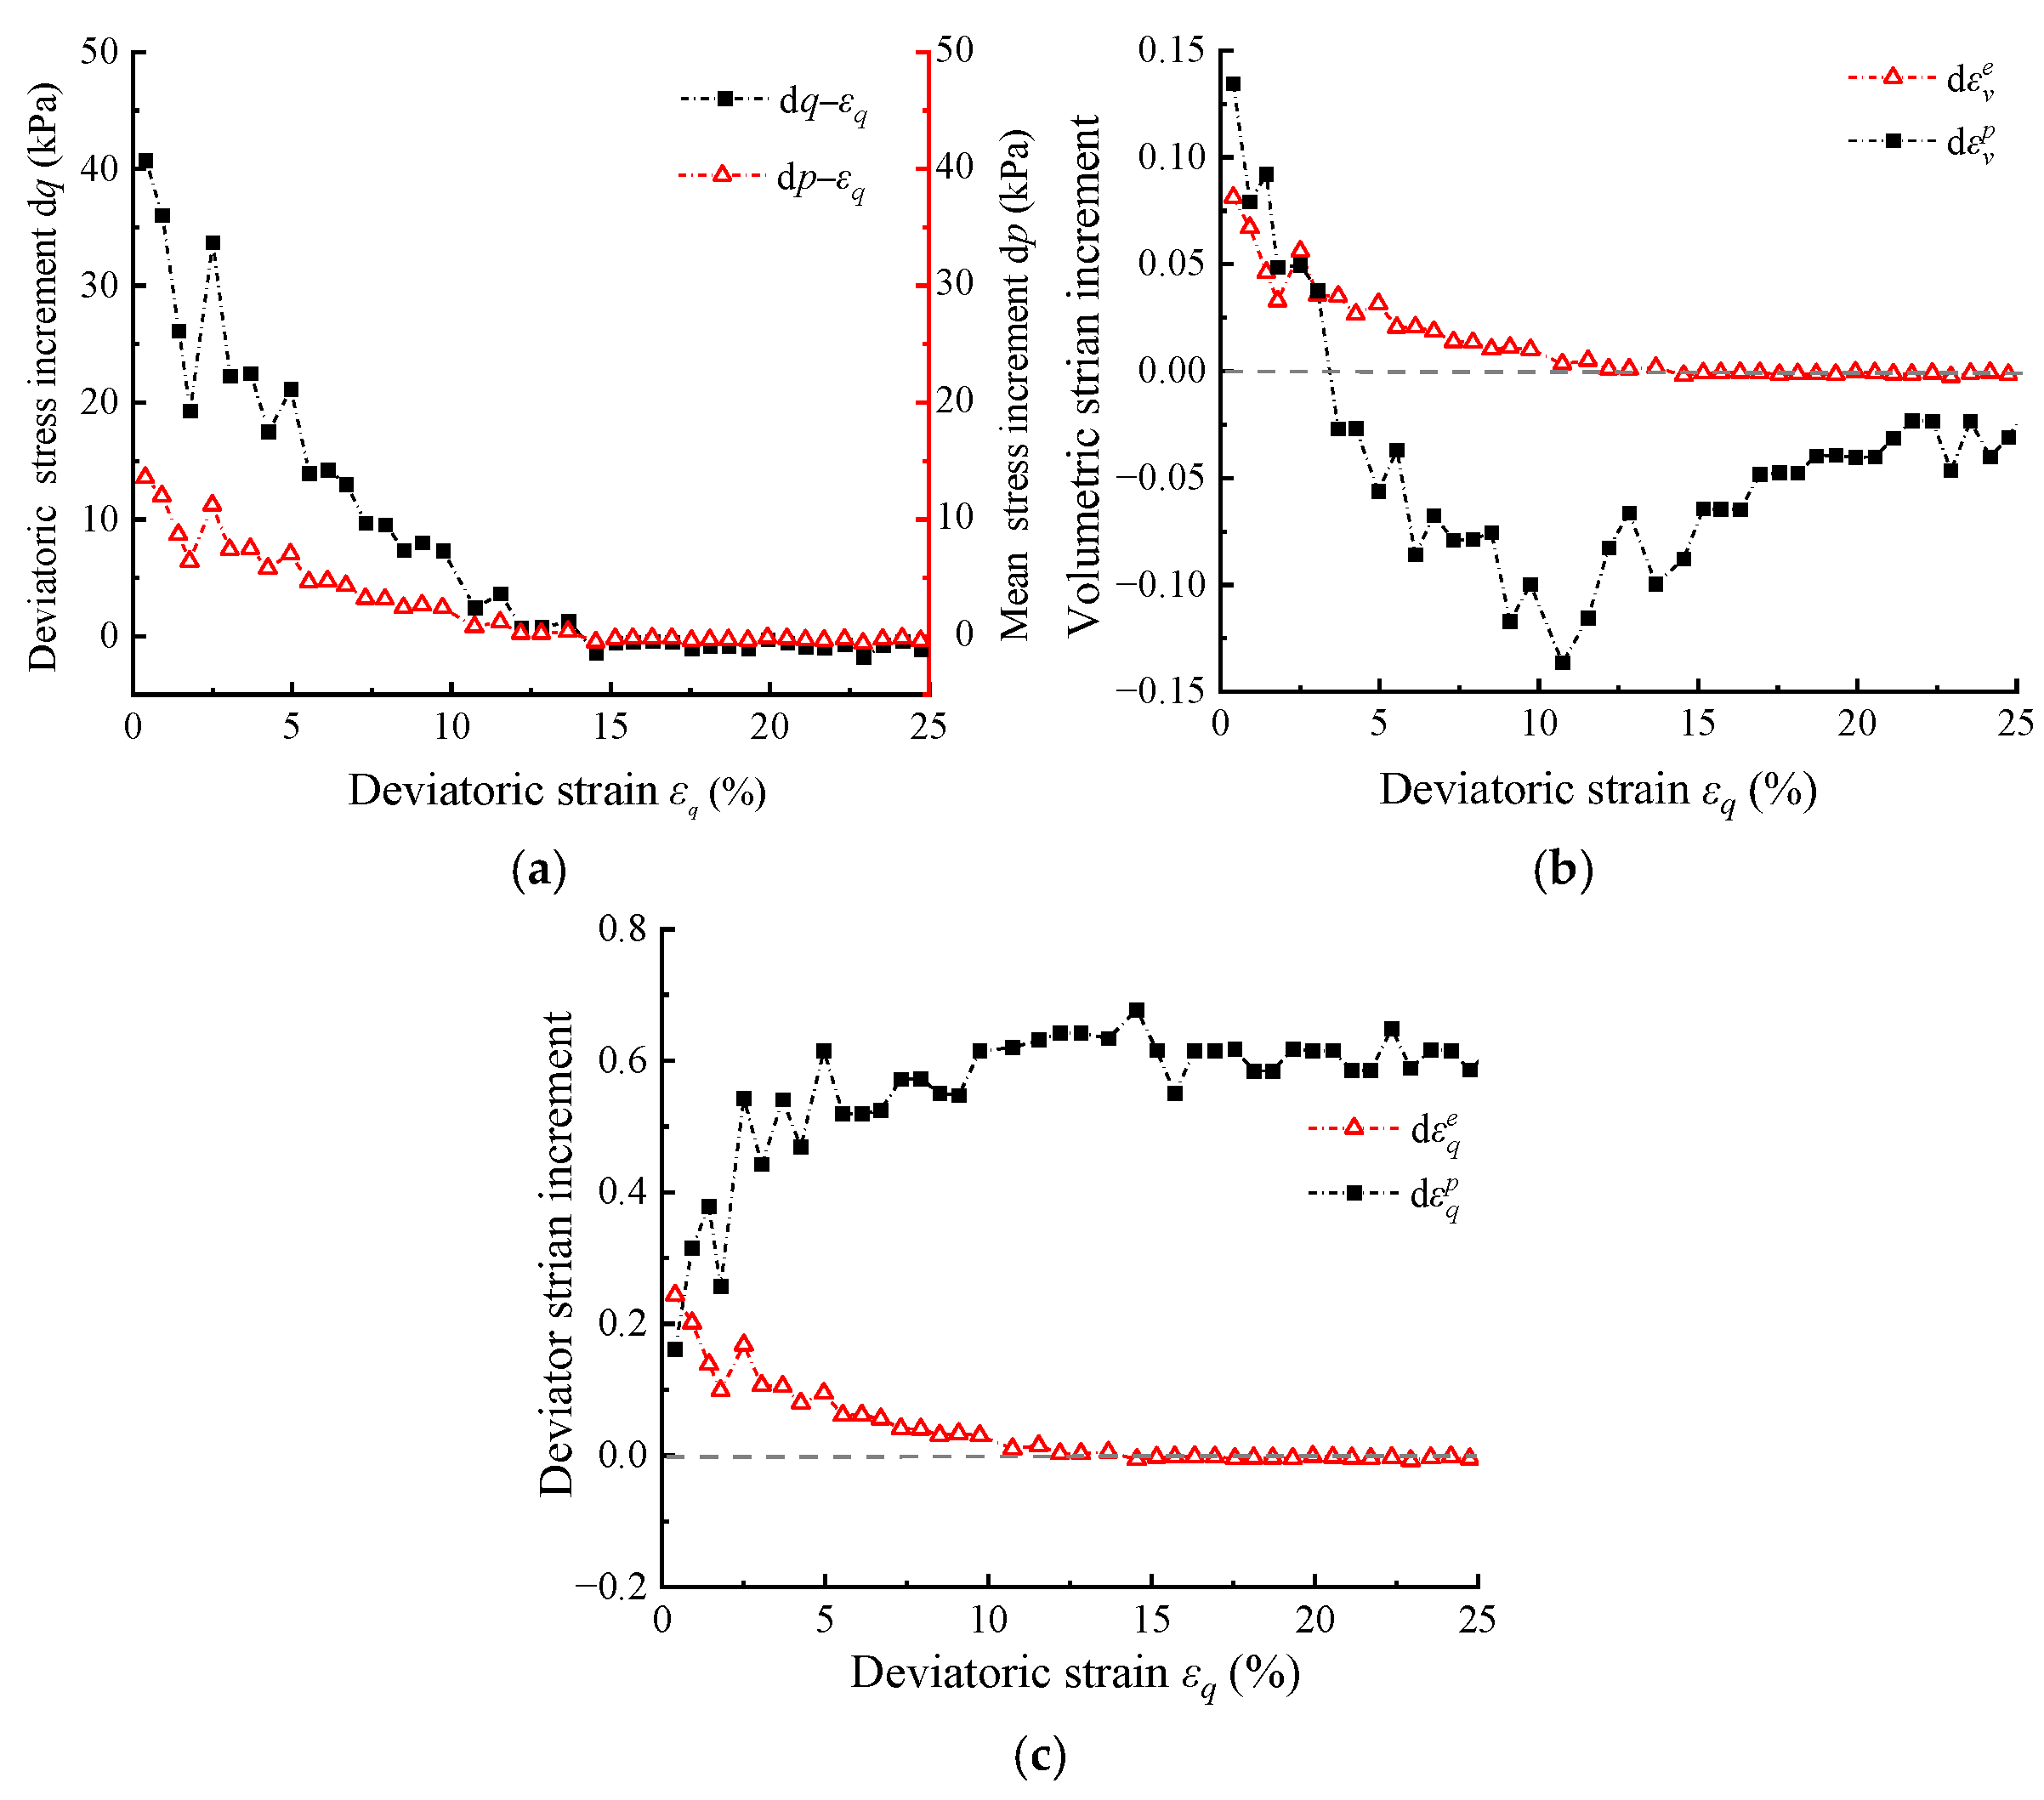
This phenomenon can be explained using Figure 5 (taking the test condition with Rc = 30% and p0 = 100 kPa as an example). As shown in Figure 5a, during stress hardening (dq > 0), the stress increments dp and dq gradually decrease with the increase of εq, and finally decrease to 0 at the peak stress ratio. These values then continue to decrease to negative values during stress softening (dq < 0), but the magnitude of the change is much lower than that during hardening. Based on Equation (3), it can be observed that the magnitudes of dp and dq determine the magnitudes of d and d. As shown in Figure 5b,c, during stress hardening, the decreasing values of dp and dq lead to a gradual reduction in d and d, resulting in an overall decreasing trend in modified relative error. The temporary increase in relative error during the early stage of hardening is caused by the temporary convergence of the d and d shown in Figure 5b, which increases the relative proportion of elastic volumetric increment and leads to a transient increase in the modified relative error. After reaching the peak stress state, dp and dq decrease to zero, resulting in zero values of modified relative error. During stress softening, dp and dq continue to decrease as negative values, but their magnitudes are smaller compared to that in stress hardening. As a result, the negative elastic deformation generated is also smaller, leading to a much smaller relative error.

Figure 5.
The relationships of stresses and strain increments with deviatoric strain: (a) dq and dp versus εq; (b) d and d versus εq; (c) d and d versus εq (taking the test condition with Rc = 30% and p0 = 100 kPa in [36] as an example).
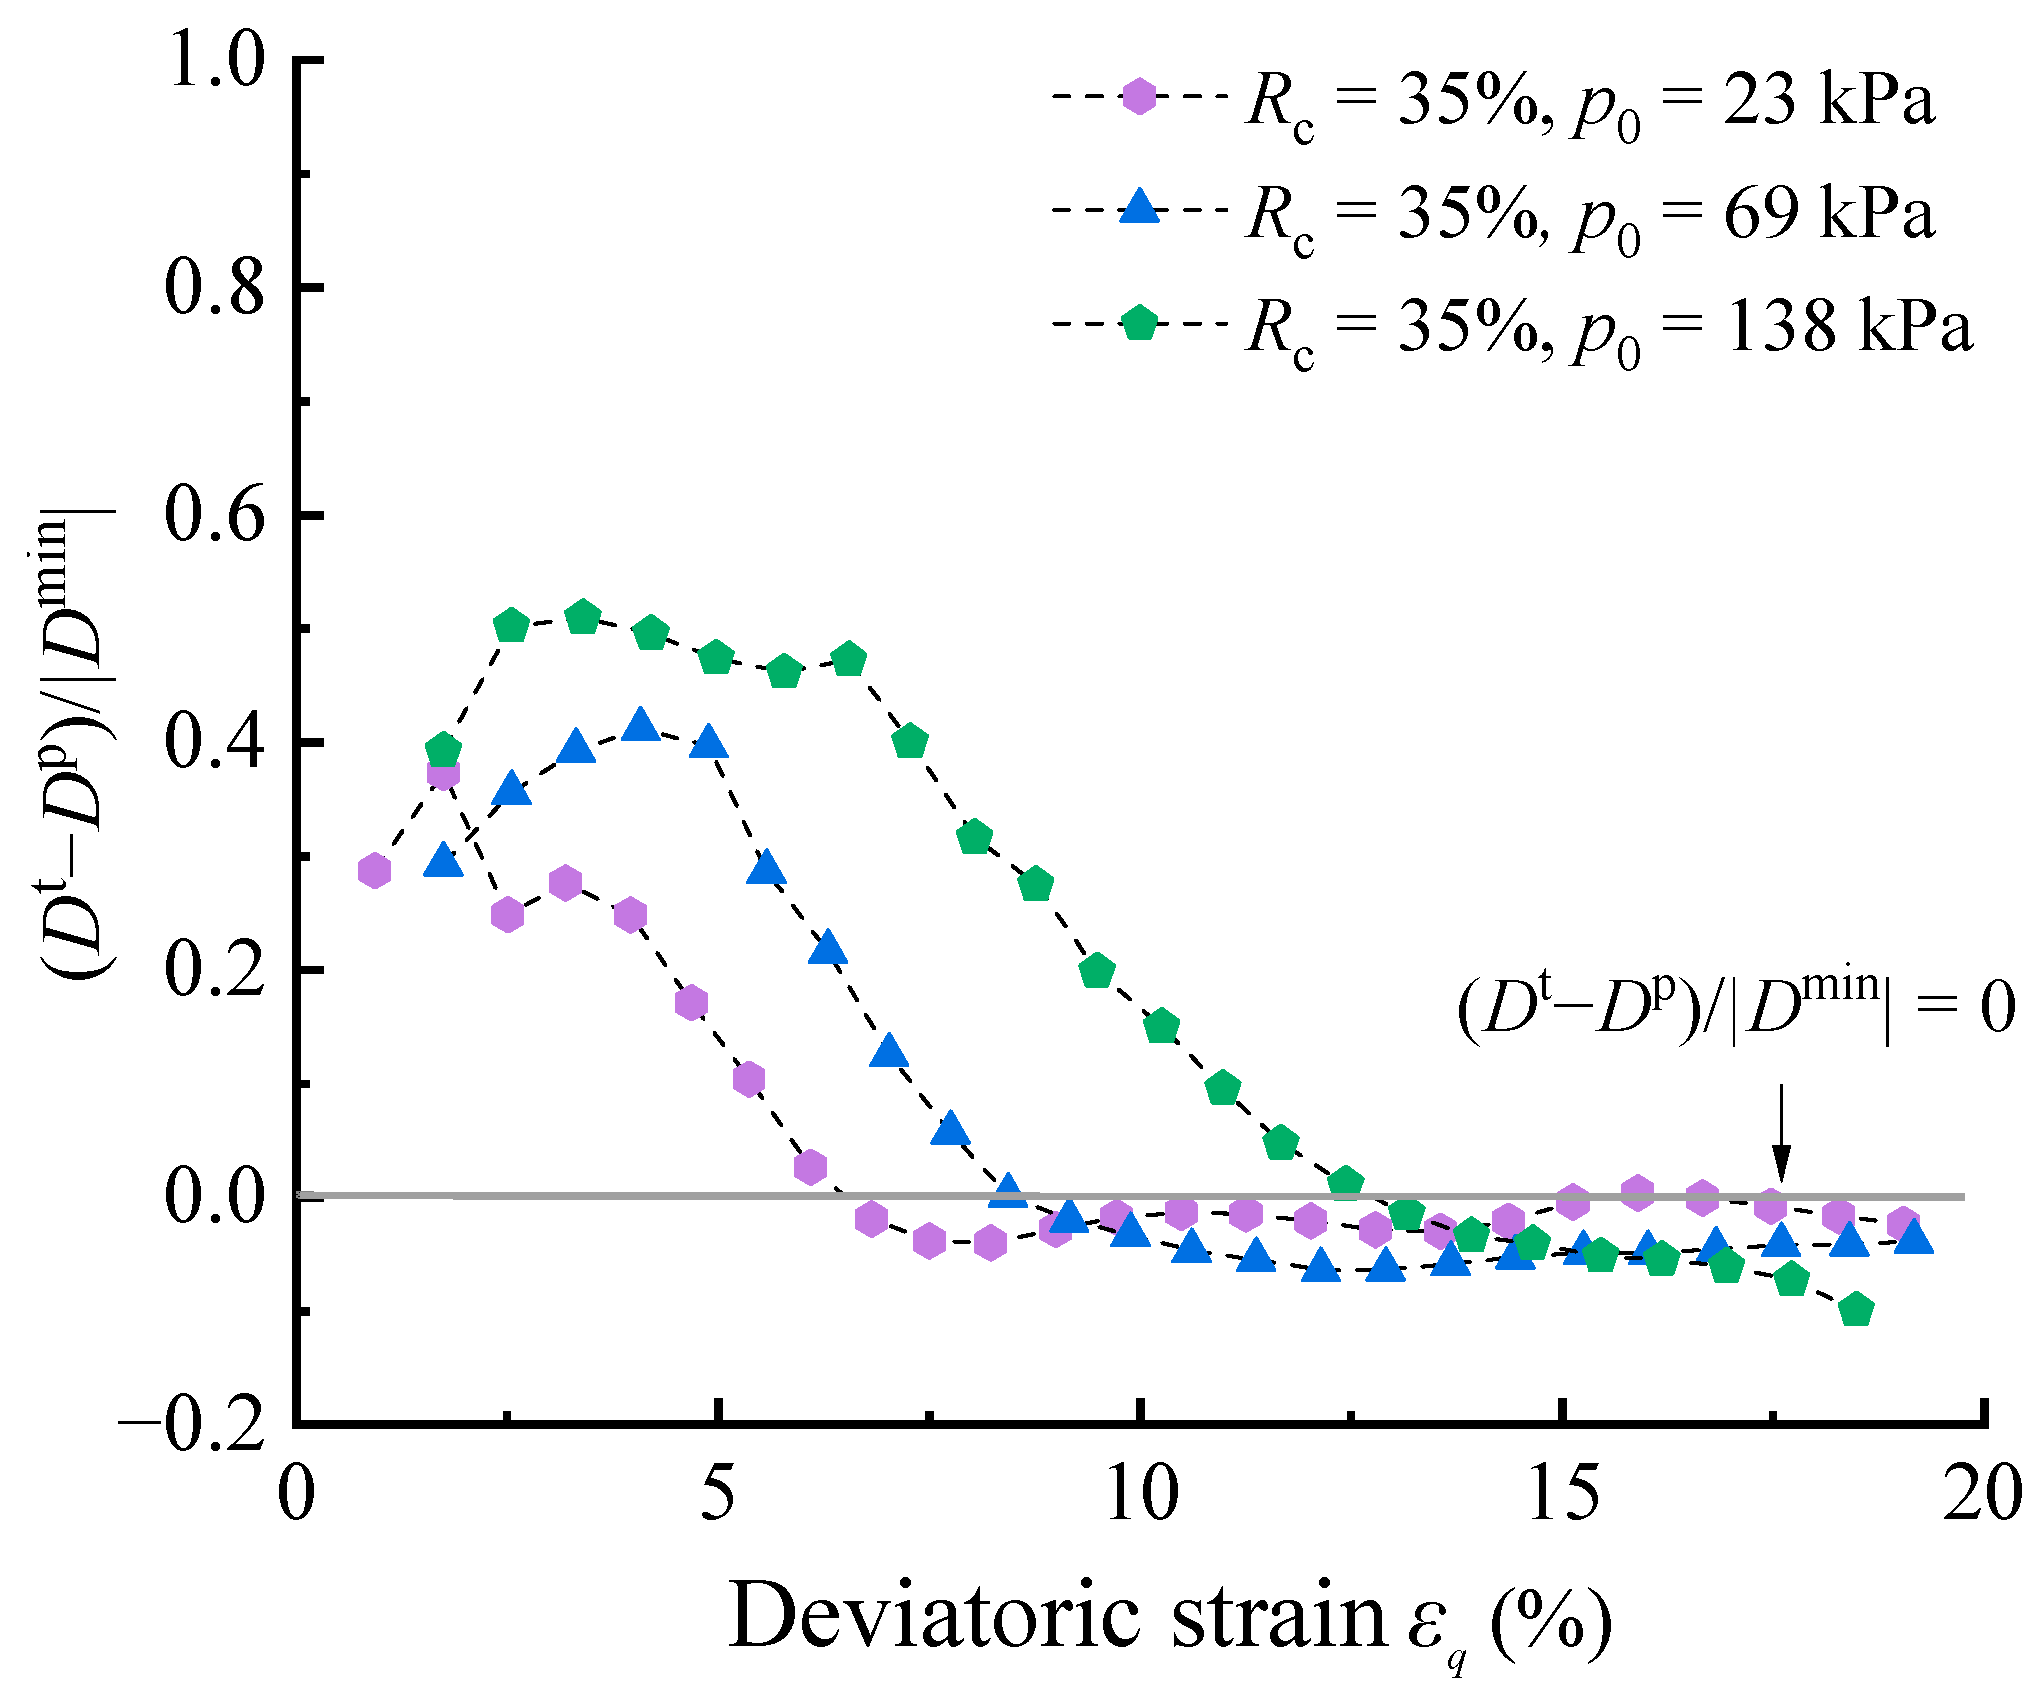
The impact of the elastic deformations in the analysis of dilatancy was further quantified using the (Dt − Dp)/|| results calculated from drained shear test data of the RCM in [37,38] with Rc = 35%. As shown in Figure 6, the experimental characteristics of the aforementioned analysis are reproducible and the errors are also at a relatively high level, which confirms the reliability of the previous conclusions.

Figure 6.
(Dt − Dp)/|| under different Rc conditions (data set needed for calculation were obtained from Mashiri et al. [38] using GetData digitization software).
4. Calibration of Dilatancy Parameters Considering Plastic
The RCM exhibits state-dependent dilatancy characteristics similar to conventional granular materials. Specifically, for the same value of η, loose specimens exhibit contraction while dense specimens exhibit dilation. Therefore, the test results of RCM have been analyzed using the state-dependent dilatancy function introduced by Li and Dafalias [24], as demonstrated in several studies (e.g., [16,17,36,39,42,44]).
where e represents Euler’s number, D0 and m are model parameters, and ψ = e − ecs is the state parameter as defined by Been and Jefferies [55]. This parameter measures the deviation of the soil state, given the current void ratio e and confining pressure p, from the critical state. The empirical formula ecs = eΓ − λc(lnp) is used instead of ecs = eΓ − λc(p/pa)ξ, which was used in [24] to depict the critical state line of RCM in their studies, where eΓ, λc are the critical state constants.
4.1. Calibration Methods for Sand
The state-dependent model was originally proposed for sand. Therefore, parameters m and D0 can be determined by neglecting the small elastic deformation of the sand in shear tests [24]. Hence:
For drained triaxial tests, the constant m can then be calibrated by Equation (9) at Dt = 0 (peak of the volumetric contraction strain [31]). Hence:
where Md is the transformation stress ratio determined at Dt = 0; ψd is the value of ψ at Dt = 0.
After m is determined, D0 can be subsequently determined by fitting the measured εq–εv curves using Equation (9) [24,31].
4.2. Calibration Methods for Highly Elastic Materials
4.2.1. Calibration of the Parameter m
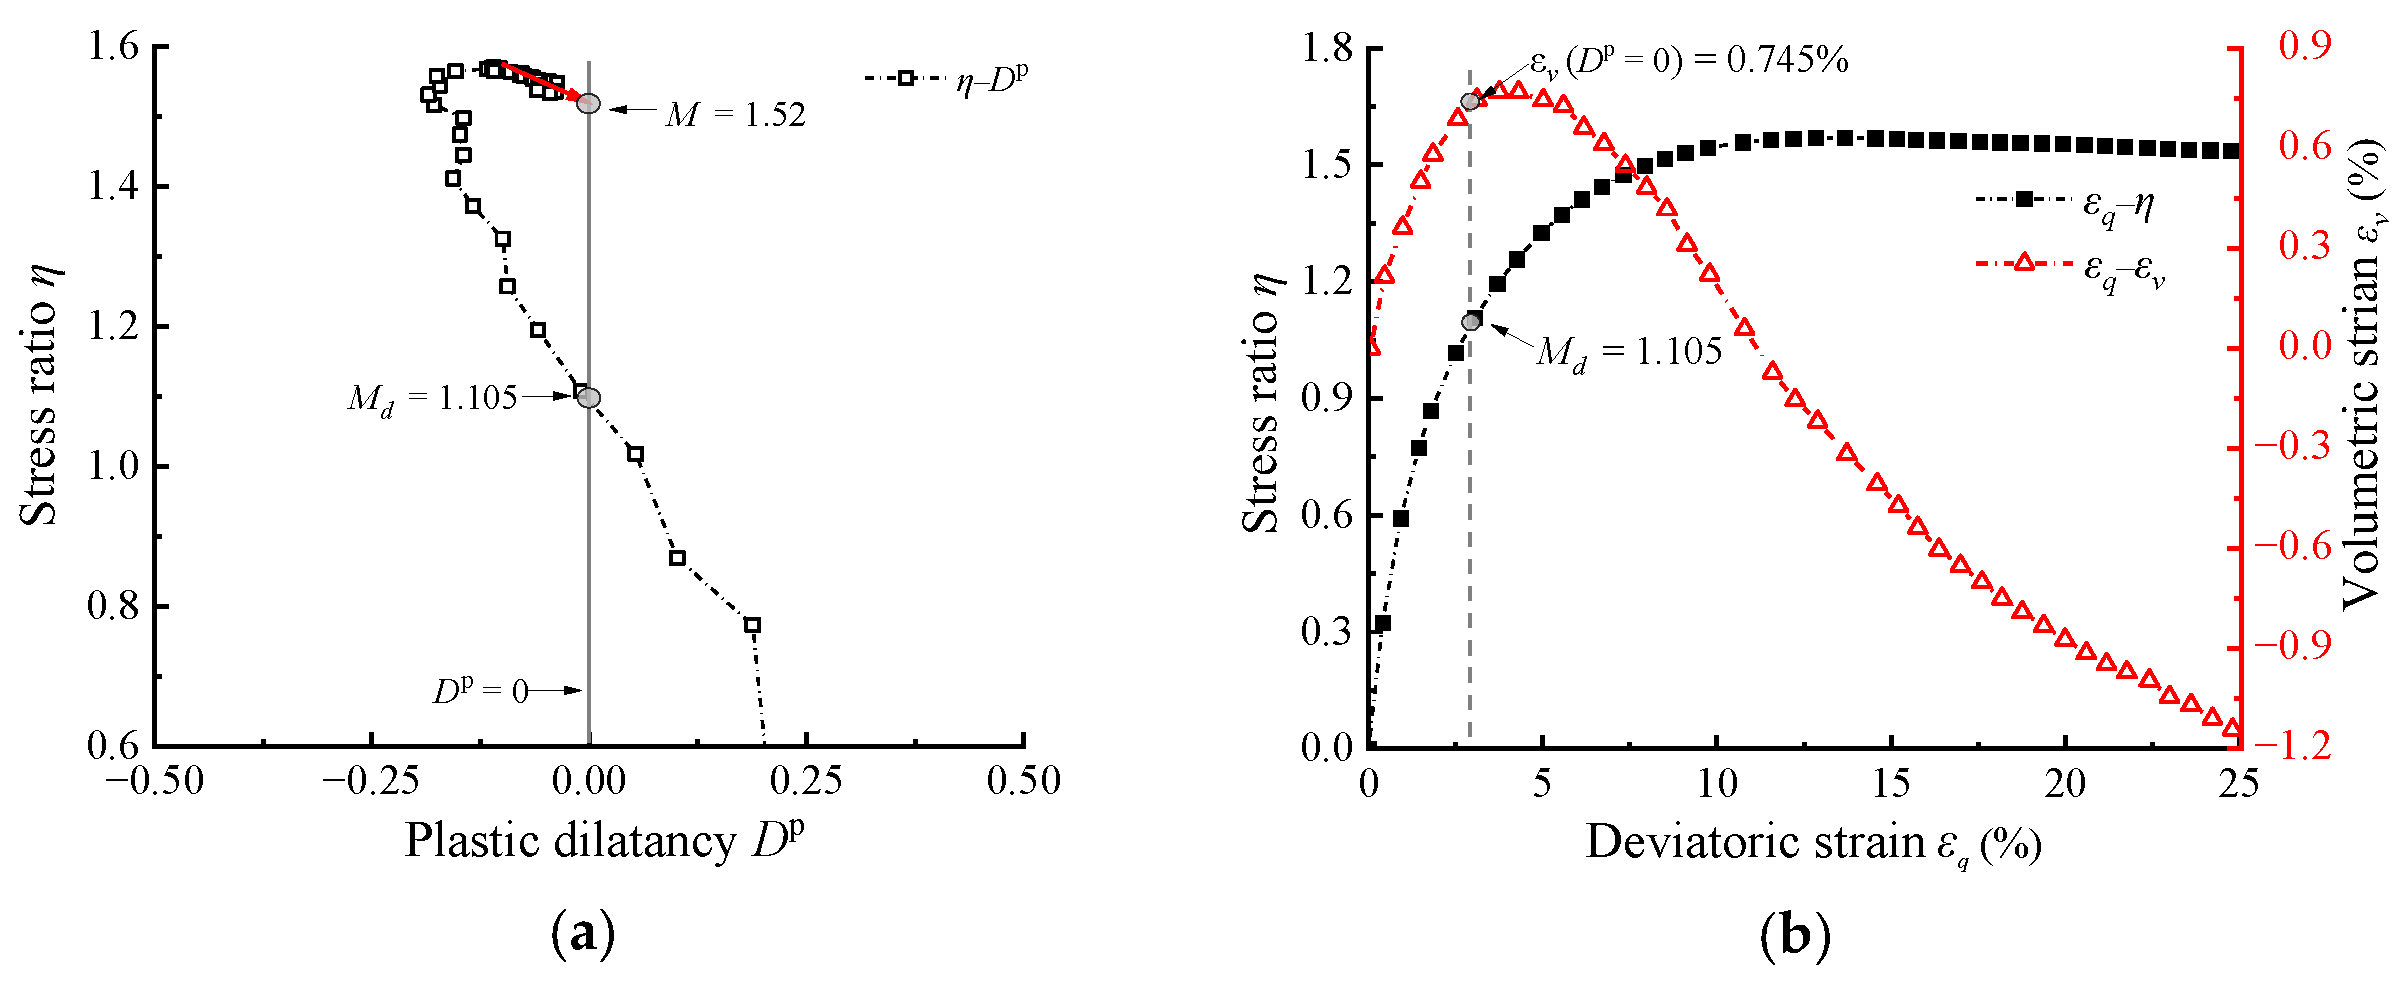
As previously mentioned, m is calculated using Md and ψd at the phase transformation state. For highly elastic RBM, previous studies have used various descriptions to define this state; e.g., the state where the Dt = dεv/dεq = 0 [36], the state where the εv reaches its minimum value [16,38,39]. In summary, these descriptions collectively indicate the location of maximum total compressive volumetric deformation (Dt = 0), which corresponds to the densest state under shear. However, the previous section of this paper has shown that using Dt = 0 will delay the phase transformation state, and overestimate Md. Therefore, a modified calibration method for m is proposed. As shown in Figure 7a, a more precise phase transformation stress Md is determined based on the η–Dp curve. Then, the deviatoric strain at the phase transformation state εq (η = Md) of the materials is determined according to the εq–η curve, as shown in Figure 7b. Subsequently, εv (η = Md) can be determined based on the εq–εv curve for converting the void ratio e (η = Md) and calculating the ψd. Finally, substituting Md and ψd determined by new method into Equation (10) yields a more precise value of m. The critical state ratio M needed for calculation in Equation (10) is determined by the extrapolation method introduced in [16,56,57]. Specifically, as indicated by the red arrow in Figure 7a, this involves linearly fitting the data near the end of the test and extrapolating it to the point where Dp = 0.
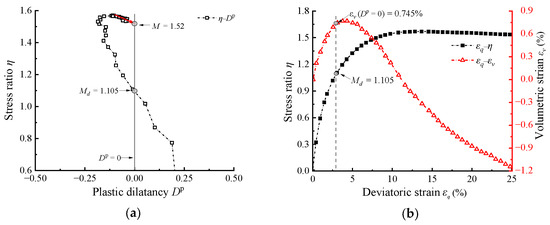
Figure 7.
Method for calibrating the parameter m of highly elastic RCM: (a) determination of the Md; (b) determination of the extreme value of plastic volumetric strain.
4.2.2. Calibration of the Parameter D0
For conventional cohesionless materials, the small elastic deformations are ignored, and parameter D0 can be determined using Equation (9). For high elastic RCM, elastic deformation can further be considered based on Equation (9). Therefore,
The parameter D0 can be subsequently determined by fitting the measured εq−εv curves using Equation (11). As shown in Figure 4, the modified relative error reaches zero at the peak strength states, indicating that there are no influences from elastic deformations. Therefore, it is also feasible to calibrate D0 using data at peak strength states, as introduced in [16,38].
5. Validation of the Parameter Calibration Methods
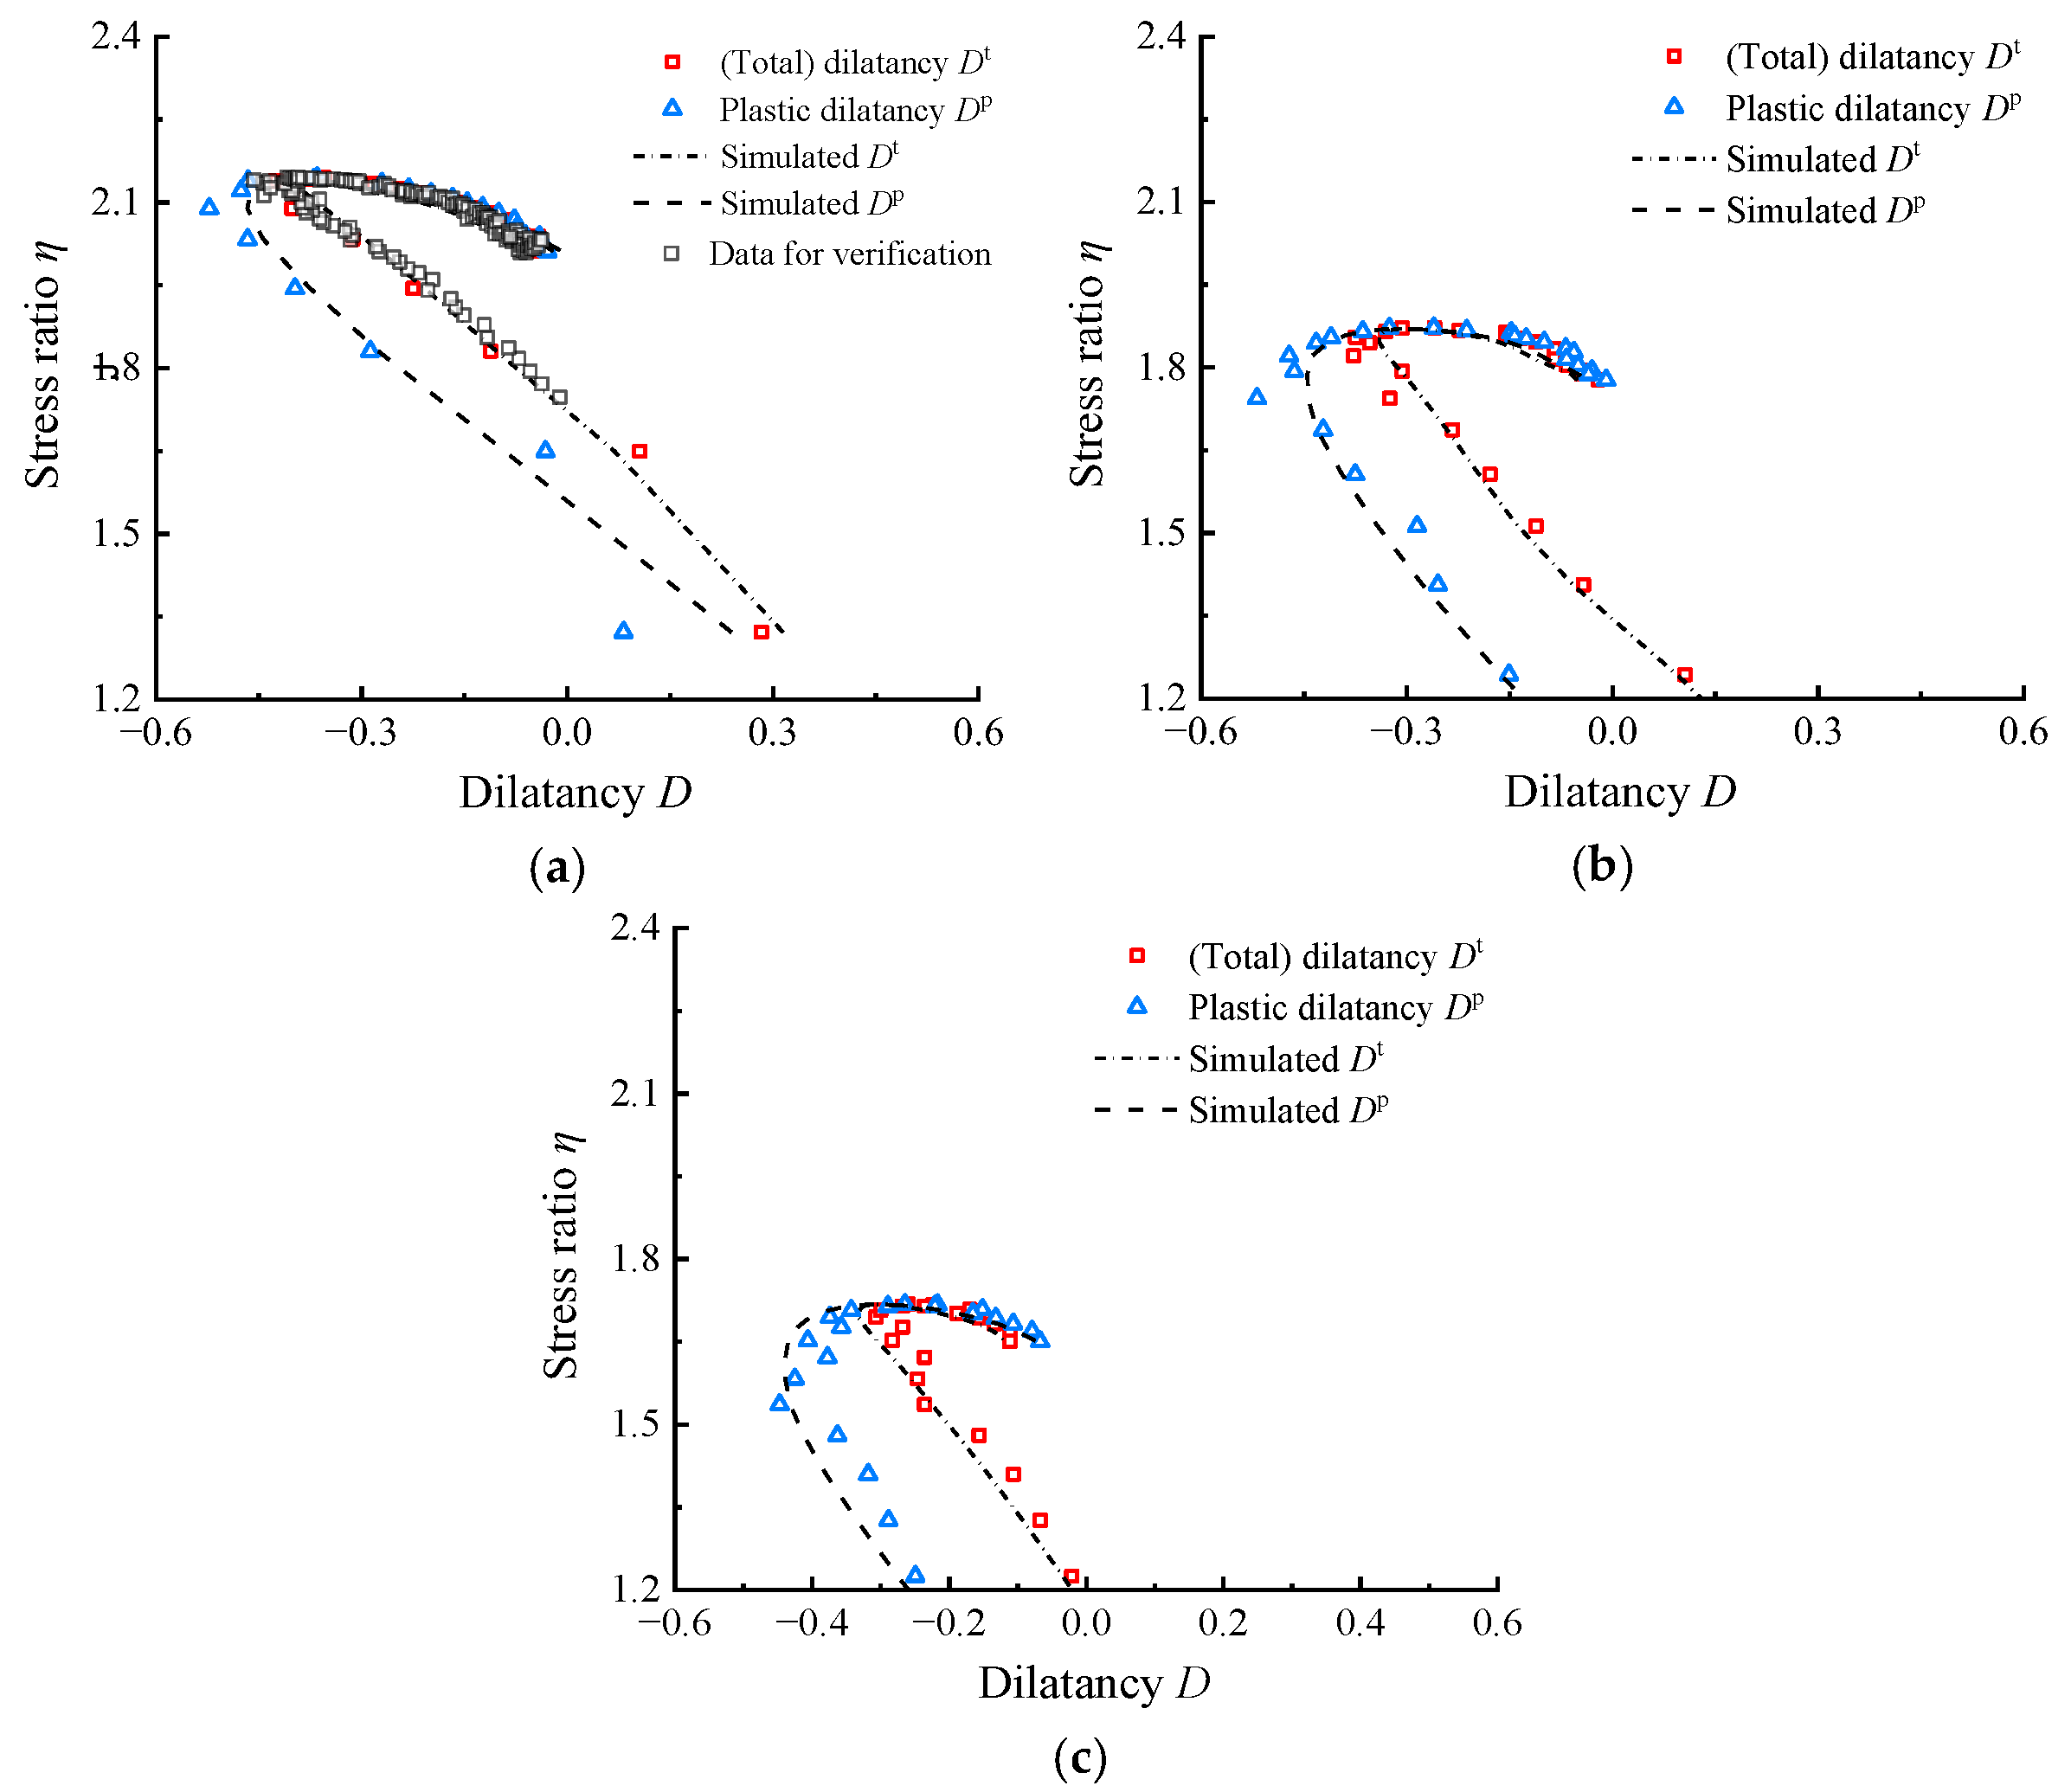
The capability of the parameter calibration method was validated using the experimental results from shear tests conducted by Youwai and Bergado [36] and Mashiri et al. [37,38]. All parameters needed for simulation are listed in Table 1 and Table 2. The elastic and critical state parameters follow the values in [36,37], the dilatancy parameters D0 and m are calibrated by the novel modified methods in this paper, and the critical state ratio M is determined by extrapolation method introduced in [16,56,57]. Figure 8 and Figure 9 compare the simulated η–Dt and η–Dp results with the experimental results from [36,38] at different Rc and p0 values, respectively. Both the η–Dt and η–Dp responses simulated using the parameters in this paper can capture the overall trend of the test results of RCM. This demonstrates the ability of model to predict the stress–dilatancy mechanical behavior of highly elastic RCM in a wide range of Rc and p0. The stress–dilatancy curves in this paper are calculated based on the limited εv,i–εq,i and εq,i–qi data set shown in the literature using GetData. To verify the reliability of the calculation, Figure 9a also compares the η–Dt curve represented by gray hollow squares in references [37,38] (The study in [37] indicates that the ratio of the rates of total deformations was used for dilatancy calculation), which was calculated and provided based on abundant original experimental data. Additionally, the positive and negative definitions of dilatancy in this paper are different to theirs, and a negative sign was added for comparison. It can be observed that, although the data points calculated in this paper are relatively few, they match the original experimental data very well, thus confirming the reliability of the calculation method used in this paper.
Table 2.
Summary of critical state and dilatancy parameters at different testing conditions.
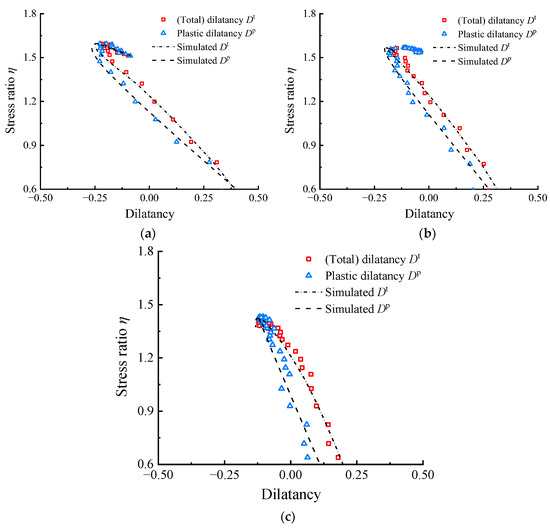
Figure 8.
Comparison of the test data and simulation results for RCM at p0 = 100 kPa with varying Rc: (a) Rc = 20%; (b) Rc = 30%; (c) Rc = 40%.
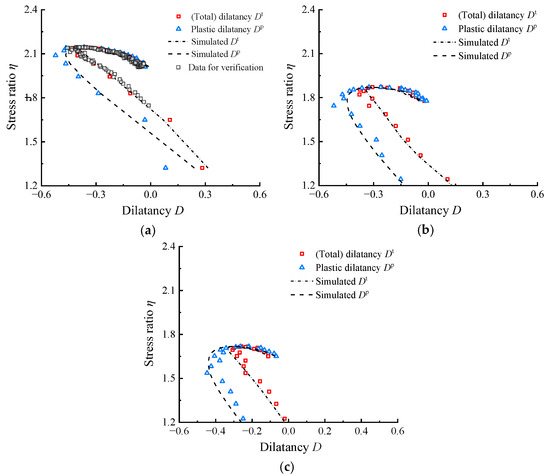
Figure 9.
Comparison of the test data and simulation results for RCM at Rc = 35% with varying p0: (a) p0 = 23 kPa; (b) p0 = 69 kPa; (c) p0 = 138 kPa (=εv,i–εq,i and εq,i–qi data set needed for calculating the η–D responses were obtained from Mashiri et al. [37,38] using GetData Graph Digitizer 2.22).
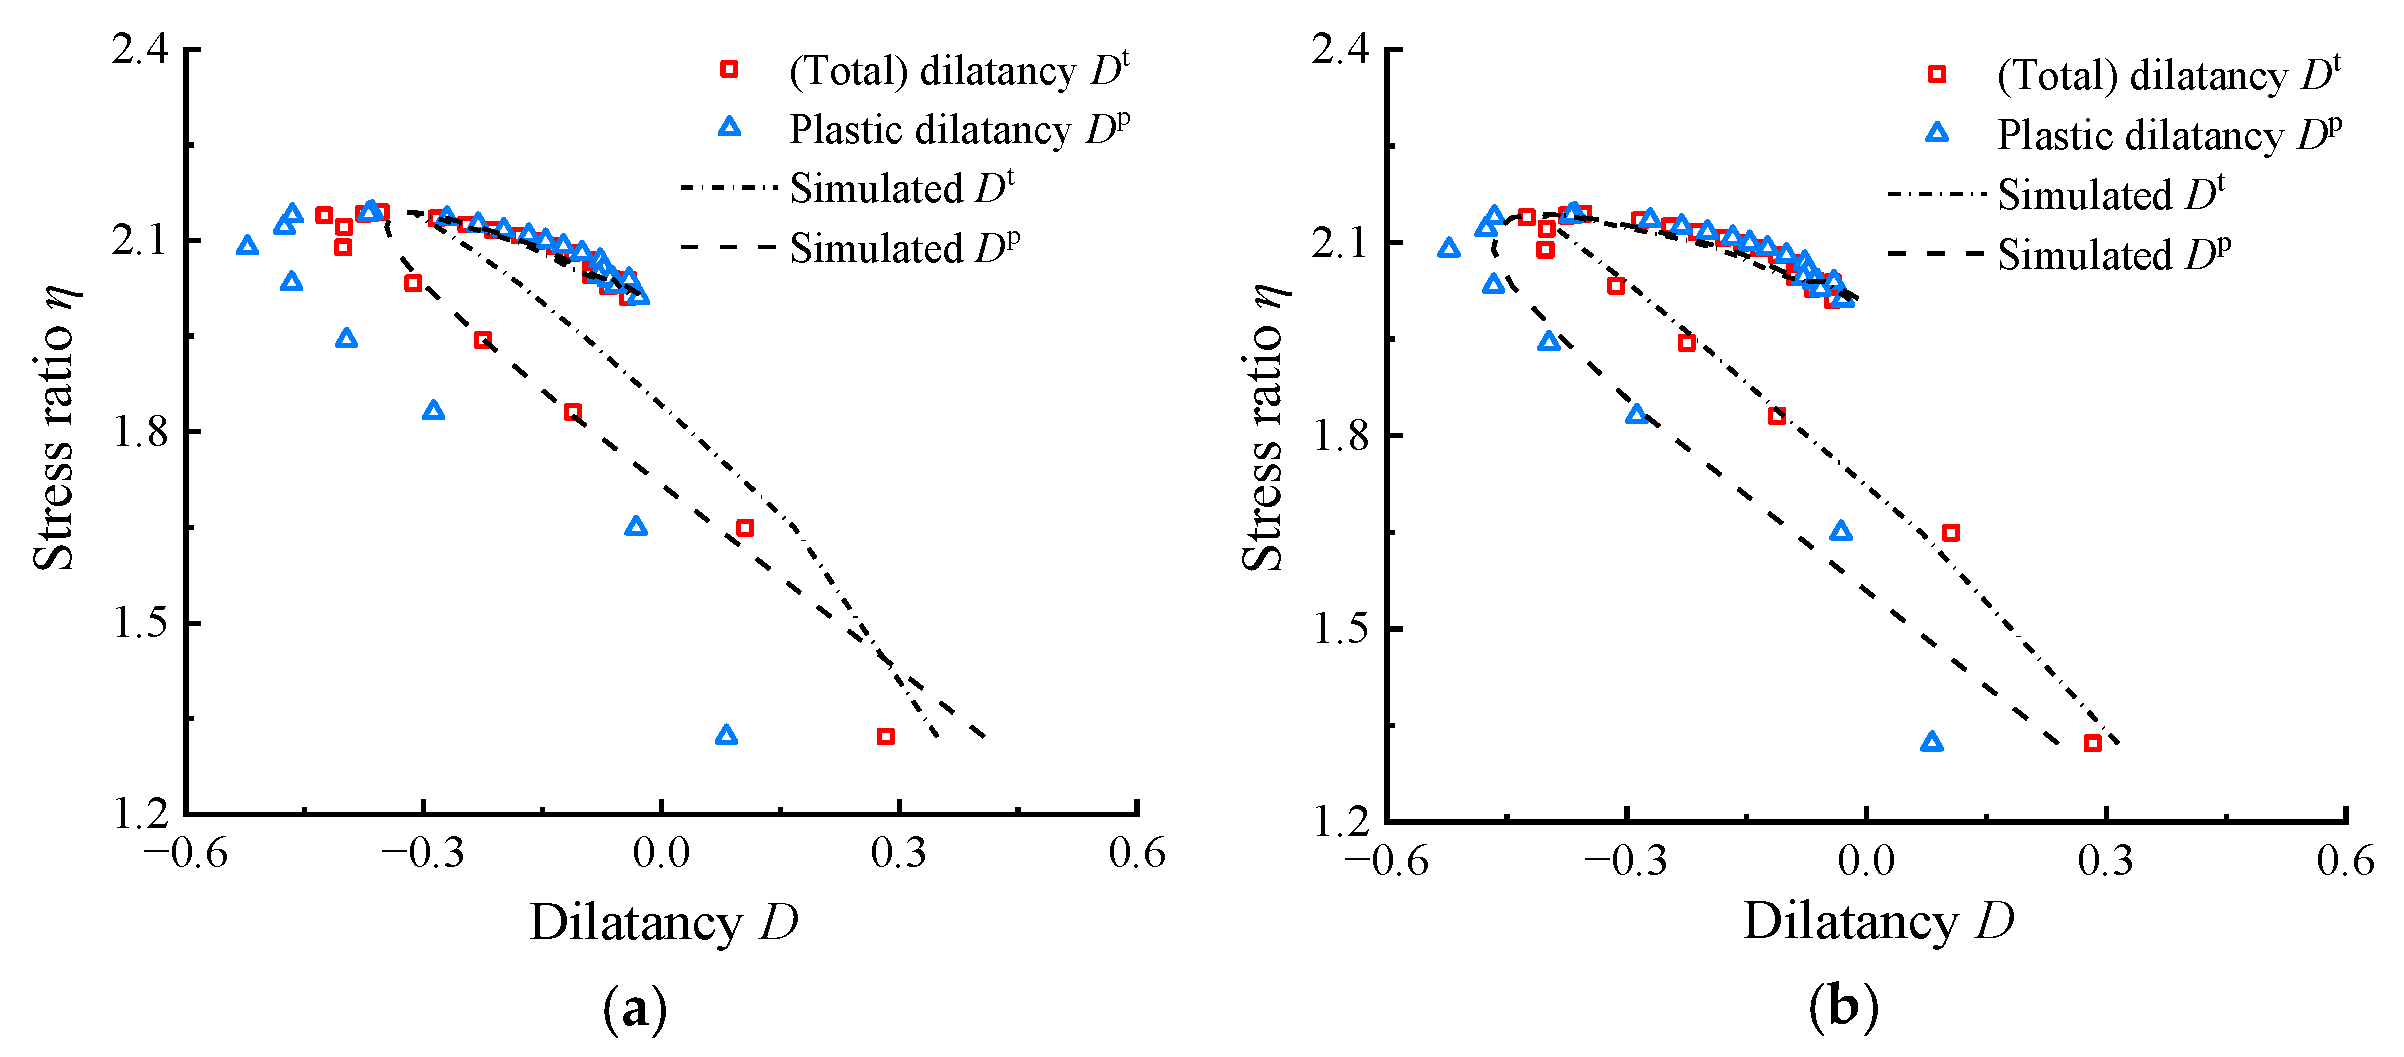
Figure 10 compares the simulation results obtained using the dilatancy parameters calibrated by the proposed method in Table 2 with those obtained using parameters calibrated by the original method. The comparison uses the test conditions with Rc = 35% and p0 = 23 kPa from [37,38] as an example, where D0 = 2.4 and m = 3.1 were determined by original method and extrapolated M. In Figure 10a, the simulated η–Dt and η–Dp curves using the parameters calibrated in this paper both exhibit good agreement with tested curves. In Figure 10b, due to the neglect of elastic deformation during parameter calibration, the simulated η–Dp matches the measured η–Dt, while the simulated η–Dt overestimates the overall contraction observed in the measured data.
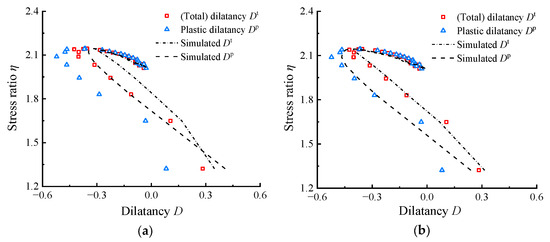
Figure 10.
Comparison of the simulation results obtained by two sets of dilatancy parameters: (a) simulations using parameters determined by original method; (b) simulations using parameters determined by modified method in this paper (using the test condition with Rc = 35% and p0 = 23 kPa in [37,38] as an example).
6. Discussion
A series of of η–Dp and η–Dt curves of RCM are compared, the errors caused by using η–Dt instead of η–Dp are quantitatively analyzed, and a novel modified method for calibrating the parameters of the state-dependent dilatancy model based on Dp is proposed. The method in this study can more precisely capture the stress–dilatancy results of highly elastic rubber-added materials compared with previous studies. However, for practical purposes, this article focuses solely on tests conducted within the commonly recommended optimal range of rubber gravity content (20–40%). In fact, there should be a smaller range of rubber content that still meets high elastic stiffness to the extent that elastic deformation can be ignored. Therefore, some experiments conducted on RCM with lower rubber content can still be further studied to enrich the possible application range of conclusions in future. In addition, RSM with different rubber–sand particle size ratios and different shape parameters should also be taken into account in the future.
7. Conclusions
To analyze the influence of highly elastic properties on the stress–dilatancy behavior of RCM, a comparative analysis between η–Dt and η–Dp is conducted, and a novel modified dilatancy model parameter calibration method specifically for these highly elastic rubber-added materials is proposed. The following main conclusions can be drawn:
- (1)
- Compared to η–Dp, the η–Dt response tends to overestimate both the phase transformation stress ratio and the reduction capacity in dilatancy for highly elastic RCM. Therefore, the η–Dp response is more suitable for the dilatancy analysis of RCM.
- (2)
- The difference between Dp and Dt increases initially with increasing deviatoric strain during the stress hardening, and subsequently decreases, eventually approaching zero at the peak stress state. During stress softening, Dp and Dt start to exhibit a difference again, but relatively smaller compared to the stress hardening. In addition, with increasing confining pressure and rubber content, the difference between Dp and Dt becomes more significant.
- (3)
- The dilatancy parameters D0 and m, calibrated by the modified method in this paper, can more precisely capture the strength–dilatancy behavior of highly elastic materials under different initial confining stresses and rubber contents.
Author Contributions
H.Z. proposed the method, analyzed the data, and plotted the figures. X.Z. validated the results and administered the project. L.L. validated the results and wrote the original manuscript. Z.J. created the visualizations and provided supervision. All authors reviewed the manuscript. All authors have read and agreed to the published version of the manuscript.
Funding
This research was funded by the National Natural Science Foundation of China (Grant no. 52308368).
Institutional Review Board Statement
Not applicable.
Informed Consent Statement
Not applicable.
Data Availability Statement
The original contributions presented in the study are included in the article; further inquiries can be directed to the corresponding author/s.
Conflicts of Interest
The authors declare no conflicts of interest.
References
- Bosscher, P.J.; Edil, T.B.; Kuraoka, S. Design of highway embankments using tire chips. J. Geotech. Geoenviron. Eng. 1997, 123, 295–304. [Google Scholar] [CrossRef]
- Yoon, S.; Prezzi, M.; Siddiki, N.Z.; Kim, B. Construction of a test embankment using a sand–tire shred mixture as fill material. Waste Manag. 2006, 26, 1033–1044. [Google Scholar] [CrossRef]
- Tandon, V.; Velazco, D.A.; Nazarian, S.; Picornell, M. Performance monitoring of embankments containing tire chips: Case study. J. Perform. Constr. Facil 2007, 21, 207–214. [Google Scholar] [CrossRef]
- Lee, J.; Salgado, R.; Bernal, A.; Lovell, C. Shredded tires and rubber-sand as lightweight backfill. J. Geotech. Geoenviron. Eng. 1999, 125, 132–141. [Google Scholar] [CrossRef]
- Ma, Y.; Ma, X.; Luan, Y.; Jiang, S.; Zhang, J. Research on key influencing factors of scrap tire-soil retaining wall. Case Stud. Constr. Mater. 2023, 19, e02277. [Google Scholar] [CrossRef]
- Tsang, H.H. Seismic isolation by rubber–soil mixtures for developing countries. Earthq. Eng. Struct. Dyn. 2008, 37, 283–303. [Google Scholar] [CrossRef]
- Wu, M.; Tian, W.; He, J.; Liu, F.; Yang, J. Seismic isolation effect of rubber-sand mixture cushion under different site classes based on a simplified analysis model. Soil Dyn. Earthq. Eng. 2023, 166, 107738. [Google Scholar] [CrossRef]
- Tafreshi, S.M.; Amiri, A.; Dawson, A. Sustainable use of End-of-Life-Tires (ELTs) in a vibration isolation system. Constr. Build. Mater. 2023, 405, 133316. [Google Scholar] [CrossRef]
- Liu, F.; Wang, J.; Zhou, B.; Wu, M.; He, J.; Bin, J. Shaking table study on rubber-sand mixture cored composite block as low-cost isolation bearing for rural houses. J. Build. Eng. 2023, 76, 107413. [Google Scholar] [CrossRef]
- Zhou, E.; Yao, Y.; Cui, L.; Wang, L.; Zuo, X. Dynamic properties of silty sand mixed with rubber particles for medium strain. Int. J. Civ. Eng. 2023, 21, 1867–1878. [Google Scholar] [CrossRef]
- Zhou, E.; Bai, Y.; Zuo, X. Evaluation of dynamic behaviour of rubber particle-clay mixtures using the skeleton void ratio approach. Constr. Build. Mater. 2024, 426, 136127. [Google Scholar] [CrossRef]
- Zhou, E.; Wang, Q. Experimental Investigation on Shear Strength and Liquefaction Potential of Rubber-Sand Mixtures. Adv. Civ. Eng. 2019, 2019, 5934961. [Google Scholar]
- Warith, M.; Evgin, E.; Benson, P. Suitability of shredded tires for use in landfill leachate collection systems. Waste Manag. 2004, 24, 967–979. [Google Scholar] [CrossRef]
- Kaushik, M.; Kumar, A.; Bansal, A. Performance assessment of tire chips–gravel mixes as leachate drainage layer material. Int. J. Geotech. Eng. 2015, 9, 453–470. [Google Scholar] [CrossRef]
- Adesokan, D.; Fleming, I.; Hammerlindl, A. One-dimensional (1D) immediate compression and creep in large particle-sized tire-derived aggregate (TDA) for leachate collection and removal systems (LCRSs). Can. Geotech. J. 2021, 58, 982–994. [Google Scholar] [CrossRef]
- Qi, Y.J.; Indraratna, B.; Vinod, J.S. Behavior of Steel Furnace Slag, Coal Wash, and Rubber Crumb Mixtures with Special Relevance to Stress-Dilatancy Relation. J. Mater. Civ. Eng. 2018, 30, 04018276. [Google Scholar] [CrossRef]
- Qi, Y.J.; Indraratna, B.; Coop, M.R. Predicted Behavior of Saturated Granular Waste Blended with Rubber Crumbs. Int. J. Geomech. 2019, 19, 04019079. [Google Scholar] [CrossRef]
- Indraratna, B.; Malisetty, R.S.; Arachchige, C.; Qi, Y.; Rujikiatkamjorn, C. Sustainable Performance of Recycled Rubber and Mining Waste Utilized for Efficient Rail Infrastructure. Indian Geotech. J. 2024, 54, 1738–1750. [Google Scholar] [CrossRef]
- Disfani, M.M.; Tsang, H.-H.; Arulrajah, A.; Yaghoubi, E. Shear and compression characteristics of recycled glass-tire mixtures. J. Mater. Civ. Eng. 2017, 29, 06017003. [Google Scholar] [CrossRef]
- Phan, T.M.; Ma, H.-J.; Park, D.-W. Evaluation on performance of rubber tire powder and waste glass modified binder as crack filling materials using 3D printing technology. Constr. Build. Mater. 2024, 416, 135225. [Google Scholar] [CrossRef]
- Gerges, N.; Issa, C.A.; Antoun, M.; Sleiman, E.; Hallal, F.; Shamoun, P.; Hayek, J. Eco-friendly mortar: Optimum combination of wood ash, crumb rubber, and fine crushed glass. Case Stud. Constr. Mater. 2021, 15, e00588. [Google Scholar] [CrossRef]
- Yao, T.; Han, X.; Li, B.; Guo, F.; Ji, H.; Ai, C.; Han, S. Development of polyurethane urea (PUU)-waste rubber particles (WRP) composite materials for active ice-breaking of groove-filled asphalt pavement. Case Stud. Constr. Mater. 2024, 21, e03617. [Google Scholar] [CrossRef]
- Tasalloti, A.; Chiaro, G.; Murali, A.; Banasiak, L. Physical and mechanical properties of granulated rubber mixed with granular soils—a literature review. Sustainability 2021, 13, 4309. [Google Scholar] [CrossRef]
- Li, X.S.; Dafalias, Y.F. Dilatancy for cohesionless soils. Géotechnique 2000, 50, 449–460. [Google Scholar] [CrossRef]
- Rowe, P.W. The stress-dilatancy relation for static equilibrium of an assembly of particles in contact. Proc. R. Soc. London Ser. A Math. Phys. Sci. 1962, 269, 500–527. [Google Scholar] [CrossRef]
- Chiu, C.; Ng, C.W.W. A state-dependent elasto-plastic model for saturated and unsaturated soils. Géotechnique 2003, 53, 809–829. [Google Scholar] [CrossRef]
- Nova, R.; Wood, D.M. A constitutive model for sand in triaxial compression. Int. J. Numer. Anal. Methods Geomech. 1979, 3, 255–278. [Google Scholar] [CrossRef]
- Wood, D.M. Soil Behaviour and Critical State Soil Mechanics; Cambridge University Press: Cambridge, UK, 1990. [Google Scholar]
- Zhang, H.; Zhang, X. A state-dependent dilatancy model for cemented sand. Comput. Geotech. 2024, 173, 106527. [Google Scholar] [CrossRef]
- Singh, S.; Kandasami, R.K.; Murthy, T.G.; Coop, M.R. On the modelling of stress-dilatancy behavior in weakly cemented sands. Soils Found. 2023, 63, 101328. [Google Scholar] [CrossRef]
- Taiebat, M.; Dafalias, Y.F. SANISAND: Simple anisotropic sand plasticity model. Int. J. Numer. Anal. Methods Geomech. 2008, 32, 915–948. [Google Scholar] [CrossRef]
- Yu, H.; Shen, X.-m.; Ye, Y.-c.; Yang, J.; Zhu, C.-h. Large-scale triaxial tests on dilatancy characteristics of lean cemented sand and gravel. Front. Earth Sci. 2021, 9, 799215. [Google Scholar] [CrossRef]
- Been, K.; Jefferies, M. Stress-dilatancy in very loose sand. Can. Geotech. J. 2004, 41, 972–989. [Google Scholar] [CrossRef]
- Szypcio, Z. Stress-dilatancy for soils. Part I: The frictional state theory. Stud. Geotech. Et Mech. 2016, 38, 51–57. [Google Scholar] [CrossRef]
- Jefferies, M. On the fundamental nature of the state parameter. Géotechnique 2022, 72, 1082–1091. [Google Scholar] [CrossRef]
- Youwai, S.; Bergado, D.T. Strength and deformation characteristics of shredded rubber tire sand mixtures. Can. Geotech. J. 2003, 40, 254–264. [Google Scholar] [CrossRef]
- Mashiri, M.S. Monotonic and cyclic behaviour of sand-tyre chip (STCh) mixtures. Ph.D. Thesis, University of Wollongong, Wollongong, NSW, Australia, 2014. [Google Scholar]
- Mashiri, M.; Vinod, J.; Sheikh, M.N.; Tsang, H.-H. Shear strength and dilatancy behaviour of sand–tyre chip mixtures. Soils Found. 2015, 55, 517–528. [Google Scholar] [CrossRef]
- Mashiri, M.S.; Vinod, J.S.; Sheikh, M.N. Constitutive Model for Sand-Tire Chip Mixture. Int. J. Geomech. 2016, 16, 04015022. [Google Scholar] [CrossRef]
- Rouhanifar, S.; Afrazi, M.; Fakhimi, A.; Yazdani, M. Strength and deformation behaviour of sand-rubber mixture. Int. J. Geotech. Eng. 2021, 15, 1078–1092. [Google Scholar] [CrossRef]
- Noorzad, R.; Raveshi, M. Mechanical behavior of waste tire crumbs–sand mixtures determined by triaxial tests. Geotech. Geol. Eng. 2017, 35, 1793–1802. [Google Scholar] [CrossRef]
- Tawk, M.; Indraratna, B. Role of rubber crumbs on the stress-strain response of a coal wash matrix. J. Mater. Civ. Eng. 2021, 33, 04020480. [Google Scholar] [CrossRef]
- Arachchige, C.M.K. Experimental and Numerical Study of Rubber Intermixed Ballast System Subjected to Monotonic and Cyclic Loading. Ph.D. Thesis, University of Technology Sydney (Australia), Sydney, Australia, 2022. [Google Scholar]
- Zhang, J.-Q.; Wang, X.; Yin, Z.-Y. DEM-based study on the mechanical behaviors of sand-rubber mixture in critical state. Constr. Build. Mater. 2023, 370, 130603. [Google Scholar] [CrossRef]
- Szypcio, Z.; Dolzyk-Szypcio, K.; Nurgaliyev, A. Stress-dilatancy relationship of sand-rubber mixtures. IOP Conf. Ser. Mater. Sci. Eng. 2022, 1260, 012003. [Google Scholar] [CrossRef]
- Anastasiadis, A.; Senetakis, K.; Pitilakis, K. Small-strain shear modulus and damping ratio of sand-rubber and gravel-rubber mixtures. Geotech. Geol. Eng. 2012, 30, 363–382. [Google Scholar] [CrossRef]
- Lee, J.-S.; Dodds, J.; Santamarina, J.C. Behavior of rigid-soft particle mixtures. J. Mater. Civ. Eng. 2007, 19, 179–184. [Google Scholar] [CrossRef]
- Fu, R.; Yang, B.; Hu, X.; Zhou, B.; Coop, M.R. A micromechanical investigation of sand–rubber mixtures using the discrete element method. Eng. Geol. 2023, 318, 107106. [Google Scholar] [CrossRef]
- Zornberg, J.G.; Cabral, A.R.; Viratjandr, C. Behaviour of tire shred sand mixtures. Can. Geotech. J. 2004, 41, 227–241. [Google Scholar] [CrossRef]
- Bali Reddy, S.; Pradeep Kumar, D.; Murali Krishna, A. Evaluation of the optimum mixing ratio of a sand-tire chips mixture for geoengineering applications. J. Mater. Civ. Eng. 2016, 28, 06015007. [Google Scholar] [CrossRef]
- Hataf, N.; Rahimi, M. Experimental investigation of bearing capacity of sand reinforced with randomly distributed tire shreds. Constr. Build. Mater. 2006, 20, 910–916. [Google Scholar] [CrossRef]
- Richart, F.E.; Hall, J.R.; Woods, R.D. Vibrations of Soils and Foundations; Prentice-Hall: Hoboken, NJ, USA, 1970. [Google Scholar]
- Beer, F.P.; Johnston, E.R.; DeWolf, J.T.; Mazurek, D.F.; Sanghi, S. Mechanics of Materials; Mcgraw-Hill New York: New York, NY, USA, 1992; Volume 1. [Google Scholar]
- Ishihara, K. Soil Behaviour in Earthquake Geotechnics; Oxford University Press: Oxford, UK, 1996. [Google Scholar]
- Been, K.; Jefferies, M.G.; Hachey, J. The critical state of sands. Geotechnique 1991, 41, 365–381. [Google Scholar] [CrossRef]
- Wagner, A.C.; de Sousa Silva, J.P.; de Azambuja Carvalho, J.V.; Rissoli, A.L.C.; Cacciari, P.P.; Chaves, H.M.; Scheuermann Filho, H.C.; Consoli, N.C. Mechanical behavior of iron ore tailings under standard compression and extension triaxial stress paths. J. Rock Mech. Geotech. Eng. 2023, 15, 1883–1894. [Google Scholar] [CrossRef]
- Ferreira, P.; Bica, A. Problems in identifying the effects of structure and critical state in a soil with a transitional behaviour. Géotechnique 2006, 56, 445–454. [Google Scholar] [CrossRef]

Disclaimer/Publisher’s Note: The statements, opinions and data contained in all publications are solely those of the individual author(s) and contributor(s) and not of MDPI and/or the editor(s). MDPI and/or the editor(s) disclaim responsibility for any injury to people or property resulting from any ideas, methods, instructions or products referred to in the content. |
© 2024 by the authors. Licensee MDPI, Basel, Switzerland. This article is an open access article distributed under the terms and conditions of the Creative Commons Attribution (CC BY) license (https://creativecommons.org/licenses/by/4.0/).