Author Contributions
Conceptualization, X.C.; Methodology, R.J. and C.T.; Software, R.J. and C.L.; Validation, C.L.; Formal analysis, Y.L. and C.T.; Investigation, Y.L.; Resources, Y.L. and C.T.; Data curation, C.T.; Writing—original draft, R.J. and X.C.; Writing—review & editing, X.C.; Funding acquisition, X.C. All authors have read and agreed to the published version of the manuscript.
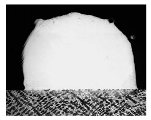
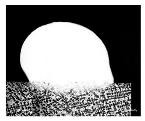
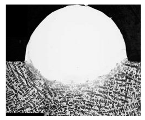
Figure 1.
Microstructure of Fe60 alloy powder.
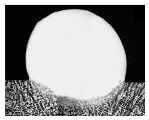
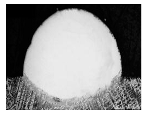
Figure 1.
Microstructure of Fe60 alloy powder.
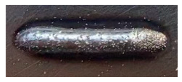
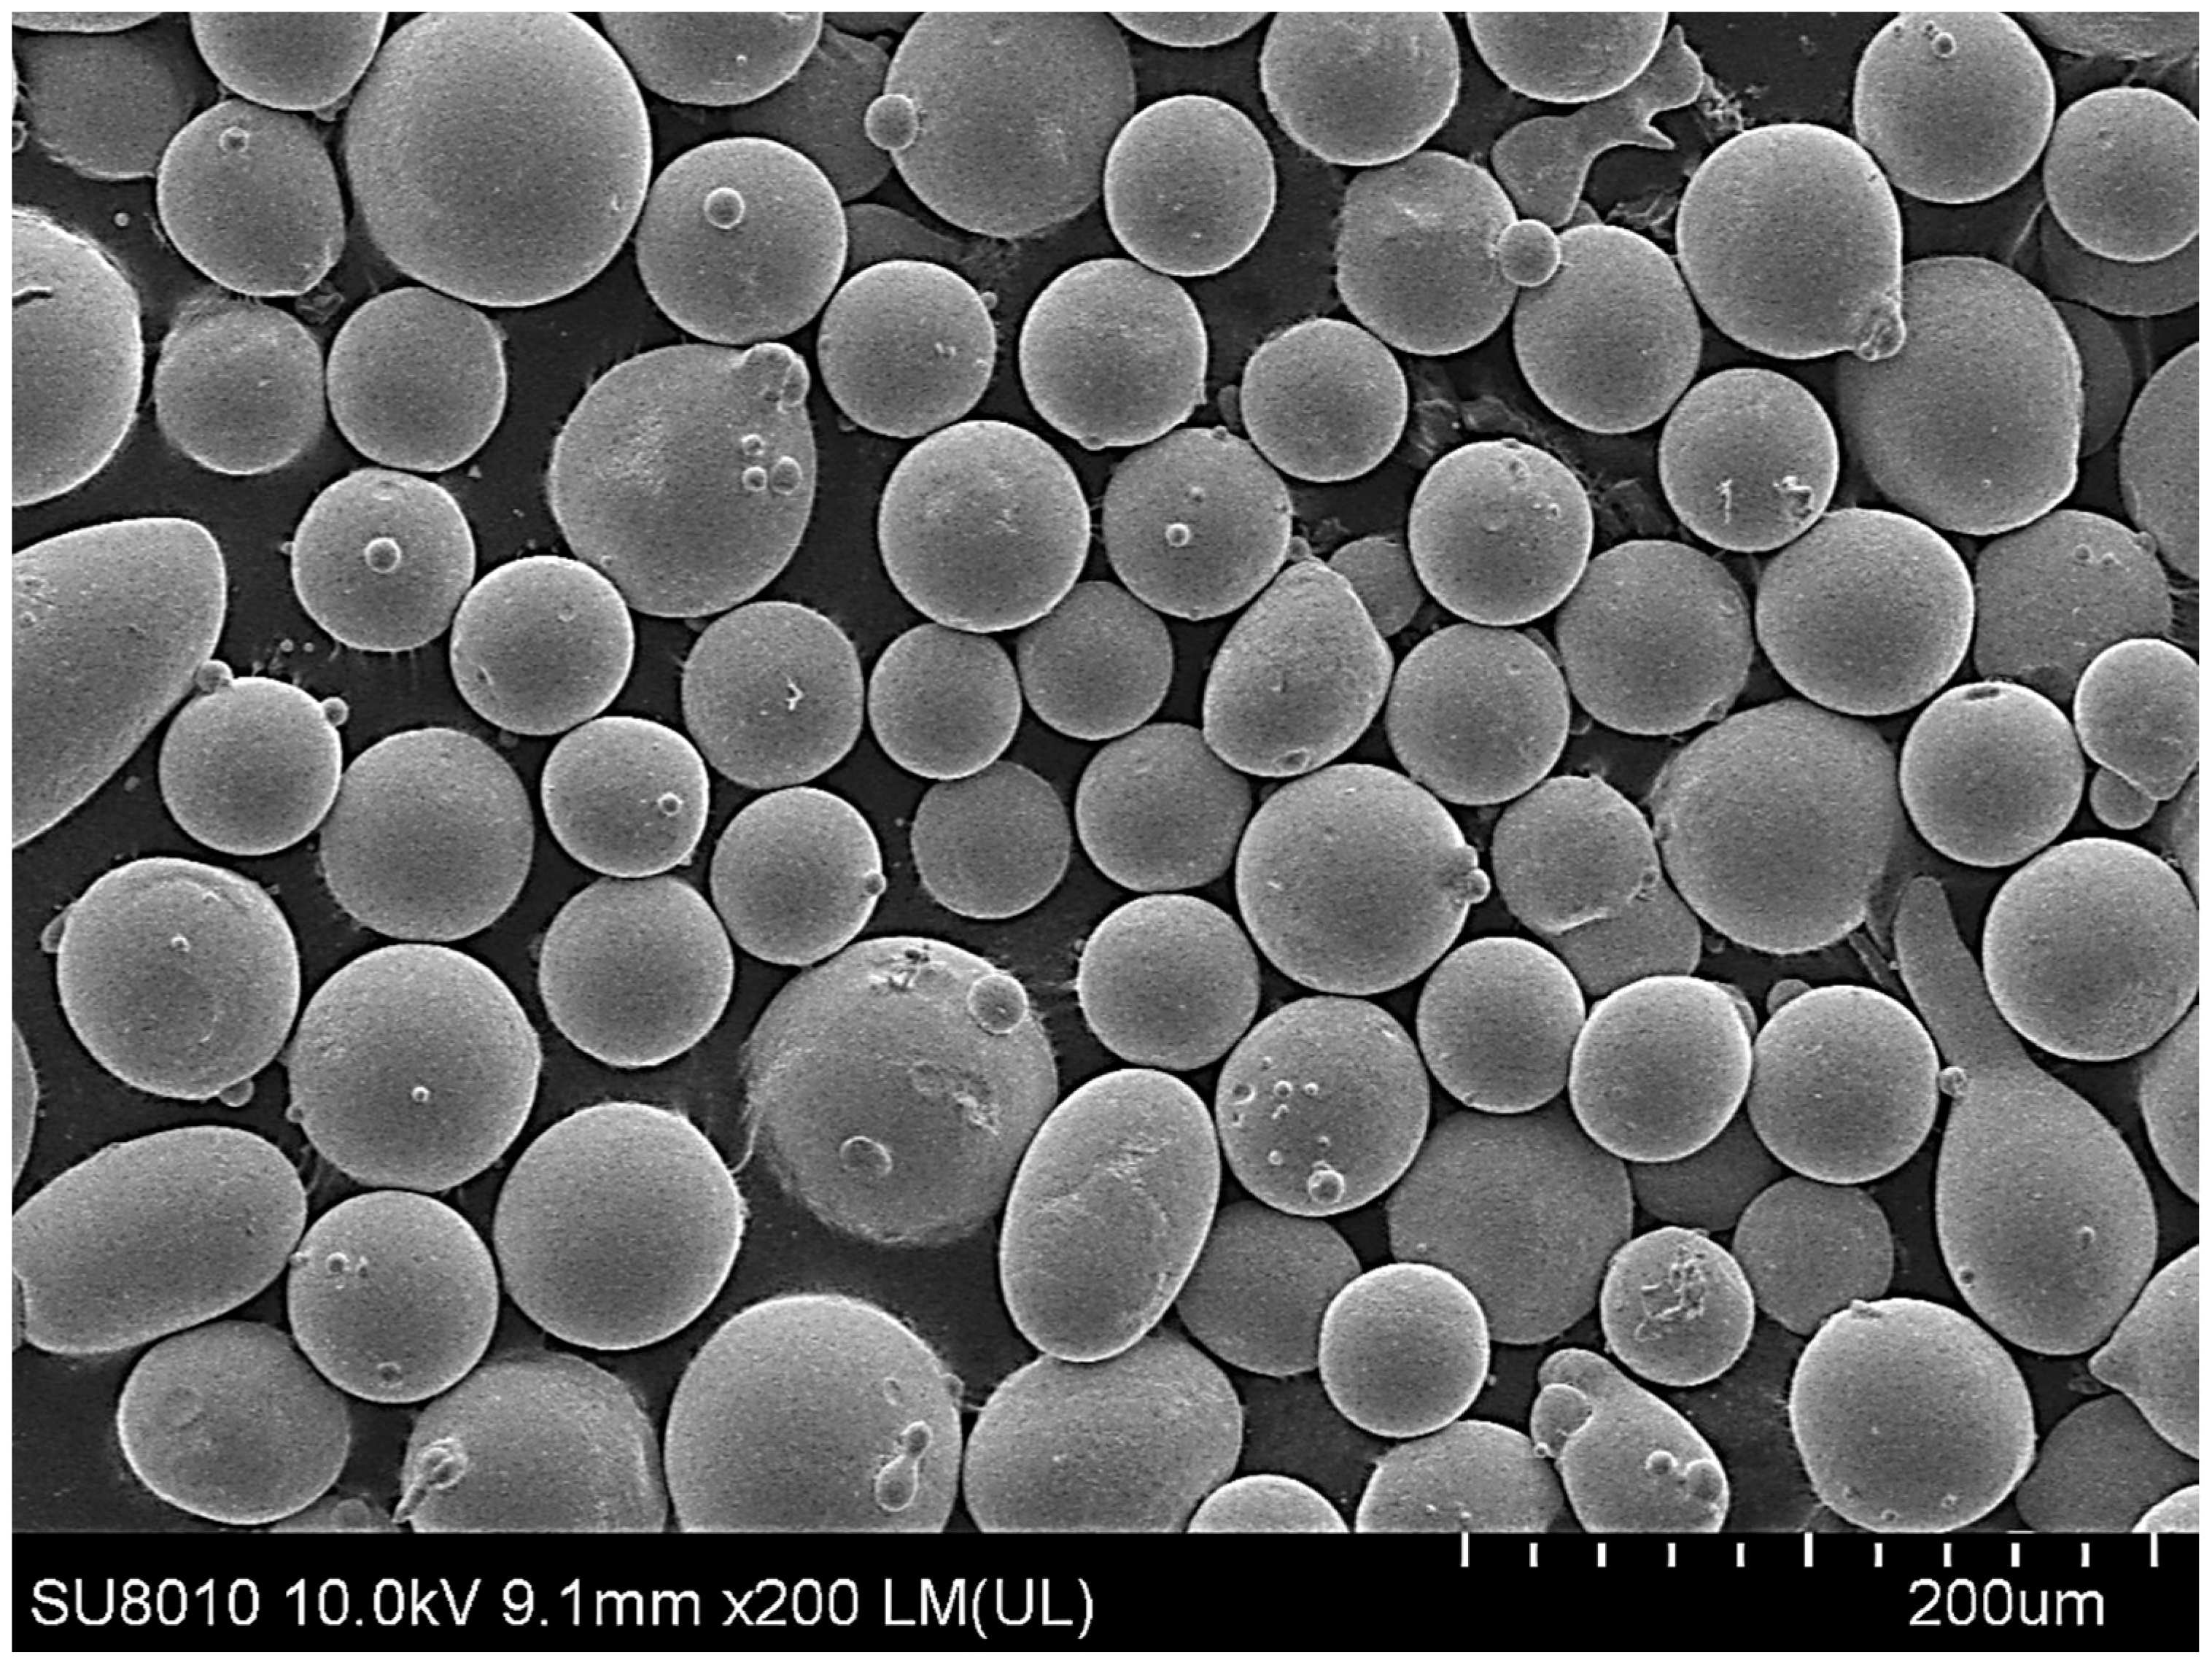
Figure 2.
Geometric model.
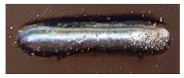
Figure 2.
Geometric model.
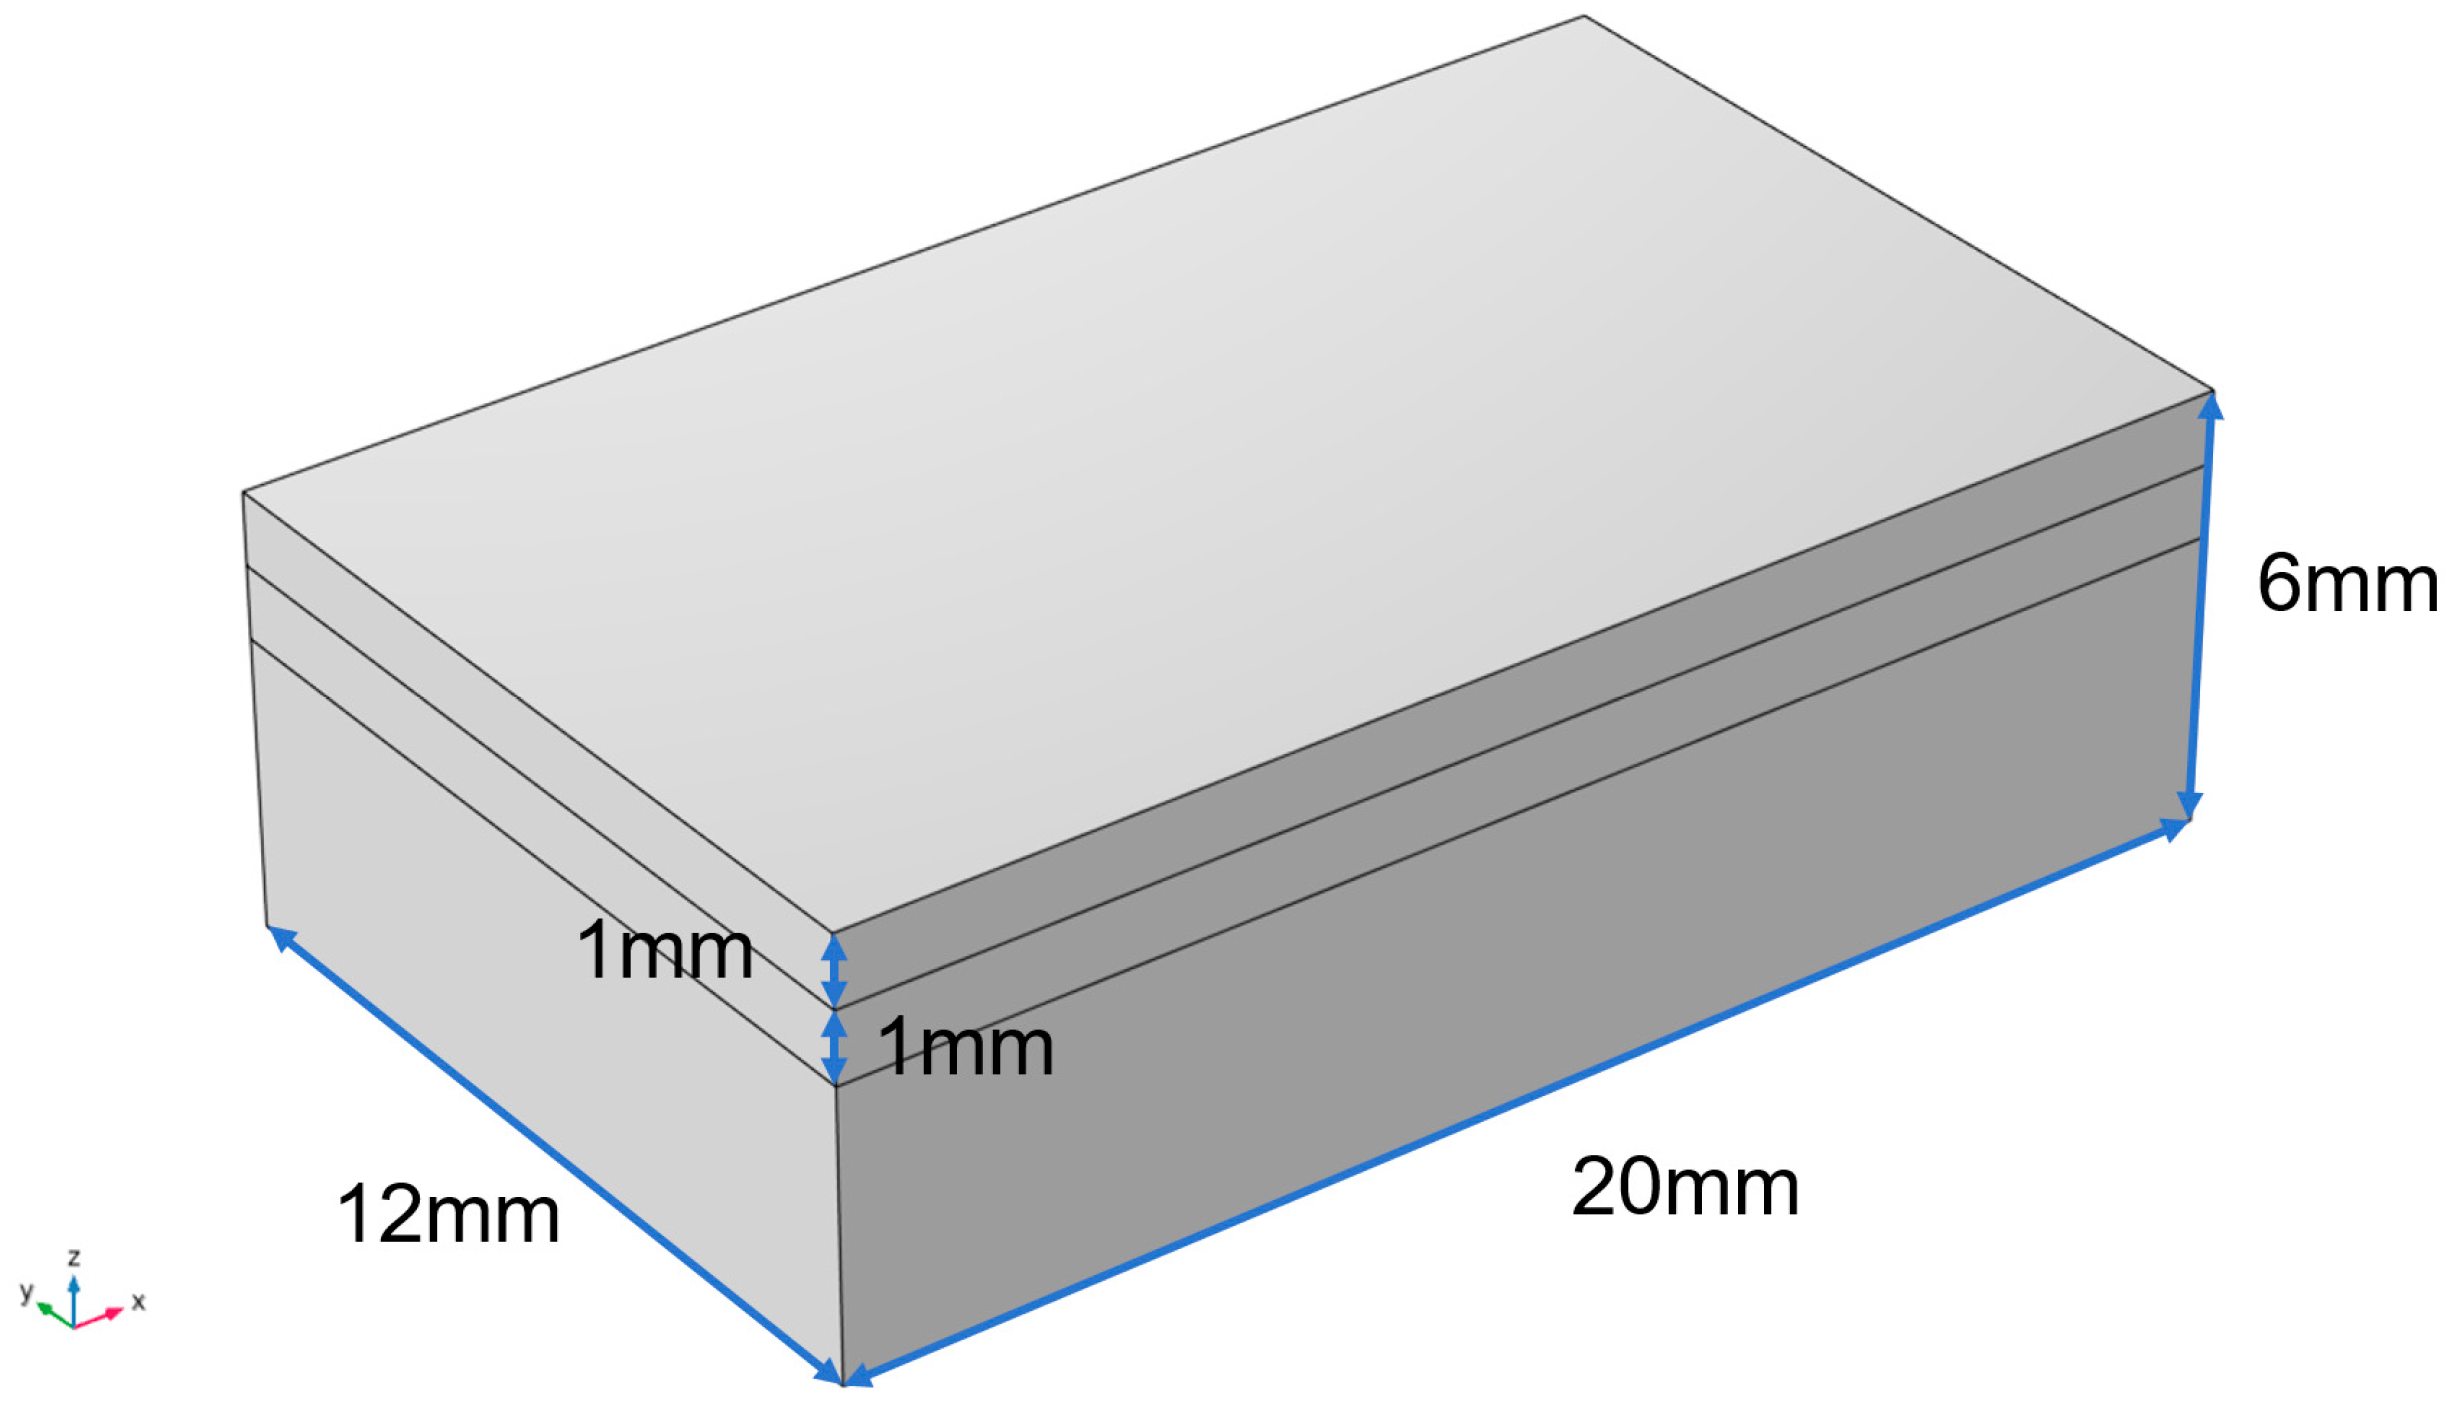
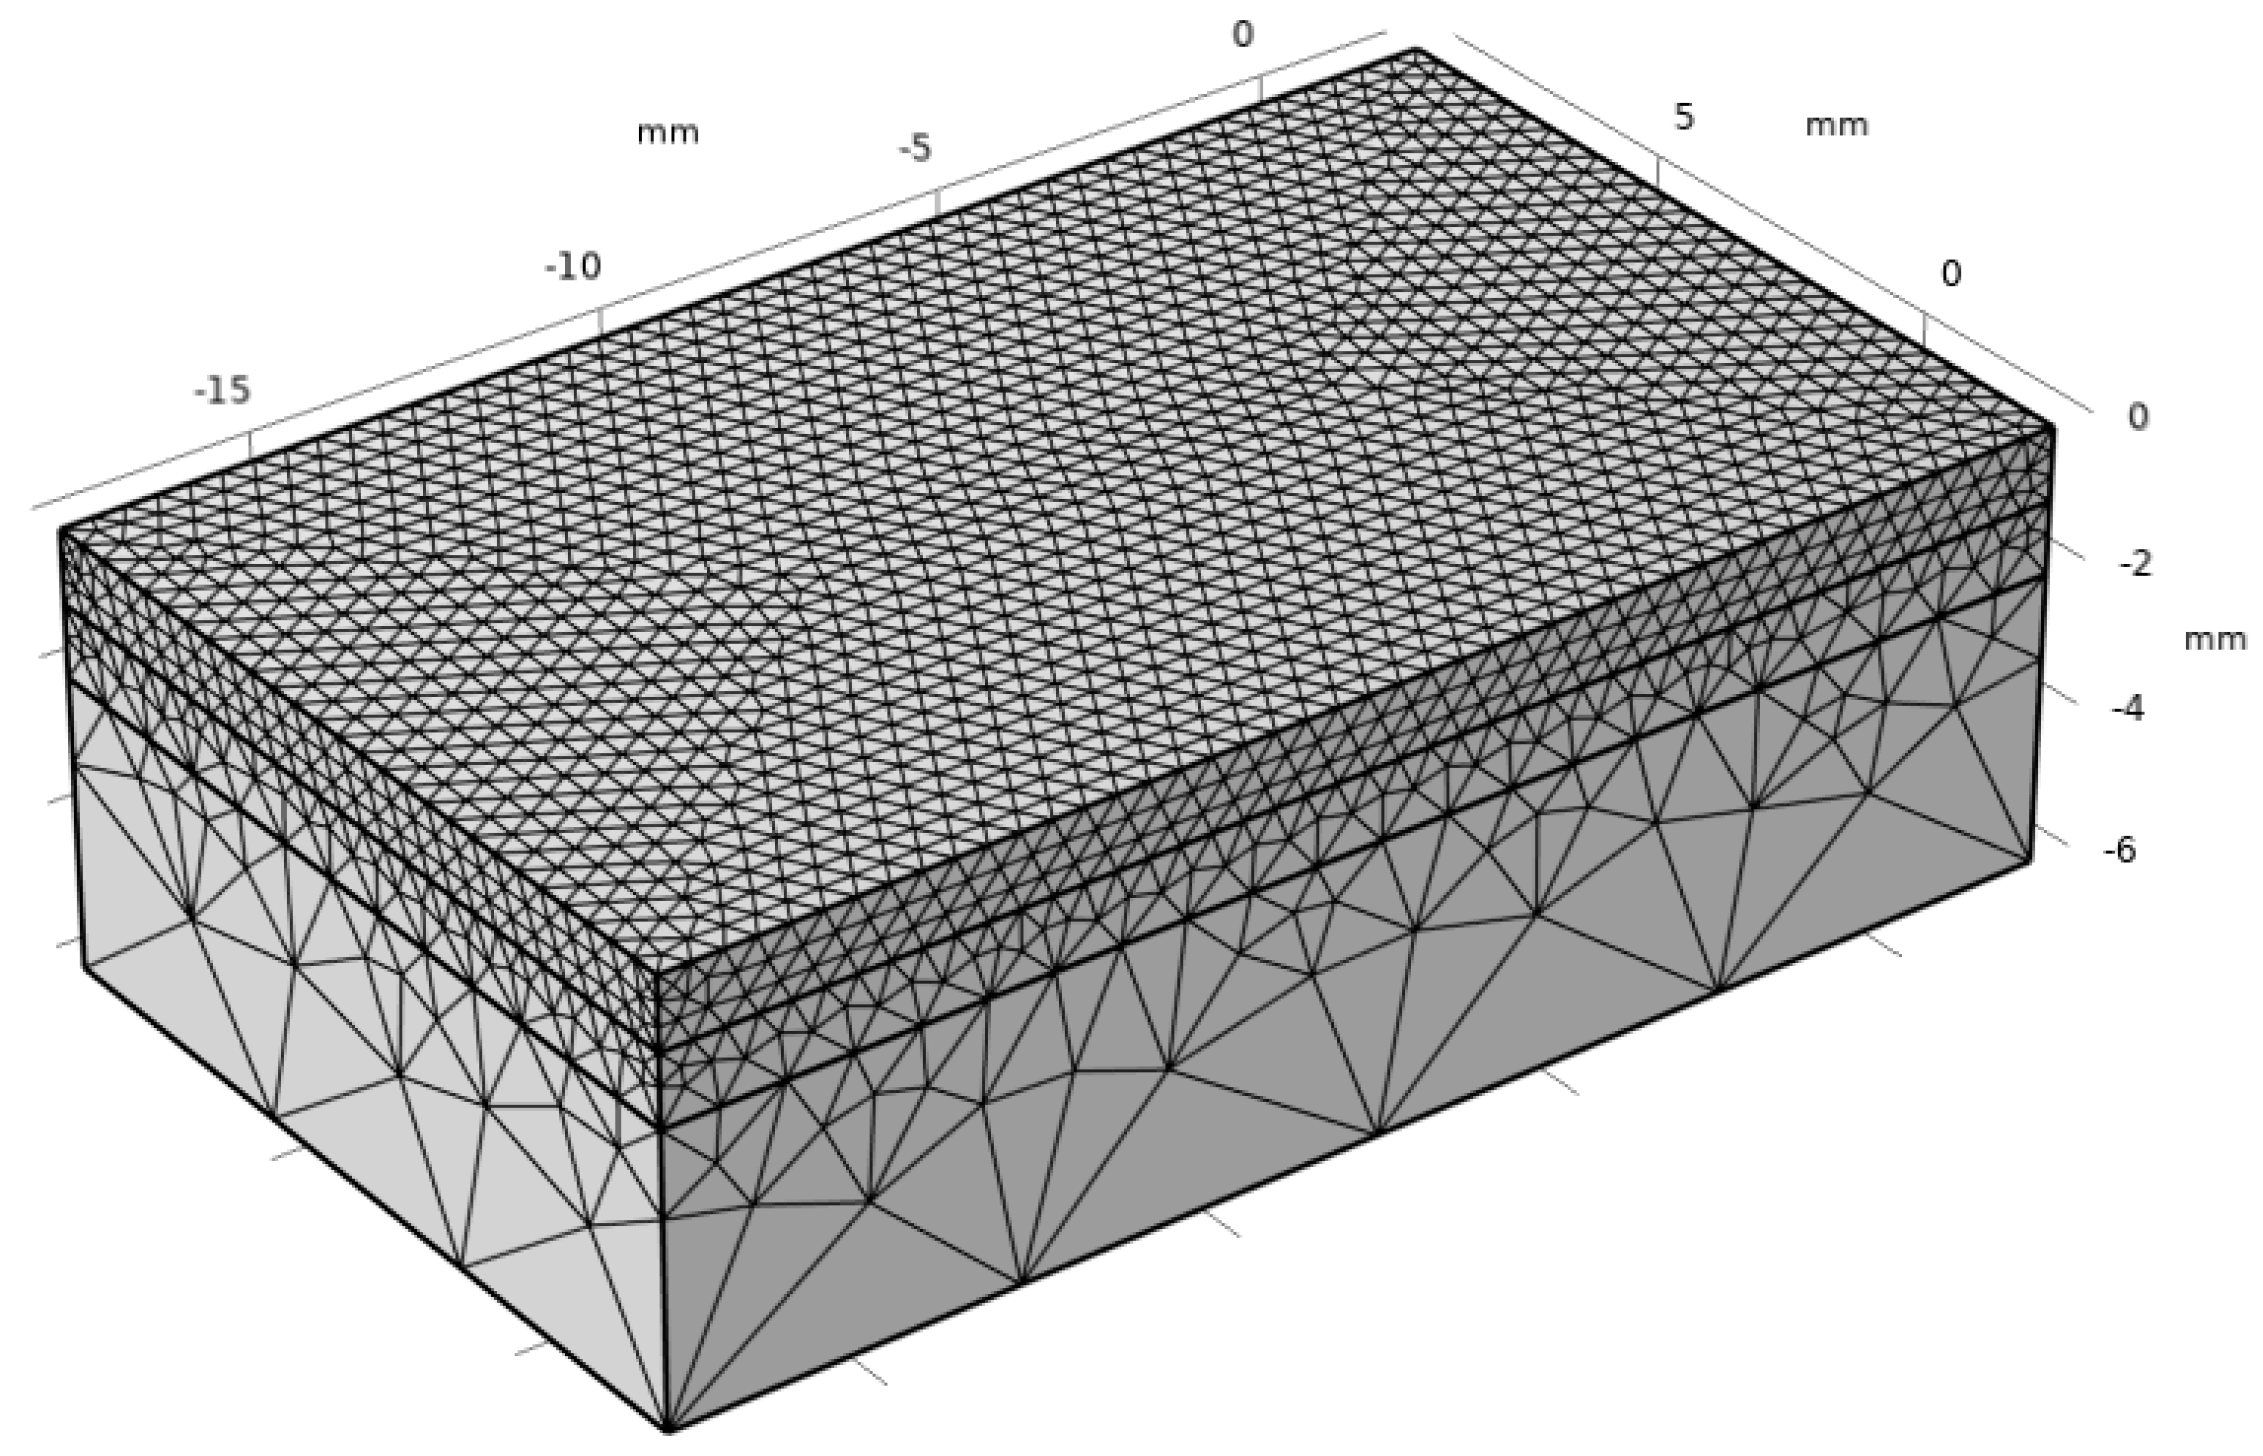
Figure 3.
Mesh division of the laser cladding.
Figure 3.
Mesh division of the laser cladding.
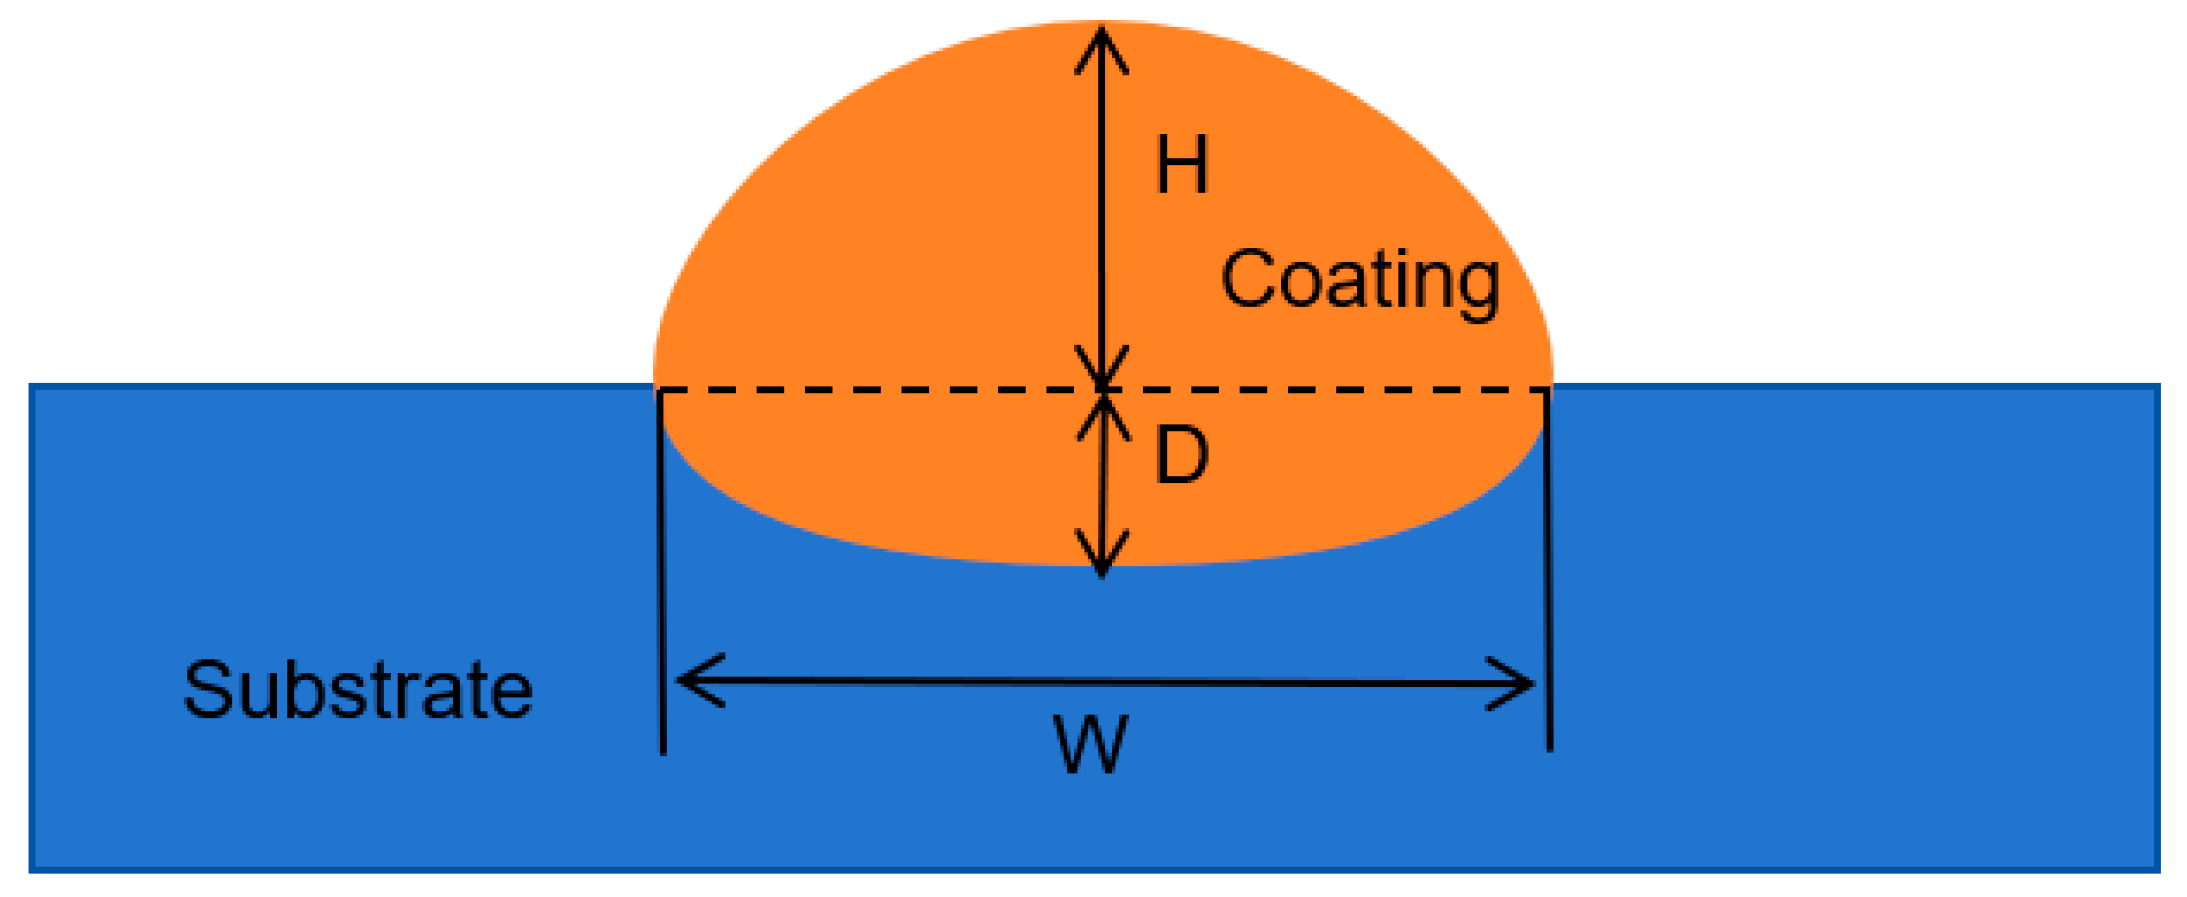
Figure 4.
Dilution rate calculation schematic.
Figure 4.
Dilution rate calculation schematic.
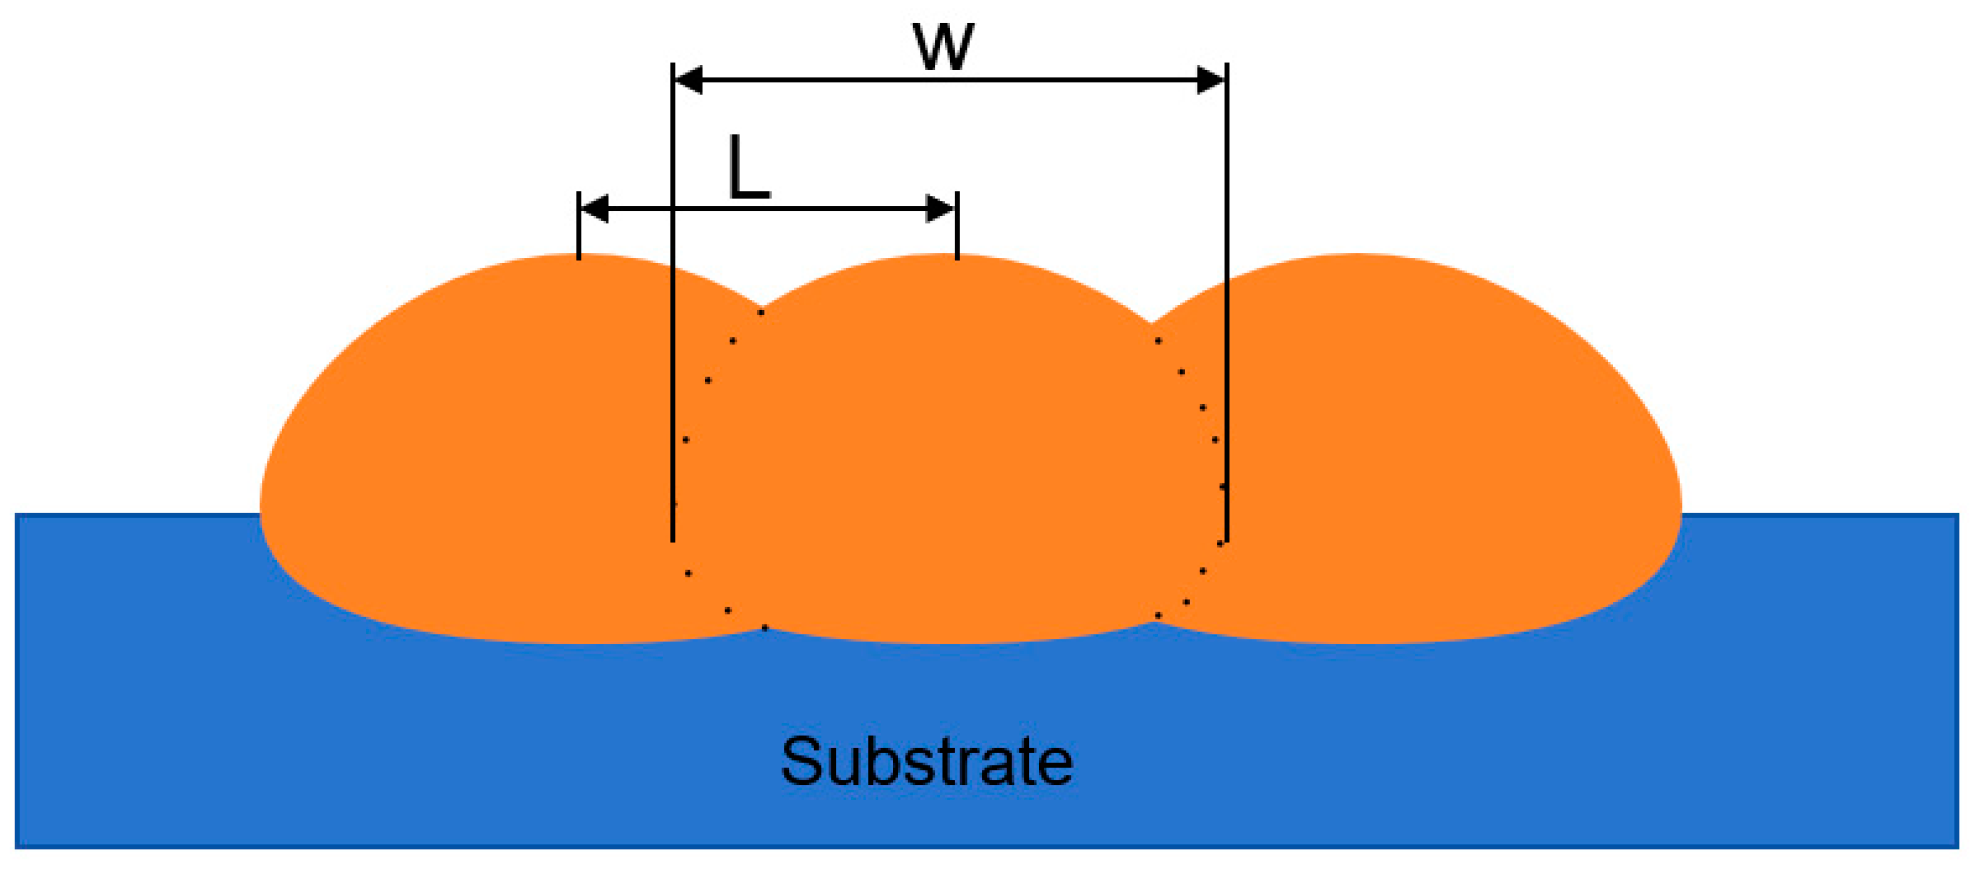
Figure 5.
Schematic of multi-pass overlap rate cross-section of cladding coating.
Figure 5.
Schematic of multi-pass overlap rate cross-section of cladding coating.
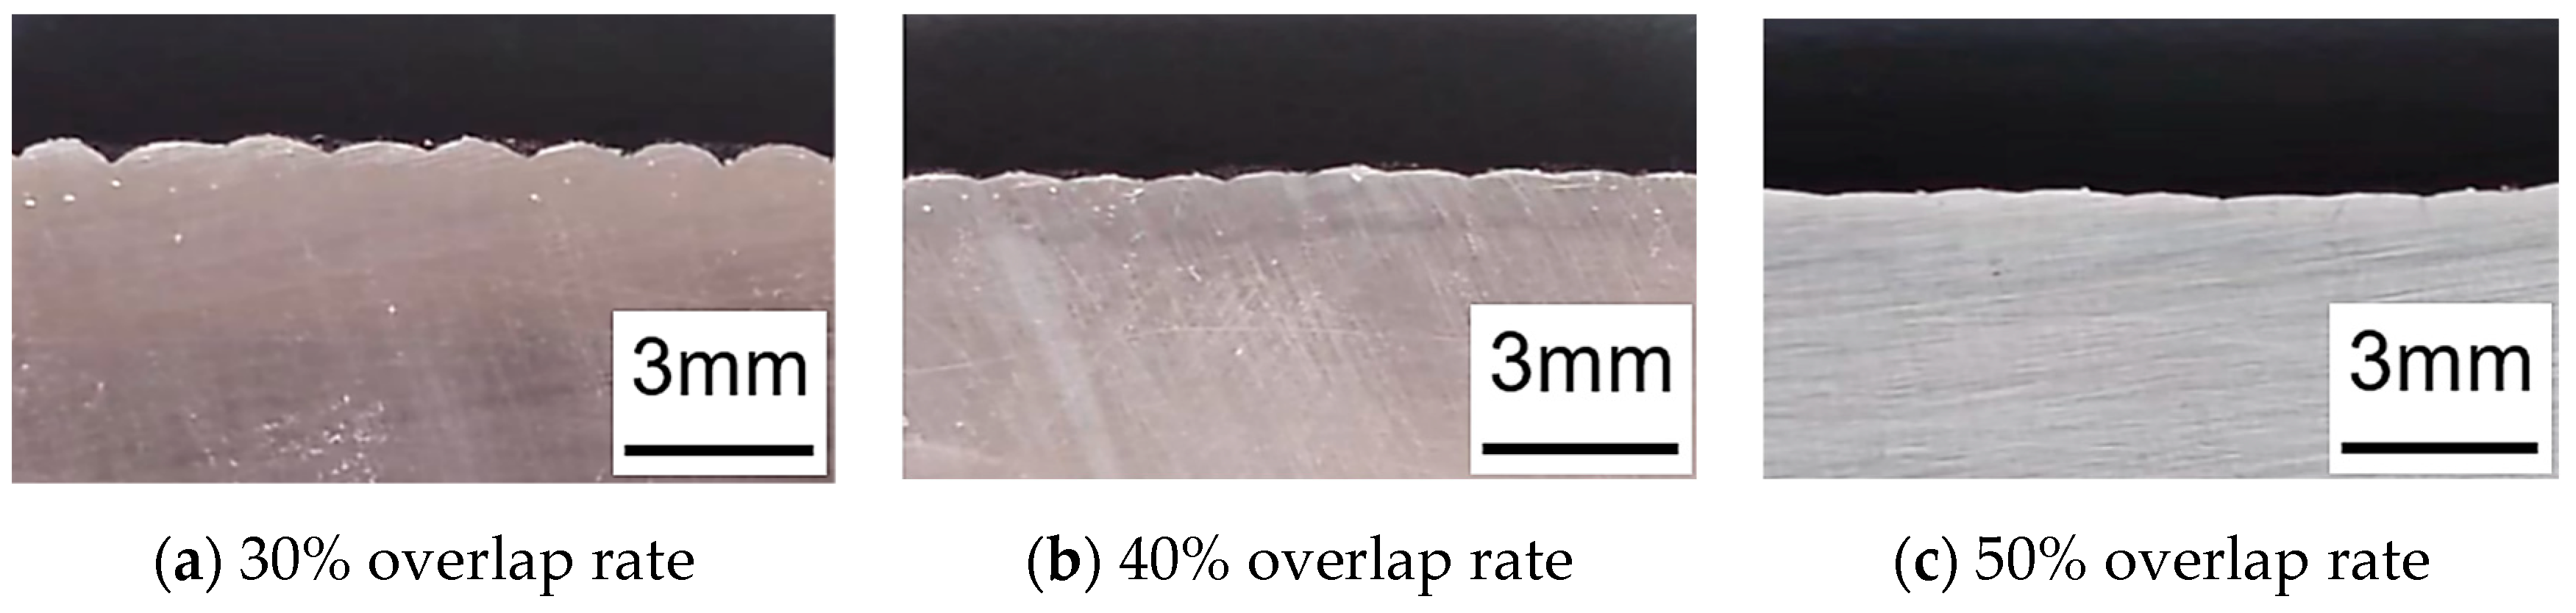
Figure 6.
Cross-section morphologies of cladding layers at different overlap rates.
Figure 6.
Cross-section morphologies of cladding layers at different overlap rates.
Figure 7.
Cross-section morphologies of cladding layers at different bonding rates.
Figure 7.
Cross-section morphologies of cladding layers at different bonding rates.
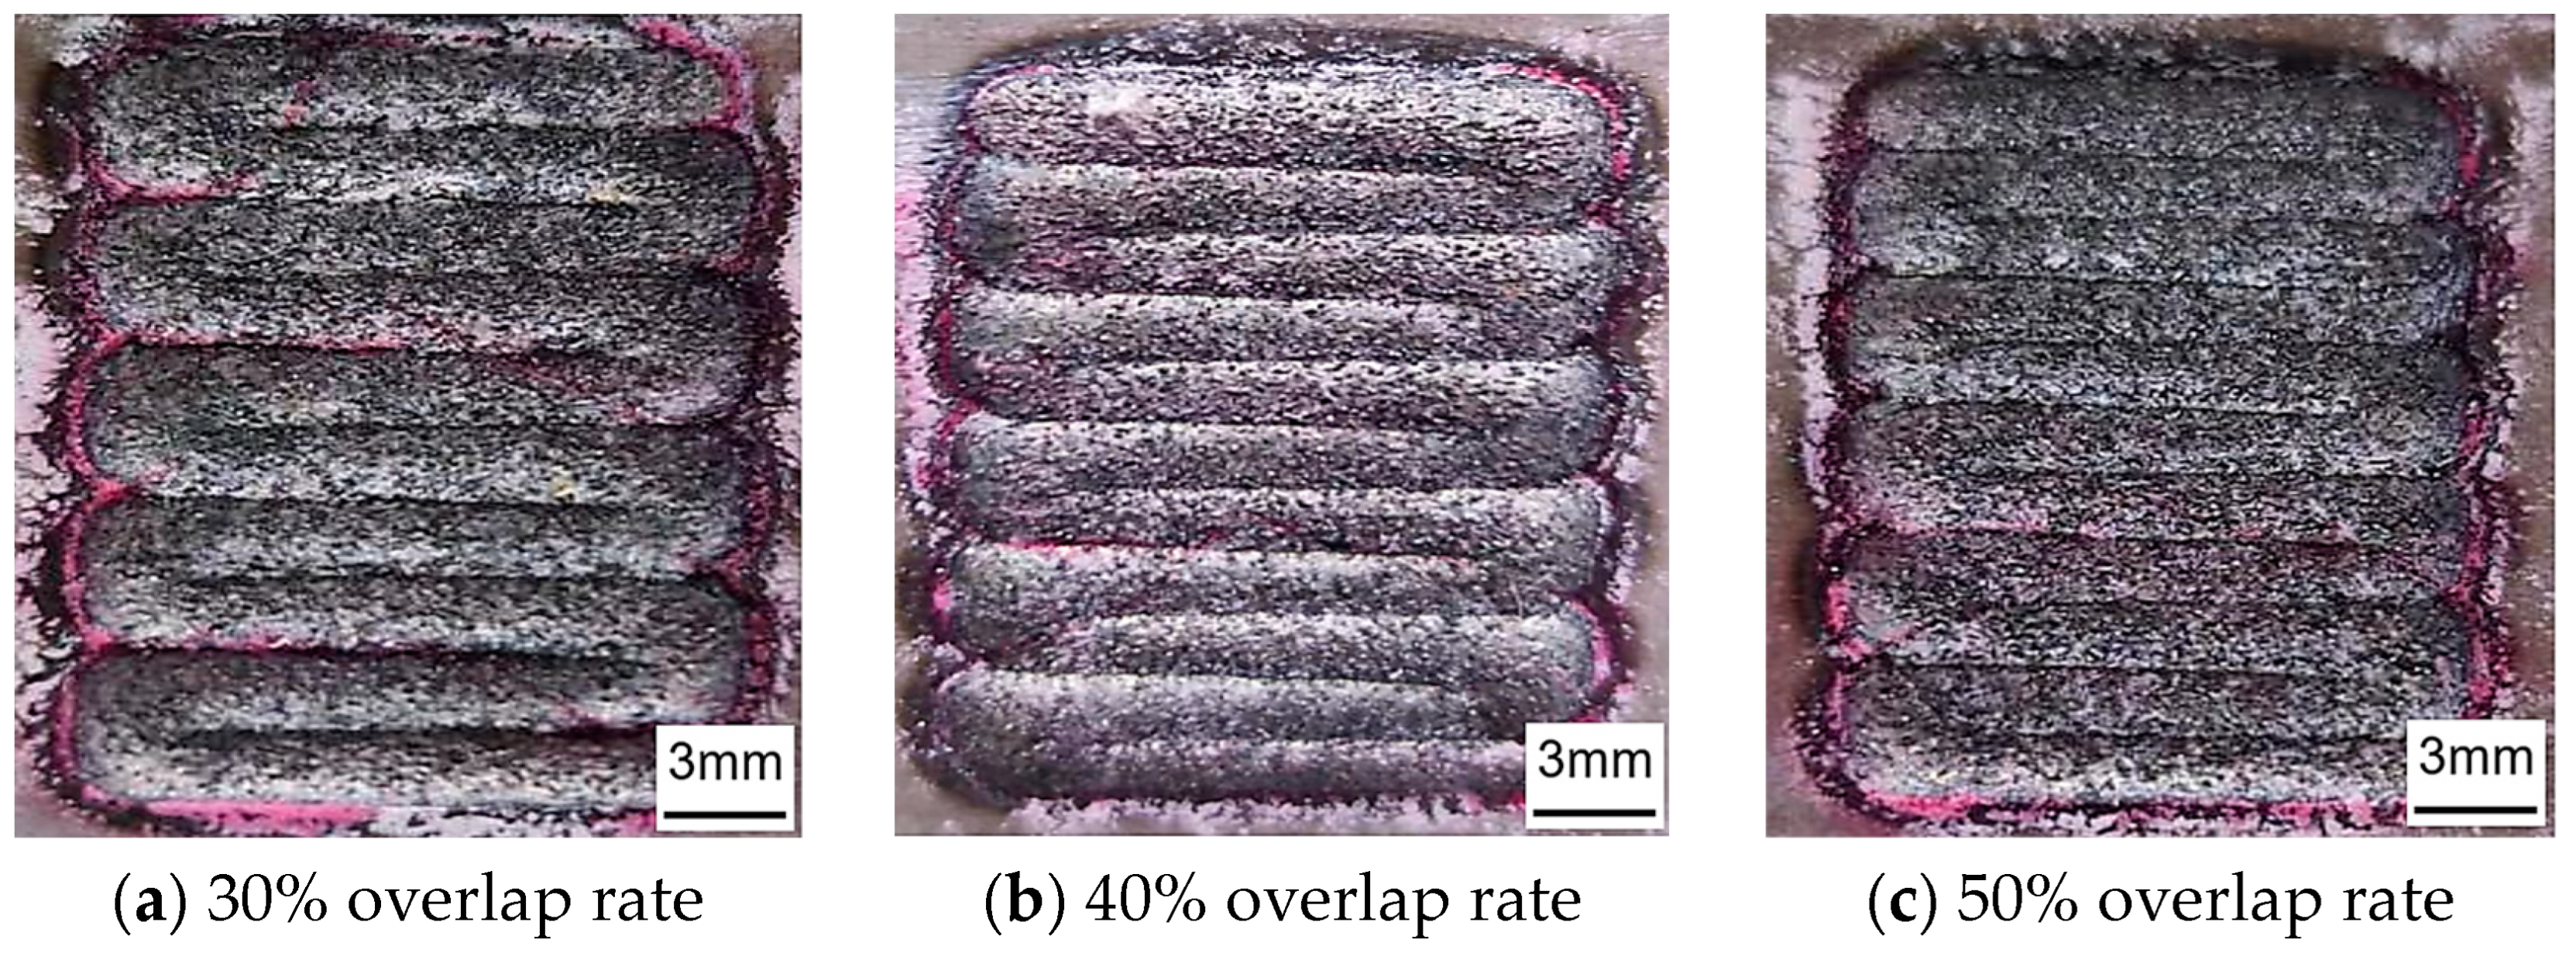
Figure 8.
Crack detection of cladding coatings with different overlap rates.
Figure 8.
Crack detection of cladding coatings with different overlap rates.
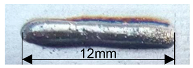
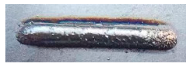
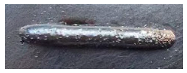
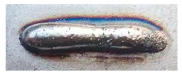
Figure 9.
Macroscopic morphology of Fe60 alloy powder multi-pass fusion coating with 50% overlap rate.
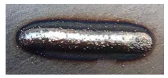
Figure 9.
Macroscopic morphology of Fe60 alloy powder multi-pass fusion coating with 50% overlap rate.
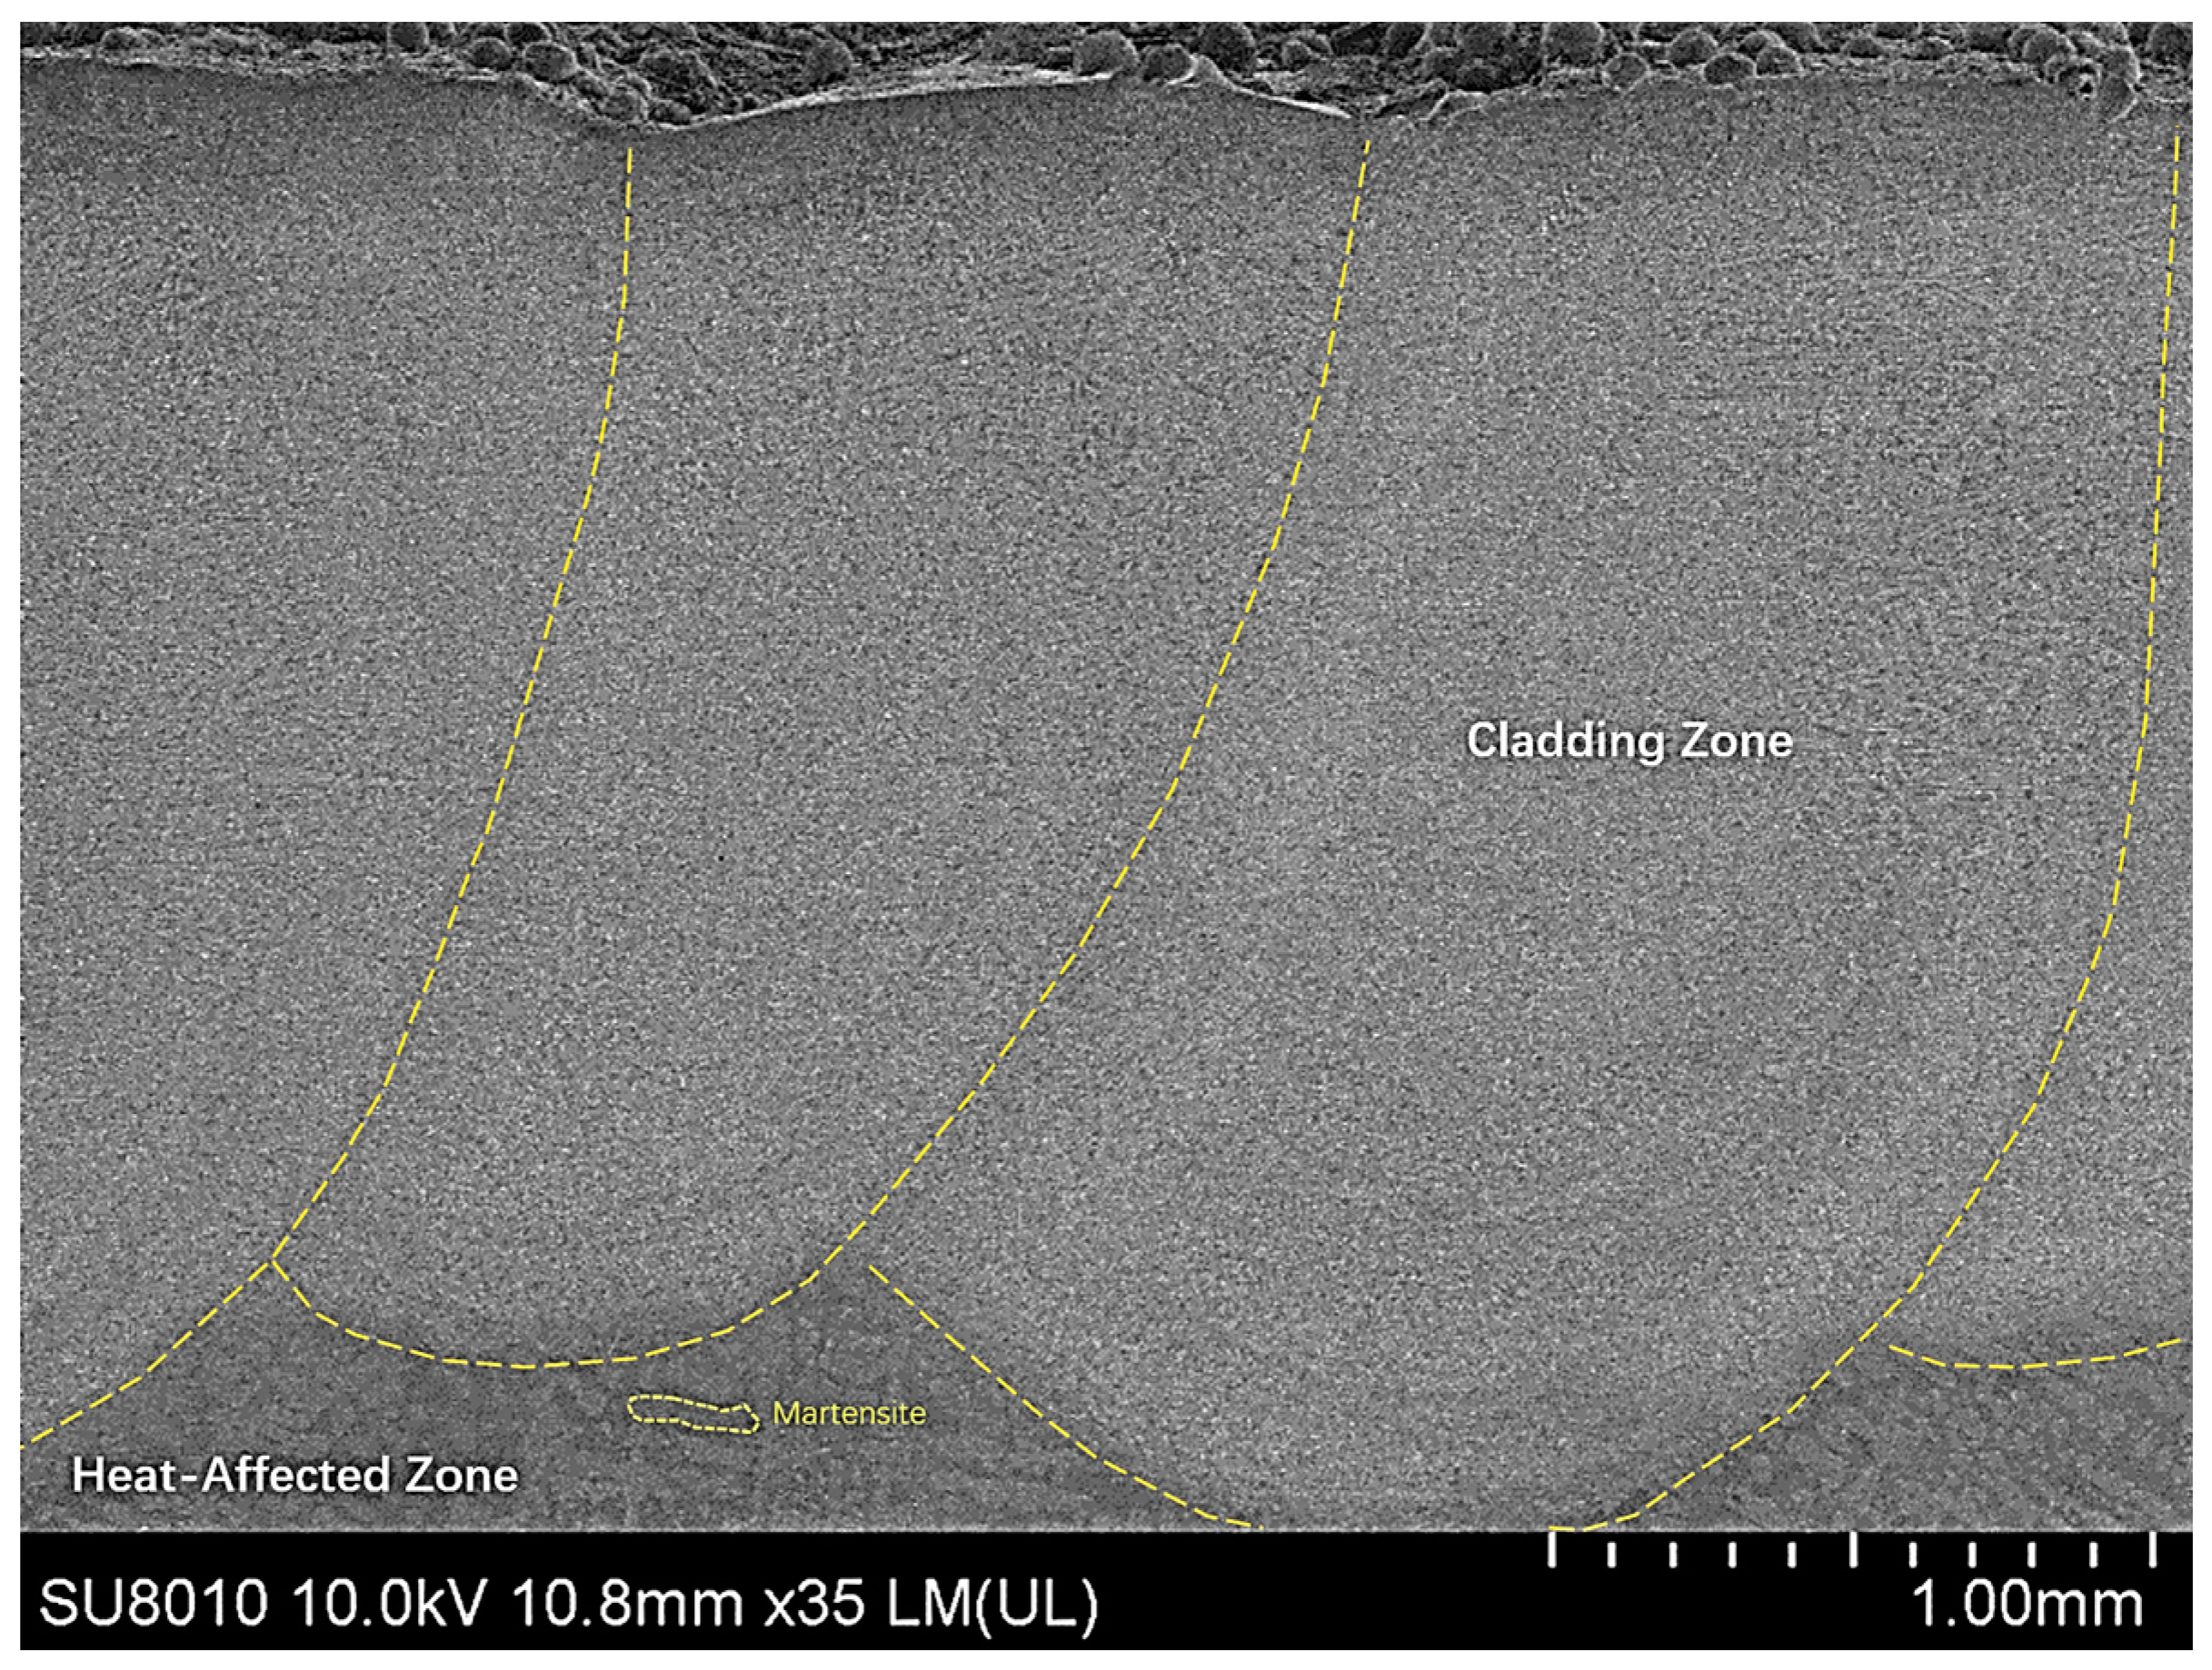
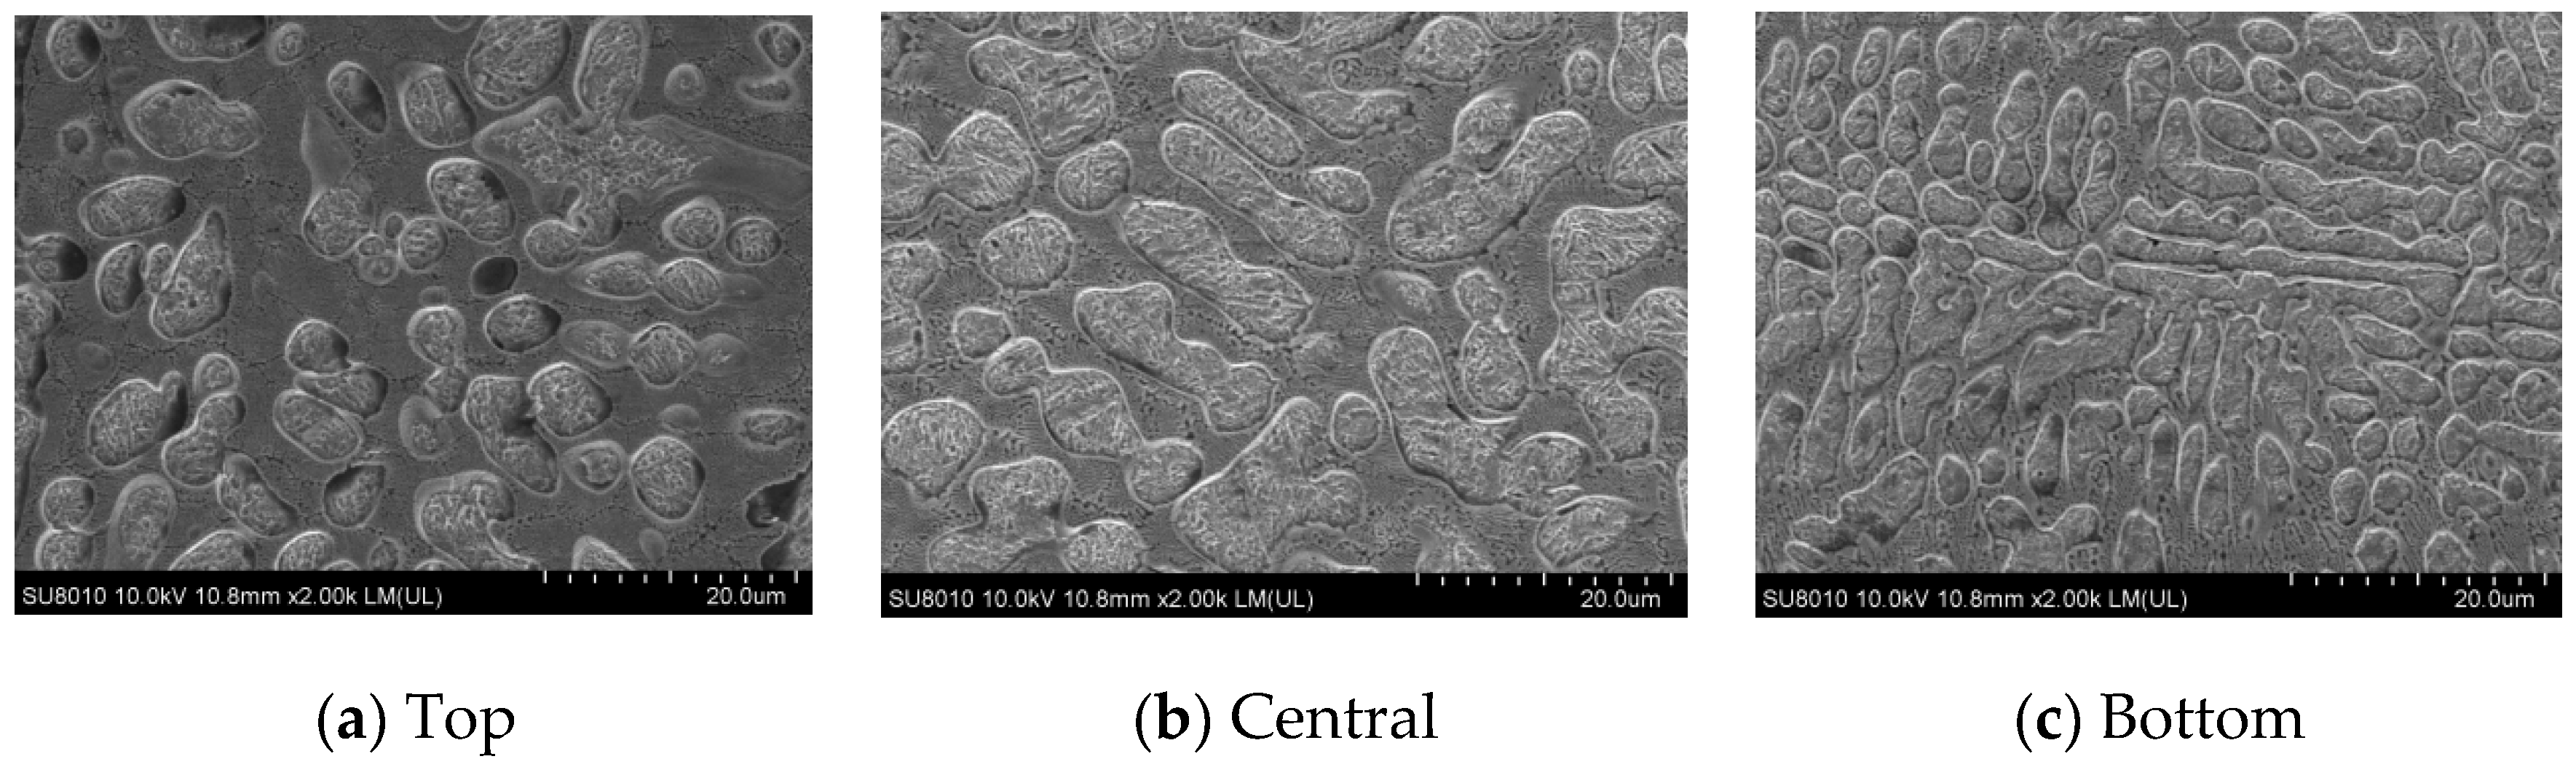
Figure 10.
Microstructure and morphology of laser cladding coatings under the optimal process.
Figure 10.
Microstructure and morphology of laser cladding coatings under the optimal process.
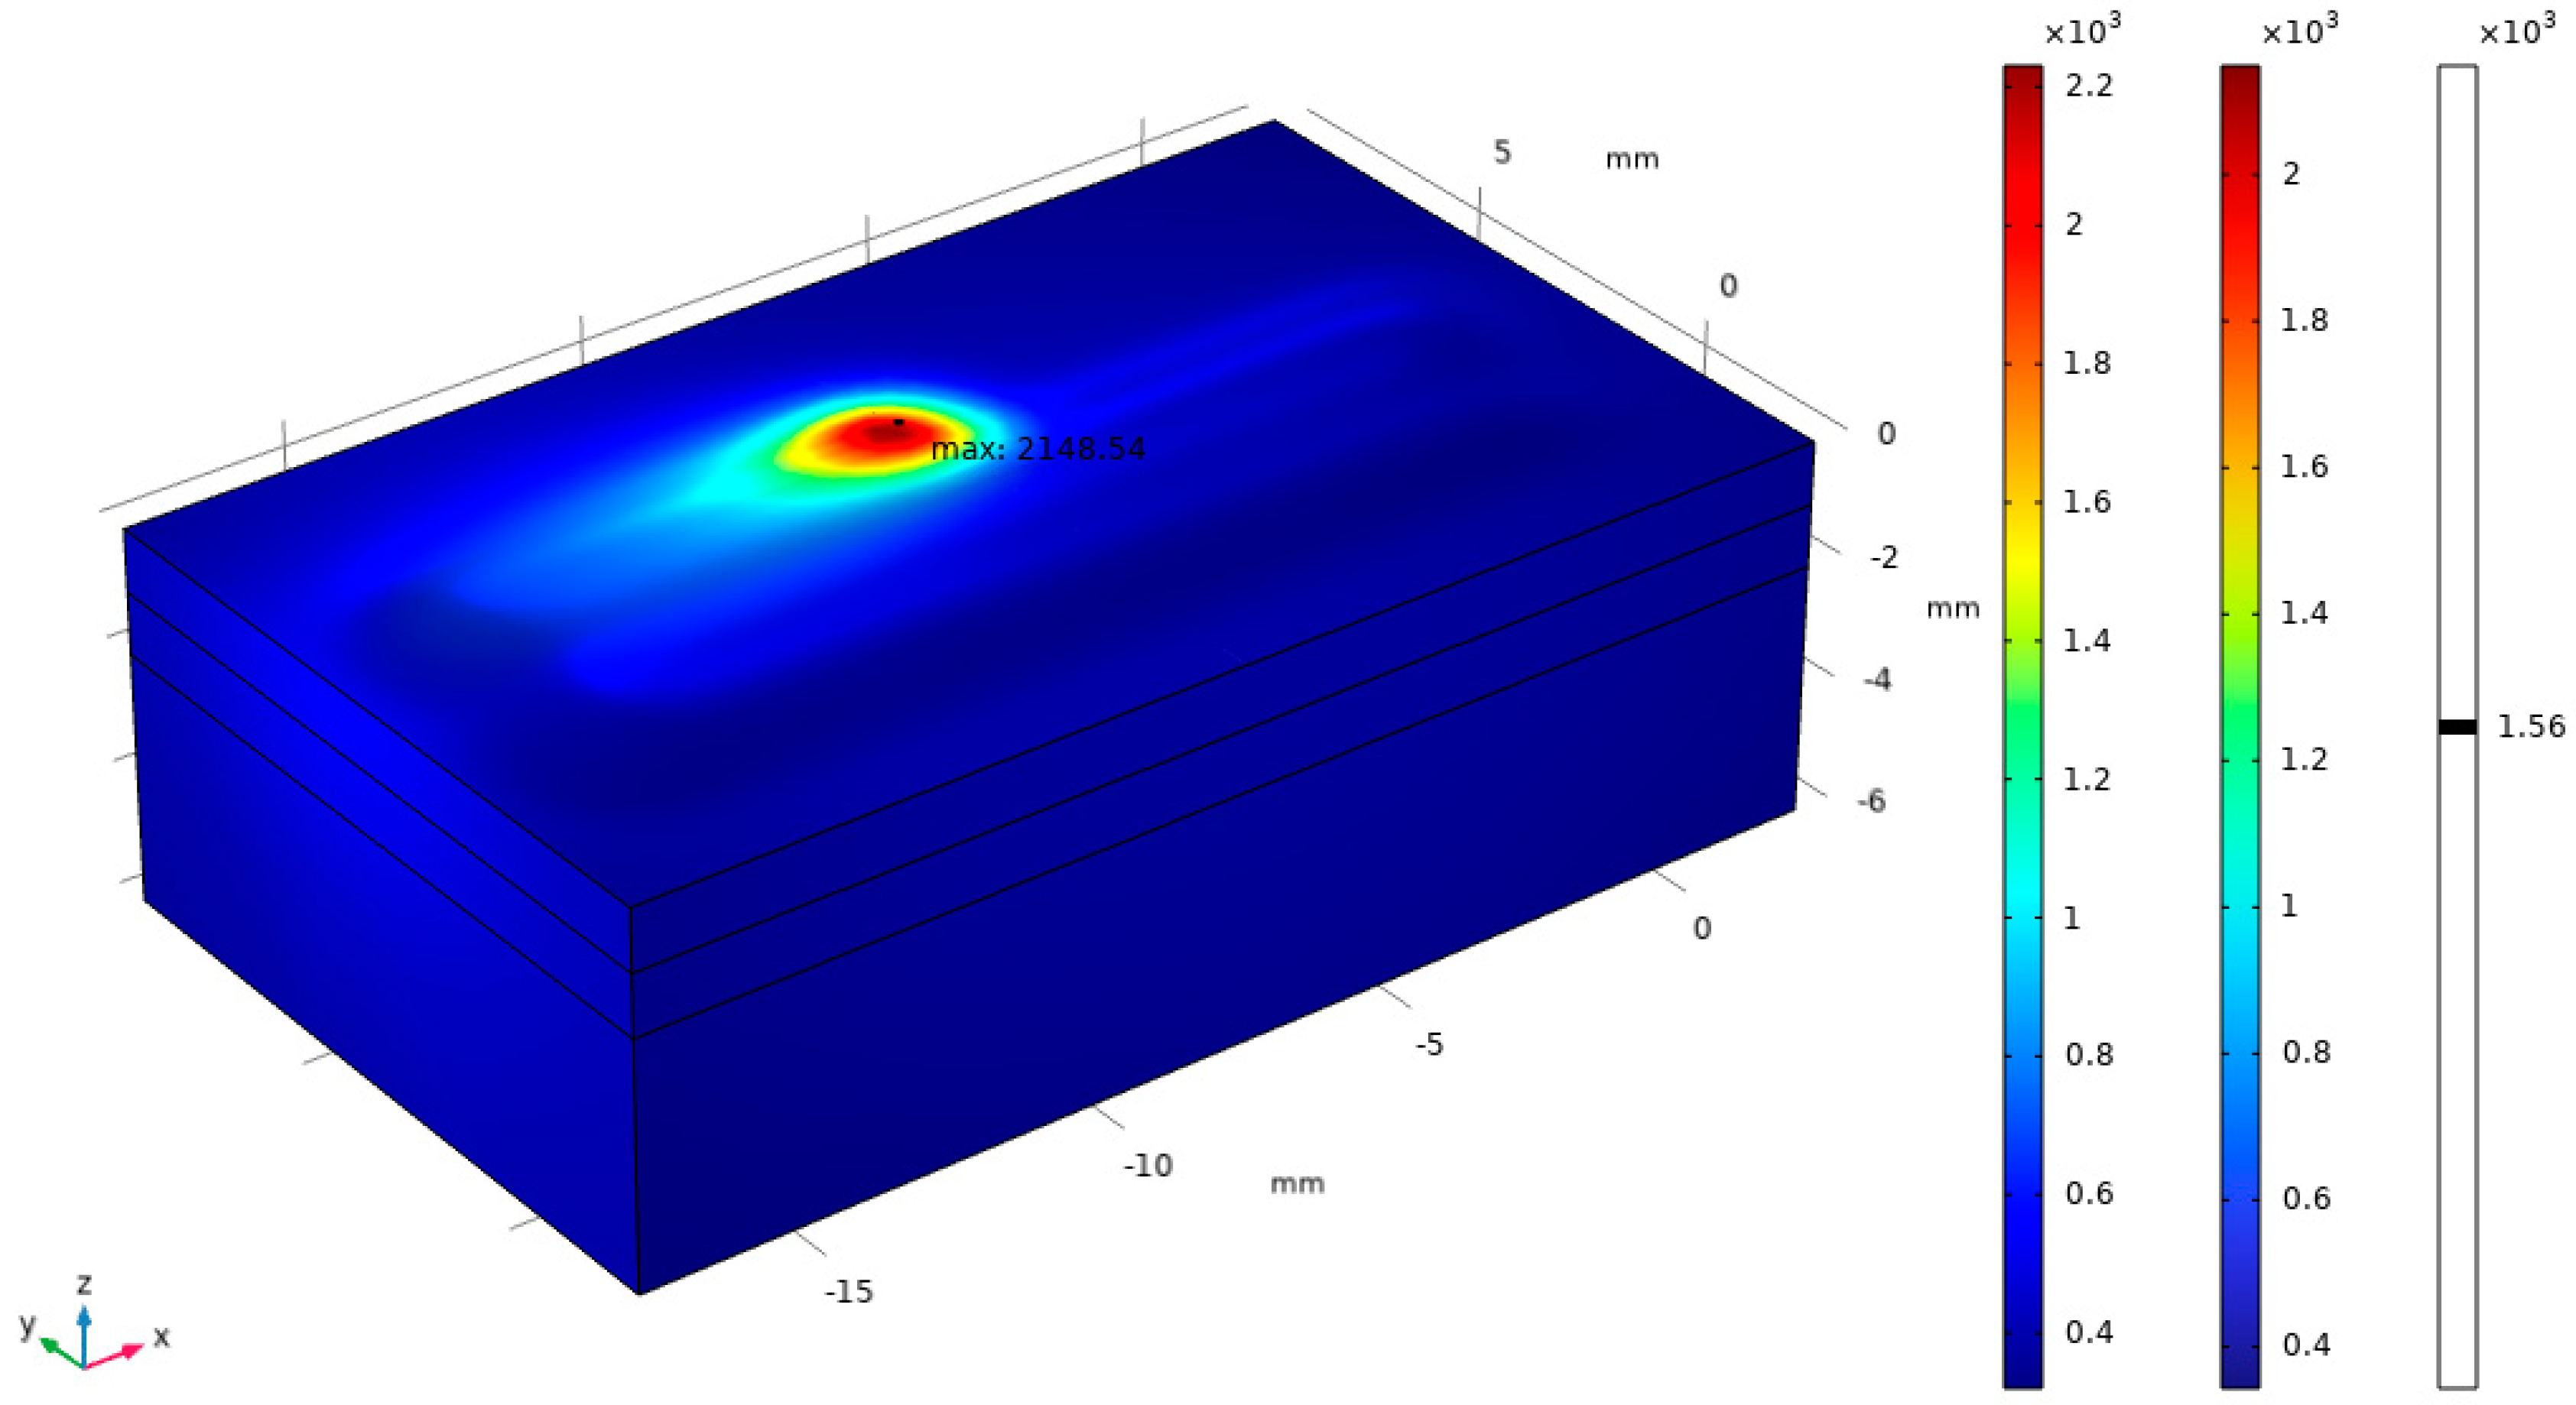
Figure 11.
Cloud diagram of temperature distribution of single-layer multi-pass laser cladding.
Figure 11.
Cloud diagram of temperature distribution of single-layer multi-pass laser cladding.
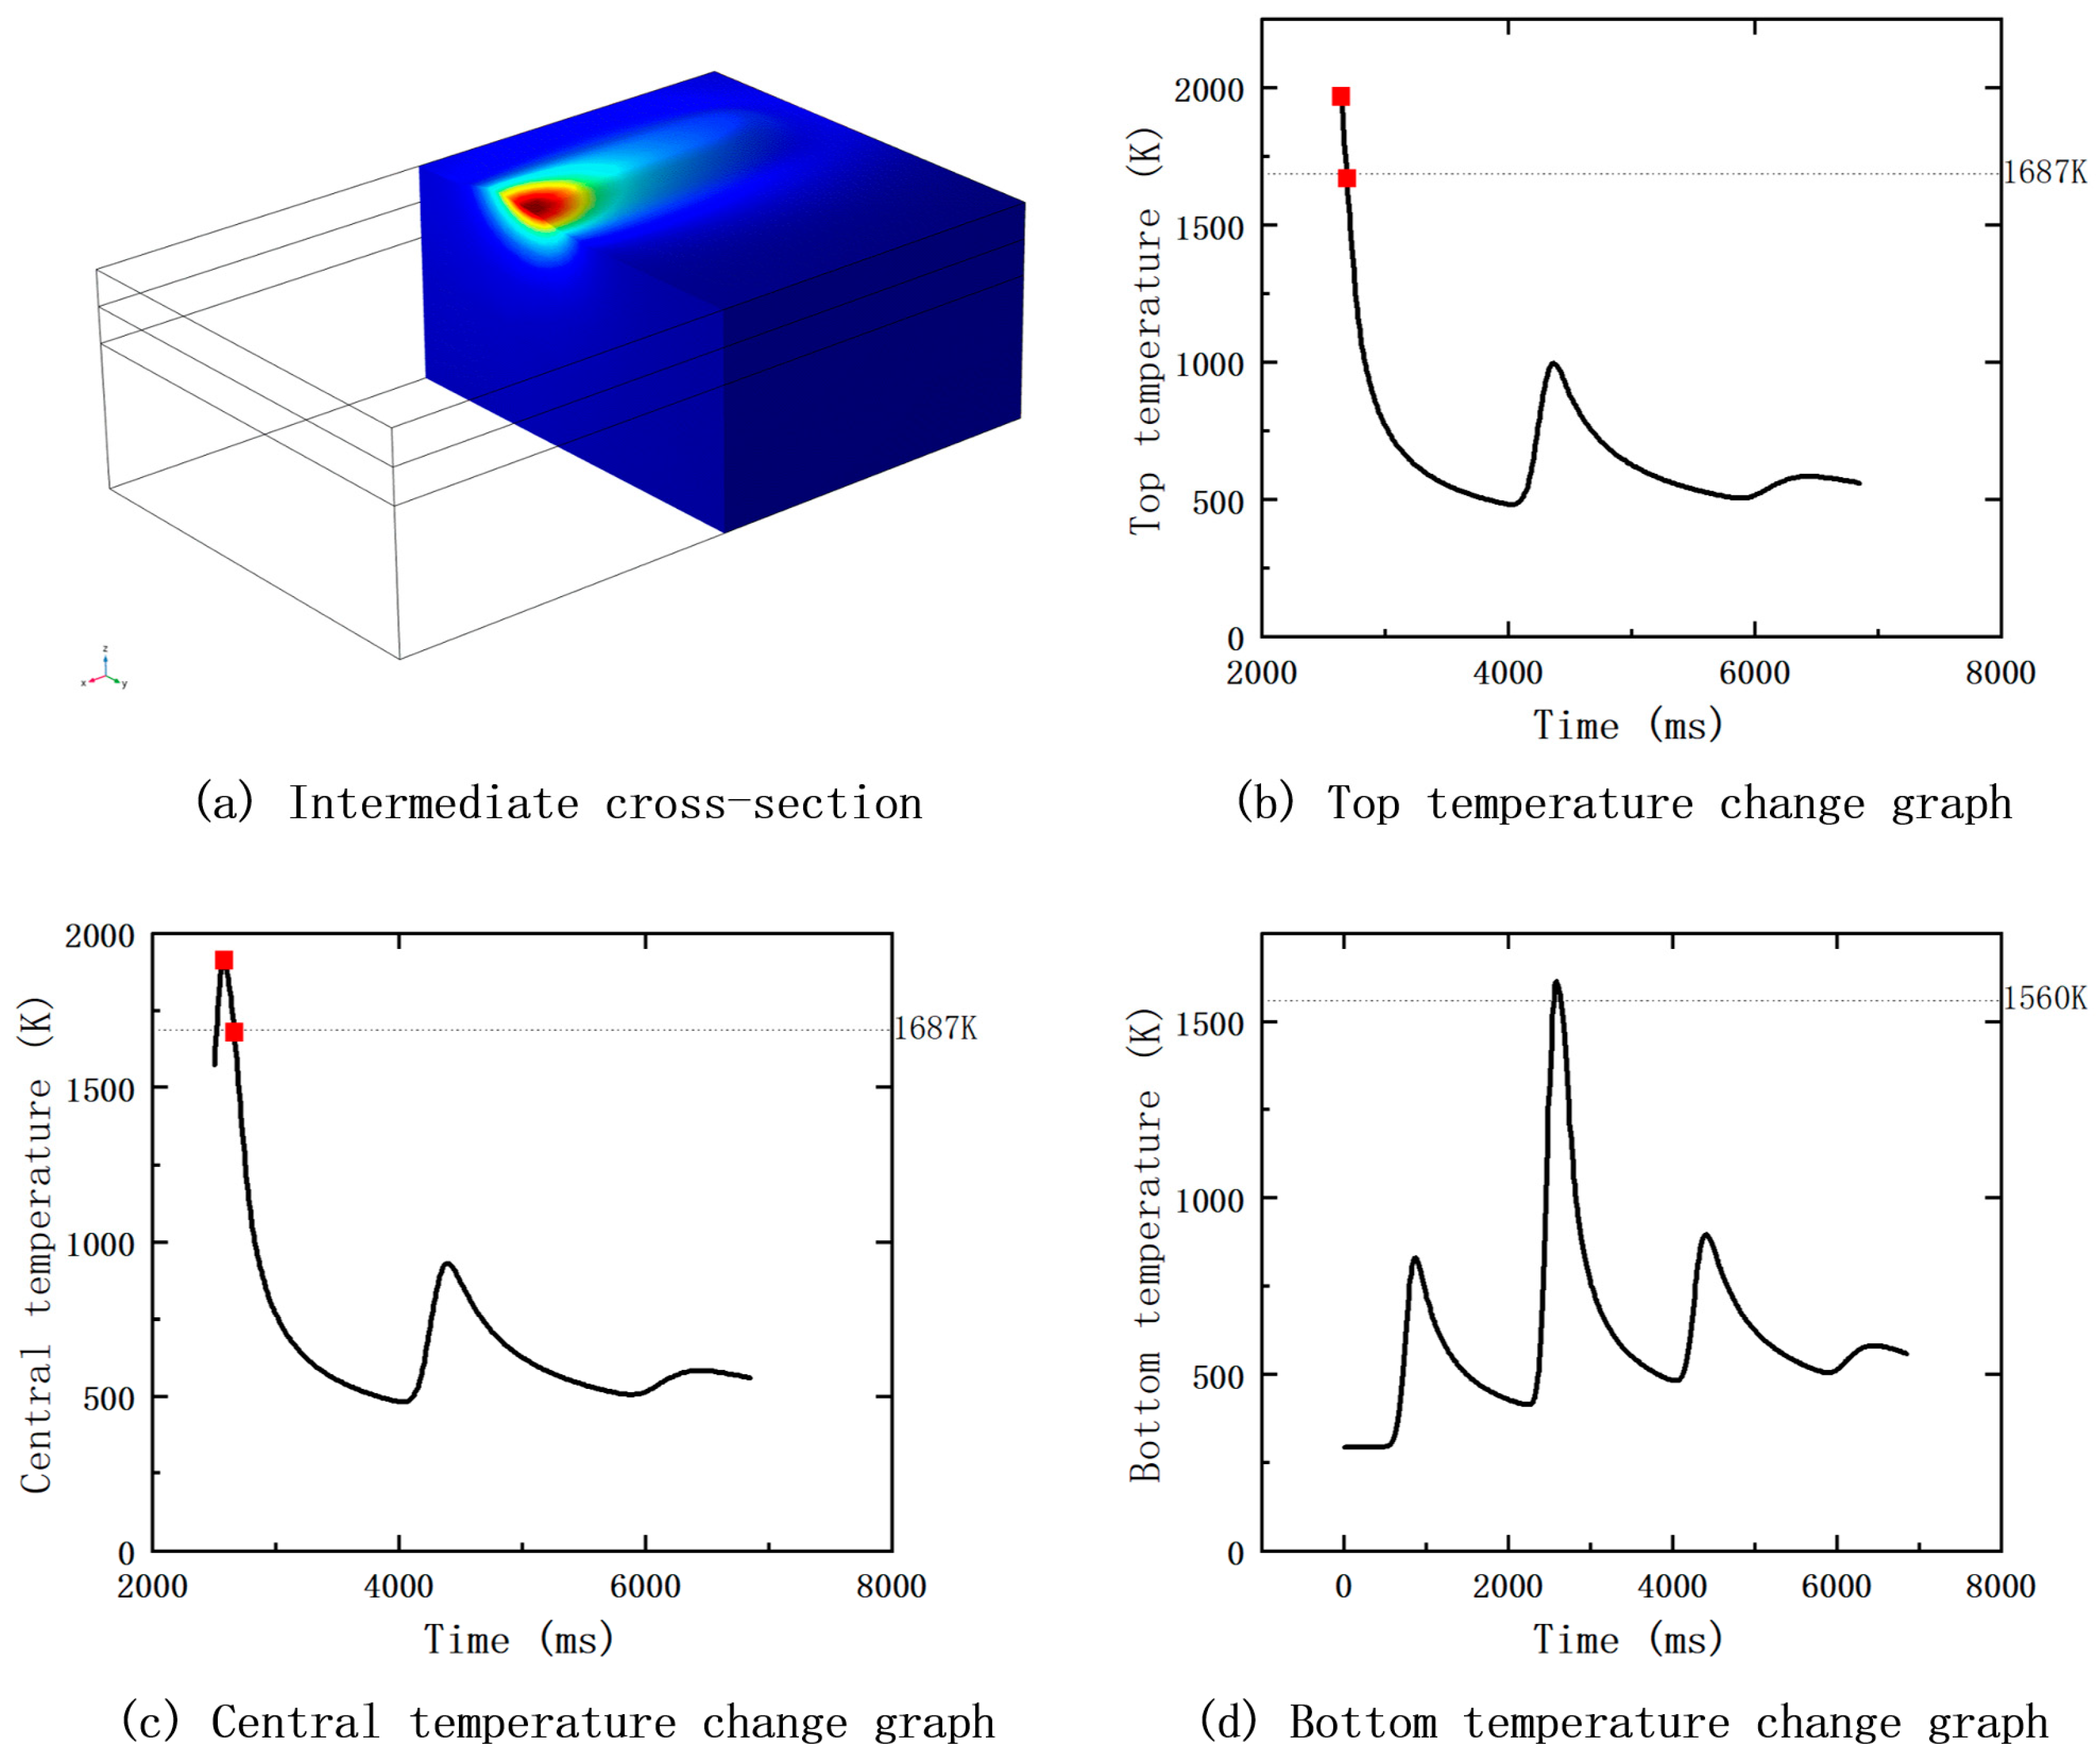
Figure 12.
Temperature profiles of the top, middle, and bottom of the middle section of the fused cladding layer.
Figure 12.
Temperature profiles of the top, middle, and bottom of the middle section of the fused cladding layer.
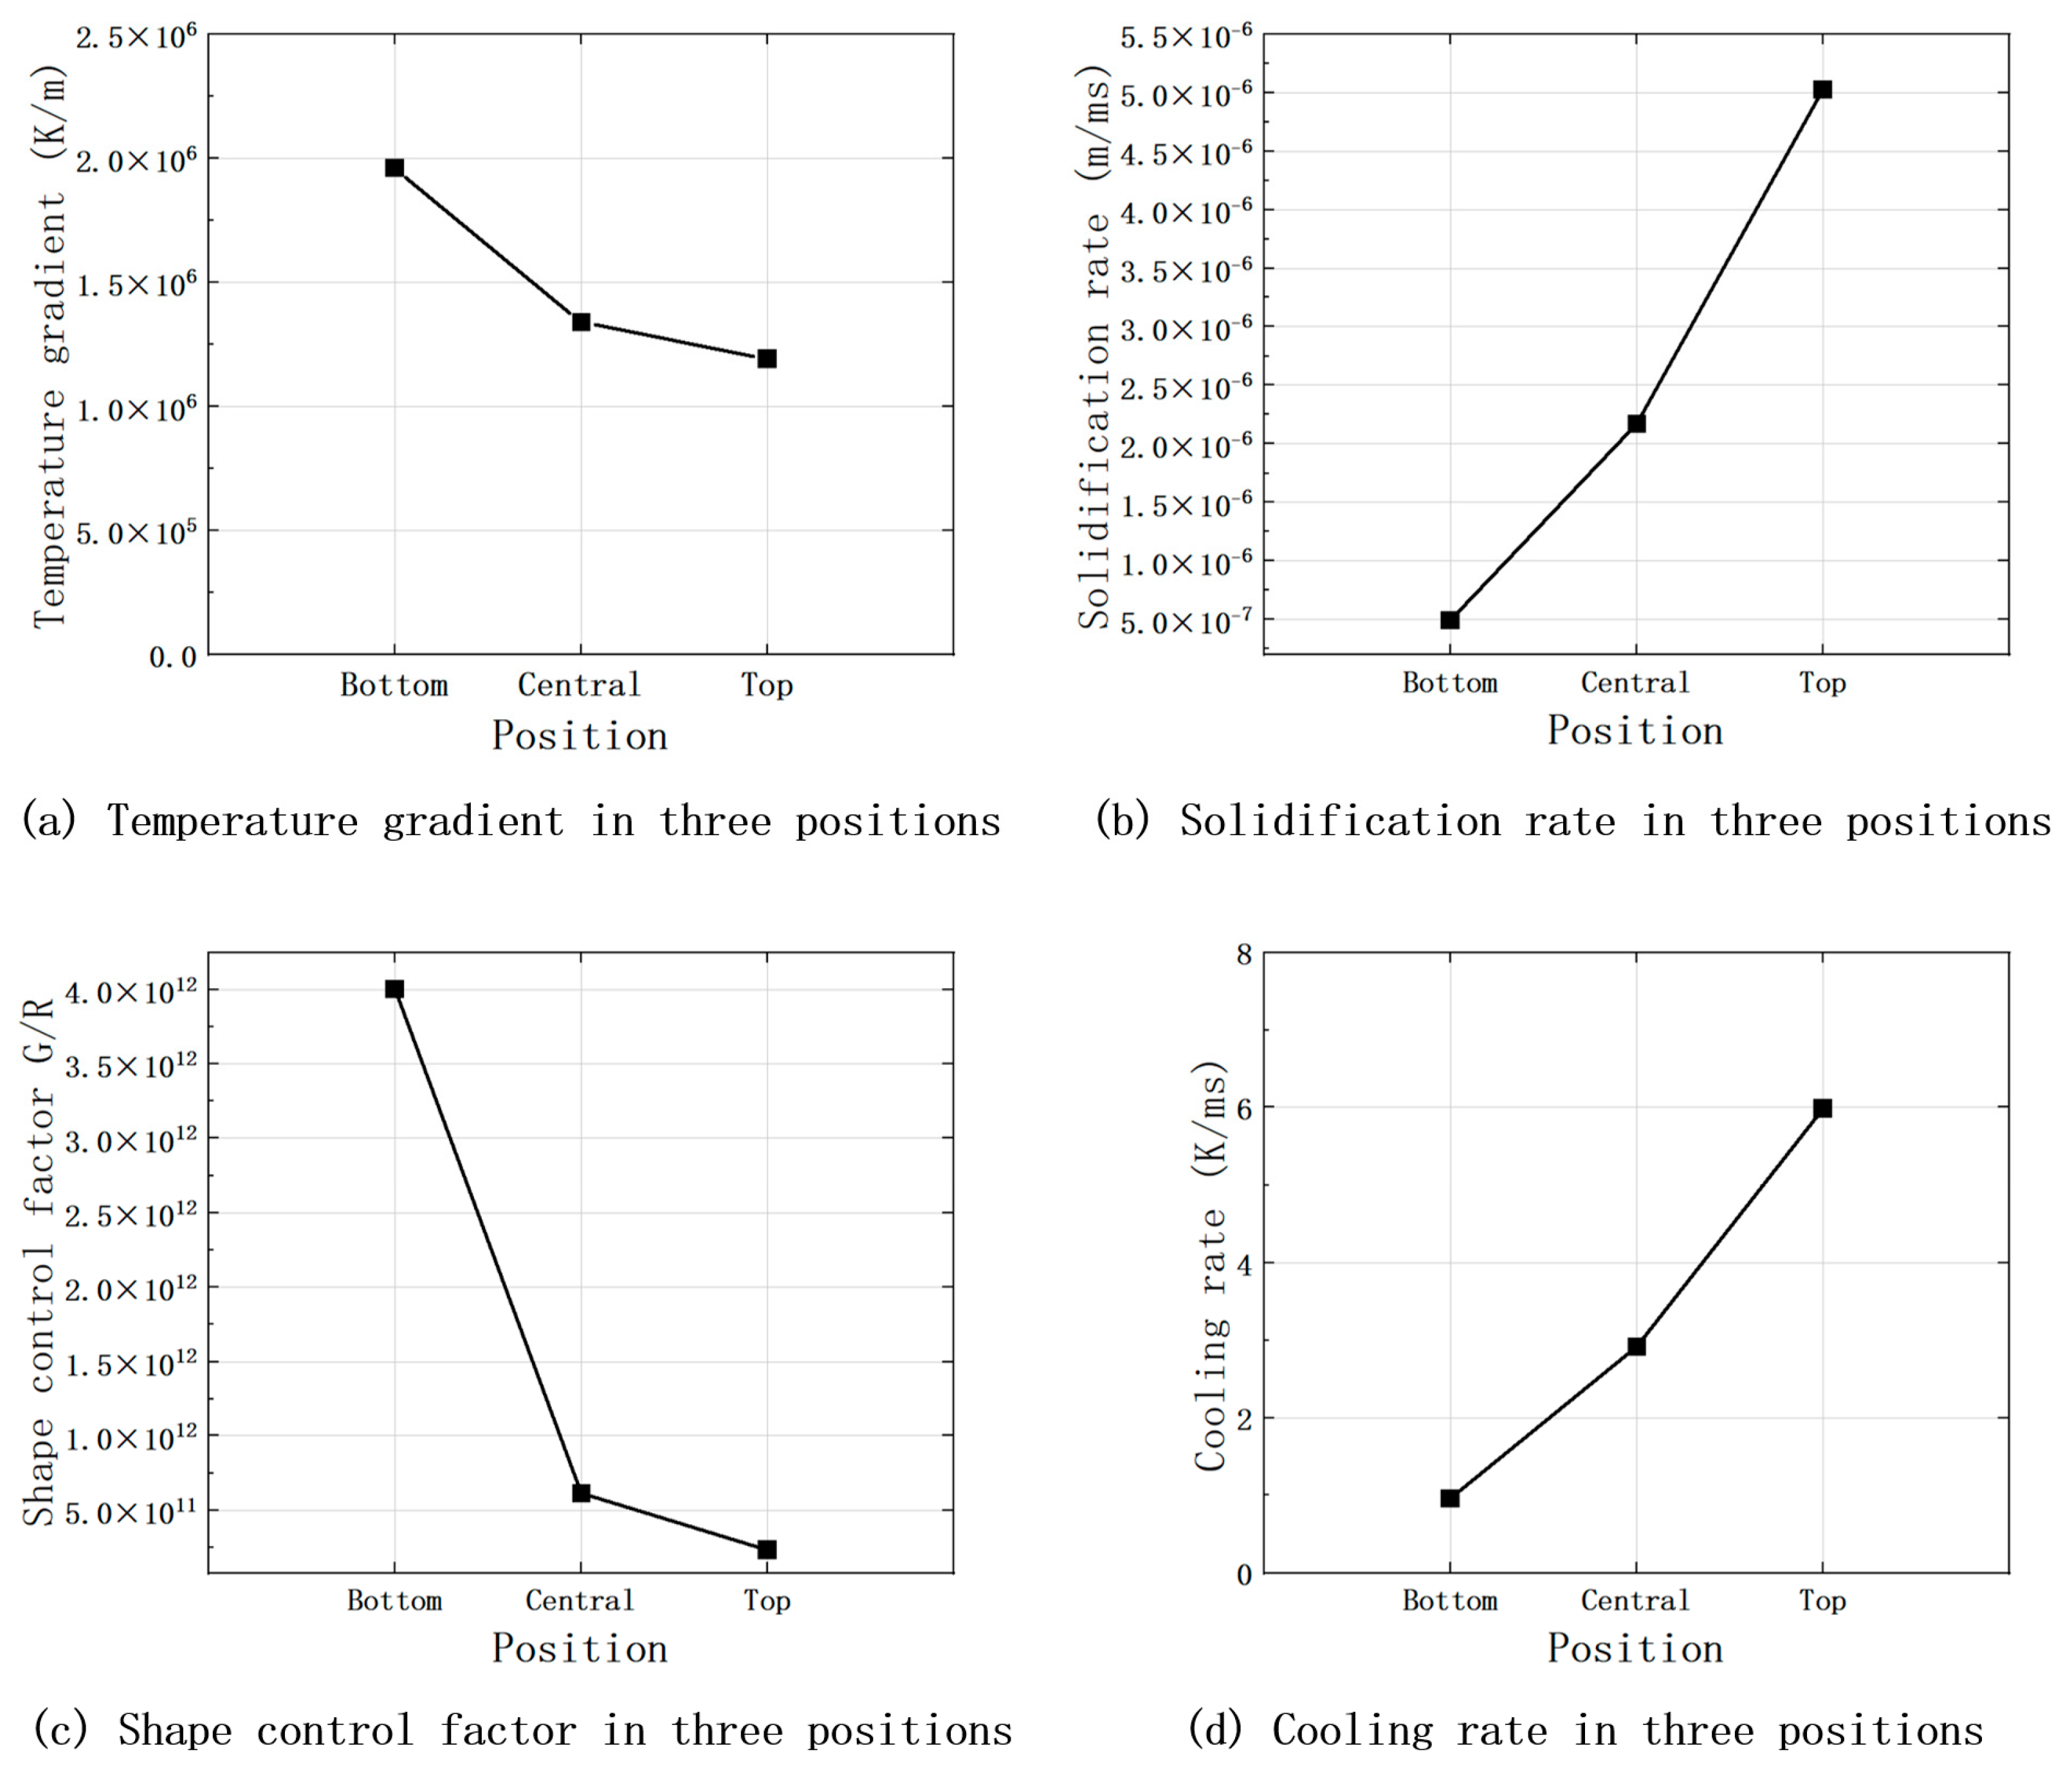
Figure 13.
Solidification data related to the top, middle, and bottom of the fused cladding at the middle cross-section.
Figure 13.
Solidification data related to the top, middle, and bottom of the fused cladding at the middle cross-section.
Figure 14.
Relation and principle of dendrite morphology.
Figure 14.
Relation and principle of dendrite morphology.
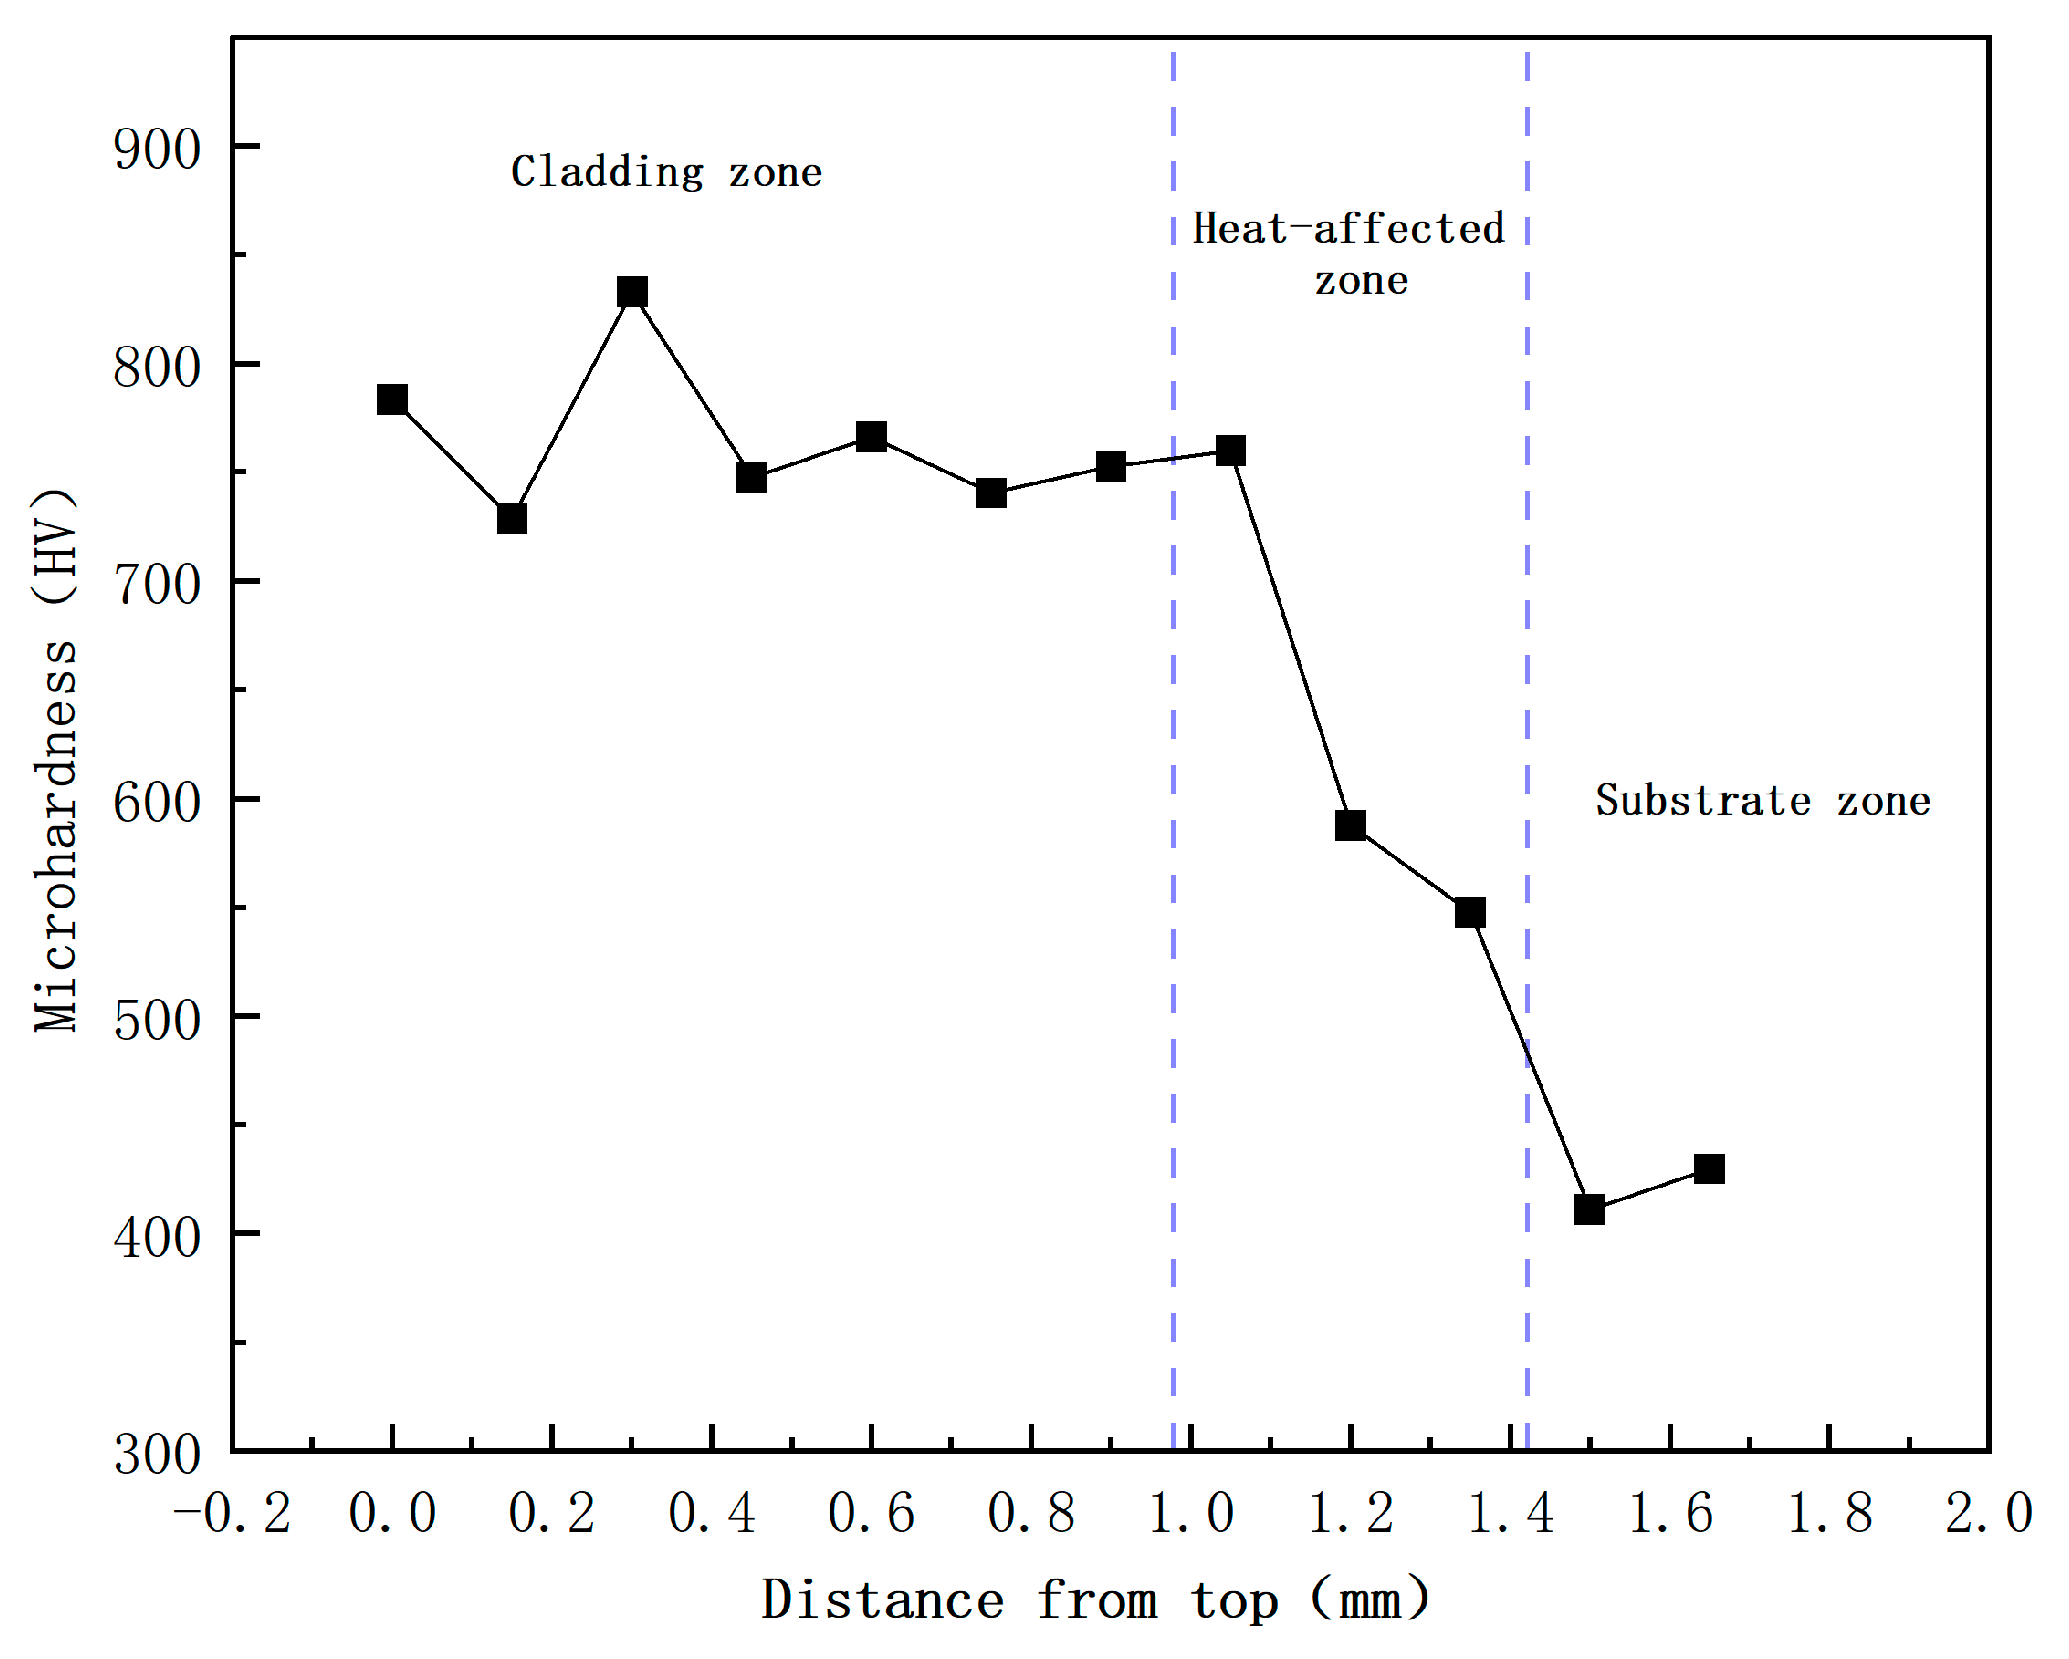
Figure 15.
Microhardness distribution diagram of single-layer Fe60 powder cladding layer.
Figure 15.
Microhardness distribution diagram of single-layer Fe60 powder cladding layer.
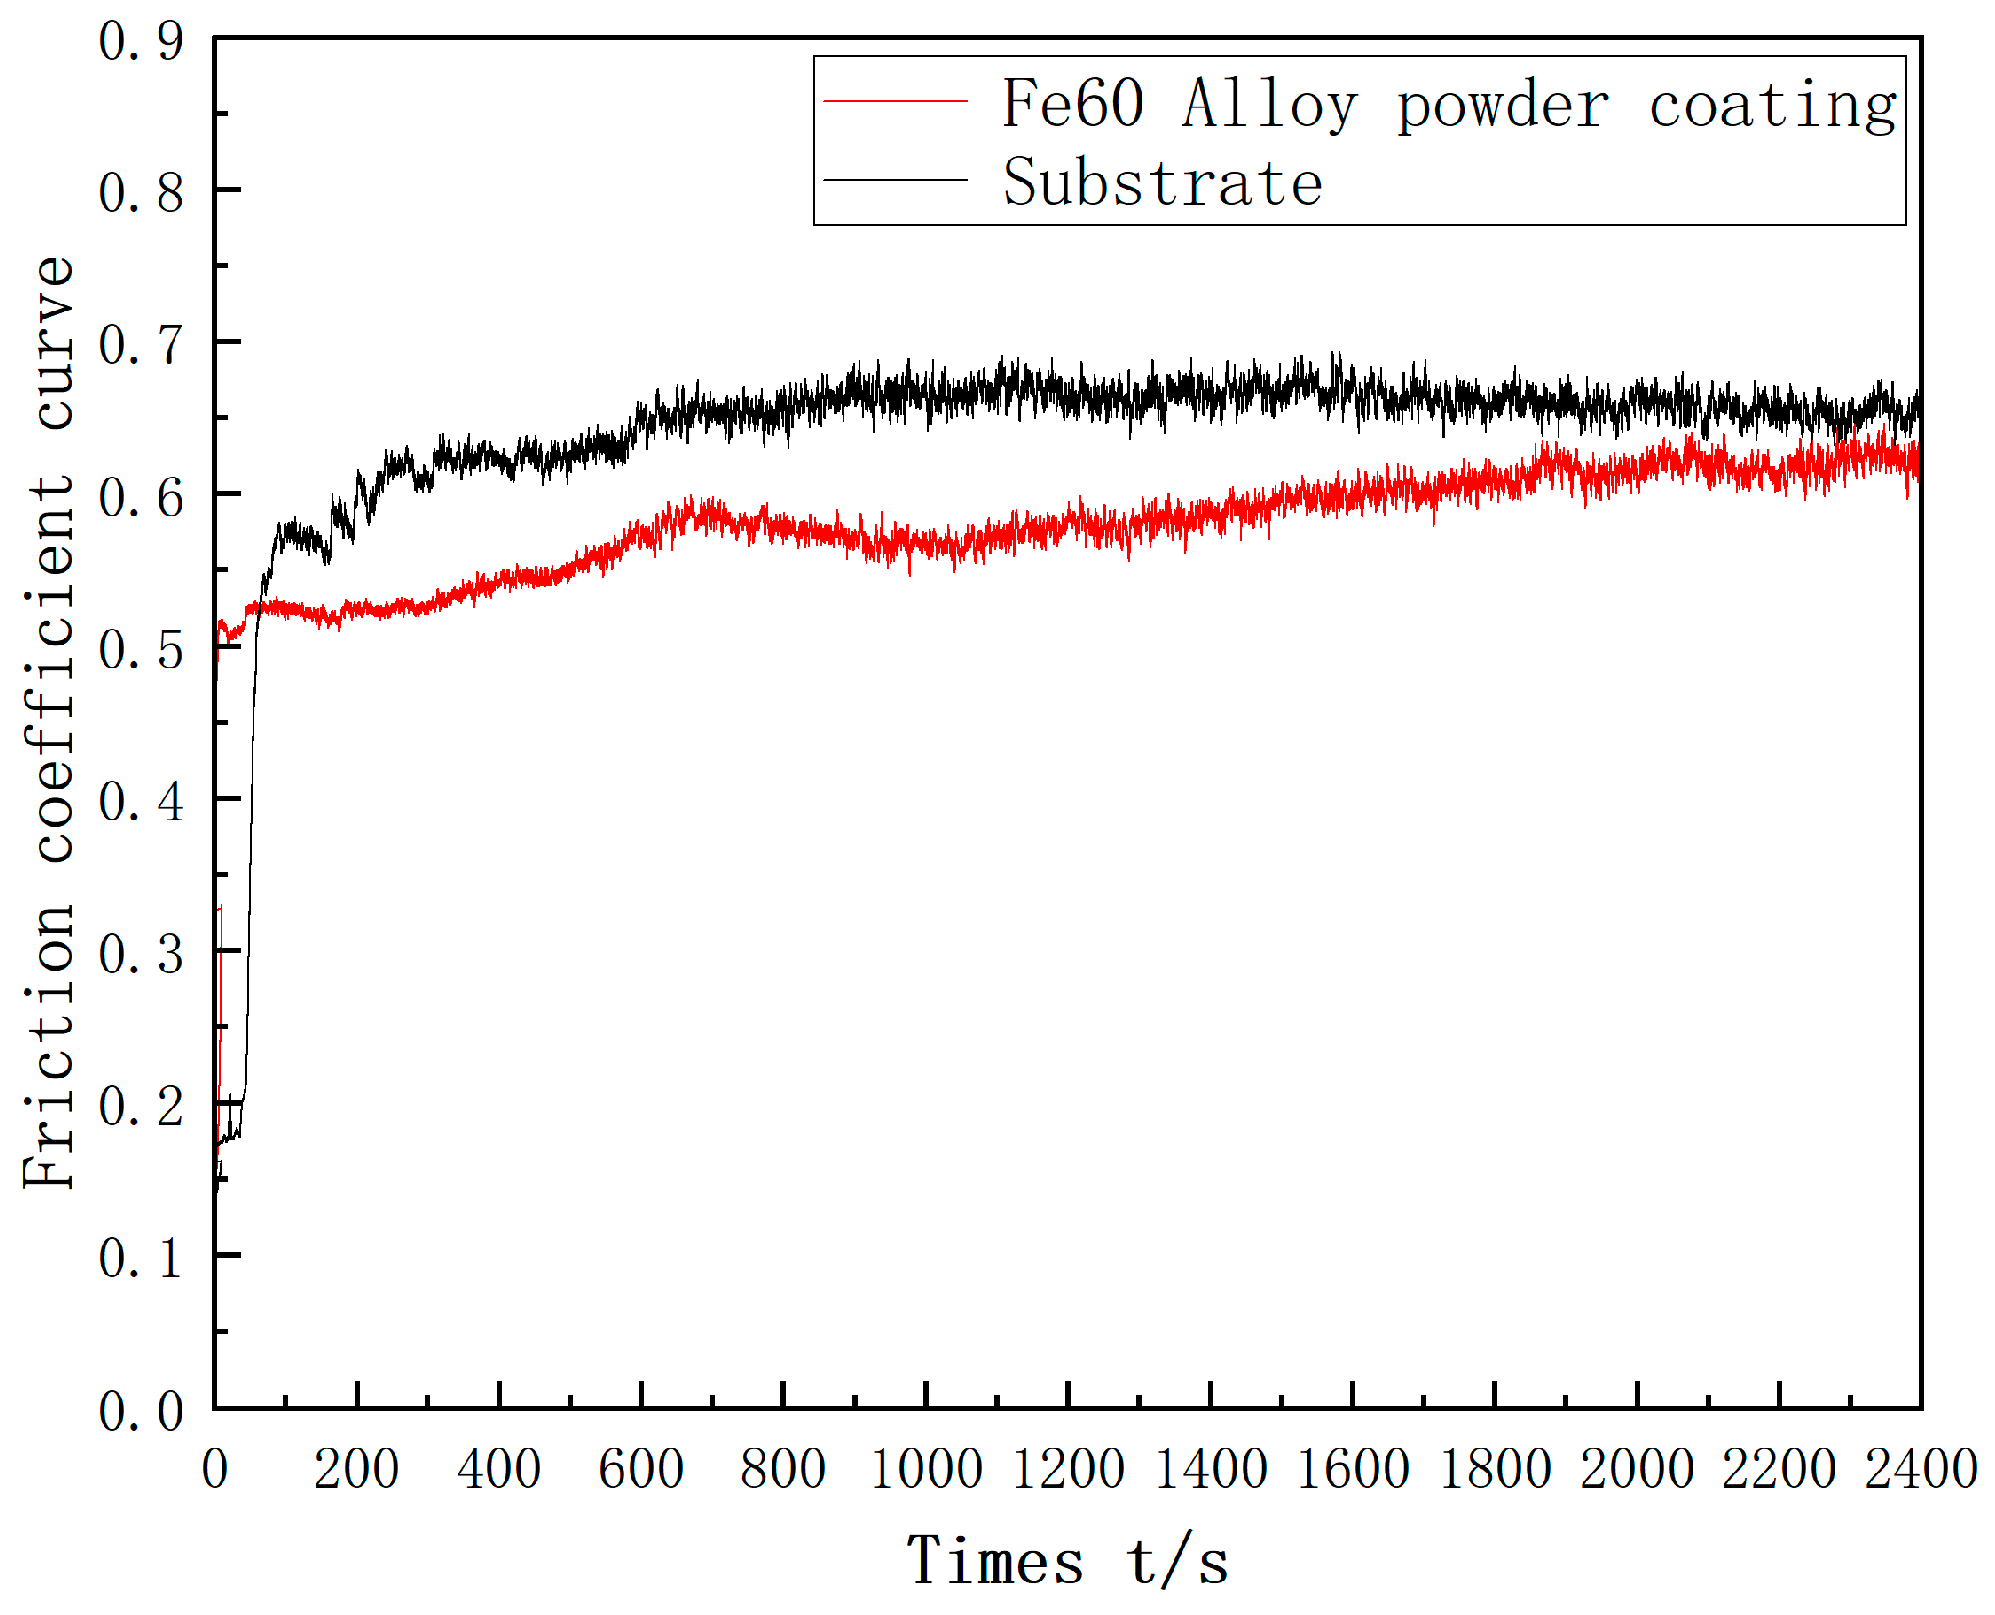
Figure 16.
Friction coefficient curve of Fe-based cladding layer and matrix.
Figure 16.
Friction coefficient curve of Fe-based cladding layer and matrix.
Figure 17.
Wear amount of Fe60 powder cladding layer and matrix.
Figure 17.
Wear amount of Fe60 powder cladding layer and matrix.
Figure 18.
Surface wear morphology of the matrix and Fe60 alloy powder cladding layer.
Figure 18.
Surface wear morphology of the matrix and Fe60 alloy powder cladding layer.
Table 1.
Main chemical components of mixer lining plate.
Table 1.
Main chemical components of mixer lining plate.
| Elements | C | Si | Mn | P | Ni | Mo | S | Fe |
|---|
| Content (Wt.%) | 3.76 | 0.53 | 0.35 | 0.018 | 0.012 | <0.01 | 0.027 | Bal |
Table 2.
Chemical composition of Fe60 alloy powder.
Table 2.
Chemical composition of Fe60 alloy powder.
| Elements | C | Si | B | Cr | Ni | Fe |
|---|
| Content (wt.%) | 0.8–1.2 | 1.0–2.0 | 3.8–4.2 | 16–18 | 9.0–12 | Bal |
Table 3.
Main parameters of the laser cladding device.
Table 3.
Main parameters of the laser cladding device.
| Parameter Name | Parameter Data |
|---|
| Wavelength range | 800–1100 nm |
| Power adjustment range | 10–100% |
| Laser power | 0~4000 W |
| Power density | 104–1010 W/cm2 |
| Maximum modulation frequency | 5 kHz |
Table 4.
Mesh element size parameters.
Table 4.
Mesh element size parameters.
| Region | Maximum Element Size (mm) | Minimum Element Size (mm) |
|---|
| Upper | 0.45 | 0.0849 |
| Middle | 2 | 0.36 |
| Lower | 10 | 1.4 |
Table 5.
Thermo-physical parameters of mixer lining plate.
Table 5.
Thermo-physical parameters of mixer lining plate.
| Temperature (K) | Density (kg/m3) | Specific Heat (J/kg/K) | Thermal Conductivity (W/m/K) |
|---|
| 300 | 7716 | 573 | 11.9 |
| 600 | 7643 | 626 | 16.3 |
| 900 | 7548 | 728 | 19.4 |
| 1200 | 7420 | 705 | 21.6 |
| 1500 | 7015 | 753 | 31.6 |
Table 6.
Thermophysical parameters of Fe60 alloy powder.
Table 6.
Thermophysical parameters of Fe60 alloy powder.
| Temperature (K) | Density (kg/m3) | Specific Heat (J/kg/K) | Thermal Conductivity (W/m/K) |
|---|
| 300 | 7580 | 480 | 18.1 |
| 600 | 7490 | 590 | 23.2 |
| 900 | 7380 | 840 | 25.9 |
| 1200 | 7340 | 740 | 27.5 |
| 1500 | 7155 | 845 | 30.7 |
Table 7.
Parameters used in calculations.
Table 7.
Parameters used in calculations.
| Parameters | Symbol | Value | Unit |
|---|
| Initial temperature | | 293.15 | K |
| Convective heat transfer coefficient | | 1250 | W/m2/K |
| Stephen–Boltzmann constant | | 5.67 × 10⁻⁸ | W/m2/K4 |
| Surface heat dissipation rate | | 0.8 | |
| Laser absorption rate | | 0.4 | |
| Laser masking rate | | 0.5 | |
| Laser power | | 900 | W |
| Spot radius | | 1.5 | mm |
| Scanning speed | | 600 | mm/min |
| Powder feeding speed | | 7 | g/min |
| Powder feeding speed coefficient | | 2.7 × 10⁻³ | |
| Radius of the powder flow | | 1.5 | mm |
Table 8.
Orthogonal test factors and levels.
Table 8.
Orthogonal test factors and levels.
| Controlling Factors | Laser Power (W) | Scanning Speed (mm/min) | Powder Feeding Speed (g/min) |
|---|
| 1 | 800 | 400 | 7 |
| 2 | 900 | 500 | 9 |
| 3 | 1000 | 600 | 11 |
Table 9.
Orthogonal test table.
Table 9.
Orthogonal test table.
| Specimen Number | Laser Power (W) | Scanning Speed (mm/min) | Powder Feeding Speed (g/min) |
|---|
| 1 | 800 | 400 | 7 |
| 2 | 800 | 500 | 9 |
| 3 | 800 | 600 | 11 |
| 4 | 900 | 400 | 9 |
| 5 | 900 | 500 | 11 |
| 6 | 900 | 600 | 7 |
| 7 | 1000 | 400 | 11 |
| 8 | 1000 | 500 | 7 |
| 9 | 1000 | 600 | 9 |
Table 10.
Microhardness score of cladding layer.
Table 10.
Microhardness score of cladding layer.
| Interval (HV) | 550–599 | 600–649 | 650–699 | 700–749 | 750–800 |
|---|
| Score | 0–2 | 3–4 | 5–6 | 7–8 | 9–10 |
Table 11.
Surface quality rating table of cladding layer.
Table 11.
Surface quality rating table of cladding layer.
| Serial Number | Surface Morphology of the Cladding Layer | Score |
|---|
| 1 | The surface of the coating is flat, is bright, has no air holes, and has no cracks; wetting angle () | 9–10 |
| 2 | The coating surface is flat, is bright, is microporous, and has no cracks; wetting angle () | 7–8 |
| 3 | The coating surface is flat, is bright, is microporous, has a small number of cracks; wetting angle () | 5–6 |
| 4 | The coating surface is rough, has obvious pores, and has a small number of cracks; wetting angle () | 3–4 |
| 5 | The coating surface is rough, has a large number of pores, and has a large number of cracks; wetting angle () | 0–2 |
Table 12.
Rating table of dilution rate of cladding layer.
Table 12.
Rating table of dilution rate of cladding layer.
| Interval (%) | 0–9 | 10–20 | 21–30 | 31–40 | 41–50 | 51–60 |
|---|
| Score | 0–2 | 9–10 | 7–8 | 5–6 | 3–4 | 0–2 |
Table 13.
Surface quality table of cladding layer.
Table 14.
Calculation results of coating dilution rate and microhardness.
Table 14.
Calculation results of coating dilution rate and microhardness.
| Specimen Number | Melting Width (mm) | Melting Depth (mm) | Melting Height (mm) | Dilution
Ratio (%) | Microhardness (HV) |
|---|
| 1 | 1.751 | 0.036 | 1.511 | 2.3 | 663 |
| 2 | 1.759 | 0.062 | 1.311 | 4.5 | 661 |
| 3 | 1.717 | 0.039 | 1.523 | 2.5 | 626 |
| 4 | 2.131 | 0.516 | 1.606 | 24 | 726 |
| 5 | 1.825 | 0.061 | 1.655 | 3.5 | 647 |
| 6 | 2.023 | 0.456 | 1.048 | 30 | 767 |
| 7 | 2.129 | 0.665 | 1.887 | 26 | 683 |
| 8 | 2.305 | 0.597 | 1.190 | 33 | 730 |
| 9 | 2.047 | 0.470 | 1.261 | 27 | 738 |
Table 15.
Results of weighted comprehensive analysis.
Table 15.
Results of weighted comprehensive analysis.
Specimen
Number | Surface
Hardness | Dilution Ratio | Surface Quality | Comprehensive Evaluation Score |
|---|
| 1 | 5 | 0 | 5 | 3.5 |
| 2 | 5 | 0 | 5 | 3.5 |
| 3 | 4 | 0 | 5 | 3 |
| 4 | 8 | 8 | 6 | 7.6 |
| 5 | 4 | 0 | 5 | 3 |
| 6 | 9 | 7 | 9 | 8.4 |
| 7 | 6 | 7 | 6 | 6.3 |
| 8 | 8 | 6 | 9 | 7.6 |
| 9 | 8 | 7 | 9 | 7.9 |
Table 16.
Process parameters of cladding layers with different bonding rates.
Table 16.
Process parameters of cladding layers with different bonding rates.
| Specimen Number | Laser Power (W) | Scanning Speed (mm/min) | Powder Feeding (g/min) | Overlap Rate (%) |
|---|
| 1 | 900 | 600 | 7 | 30 |
| 2 | 900 | 600 | 7 | 40 |
| 3 | 900 | 600 | 7 | 50 |


