
Determination of Lubrication Layer Thickness and Its Effect on Concrete Pumping Pressure


Abstract
1. Introduction
2. Materials and Methods
2.1. Characteristics of Initial Materials

| Concrete Grade | Water–Cement Ratio | Water | Cement | Secondary Fly Ash | Sand | Stone | Water-Reducing Agent |
|---|---|---|---|---|---|---|---|
| C30 | 0.42 | 164 | 300 | 90 | 900 | 1080 | 3.2 |
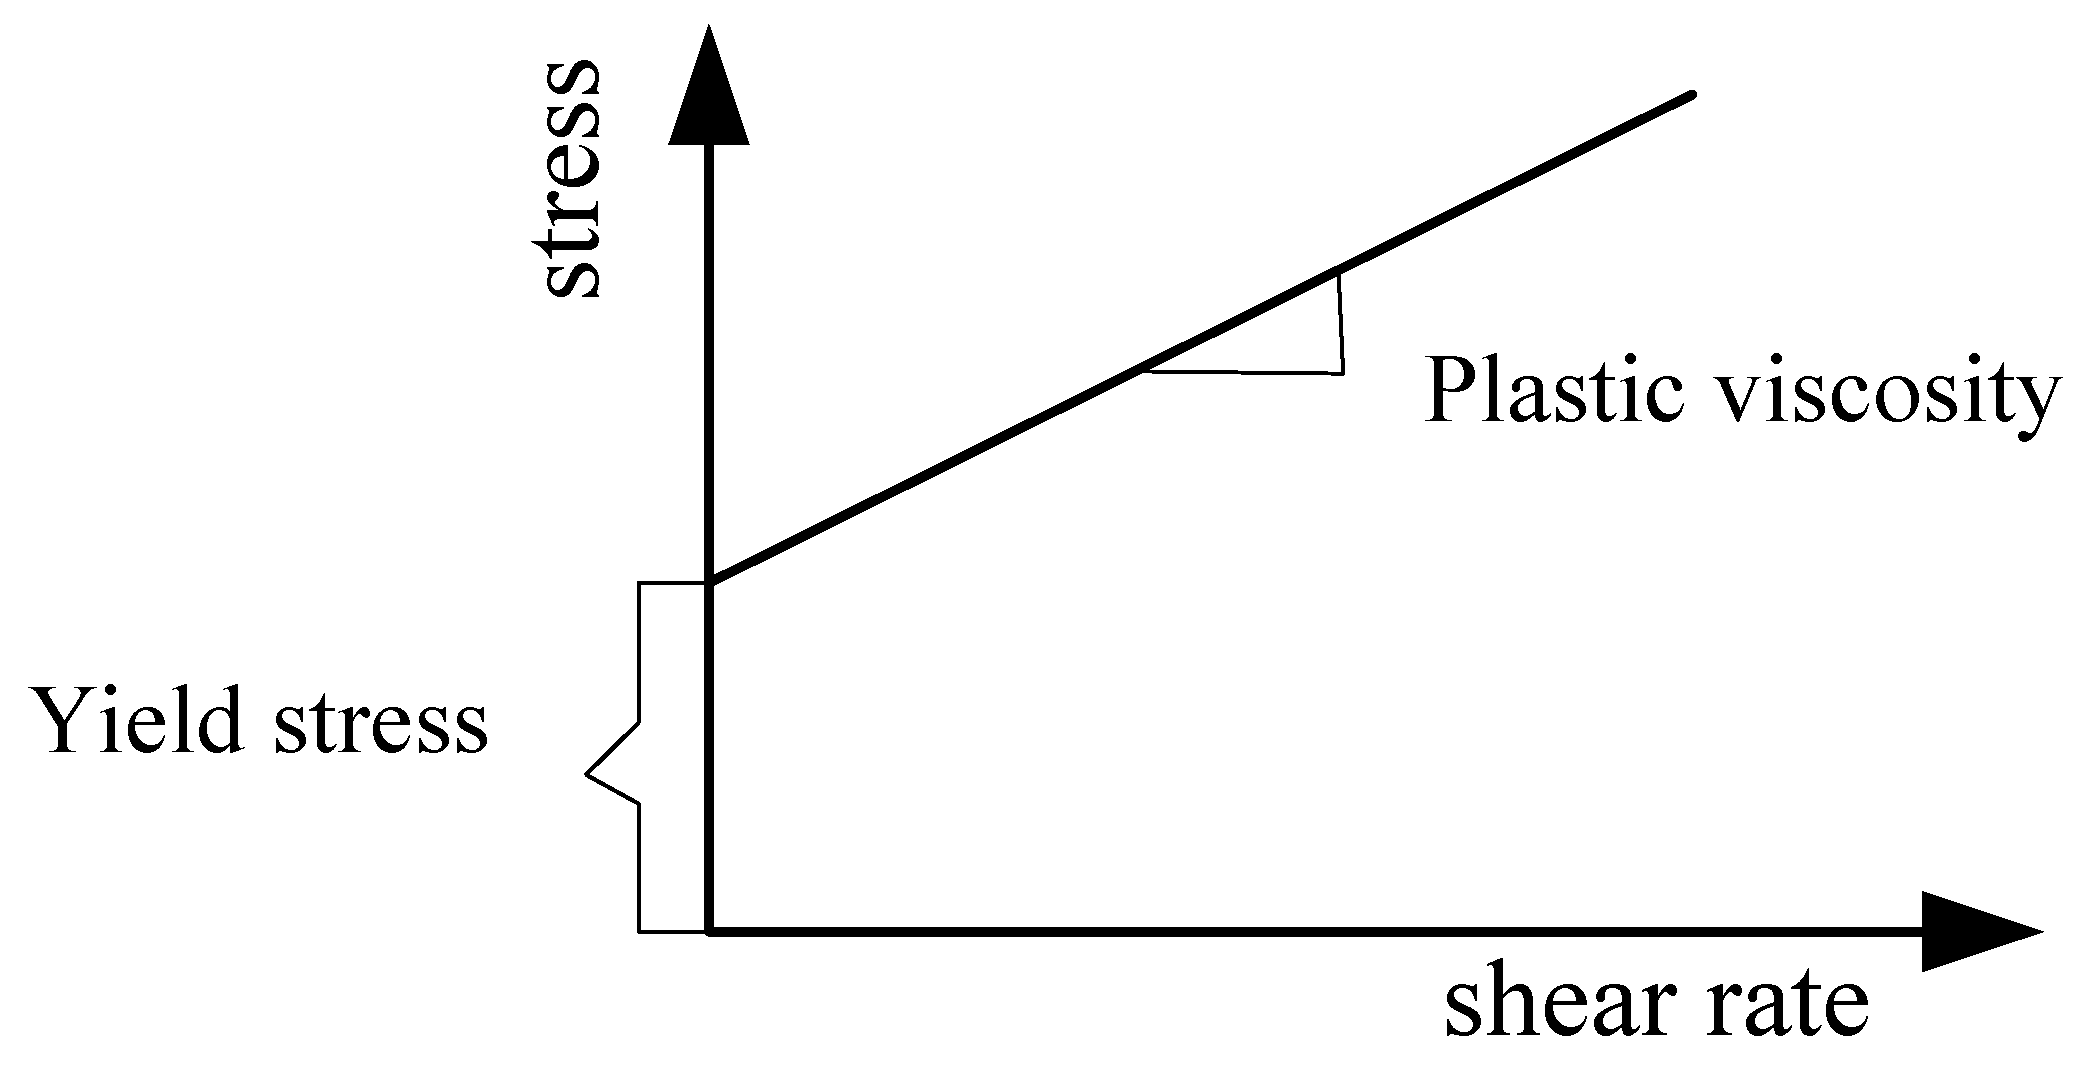
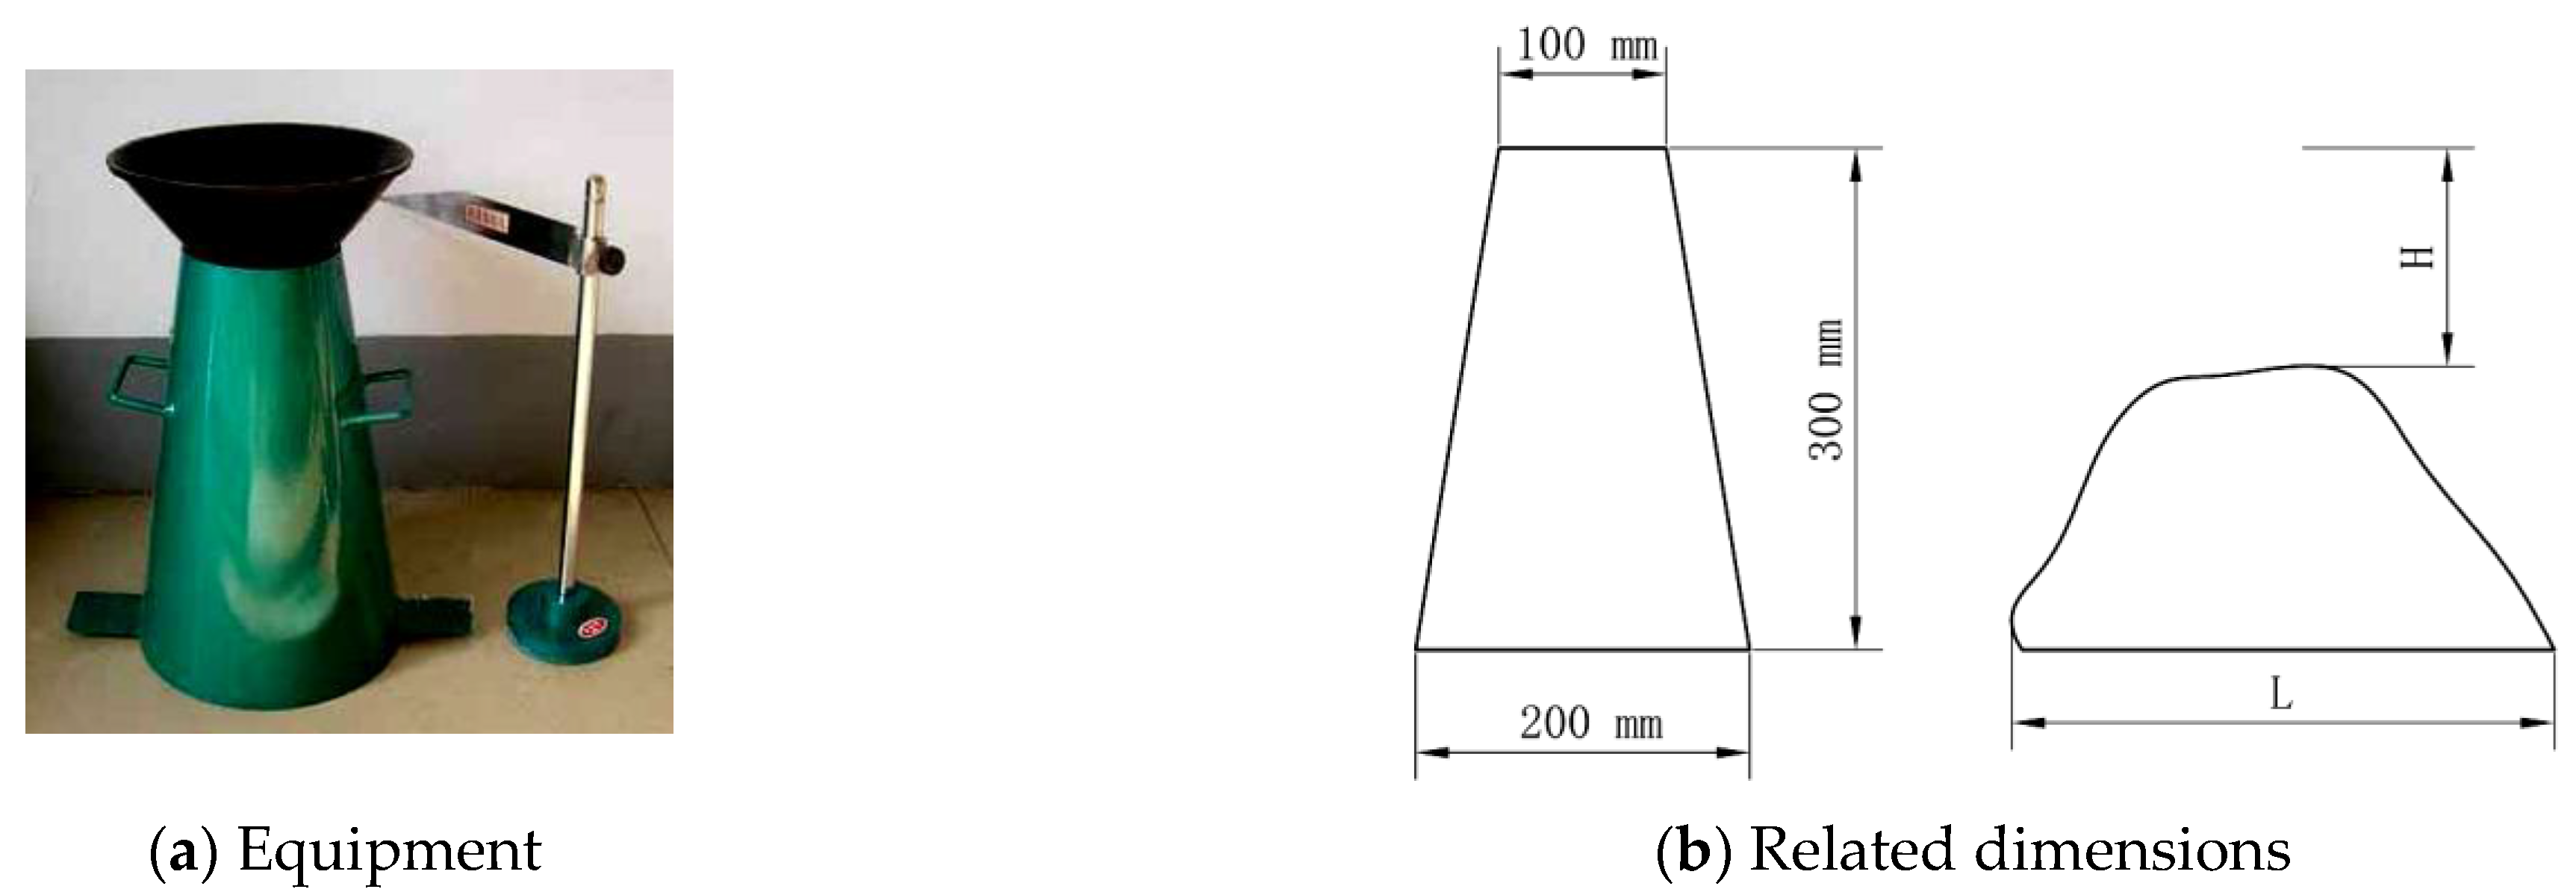
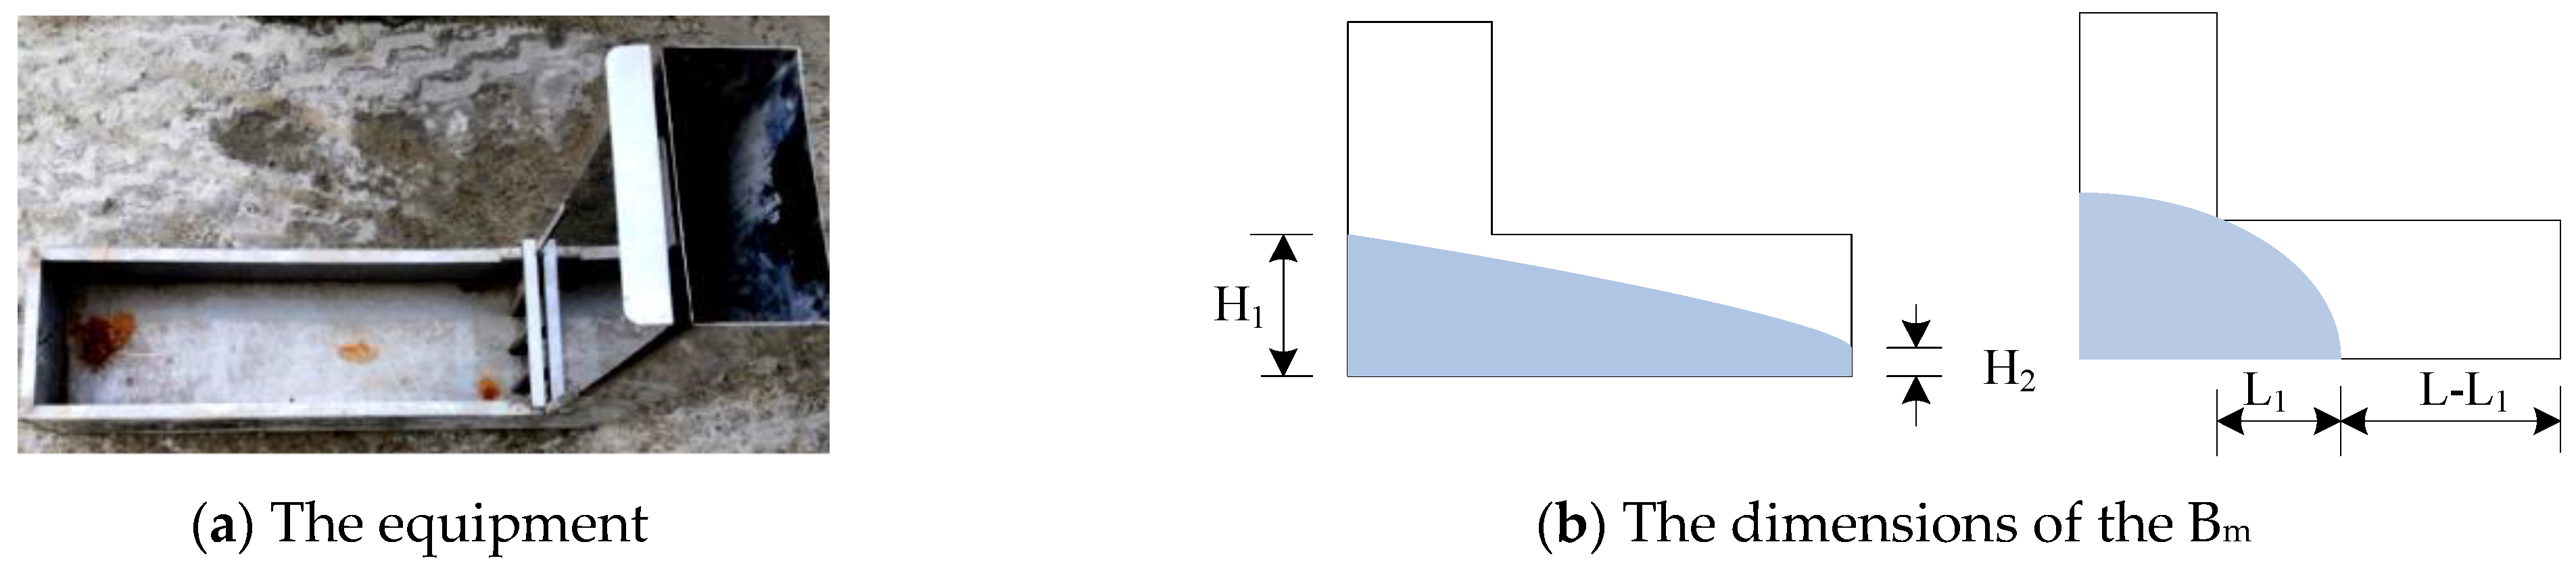
2.2. Experiment
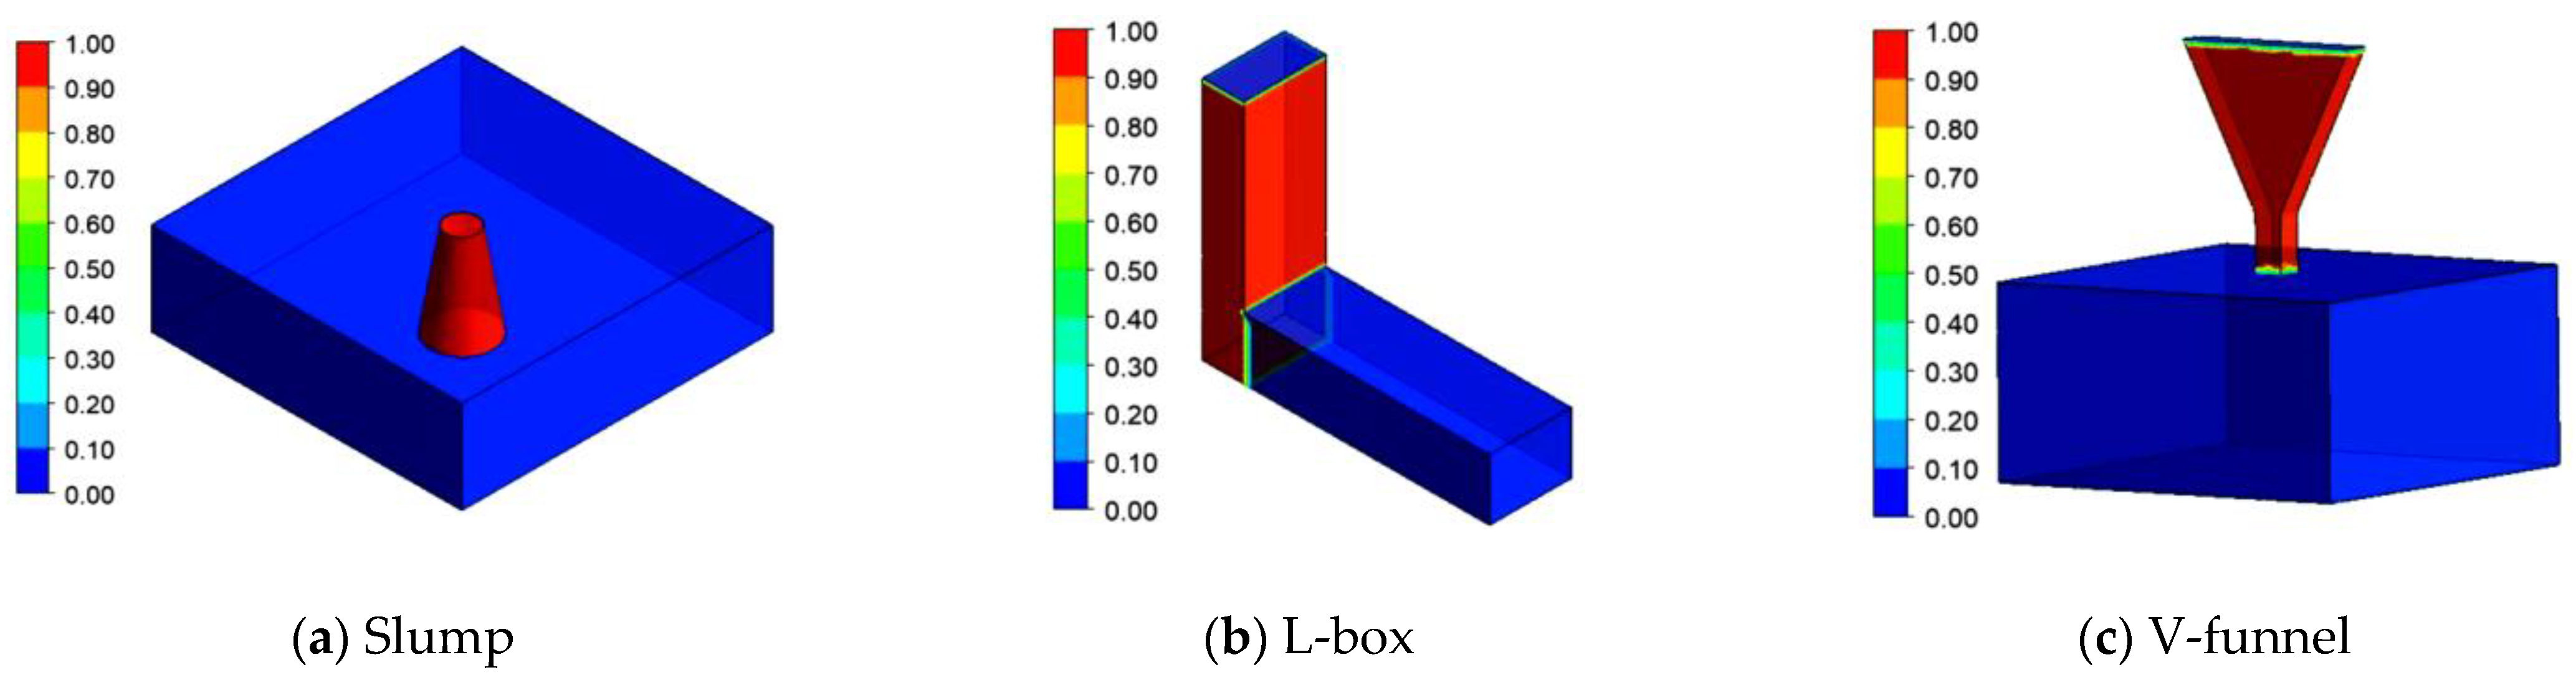
2.3. Simulation
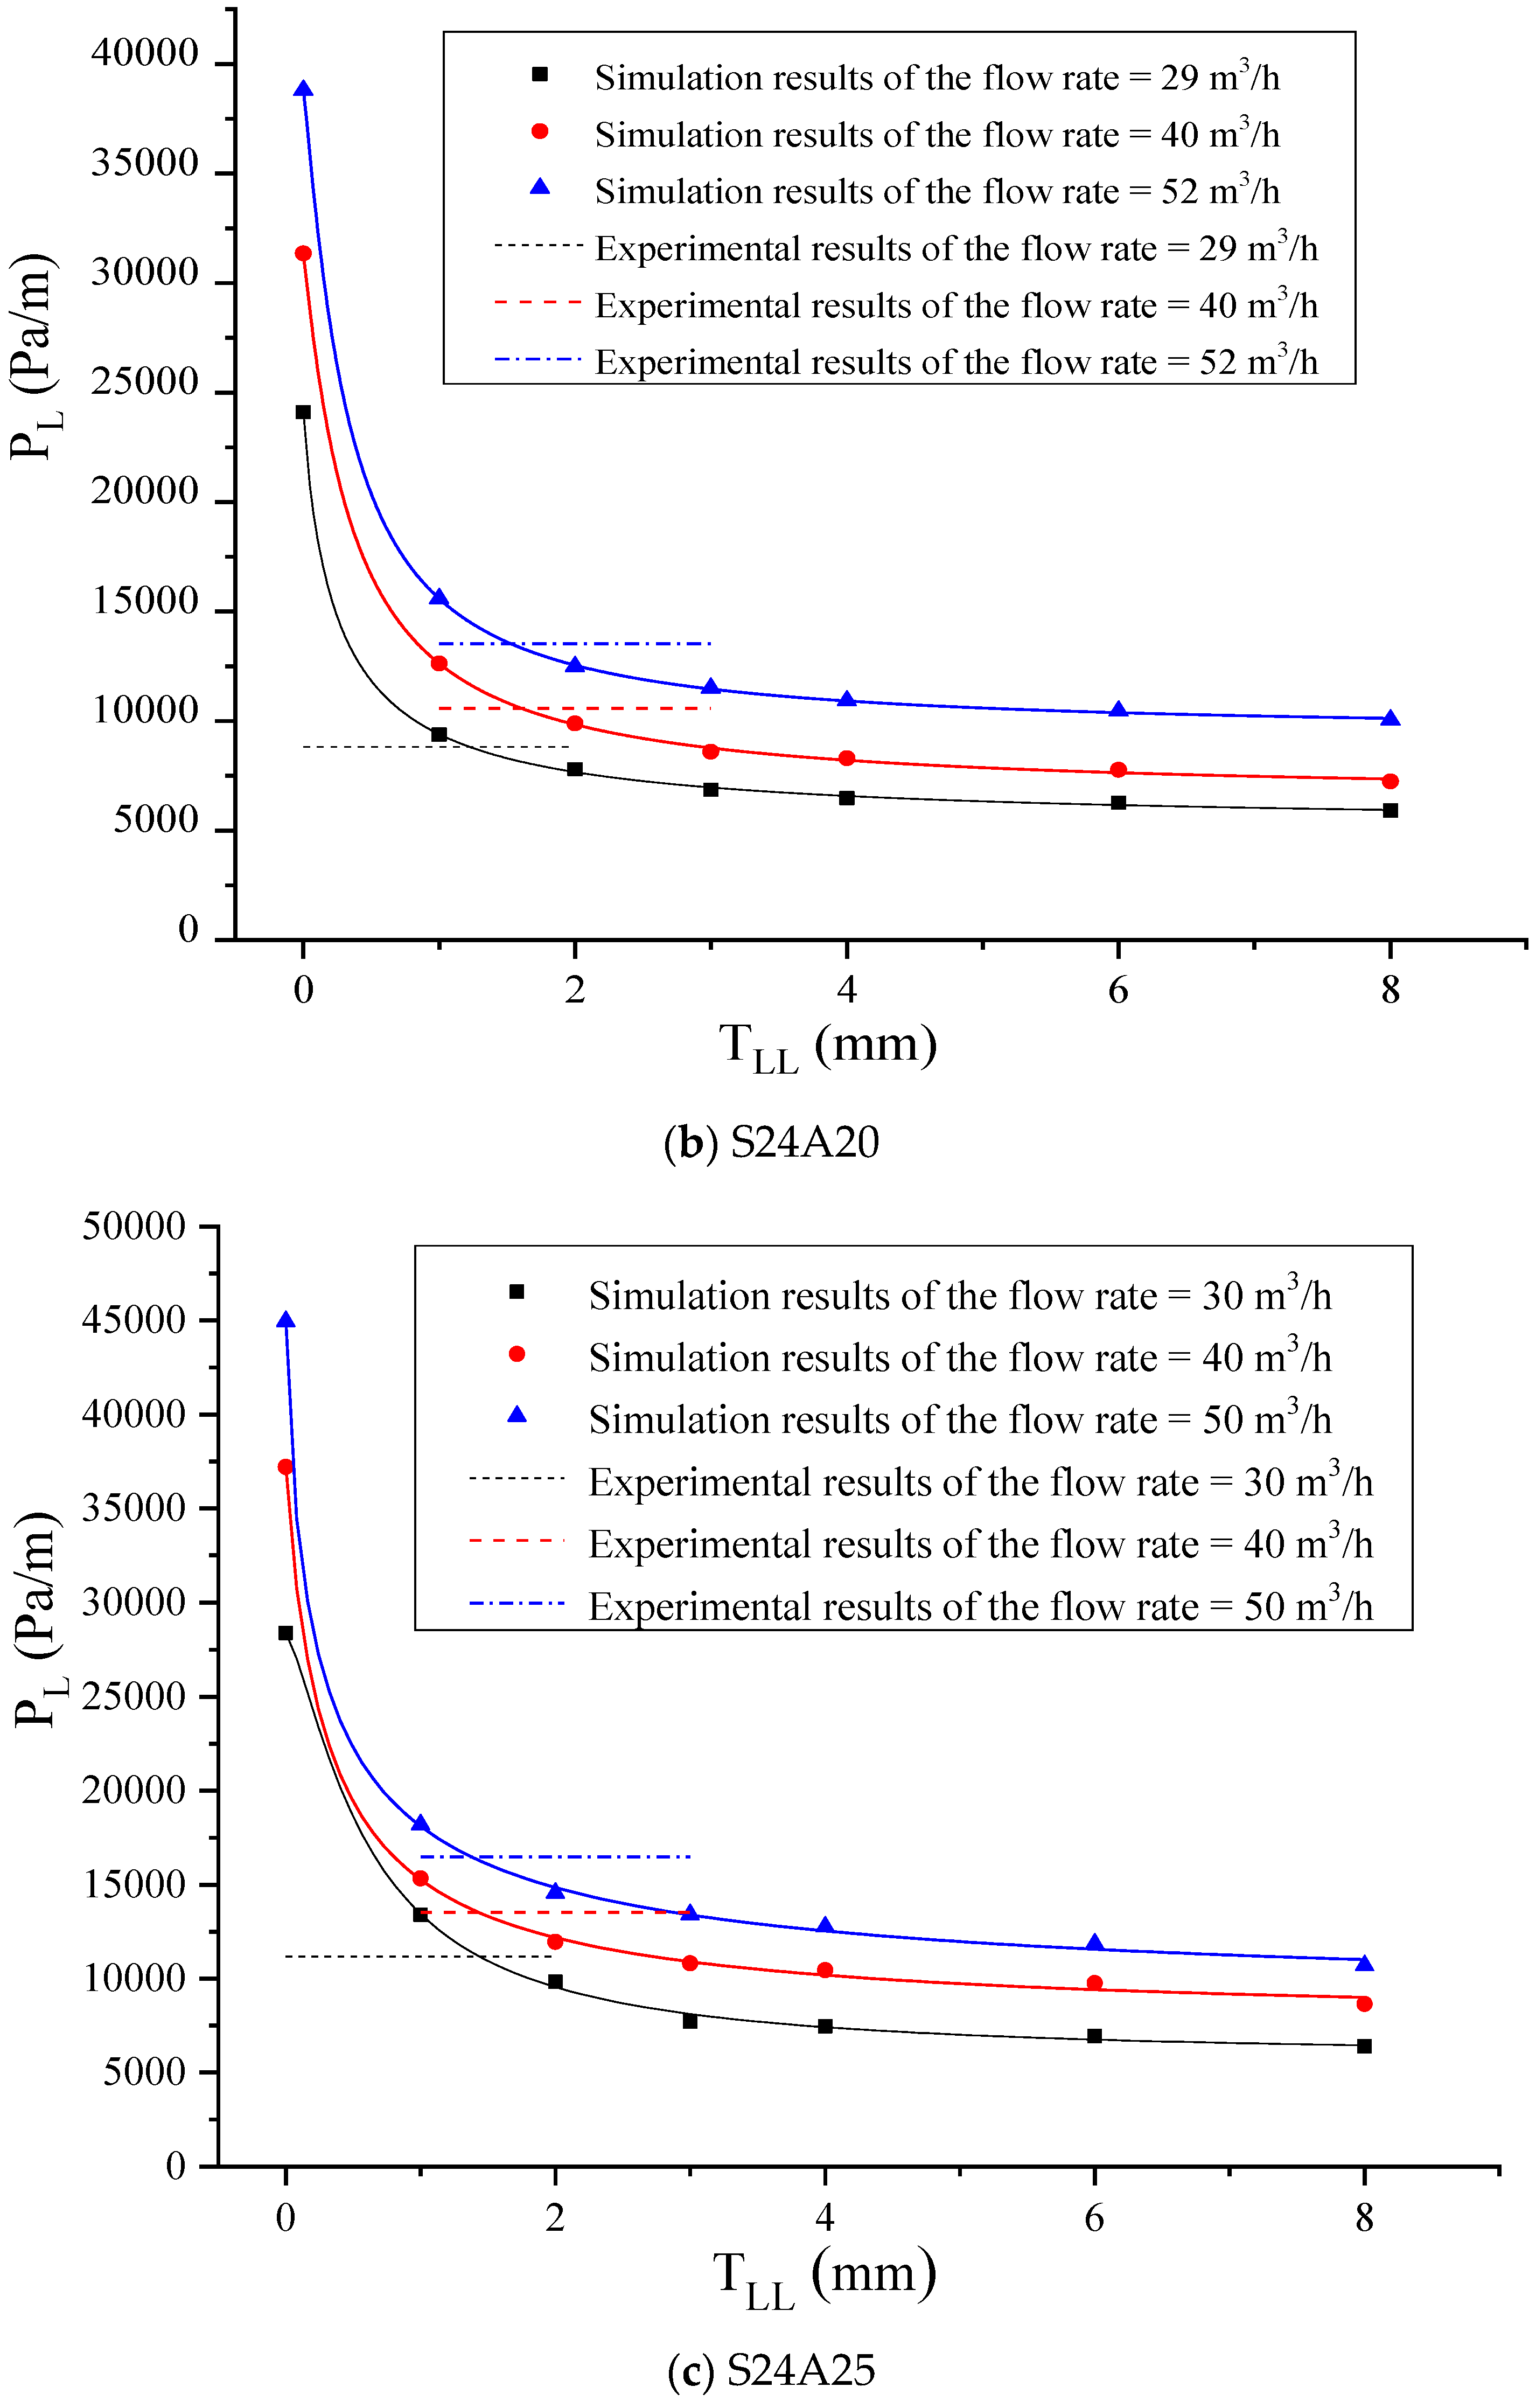
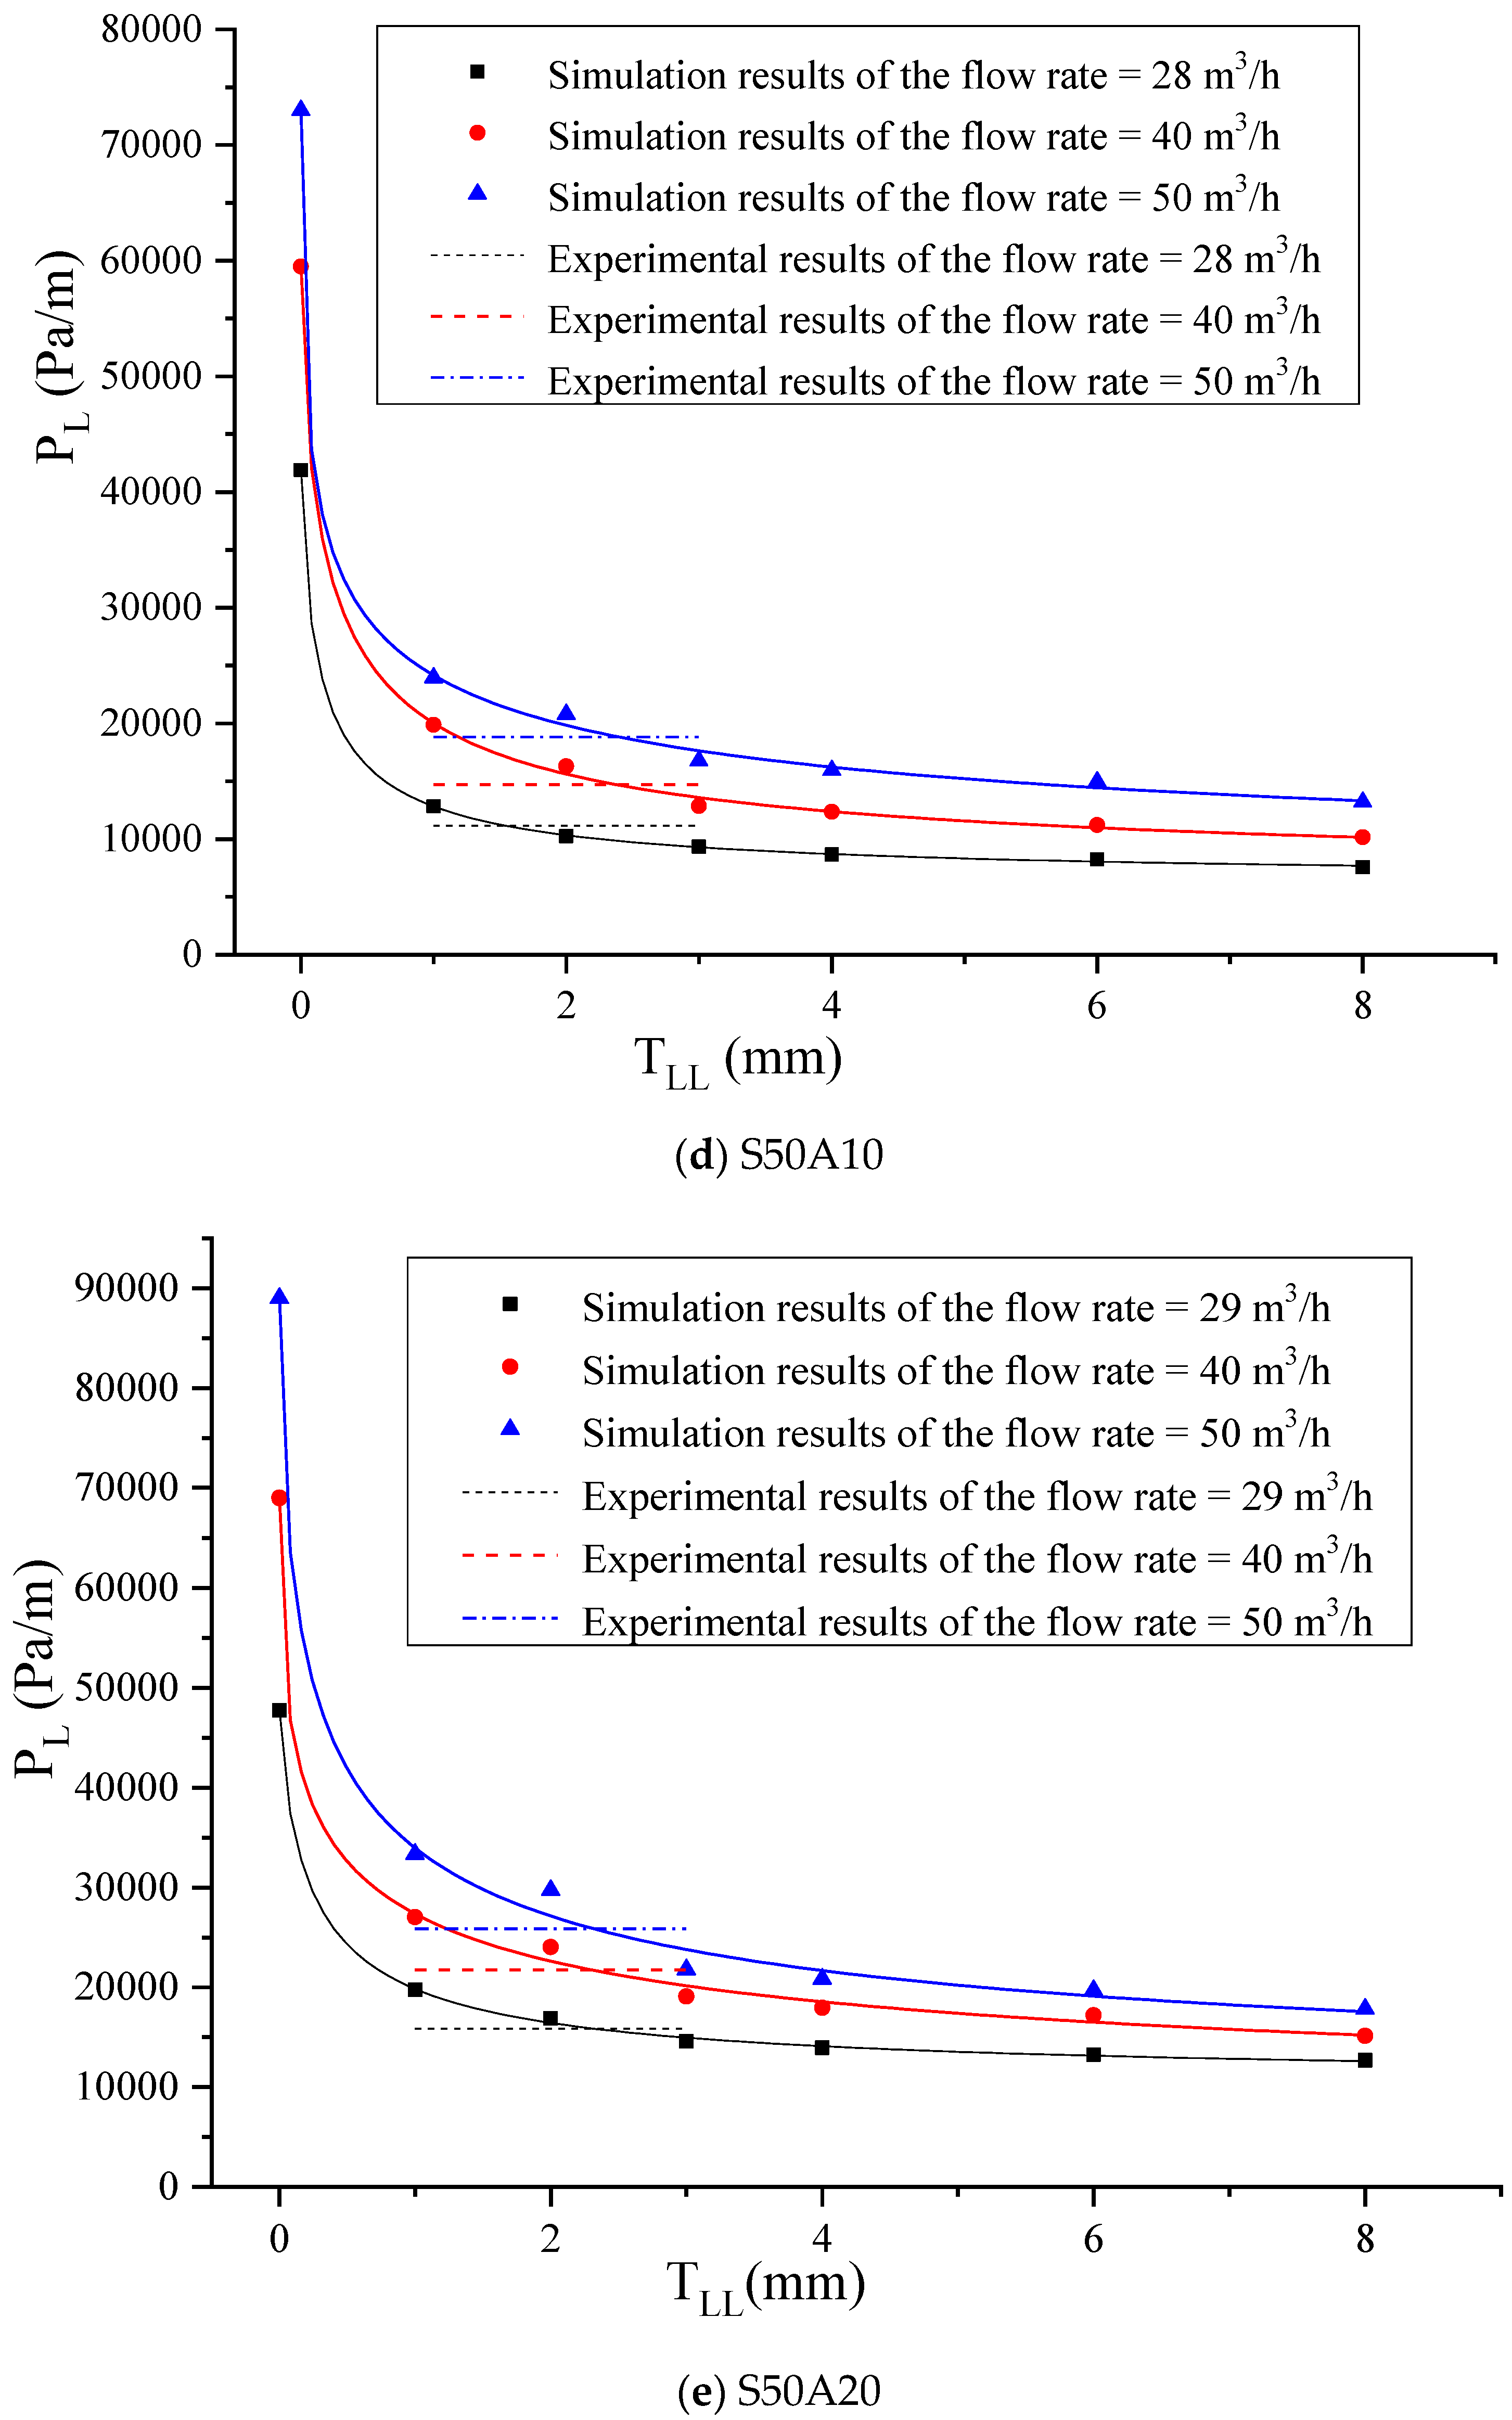
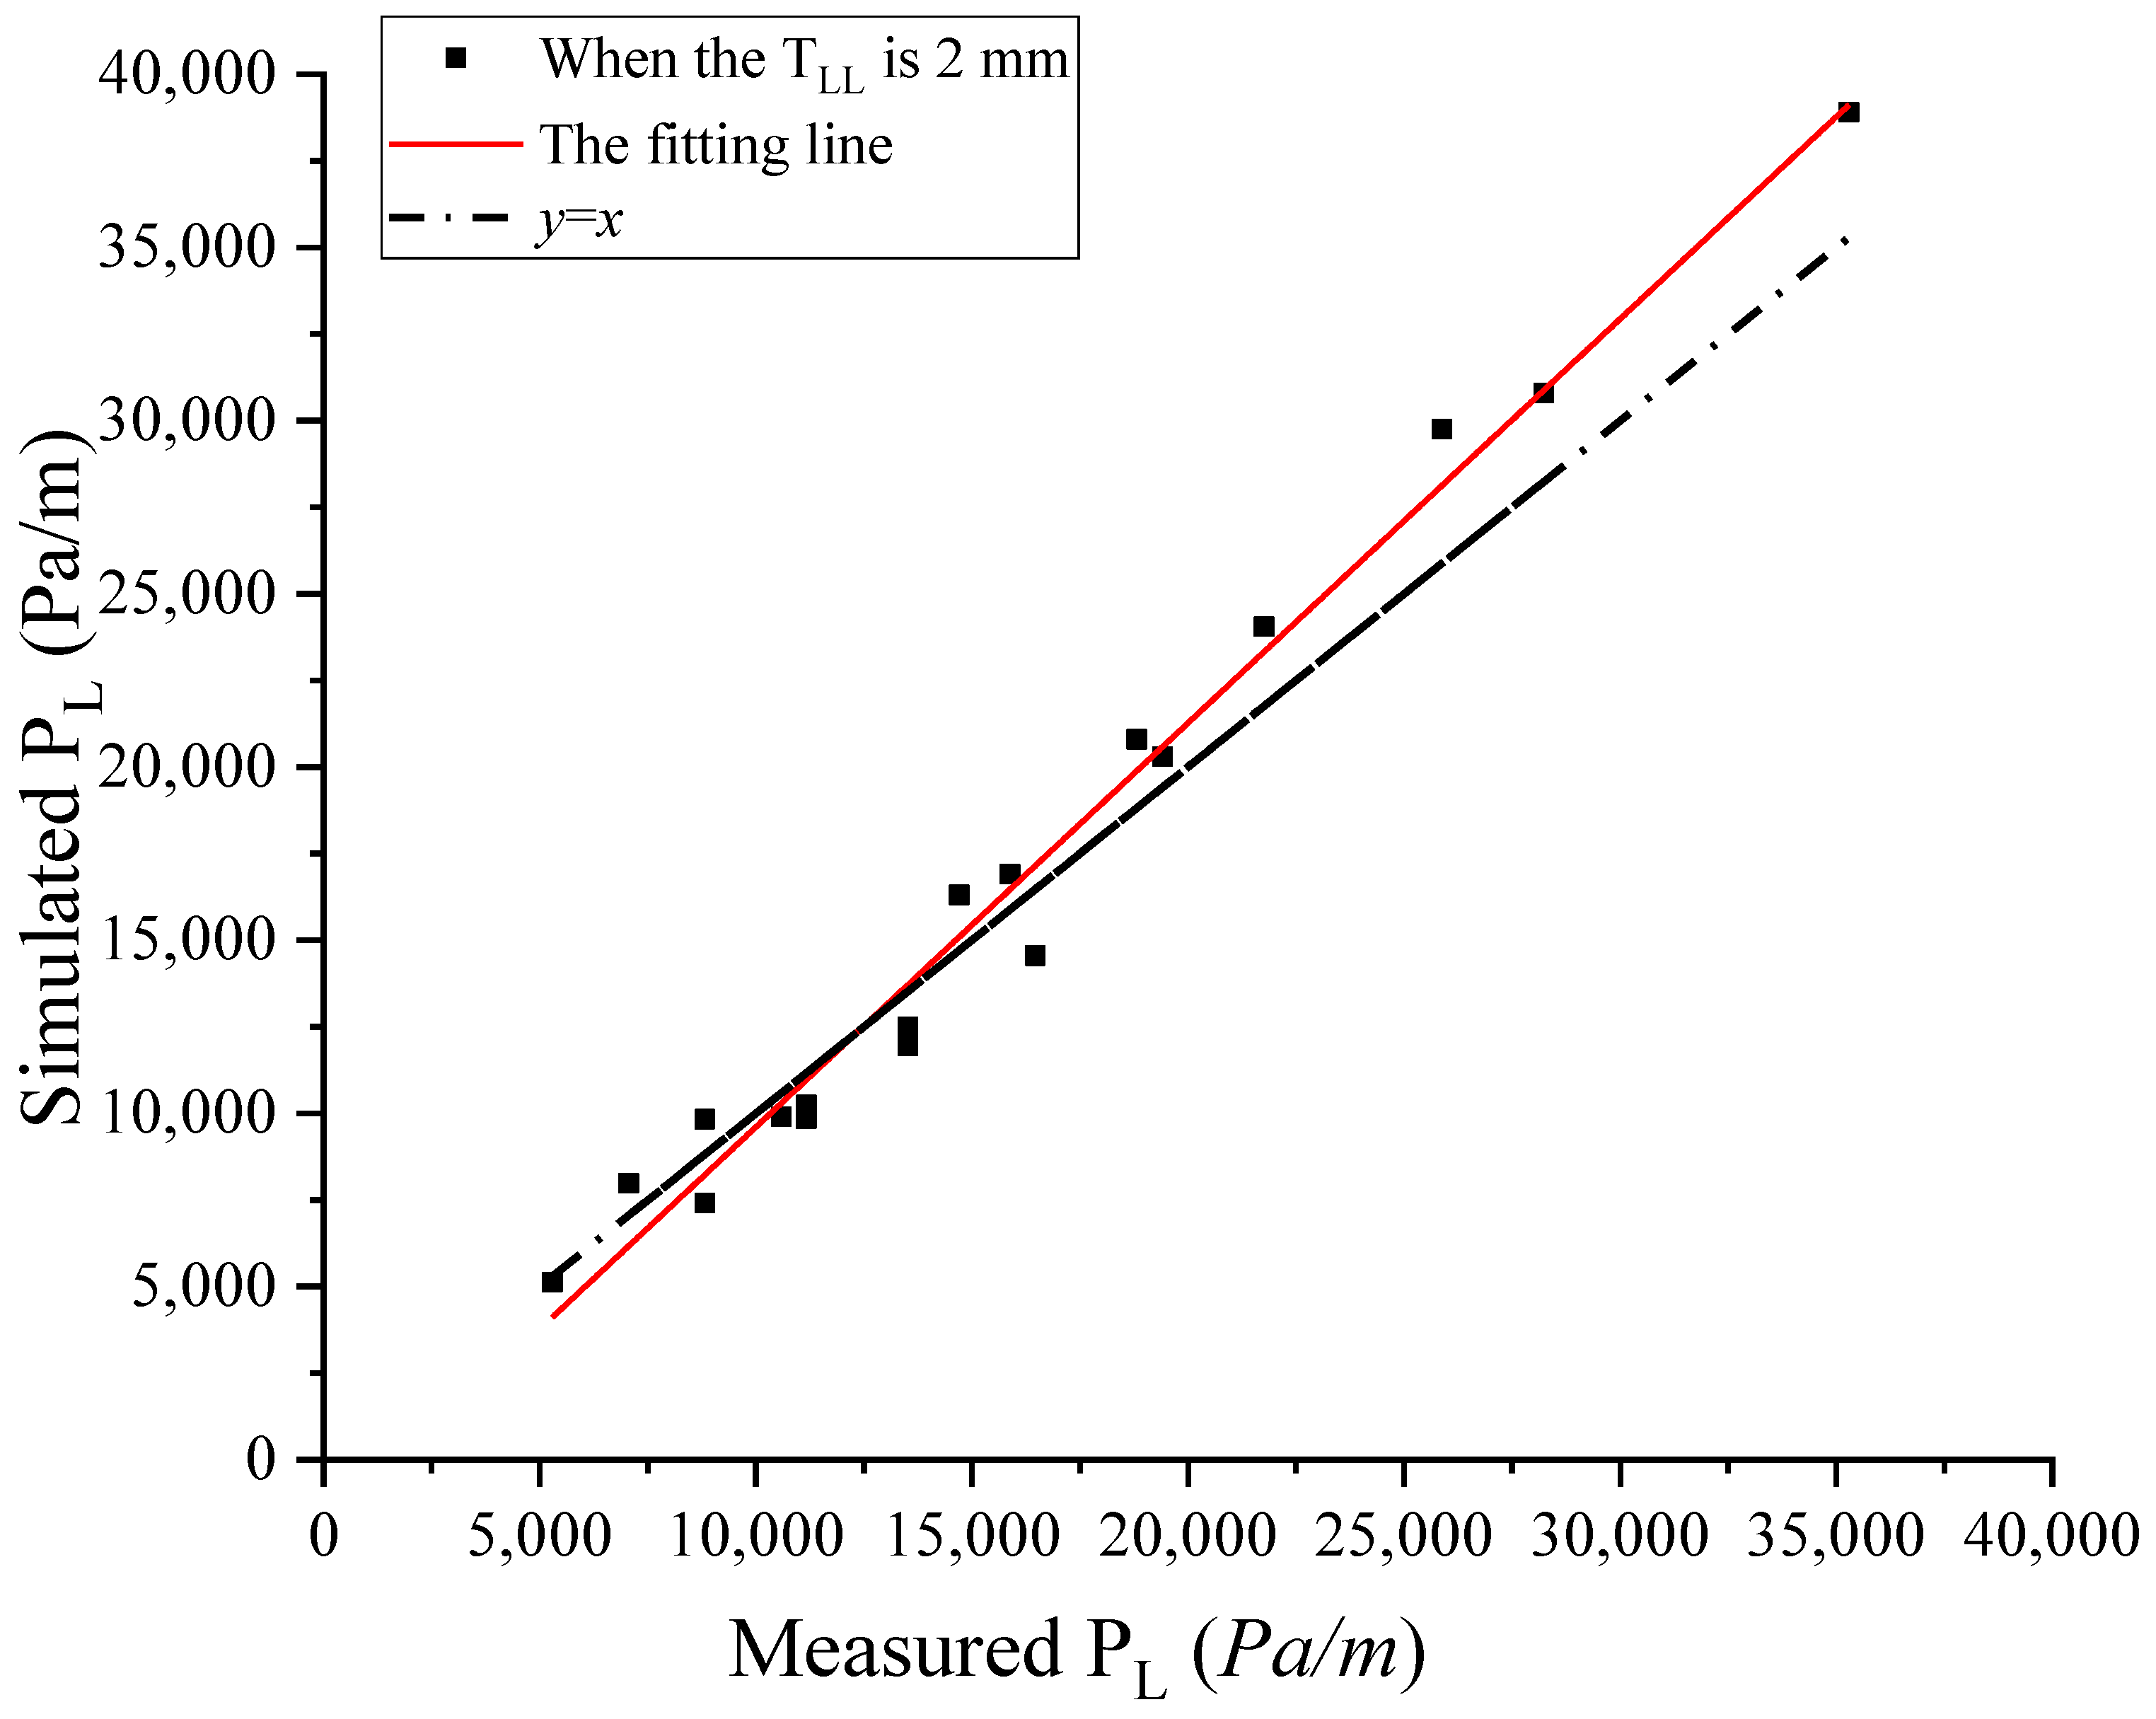
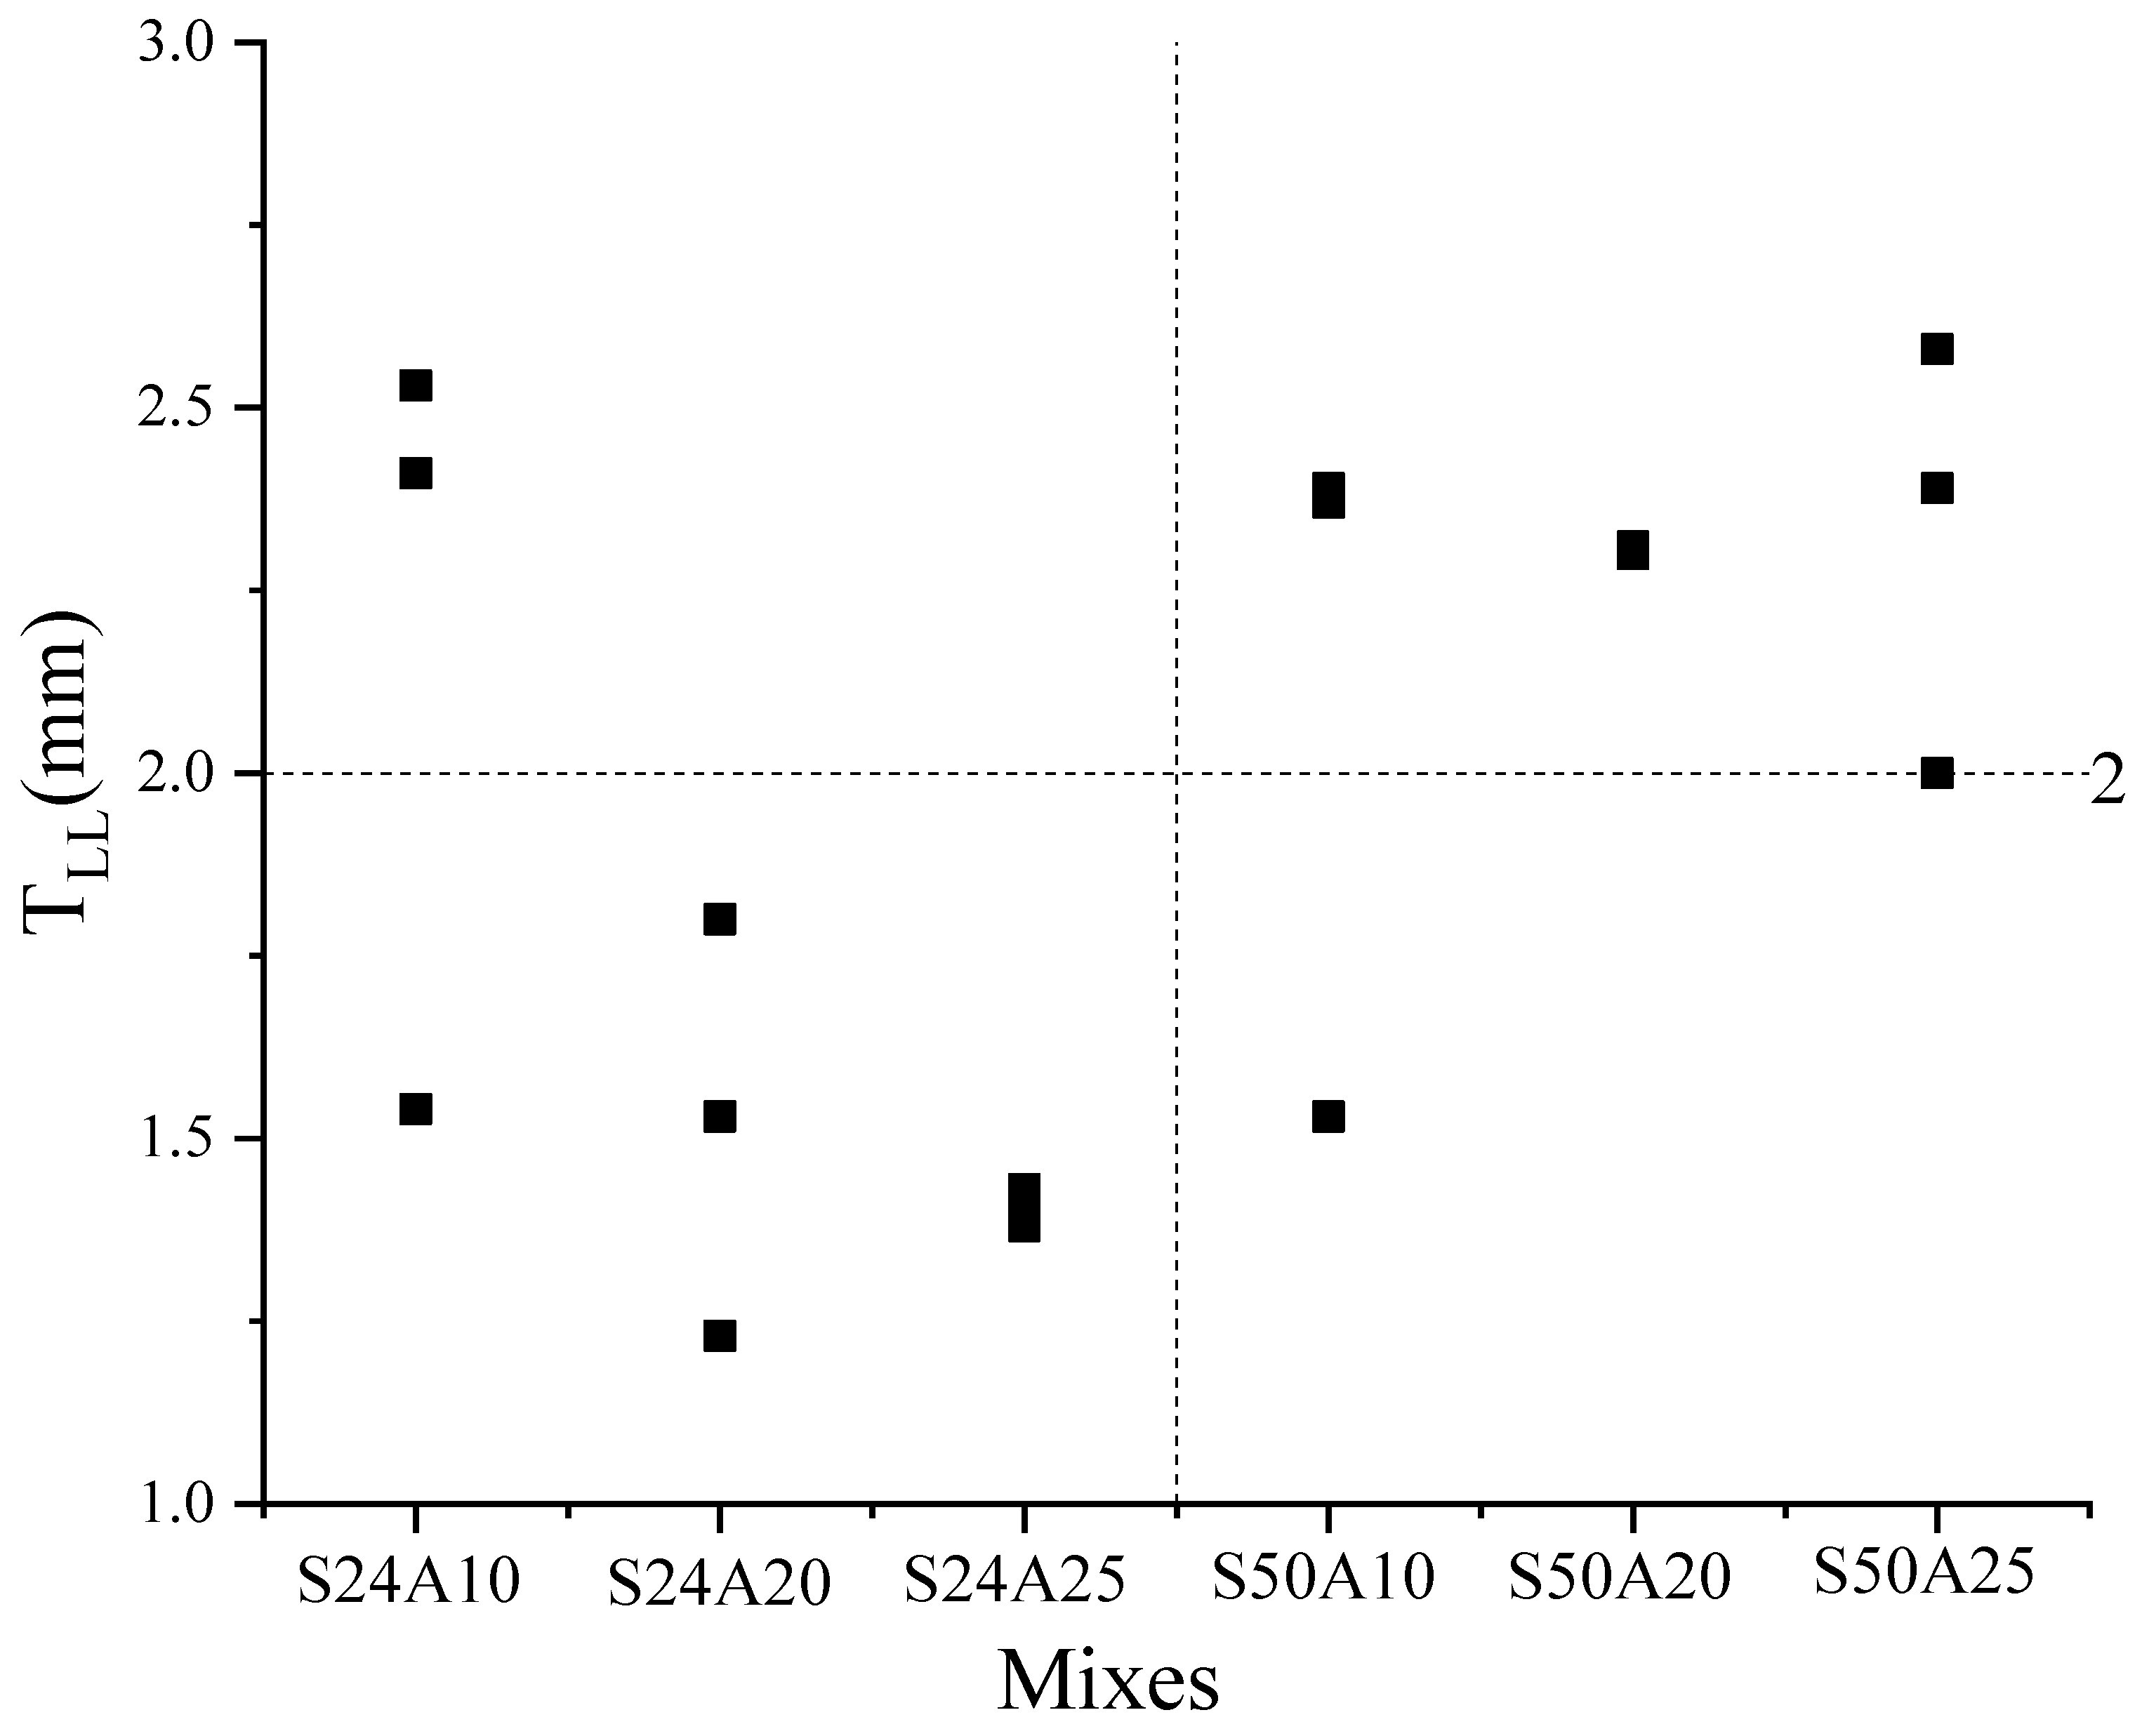
3. Results and Discussion
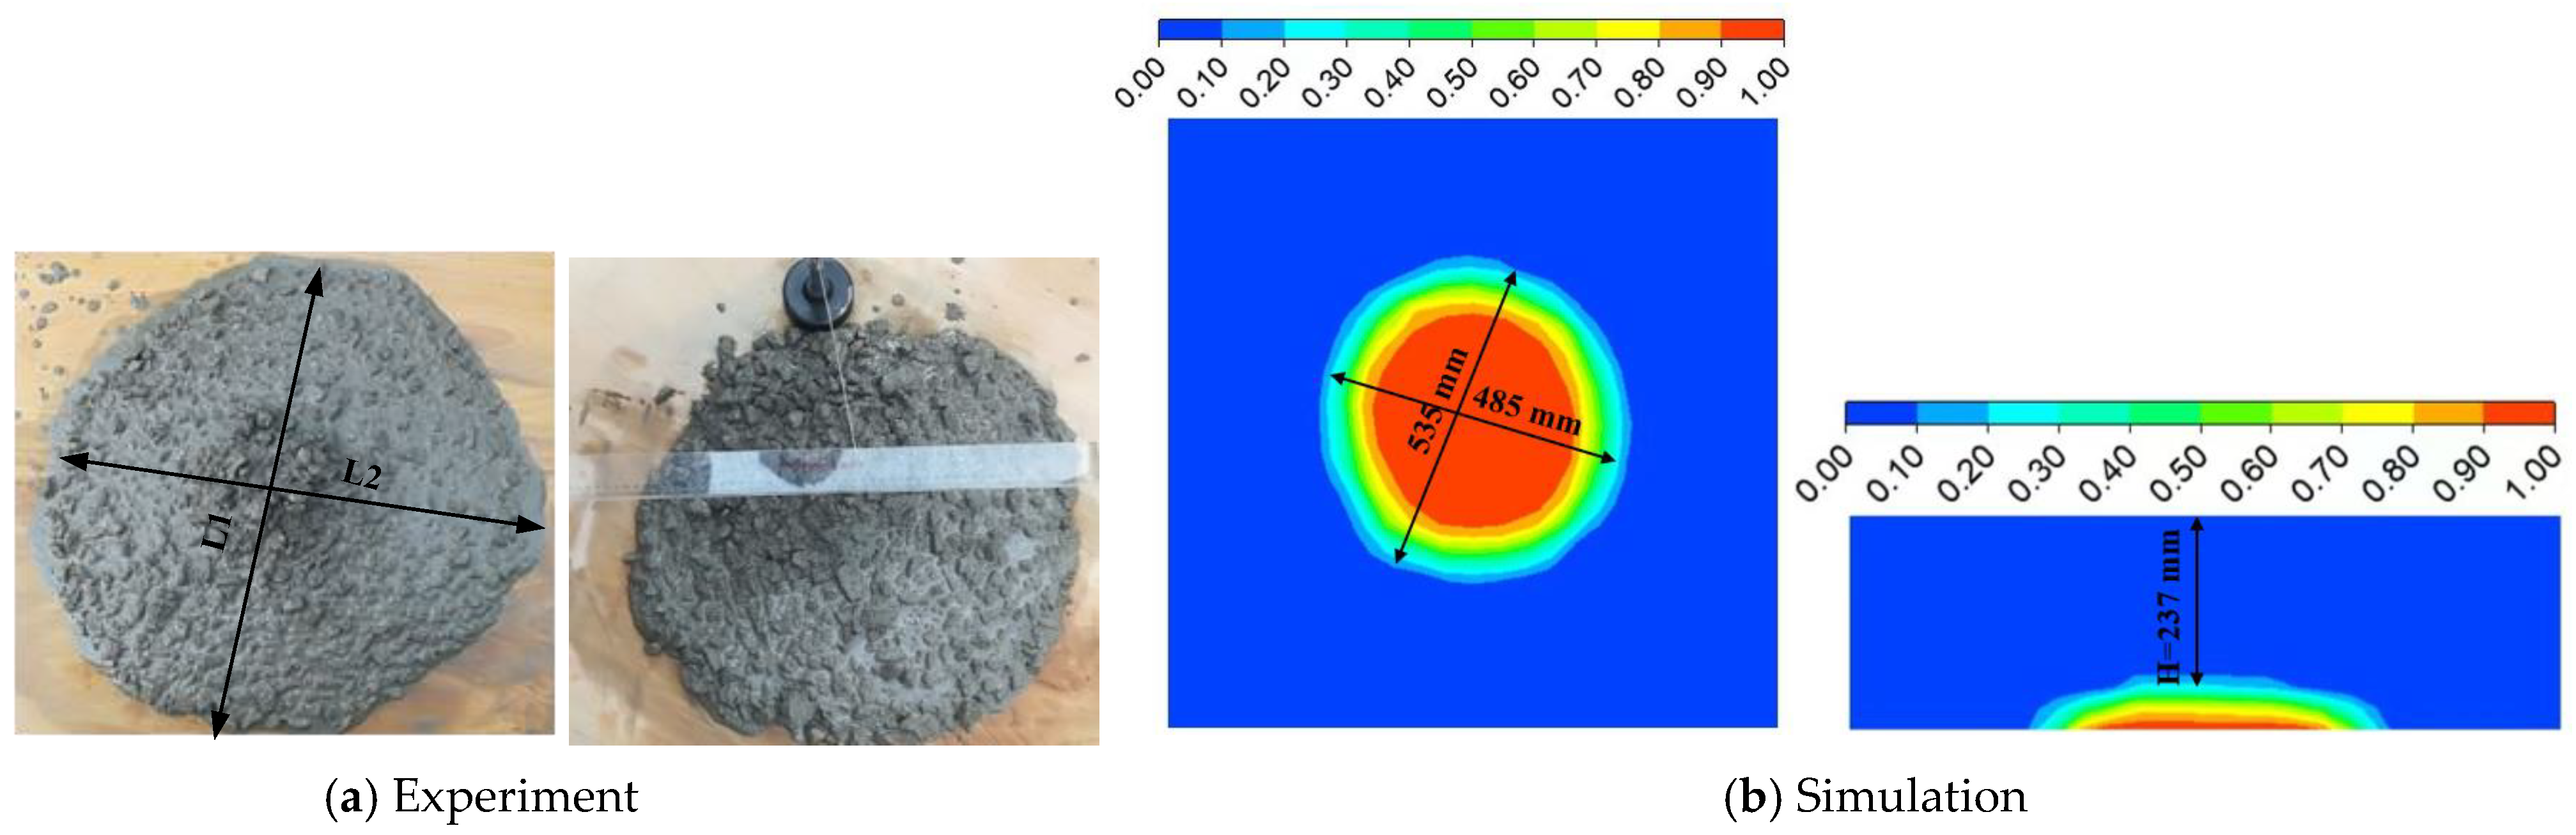
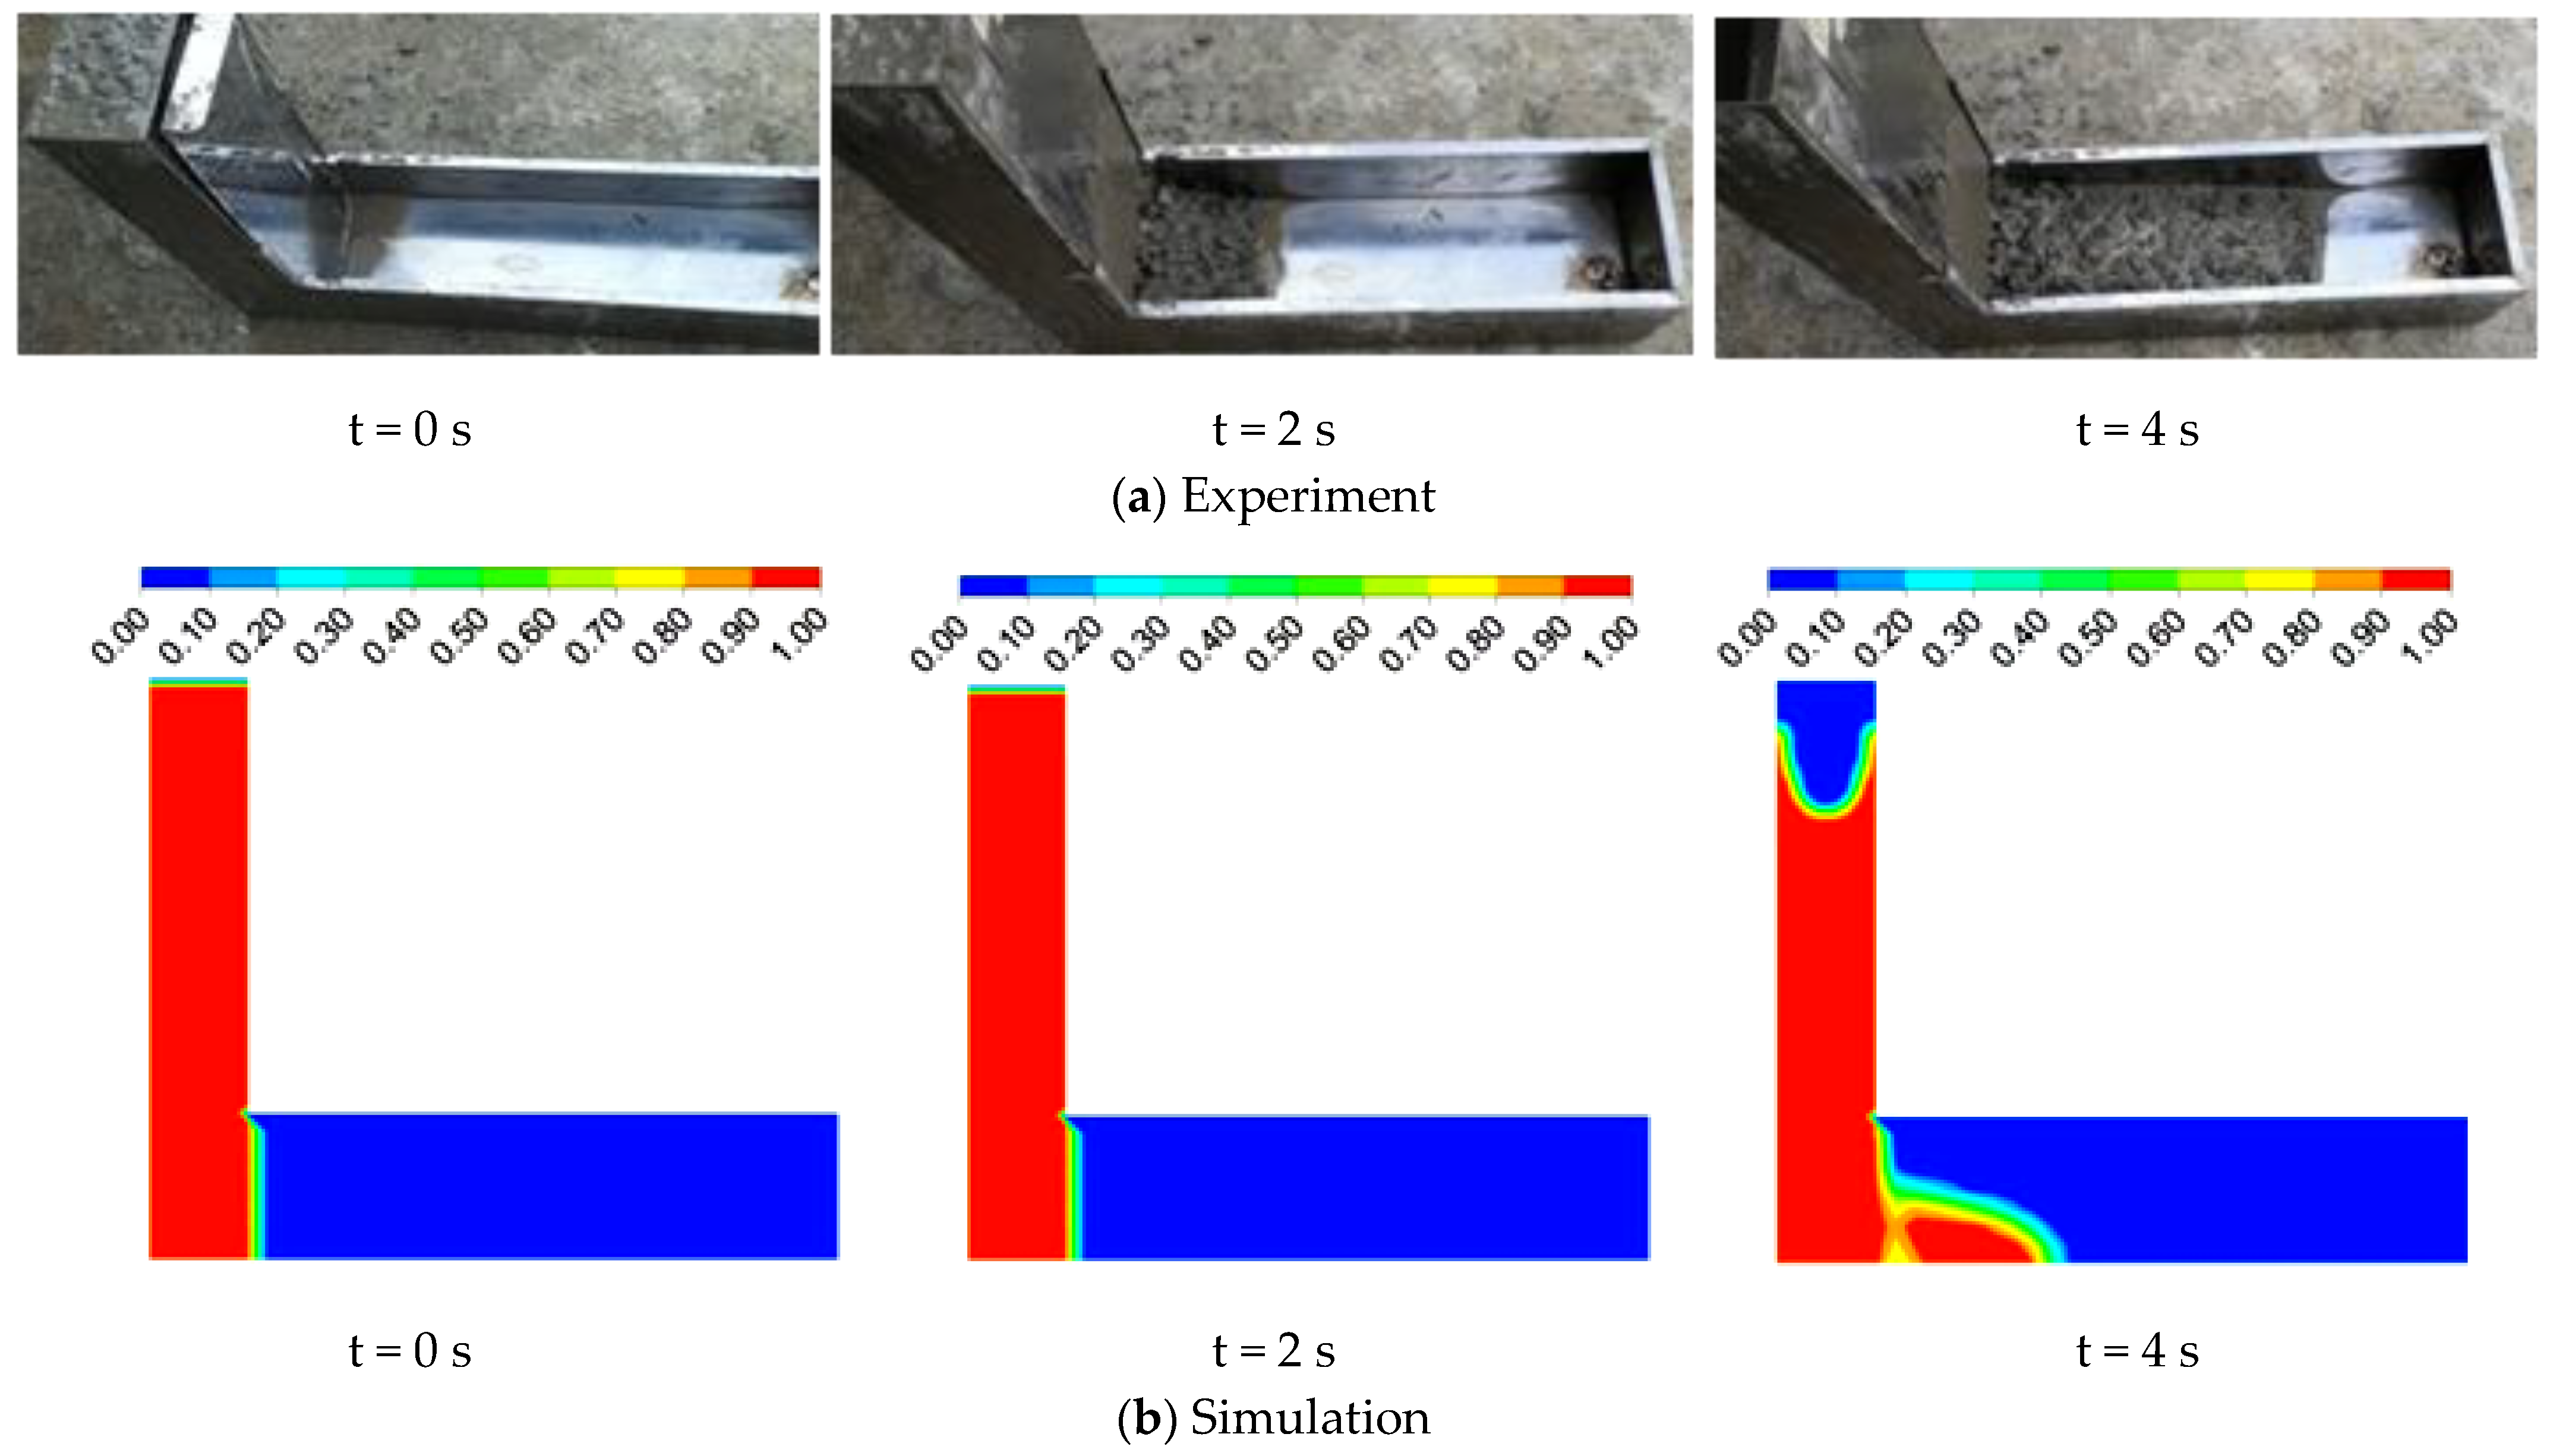
3.1. Comparison of Simulation and Experimental Results
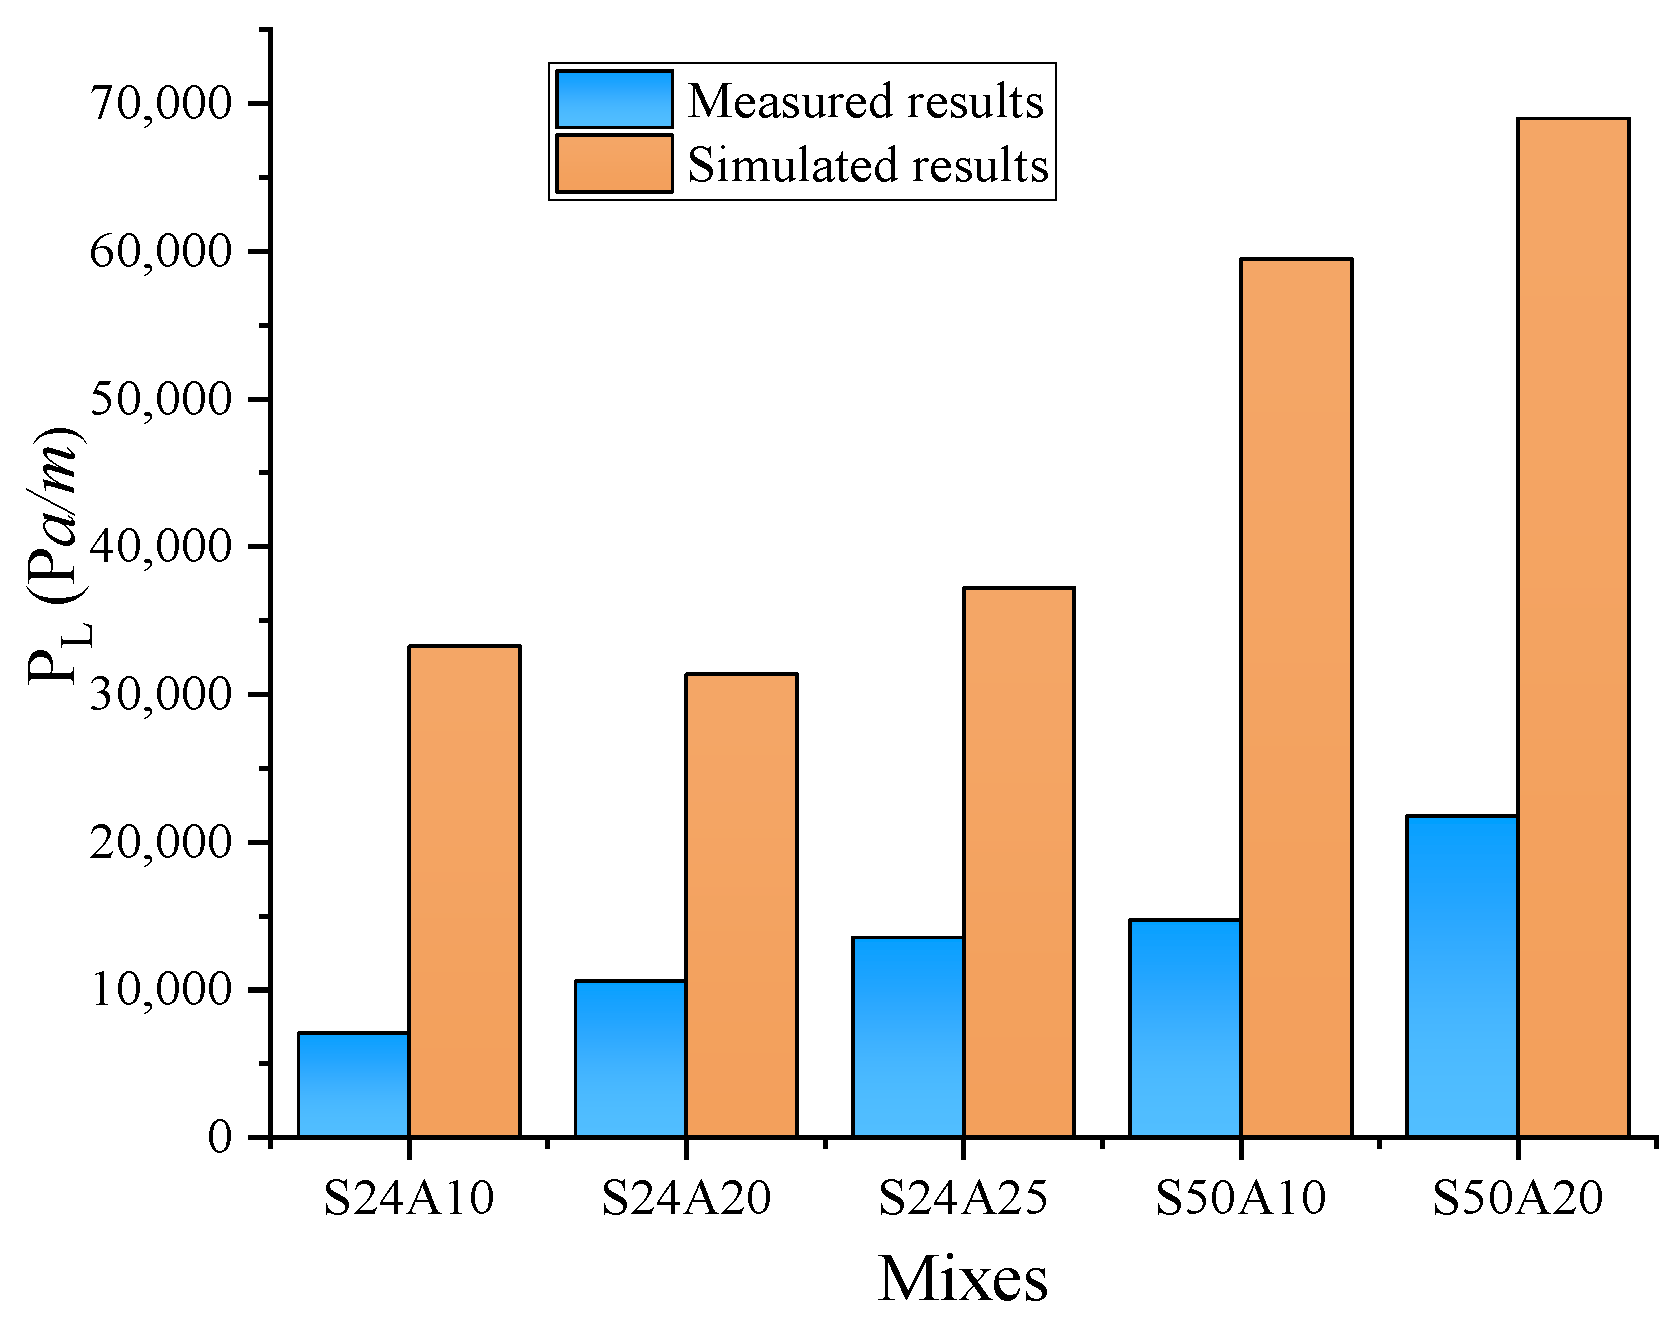
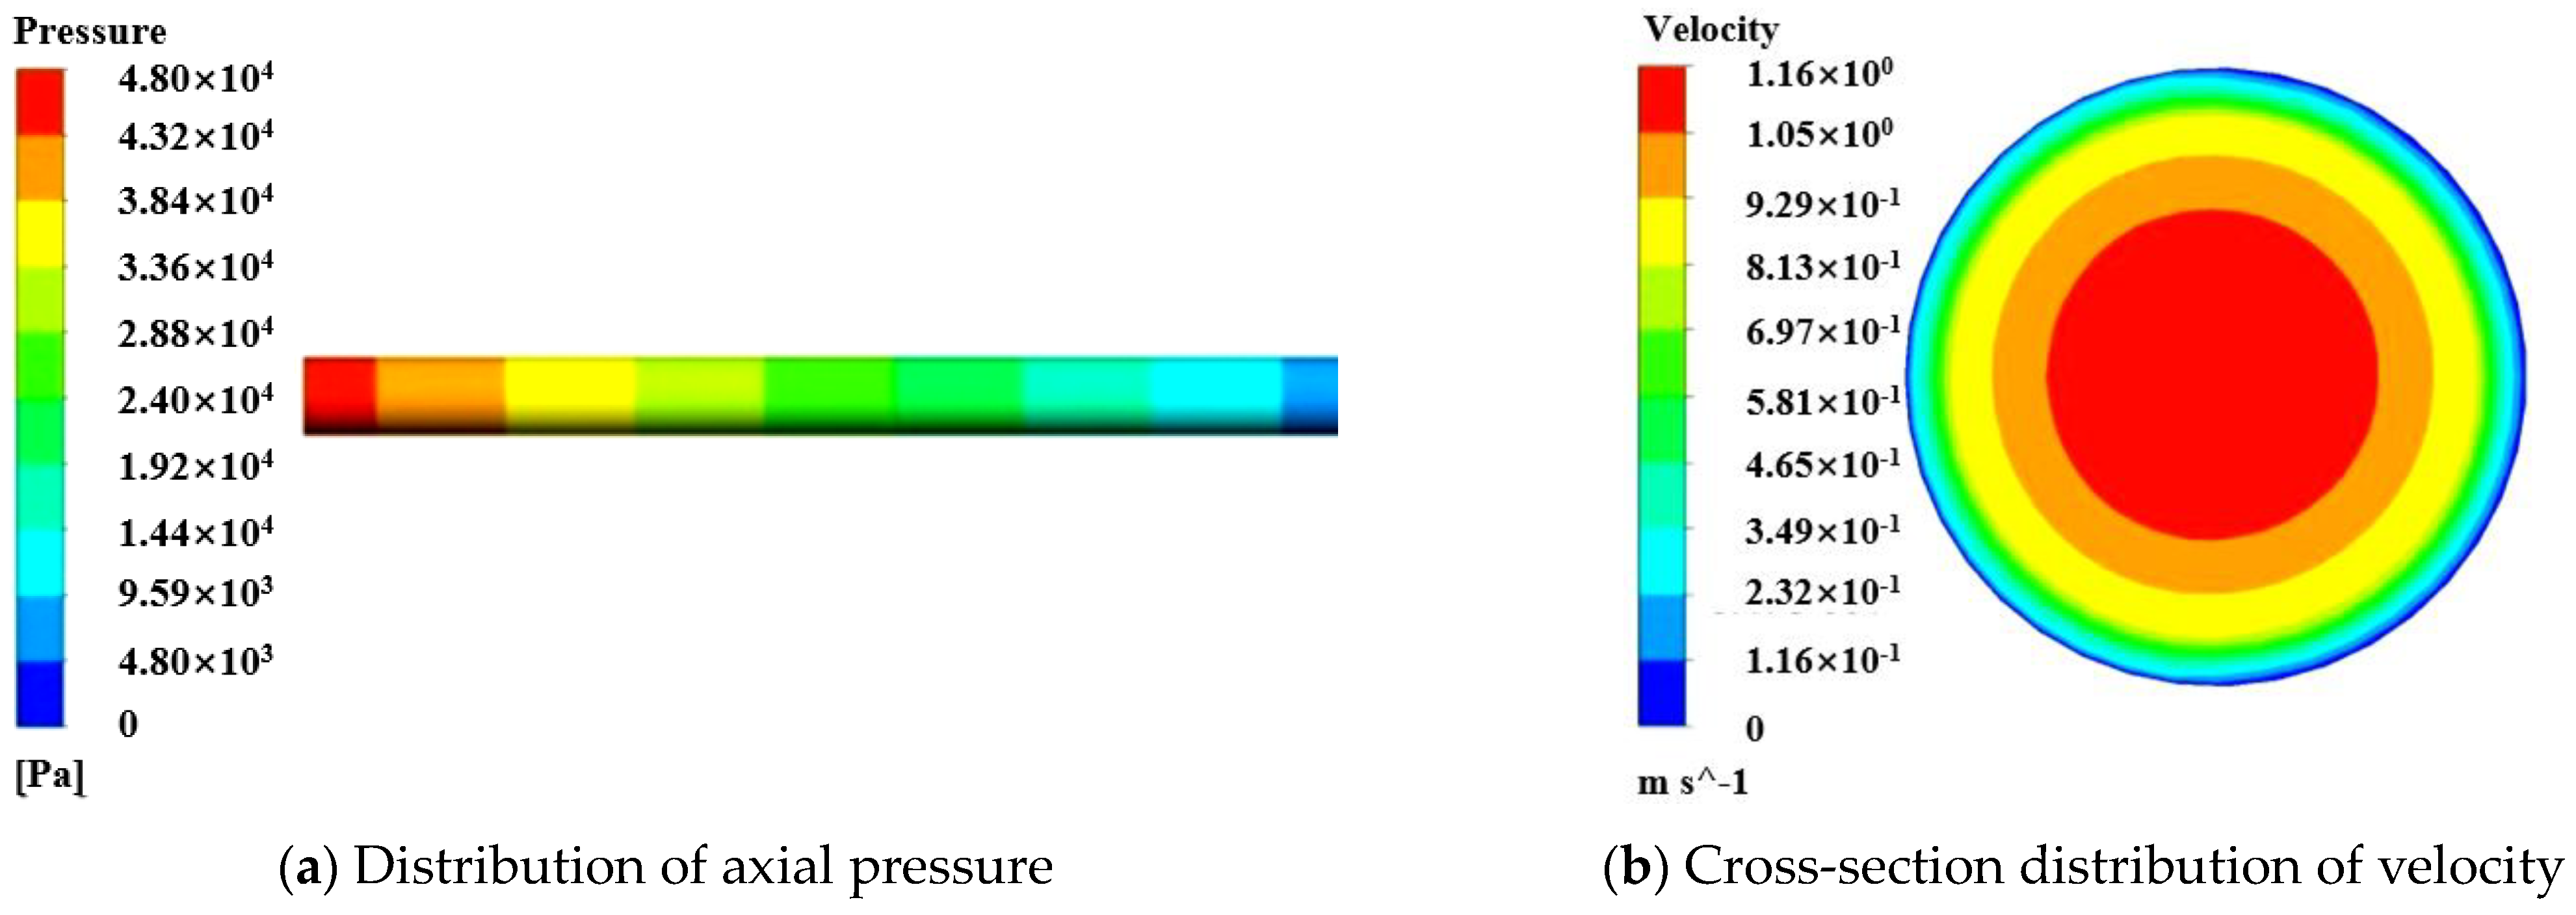
3.2. Effect of TLL on PL
4. Conclusions
Author Contributions
Funding
Institutional Review Board Statement
Informed Consent Statement
Data Availability Statement
Conflicts of Interest
References
- Feys, D.; De Schutter, G.; Khayat, K.H.; Verhoeven, R. Changes in rheology of self-consolidating concrete induced by pumping. Mater. Struct. 2016, 49, 4657–4677. [Google Scholar] [CrossRef]
- Sustandi, A.; Arianti, S.; Grand, W. Study of factors affecting productivity of pouring concrete using portable concrete pump in construction project X. IOP Conf. Ser. 2020, 852, 012035. [Google Scholar] [CrossRef]
- Kwon, S.H.; Jang, K.P.; Kim, J.H.; Shah, S.P. State of the Art on Prediction of Concrete Pumping. Int. J. Concr. Struct. Mater. 2016, 10, 75–85. [Google Scholar] [CrossRef]
- Secrieru, E.; Cotardo, D.; Mechtcherine, V.; Lohaus, L.; Schröfl, C.; Begemann, C. Changes in concrete properties during pumping and formation of lubricating material under pressure. Cem. Concr. Res. 2018, 108, 129–139. [Google Scholar] [CrossRef]
- Feys, D.; Khayat, K.H.; Khatib, R. How do concrete rheology, tribology, flow rate and pipe radius influence pumping pressure? Cem. Concr. Compos. 2016, 66, 38–46. [Google Scholar] [CrossRef]
- Feys, D.; De Schutter, G.; Fataei, S.; Martys, N.; Mechtcherine, V. Pumping of concrete: Understanding a common placement method with lots of challenges. Cem. Concr. Res. 2022, 154, 106720. [Google Scholar] [CrossRef]
- Chajec, A.; Šavija, B. The effect of using surface functionalized granite powder waste on fresh properties of 3D-printed cementitious composites. J. Build Eng. 2024, 97, 110707. [Google Scholar] [CrossRef]
- Chajec, A. The use of granite powder waste in cementitious composites. JMRT 2023, 25, 4761–4783. [Google Scholar] [CrossRef]
- Kaplan, D. Pumping of Concrete. Ph.D. Thesis, LCPC, Paris, France, 1999. [Google Scholar]
- Choi, M.; Roussel, N.; Kim, Y.; Kim, J. Lubrication layer properties during concrete pumping. Cem. Concr. Res. 2013, 45, 69–78. [Google Scholar] [CrossRef]
- Yammine, J.; Chaouche, M.; Guerinet, M.; Moranville, M.; Roussel, N. From ordinary rheology concrete to self-compacting concrete: A transition between frictional and hydrodynamic interactions. Cem. Concr. Res. 2008, 38, 890–896. [Google Scholar] [CrossRef]
- Choi, M.S.; Park, S.B.; Kang, S.T. Effect of the Mineral Admixtures on Pipe Flow of Pumped Concrete. J. Adv. Concr. Technol. 2015, 13, 489–499. [Google Scholar] [CrossRef]
- Ngo, T.T.; Kadri, E.H.; Bennacer, R.; Cussigh, F. Use of tribometer to estimate interface friction and concrete boundary layer composition during the fluid concrete pumping. Constr. Build. Mater. 2009, 24, 1253–1261. [Google Scholar] [CrossRef]
- Ngo, T.; Kadri, E.; Cussigh, F.; Bennacer, R.; Duval, R. Practical tribometer to estimate pumpability of fresh concrete. J. Asian Archit. Build. 2010, 9, 229–236. [Google Scholar] [CrossRef]
- Feys, D. Interactions between Rheological Properties and Pumping of Self-Compacting Concrete. Ph.D. Thesis, Gent University, Ghent, Belgium, 2009. [Google Scholar]
- Feys, D.; Khayat, K.H.; Perez-Schell, A.; Khatib, R. Prediction of pumping pressure by means of new tribometer for highly-workable concrete. Cem. Concr. Compos. 2015, 57, 102–115. [Google Scholar] [CrossRef]
- Chen, L.; Liu, G.; Cheng, W.; Pan, G. Pipe flow of pumping wet shotcrete based on lubrication layer. Springerplus 2016, 5, 945. [Google Scholar] [CrossRef]
- Kaplan, D.; de Larrard, F.; Sedran, T. Design of concrete pumping circuit. ACI Mater. J. 2005, 102, 110. [Google Scholar]
- Koehler, E.P.; Fowler, D.W.; Ferraris, C.F.; Amziane, S. A new, portable rheometer for fresh self-consolidating concrete. ACI Mater. J. 2006, 233, 97–116. [Google Scholar]
- Mechtcherine, V.; Nerella, V.N.; Kasten, K. Testing pumpability of concrete using sliding pipe rheometer. Constr. Build. Mater. 2014, 53, 312–323. [Google Scholar] [CrossRef]
- Feys, D.; Khayat, K.H.; Perez-Schell, A.; Khatib, R. Development of a tribometer to characterize lubrication layer properties of self-consolidating concrete. Cem. Concr. Compos. 2014, 54, 40–52. [Google Scholar] [CrossRef]
- Jo, S.D.; Park, C.K.; Jeong, J.H.; Lee, S.H.; Kwon, S.H. A computational approach to estimating a lubricating layer in concrete pumping. Comput. Mater. Contin. 2012, 27, 189–210. [Google Scholar]
- Choi, M.S.; Kim, Y.J.; Kwon, S.H. Prediction on pipe flow of pumped concrete based on shear-induced particle migration. Cem. Concr. Res. 2013, 52, 216–224. [Google Scholar] [CrossRef]
- Le, H.D.; Kadri, E.H.; Aggoun, S.; Vierendeels, J.; Troch, P.; De Schutter, G. Effect of lubrication layer on velocity profile of concrete in a pumping pipe. Mater. Struct. 2015, 48, 3991–4003. [Google Scholar] [CrossRef]
- Met-flow, S.A. Model UVP-Duo with Software Version 3 User’s Guide; Met-flow Co.: Lausanne, Switzerland, 2002. [Google Scholar]
- Feys, D.; Verhoeven, R.; de Schutter, G. Evaluation of time independent rheological models applicable to fresh self-compacting concrete. Appl. Rheol. 2007, 17, 56244-1–56244-10. [Google Scholar] [CrossRef]
- Ngo, T.T.; Kadri, E.H.; Cussigh, F.; Bennacer, R. Relationships between concrete composition and boundary layer composition to optimise concrete pumpability. Eur. J. Environ. Civ. Eng. 2012, 16, 157–177. [Google Scholar] [CrossRef]
- Secrieru, E.; Fataei, S.; Schröfl, C.; Mechtcherine, V. Study on concrete pumpability combining different laboratory tools and linkage to rheology. Constr. Build. Mater. 2017, 144, 451–461. [Google Scholar] [CrossRef]
- Jang, K.P.; Kim, W.J.; Choi, M.S.; Kwon, S.H. A new method to estimate rheological properties of lubricating layer for prediction of concrete pumping. Adv. Concr. Constr. 2018, 6, 465–483. [Google Scholar]
- Kwon, S.H.; Park, C.K.; Jeong, J.H.; Jo, S.D.; Lee, S.H. Prediction of Concrete Pumping: Part II—Analytical Prediction and Experimental Verification. ACI J. 2013, 110, 657–667. [Google Scholar]
- Feys, D.; De Schutter, G.; Verhoeven, R. Parameters influencing pressure during pumping of self-compacting concrete. Mater. Struct. 2012, 46, 533–555. [Google Scholar] [CrossRef]
- Secrieru, E.; Khodor, J.; Schröfl, C.; Mechtcherine, V. Formation of lubricating layer and flow type during pumping of cement-based materials. Constr. Build. Mater. 2018, 178, 507–517. [Google Scholar] [CrossRef]
- Cui, W.; Zhao, C.; Wang, S. Estimation of super high-rise pumping pressure for high-performance concrete based on computational fluid dynamics modeling and situation measurement. Adv. Civ. Eng. 2021, 2021, 6446233. [Google Scholar] [CrossRef]
- Feys, D.; Khayat, K.H. Recent developments in evaluating pumping behavior of flowable and self-consolidating concrete. J. Sustain. Cem-Based. Mater. 2015, 4, 238–251. [Google Scholar] [CrossRef]
- Sassi, R.; Jelidi, A.; Montassar, S. Numerical simulation of fresh concrete flow in the L-box test using computational fluid dynamics. Mag. Concrete Res. 2023, 75, 1189–1201. [Google Scholar] [CrossRef]
- Cao, G.; Bai, Y.; Shi, Y.; Li, Z.; Deng, D.; Jiang, S.; Xie, S.; Wang, H. Investigation of vibration on rheological behavior of fresh concrete using CFD-DEM coupling method. Constr. Build. Mater. 2024, 425, 135908. [Google Scholar] [CrossRef]
- Ansys Inc. Ansys Fluent Theory Guide; ANSYS Inc.: Canonsburg, PA, USA, 2023. [Google Scholar]


| Name | H (mm) | L1 × L2 (mm) |
|---|---|---|
| Number | ||
| 1 | 245 | 510 × 600 |
| 2 | 230 | 460 × 510 |
| 3 | 240 | 490 × 530 |
| 4 | 235 | 480 × 500 |
| 5 | 245 | 500 × 550 |
| Average | 239 | 488 × 538 |
| Name | H2 (mm) | H1 (mm) | Bm |
|---|---|---|---|
| Number | |||
| 1 | 40 | 105 | 0.381 |
| 2 | 37 | 102 | 0.363 |
| 3 | 38 | 110 | 0.345 |
| 4 | 40 | 103 | 0.388 |
| 5 | 39 | 105 | 0.372 |
| Average | 38.8 | 105 | 0.37 |
| Name | Tv (s) |
|---|---|
| Number | |
| 1 | 18.5 |
| 2 | 17.8 |
| 3 | 18.8 |
| 4 | 16.5 |
| 5 | 17.9 |
| Average | 17.9 |
| Mixes | Aggregate Size | A10 | A20 | A25 | |||
|---|---|---|---|---|---|---|---|
| Strength | Item | LL | Concrete | LL | Concrete | LL | Concrete |
| S24 | Plastic viscosity (Pa.s) | 0.5 | 8.0 | 0.8 | 10.0 | 1.0 | 13.0 |
| Yield stress (Pa) | 15.0 | 300.0 | 12.0 | 200.0 | 5.0 | 150.0 | |
| S50 | Plastic viscosity (Pa.s) | 1.3 | 25.0 | 2.0 | 30.0 | 2.5 | 40.0 |
| Yield stress (Pa) | 11.0 | 100.0 | 12.0 | 80.0 | 50.0 | 80.0 | |
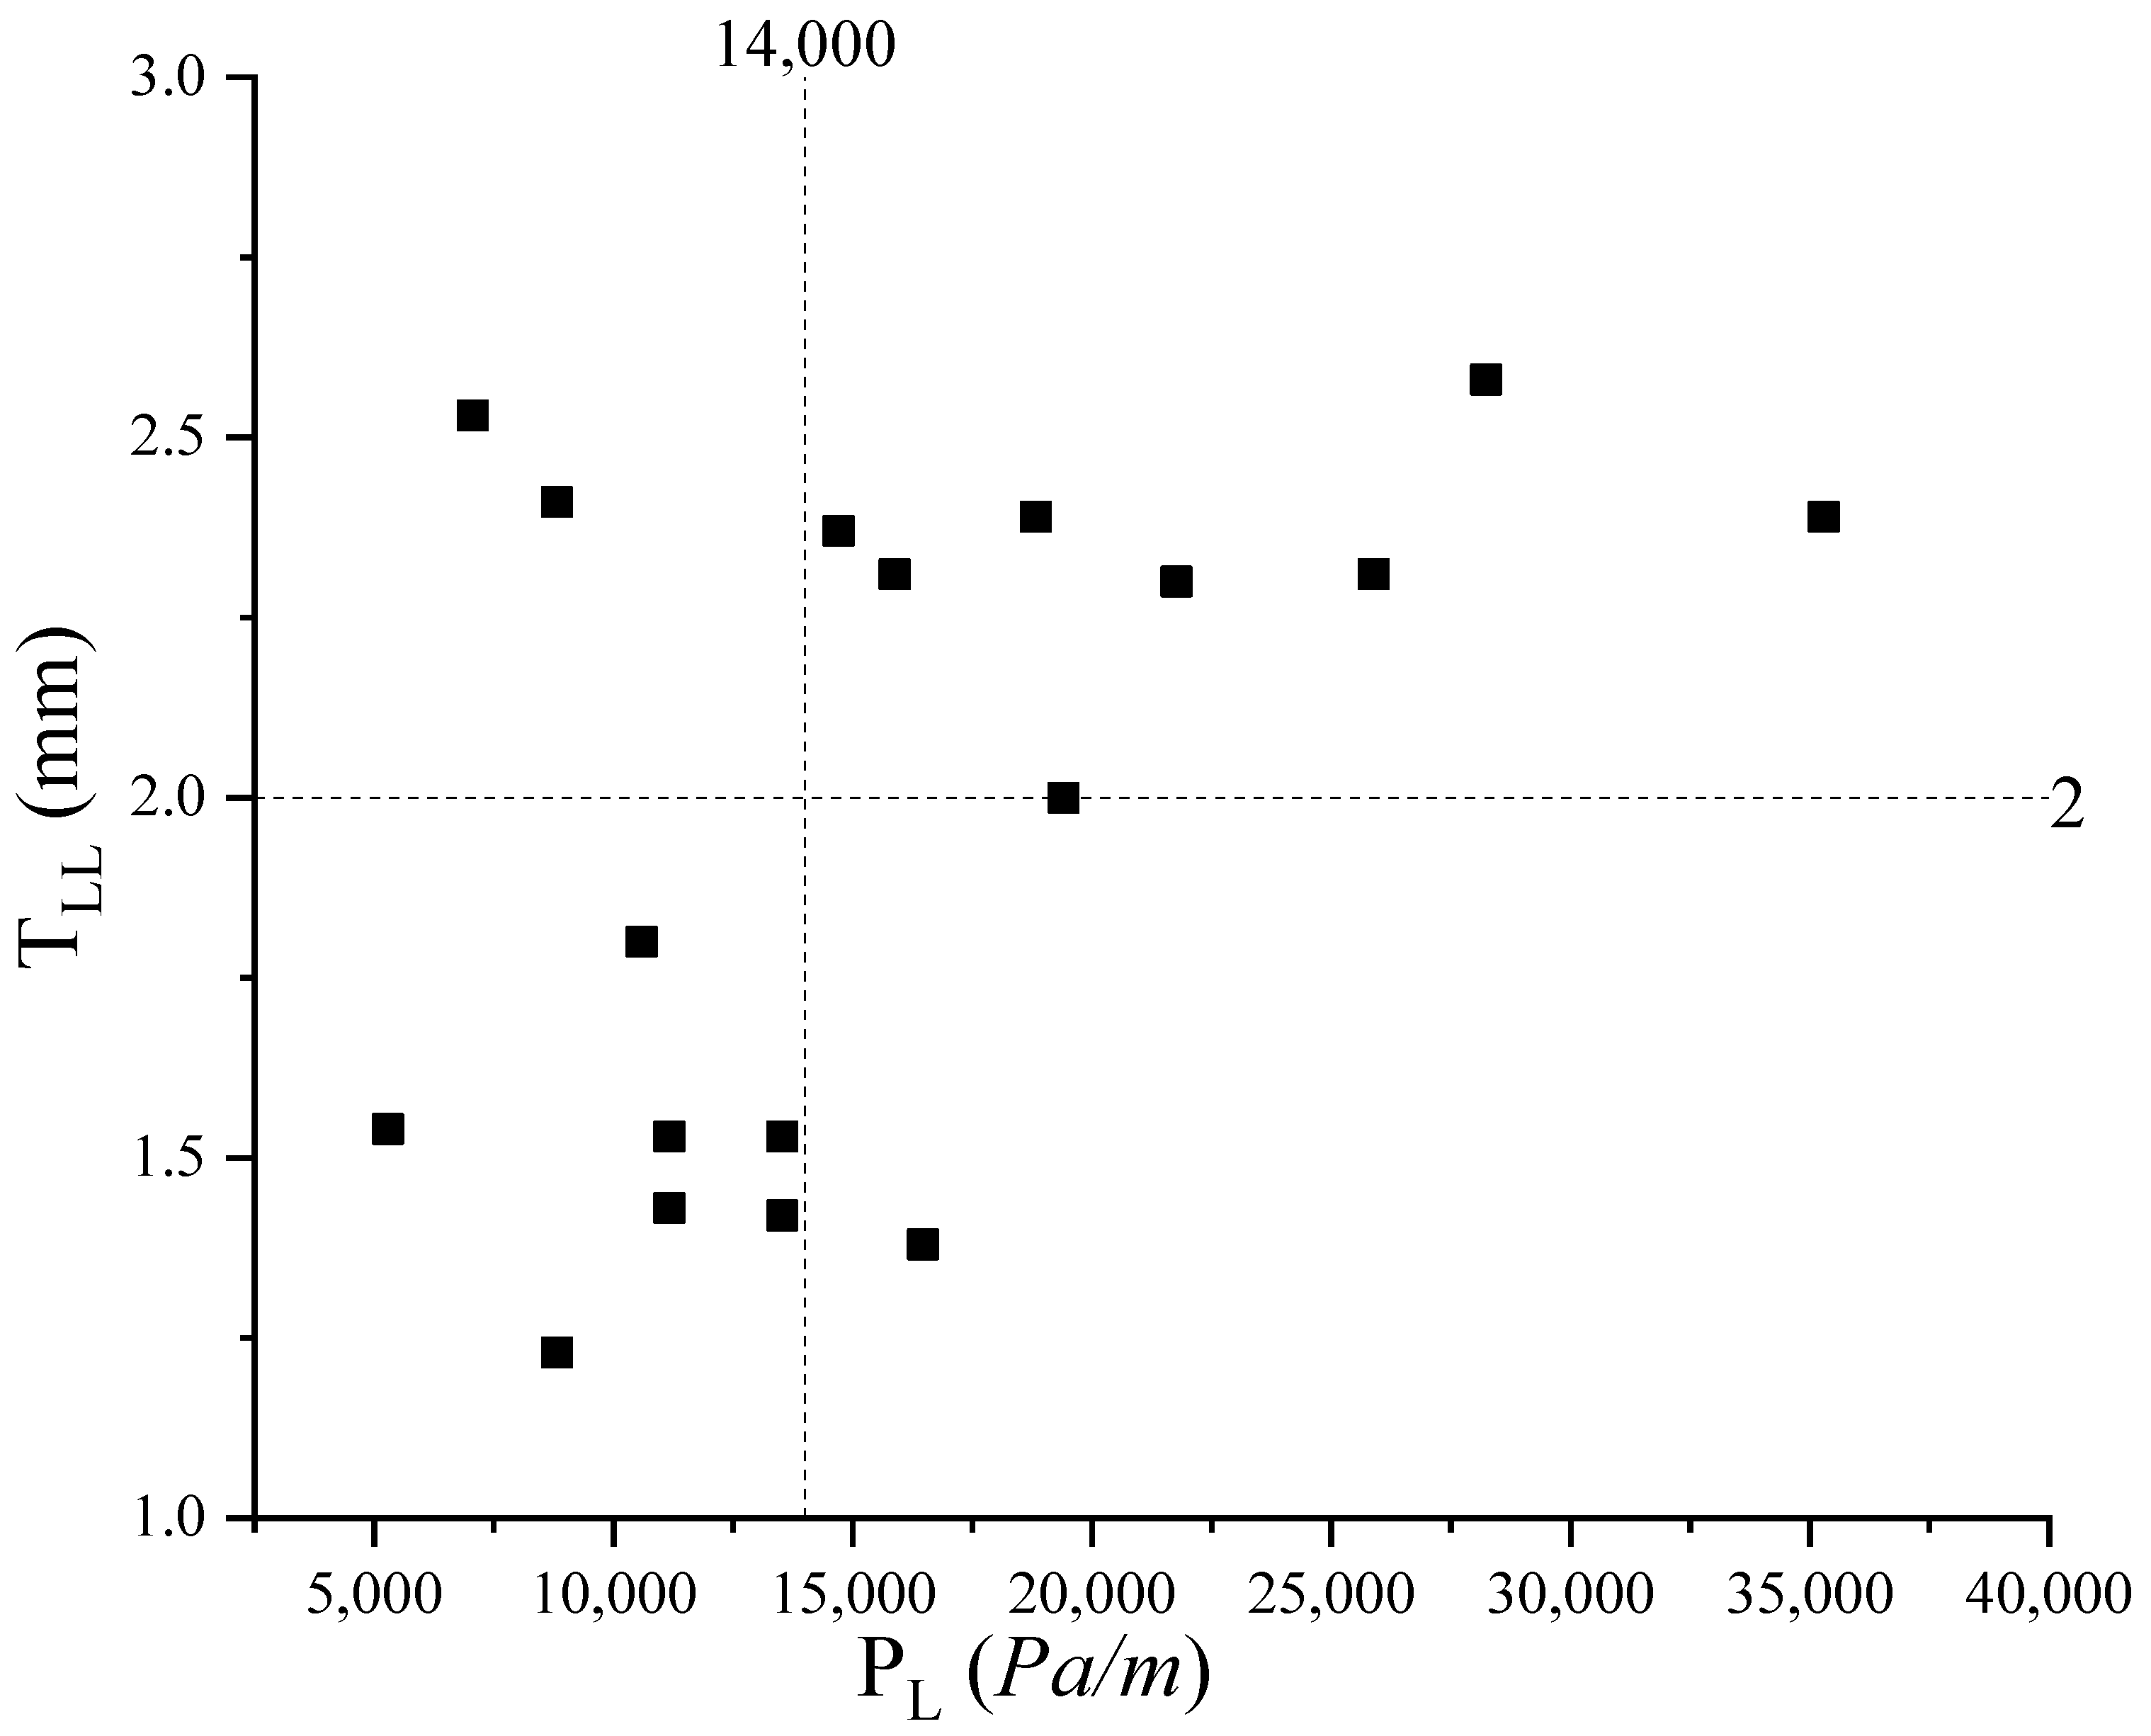
| Mixes | Measured Results [23] | Determined Results TLL (mm) | ||
|---|---|---|---|---|
| Design Strength | Aggregate Size | PL (Pa/m) | Flow Rate (m3/h) | |
| S24 | A10 | 5294 | 28 | 1.54 |
| 7059 | 40 | 2.53 | ||
| 8824 | 50 | 2.41 | ||
| A20 | 8824 | 29 | 1.23 | |
| 10,588 | 40 | 1.8 | ||
| 13,529 | 52 | 1.53 | ||
| A25 | 11,176 | 30 | 1.43 | |
| 13,529 | 40 | 1.42 | ||
| 16,471 | 50 | 1.38 | ||
| S50 | A10 | 11,176 | 28 | 1.53 |
| 14,706 | 40 | 2.37 | ||
| 18,824 | 50 | 2.39 | ||
| A20 | 15,882 | 29 | 2.31 | |
| 21,765 | 40 | 2.3 | ||
| 25,882 | 52 | 2.31 | ||
| A25 | 19,412 | 29 | 2 | |
| 28,235 | 42 | 2.58 | ||
| 35,294 | 53 | 2.39 | ||
| Average value | 1.97 | |||
Disclaimer/Publisher’s Note: The statements, opinions and data contained in all publications are solely those of the individual author(s) and contributor(s) and not of MDPI and/or the editor(s). MDPI and/or the editor(s) disclaim responsibility for any injury to people or property resulting from any ideas, methods, instructions or products referred to in the content. |
© 2024 by the authors. Licensee MDPI, Basel, Switzerland. This article is an open access article distributed under the terms and conditions of the Creative Commons Attribution (CC BY) license (https://creativecommons.org/licenses/by/4.0/).
Share and Cite
Deng, R.; Ye, T.; Ye, Z. Determination of Lubrication Layer Thickness and Its Effect on Concrete Pumping Pressure. Materials 2024, 17, 5136. https://doi.org/10.3390/ma17205136
Deng R, Ye T, Ye Z. Determination of Lubrication Layer Thickness and Its Effect on Concrete Pumping Pressure. Materials. 2024; 17(20):5136. https://doi.org/10.3390/ma17205136
Chicago/Turabian StyleDeng, Rong, Tong Ye, and Zhiwei Ye. 2024. "Determination of Lubrication Layer Thickness and Its Effect on Concrete Pumping Pressure" Materials 17, no. 20: 5136. https://doi.org/10.3390/ma17205136
APA StyleDeng, R., Ye, T., & Ye, Z. (2024). Determination of Lubrication Layer Thickness and Its Effect on Concrete Pumping Pressure. Materials, 17(20), 5136. https://doi.org/10.3390/ma17205136