
Improving the Flexural Response of Timber Beams Using Externally Bonded Carbon Fiber-Reinforced Polymer (CFRP) Sheets

 ,
,  ,
,  ,
,  ,
,  ,
,  and
and
Abstract
1. Introduction
2. Finite Element Analysis
2.1. Material Modeling
2.1.1. Timber
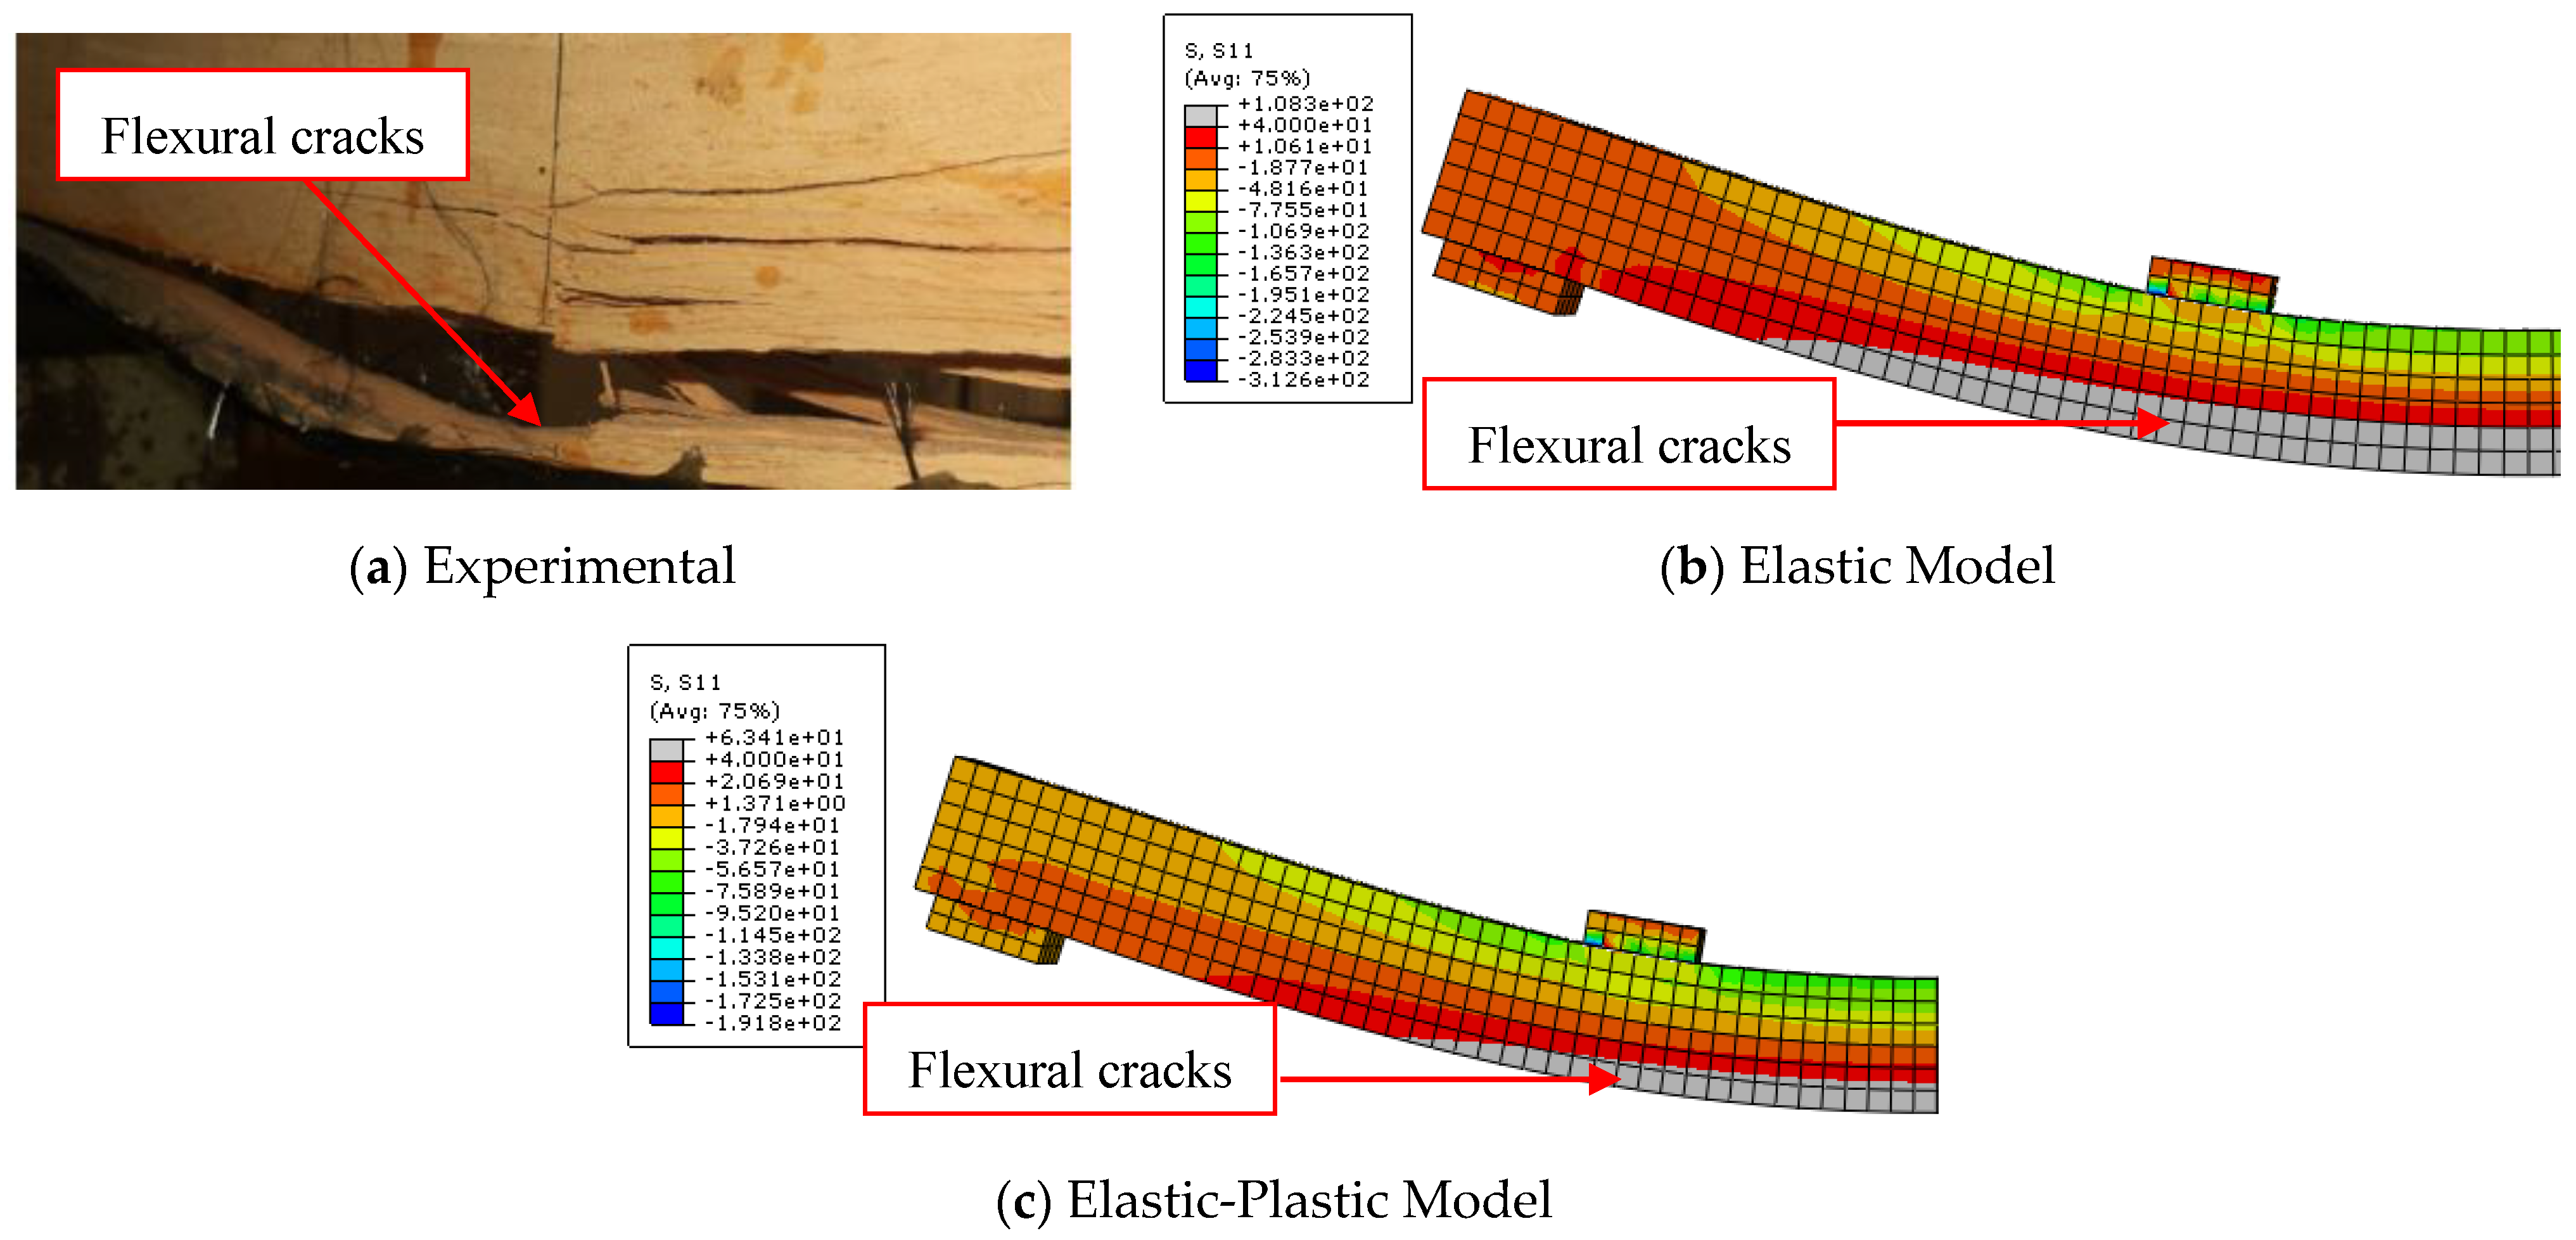
Elastic Model
Elastic-Plastic Model
2.1.2. CFRP
2.1.3. Adhesive
Perfect Bond Model
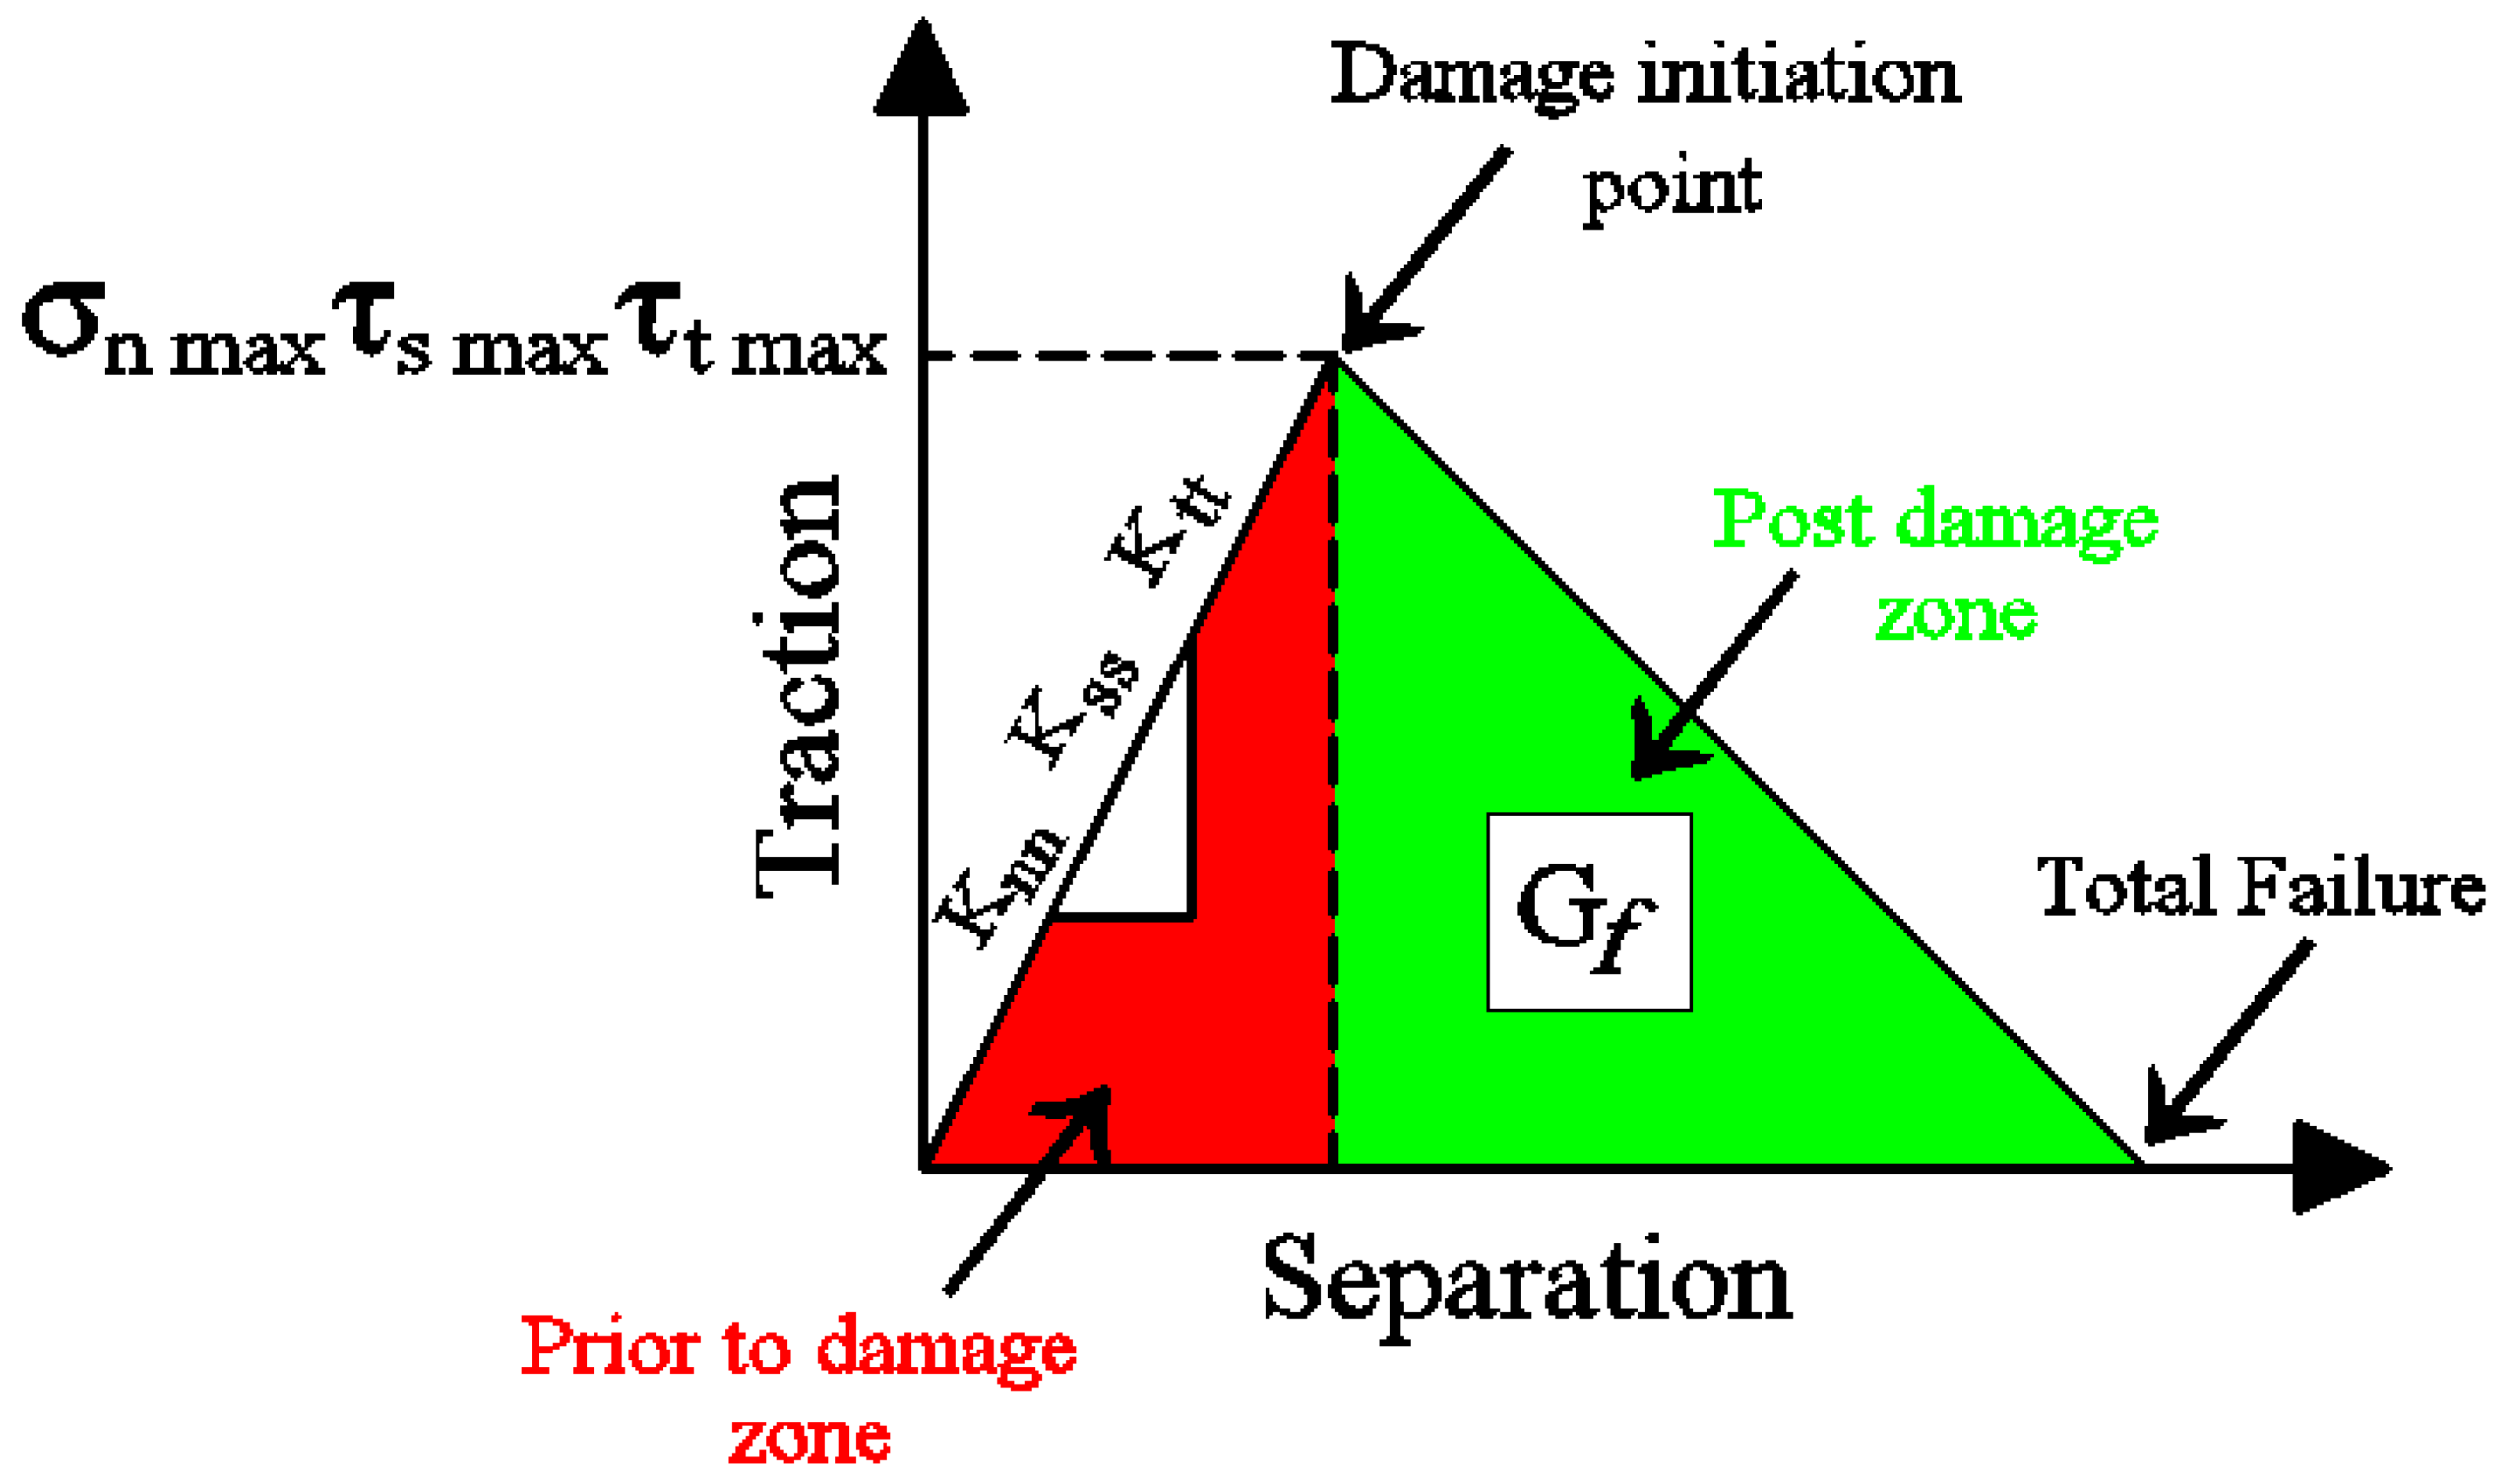
Cohesive Zone Criterion
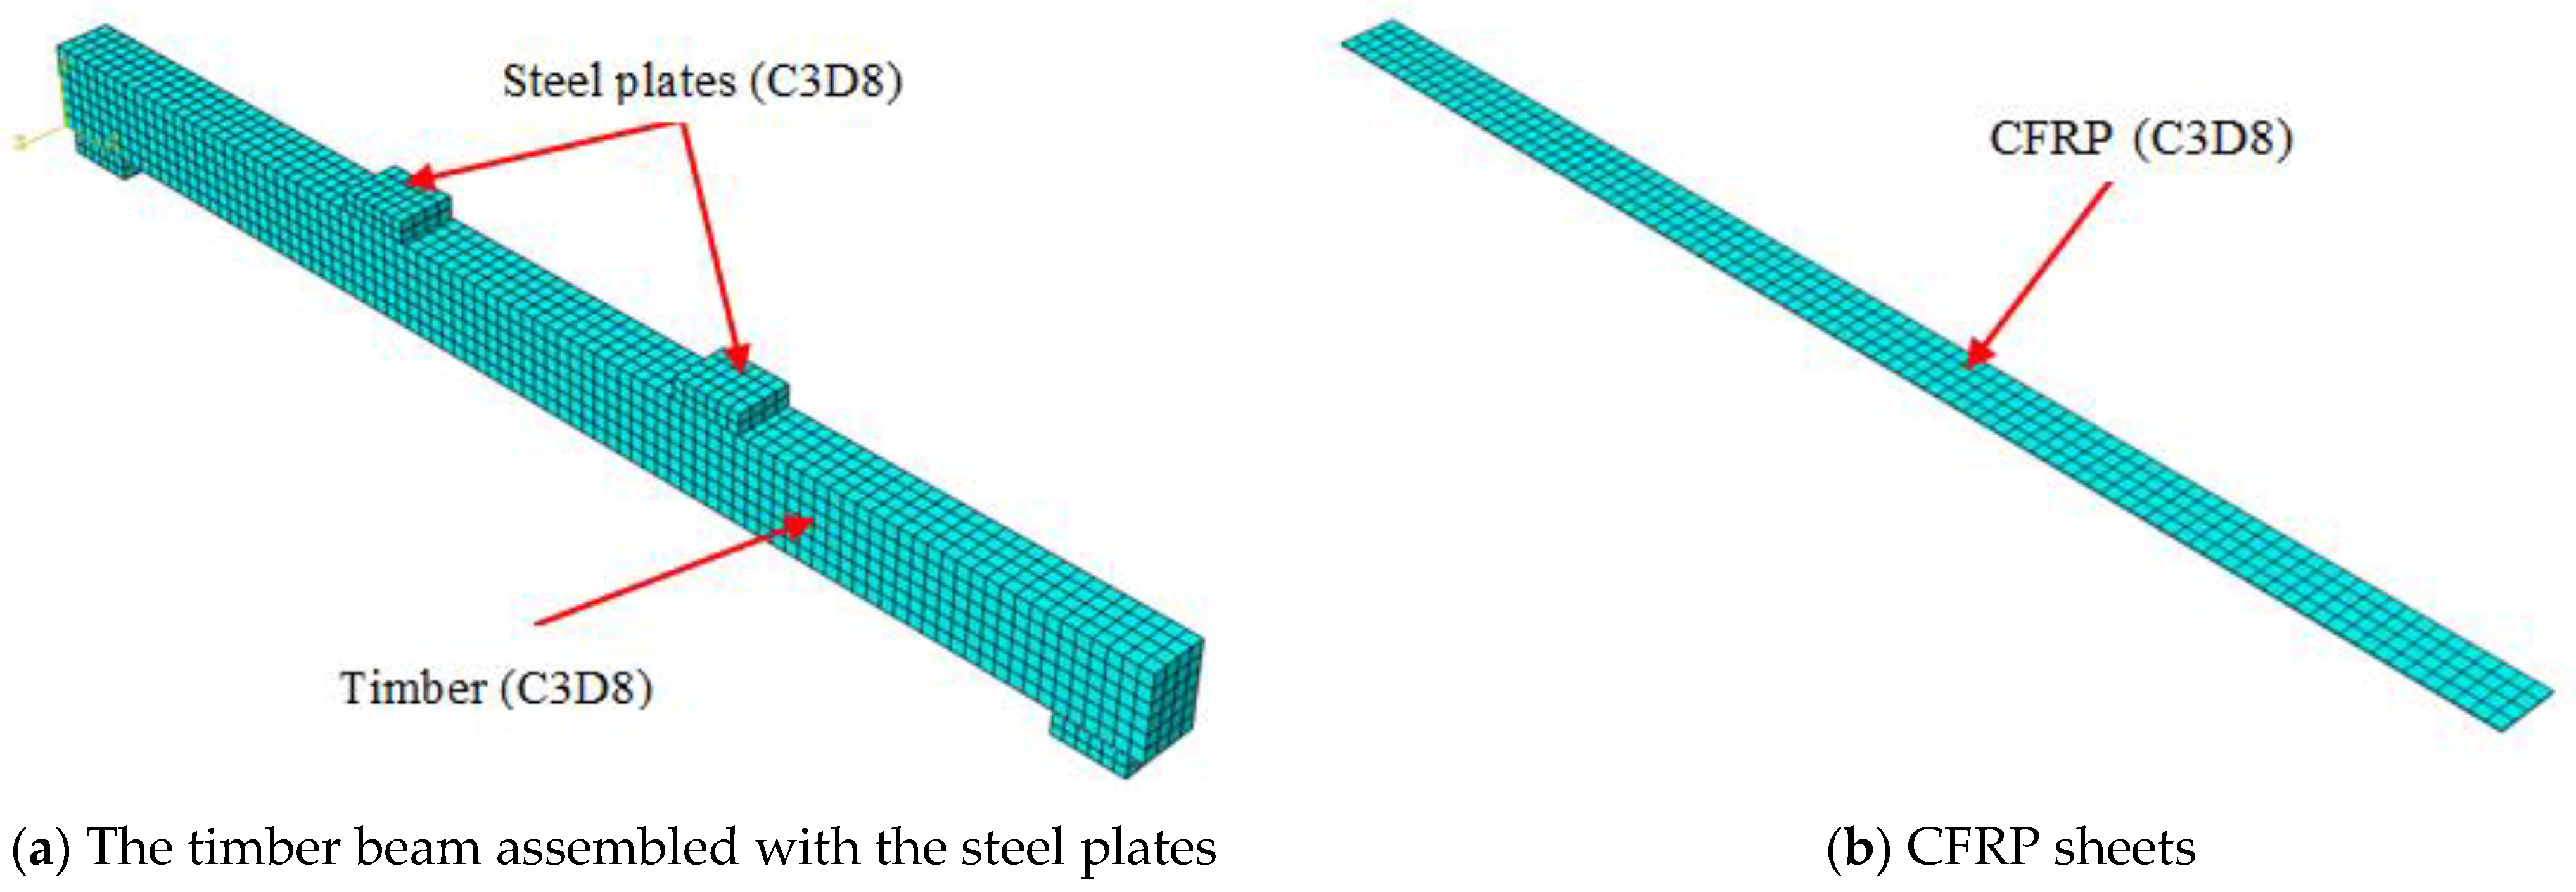
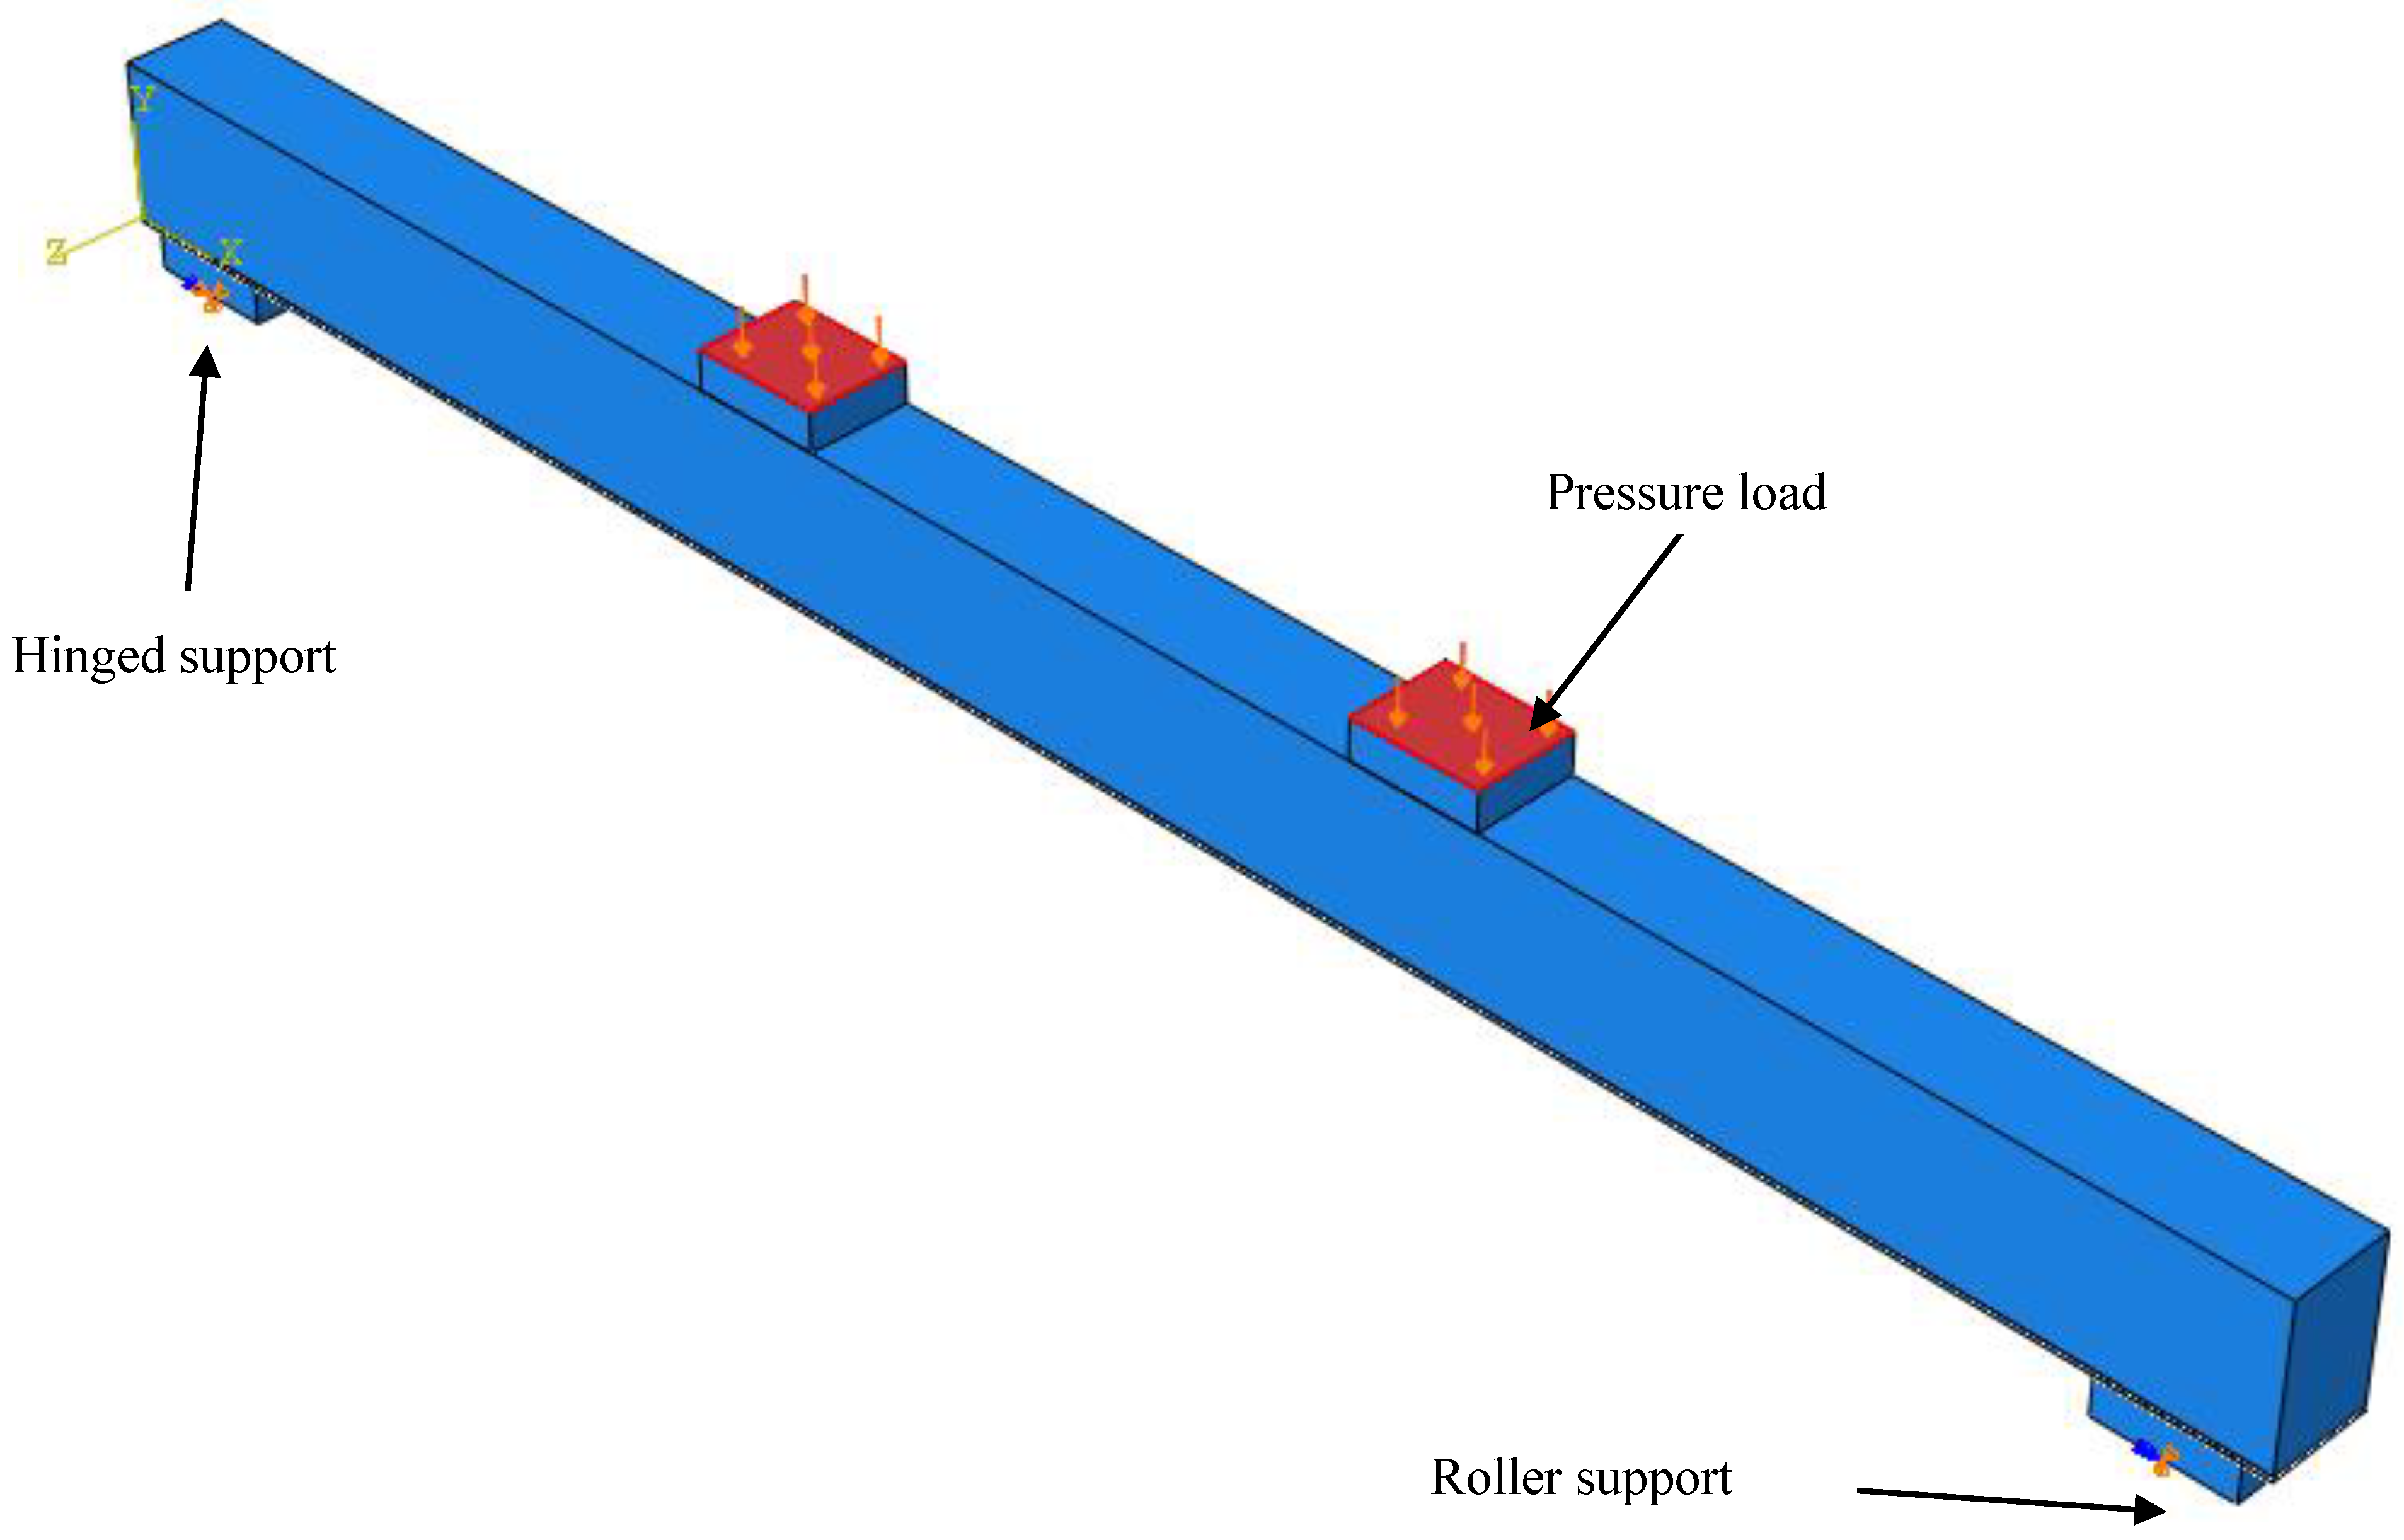
2.2. Elements, Mesh Size, and Boundary Conditions
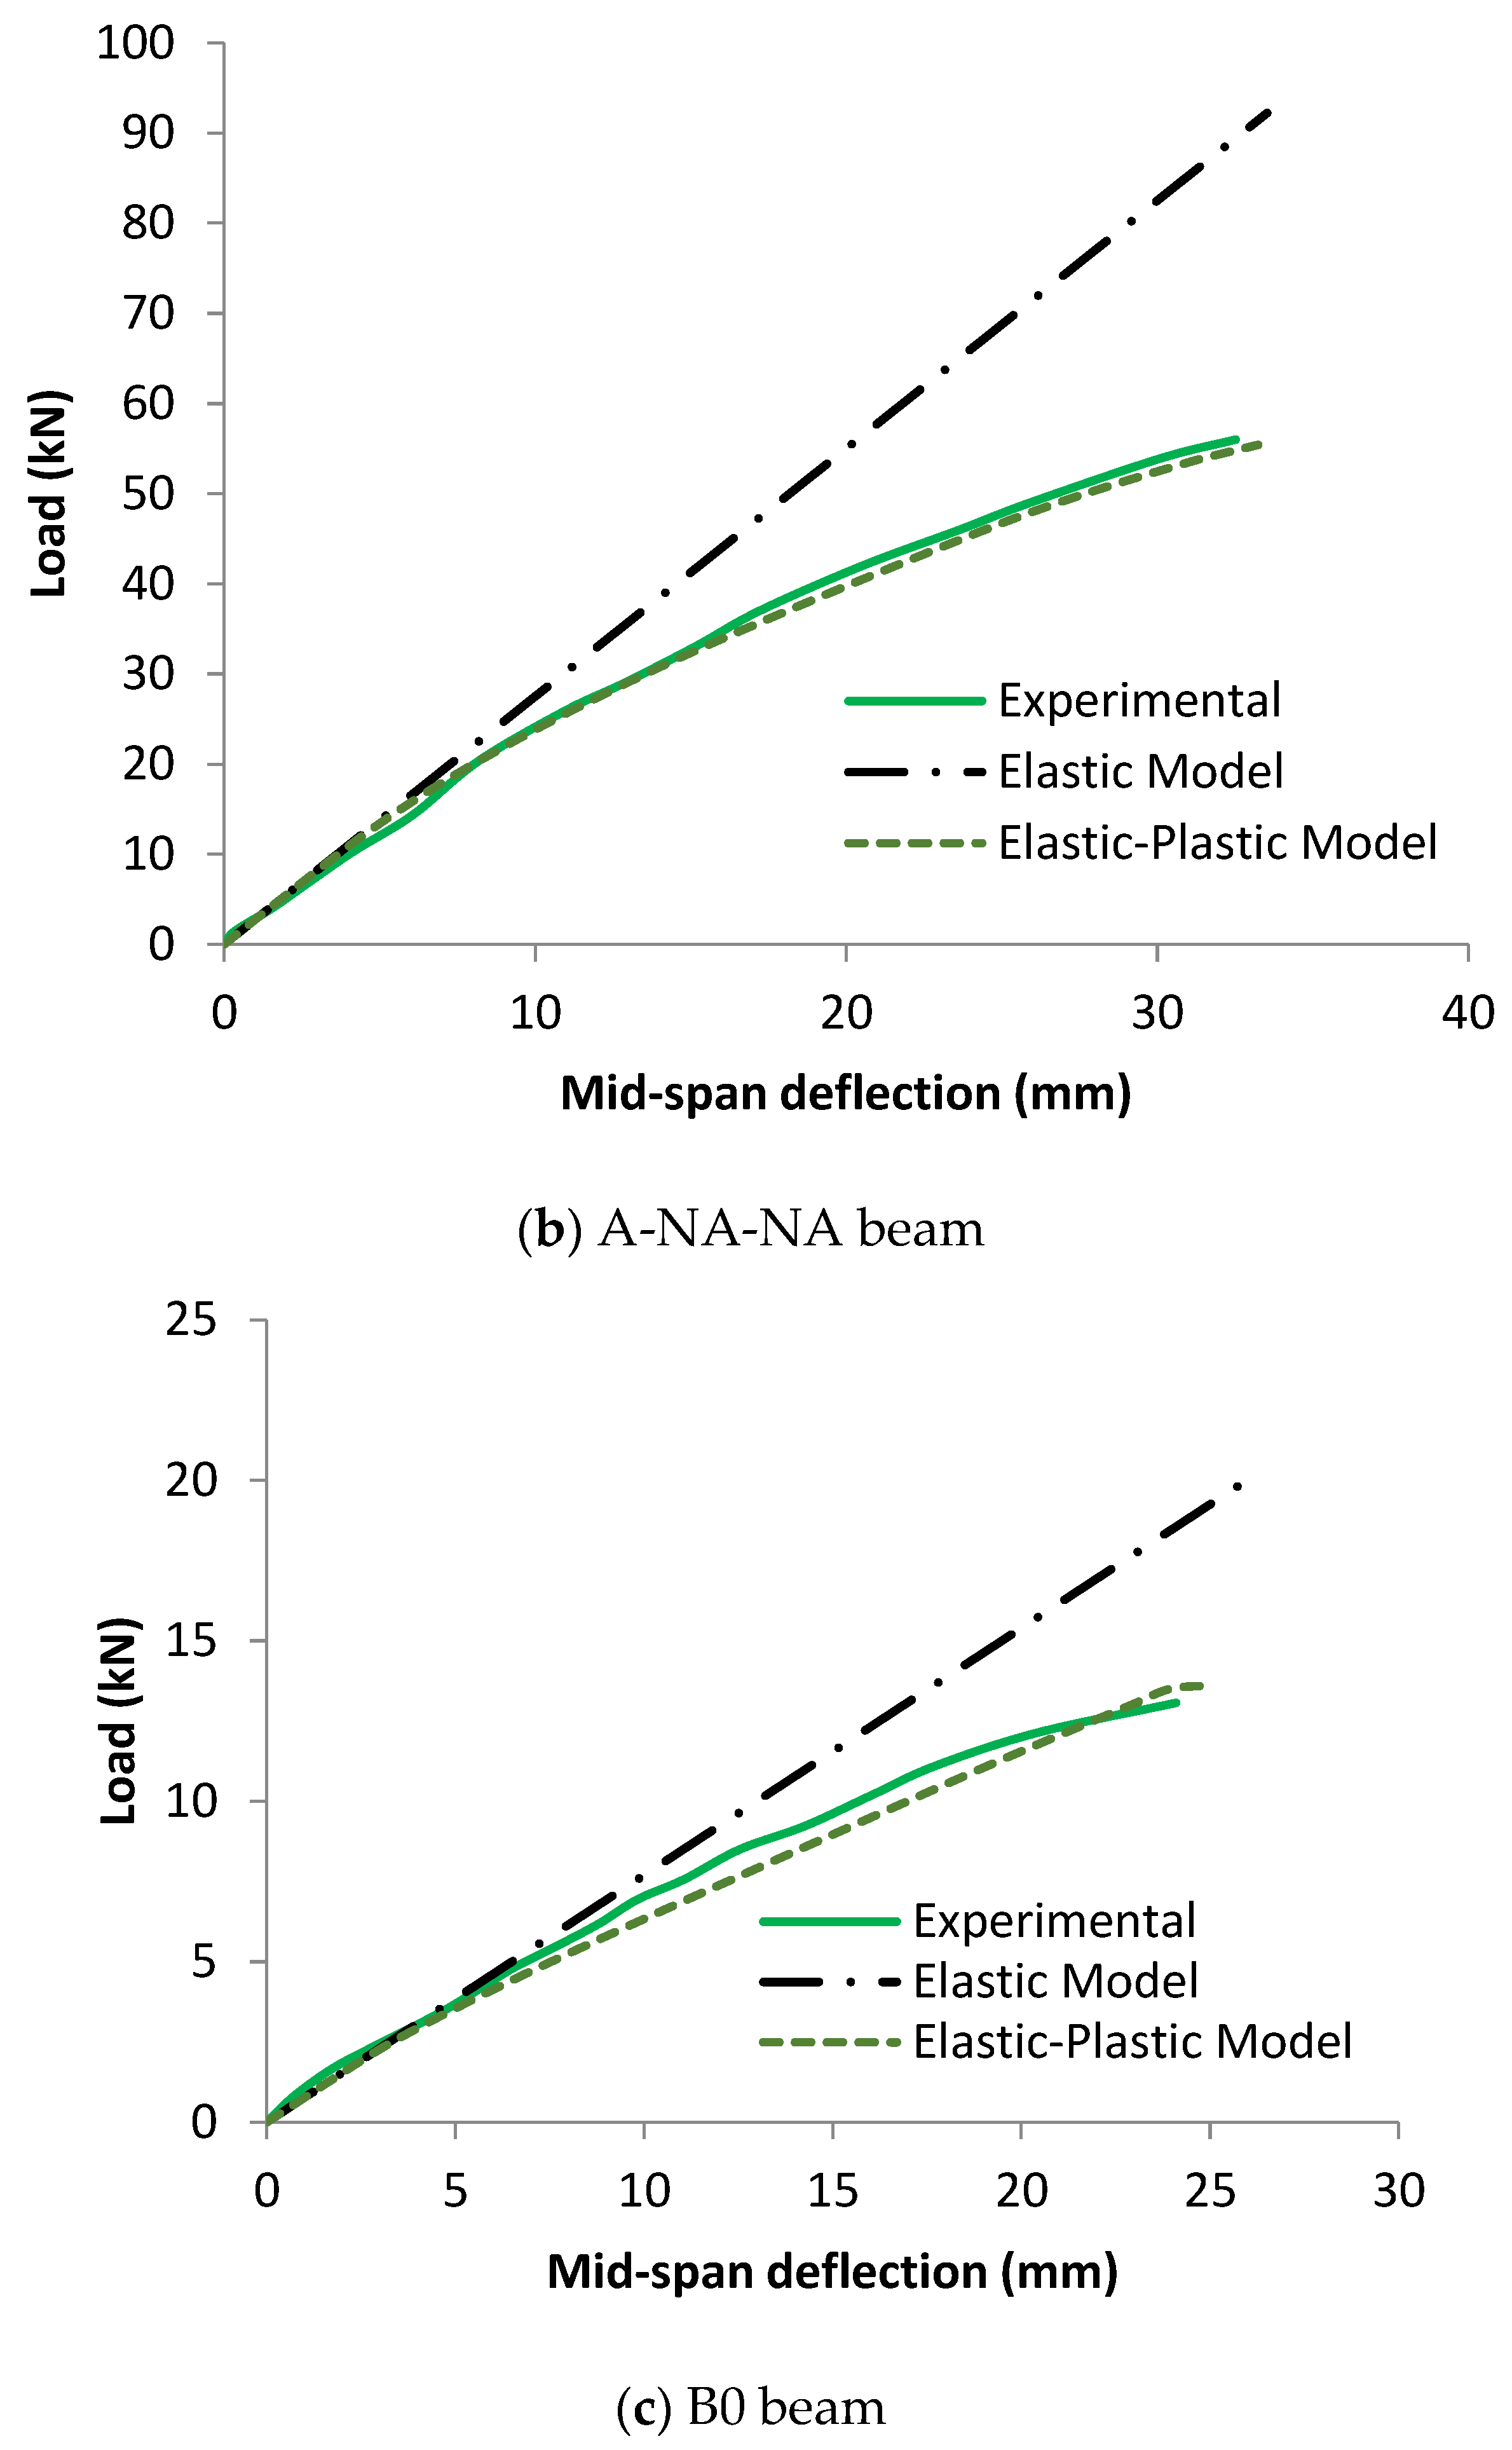
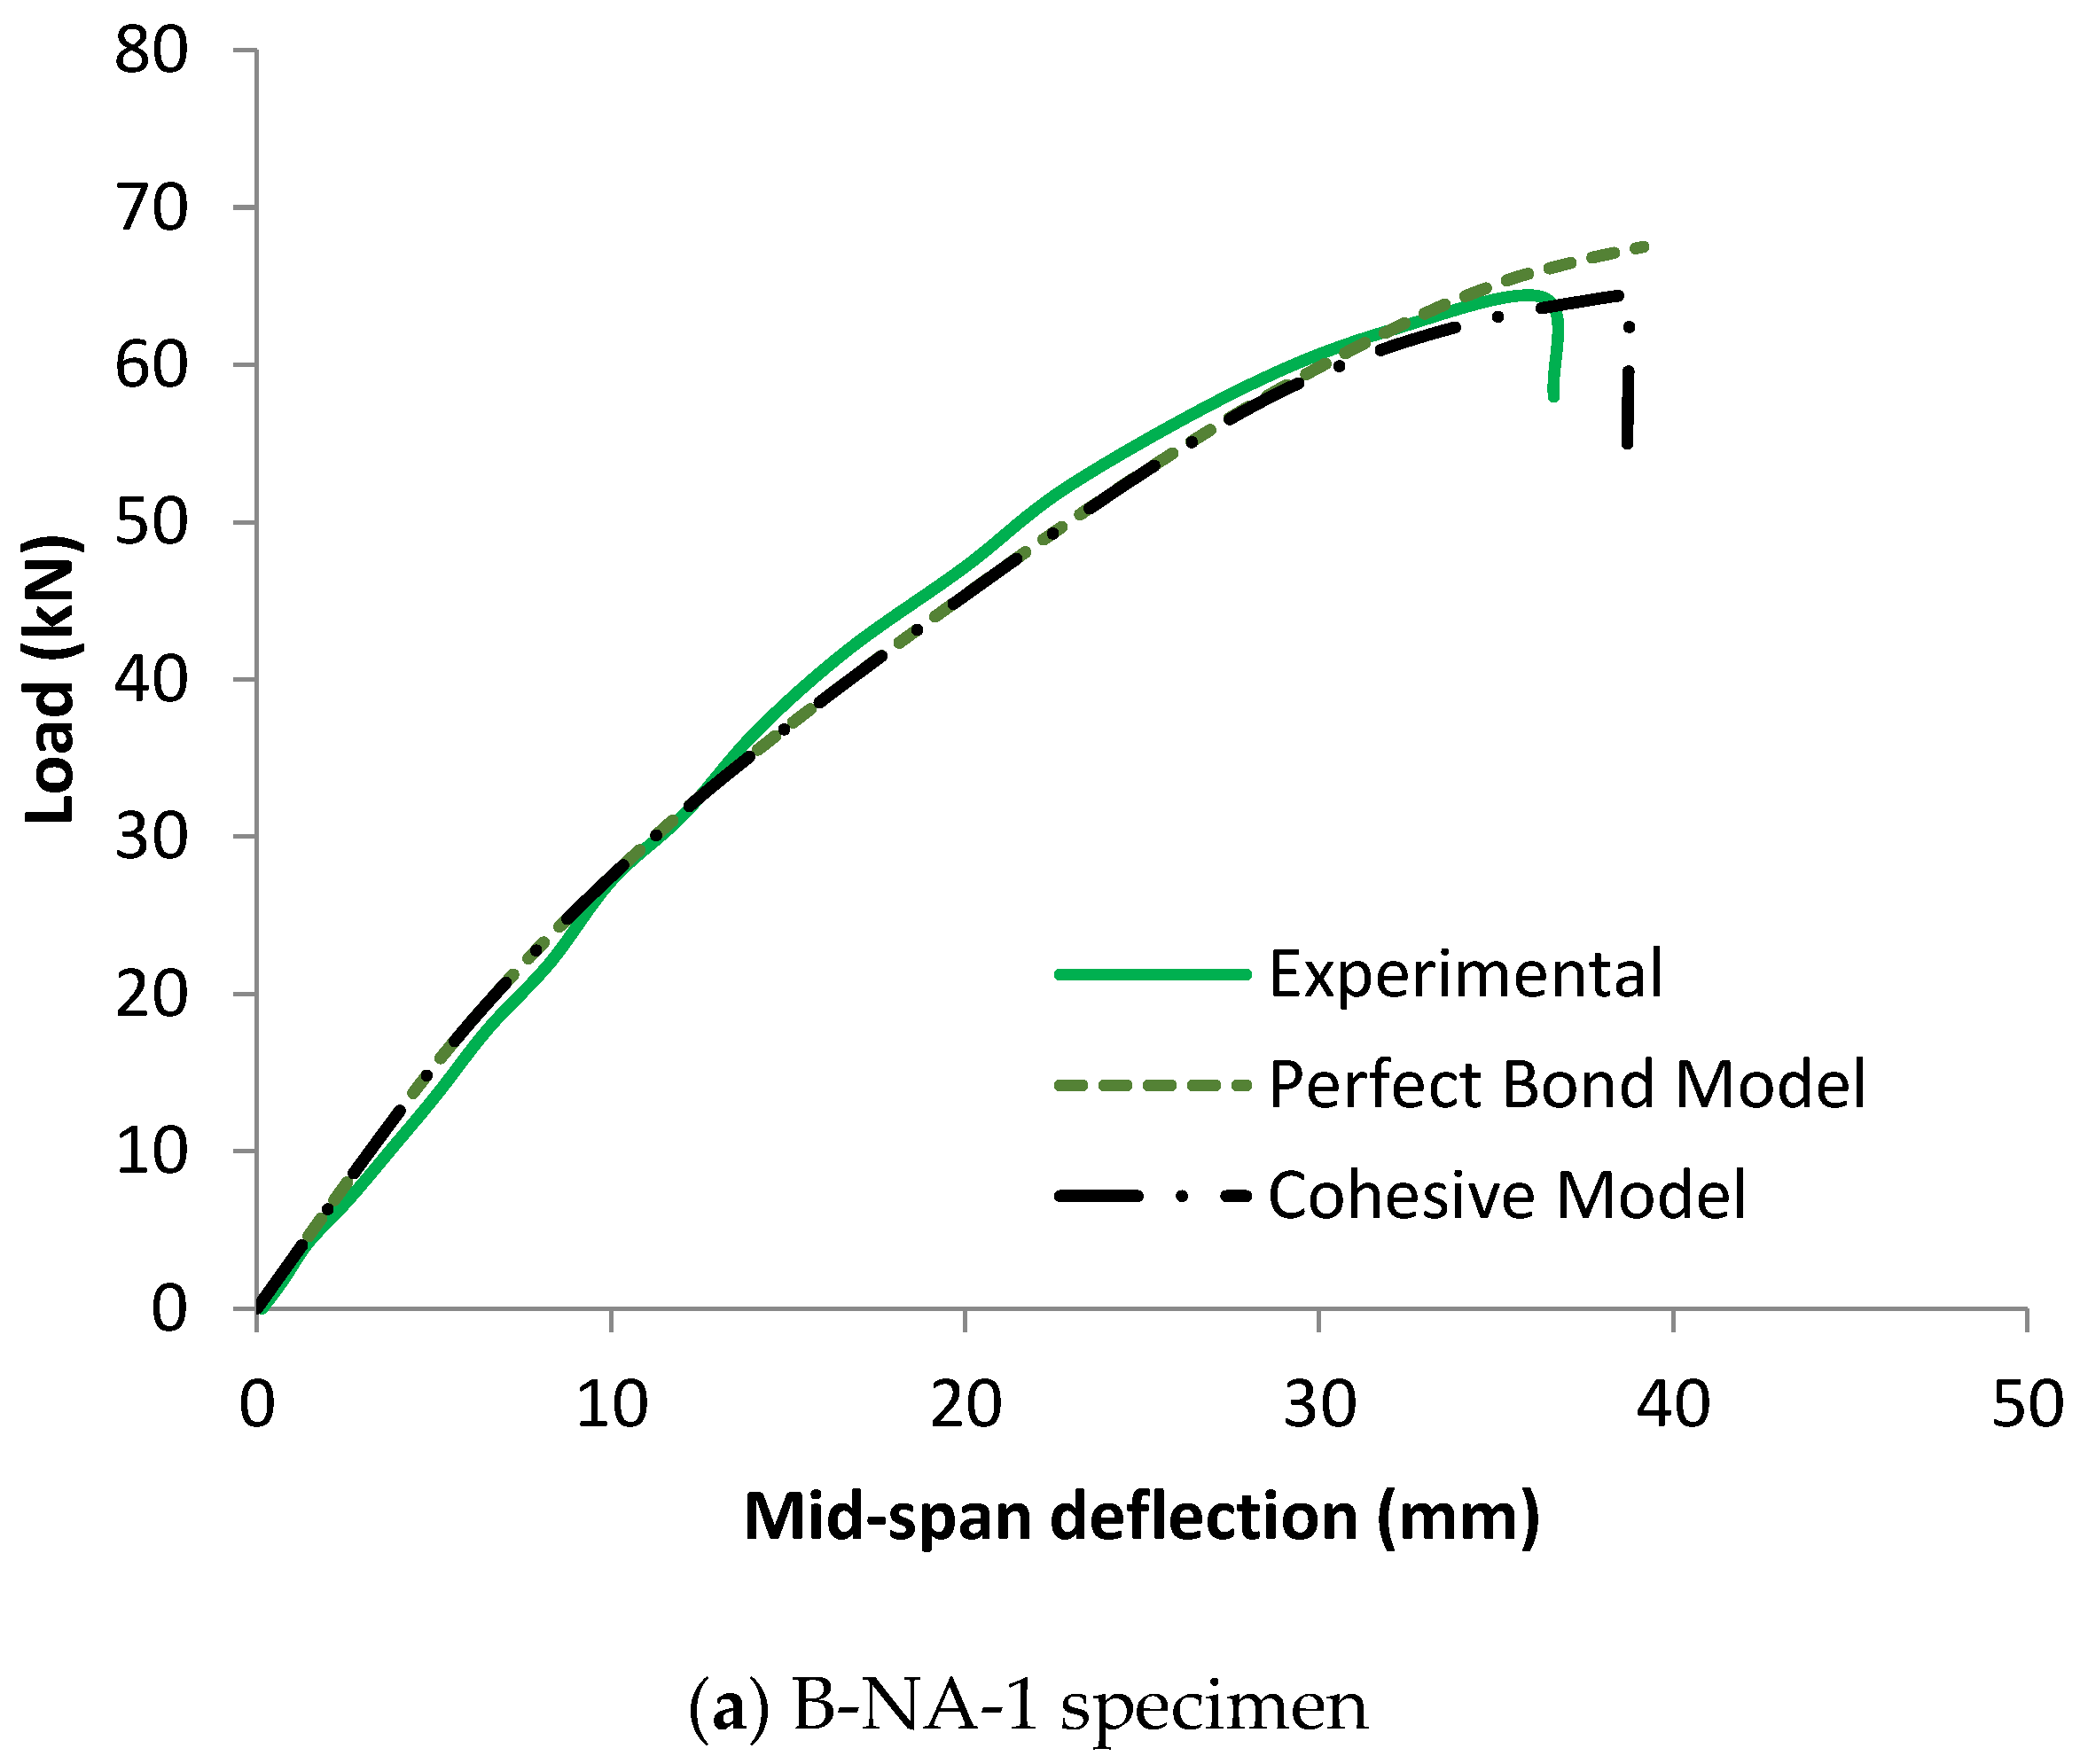
2.3. Validation Using Available Experimental Studies
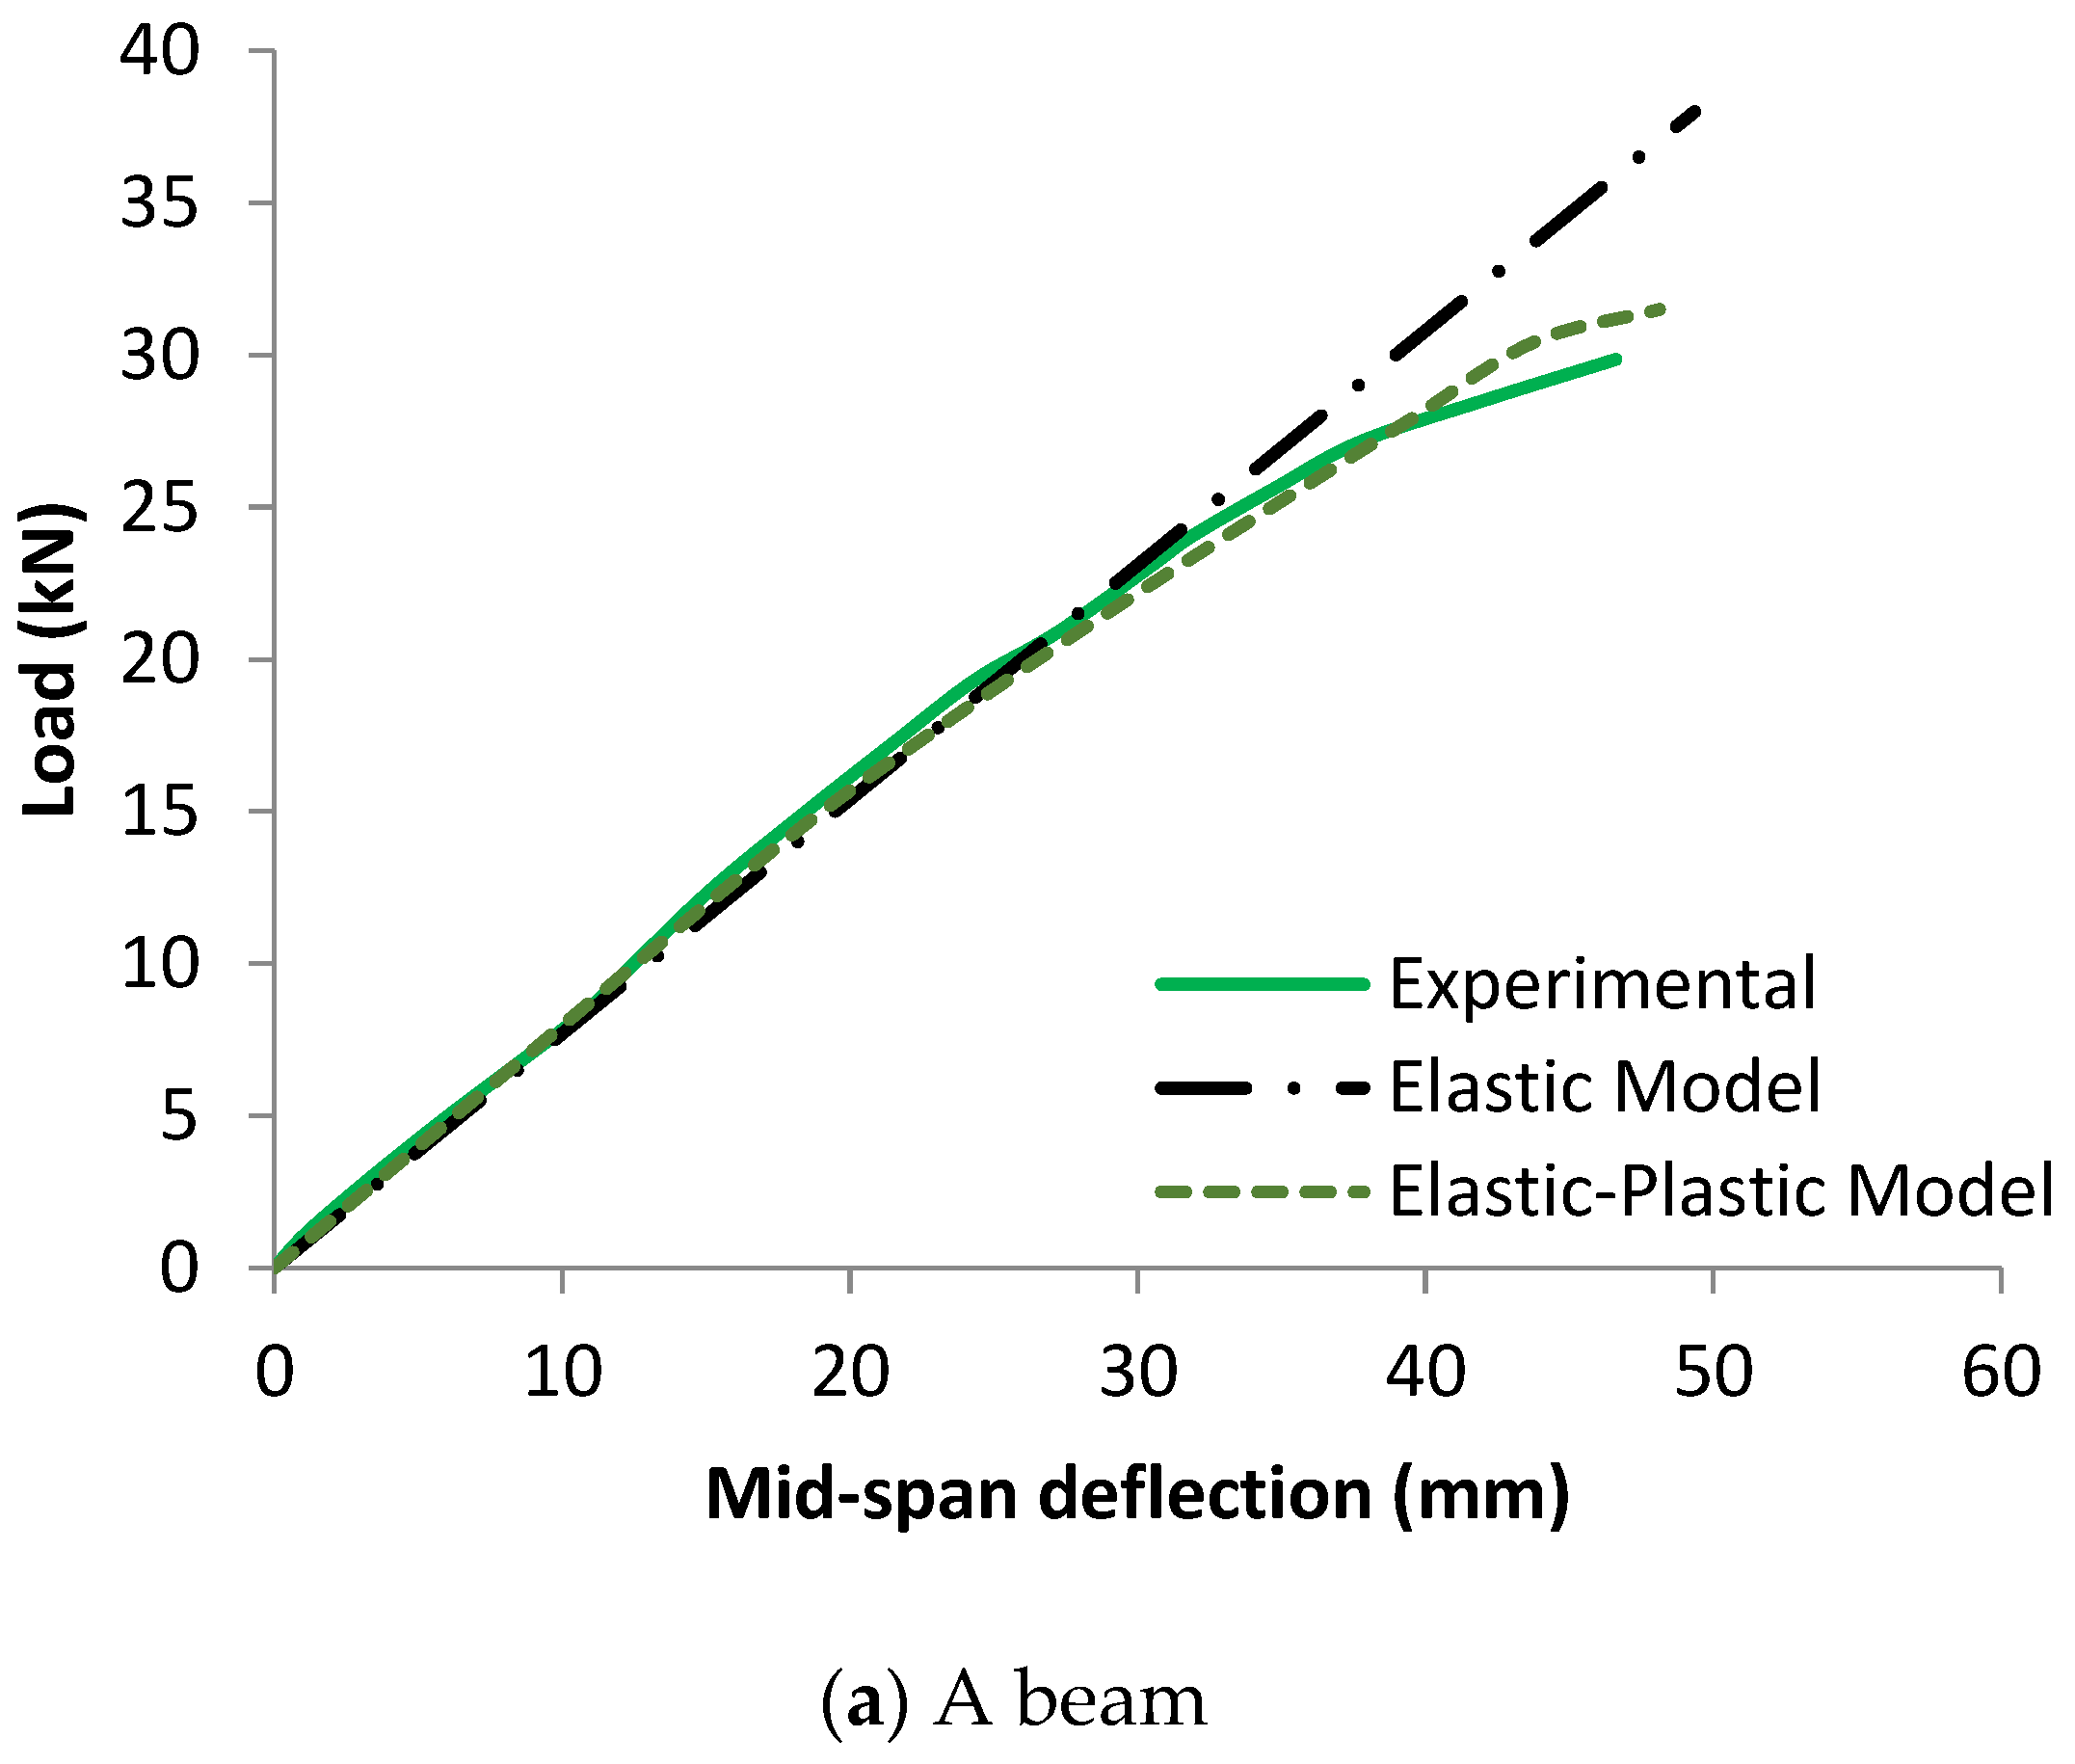
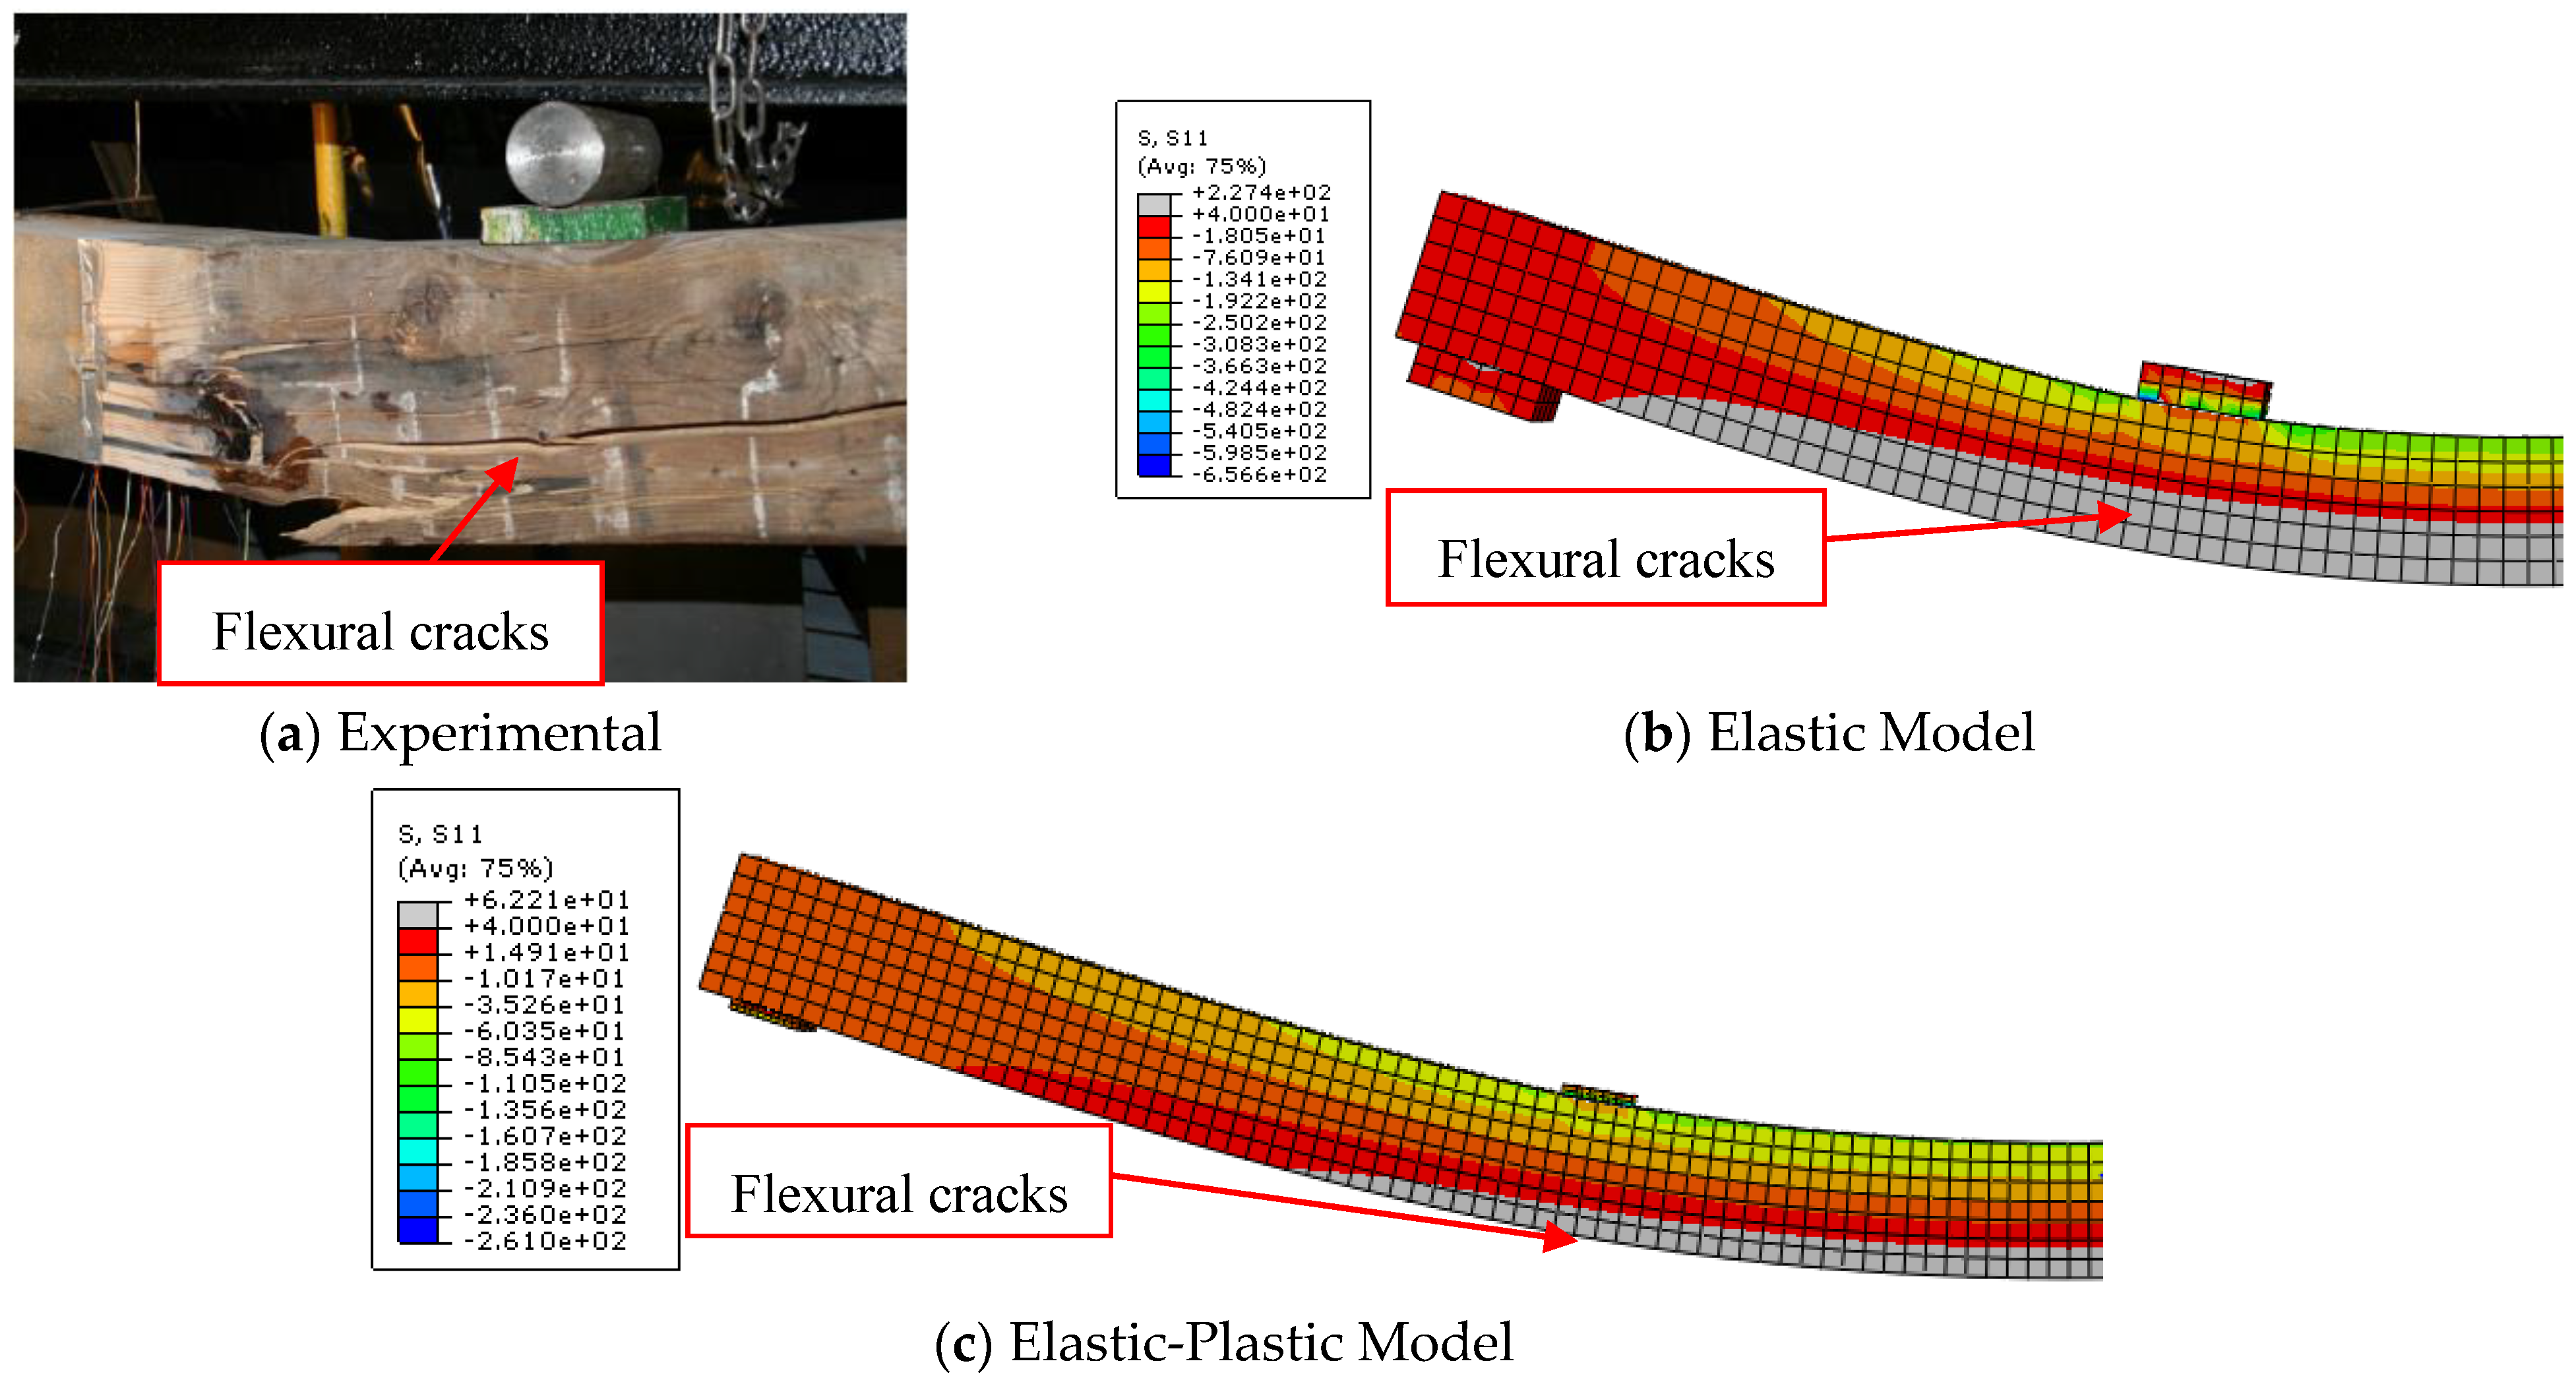
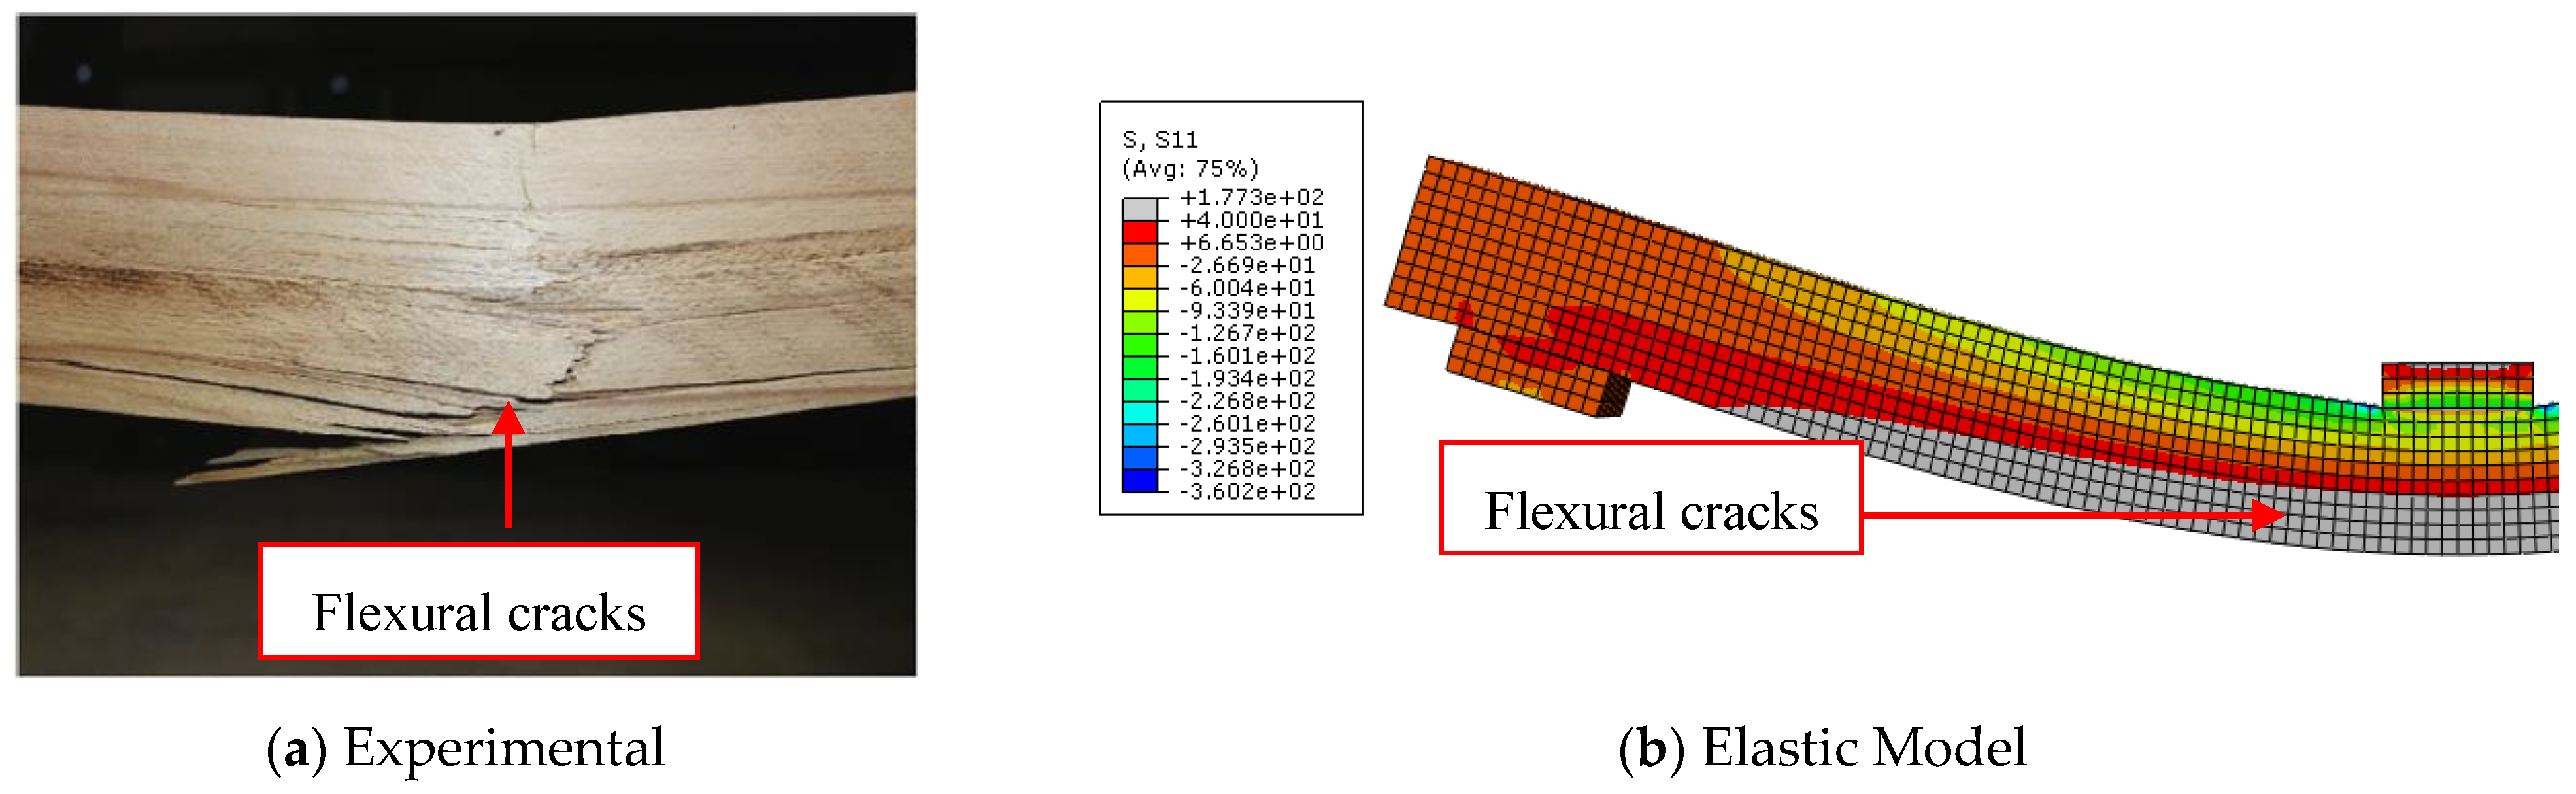
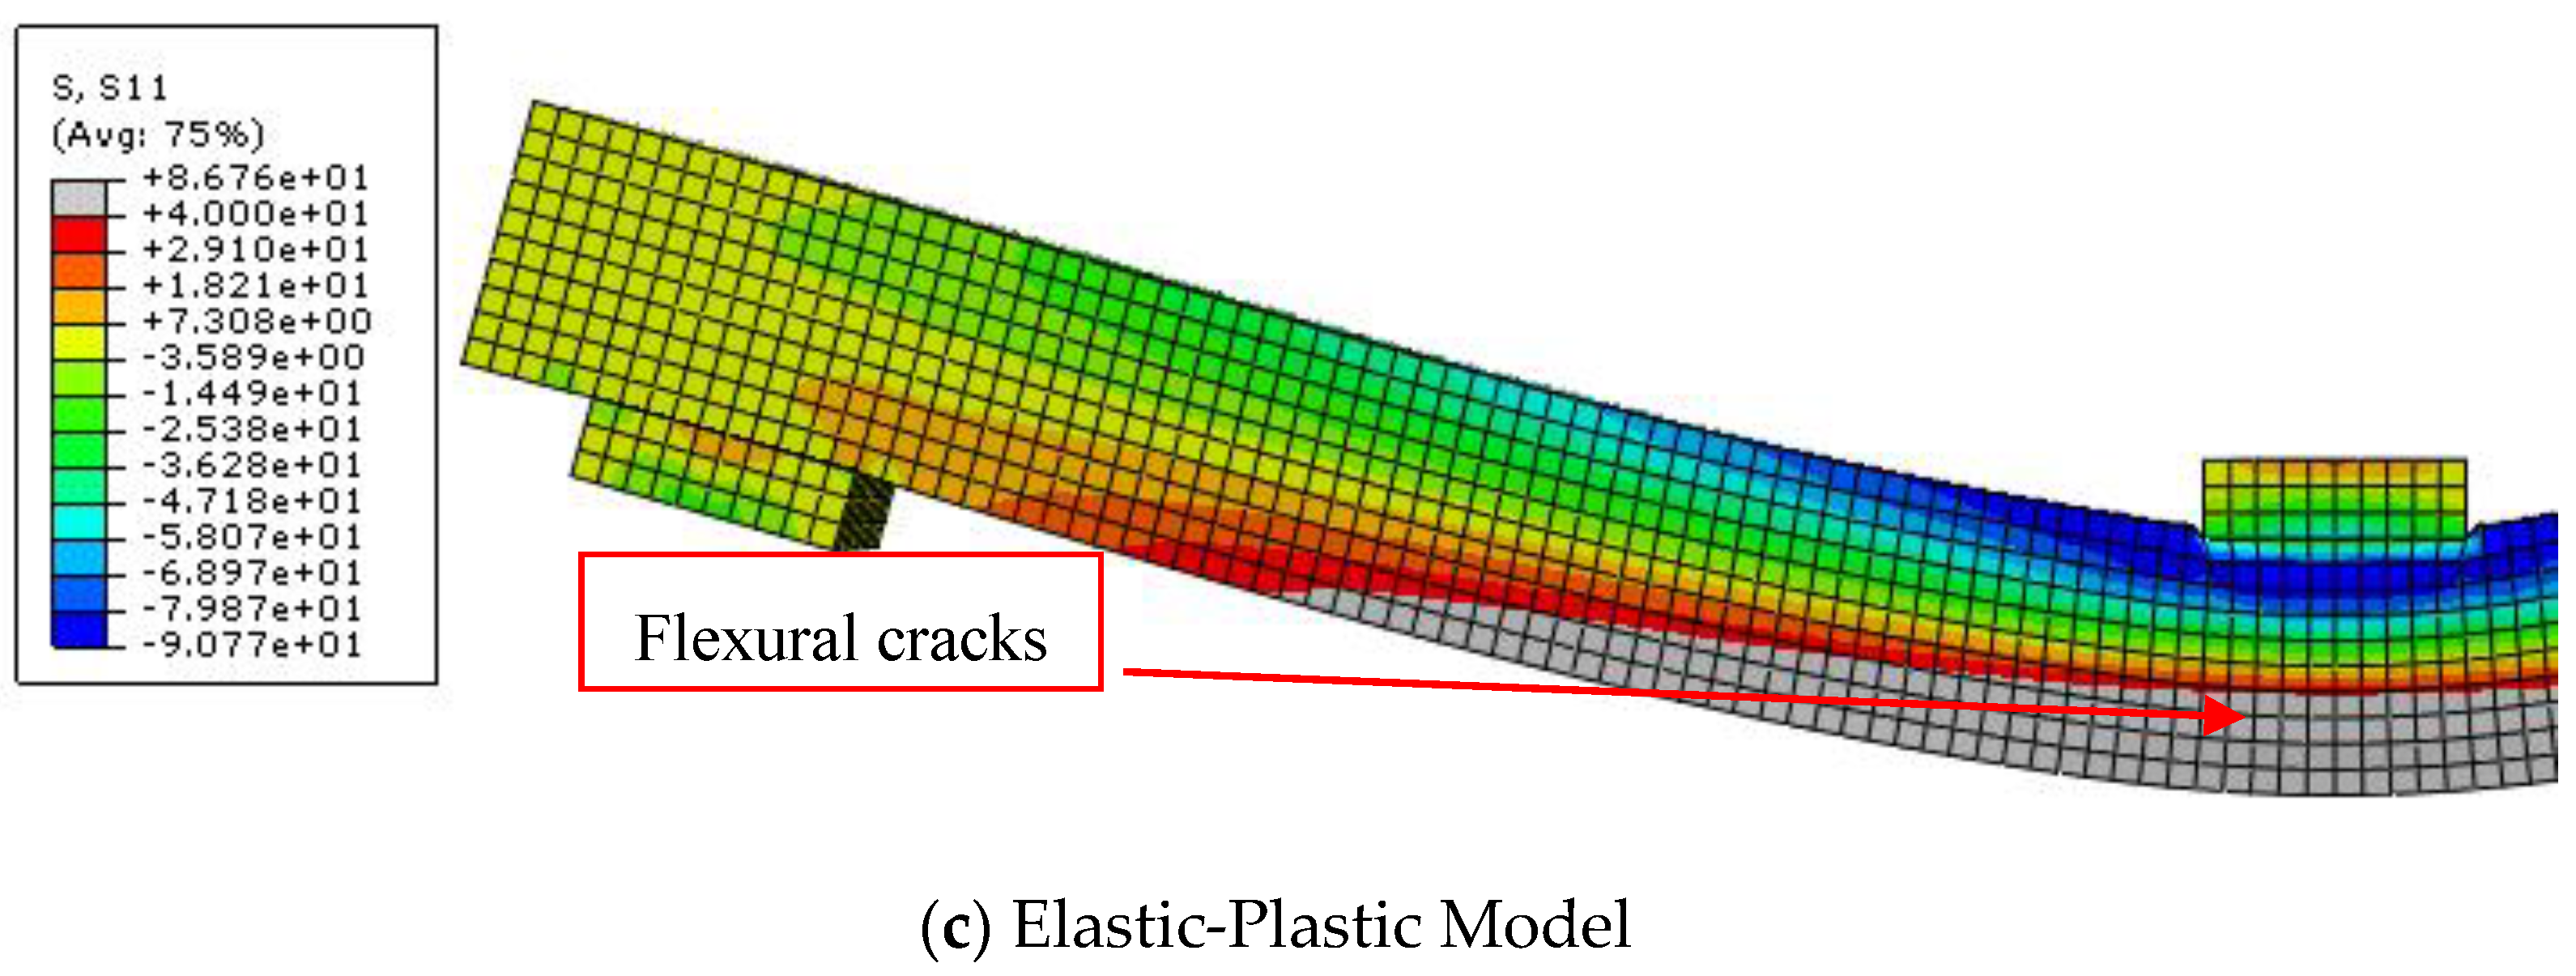
2.3.1. Timber Beams
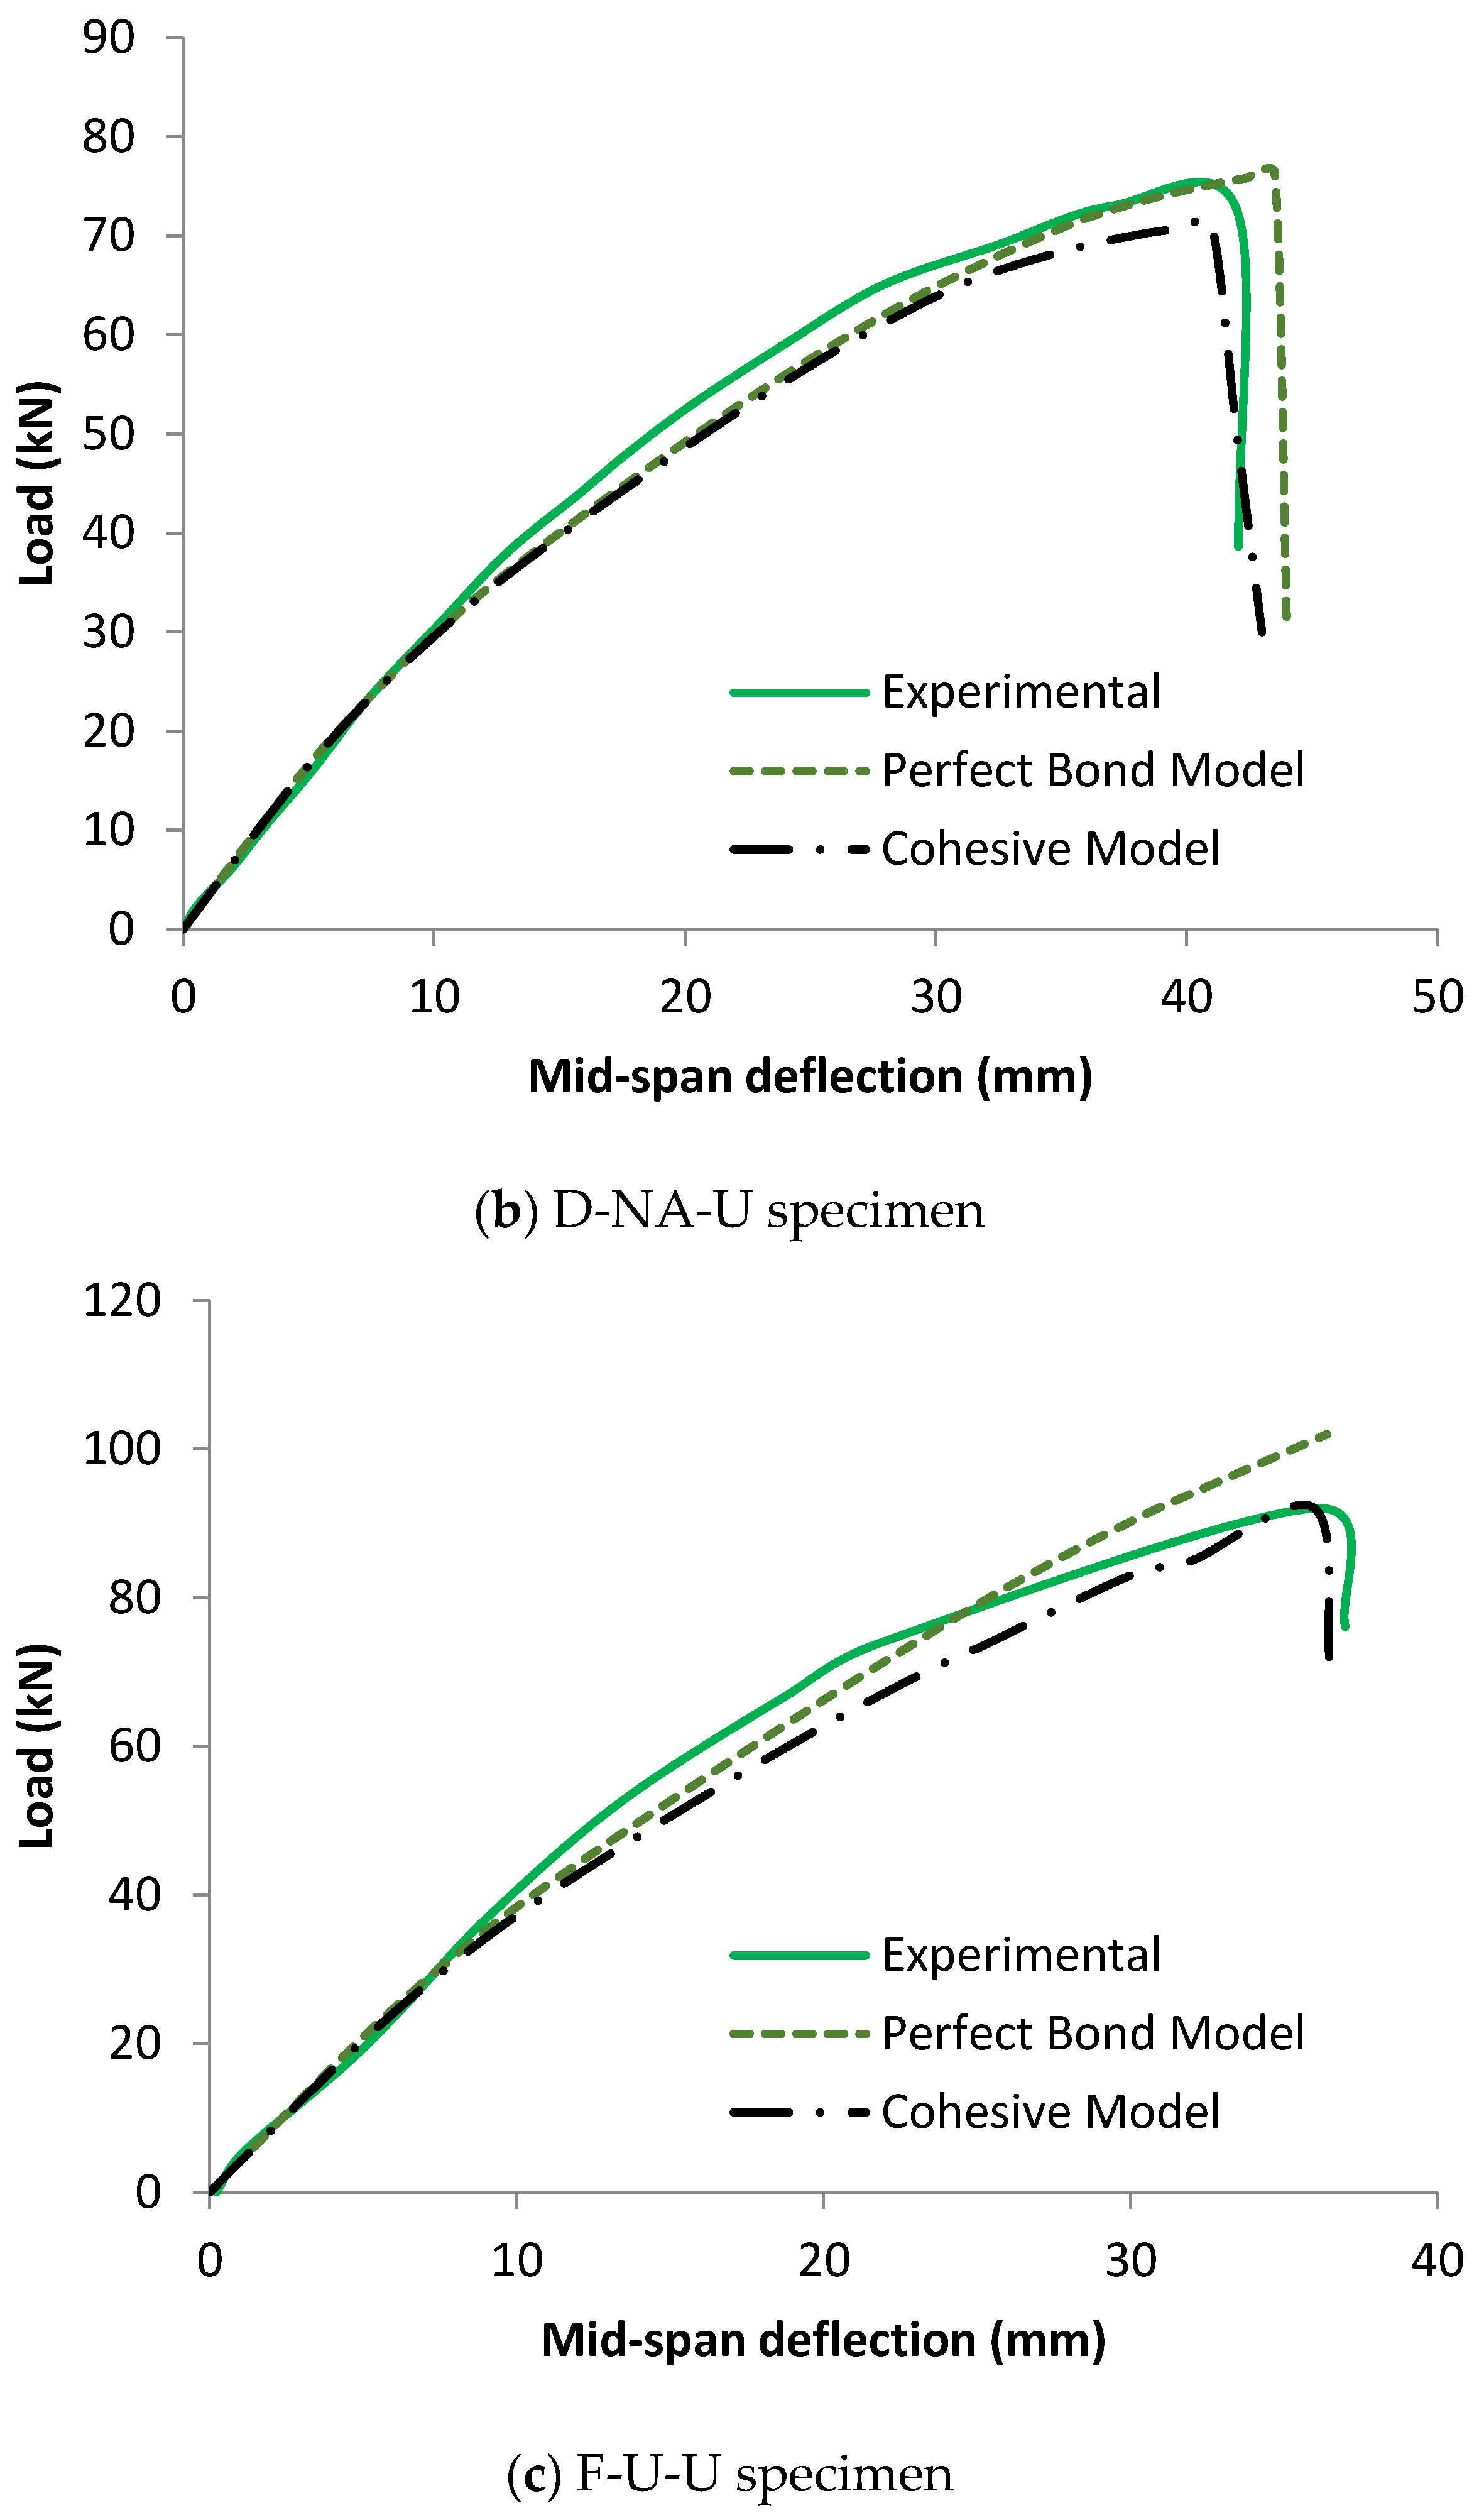
2.3.2. Timber Beams Strengthened with FRP
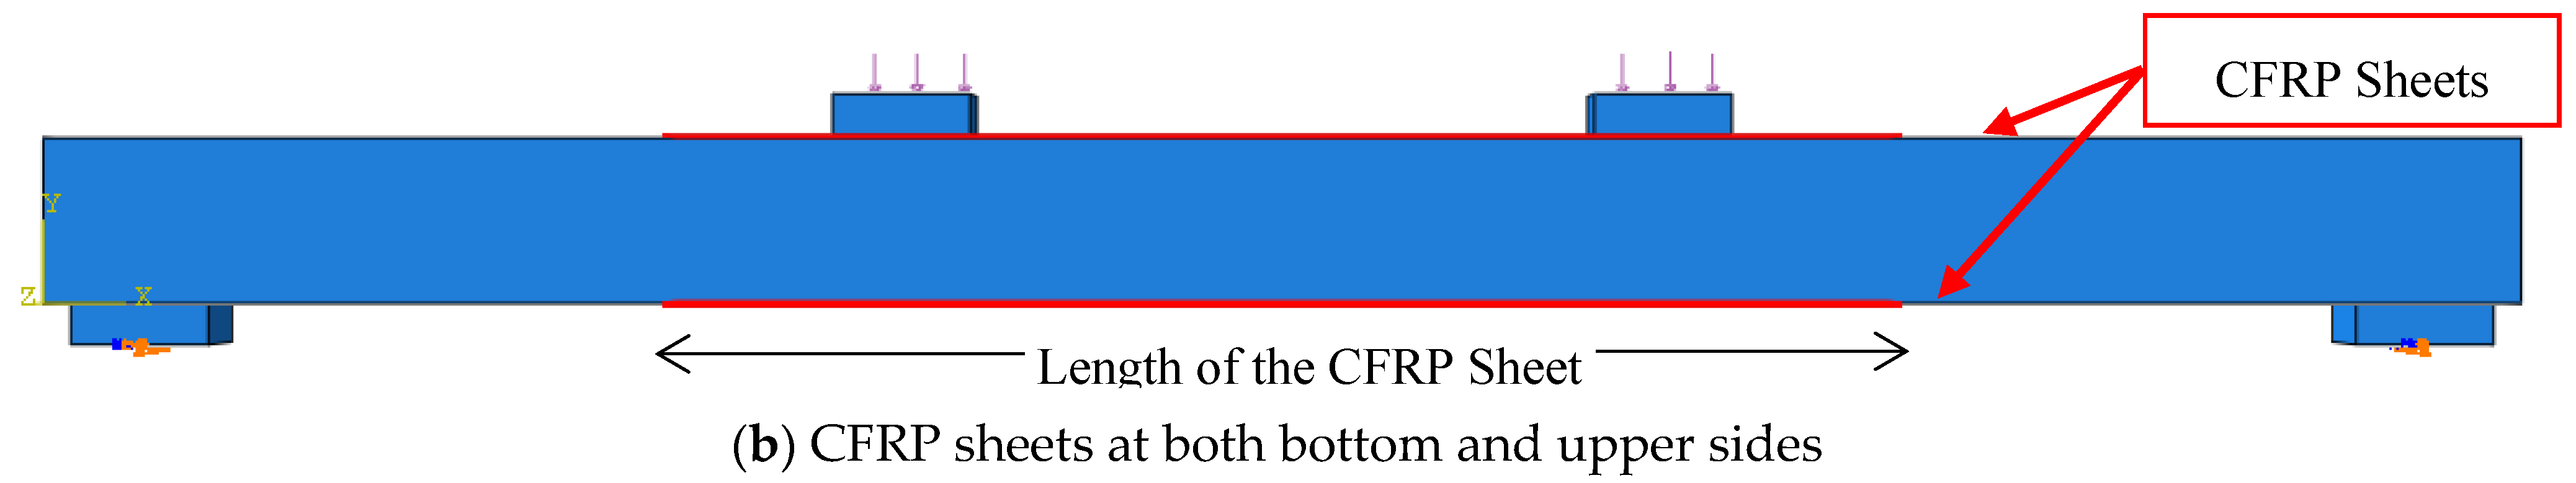
3. Parametric Analysis
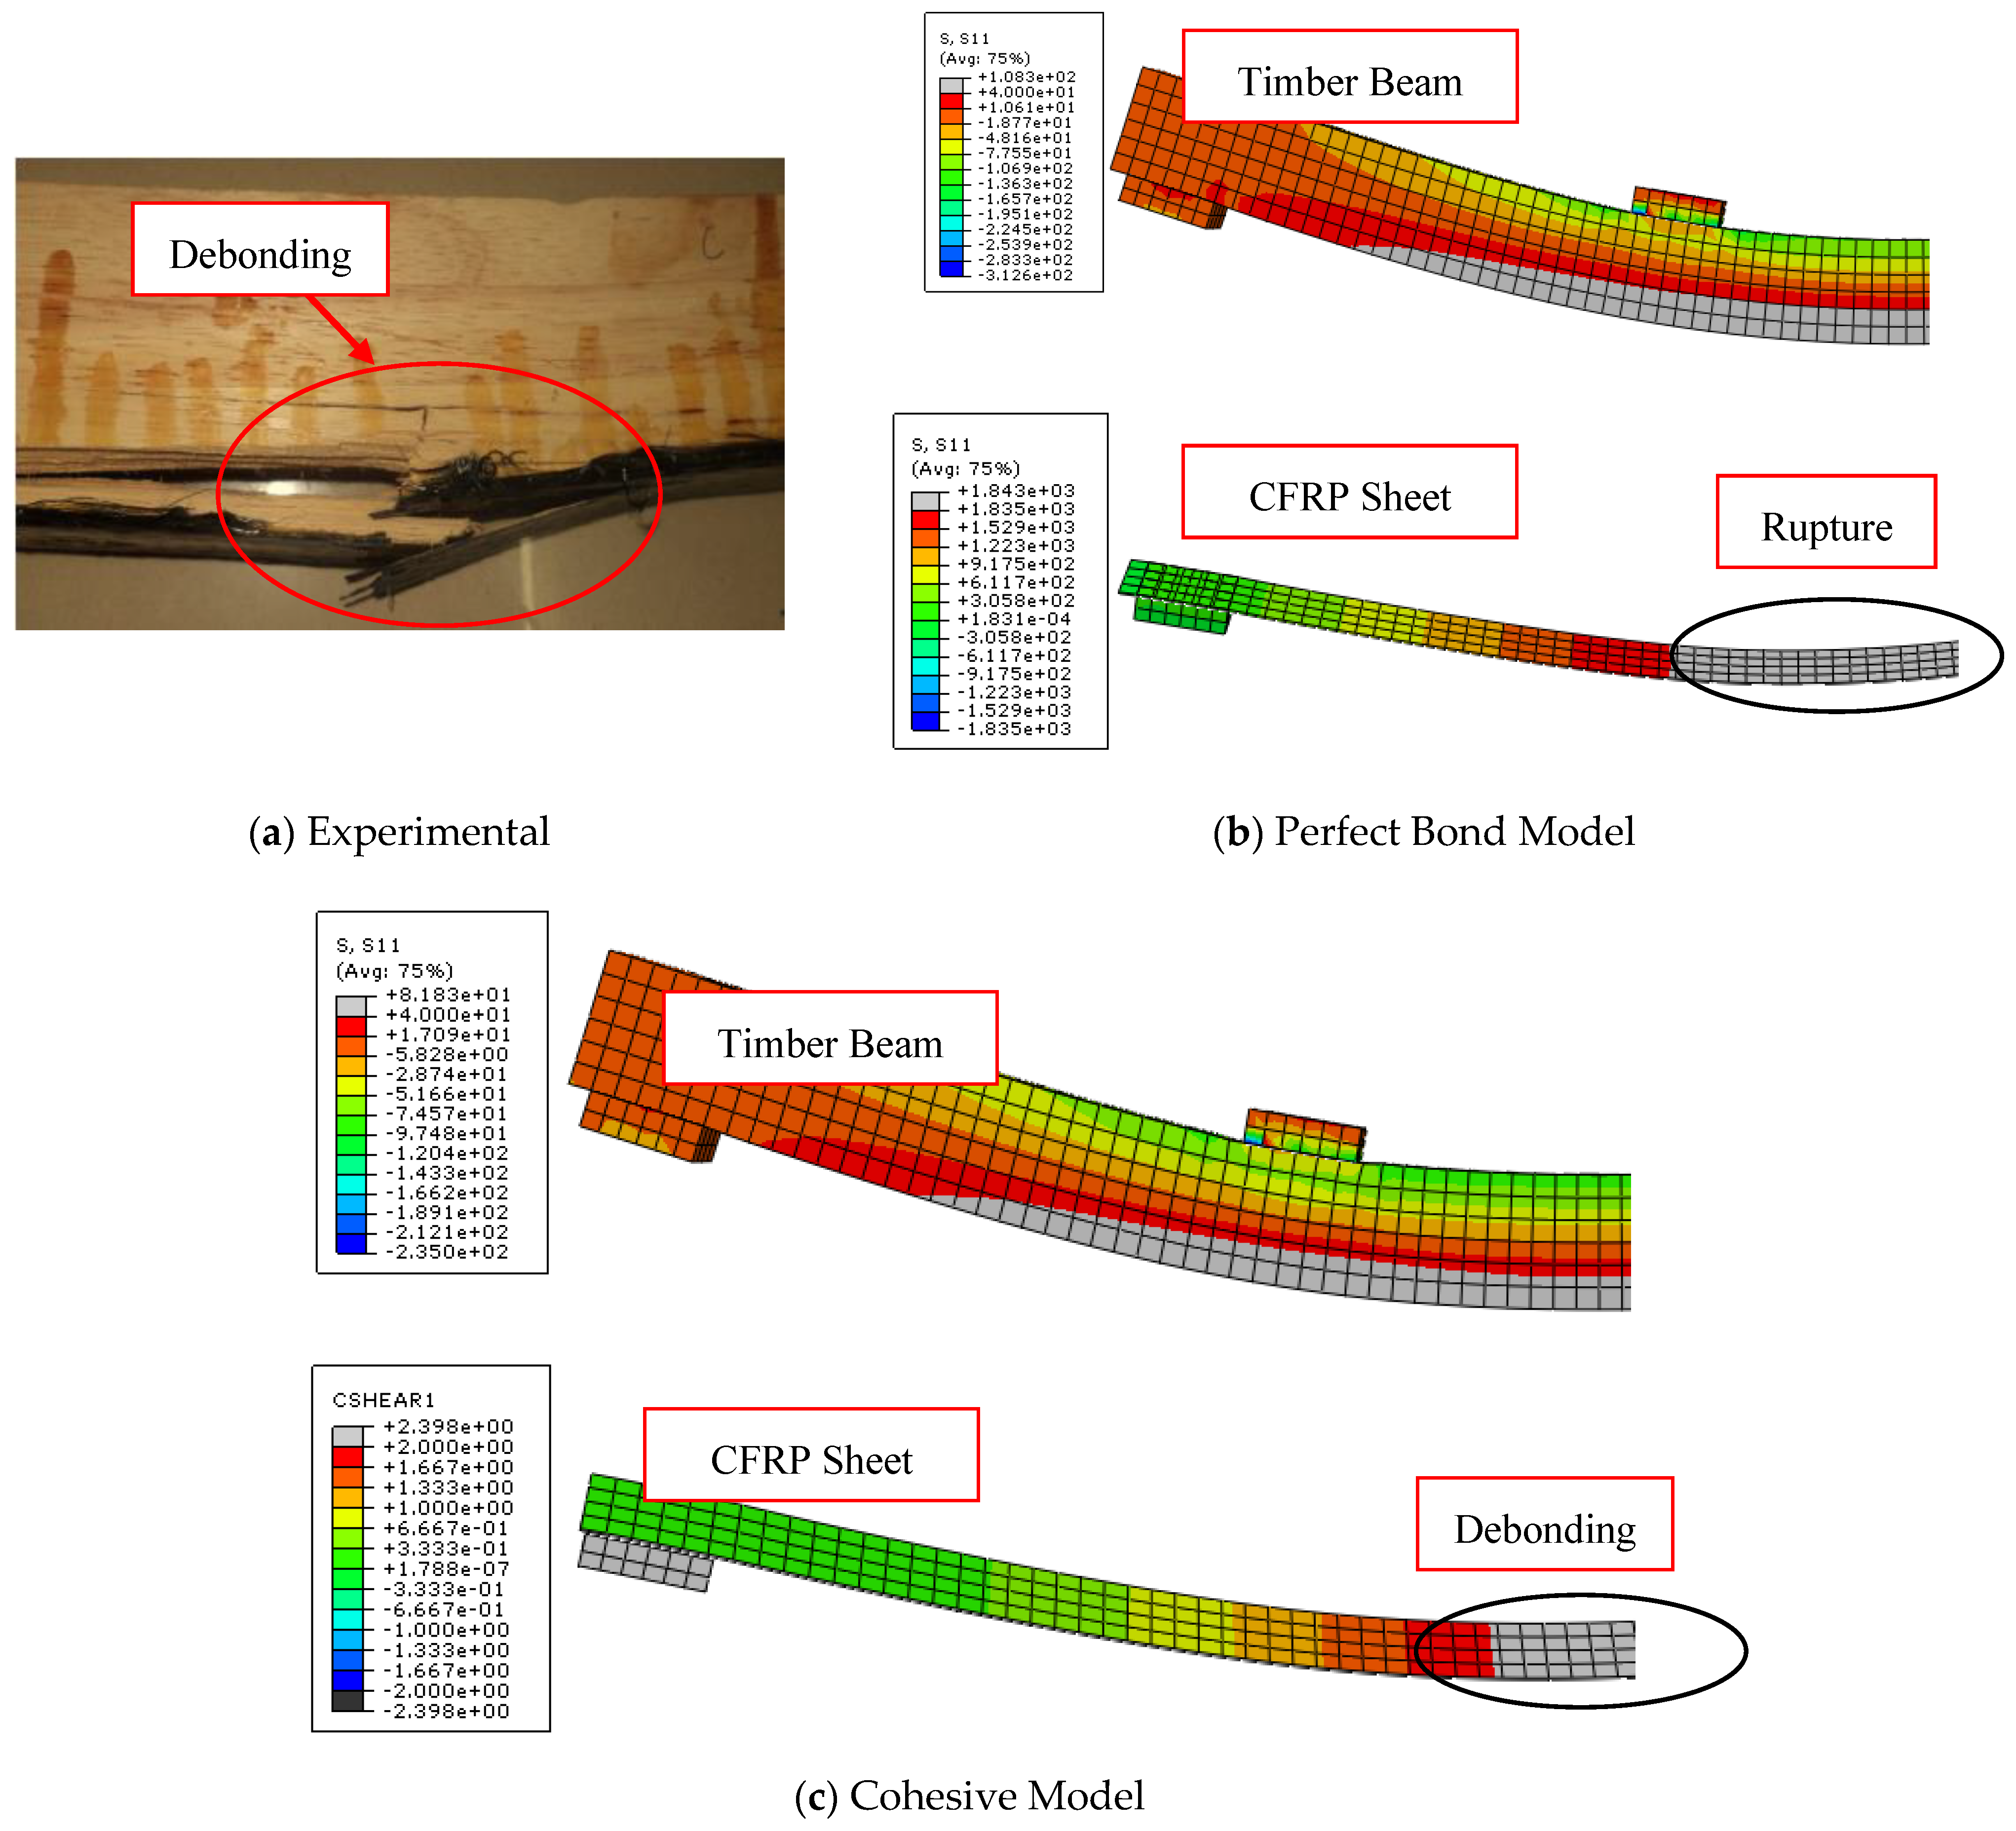
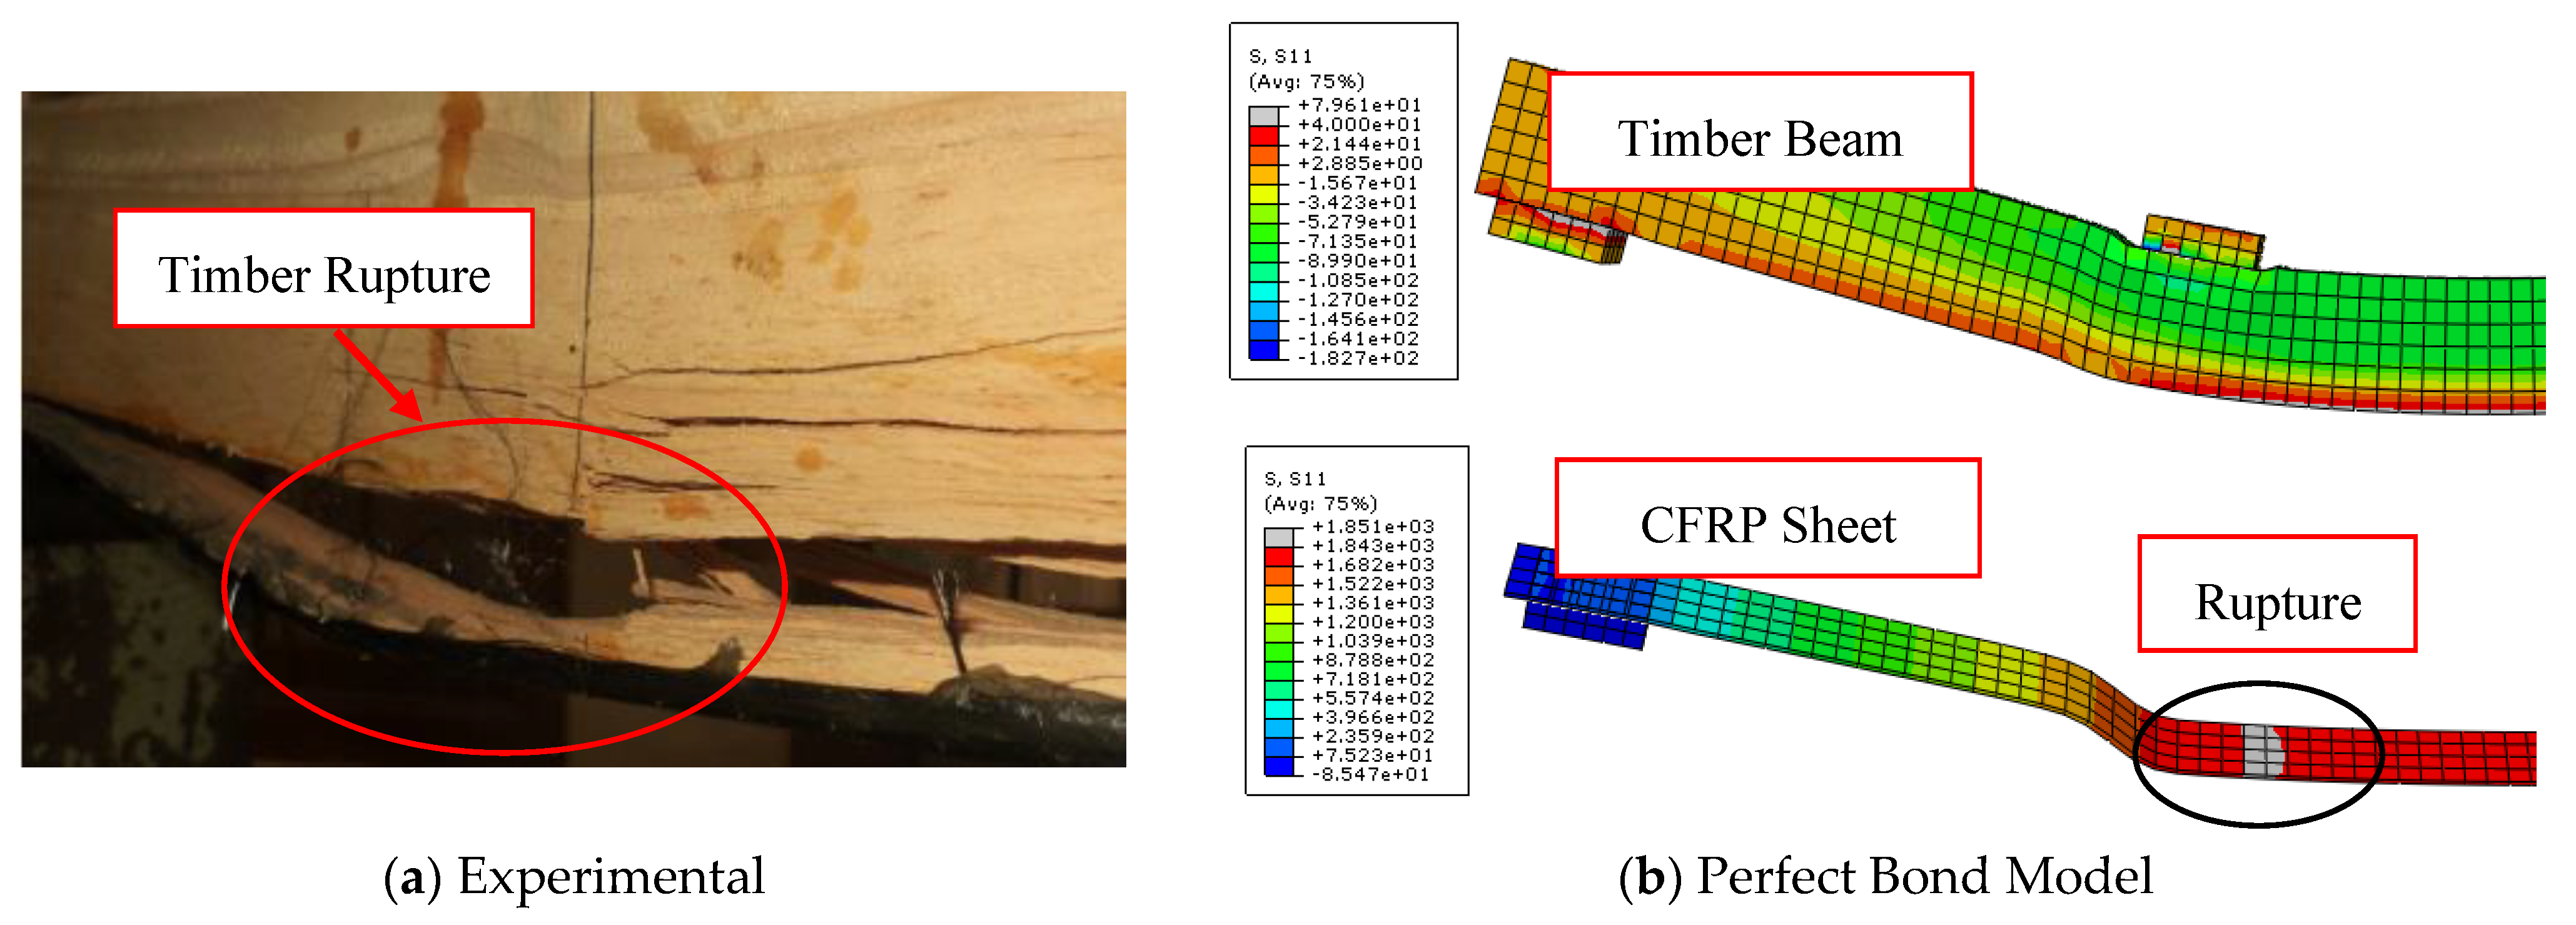
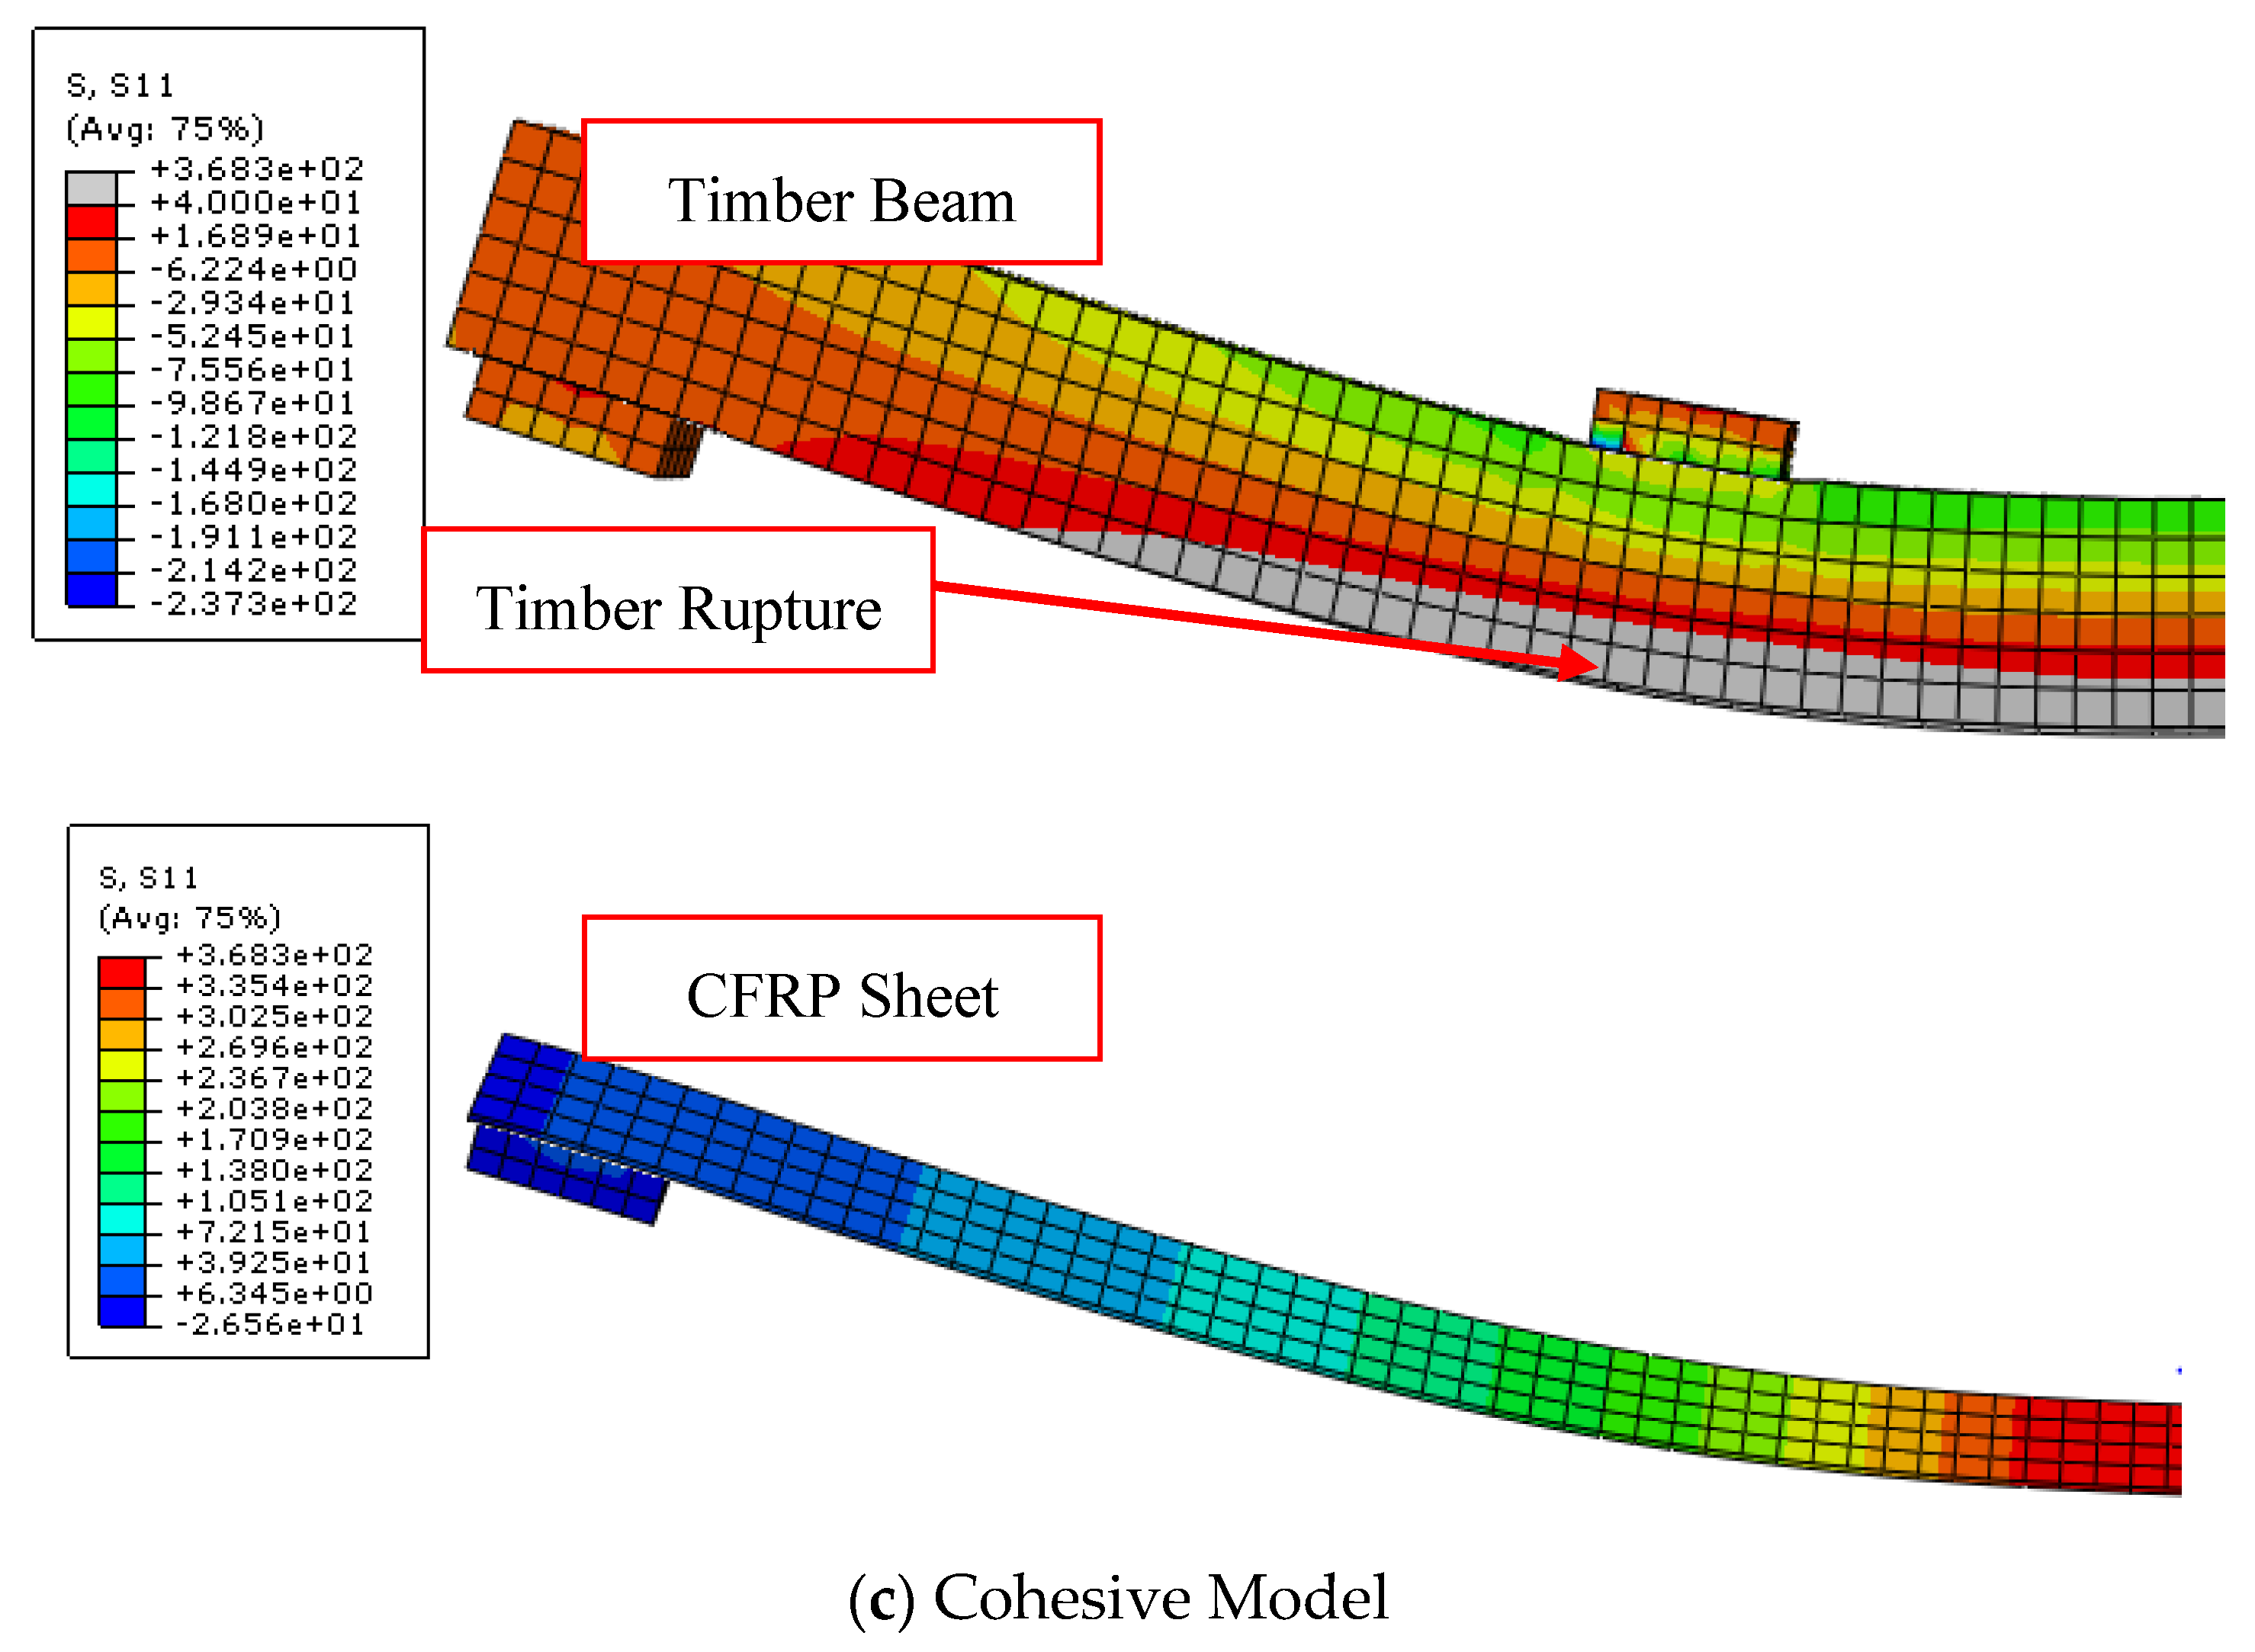
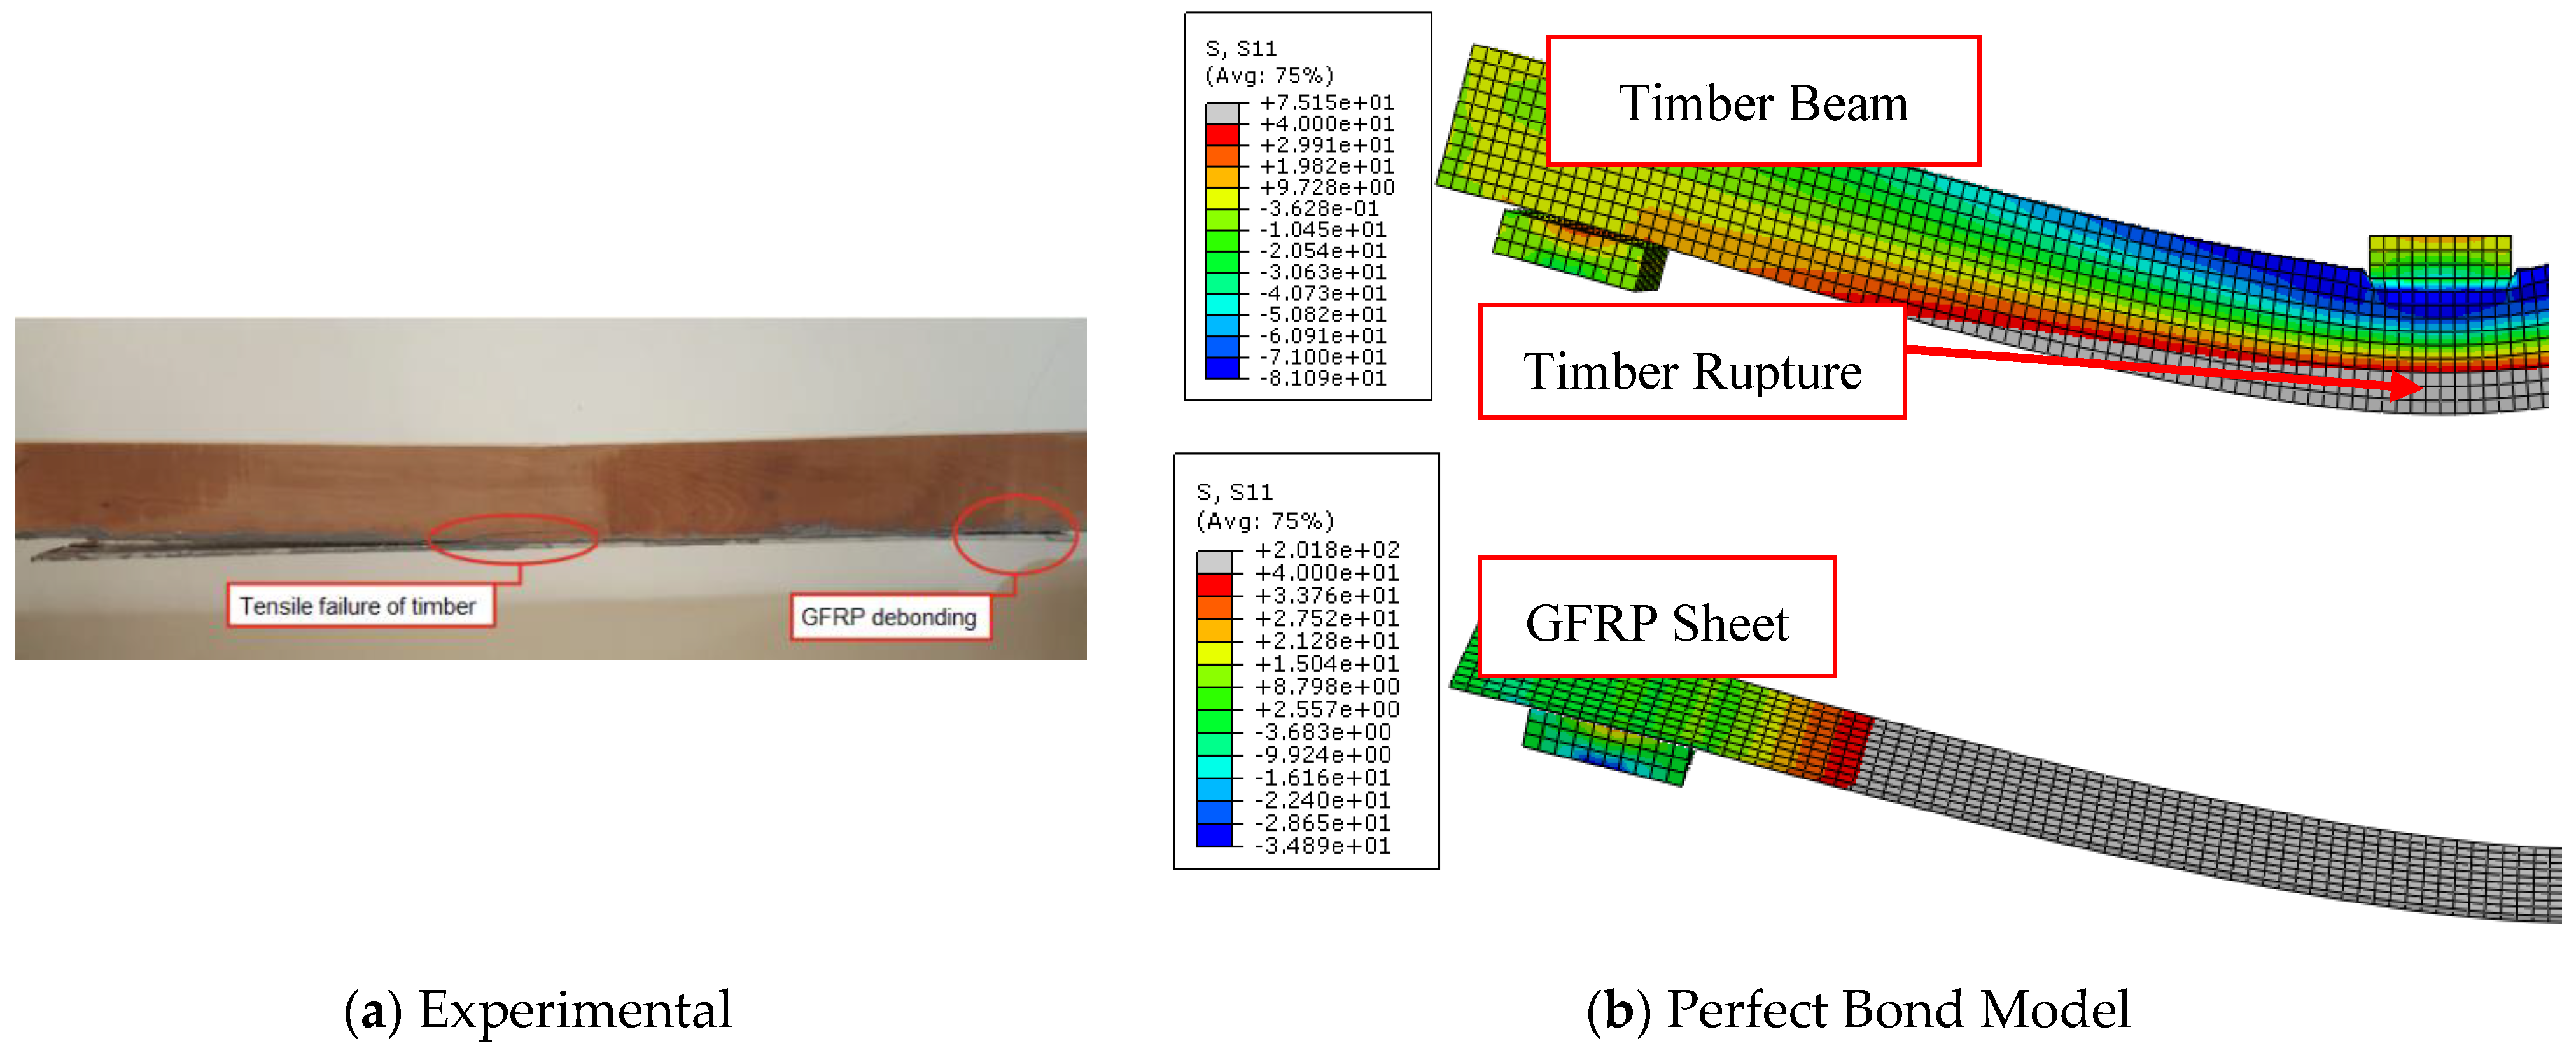
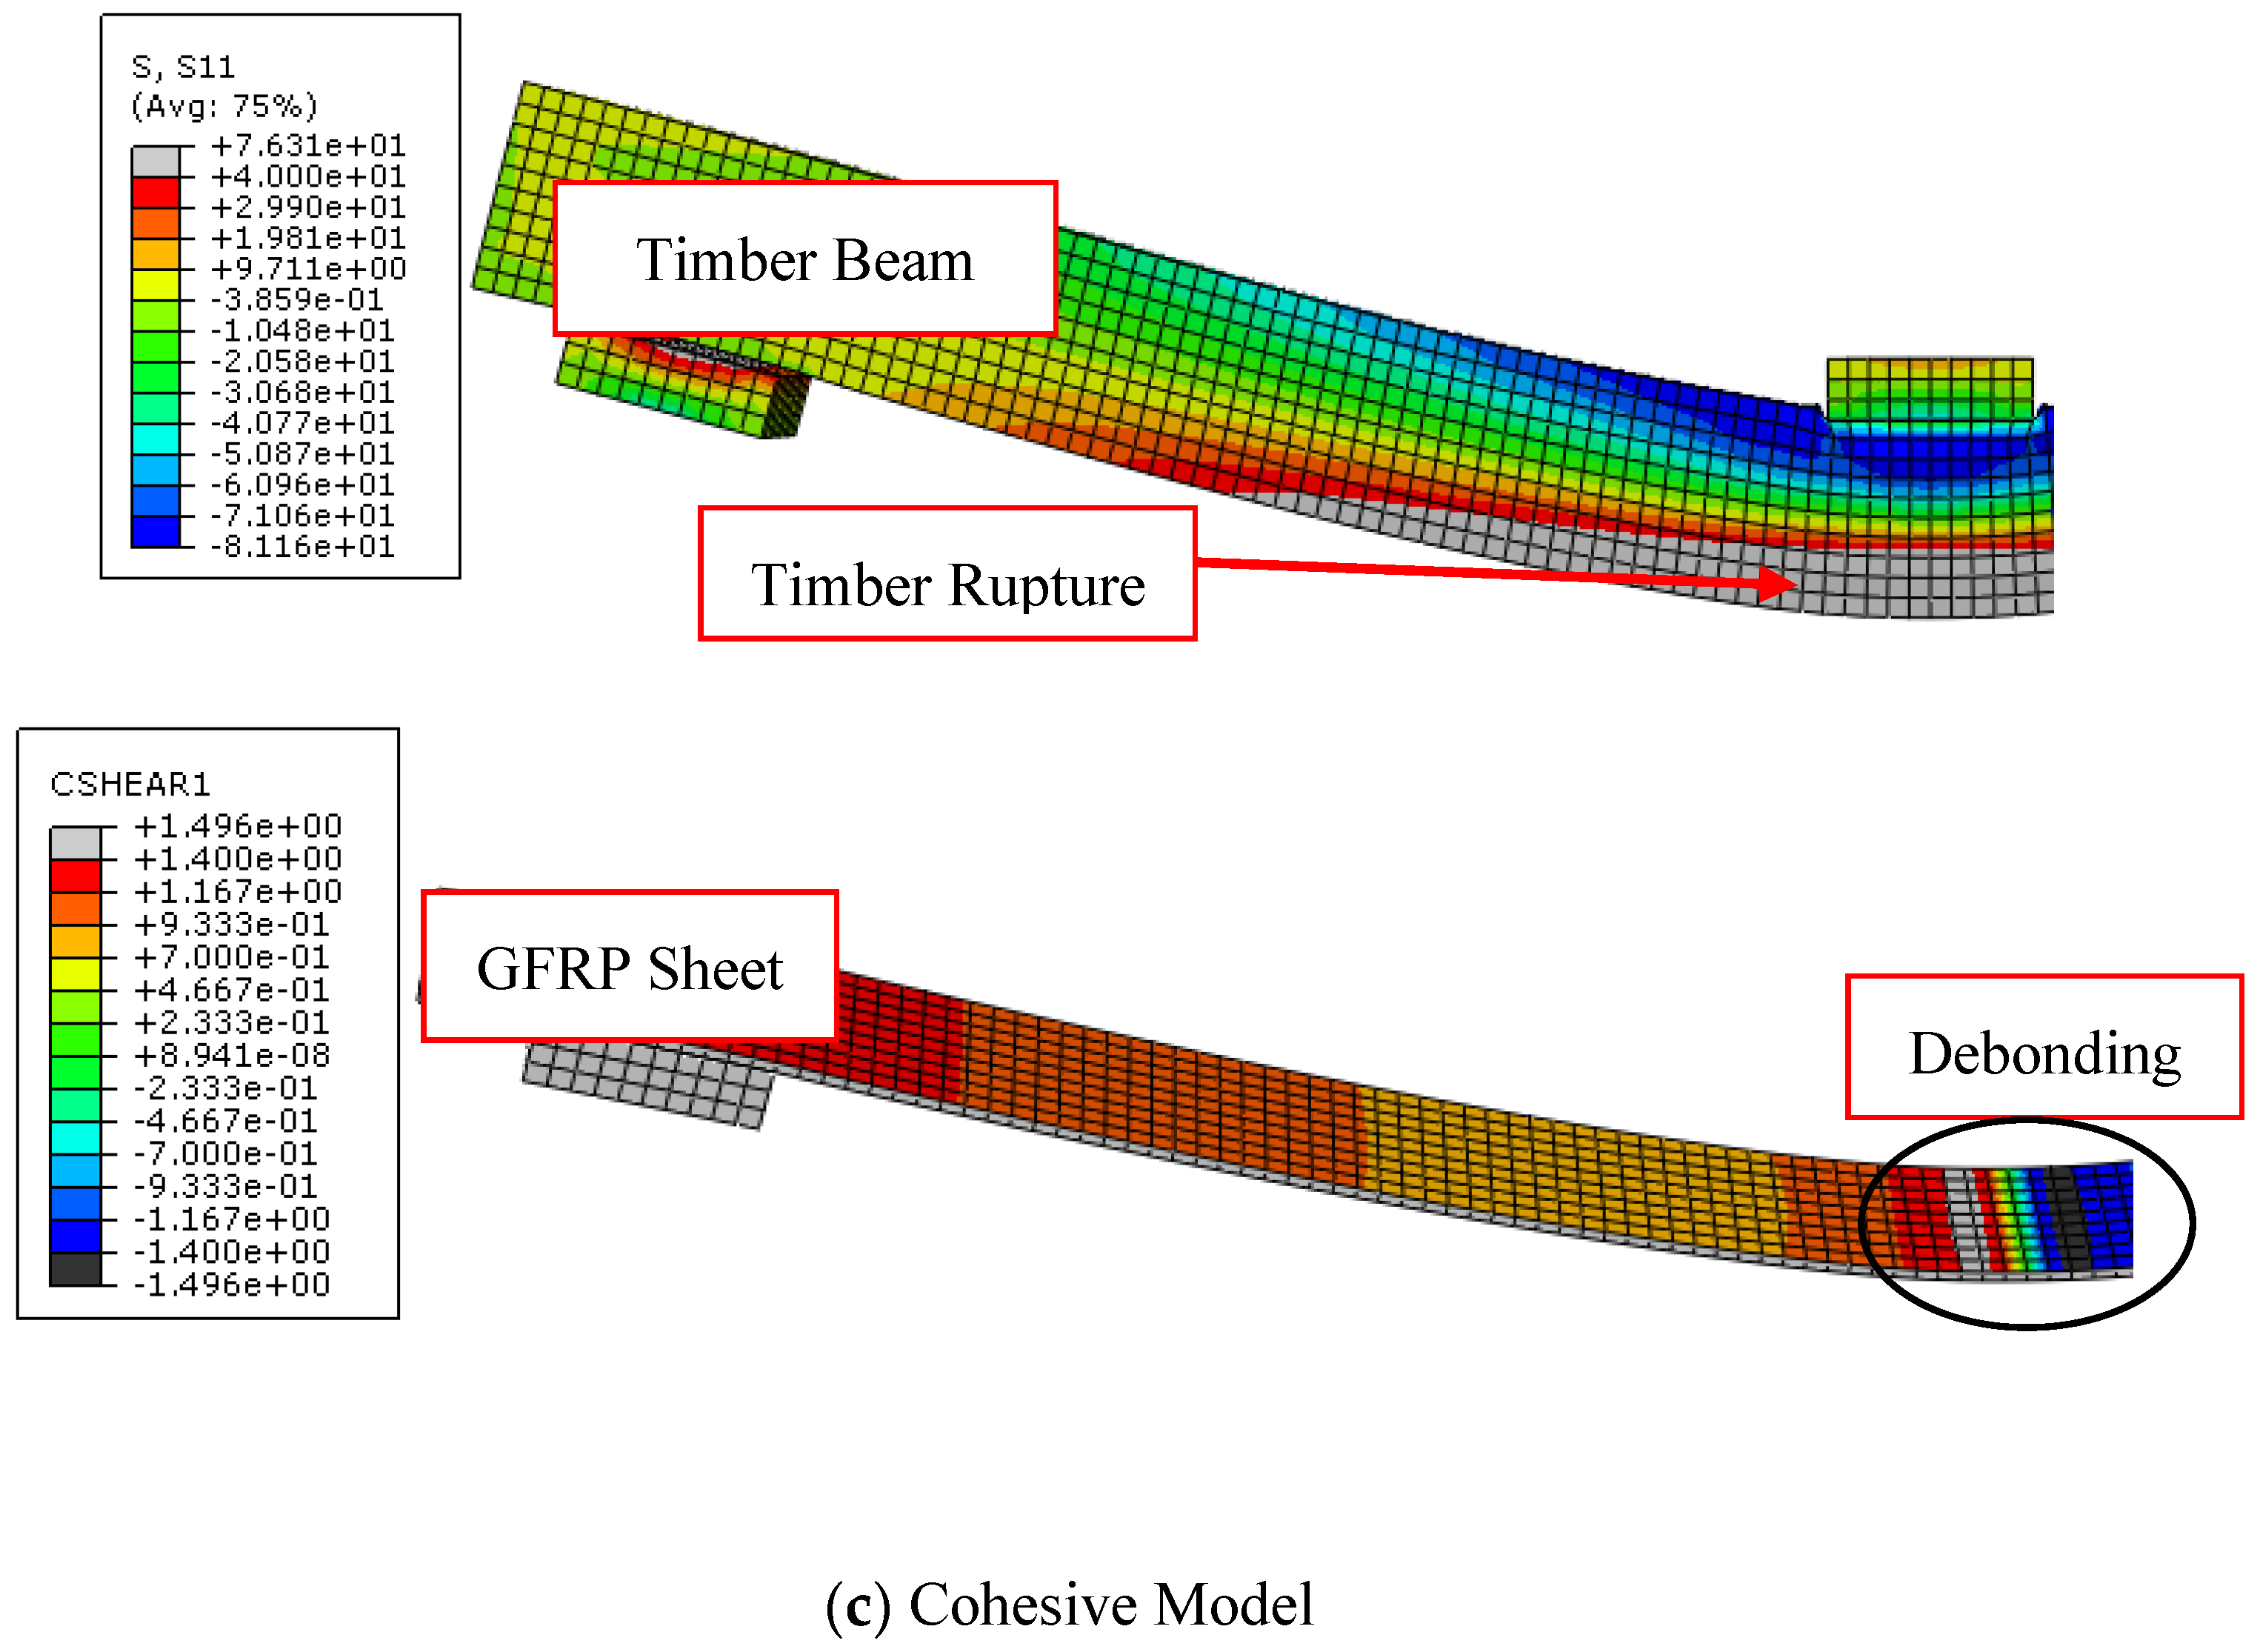
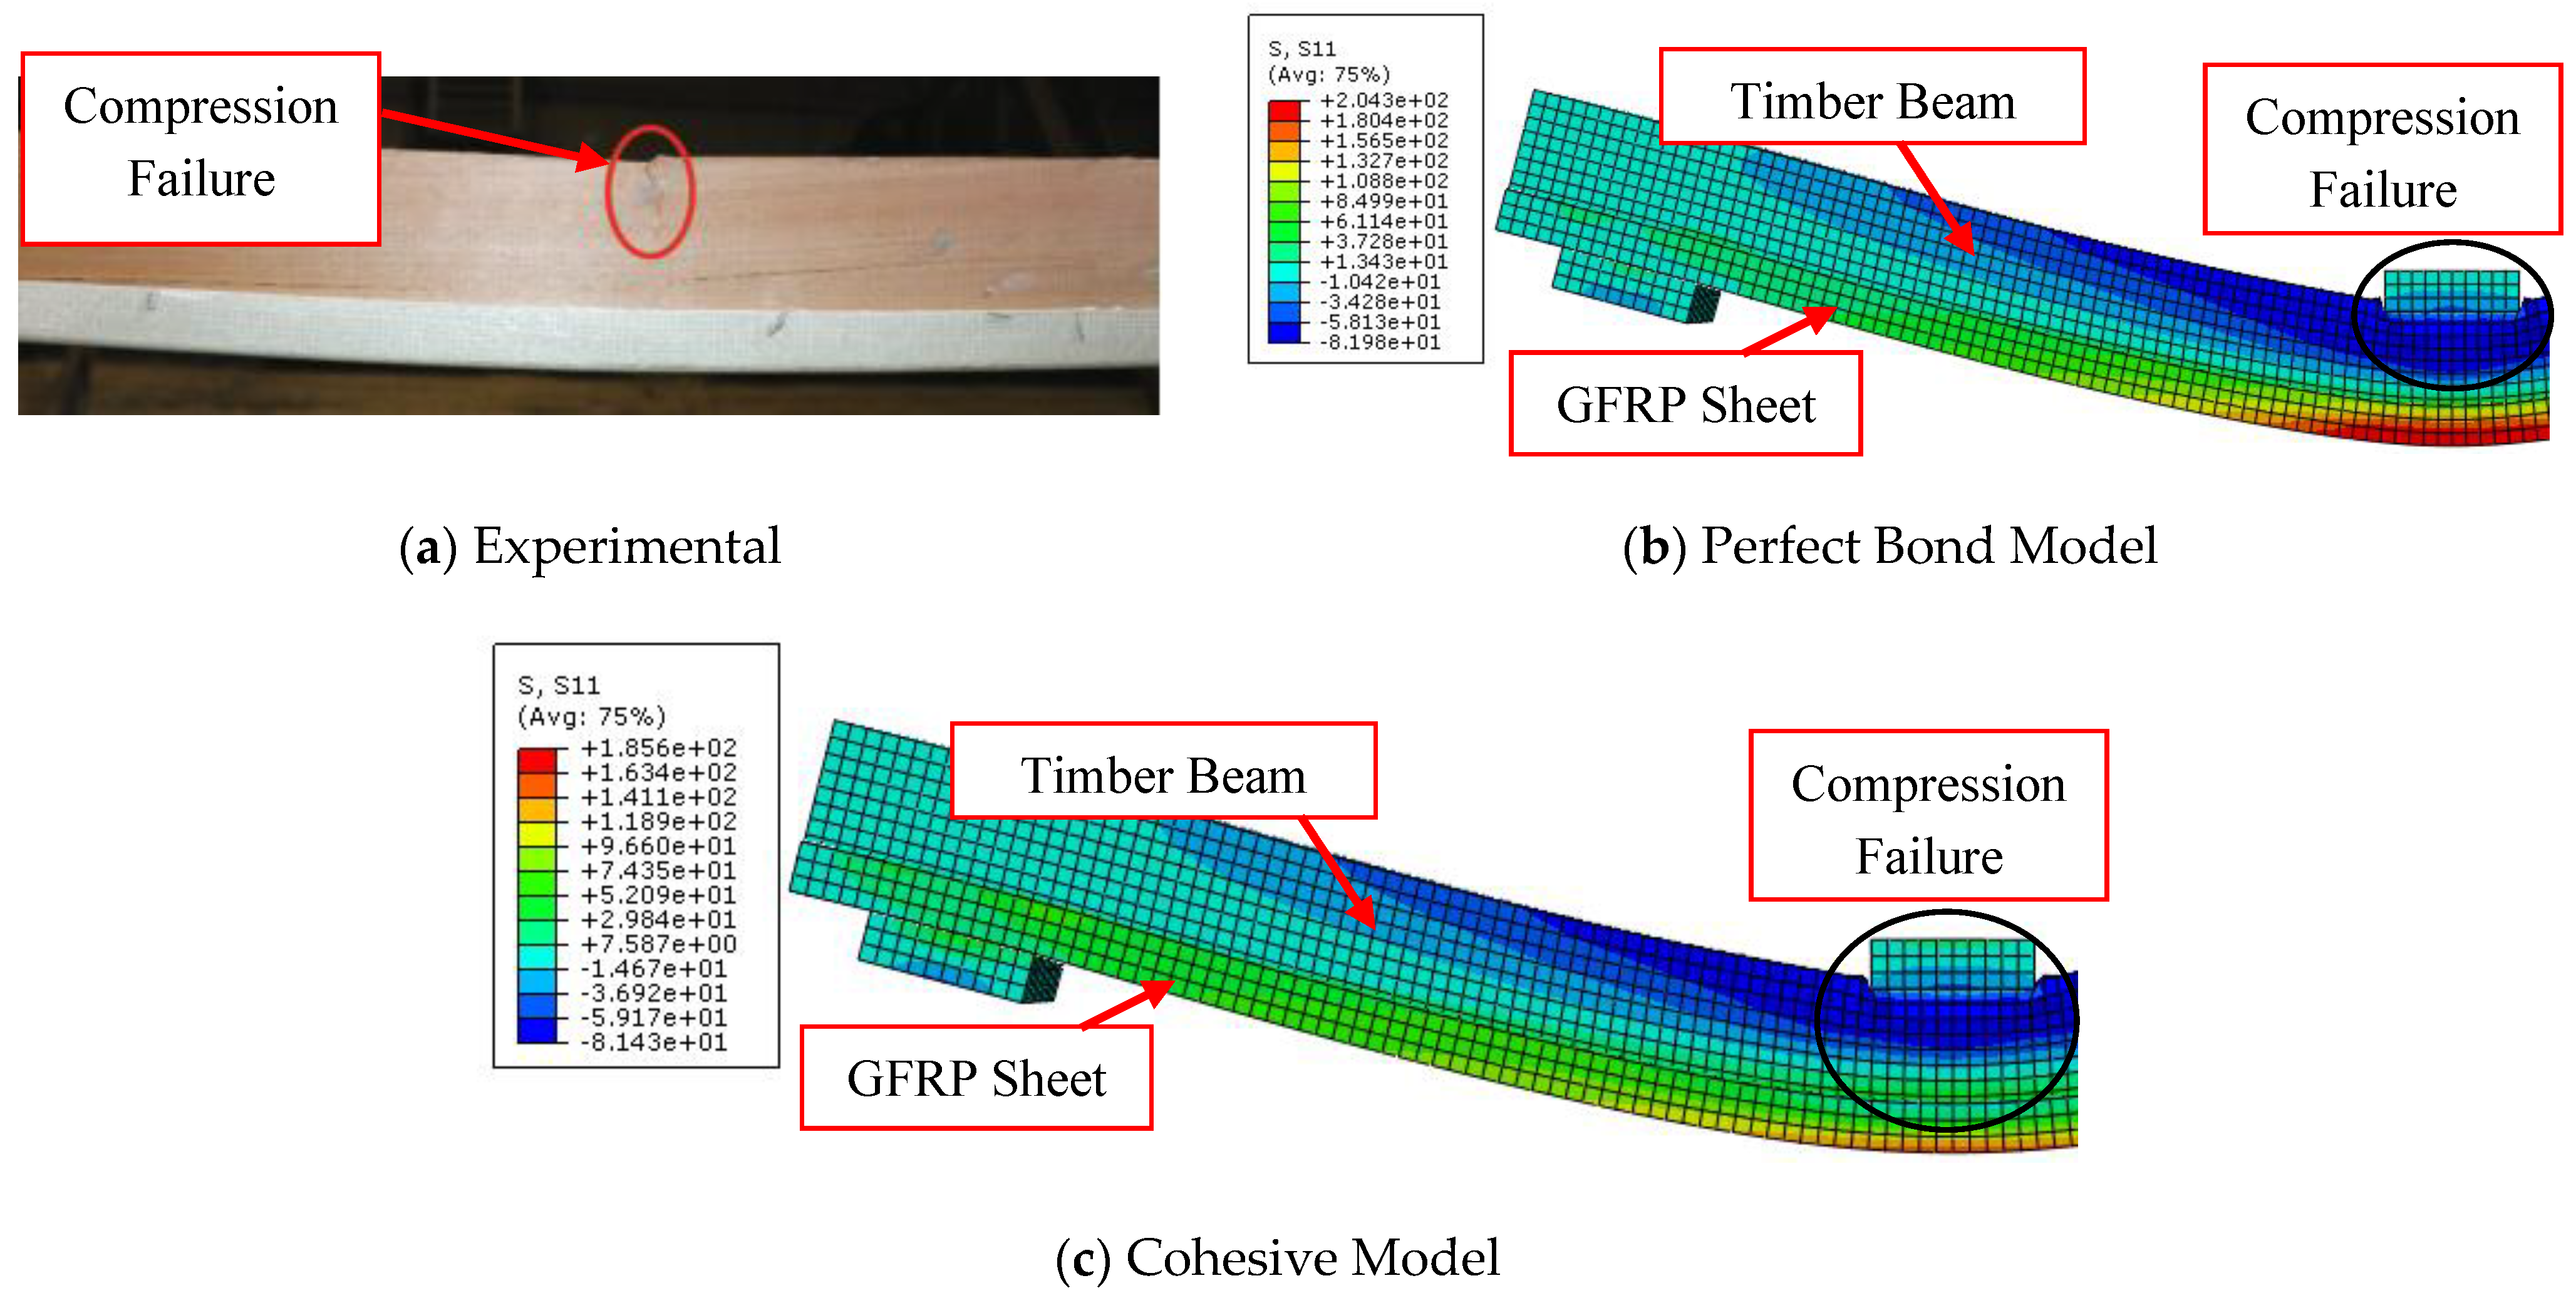
3.1. Description of the Failure Patterns
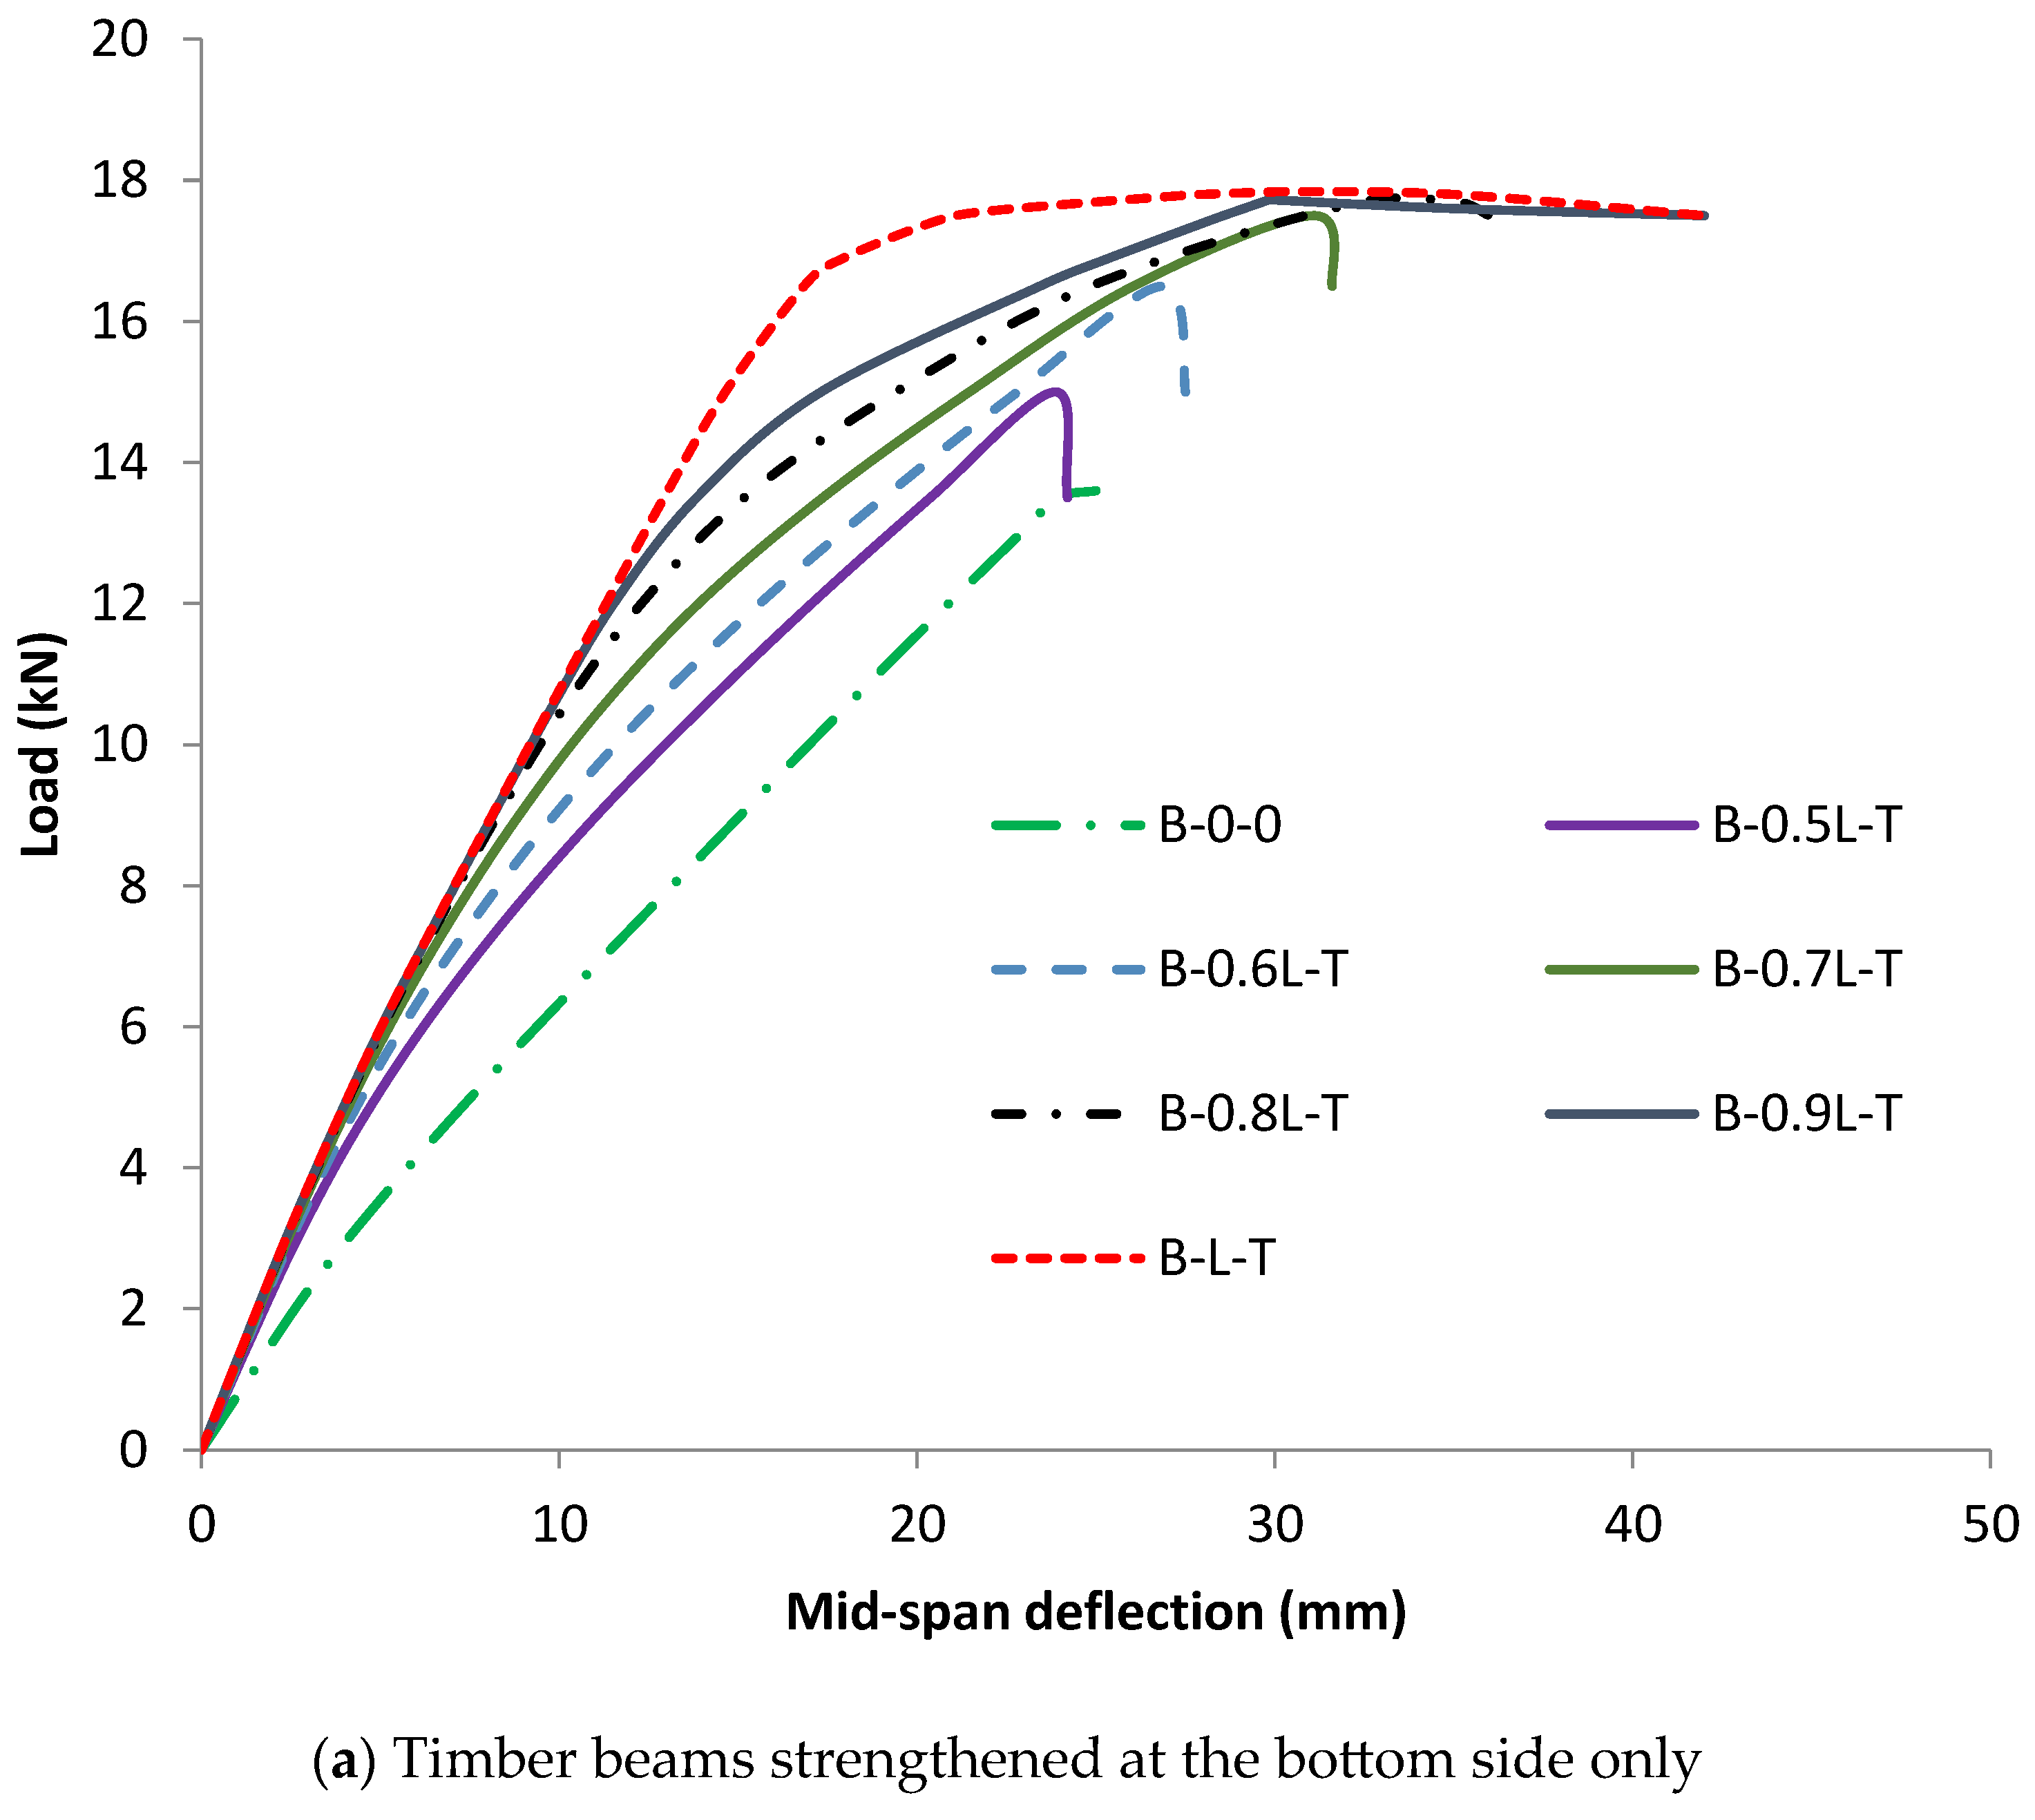
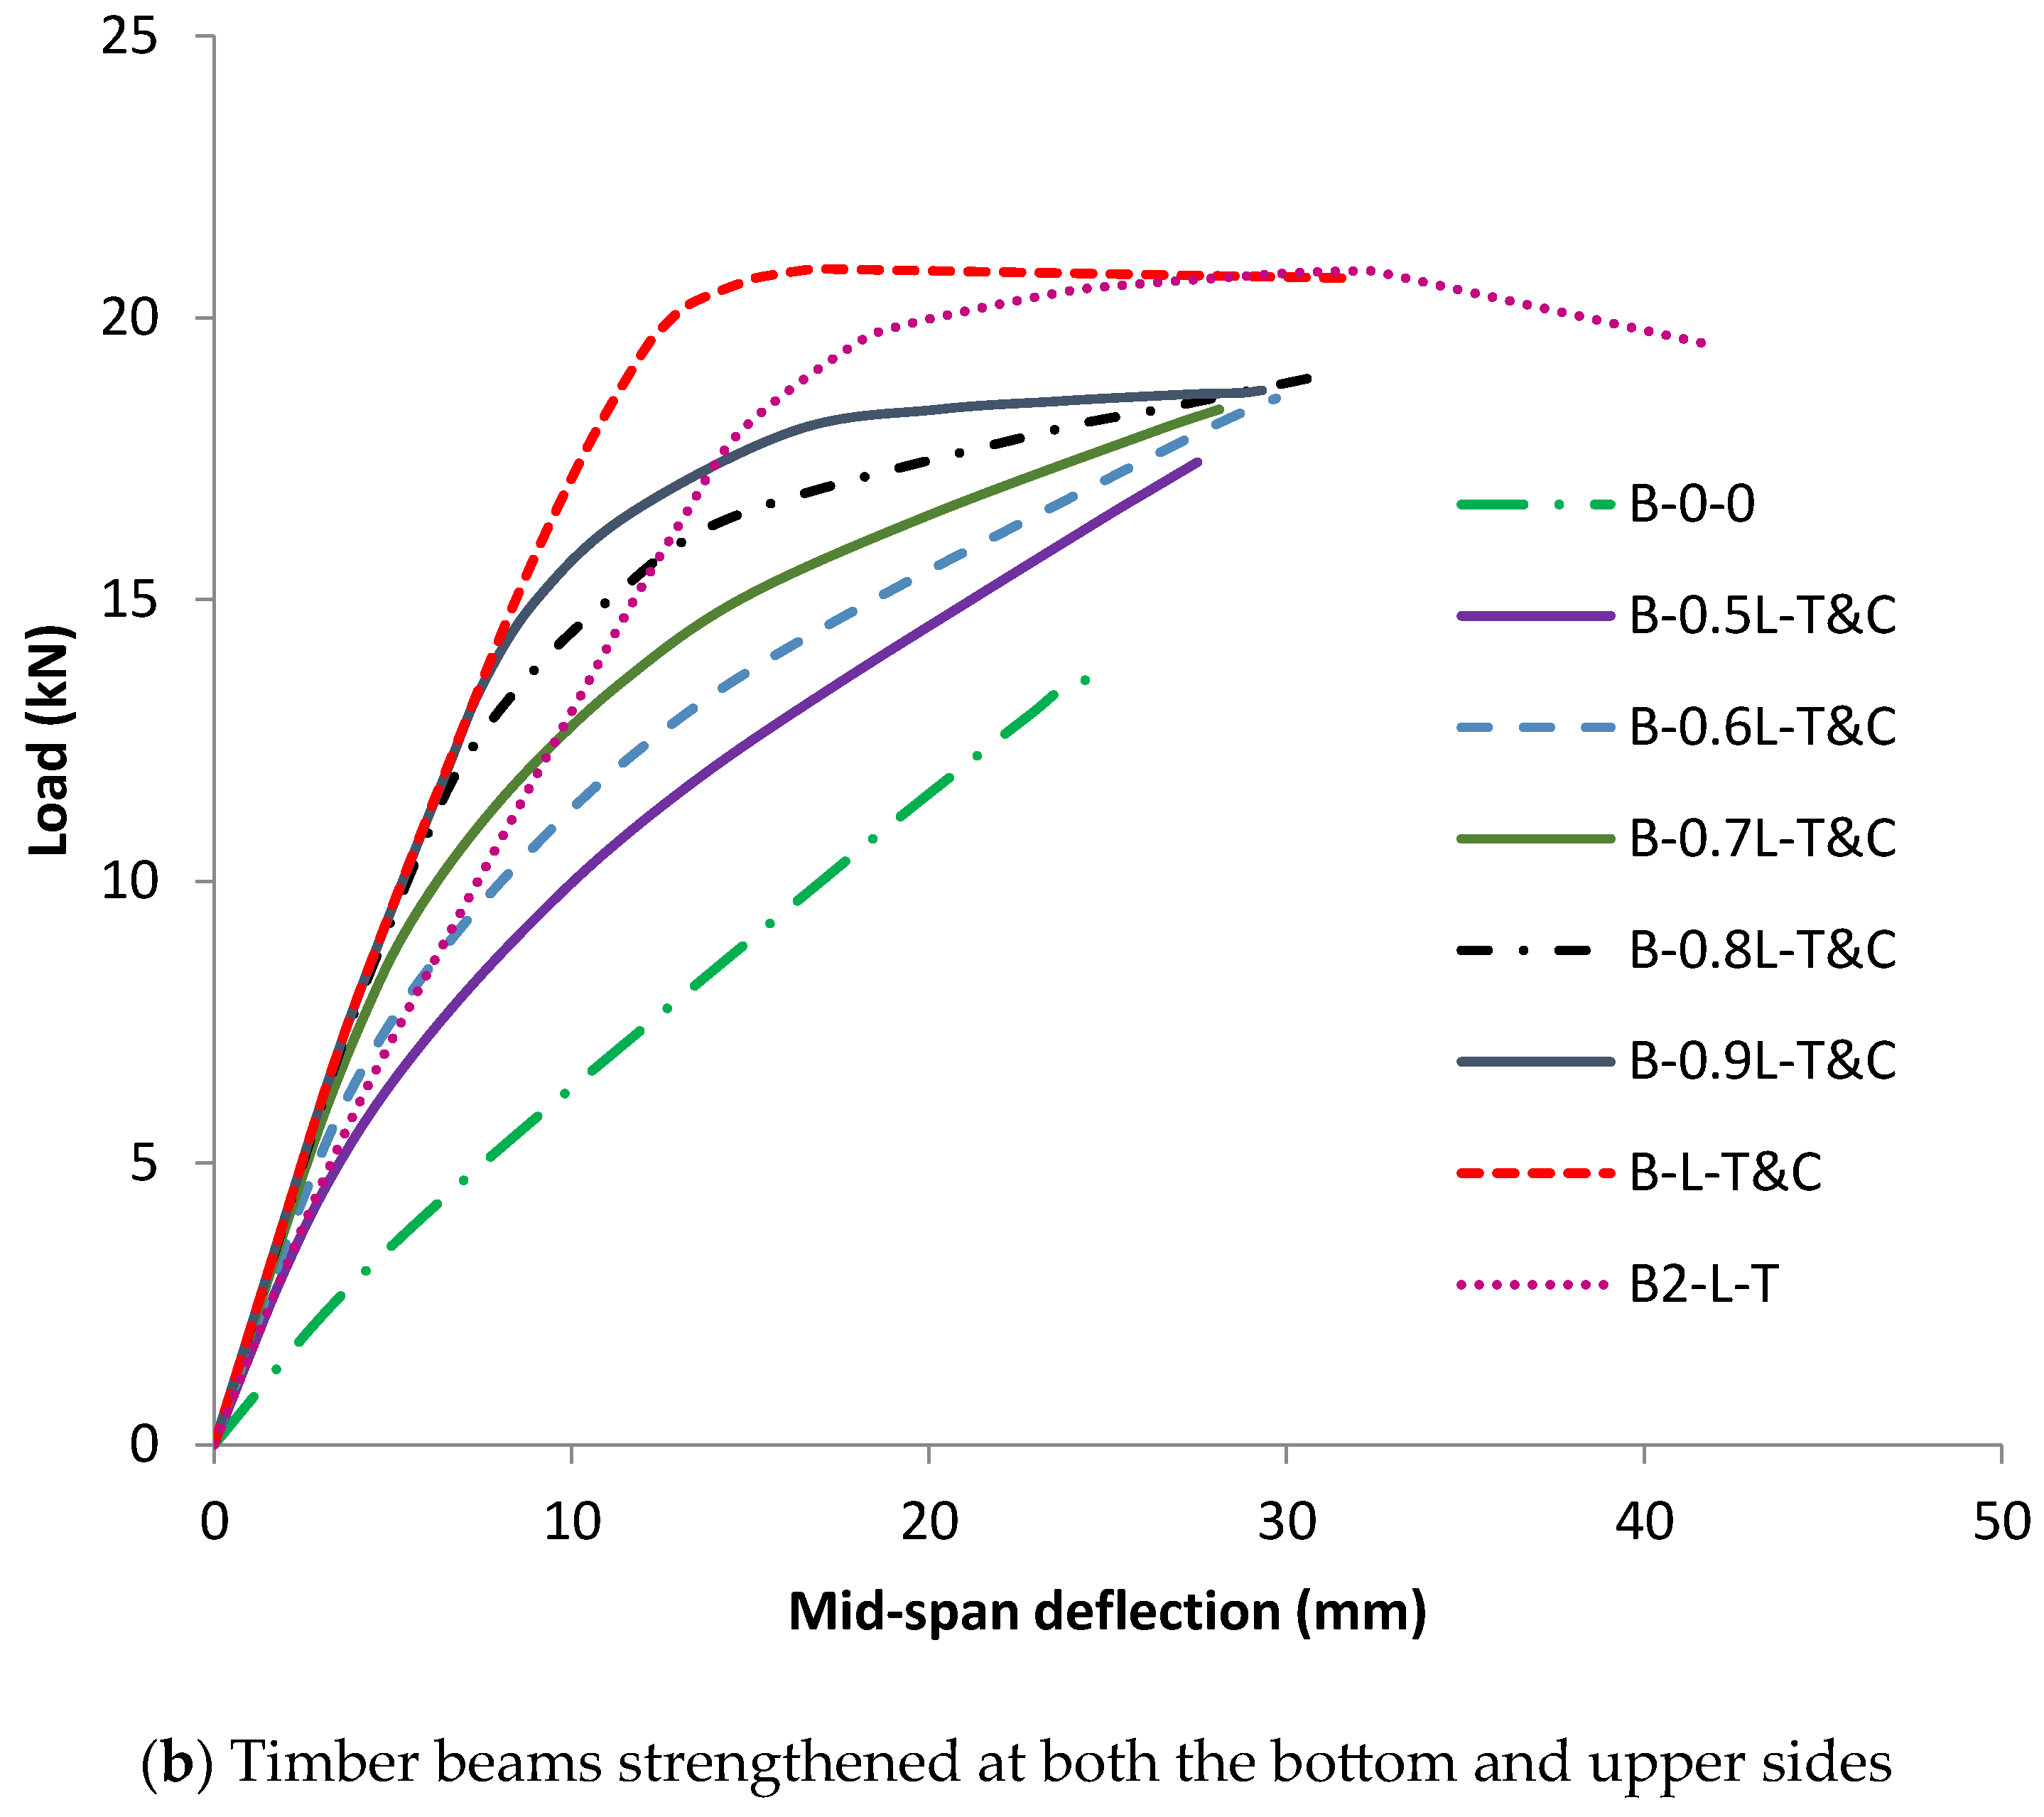
3.2. Load-Deflection Responses
3.3. Flexural Rigidity
3.4. Ductility Index
4. Conclusions
- Elastic-plastic models with the anisotropic Hill yield criterion correctly predict the failure pattern, flexural strength, and load-deflection behavior of bare timber beams, while elastic models overestimate the flexural strength of the beams.
- The perfect bond model exhibits an accurate prediction of the behavior of the strengthened beams when the failure of the beam was governed by the cracking in the timber material.
- All strengthened beams fail as a result of FRP debonding from the timber substrate regardless of the variation in the strengthening configuration and dimensions.
- The FRP length and thickness have a noticeable influence on the flexural strength of the strengthened beams, that is, the flexural strength of the strengthened beams increases as the span length and thickness of the FRP increase.
- The increases in the flexural strength of the beams range from 10.3% to 30.9% when the span length of the CFRP placed in the tensile zone varied from 50% to 100% of the total length of the beams.
- Utilization of a single layer and a double layer of CFRP sheets increases the flexural strength by 30.9% and 52.9%, respectively, compared to the un-strengthened beam.
- The increase in the flexural rigidity of timber beams was strengthened only in the tensile zone with increasing lengths, and their counterparts were strengthened in both the tensile and compressive zones with the same strengthening lengths, in the ranges of 49–66% and 108–165%, respectively, with respect to the control timber beam.
- Strengthening the beam in both the tensile and compressive zones exhibits an increase in the ductility index of 136.6% and 240.7% when the CFRP length is 50% and 100% of the total beam length, respectively.
Author Contributions
Funding
Institutional Review Board Statement
Informed Consent Statement
Data Availability Statement
Conflicts of Interest
References
- Bakis, C.E.; Bank, L.C.; Brown, V.L.; Cosenza, E.; Davalos, J.F.; Lesko, J.J.; Machida, A.; Rizkalla, S.H.; Triantafillou, T.C. Fiber-reinforced polymer composites for construction—State-of-the-art review. J. Compos. Constr. 2002, 6, 73–87. [Google Scholar] [CrossRef]
- Wilt, J.; Liang, R.; GangaRao, H.; Mostoller, J. Structural responses of FRP sheet piles under cantilever loading. Sustain. Struct. 2023, 3. [Google Scholar] [CrossRef]
- Tam, L.H.; Minkeng, M.A.N.; Lau, D.; Mansour, W.; Wu, C. Molecular interfacial shearing creep behavior of carbon fiber/epoxy matrix interface under moisture condition. Eng. Fract. Mech. 2023, 282, 109177. [Google Scholar] [CrossRef]
- ELWakkad, N.Y.; Heiza, K.M.; Mansour, W. Experimental study and finite element modelling of the torsional behavior of self-compacting reinforced concrete (SCRC) beams strengthened by GFRP. Case Stud. Constr. Mater. 2023, 18, e02123. [Google Scholar] [CrossRef]
- Sakr, M.A.; Sakla, S.S. Long-term deflection of cracked composite beams with nonlinear partial shear interaction—A study using neural networks. Eng. Struct. 2009, 31, 2988–2997. [Google Scholar] [CrossRef]
- Wu, C.; Zhao, X.; Duan, W.H.; Al-Mahaidi, R. Bond characteristics between ultra high modulus CFRP laminates and steel. Thin-Walled Struct. 2012, 51, 147–157. [Google Scholar] [CrossRef]
- Obaidat, Y.T.; Heyden, S.; Dahlblom, O. The effect of CFRP and CFRP/concrete interface models when modelling retrofitted RC beams with FEM. Compos. Struct. 2010, 92, 1391–1398. [Google Scholar] [CrossRef]
- Lifshitz Sherzer, G.; Gal, E.; Schlangen, E.; Ye, G. Multi-scale modelling of the mechanics of concrete based on the cement paste properties. In Computational Modelling of Concrete Structures; Taylor & Francis Group: London, UK, 2018; pp. 137–140. [Google Scholar] [CrossRef]
- Nadir, Y.; Nagarajan, P.; Ameen, M.; Arif, M.M. Flexural stiffness and strength enhancement of horizontally glued laminated wood beams with GFRP and CFRP composite sheets. Constr. Build. Mater. 2016, 112, 547–555. [Google Scholar] [CrossRef]
- Saad, K.; Lengyel, A. Strengthening timber structural members with CFRP and GFRP: A state-of-the-art review. Polymers 2022, 14, 2381. [Google Scholar] [CrossRef]
- Jian, B.; Cheng, K.; Li, H.; Ashraf, M.; Zheng, X.; Dauletbek, A.; Zhou, K. A review on strengthening of timber beams using fiber reinforced polymers. J. Renew. Mater. 2022, 10, 2073–2098. [Google Scholar] [CrossRef]
- Saad, K.; Lengyel, A. Experimental, Analytical, and Numerical Assessments for the Controversial Elastic Stiffness Enhancement of CFRP-Strengthened Timber Beams. Polymers 2022, 14, 4222. [Google Scholar] [CrossRef]
- Kim, Y.J.; Harries, K.A. Modeling of timber beams strengthened with various CFRP composites. Eng. Struct. 2010, 32, 3225–3234. [Google Scholar] [CrossRef]
- Harrach, D.; Movahedi Rad, M. Numerical flexural strengthening investigation of timber-CFRP composite beams. IOP Conf. Ser. Mater. Sci. Eng. 2021, 1141, 012010. [Google Scholar] [CrossRef]
- Khelifa, M.; Celzard, A. Numerical analysis of flexural strengthening of timber beams reinforced with CFRP strips. Compos. Struct. 2014, 111, 393–400. [Google Scholar] [CrossRef]
- Maglad, A.M.; Mansour, W.; Tayeh, B.A.; Elmasry, M.; Yosri, A.M.; Fayed, S. Experimental and Analytical Investigation of Fracture Characteristics of Steel Fiber-Reinforced Recycled Aggregate Concrete. Int. J. Concr. Struct. Mater. 2023, 17, 74. [Google Scholar] [CrossRef]
- Maglad, A.M.; Mansour, W.; Fayed, S.; Tayeh, B.A.; Yosri, A.M.; Hamad, M. Experimental Study of the Flexural Behaviour of RC Beams Made of Eco-friendly Sawdust Concrete and Strengthened by a Wooden Plate. Int. J. Concr. Struct. Mater. 2023, 17, 49. [Google Scholar] [CrossRef]
- Nowak, T.P.; Jasieńko, J.; Czepizak, D. Experimental tests and numerical analysis of historic bent timber elements reinforced with CFRP strips. Constr. Build. Mater. 2013, 40, 197–206. [Google Scholar] [CrossRef]
- Hill, R. The Mathematical Theory of Plasticity; Clarendon Press: Oxford, UK, 1950. [Google Scholar]
- Shekarchi, M.; Vatani, A.; Raftery, G.M. Flexural behavior of timber beams strengthened with pultruded glass fi ber reinforced polymer pro files. Compos. Struct. 2020, 241, 112062. [Google Scholar] [CrossRef]
- Hibbitt, K. Sorensen ABAQUS Theory Manual; Version 6.1; Hibbitt, Karlsson and Sorenseb, Inc.: Pawtucket, RI, USA, 2000. [Google Scholar]
- Abrate, S. Criteria for yielding or failure of cellular materials. J. Sandw. Struct. Mater. 2008, 10, 5–51. [Google Scholar] [CrossRef]
- Kawecki, B. Guidelines for FEM modelling of wood-CFRP beams using ABAQUS. Arch. Civ. Eng. 2021, 67, 175–191. [Google Scholar] [CrossRef]
- Abdallah, A.M.; Badawi, M.; Elsamak, G.; Hu, J.W.; Mlybari, E.A.; Ghalla, M. Strengthening of RC beams with inadequate lap splice length using cast-in-situ and anchored precast ECC ferrocement layers mitigating construction failure risk. Case Stud. Constr. Mater. 2024, 20, e02747. [Google Scholar] [CrossRef]
- Saad, A.G.; Sakr, M.A.; Khalifa, T.M.; Darwish, E.A. Numerical analysis of rubberized engineered cementitious composite (RECC) RC beams under impact loads. Constr. Build. Mater. 2023, 409, 134162. [Google Scholar] [CrossRef]
- Zeng, J.; Guo, Y.; Li, L.; Chen, W. Behavior and three-dimensional finite element modeling of circular concrete columns partially wrapped with FRP strips. Polymers 2018, 10, 253. [Google Scholar] [CrossRef]
- Sakr, M.A.; Sakla, S.S. Long-term deflection of cracked composite beams with nonlinear partial shear interaction: I—Finite element modeling. J. Constr. Steel Res. 2008, 64, 1446–1455. [Google Scholar] [CrossRef]
- De Moura, M.F.S.F.; Daniaud, R.; Magalhães, A.G. Simulation of mechanical behaviour of composite bonded joints containing strip defects. Int. J. Adhes. Adhes. 2006, 26, 464–473. [Google Scholar] [CrossRef]
- Turon, A.; Dávila, C.G.; Camanho, P.P. An engineering solution for mesh size effects in the simulation of delamination using cohesive zone models. Eng. Fract. Mech. 2007, 74, 1665–1682. [Google Scholar] [CrossRef]
- Mahoney, D.C.O.; Katnam, K.B.; Dowd, N.P.O.; Mccarthy, C.T.; Young, T.M. Taguchi analysis of bonded composite single-lap joints using a combined interface–adhesive damage model. Int. J. Adhes. Adhes. 2013, 40, 168–178. [Google Scholar] [CrossRef]
- Campilho, R.R.D.S.G.; de Moura, M.M.F.S.F.; Domingues, J.J.M.S. Modelling single and double-lap repairs on composite materials. Compos. Sci. Technol. 2005, 65, 1948–1958. [Google Scholar] [CrossRef]
- Zhou, Y.; Huang, Y.; Sayed, U.; Wang, Z. Research on dynamic characteristics test of wooden floor structure for gymnasium. Sustain. Struct 2021, 1, 000005. [Google Scholar] [CrossRef]
- Guo, Z.G.; Cao, S.; Sun, W.M.; Lin, X. Experimental Study on Bond Stress-Slip Behaviour between FRP Sheets and Concrete. In Proceedings of the International Symposium on Bond Behaviour of FRP in Structures, Hong Kong, China, 7–9 December 2005. [Google Scholar]
- Sakr, M.A. Finite element modeling of debonding mechanisms in carbon fiber reinforced polymer-strengthened reinforced concrete continuous beams. Struct. Concr. 2018, 19, 1002–1012. [Google Scholar] [CrossRef]
- Lu, X.Z.; Teng, J.G.; Ye, L.P.; Jiang, J.J. Bond-slip models for FRP sheets/plates bonded to concrete. Eng. Struct. 2005, 27, 920–937. [Google Scholar] [CrossRef]
- Liang, R.; Hota, G. Development and evaluation of load-bearing fiber reinforced polymer composite panel systems with tongue and groove joints. Sustain. Struct. 2021, 1, 000008. [Google Scholar] [CrossRef]
- JCI Technical Report on Continuos Fibre Reinforced Concrete: JCI TC952 on Continuos Reinforced Concrete; Japan Concrete Institute: Tokyo, Japan, 1998; pp. 116–124.
- JCI Technical Report on Retrofit Technology for Concrete Structures; Technical Committee on Retrofitting Technology for Concrete Structures: Tokyo, Japan, 2003; pp. 79–97.
- Ponzo, F.C.; Antonio, D.C.; Nicla, L.; Nigro, D. Experimental estimation of energy dissipated by multistorey post-tensioned timber framed buildings with anti-seismic dissipative devices. Sustain. Struct. 2021, 1, 000007. [Google Scholar]
- Basha, A.; Tayeh, B.A.; Maglad, A.M.; Mansour, W. Feasibility of improving shear performance of RC pile caps using various internal reinforcement configurations: Tests and finite element modelling. Eng. Struct. 2023, 289, 116340. [Google Scholar] [CrossRef]
- Mansour, W.; Li, W.; Wang, P.; Badawi, M. Experimental and numerical evaluations of the shear performance of recycled aggregate RC beams strengthened using CFRP sheets. Eng. Struct. 2024, 301, 117368. [Google Scholar] [CrossRef]
- SIA 265; Timber Structures. Swiss Society of Engineers and Architects (SIA): Zurich, Switzerland, 2003.


| 11,439 | 320.4 | 320.4 | 0.013 | 0.013 | 0.23 | 600.75 | 600.75 | 600.75 |
| 40 | 10 | 10 | 15.5 | 15.5 | 7.6 | 1.0 | 0.25 | 0.67 | 0.33 |
| Reference | Beam ID | Width × Depth × Length mm | Shear Span mm | Shear Span/Depth Ratio |
|---|---|---|---|---|
| Nowak et al. [18] | A | 120 × 220 × 4000 | 1270 | 5.7 |
| Shekarchi et al. [20] | A-NA-NA | 85 × 100 × 1400 | 600 | 6.0 |
| Nadir et al. [9] | B0 | 40 × 60 × 900 | 276 | 4.6 |
| Beam ID | Ultimate Load (kN) | Maximum Mid-Span Deflection (mm) | ||||||||
|---|---|---|---|---|---|---|---|---|---|---|
| Exp | Num (M1) | Num (M2) | M1/Exp | M2/Exp | Exp | Num (M1) | Num (M2) | M1/Exp | M2/Exp | |
| A | 29.9 | 38 | 31.5 | 1.27 | 1.05 | 46.6 | 48.1 | 48.1 | 1.03 | 1.03 |
| A-NA-NA | 56 | 92.2 | 55.4 | 1.65 | 0.99 | 32.5 | 33.5 | 33.5 | 1.03 | 1.03 |
| B0 | 13 | 20 | 13.6 | 1.54 | 1.04 | 24.1 | 25 | 25 | 1.04 | 1.04 |
| Average | 1.49 | 1.03 | 1.03 | 1.03 | ||||||
| Standard deviation | 0.20 | 0.03 | 0.006 | 0.006 | ||||||
| Coefficient of variation (COV)% | 13.2 | 3.1 | 0.6 | 0.6 | ||||||
| Reference | Beam ID | Strengthening Pattern/ Material Type | FRP Thickness (mm) | Strengthening Position | Tensile Strength of FRP | N/mm3 | N/mm3 | J/m2 | J/m2 | |
|---|---|---|---|---|---|---|---|---|---|---|
| Shekarchi et al. [20] | B-NA-1 | Flat/GFRP | 2.5 | Bottom side | 450 | 1300 | 500 | 1.5 | 900 | 400 |
| D-NA-U | U-shaped/GFRP | 2.5 | Bottom side | 450 | 1300 | 500 | 1.5 | 900 | 400 | |
| F-U-U | U-shaped/GFRP | 2.5 | Bottom and upper sides | 450 | 1300 | 500 | 1.5 | 900 | 400 | |
| Nadir et al. [9] | B1 | Flat/CFRP | 1.0 | Bottom side | 1835 | 2600 | 1000 | 2.4 | 1300 | 500 |
| B2 | Flat/CFRP | 2.0 | Bottom side | 1835 | 2600 | 1000 | 2.4 | 1300 | 500 |
| Beam ID | Ultimate Load (kN) | Maximum Mid-Span Deflection (mm) | ||||||||
|---|---|---|---|---|---|---|---|---|---|---|
| Exp | Num (M3) | Num (M4) | M3/Exp | M4/Exp | Exp | Num (M3) | Num (M4) | M3/Exp | M4/Exp | |
| B-NA-1 | 64.3 | 67.5 | 64.5 | 1.05 | 1.00 | 36.6 | 39.2 | 39.2 | 1.07 | 1.07 |
| D-NA-U | 73 | 76.3 | 71 | 1.04 | 0.97 | 42.1 | 44 | 44 | 1.04 | 1.04 |
| F-U-U | 92 | 102 | 92 | 1.11 | 1.00 | 37 | 36.4 | 36.4 | 0.98 | 0.98 |
| B1 | 18 | 33 | 17.8 | 1.80 | 0.99 | 41.3 | 42 | 42 | 1.02 | 1.02 |
| B2 | 20 | 38.3 | 20.8 | 1.90 | 1.04 | 41.4 | 42 | 42 | 1.01 | 1.01 |
| Average | 1.38 | 1.00 | 1.02 | 1.02 | ||||||
| Standard deviation | 0.43 | 0.025 | 0.034 | 0.034 | ||||||
| Coefficient of variation (COV)% | 31.3 | 2.54 | 3.28 | 3.28 | ||||||
| Beam ID | Strengthening Pattern/ Material Type | FRP Thickness (mm) | Strengthening Position | CFRP Sheet Length in Bottom and Upper Sides (mm) | CFRP Sheet Length/Timber Beam Length |
|---|---|---|---|---|---|
| B-0-0 | - | - | - | - | - |
| B-0.5L-T | Flat/CFRP | 1.0 | Bottom side | 450 | 0.5 |
| B-0.5L-T&C | Flat/CFRP | 1.0 | Bottom and upper sides | 450 | 0.5 |
| B-0.6L-T | Flat/CFRP | 1.0 | Bottom side | 540 | 0.6 |
| B-0.6L-T&C | Flat/CFRP | 1.0 | Bottom and upper sides | 540 | 0.6 |
| B-0.7L-T | Flat/CFRP | 1.0 | Bottom side | 630 | 0.7 |
| B-0.7L-T&C | Flat/CFRP | 1.0 | Bottom and upper sides | 630 | 0.7 |
| B-0.8L-T | Flat/CFRP | 1.0 | Bottom side | 720 | 0.8 |
| B-0.8L-T&C | Flat/CFRP | 1.0 | Bottom and upper sides | 720 | 0.8 |
| B-0.9L-T | Flat/CFRP | 1.0 | Bottom side | 810 | 0.9 |
| B-0.9L-T&C | Flat/CFRP | 1.0 | Bottom and upper sides | 810 | 0.9 |
| B-L-T | Flat/CFRP | 1.0 | Bottom side | 900 | 1.0 |
| B-L-T&C | Flat/CFRP | 1.0 | Bottom and upper sides | 900 | 1.0 |
| B2-L-T | Flat/CFRP | 2.0 | Bottom side | 900 | 1.0 |
| Beam ID | Ultimate Load (kN) | Increasing Ratio % | Maximum Mid-Span Deflection (mm) | Flexural Rigidity (N · mm2) | Ductility Index | Increasing Ratio % | Failure Pattern | ||
|---|---|---|---|---|---|---|---|---|---|
| Elastic Stage | Ultimate Stage | Ultimate /Elastic | |||||||
| B-0-0 | 13.6 | - | 25.0 | 7.81 × 10⁹ | 5.52 × 10⁹ | 0.71 | 1.45 | - | Flexural failure |
| B-0.5L-T | 15 | 10.3 | 24.2 | 11.60 × 10⁹ | 6.38 × 10⁹ | 0.55 | 2.10 | 44.8 | Debonding |
| B-0.5L-T&C | 17.4 | 27.9 | 27.5 | 16.28 × 10⁹ | 6.43 × 10⁹ | 0.40 | 3.43 | 136.6 | Debonding |
| B-0.6L-T | 16.5 | 21.3 | 27.5 | 12.25 × 10⁹ | 6.23 × 10⁹ | 0.51 | 2.13 | 46.9 | Debonding |
| B-0.6L-T&C | 18.5 | 36.0 | 29.7 | 18.30 × 10⁹ | 6.38 × 10⁹ | 0.35 | 4.37 | 201.4 | Debonding |
| B-0.7L-T | 17.5 | 28.7 | 31.6 | 12.67 × 10⁹ | 6.10 × 10⁹ | 0.48 | 2.85 | 96.6 | Debonding |
| B-0.7L-T&C | 18.7 | 37.5 | 28.1 | 19.74 × 10⁹ | 6.63 × 10⁹ | 0.34 | 4.69 | 223.4 | Debonding |
| B-0.8L-T | 17.7 | 30.1 | 36.0 | 12.91 × 10⁹ | 6.08 × 10⁹ | 0.47 | 2.97 | 104.8 | Debonding |
| B-0.8L-T&C | 19.1 | 40.4 | 30.7 | 20.46 × 10⁹ | 6.26 × 10⁹ | 0.31 | 4.72 | 225.5 | Debonding |
| B-0.9L-T | 17.7 | 30.1 | 42.0 | 12.99 × 10⁹ | 6.02 × 10⁹ | 0.46 | 3.27 | 125.5 | Debonding |
| B-0.9L-T&C | 19.3 | 41.9 | 29.3 | 20.67 × 10⁹ | 6.48 × 10⁹ | 0.31 | 4.91 | 238.6 | Debonding |
| B-L-T | 17.8 | 30.9 | 42.0 | 13.00 × 10⁹ | 5.98 × 10⁹ | 0.46 | 3.29 | 126.9 | Debonding |
| B-L-T&C | 20.9 | 53.7 | 32.0 | 20.7 × 10⁹ | 6.62 × 10⁹ | 0.32 | 4.94 | 240.7 | Debonding |
| B2-L-T | 20.8 | 52.9 | 42.0 | 16.10 × 10⁹ | 6.52 × 10⁹ | 0.41 | 4.65 | 220.7 | Debonding |
Disclaimer/Publisher’s Note: The statements, opinions and data contained in all publications are solely those of the individual author(s) and contributor(s) and not of MDPI and/or the editor(s). MDPI and/or the editor(s) disclaim responsibility for any injury to people or property resulting from any ideas, methods, instructions or products referred to in the content. |
© 2024 by the authors. Licensee MDPI, Basel, Switzerland. This article is an open access article distributed under the terms and conditions of the Creative Commons Attribution (CC BY) license (https://creativecommons.org/licenses/by/4.0/).
Share and Cite
Mansour, W.; Li, W.; Wang, P.; Fame, C.M.; Tam, L.-h.; Lu, Y.; Sobuz, M.H.R.; Elwakkad, N.Y. Improving the Flexural Response of Timber Beams Using Externally Bonded Carbon Fiber-Reinforced Polymer (CFRP) Sheets. Materials 2024, 17, 321. https://doi.org/10.3390/ma17020321
Mansour W, Li W, Wang P, Fame CM, Tam L-h, Lu Y, Sobuz MHR, Elwakkad NY. Improving the Flexural Response of Timber Beams Using Externally Bonded Carbon Fiber-Reinforced Polymer (CFRP) Sheets. Materials. 2024; 17(2):321. https://doi.org/10.3390/ma17020321
Chicago/Turabian StyleMansour, Walid, Weiwen Li, Peng Wang, Cheikh Makhfouss Fame, Lik-ho Tam, Yao Lu, Md. Habibur Rahman Sobuz, and Noha Yehia Elwakkad. 2024. "Improving the Flexural Response of Timber Beams Using Externally Bonded Carbon Fiber-Reinforced Polymer (CFRP) Sheets" Materials 17, no. 2: 321. https://doi.org/10.3390/ma17020321
APA StyleMansour, W., Li, W., Wang, P., Fame, C. M., Tam, L.-h., Lu, Y., Sobuz, M. H. R., & Elwakkad, N. Y. (2024). Improving the Flexural Response of Timber Beams Using Externally Bonded Carbon Fiber-Reinforced Polymer (CFRP) Sheets. Materials, 17(2), 321. https://doi.org/10.3390/ma17020321