Article

Research on Alkali-Activated Slag Stabilization of Dredged Silt Based on a Response Surface Method

1
School of Civil Architecture and Environment, Hubei University of Technology, Wuhan 430068, China
2
Hubei Bridge Safety Monitoring Technology and Equipment Technology Engineering Research Center, Wuhan 430068, China
*
Author to whom correspondence should be addressed.
Materials 2024, 17(17), 4410; https://doi.org/10.3390/ma17174410
Submission received: 20 August 2024 / Revised: 3 September 2024 / Accepted: 5 September 2024 / Published: 6 September 2024

Abstract

To improve the resource utilization of dredged silt and industrial waste, this study explores the efficacy of using ground granulated blast furnace slag (GGBS), active calcium oxide (CaO), and sodium silicate (Na2O·nSiO2) as alkali activators for silt stabilization. Through a combination of addition tests, response surface method experiments, and microscopic analyses, we identified key factors influencing the unconfined compressive strength (UCS) of stabilized silt, optimized material ratios, and elucidated stabilization mechanisms. The results revealed the following: (1) CaO exhibited the most pronounced stabilization effect, succeeded by Na2O·nSiO2, whereas GGBS alone displayed marginal efficacy. CaO-stabilized silt demonstrated rapid strength augmentation within the initial 7 d, while Na2O·nSiO2-stabilized silt demonstrated a more gradual strength enhancement over time, attributable to the delayed hydration of GGBS in non-alkaline conditions, with strength increments noticeably during later curing phases. (2) Response surface analysis demonstrated substantial interactions among GGBS-CaO and GGBS-Na2O·nSiO2, with the optimal dosages identified as 11.5% for GGBS, 4.1% for CaO, and 5.9% for Na2O·nSiO2. (3) X-ray diffraction (XRD) and scanning electron microscopy (SEM) analyses clarified that the hydration reactions within the GGBS-Na2O·nSiO2 composite cementitious system synergistically enhanced one another, with hydration products wrapping, filling, and binding the silt particles, thereby rendering the microstructure denser and more stable. Based on these experimental outcomes, we propose a microstructural mechanism model for the stabilization of dredged silt employing GGBS-CaO-Na2O·nSiO2.

1. Introduction

With the expansion of large-scale urban construction projects along China’s coastline, there has emerged an urgent need to manage the vast quantities of dredged silt generated [1,2]. Characterized by high water content, extensive porosity, significant compressibility, and low bearing capacity, and laden with considerable amounts of organic matter and pollutants [3,4,5], the accumulation of dredged silt not only depletes urban land resources but also poses substantial environmental risks. Presently, prevalent methods for sludge treatment encompass natural processing, thermal treatment, electro-osmotic consolidation, and chemical stabilization. Among these, chemical stabilization, distinguished by its convenience, versatility in material selection, and cost-effectiveness [6,7], has emerged as the predominant technology for the recycling of dredged silt. This technique entails the addition of stabilizers that initiate a cascade of physicochemical reactions within the silt, thereby reducing its water content and significantly boosting its strength to fulfill the specifications required for use as a roadbed filler [8].
In the stabilization of dredged silt, ordinary Portland cement is frequently employed as a solidifying agent for soft soils [8,9]. However, cement production entails considerable carbon emissions and substantial energy consumption, with each ton of cement necessitating approximately 5000 MJ of energy and releasing 0.95 t of CO2, contributing from 5% to 8% of global greenhouse gas emissions [10,11]. Despite its mechanical robustness, cement-stabilized soil frequently exhibits poor durability, water instability, considerable shrinkage, and a propensity for cracking [12,13]. To bolster the high-quality economic advancement of coastal cities, an urgent exploration of sustainable and efficacious green alternatives to cement and lime for civil engineering applications is necessary [14,15]. Numerous scholars have investigated the formulation ratios of composite stabilizers, endeavoring to enhance the stabilization effects on silty soil by incorporating additional components into the cement mix. Blast furnace slag, a silicate byproduct of industrial iron smelting, possesses mineral components akin to those of cement clinker and displays potential hydraulic activity, activatable through alkali activation [16]. Investigations by Liu et al. [17] employing scanning electron microscopy to analyze the micro-morphology of granulated blast furnace slag in varied hydration environments revealed enhanced reactivity during room temperature alkali activation, culminating in more complete hydration of the slag particles. Yi et al. [18] discovered that the strength of activated blast furnace slag-stabilized soil could achieve 2.4 to 3.2 times that of cement-stabilized soil after 90 d. Liang and colleagues [19] employed blast furnace slag powder and cement as a composite stabilizer for zinc-contaminated silty soil, determining that a mixture of 15% cement and 10% slag provided optimal zinc fixation, alongside the greatest strength and stability of the stabilized soil. He Jun et al. [20] used alkali slag and blast furnace slag for silt stabilization, attaining an unconfined compressive strength of 1228.3 kPa after seven days with 30% alkali slag and 8% slag. In evaluating and selecting additives, orthogonal experimental methods are frequently employed, which economize on time and mitigate the experimental workload to some extent but do not outline clear functional relationships between additive dosages and response values across the entire region, thereby precluding the determination of optimal ratios for achieving maximum response values. In contrast, response surface methodology amalgamates mathematical and statistical insights, facilitating the design of experiments, the establishment of fitting models, and the assessment of interactions between variables [21]. Moreover, the precision of the Box–Behnken design in response surface methodology has gained widespread recognition in domains such as concrete production, cost analysis, and pharmaceutical testing [22].
By employing response surface methodology, this study synergistically integrated mathematical and statistical approaches to investigate the stabilization of dredged silt using alkaline-activated slag. GGBS-CaO-Na2O·nSiO2 was developed as a composite solidifier, supplanting traditional cement, grounded on outcomes from single-addition experiments. Optimal ratios of GGBS, CaO, and Na2O·nSiO2 were ascertained, and their effects on the unconfined compressive strength of the stabilized silt were evaluated. The mechanical properties and microstructural strength mechanisms were further explained through X-ray diffraction (XRD) and scanning electron microscopy (SEM). The employment of industrial waste in treating dredged silty soil not only conserves resources like cement and lime but also advances the resourceful utilization of industrial waste and dredged silt. This methodology embodies the principle of “treating waste with waste”, underpinning sustainable environmental practices.

2. Materials and Methods
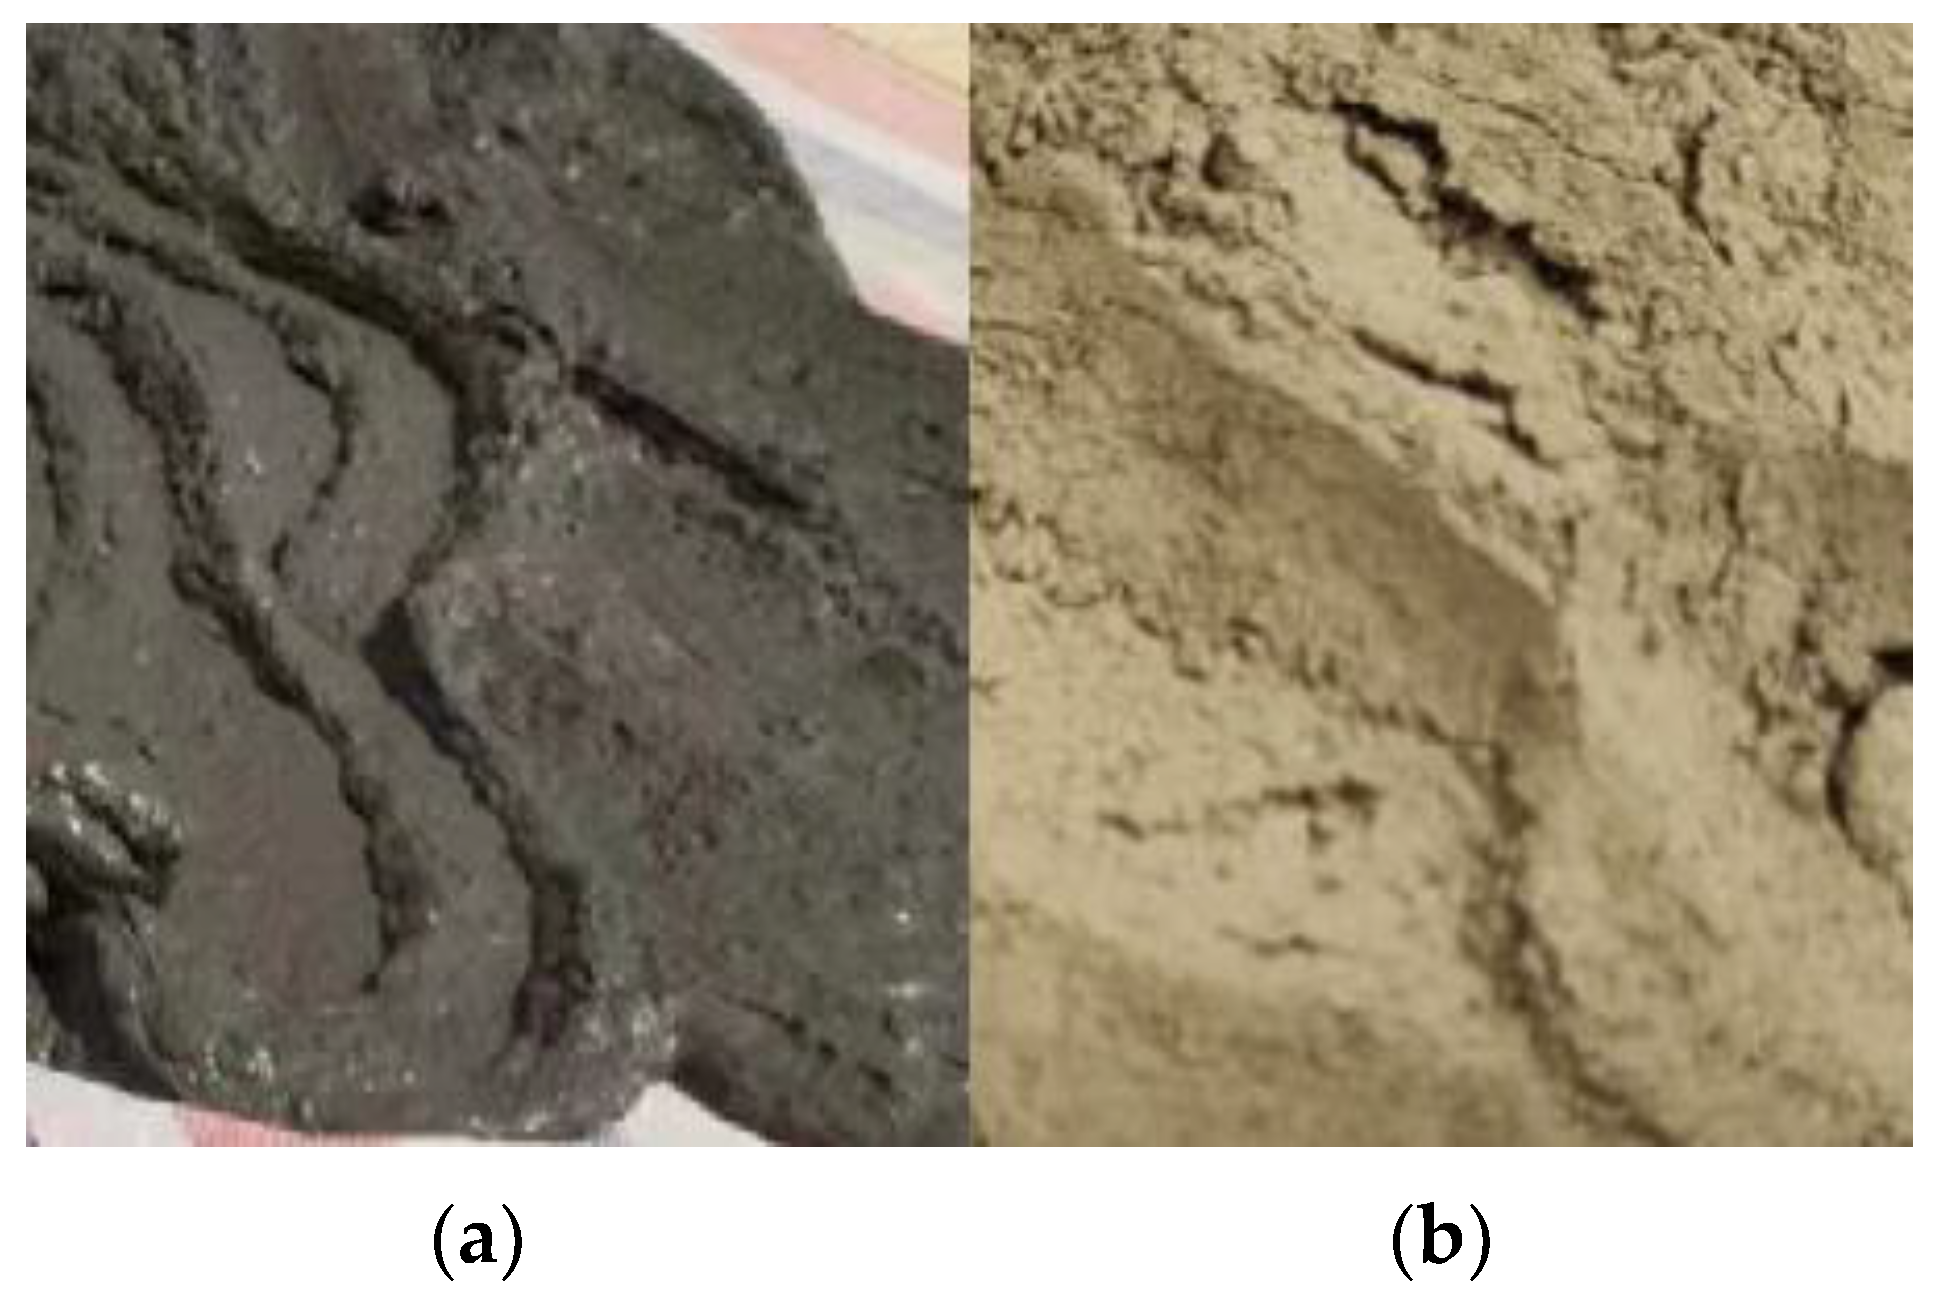
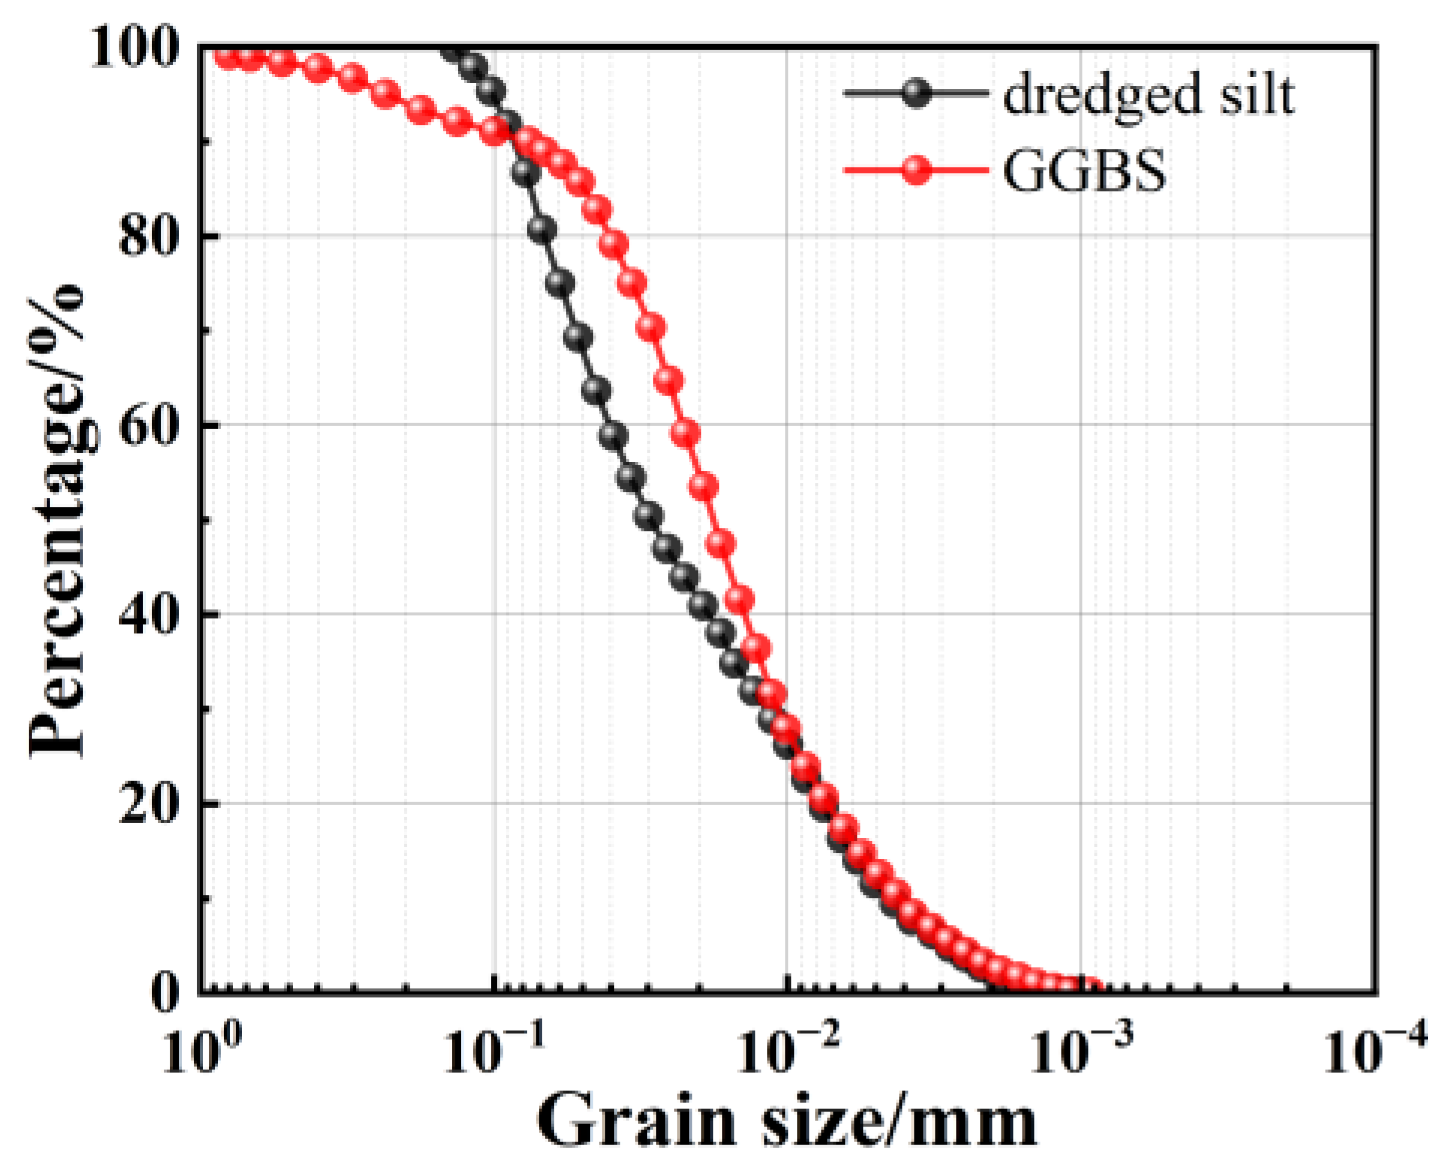
2.1. Test Materials

The dredged silt samples used in this experiment were sourced from the Xunsi River in Wuhan, China. This dredged silt exhibits a gray-black hue and is in a fluid-plastic state, as illustrated in Figure 1. Prior to initiating the experiment, the fundamental physical properties and principal chemical components of the soil samples were quantified, as detailed in Table 1 and Table 2. In Table 1, the liquid limit, defined as the moisture content at which soil transitions from a plastic to a liquid state, and the plastic limit, identified as the moisture content initiating plastic behavior in soil, are quantified. The plasticity index is derived by the subtraction of the plastic limit from the liquid limit. Meanwhile, the liquidity index, which quantifies the soil’s consistency relative to its liquid and plastic limits, is calculated by taking the soil’s natural moisture content, deducting the plastic limit, and dividing it by the plasticity index.
The S95 slag powder employed in the experiment was procured from the Jiyuan Steel Plant (Jiyuan, China). The particle size distribution curves for GGBS and dredged silt are depicted in Figure 2, while the primary chemical components are listed in Table 2. Silicate (Huasheng Chemical Reagent Co., Ltd., Tianjin, China) and calcium oxides (Sinopharm, Beijing, China) served as alkaline activators in the experiment, with all reagents being of analytical grade. Tap water was used for the experimental procedures.

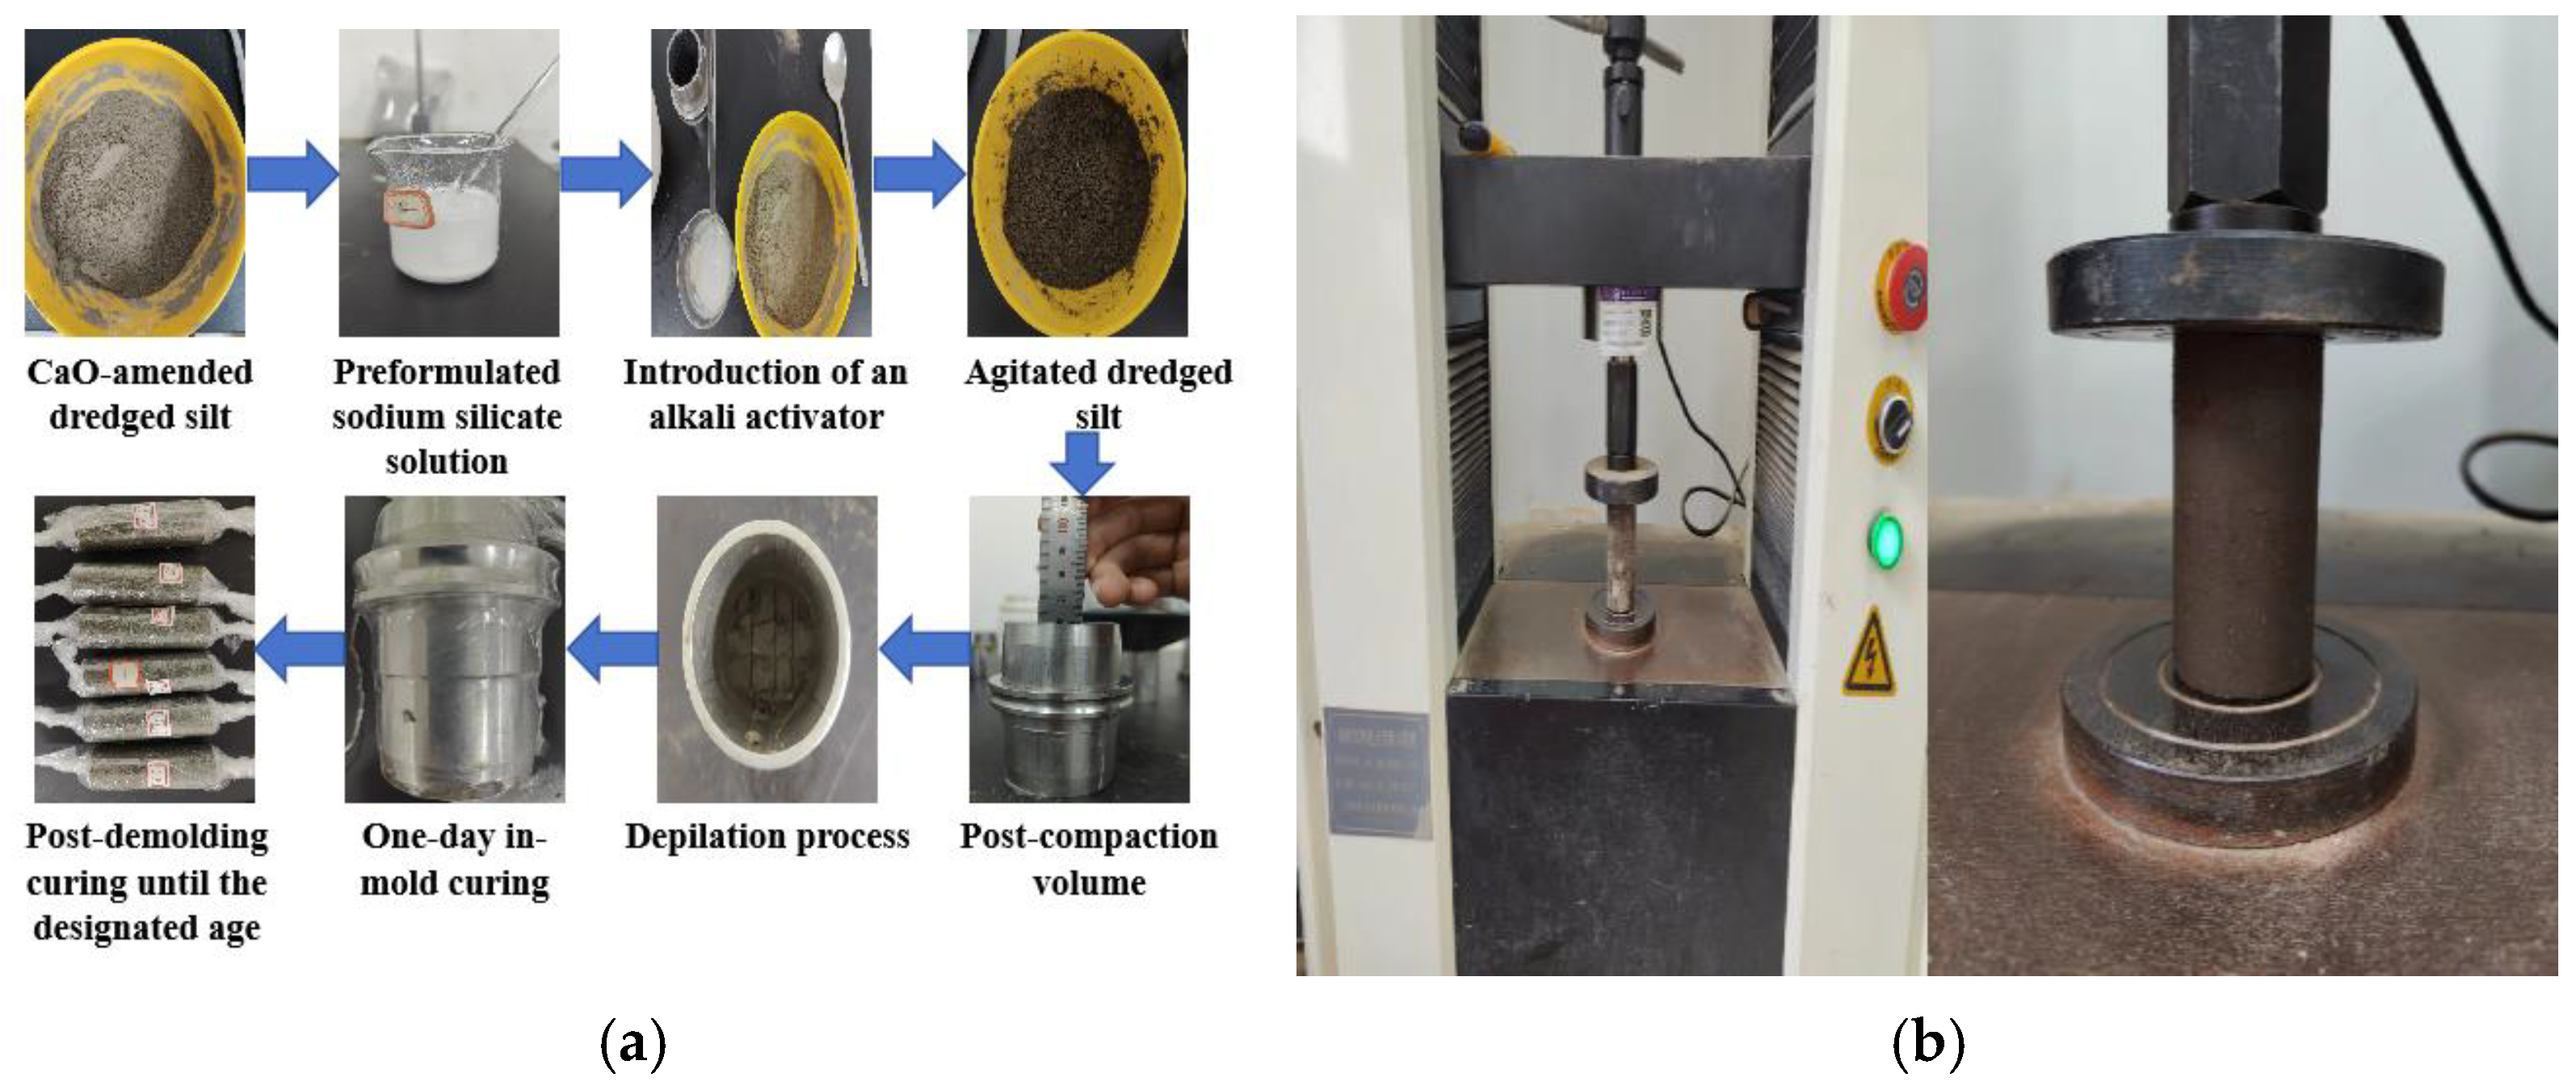
2.2. Sample Preparation

In accordance with the standard for geotechnical testing methods (GB/T 50123-2019) [23], the ratio of the sample’s height (h) to its diameter (D) should lie within the range of 2.0 to 2.5, accommodating diameters of 39.1 mm, 61.8 mm, and 101.0 mm. For this particular test, with a diameter of 39.1 mm, the height is accordingly set at 80 mm. The sample preparation process encompasses the following steps: ① extract large impurities such as plastic, leaves, and branches from the dredged silt and air dry the silt to the predetermined moisture content; ② pulverize the air-dried silt and sift it through a 2 mm sieve; ③ oven dry the sieved silt at 105 °C for a duration exceeding 24 h; ④ homogenize the silt with the solidifying agent according to the specified test ratios, stir thoroughly, and then seal and allow to stand for 24 h; ⑤ employ the layered compaction method for sample preparation. Prior to molding, uniformly apply petroleum jelly to the interior of the mold. Compact the silt amalgamated with the solidifying agent into four distinct layers within the mold to form cylindrical samples measuring 39.1 mm in diameter and 80 mm in height, producing three parallel samples for each test group; ⑥ following preparation, encase the samples in cling film to mitigate moisture evaporation, position them in a standard curing chamber (temperature (20 ± 1) °C, humidity (98 ± 1)%), demold after 24 h, verify the samples’ integrity, reseal, and continue curing until the designated durations for unconfined compressive strength testing are reached. The experiment procedure is shown in Figure 3.
The unconfined compressive strength test (UCS) serves as a prevalent method for assessing the mechanical properties of various materials, including soil, concrete, and rock. This test primarily determines the maximum axial compressive strength that a material can withstand without lateral support. Typically, samples are cylindrical with smooth, flat ends to ensure a uniform stress distribution during loading. The prepared sample is positioned between the compression plates of the WDW-10E microcomputer-controlled electronic universal testing machine (Chenda Testing Machine Manufacturing Co., Ltd. (Jinan, China)), ensuring perfect alignment of the sample’s axis with the load application direction. The load is administered uniformly at a rate of 1 mm/min until the sample fails. The testing machine automatically documents the load and deformation experienced by the sample throughout the process, halting upon achieving 3% to 5% axial deformation subsequent to the peak stress. The peak axial stress, or in its absence, the axial stress at 20% axial strain, is designated as the unconfined compressive strength of the sample. The unconfined compressive strength of the specimen was calculated using Equation (1).
q u = P A
In Equation (1), qu denotes the specimen’s unconfined compressive strength in MPa, P represents the maximum failure load in N, and A is the cross-sectional area in mm2.

2.3. Single-Addition Experiment

To determine the impact of each stabilization material on the unconfined compressive strength (UCS) of dredged silt, single-addition tests were performed by incorporating three different materials into the dredged silt individually, designated as GGBS-stabilized silt, CaO-stabilized silt, and Na2O·nSiO2-stabilized silt. After curing to the respective ages, tests for unconfined compressive strength were conducted. UCS was used as the criterion to evaluate the stabilization effects of the materials on the dredged silt and to ascertain the optimal dosage ranges for the stabilization materials. The details of the single-addition test procedure can be found in Table 3, where three replicate samples were taken for each test specimen.

2.4. RSM Experiment

The influence of alkali-activated slag on the macroscopic properties of stabilized dredged silt and its viability as a stabilizing agent are clarified in this study, which examines the effects of various factors on the early and prolonged strength of the stabilized soil. The proportions of GGBS (the ratio of GGBS mass to the dry mass of dredged silt), CaO (the ratio of CaO mass to the dry mass of dredged silt), and Na2O·nSiO2 (the ratio of Na2O·nSiO2 mass to the dry mass of dredged silt) are employed as independent variables in the experiment, designated as A, B, and C, respectively. The compressive strength of the stabilized soil at 7 and 28 d served as the response variable, denoted by Y.

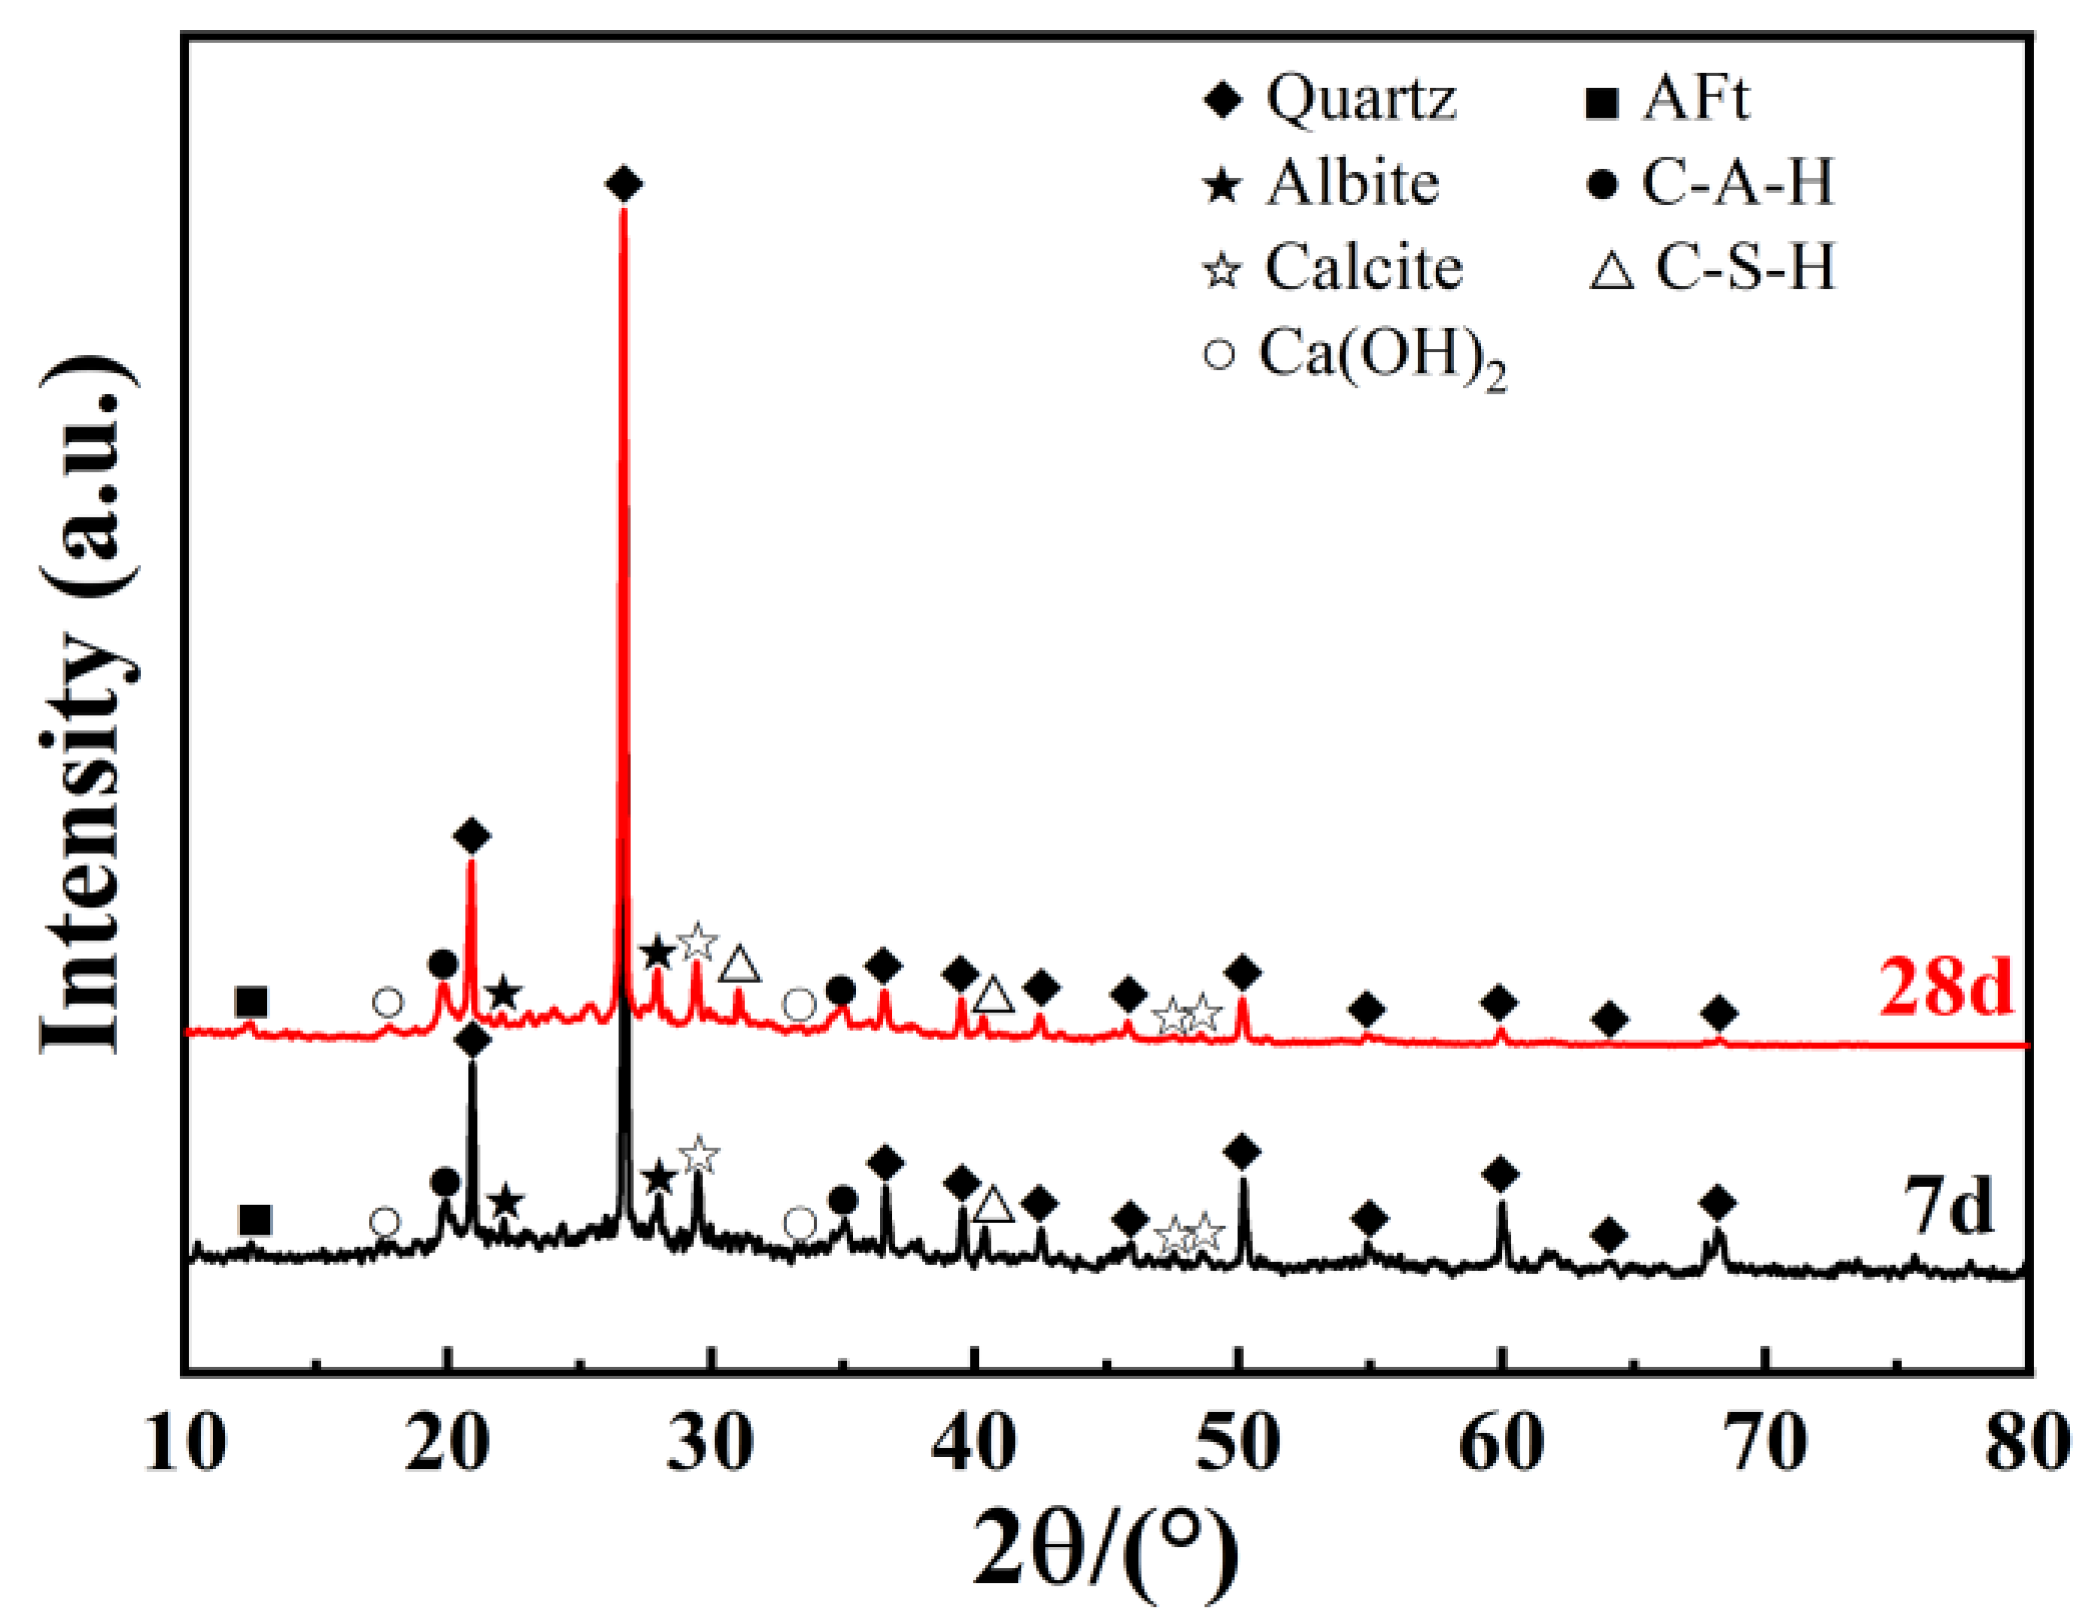
2.5. X-ray Diffraction Test (XRD)

The instrument used for the experiment was a Bruker D8 ADVANCE X-ray diffractometer (Bruker, Billerica, MA, USA). The experiment used Cu Kα radiation with a wavelength of 1.5418 Å. The scanning parameters were set with an angle range of 10° to 80° and a speed of 10°/min. Samples were collected from untreated soil and the optimal mix proportions at intervals of 7 and 28 d. The samples were processed by oven-drying the fragments at a low temperature of 40 °C for 48 h. The dried samples were subsequently pulverized into powder using an agate mortar and sifted through a 0.075 mm sieve.

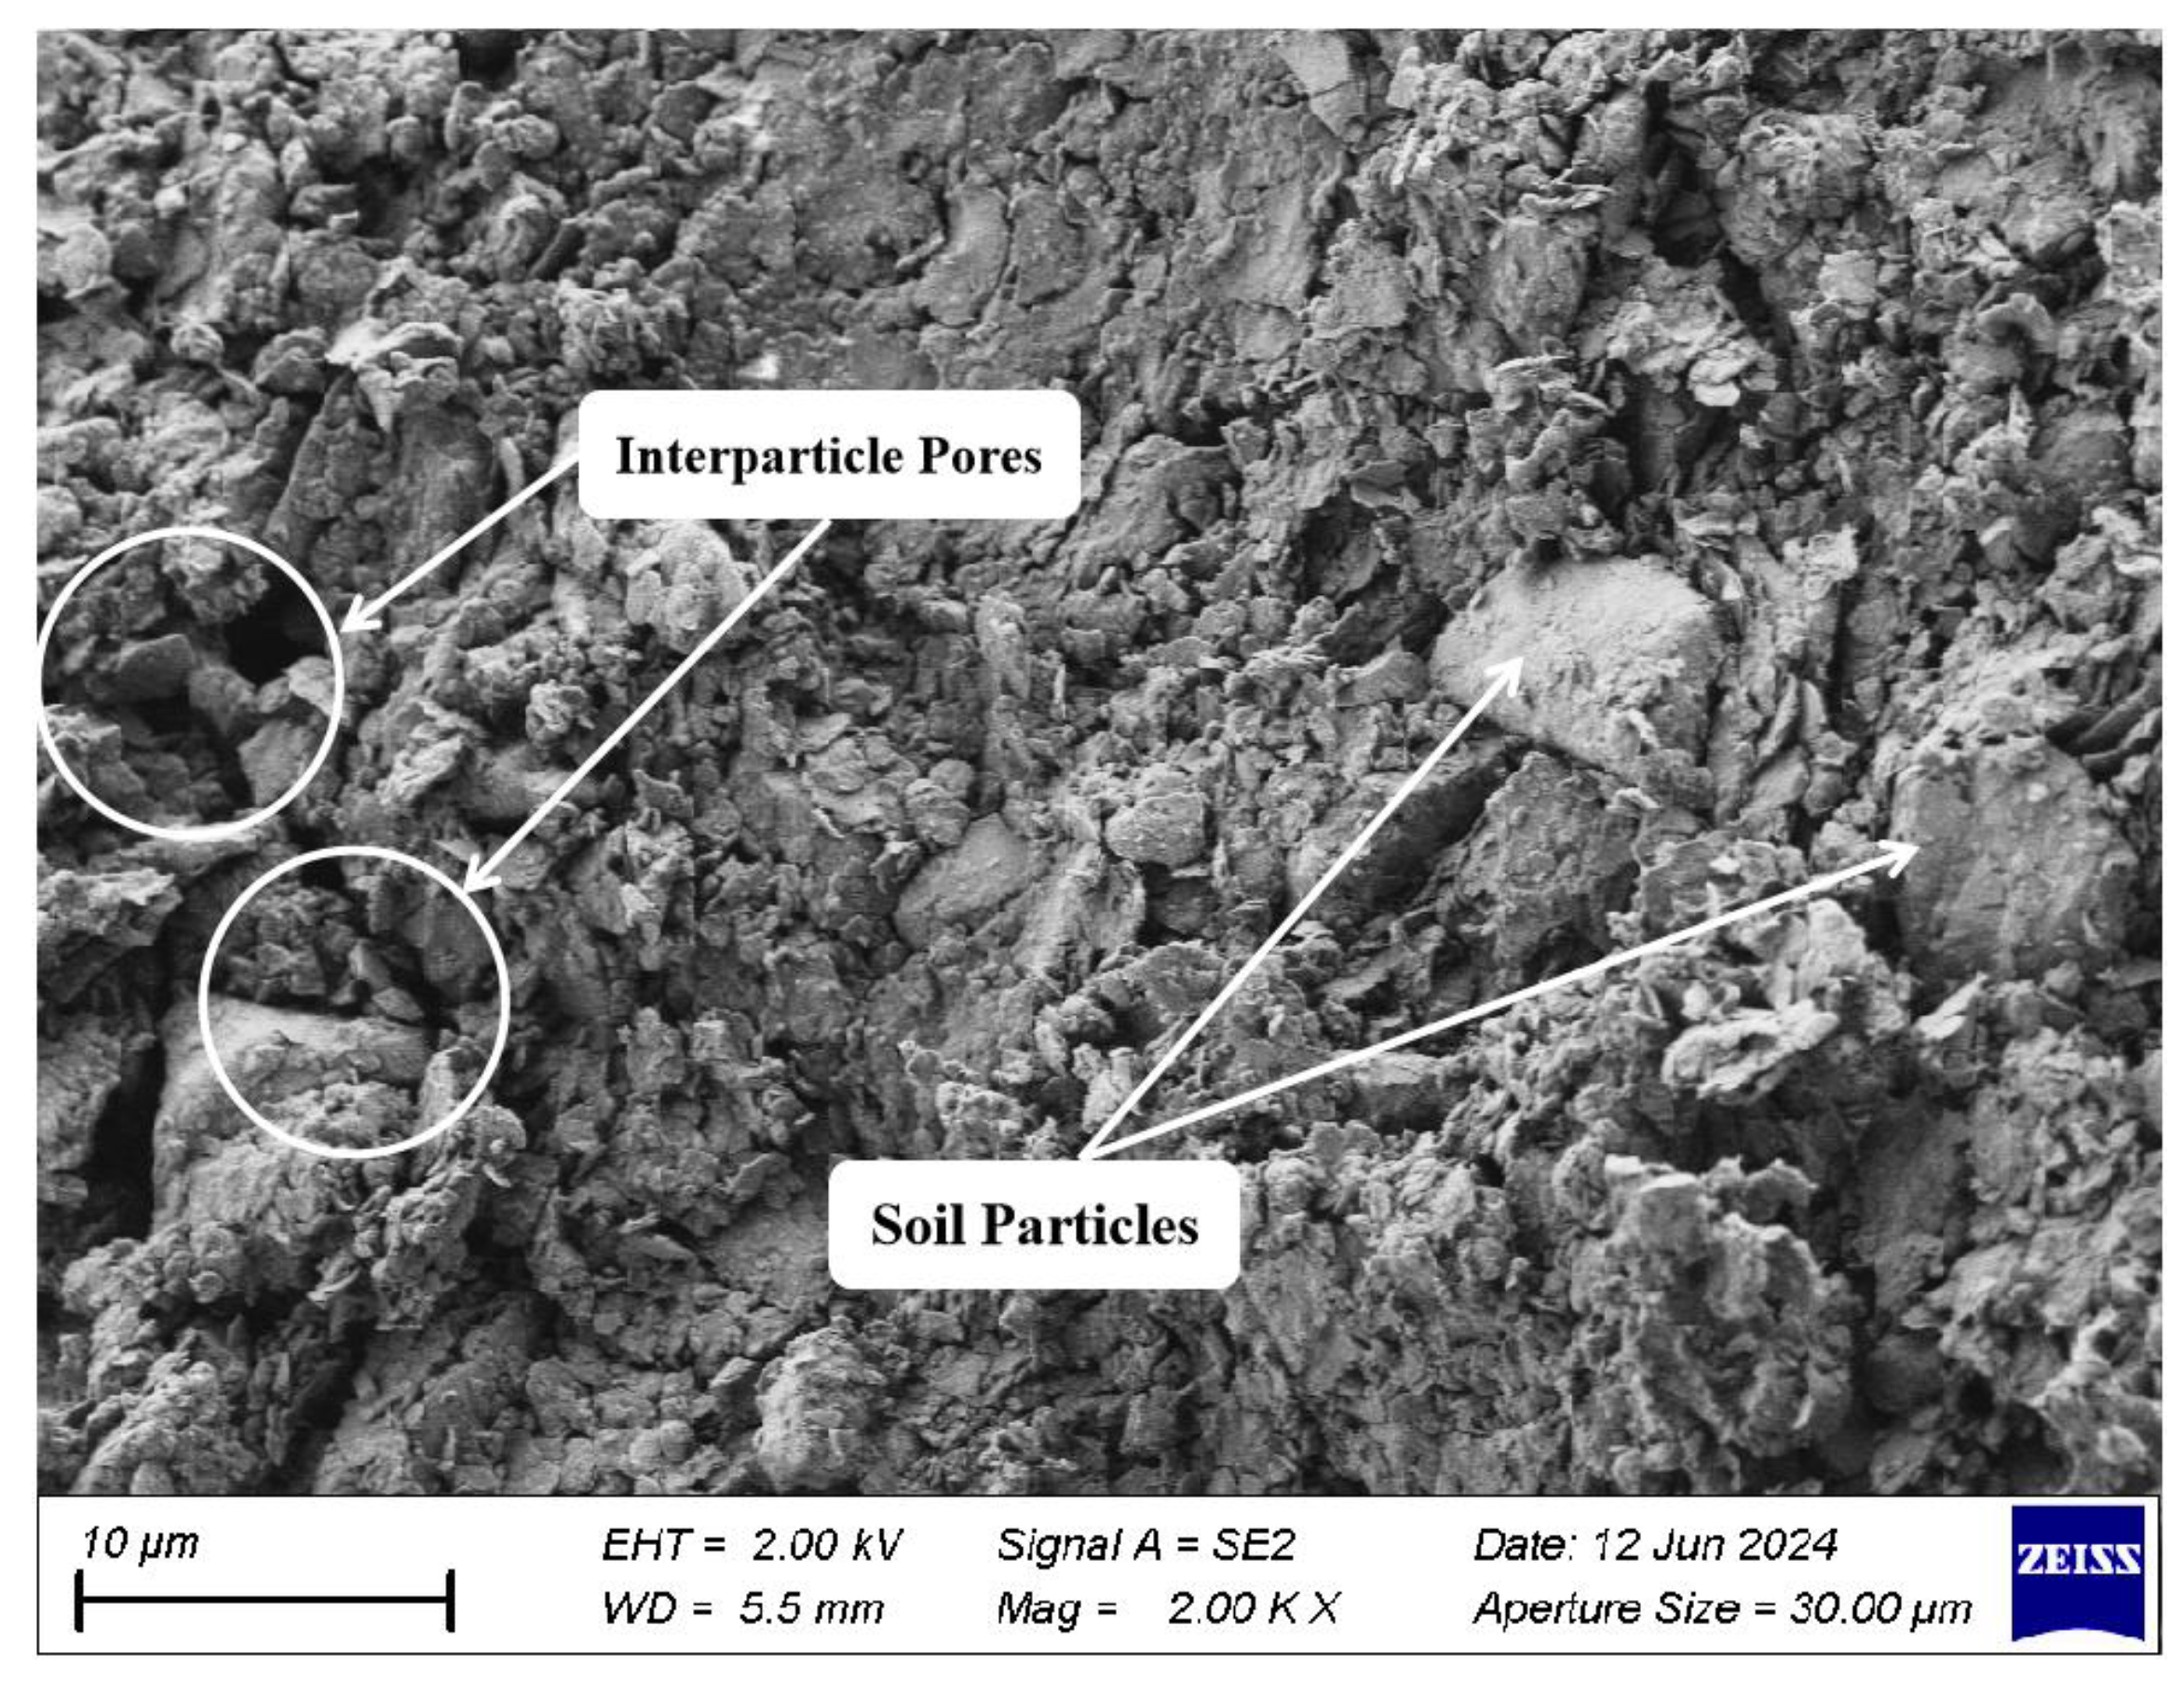
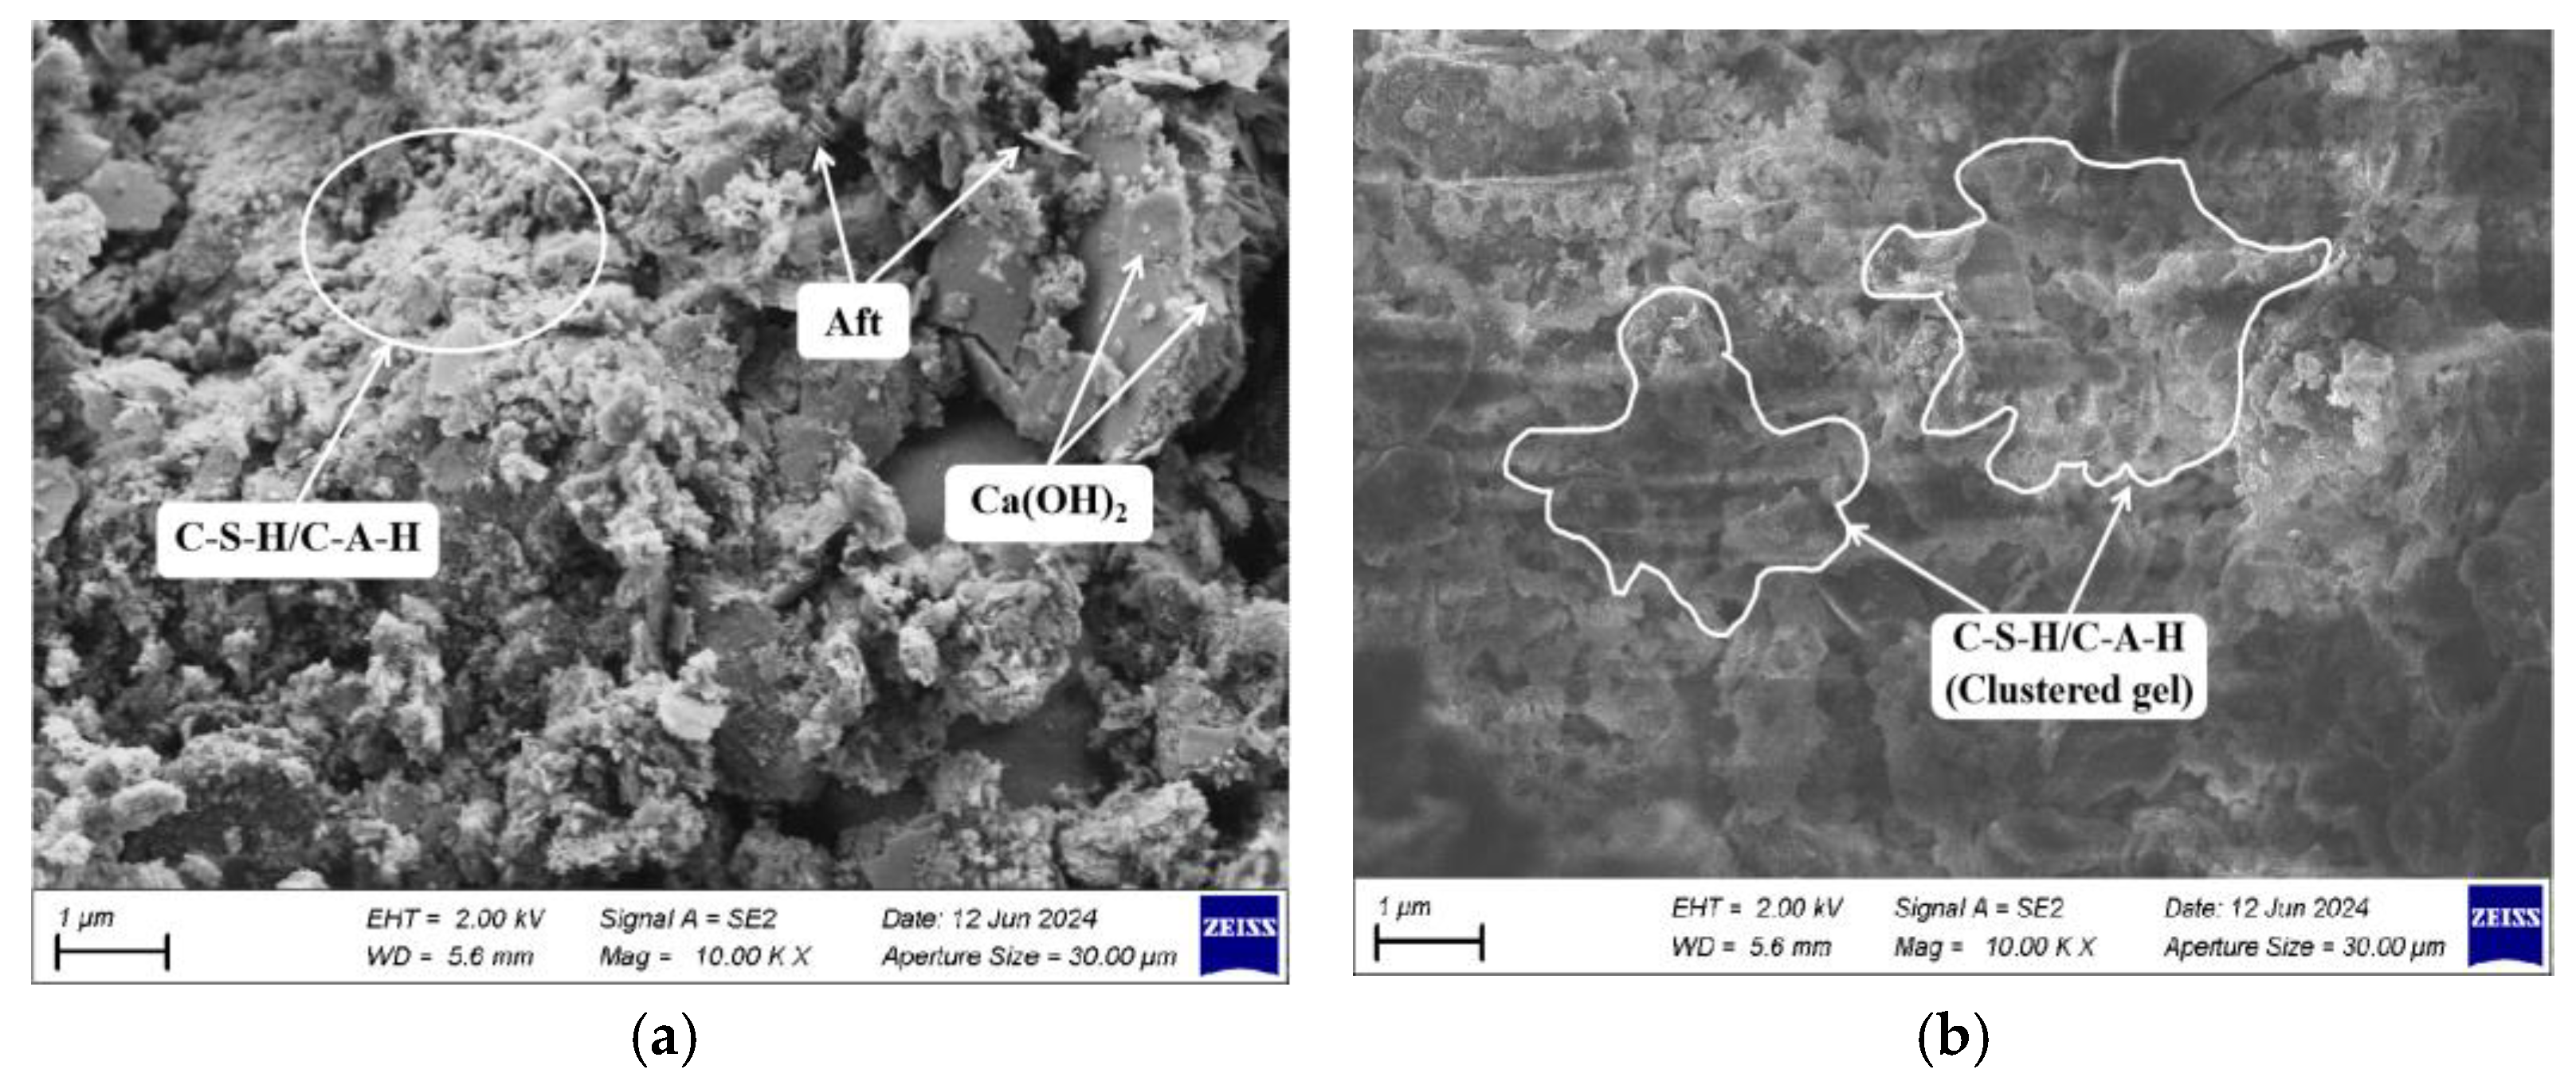
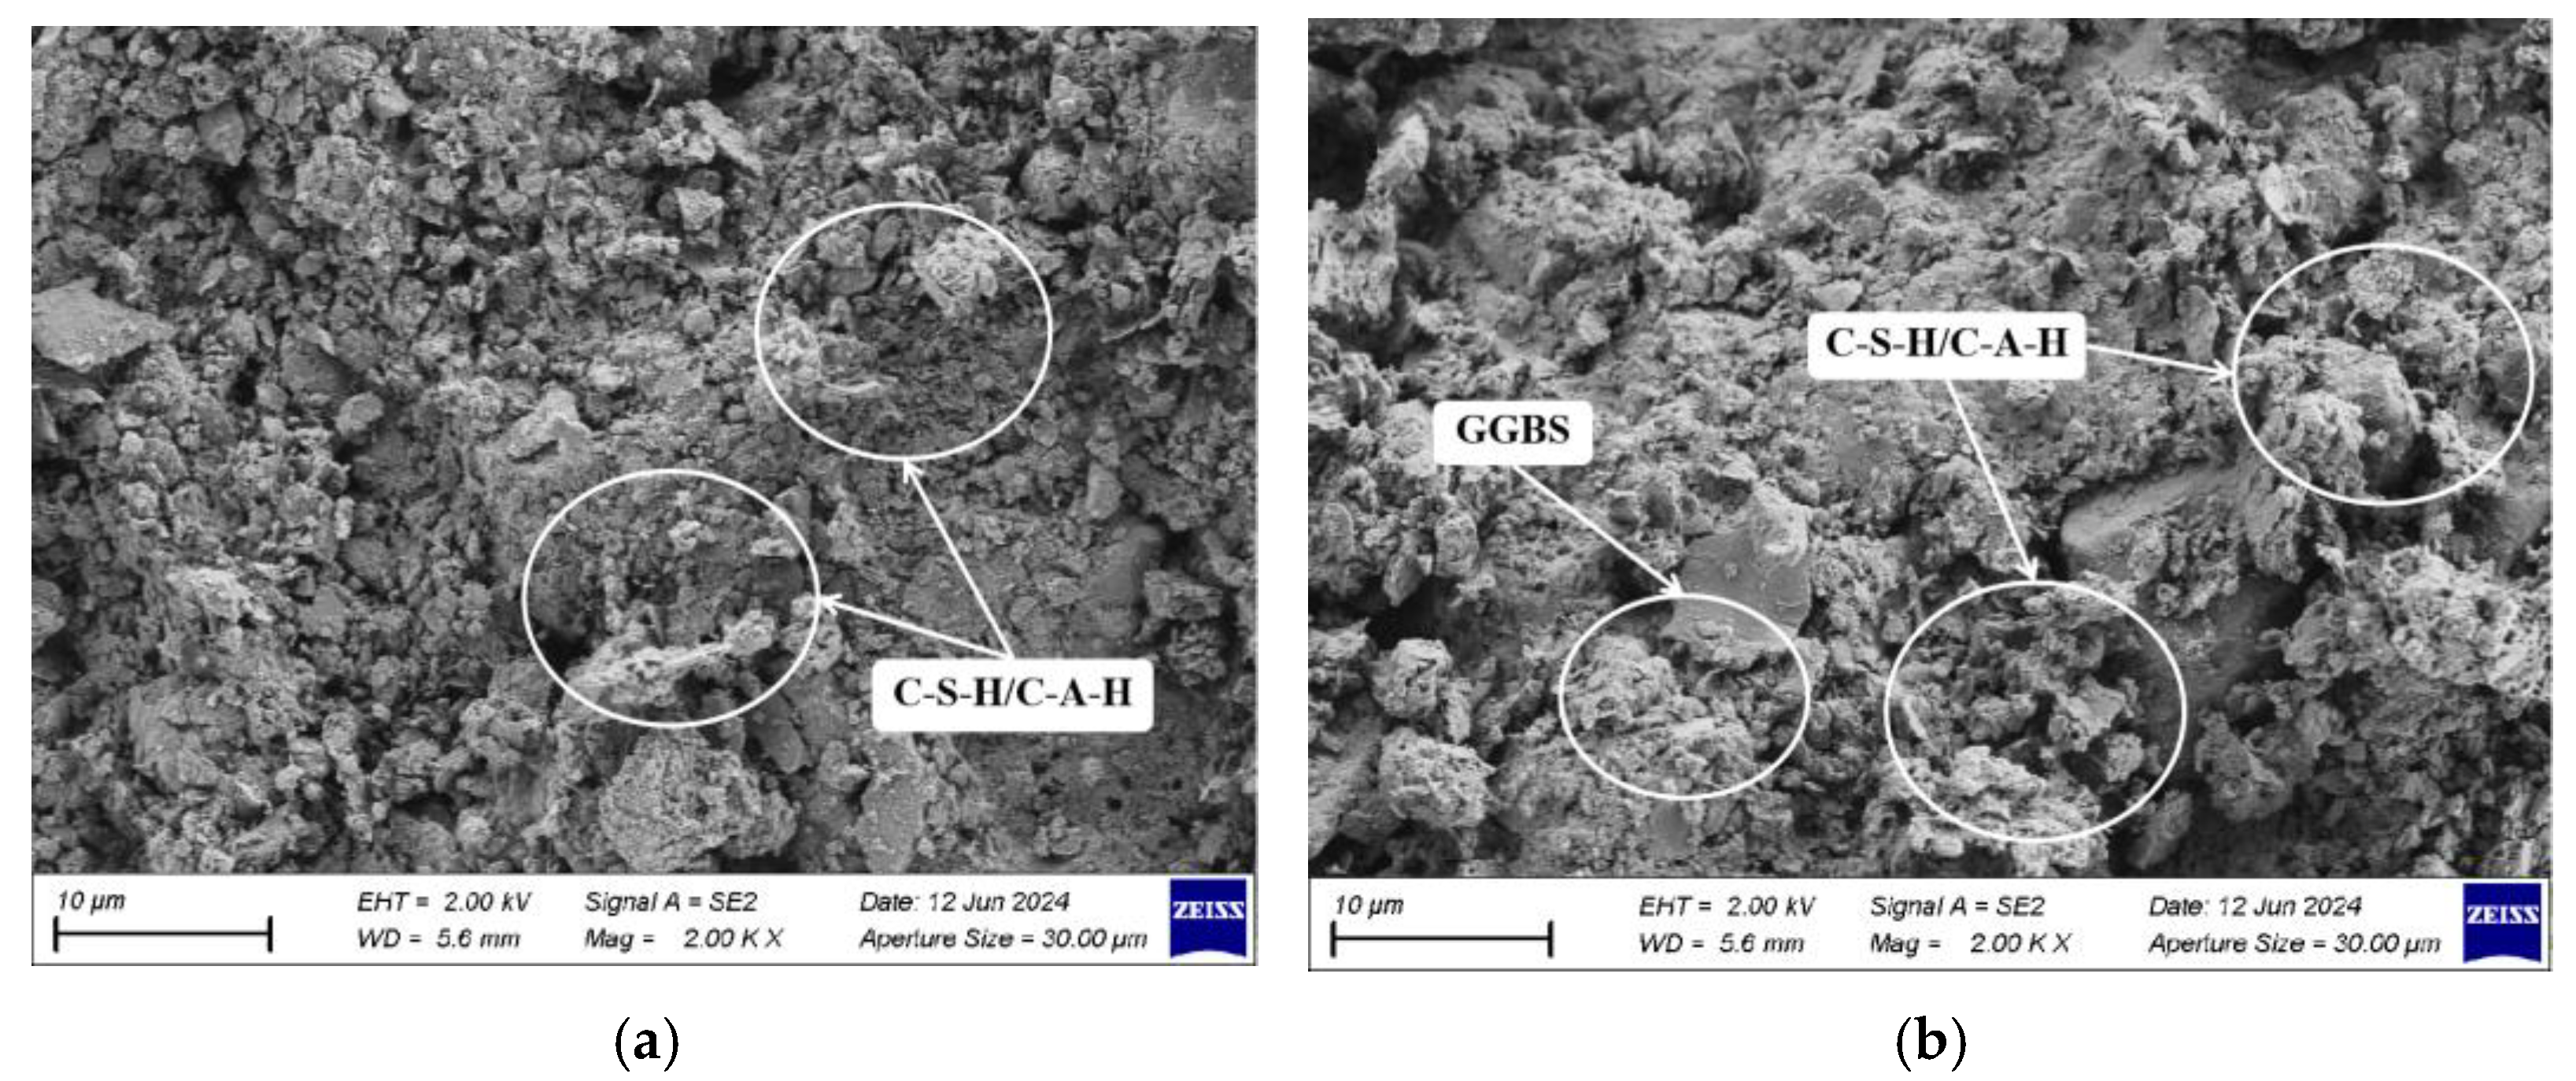
2.6. Scanning Electron Microscopy Test (SEM)

The instrument used for SEM was a ZEISS Sigma300 scanning electron microscope (ZEISS, Oberkochen, Germany). Samples were extracted from the damaged portions of the unconfined compressive strength tests and sectioned into small cubes of approximately 1 cm3. These cubes were positioned in an oven and dried for over 48 h to thoroughly eliminate the free water and bonded water from the samples. Prior to testing, the samples were fractured to yield clean and uniform fracture surfaces. Subsequently, these small soil fragments were gold-coated. The gold-coated samples were positioned in the SEM instrument, and following the establishment of a vacuum, scanning observations were undertaken.

3. Results

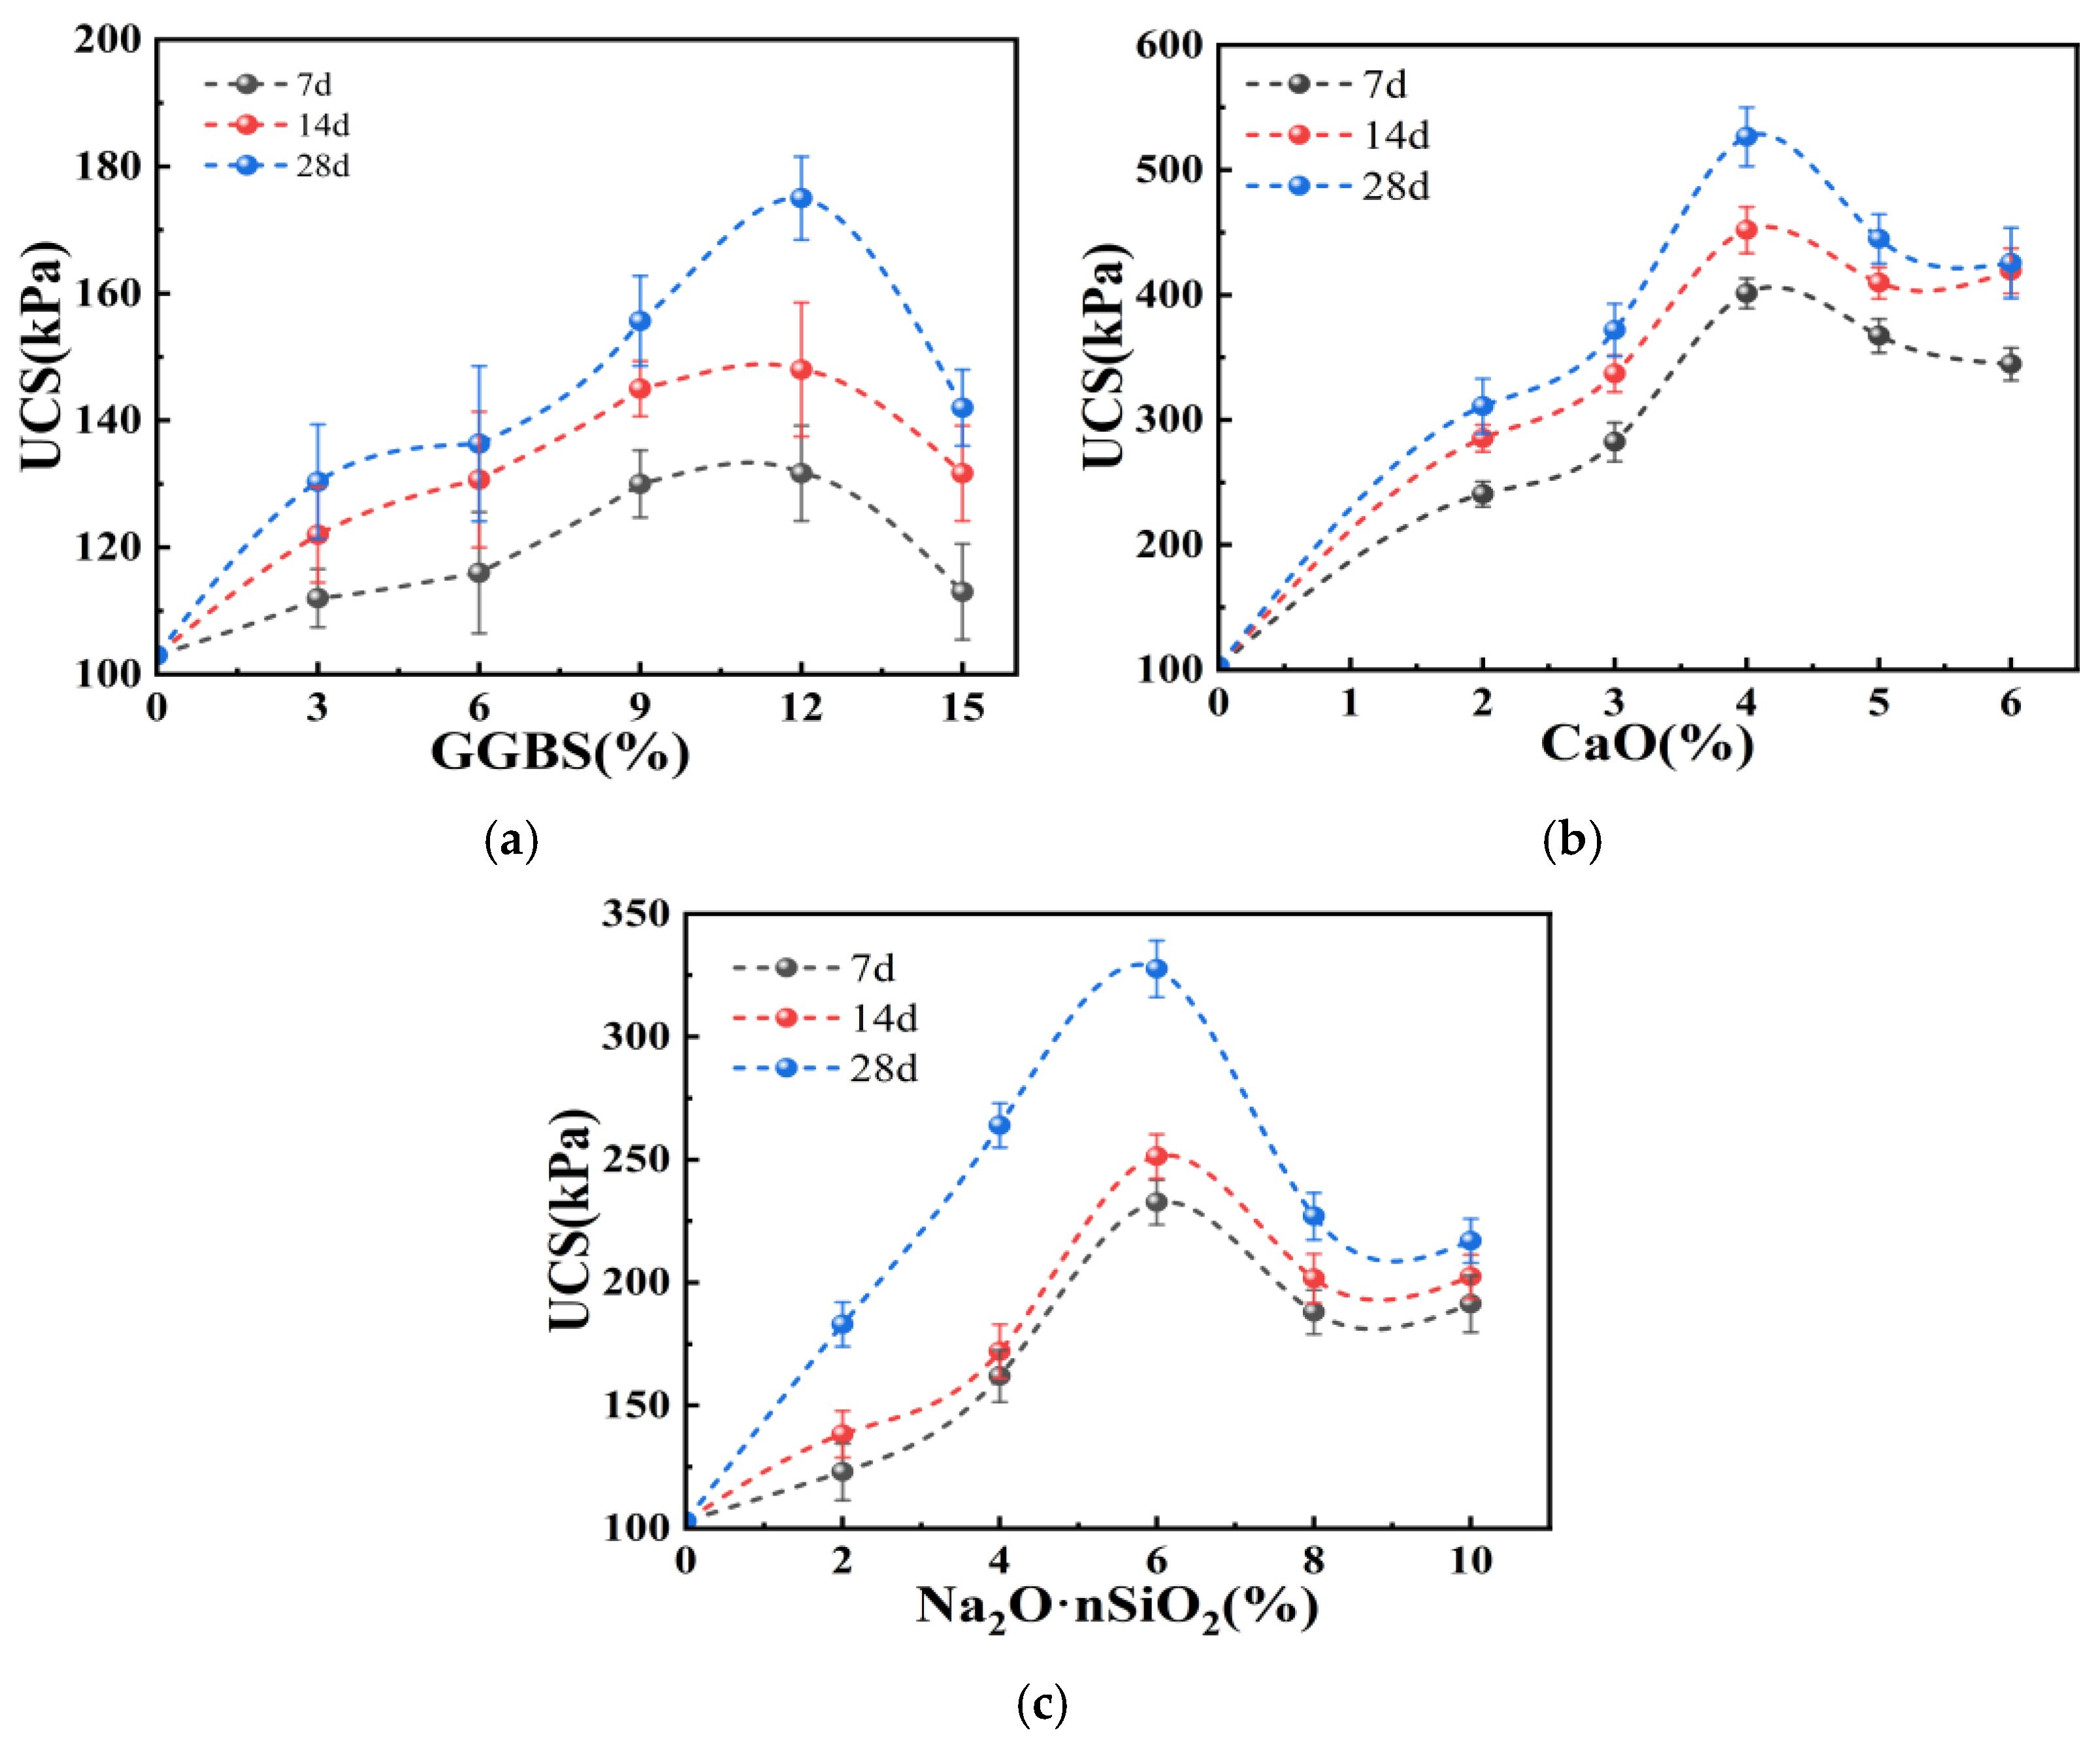
3.1. Results and Analysis of Single-Addition Experiments

Figure 4a depicts the influence of GGBS on the unconfined compressive strength of dredged silt. The graph depicts a trend where, as the GGBS content increases, the compressive strength of the stabilized silt initially rises and subsequently diminishes. Specifically, the strength of the stabilized silt gradually escalates with the GGBS content below 12%; however, beyond this threshold, the strength begins to wane. This trend is ascribed to the formation of cohesive hydration products, notably calcium silicate hydrate (CSH) and calcium aluminate hydrate (CAH), arising from the hydration of GGBS [24]. With increasing GGBS content, a greater quantity of these hydration products forms, thereby enhancing the compressive strength. At a constant GGBS content, the strength of the stabilized silt progressively increases with curing age. For example, at a 12% GGBS content, the compressive strength of the samples is 131.67 kPa at 7 d, escalates to 148 kPa at 14 d, and peaks at 175 kPa by 28 d, marking a 33% increase from the 7 d strength. However, at any given curing age, the maximum strength achieved with 12% GGBS content peaks at only 175 kPa, falling short of construction requirements [25]. Consequently, it is imperative to incorporate alkali activators into GGBS to enhance hydration [16]. According to experimental outcomes, the optimal GGBS content ranges from 9% to 15%.
Figure 4b portrays the impact of CaO on the unconfined compressive strength of dredged silt. As depicted in Figure 4b, with the incremental addition of CaO, the strength of the stabilized silt initially rises and subsequently declines, peaking at a CaO content of 4%, markedly exceeding the effect of GGBS-stabilized silt. At a CaO content of 4%, the strength of the stabilized silt significantly intensifies; however, beyond this threshold, further increases in CaO content result in a decline in strength. This phenomenon is attributable to the intense hydration reaction of CaO upon addition to soft soil, resulting in substantial production of Ca2+ ions. These ions promote the formation of calcium silicate hydrate (CSH) and calcium aluminate hydrate (CAH) [26]. However, as the hydration of CaO progresses, excessive precipitation of Ca(OH)2 crystals ensues, engendering voids within the soil structure and diminishing the stabilization efficacy of CaO on the silt. Consequently, based on experimental findings, the optimal CaO content ranges between 3% and 5%.
Figure 4c portrays the impact of Na2O·nSiO2 on the unconfined compressive strength of dredged silt. The graph depicts an initial increase followed by a decrease in the strength of the samples with escalating Na2O·nSiO2 content, peaking at 6%. Once the content exceeds 6%, the strength markedly declines, detrimentally impacting the stabilization of the dredged silt. This behavior is attributed to the robust adsorptive properties and the formation of cementitious substances during the hydration reaction of Na2O·nSiO2, which significantly contributes to silt stabilization [27]. The hydration reaction of Na2O·nSiO2 yields a substantial amount of fibrous material that permeates the stabilized soil, filling voids and augmenting the soil’s density and structural integrity. However, as the content increases, the diminished space for hydration reactions, resulting from the filled voids, impedes further Na2O·nSiO2 hydration. Consequently, based on experimental outcomes, the recommended Na2O·nSiO2 content range is 4% to 8%.
Based on the results of the single-addition experiments involving GGBS, CaO, and Na2O·nSiO2, it is clear that all three materials positively influence the stabilization of dredged silt. Among these, CaO exhibits the most pronounced solidifying effect, succeeded by Na2O·nSiO2, with GGBS demonstrating the least effectiveness. Taking into account the solidifying effects and economic considerations of the three materials, the optimal content ranges for the dredged silt in this study are identified as 9% to 15% for GGBS, 3% to 5% for CaO, and 4% to 8% for Na2O·nSiO2.

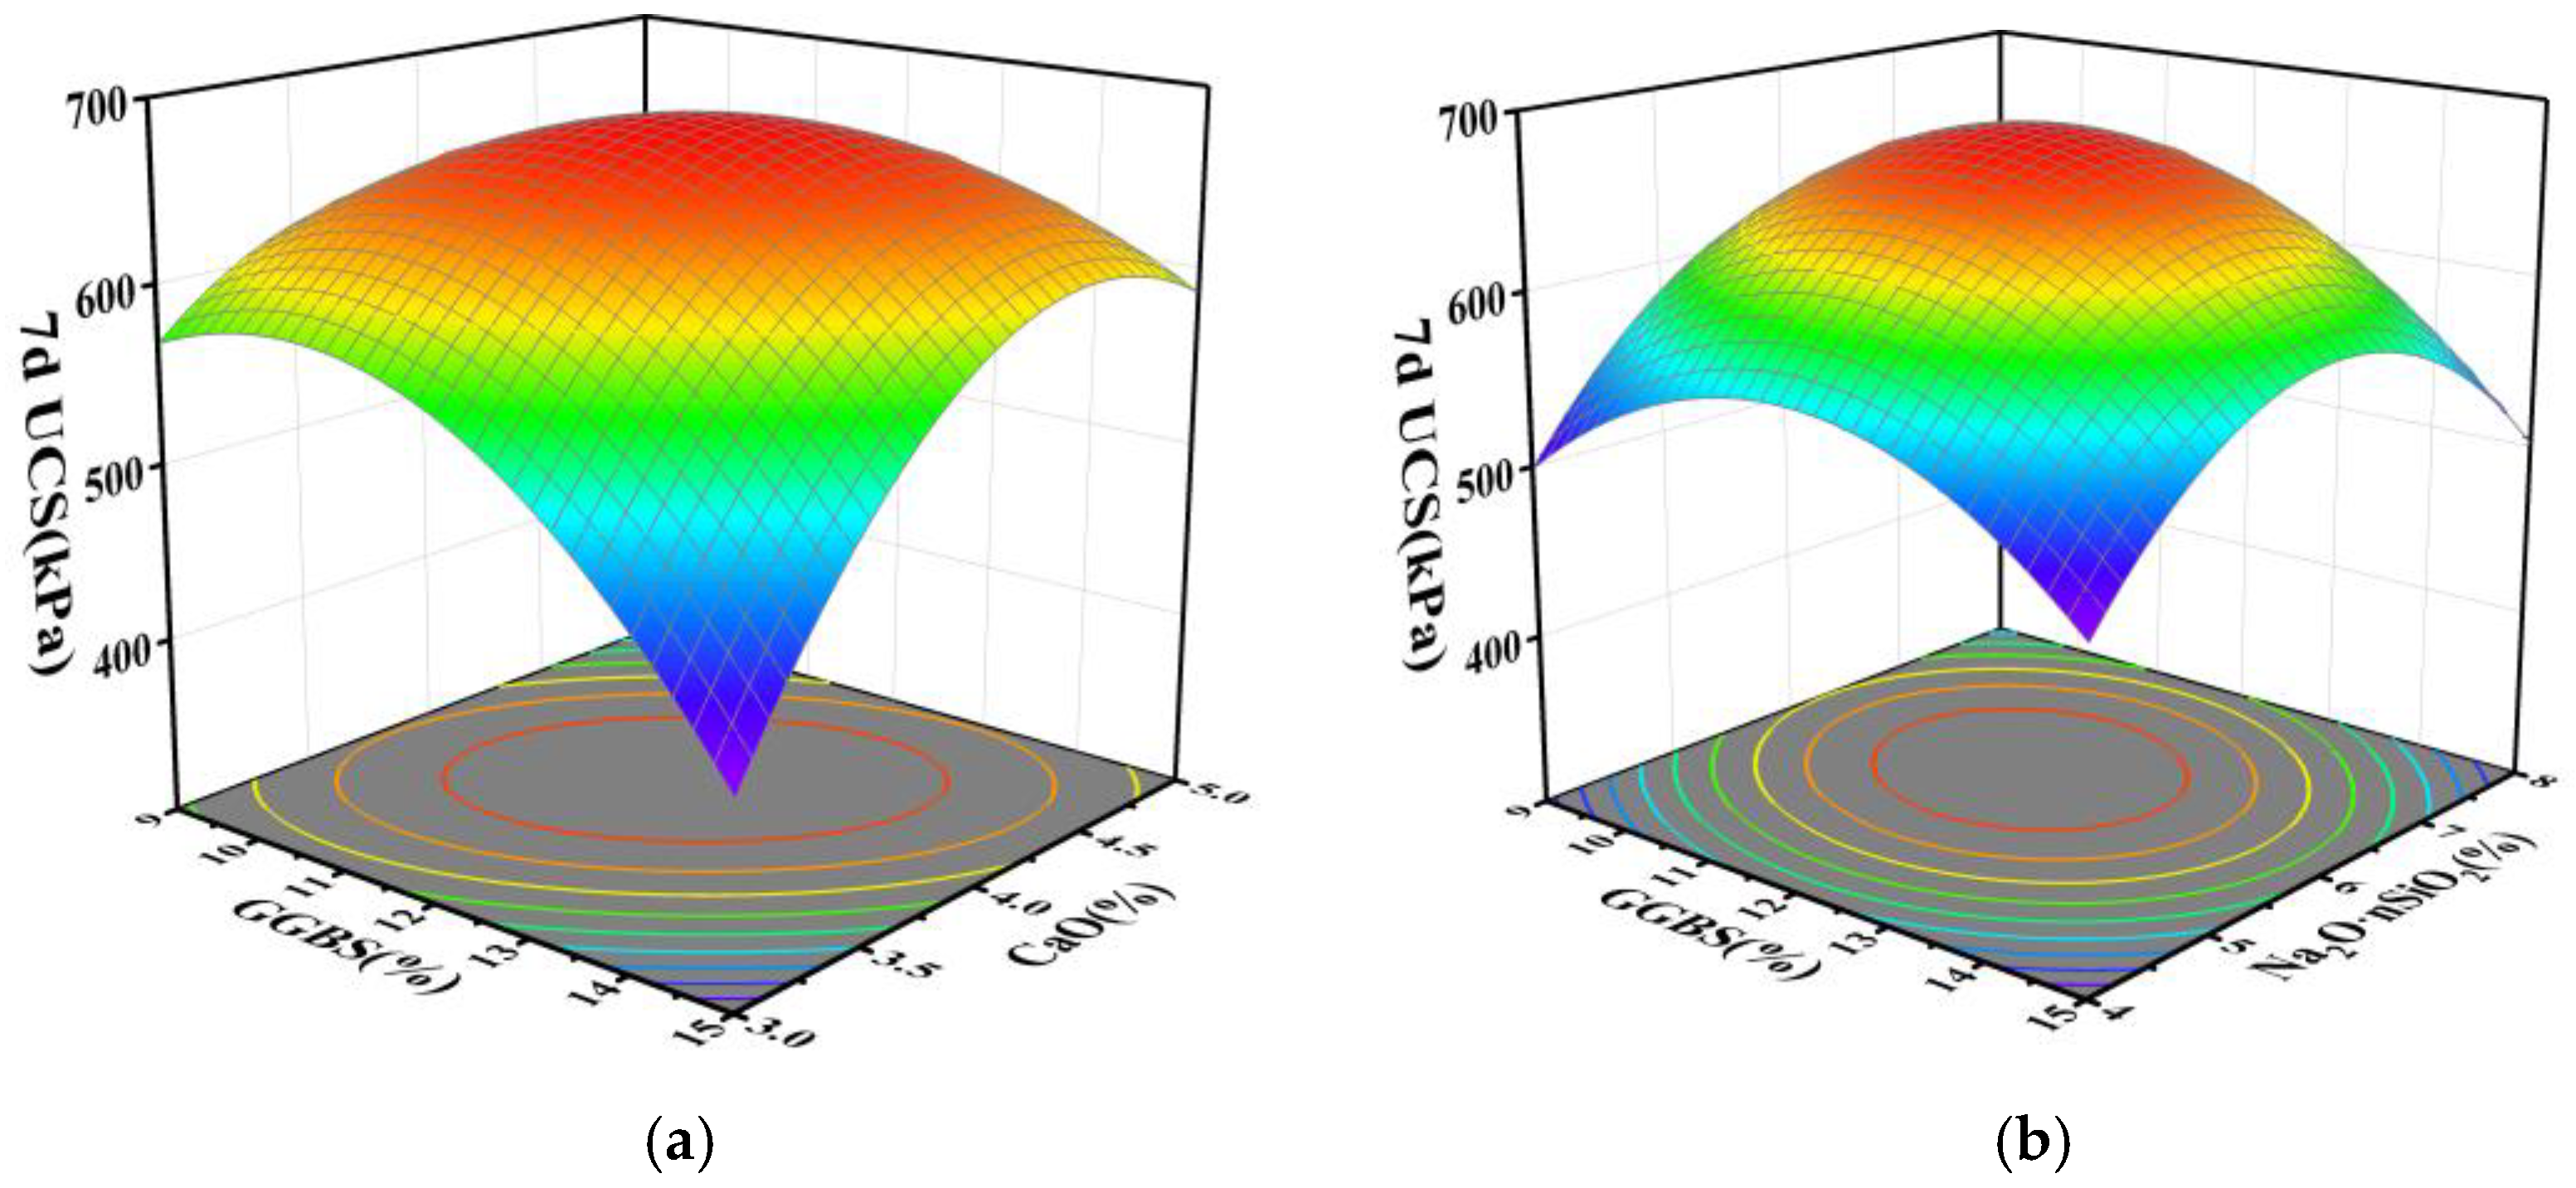
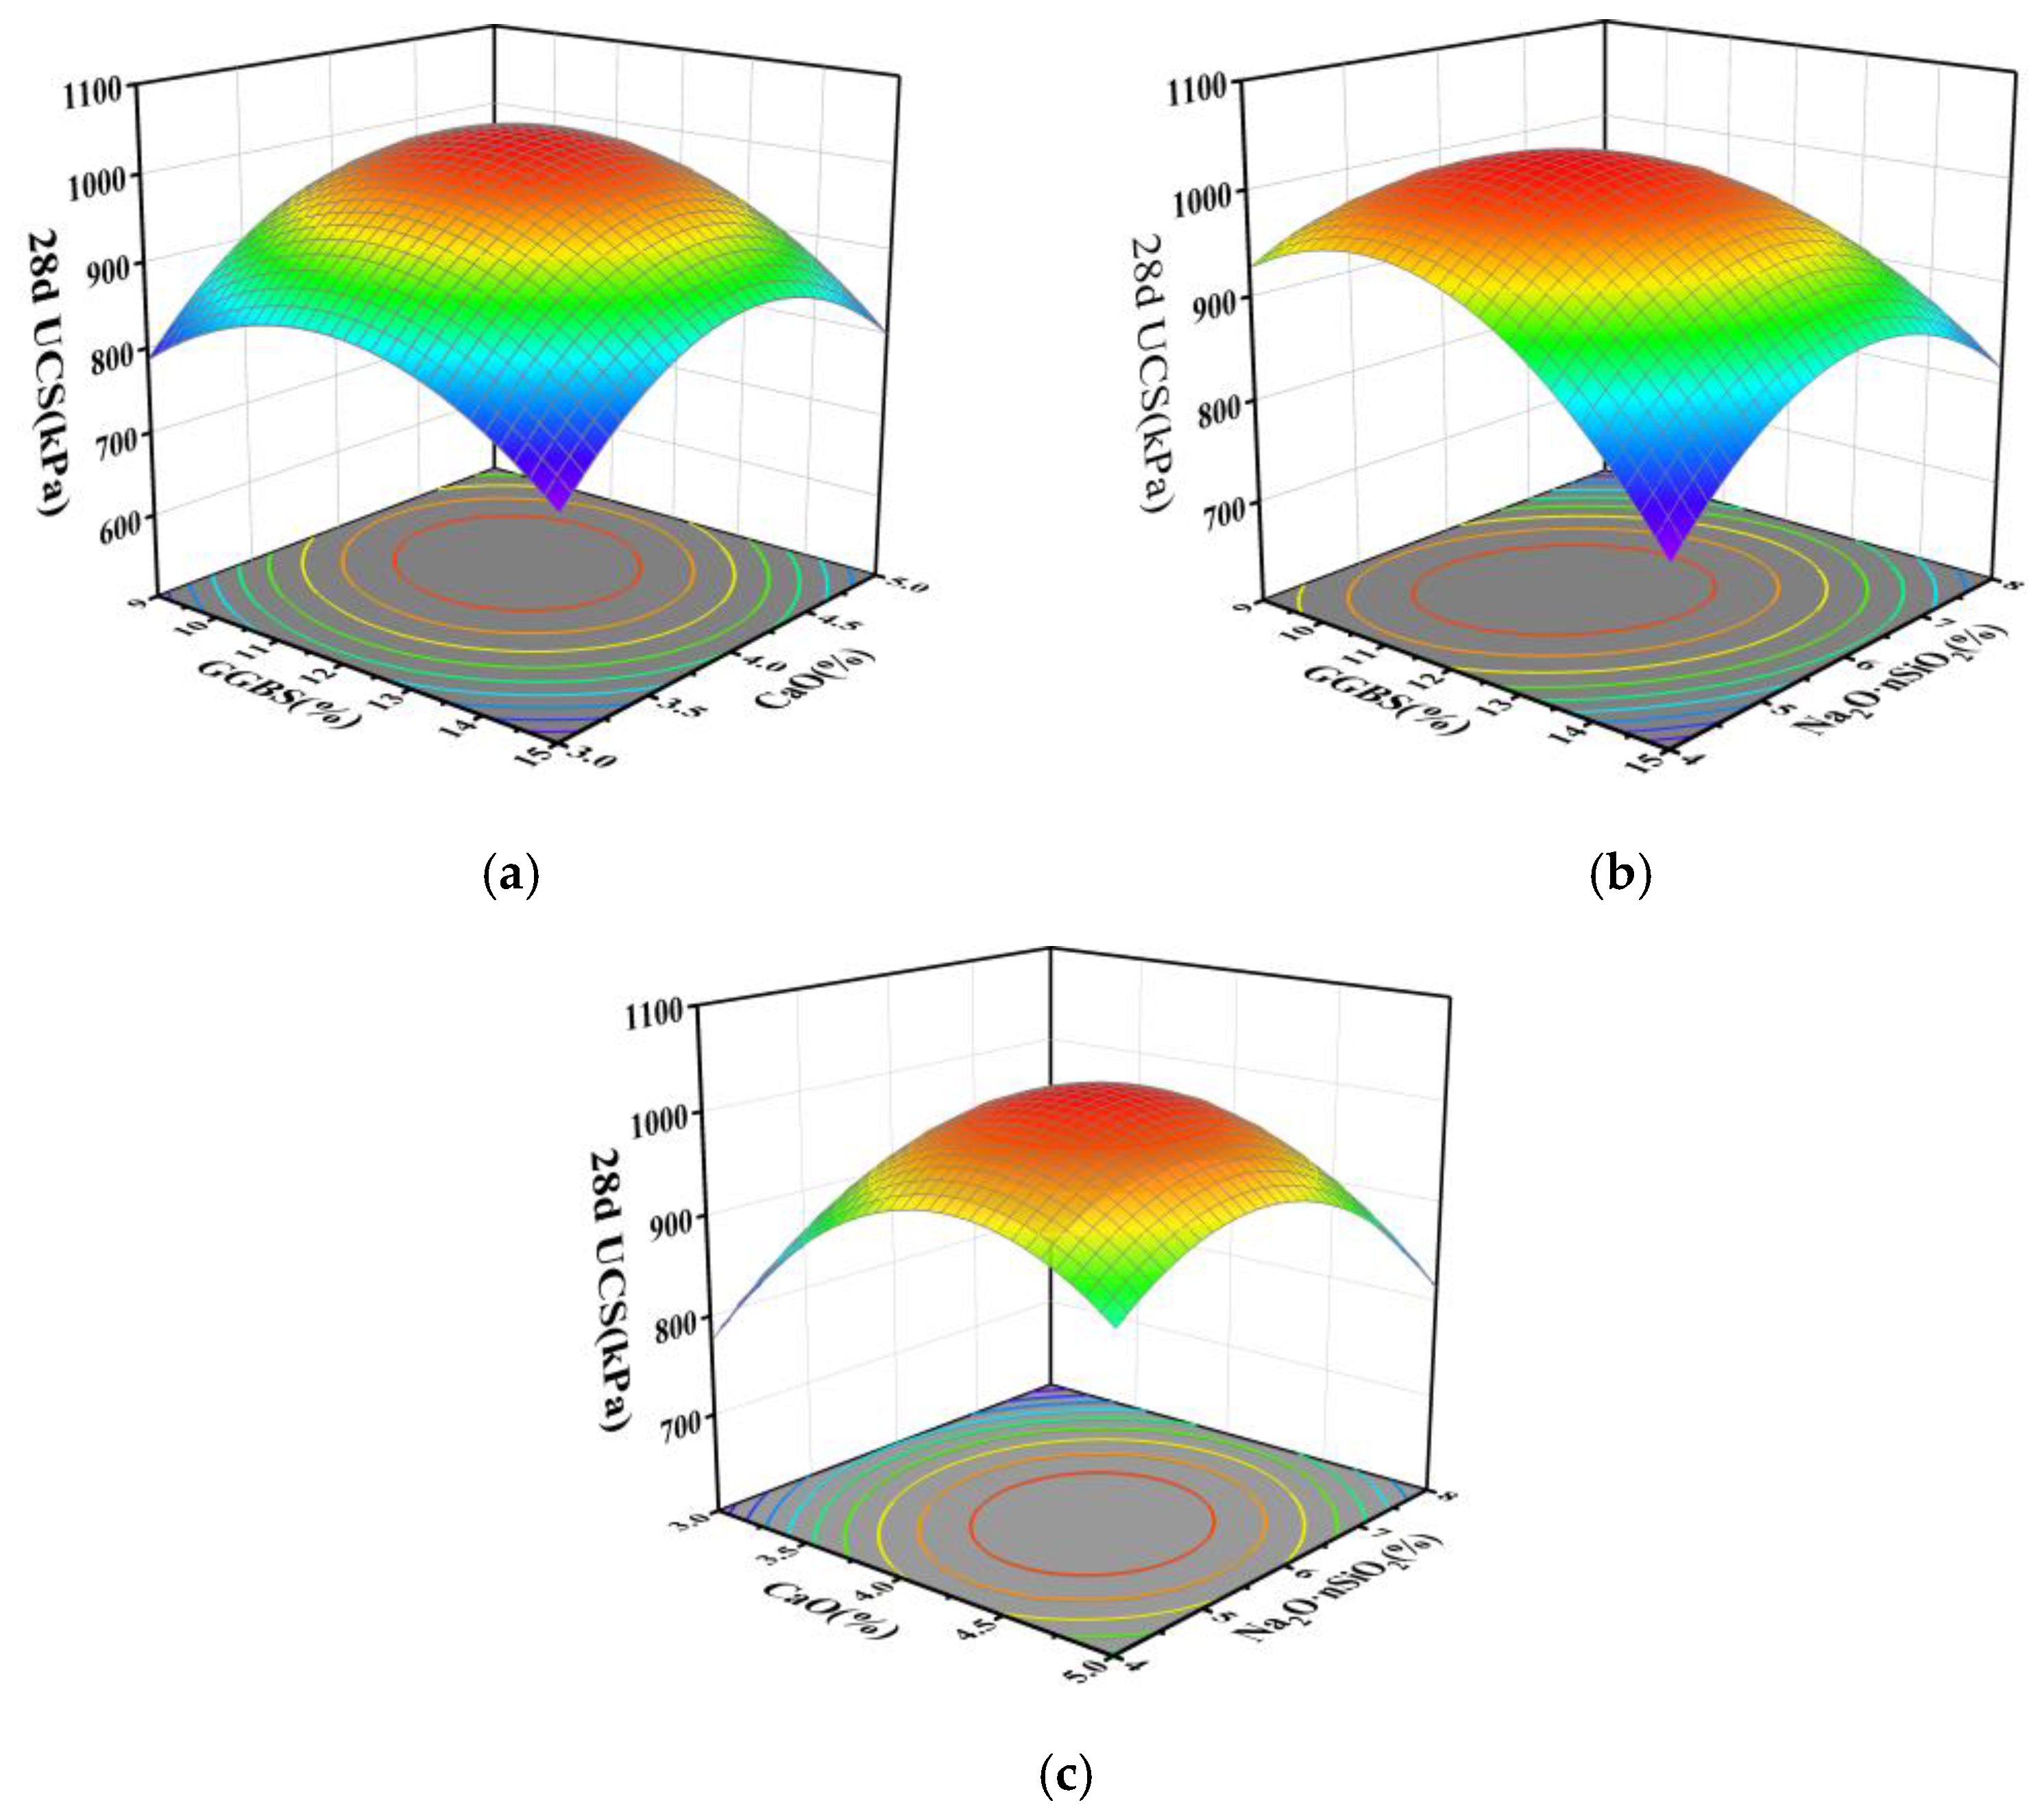
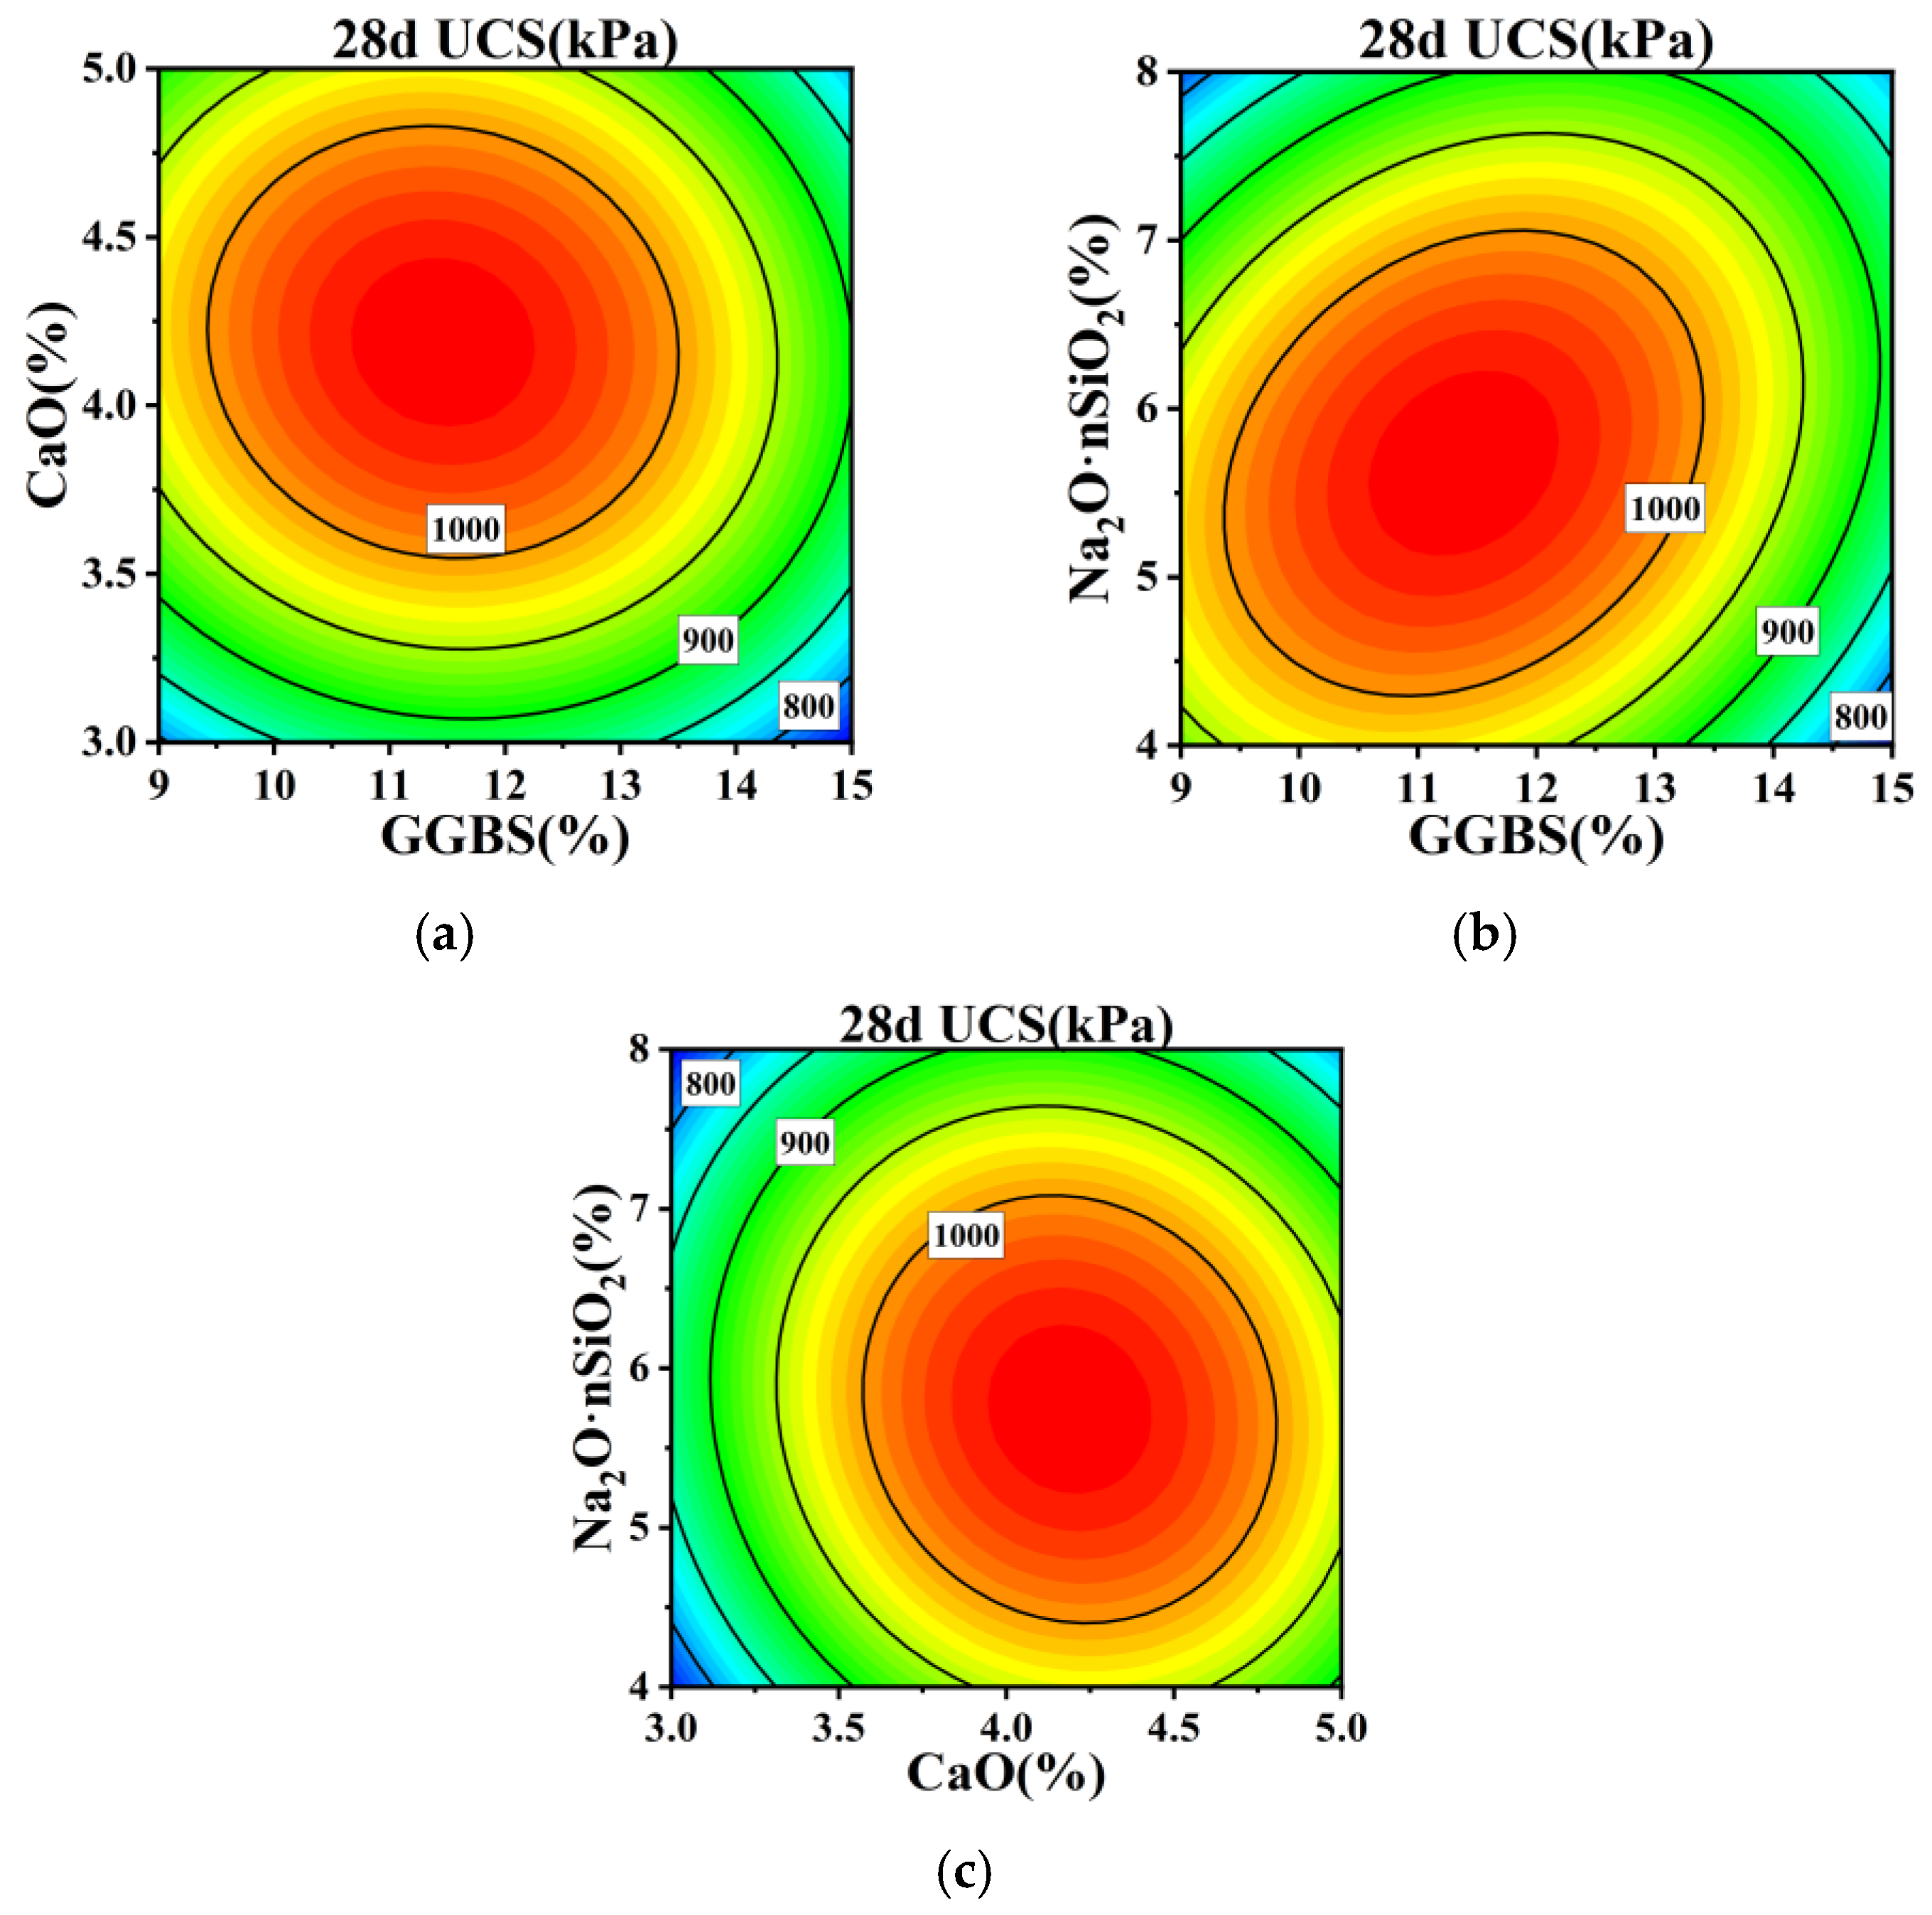
3.2. Results and Analysis of RSM Experiments

Employing the Box–Behnken design within Design-Expert software (Version: 13.0.5.0 64-bit), a three-factor, three-level experiment was executed to explain the impacts of each experimental factor and their synergistic interactions on the strength of the stabilized soil. The coding and level configuration of the independent variables are shown in Table 4.
The response surface methodology incorporates 17 experimental groups. Unconfined compressive strength tests on the stabilized dredged silt were performed at two distinct curing periods: 7 and 28 d. The response values, denoted as Y7d and Y28d, are expressed in units of kilopascals (kPa). The experimental groups and their corresponding results are detailed in Table 5.
Using Design-Expert software, the experimental results presented in Table 5 were subjected to a second-order polynomial regression analysis. The second-order regression equation and the results of the variance analysis for each term are detailed in Table 6.
This study employed the F-distribution to evaluate the significance of the regression outcomes. During the analysis, it is imperative to first establish the significance level α. In Table 6, should the p-value fall below α, the corresponding experimental result is deemed significantly different. Conversely, if not significantly different, it can be excluded from the optimization analysis. In this study, the significance level α was established at 0.05. As shown in Table 6, the model F-values for Y7d and Y28d are 48.31 and 61.02, respectively, with p-values both under 0.0001, signifying that the regression models possess high significance. For Y7d, the significance ranking of the single factors is B > C > A, denoting CaO content > Na2O·nSiO2 content > GGBS content. The significance ranking of the factor interactions is AB > AC > BC, suggesting that the 7 d unconfined compressive strength of the stabilized soil predominantly relates to the CaO and GGBS contents. For Y28d, the significance ranking of the single factors is B > A > C, signifying CaO content > GGBS content > Na2O·nSiO2 content. The significance ranking of the factor interactions is AC > BC > AB, indicating that the 28 d unconfined compressive strength of the stabilized soil is chiefly associated with the GGBS and Na2O·nSiO2 contents. Because the Design-Expert software was employed, non-significant terms were systematically excluded to formulate the second-order polynomial regression equations between the GGBS content (A), CaO content (B), Na2O·nSiO2 content (C), and the unconfined compressive strength of stabilized soil at 7 and 28 d, as outlined in Equations (2) and (3).
Y7d = 680.4 − 16.62A + 25.75B + 18.13C + 62AB − 10.75AC + 2BC − 76.08A2 − 89.33B2 − 93.57C2
Y28d = 1022.4 − 34.25A + 40.75B − 21.75C − 62AB − 13.25AB − 47.25BC − 17.25BC − 102.08A2 − 114.58B2 − 97.07C2
Table 7 displays the outcomes of the model reliability analysis. The proximity of the model correlation coefficient (R2) and the adjusted determination coefficient (Adjusted R2) confirm the adequacy of the regression equation’s fit. Furthermore, a coefficient of variation (C.V.) below 10, a signal-to-noise ratio (Adequate Precision) exceeding 4, and a disparity less than 0.2 between the Adjusted R2 and the Predicted R2 emphasize the high accuracy and reliability of the experiments. As shown in Table 7, the R2 values for the models established for 7 and 28 d are 0.9842 and 0.9874, respectively, nearing 1, thereby indicating high model reliability. The Adjusted R2 and Predicted R2 for the two models are 0.9638 and 0.8490 and 0.9712 and 0.8657, respectively. The coefficients of variation stand at 3.12% and 2.14%, while the signal-to-noise ratios are recorded at 20.198% and 19.398%, respectively. This confirmation underscores that both models exhibit high accuracy and robust reliability, attesting to the effectiveness of the models established in this study.
Employing the regression equation, the configurations of response surface plots and contour maps are scrutinized to analyze the impact of GGBS, CaO, and Na2O·nSiO2 on unconfined compressive strength. These plots effectively explain the interactions among the variables. By evaluating the steepness of the response surface plots, the magnitude of their impact on response values can be assessed; a steeper gradient signifies more intense interactions among the variables. The interactions of GGBS content (A), CaO content (B), and Na2O·nSiO2 content (C) with respect to the 7 and 28 d unconfined compressive strength values are delineated through the response surfaces and contour lines depicted in Figure 5, Figure 6, Figure 7 and Figure 8.
Figure 5a–c systematically depicts the trends on interaction surfaces AB, AC, and BC, respectively. On the AB surface, the gradient of the 7 d UCS initially ascends and subsequently descends with increasing GGBS content. At low GGBS levels, this pattern is mirrored with increasing CaO content; however, at elevated GGBS levels, the gradient stabilizes following an initial ascent with increasing CaO content. The optimal 7 d UCS is achieved with GGBS contents between 11–14% and CaO contents between 3.5–4.5%, wherein CaO exerts a more pronounced influence on UCS than GGBS. On the AC surface, the gradient of the 7 d UCS similarly elevates and then diminishes with escalating GGBS and Na2O·nSiO2 contents, peaking within the ranges of 11–14% GGBS and 5–7% Na2O·nSiO2, signifying a more substantial influence of Na2O·nSiO2. On the BC surface, analogous trends manifest with Na2O·nSiO2 and CaO, where the peak 7 d UCS is noted within CaO contents of 3.5–4.5% and Na2O·nSiO2 contents of 5–7%, with CaO exerting a more significant effect. Contour plots in Figure 6a–c depict the interaction between GGBS and CaO as notably distinct, forming an elliptical shape, while the interactions involving Na2O·nSiO2 demonstrate as circular, suggesting less significance and minimal impact on UCS.
Figure 7 and Figure 8 demonstrate that the 28 d cured soil’s compressive strength trend closely mirrors that of the 7 d cured soil. The highest unconfined compressive strength is observed when GGBS, CaO, and Na2O·nSiO2 contents are within the ranges of 11% to 14%, 4% to 4.5%, and 5% to 7%, respectively. The elliptical contour lines for GGBS and Na2O·nSiO2 on the contour maps indicate a significant interaction between these components, corroborating the findings from the significance analysis in Table 6.
Design-Expert software was used to optimize the mix proportions of alkali-activated, slag-stabilized dredged silt, targeting the maximum unconfined compressive strength. The optimal mix proportions were established at 11.5% GGBS, 4.1% CaO, and 5.9% Na2O·nSiO2. Scatter plots comparing the actual versus predicted unconfined compressive strengths for 7 and 28 d, as illustrated in Figure 9a,b, reveal data points closely aligned along a 45-degree diagonal, demonstrating high fidelity in the model’s predictions.
To validate the accuracy of the optimal mix ratio for the cured soil, samples were prepared and subjected to unconfined compressive strength tests under standard curing conditions until the designated ages were reached. The actual and predicted strength values of the cured soil, as detailed in Table 8 and depicted in Figure 9c, indicate that the actual results are derived from averages across five distinct sets of strength tests. The absolute relative error (D) between the predicted and actual strengths, computed using Equation (3), confirms that, for both 7 d (683.4 kPa predicted vs. 703.4 kPa actual) and 28 d (1032.4 kPa predicted vs. 1066.3 kPa actual), the discrepancies are under 5%. This validation underscores the high accuracy of the predictive model developed in this study, offering a reliable reference for subsequent applications.

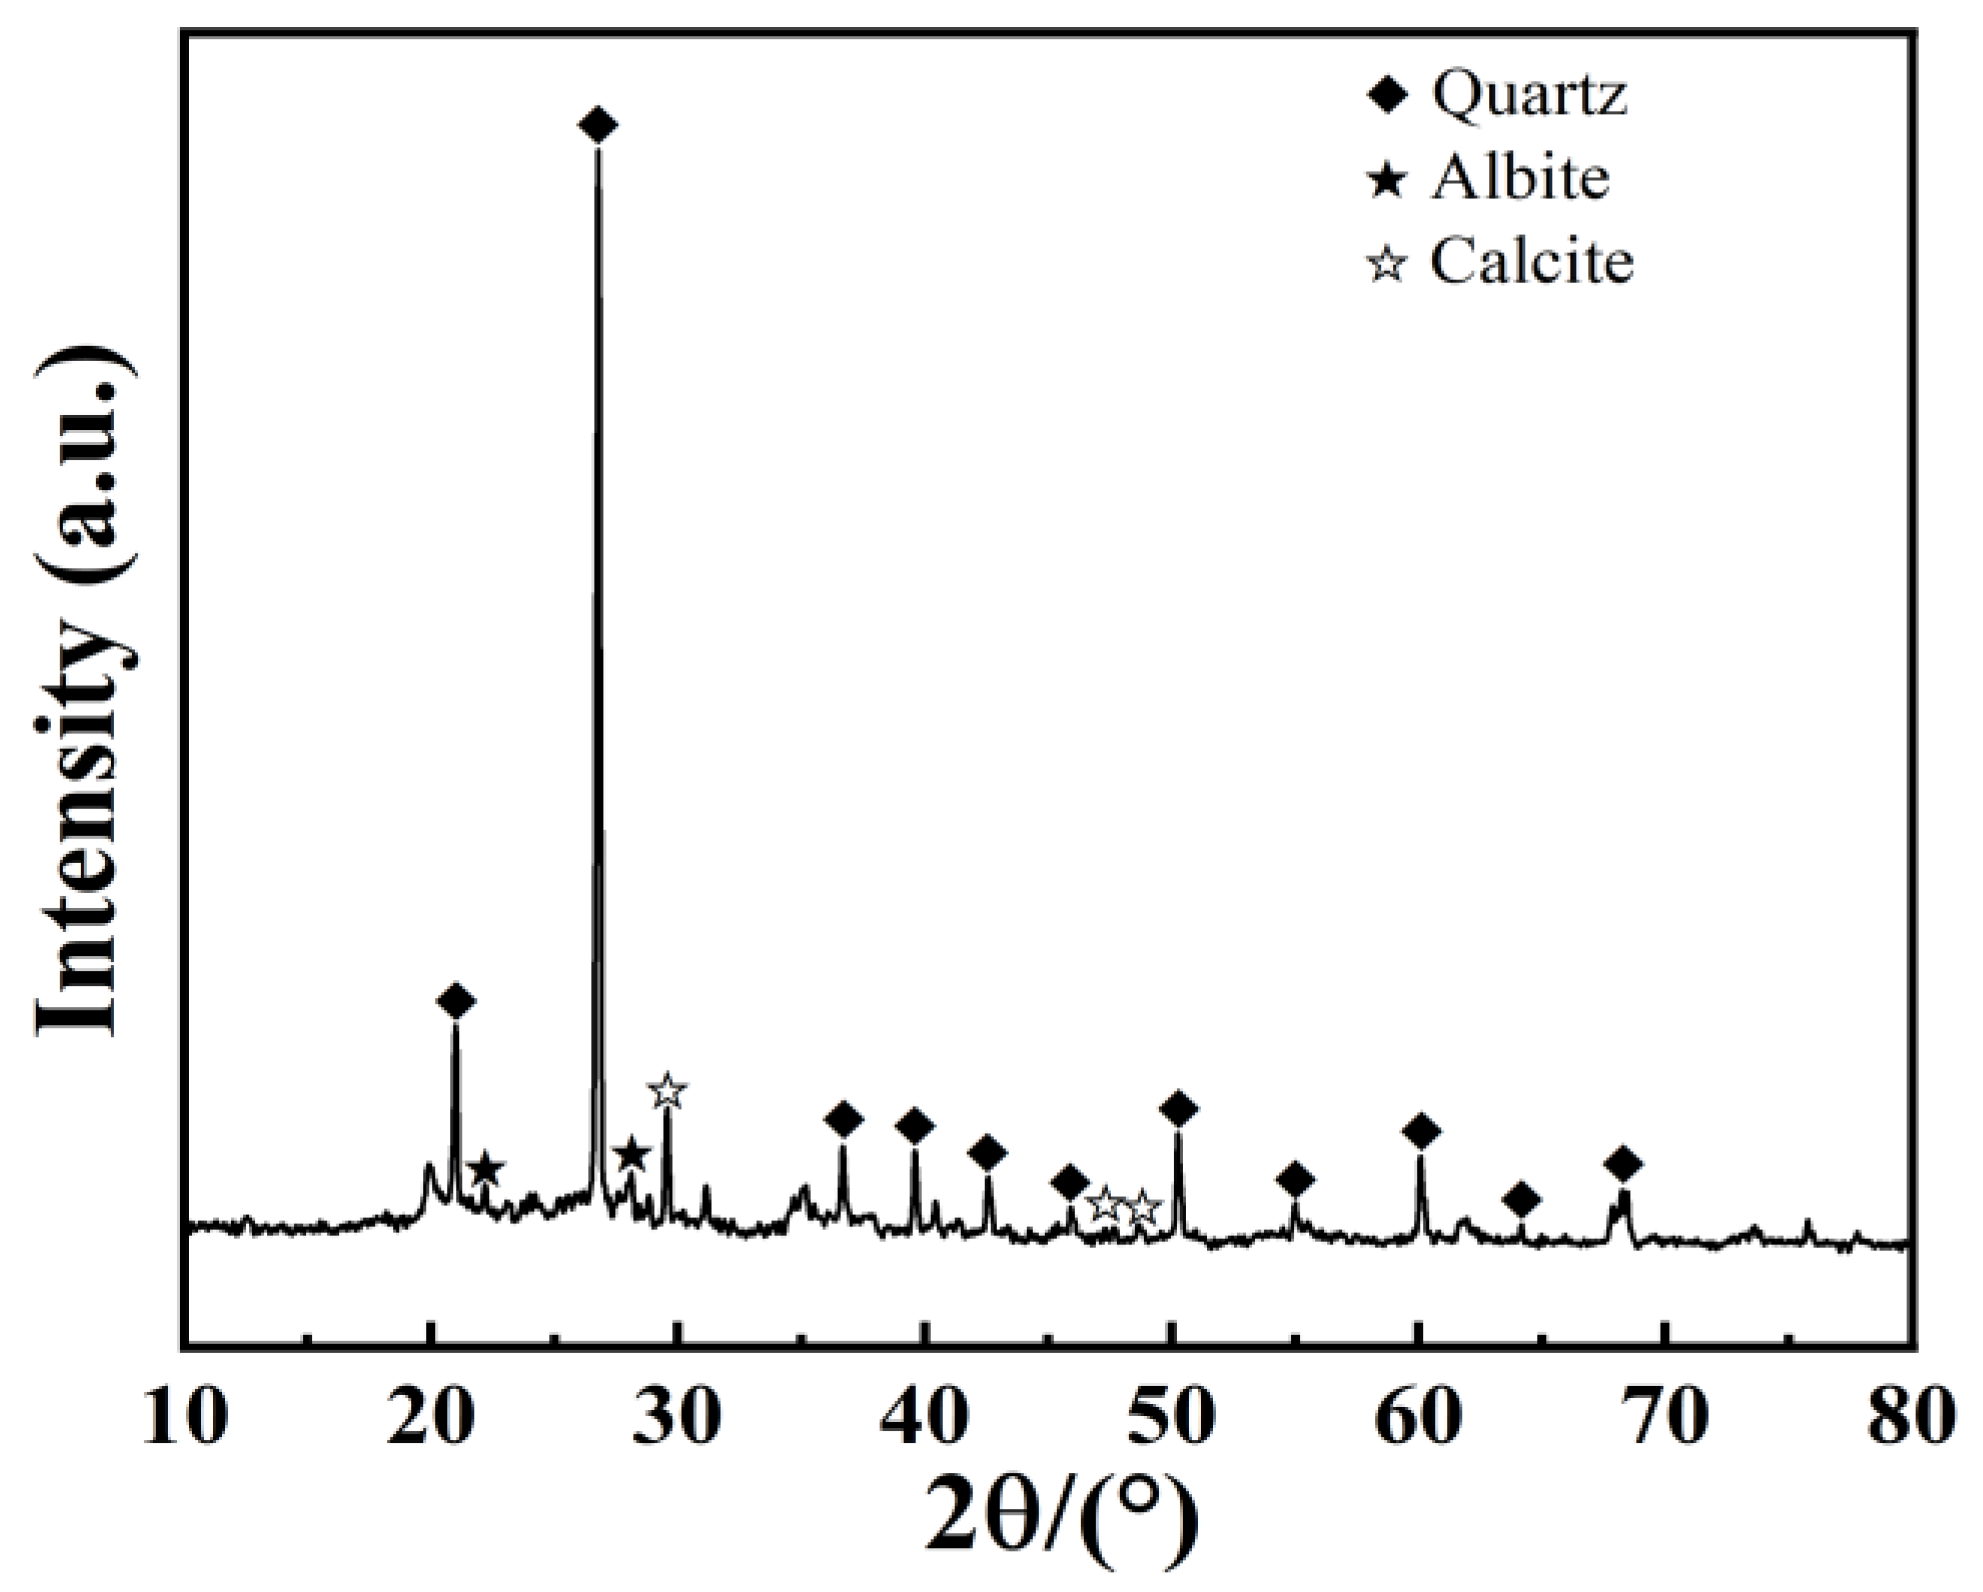
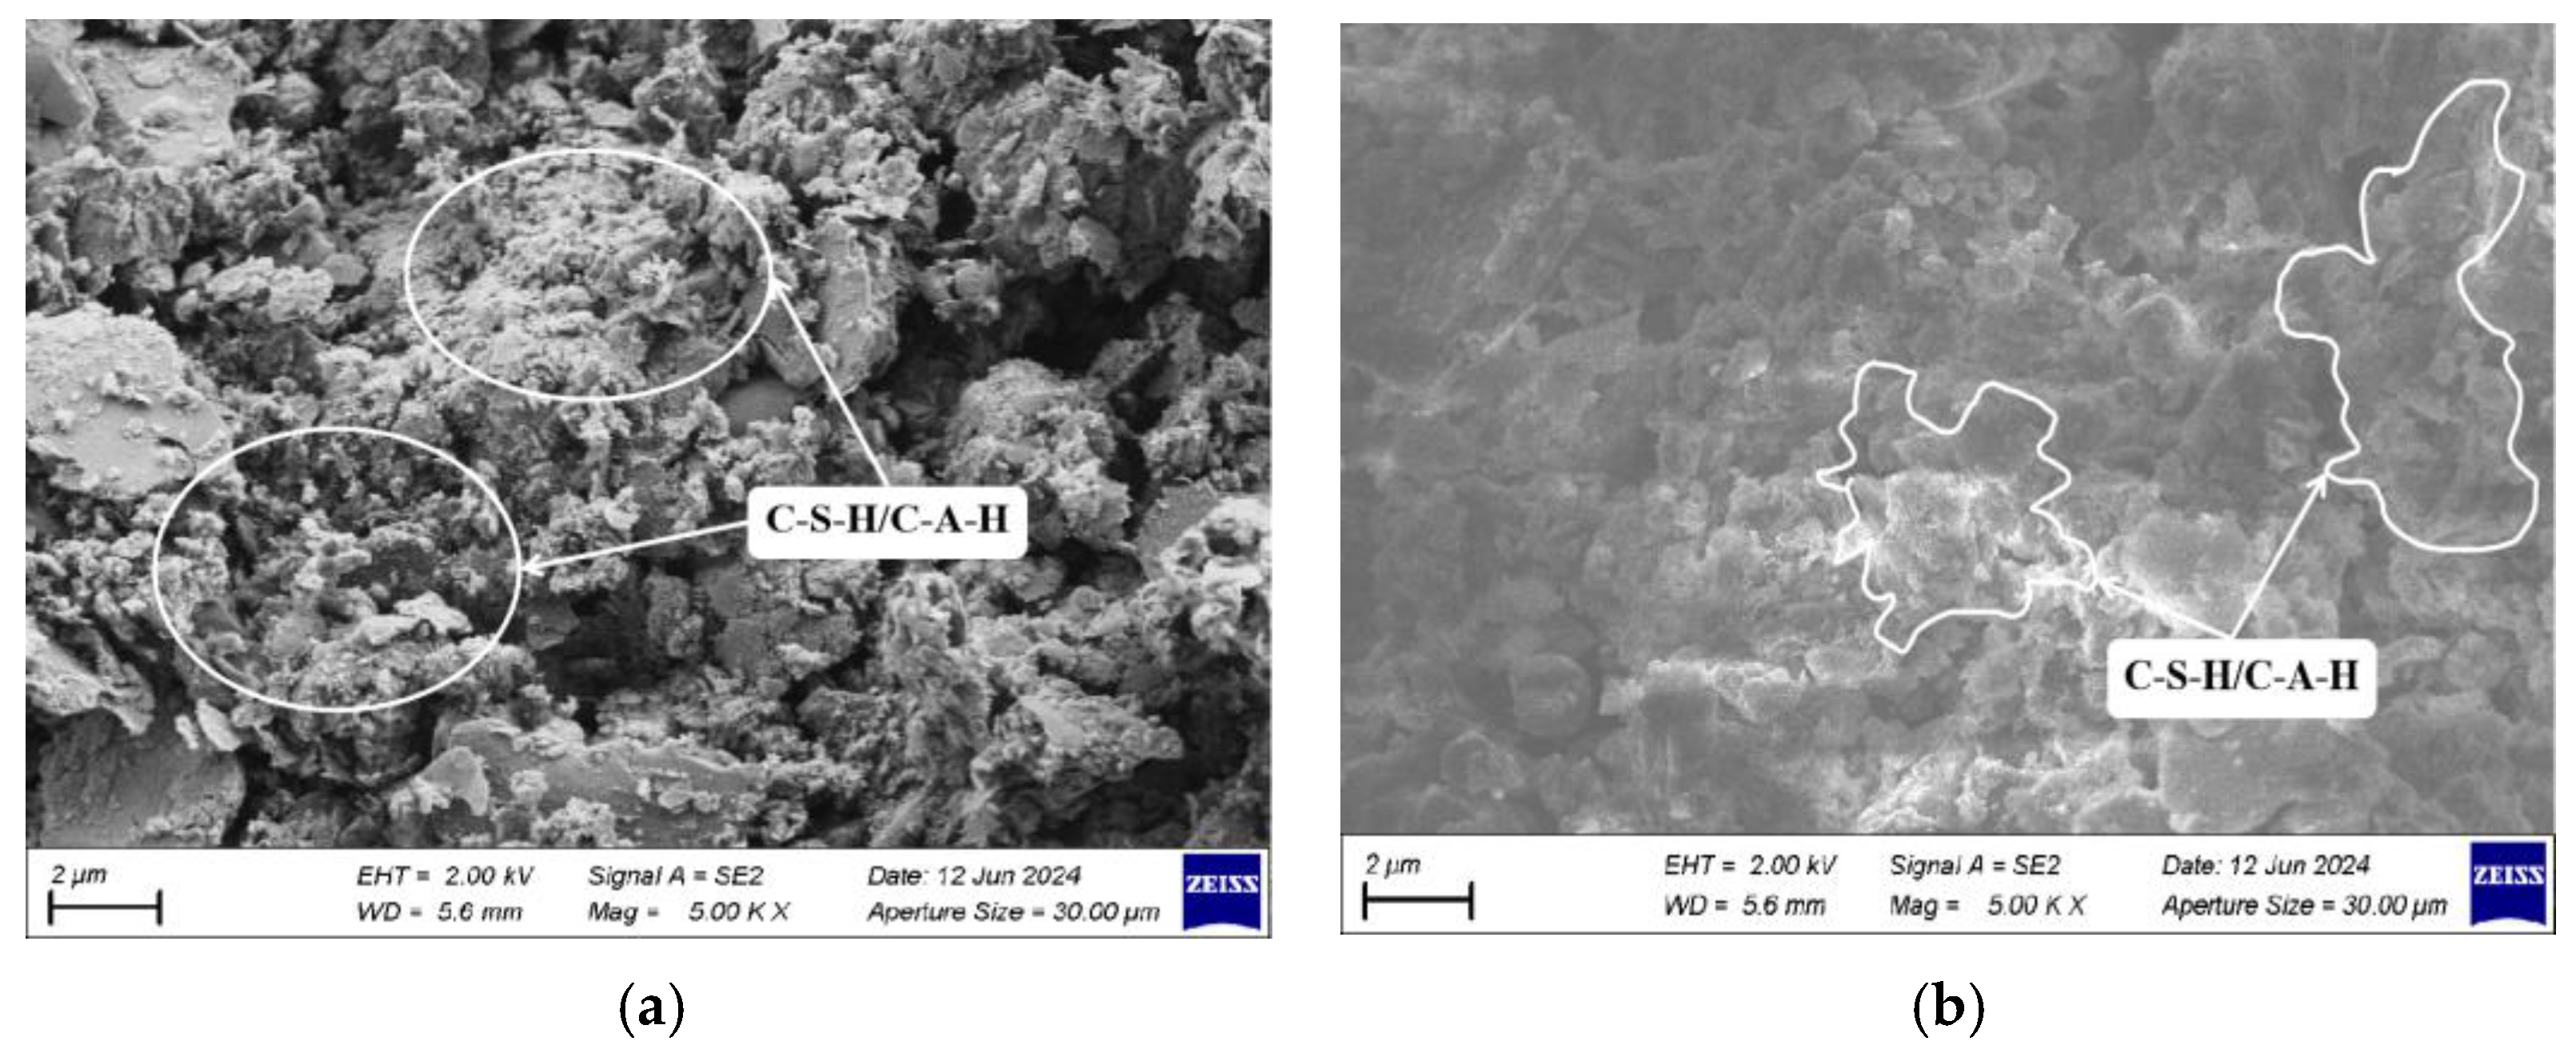
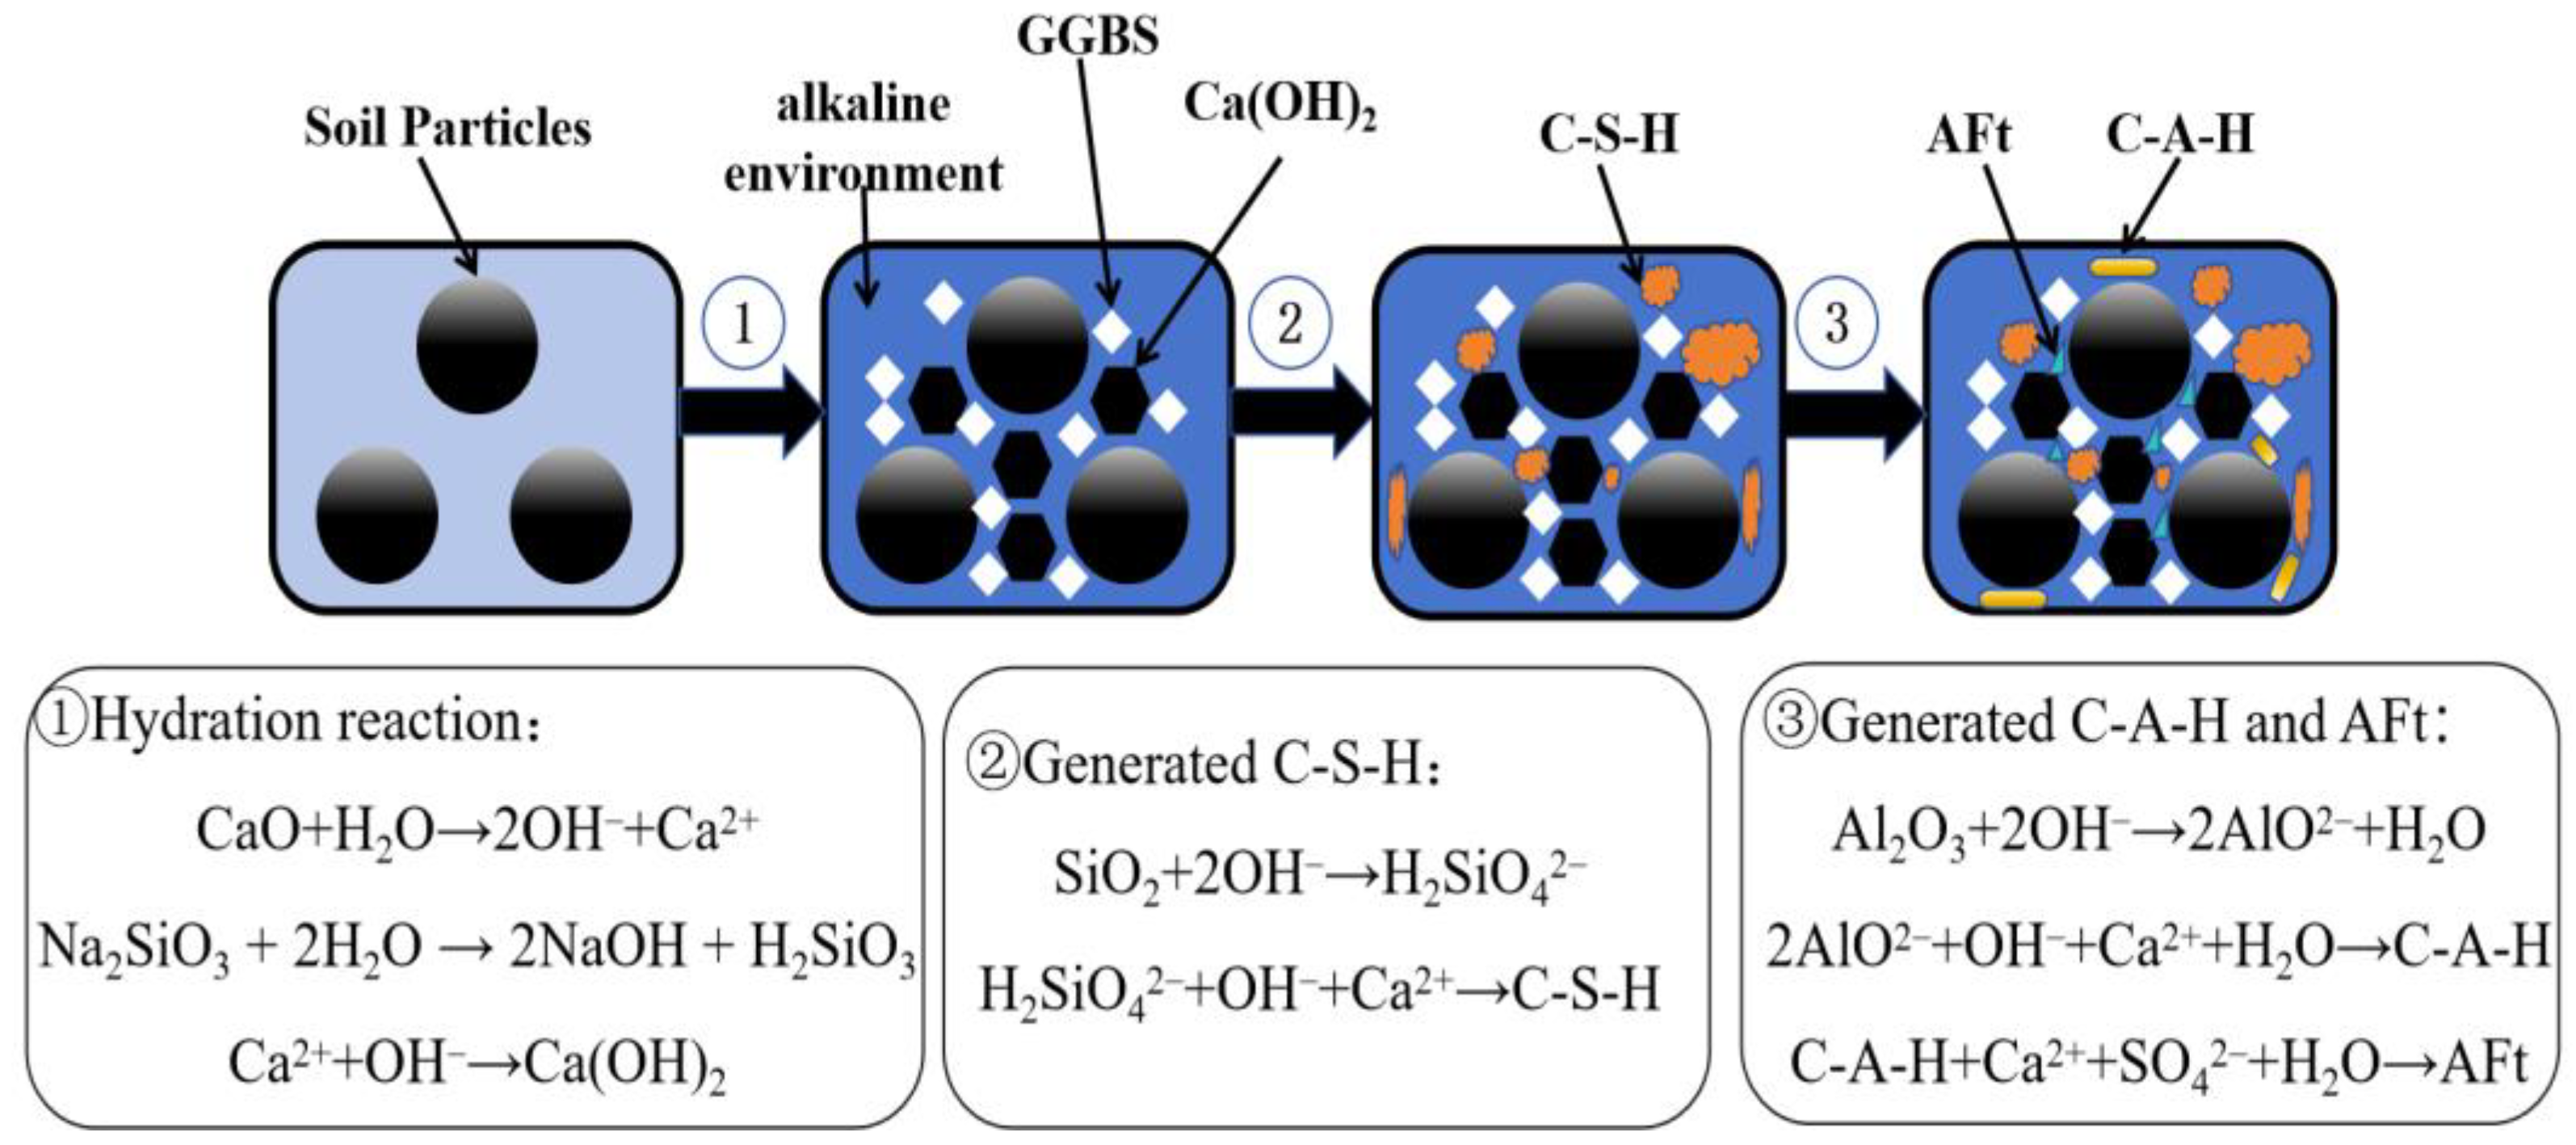
3.3. Analysis of Microstructural Characteristics and Mechanisms

X-ray diffraction (XRD) experiments were performed to analyze the alterations in hydration products under diverse curing conditions. The XRD spectrum illustrated in Figure 10 identifies quartz, albite, and calcite as the predominant components of the dredged silt.
The XRD spectrum of the GGBS-CaO-Na2O·nSiO2-stabilized dredged silt, displayed in Figure 11, indicates an enhanced composition of internal hydration products, extending beyond the foundational constituents of the original dredged silt, including quartz, albite, and calcite. Significantly, new hydration products such as calcium aluminate hydrate (C-A-H), portlandite (Ca(OH)2), calcium silicate hydrate (C-S-H), and ettringite (AFt) have been identified. When comparing the 28 d spectrum to the 7 d spectrum, a noticeable decrease in portlandite peaks and an increase in calcite peaks are observed, likely attributable to the consumption of portlandite by pozzolanic reactions and the enhancement of calcite through carbonation as curing progresses. This synergistic interaction within the GGBS-CaO-Na2O·nSiO2 binder system not only facilitates the formation of new hydration products but also substantially enhances the strength of the stabilized dredged silt. This phenomenon corresponds with the significant factor interactions observed in response surface testing, exemplifying the complex interplay among the components within the binder system.
Scanning electron microscopy (SEM) was used to investigate the microstructures of both dredged silt and stabilized dredged silt. The SEM image depicted in Figure 12 shows that the particles in the dredged silt are large and poorly interconnected, resulting in a structurally weak composition characterized by abundant pores and cracks. This configuration manifests macroscopically as subpar mechanical performance.
Figure 13a,b showcases the SEM images of dredged silt stabilized with an optimal mix of GGBS, CaO, and Na2O·nSiO2 at 7 and 28 d, respectively. The images explain that, as the curing time progresses, the gaps between soil particles diminish and the structural density escalates, thereby bolstering the overall integrity and compressive strength of the stabilized dredged silt samples. A substantial volume of white flocculent gel-like hydration products is observed adhering between the soil particles. These hydration products proliferate as the curing period extends, culminating in a more compact soil structure. This effect arises from the SiO2 and Al2O3 in both the dredged silt and GGBS gradually dissolving under the influence of the alkaline activators CaO and Na2O·nSiO2, subsequently reaggregating to yield copious flocculent cementitious materials, namely, C-S-H and C-A-H. These materials adhere to the glassy surfaces, enveloping the soil particles and effectively filling the inter-particle spaces. Additionally, acicular structures (AFt), observed within the pores, function as a framework supporting the soil particles, collaborating with the cementitious hydrates to effectively fill the voids, thereby creating a dense, net-like internal structure that enhances the ongoing improvement in the macroscopic mechanical strength of the stabilized soil. However, the presence of AFt observed in the images is limited, possibly due to the extensive formation of C-S-H and C-A-H, which may envelop or obscure the AFt.
Relative to the SEM image at 7 d, the stabilized dredged silt exhibits substantial changes by 28 d, reflecting the progression of hydration reactions. Na2O·nSiO2 compounds fully dissolve, enabling the resultant cementitious materials to overlap and progressively form extensive clumped and networked structures. As the boundaries between soil particles diminish, a compact aggregate materializes. This transformation consolidates the microstructure, significantly augmenting the macroscopic mechanical strength of the stabilized dredged silt.
Further analysis explored the impact of various factors on the microstructure of hydration products using SEM to examine stabilized dredged silt with differing slag contents in the 7 d response surface tests, as depicted in Figure 14. The SEM images from experimental groups S3 and S4, depicted in Figure 14a and Figure 14b, respectively, display differing mix ratios: S3 with 9% GGBS, 5% CaO, and 6% Na2O·nSiO2 and S4 with 15% GGBS, 5% CaO, and 6% Na2O·nSiO2. Figure 14b demonstrates a more significant presence of unreacted GGBS compared to Figure 14a. As the GGBS content increases, the micro-porosity between the particles of the stabilized silt diminishes, culminating in a denser soil structure. This densification occurs as Ca-O bonds in GGBS break more readily than Si-O and Al-O bonds, thereby liberating additional Ca2+ ions to accelerate the exothermic hydration reactions, hastening the initial dissolution and promoting the formation of supplementary C-S-H and C-A-H.
Figure 15a,b presents SEM images for experimental groups S2 and S4, with S2’s mixture comprising 15% GGBS, 3% CaO, and 6% Na2O·nSiO2. The images clearly demonstrate that an increase in the quantity of alkaline activators significantly reduces the porosity among the particles of stabilized dredged silt and intensifies the density of the white network gel interspersed among the particles. This effect stems from the elevated OH concentration resulting from increased alkaline activator usage, which accelerates the dissolution of silico-aluminate compounds in both GGBS and dredged silt. This enhancement in hydration reactions leads to the prolific creation of silicate aluminates. Using the adhesive properties of C-S-H and C-A-H, the overall structural integrity of the stabilized silt is substantially enhanced, rendering the strength of the S4 stabilized silt significantly superior to that of S1.
Based on the extensive XRD and SEM experiments, along with macroscopic testing, a micro-mechanism model for the GGBS-CaO-Na2O·nSiO2 stabilization of dredged silt has been developed, as illustrated in Figure 16. The stabilization involves several key processes:
Process ①: When the GGBS-CaO-Na2O·nSiO2 solidifier is incorporated into the dredged silt and thoroughly mixed, the CaO within the solidifier undergoes rapid hydration, releasing large amounts of Ca2+ and OH. Concurrently, Na2O·nSiO2 reacts with water to produce abundant OH and Na+. As the concentration of these ions rises, Na+ and K+ from the silt particles dissolve and engage in adsorption exchange with Ca2+, leading to a reduction in the double-layer thickness of the soil particles and decreasing their separation. This process results in flocculation and the formation of larger aggregates, enhancing the soil particles’ cohesion. Meanwhile, the less soluble flake-like product, Ca(OH)2, gradually precipitates, further enhancing the bonds between soil particles due to its hydration activity combined with the filling effects of GGBS particles. The marked increase in OH levels in the solution thus establishes an advantageous alkaline environment conducive to facilitating processes ② and ③.
Process ②: Under alkaline conditions, SiO2 in the dredged silt initially reacts with OH ions to form H2SiO42−. This compound then further reacts with OH and Ca2+ to generate the flocculent gel C-S-H. The C-S-H gel envelops and binds the soil particles, leading to the formation of larger particle aggregates.
Process ③: Under alkaline conditions, the activity of GGBS is enhanced, causing Al2O3 contained within it to undergo a hydration reaction with OH ions in the solution, forming AlO2−. This ion then combines with Ca2+ to create the flocculent gel C-A-H, which serves as a binder for the soil particles. Additionally, C-A-H reacts with SO42− present in the dredged silt, leading to the formation of needle-like structures known as AFt.
Overall, the stabilization of dredged silt via GGBS-CaO-Na2O·nSiO2 is propelled by the binding properties of C-S-H and C-A-H, coupled with the filling actions of Ca(OH)2 and AFt. These components synergistically transform the loose soil into a dense aggregate, significantly enhancing its stability and mechanical strength.

4. Conclusions

To facilitate the resource utilization of dredged silt and industrial waste, it is stabilized using blast furnace slag, activated calcium oxide, and sodium silicate. The stabilization and micro-mechanisms of GGBS-CaO-Na2O·nSiO2 composite materials were investigated through single-addition tests, response surface methodology, X-ray diffraction, and scanning electron microscopy experiments. The main conclusions are as follows:
(1)
In the single-addition experiments, CaO showed the most significant stabilization effect, characterized by rapid hydration reactions and early strength development; the stabilization effect of GGBS was substantially lower than that of CaO, with a gradual increase in strength over the curing period; Na2O·nSiO2 only slightly improved the strength of the stabilized soil at dosages below 6%, with most strength gains occurring in the later stages of curing.
(2)
Based on response surface methodology, regression fitting and significance analysis of the experimental results yielded regression equations for the 7 d and 28 d compressive strengths of the stabilized silt, revealing significant interactions between GGBS-CaO and GGBS-Na2O·nSiO2. Optimization of the regression equations determined the optimal mix proportions for the GGBS-CaO-Na2O·nSiO2 interaction affecting the stabilized silt to be 11.5% GGBS, 4.1% CaO, and 5.9% Na2O·nSiO2.
(3)
The hydration reactions within the GGBS-CaO-Na2O·nSiO2 composite binder system are mutually enhancing, producing hydration products such as Ca(OH)2, C-S-H, C-A-H, and AFt in an alkaline environment. These products encapsulate, bind, and fill, stabilizing the microstructure of the soil.

Author Contributions

Conceptualization, Q.H. and W.Y.; Methodology, Q.H. and W.Y.; Validation, W.Y. and G.T.; Writing—original draft, Q.H. and W.Y.; Writing—review and editing, W.Y. and G.T.; funding acquisition, Q.H. All authors have read and agreed to the published version of the manuscript.

Funding

This study was supported by the National Natural Science Foundation of China (52078195) and the Scientific Research Program Funded by Key Projects of the National Self Science Foundation (U22A20232).

Institutional Review Board Statement

Not applicable.

Informed Consent Statement

Not applicable.

Data Availability Statement

All data generated or analyzed during this study are included in this published article.

Conflicts of Interest

The authors declare no conflicts of interest.

References

  1. Liu, H.; Zhao, M. Review of ground improvement technical and its application in China. J. China Civ. Eng. J. 2016, 49, 96–115. [Google Scholar]
  2. Zhang, C.; Guan, F.; Li, L.; Huang, Y. The progress in the reutillzation treatment and disposal of dredged sediments in China. J. Environ. Eng. 2014, 32, 95–99. [Google Scholar]
  3. Xu, R.Q.; Zhu, K.L.; Hang, G.W.; Yan, Z.; Zhang, G.; Yan, J.; Zhang, M.; Zhang, B. Experimental study on solidification and road performance of mucky soil. J. Hunan Univ. (Nat. Sci.) 2022, 49, 167–174. [Google Scholar]
  4. Gu, C.; Wang, L.W.; Wang, J.; Zhang, T.; Cai, Y.; Lin, G. Model test study on negative friction of single pile in underconsolidated soft clay foundation under different initial moisture content. J. Chin. J. Rock Mech. Eng. 2022, 41, 2554–2566. [Google Scholar]
  5. Ruan, Q.; Ruan, B.; Zeng, Y.; Wen, K.; Li, X. Experimental research on mechanical properties of cement stabilized muddy clay from Dong-ting Lake area. J. Railw. Sci. Eng. 2014, 11, 106–111. [Google Scholar]
  6. Chen, M.; Yang, G.; Xu, F. Research progress on solidification treatment of dredged silt. J. South-North Water Transf. Water Sci. Technol. 2018, 16, 128–138. [Google Scholar]
  7. Sun, H.; Wang, W.; Ling, D. Mechanical properties and microstructure of solidified soil with low cement content. J. Zhejiang Univ. (Eng. Sci.) 2021, 55, 530–538. [Google Scholar]
  8. Tang, Y.; Liu, H.; Zhu, W. Study on engineering properties of cement-stabilized soil. J. Chin. J. Geotech. Eng. 2000, 22, 549–554. [Google Scholar]
  9. Huang, Y.; Zhu, W.; Zhang, C.; Wang, W. Mechanical characteristics and strength source of remolded solidified dredged material. J. Rock Soil Mech. 2009, 30, 1352–1356. [Google Scholar]
  10. Pan, C.; Xie, X.; Gen, J.; Wang, W. Effect of stabilization/solidification on mechanical and phase characteristics of organic river silt by a stabilizer. J. Constr. Build. Mater. 2020, 236, 117538. [Google Scholar] [CrossRef]
  11. Saini, G.; Vattipalli, U. Assessing properties of alkali activated GGBS based self-compacting geopolymer concrete using nano-silica. J. Case Stud. Constr. Mater. 2020, 12, e00352. [Google Scholar] [CrossRef]
  12. Li, L.; Han, Q.; Yang, X.; Xiao, H.; Li, W.T.; Huang, S.P. Mechanical properties and micro-mechanisms of RHA-cement solidified sludge. J. China Civ. Eng. J. 2023, 56, 166–176. [Google Scholar]
  13. Yu, C.; Zhang, L.; Zheng, D.; Yang, F. Research progress of geopolymer materials prepared from solid waste and their applications. Sci. Sin. Technol. 2022, 52, 529–546. [Google Scholar] [CrossRef]
  14. Chen, R.; Jian, W.; Zhang, X.; Fang, Z.H. Experimental study on performance of sludge stabilized by CSFG-FR synergy. J. Rock Soil Mech. 2022, 43, 1020–1030. [Google Scholar]
  15. Amar, M.; Benzerzour, M.; Kleib, J.; Abriak, N.E. From dredged sediment to supplementary cementitious material: Characterization, treatment, and reuse. J. Int. J. Sediment Res. 2021, 36, 92–109. [Google Scholar] [CrossRef]
  16. Lv, O.F.; Wang, Z.S.; Gu, L.Y.; Chen, Y.; Shan, X.K. Effect of sodium sulfate on strength and microstructure of alkali-activated fly ash based geopolymer. J. Cent. South Univ. 2020, 27, 1691–1702. [Google Scholar] [CrossRef]
  17. Liu, R.; Ding, S.; Yan, P. Influence of Hydration Environment on the Characteristics of Ground Granulated Blast Furnace Slag Hydration Products. J. Bull. Chin. Ceram. Soc. 2015, 52, 1594–1599. [Google Scholar]
  18. Yi, Y.; Zheng, X.; Liu, S.; Al-Tabbaa, A. Comparison of reactive magnesia- and carbide slag-activated ground granulated blast furnace slag and Portland cement for stabilisation of a natural soil. J. Appl. Clay Sci. 2015, 111, 21–26. [Google Scholar] [CrossRef]
  19. Liang, S.; Dai, J.; Niu, J.; Wang, M.; Wang, L.; Dong, J. Solidification of additives for zinc-contaminated silt. J. Adv. Mech. Eng. 2018, 10, 1–13. [Google Scholar] [CrossRef]
  20. He, J.; Wang, X.; Shi, X.; Su, Z. Unconfined compressive strength and microscopic characteristics of soft soil solidified with soda residue and ground granulated blast furnace slag. J. Basic Sci. Eng. 2021, 29, 376–386. [Google Scholar]
  21. Dong, C.H.; Xie, X.Q.; Wang, X.L.; Zhan, Y.; Yao, Y.J. Application of Box-Behnken design in optimisation for polysaccharides extraction from cultured mycelium of Cordyceps sinensis. J. Food Bioprod. Process. 2009, 87, 139–144. [Google Scholar] [CrossRef]
  22. Asadzadeh, S.; Khoshbayan, S. Multi-objective optimization of influential factors on production process of foamed concrete using Box-Behnken approach. J. Constr. Build. Mater. 2018, 170, 101–110. [Google Scholar] [CrossRef]
  23. GB/T 50123-2019; Standard for Geotechnical Testing Methods. National Standard: Beijing, China, 2019.
  24. Bilim, C.; Karahan, O.; Atis, C.D.; Ilkentapar, S. Influence of admixtures on the properties of alkali-activated slag mortars subjected to different curing conditions. J. Mater. Des. 2013, 44, 540–547. [Google Scholar] [CrossRef]
  25. JTG/TF20-2015; Pavement Base Construction Technical Instructions. National Standards of the People’s Republic of China: Beijing, China, 2015.
  26. Cai, G.; Zhou, Y.; Poon, C.S.; Li, J.S. Physical and mechanical performance of quicklime-activated GGBS stabilized marine sediment at high water content. J. Rock Soil Mech. 2022, 43, 327–336. [Google Scholar]
  27. Li, S.; Zhang, H.; Wang, G.; Deng, R. Experimental study of alkali-activated geopolymer cured silty soil based on response surface method. J. Bull. Chin. Ceram. Soc. 2023, 42, 4438–4448. [Google Scholar]
Figure 1. Dredged silt. (a) Undisturbed dredged silt and (b) dried dredged silt.
Materials 17 04410 g001
Figure 2. Particle grading curve of GGBS and dredged silt.
Materials 17 04410 g002
Figure 3. (a) Preparation of specimens, and (b) unconfined compressive strength testing.
Materials 17 04410 g003
Figure 4. UCS of single-addition stabilized dredged silt: (a) GGBS, (b) CaO, and (c) Na2O·nSiO2.
Materials 17 04410 g004
Figure 5. Surface of mutual influence for three factors on 7 d UCS strength: (a) AB, (b) AC, and (c) BC.
Materials 17 04410 g005aMaterials 17 04410 g005b
Figure 6. Contour plots of mutual influence for three factors on 7 d UCS strength: (a) AB, (b) AC, and (c) BC.
Materials 17 04410 g006
Figure 7. The surface of mutual influence for three factors on 28 d UCS strength: (a) AB, (b) AC, and (c) BC.
Materials 17 04410 g007
Figure 8. Contour plots of mutual influence for three factors on 28 d UCS strength: (a) AB, (b) AC, and (c) BC.
Materials 17 04410 g008
Figure 9. Comparison of predicted compressive strength with actual value; (a) 7 d, (b) 28 d, and (c) optimal ratio.
Materials 17 04410 g009
Figure 10. XRD of dredged silt.
Materials 17 04410 g010
Figure 11. XRD of stabilized dredged silt at 7 and 28 d under the optimal ratio.
Materials 17 04410 g011
Figure 12. SEM image of dredged silt (2000 times).
Materials 17 04410 g012
Figure 13. SEM images of stabilized dredged silt under the optimal ratio (10,000 times): (a) 7 d and (b) 28 d.
Materials 17 04410 g013
Figure 14. SEM images of stabilized dredged silt with different GGBS contents (2000 times): (a) S3 and (b) S4.
Materials 17 04410 g014
Figure 15. SEM images of stabilized dredged silt with different alkali-activator contents (5000 times): (a) S2 and (b) S4.
Materials 17 04410 g015
Figure 16. Microscopic mechanism model of stabilized dredged silt.
Materials 17 04410 g016
Table 1. Basic physical properties and indexes of dredged silt.
Moisture Content/%Relative
Density
Liquid
Limit/%
Plastic Limit/%Plasticity
Index
Liquidity
Index
59.22.6146.125.920.21.64
% is a mass fraction.
Table 2. Main chemical components of the experimental materials.
MaterialsMass Fraction/%
CaOSiO2Al2O3SO3Fe2O3
Dredged silt3.262.619.51.36.5
GGBS42.033.012.01.671.0
Table 3. Single-addition test scheme.
Stabilizing AgentsAdditive Percentage/%Curing Period (Days)
GGBS3, 6, 9, 12, 157, 14, 28
CaO2, 3, 4, 5, 6
Na2O·nSiO22, 4, 6, 8, 10
Table 4. Response surface design scheme.
Independent VariableCode Level
−101
A (GGBS)/%9.0012.0015.00
B (CaO)/%3.004.005.00
C (Na2O·nSiO2)/%4.006.008.00
Table 5. Regression model coefficient and significance.
SampleIndependent VariableResponse Value
A/%B/%C/%Y7d/kPaY28d/kPa
1−1−10561785
21−10395763
3−110511875
4110593800
5−10−1495940
610−1492757
7−101551795
8101505801
90−1−1466762
1001−1491896
110−11500760
12011533825
130006951014
140006581013
150006771024
160006951013
170006771048
Table 6. Regression model coefficient and significance.
Source of VarianceY7dY28d
CoefficientF-Valuep-ValueCoefficientF-Valuep-Value
Model680.448.31<0.00011022.461.02<0.0001
A−16.627.290.0306−34.2526.80.0013
B25.7517.490.004140.7537.940.0005
C18.138.670.0216−21.7510.810.0133
AB62.0050.70.0002−13.252.010.1997
AC−10.751.520.256847.2525.50.0015
BC2.000.0530.8249−17.253.40.1078
A2−76.0880.35<0.0001−102.08125.28<0.0001
B2−89.33110.77<0.0001−114.58157.85<0.0001
C2−93.57121.57<0.0001−97.07113.31<0.0001
R20.98420.9874
Table 7. Model reliability test analysis.
GroupStd.Dev
/kPa
Mean/kPaR2Adjusted R2Predicted R2C.V./%Adequate Precision
7 d17.41558.530.98420.96380.84903.1220.198
28 d18.71874.760.98740.97120.86572.1419.398
Table 8. Model reliability test analysis.
A/%B/%C/%28 d7 d
Yp/kPaYa/kPaD/%Yp/kPaYa/kPaD/%
11.54.15.9683.4703.42.921032.41066.33.30
D = | Y a Y p | Y a × 100 % (4)
Note: Ya: actual value, Yp: predicted value.
Disclaimer/Publisher’s Note: The statements, opinions and data contained in all publications are solely those of the individual author(s) and contributor(s) and not of MDPI and/or the editor(s). MDPI and/or the editor(s) disclaim responsibility for any injury to people or property resulting from any ideas, methods, instructions or products referred to in the content.

