
Study on the Combined Effect of Municipal Solid Waste Incineration Bottom Ash and Waste Shingle in Hot Mix Asphalt


Abstract
:1. Introduction

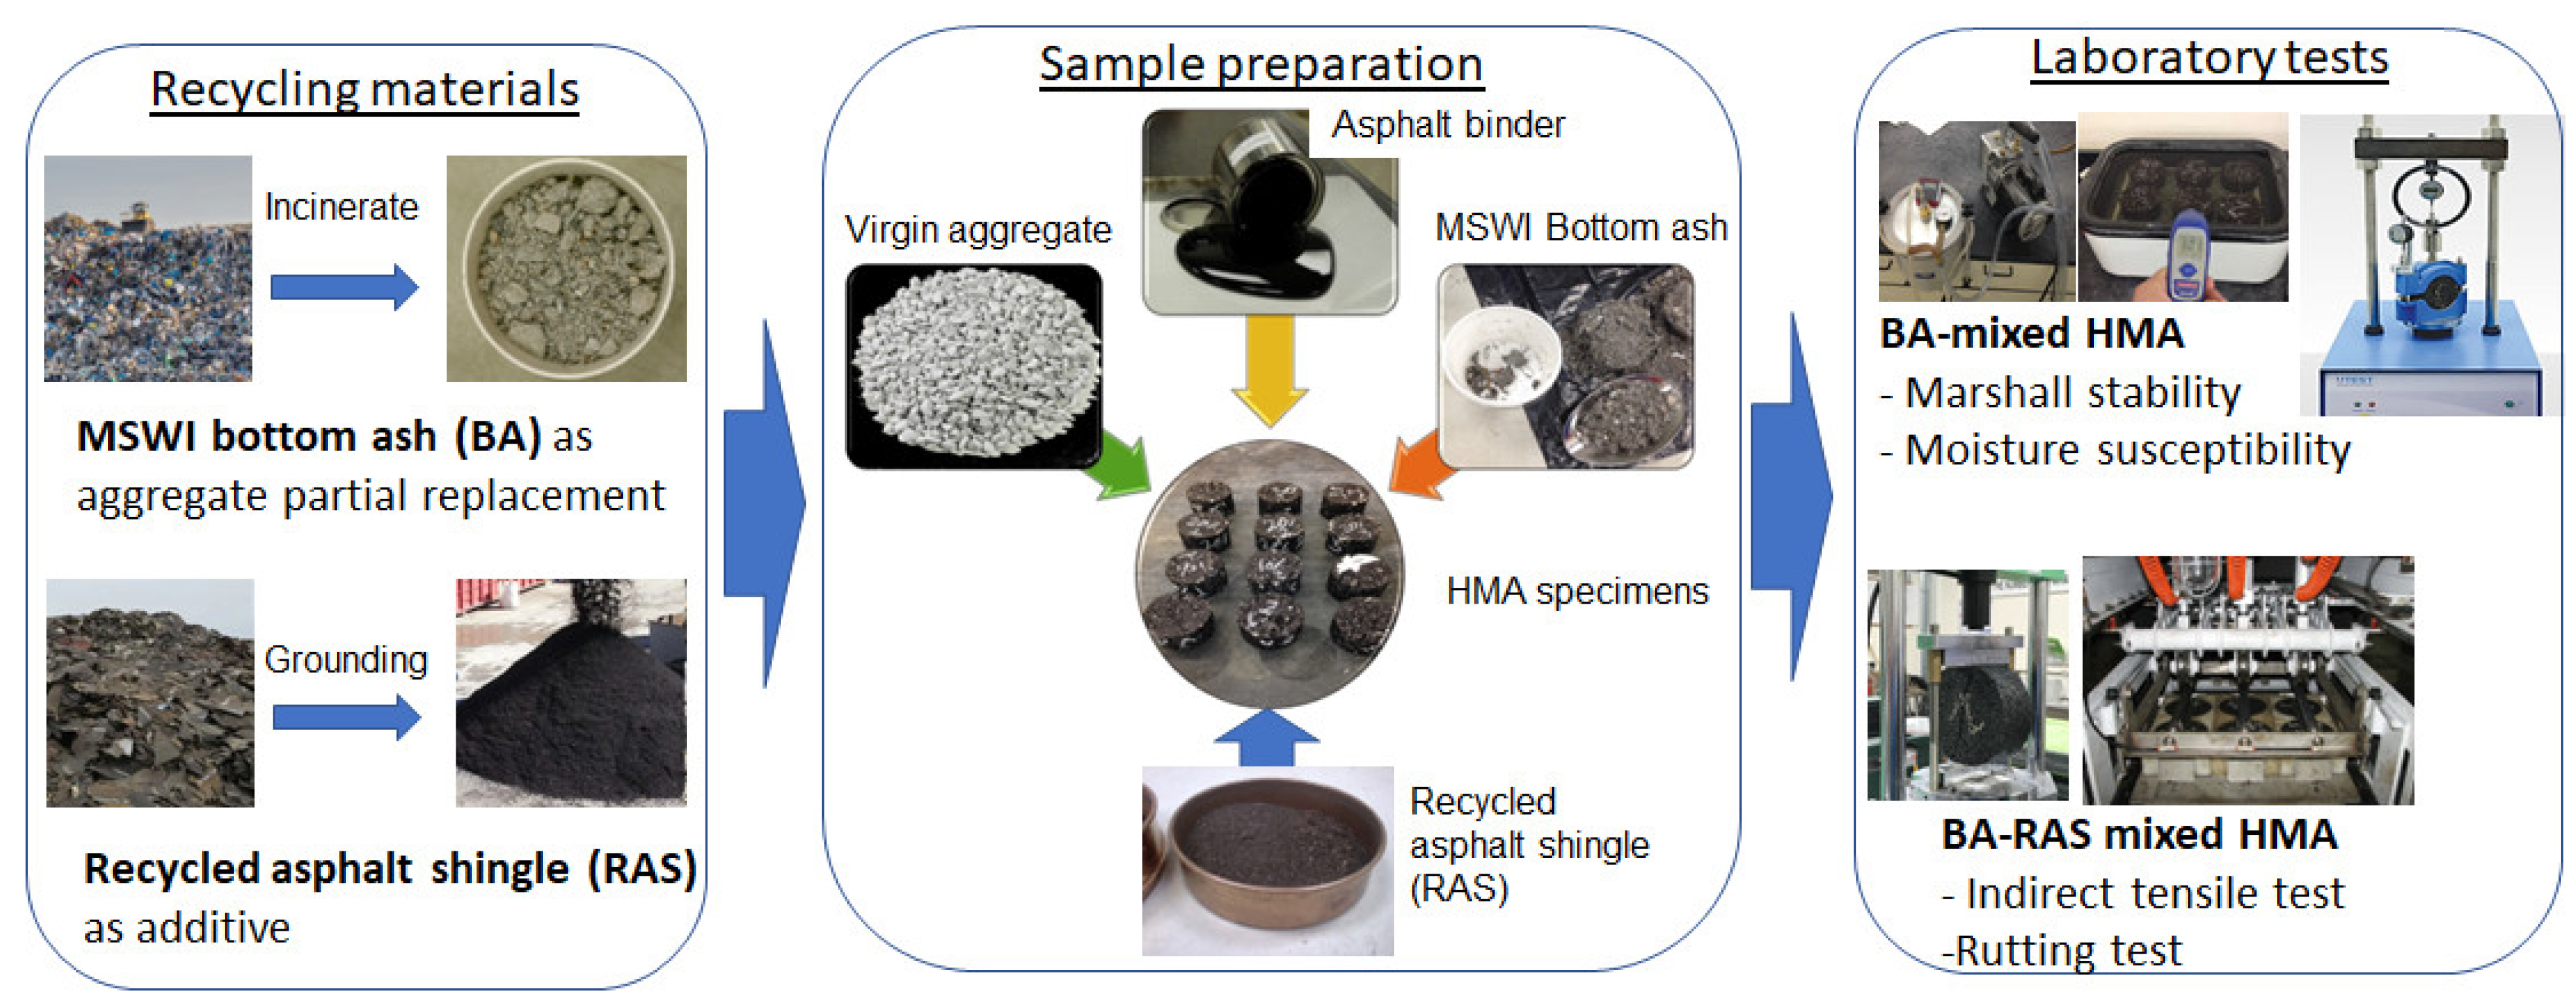
2. Methodology and Scope
3. Materials
3.1. Asphalt Binder
3.2. Aggregate and Recycling Materials
4. Specimen Preparation
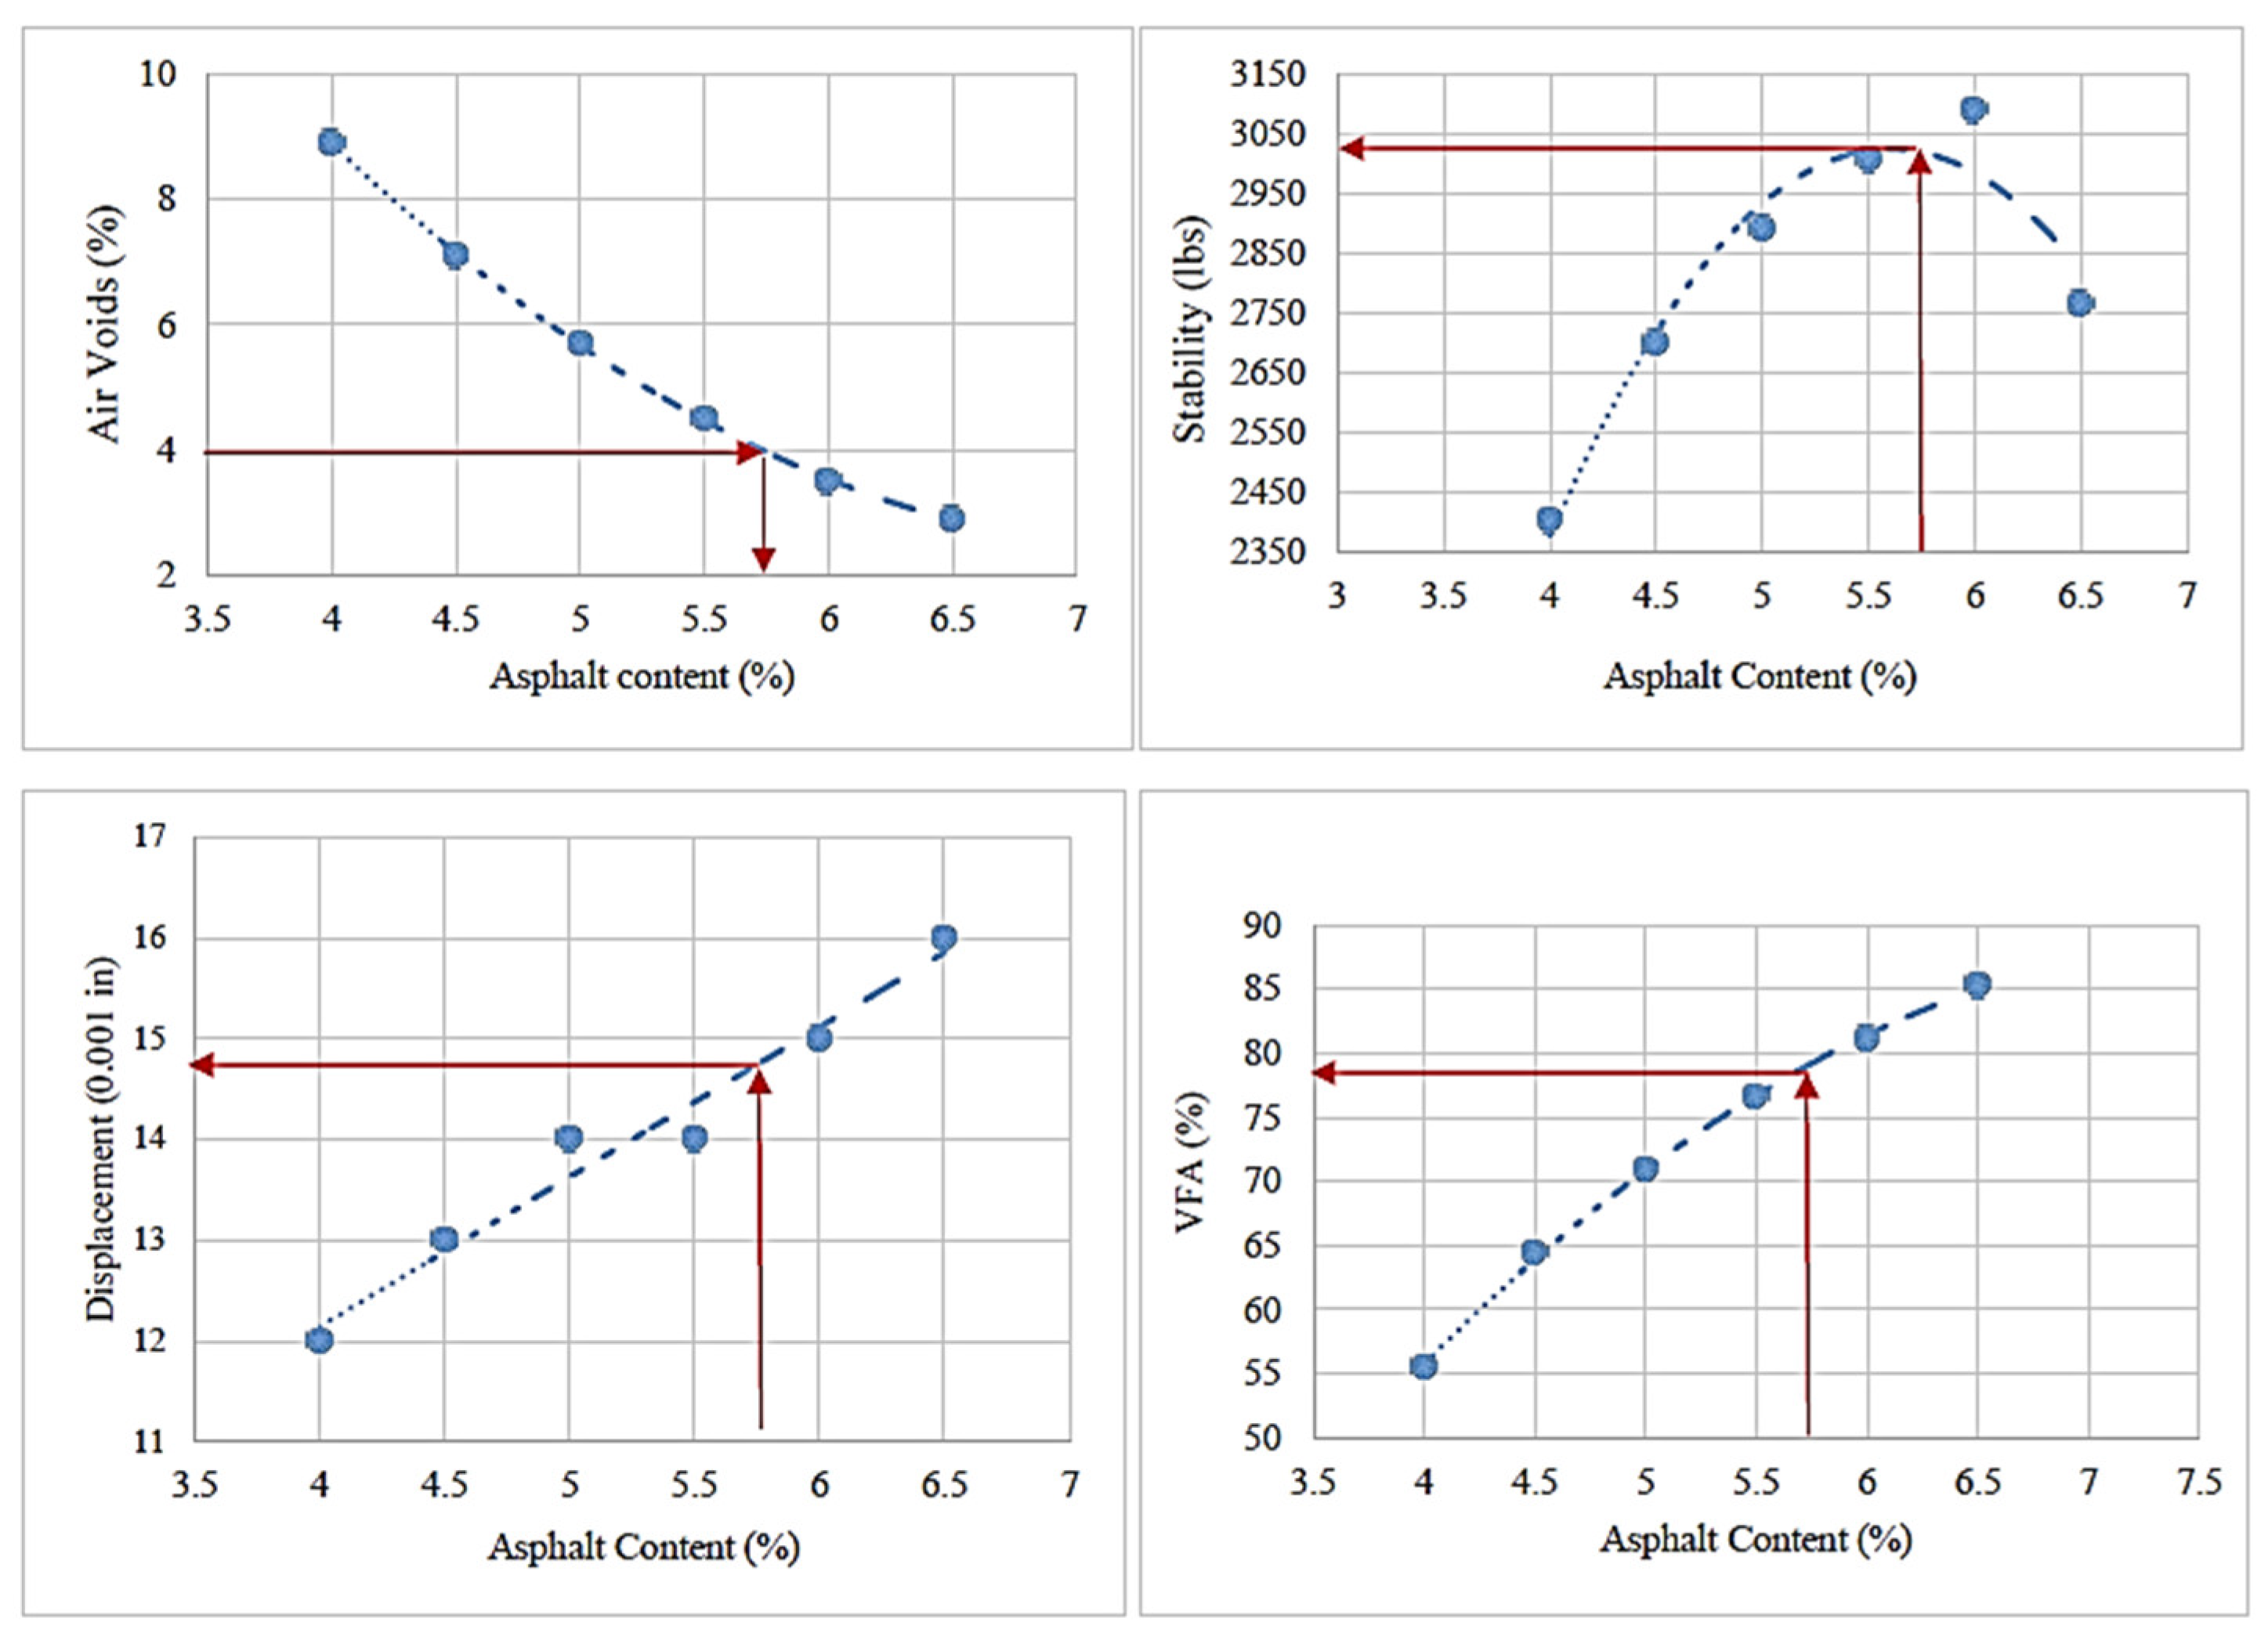
4.1. Control HMA Specimen
Optimum Binder Content (OBC)
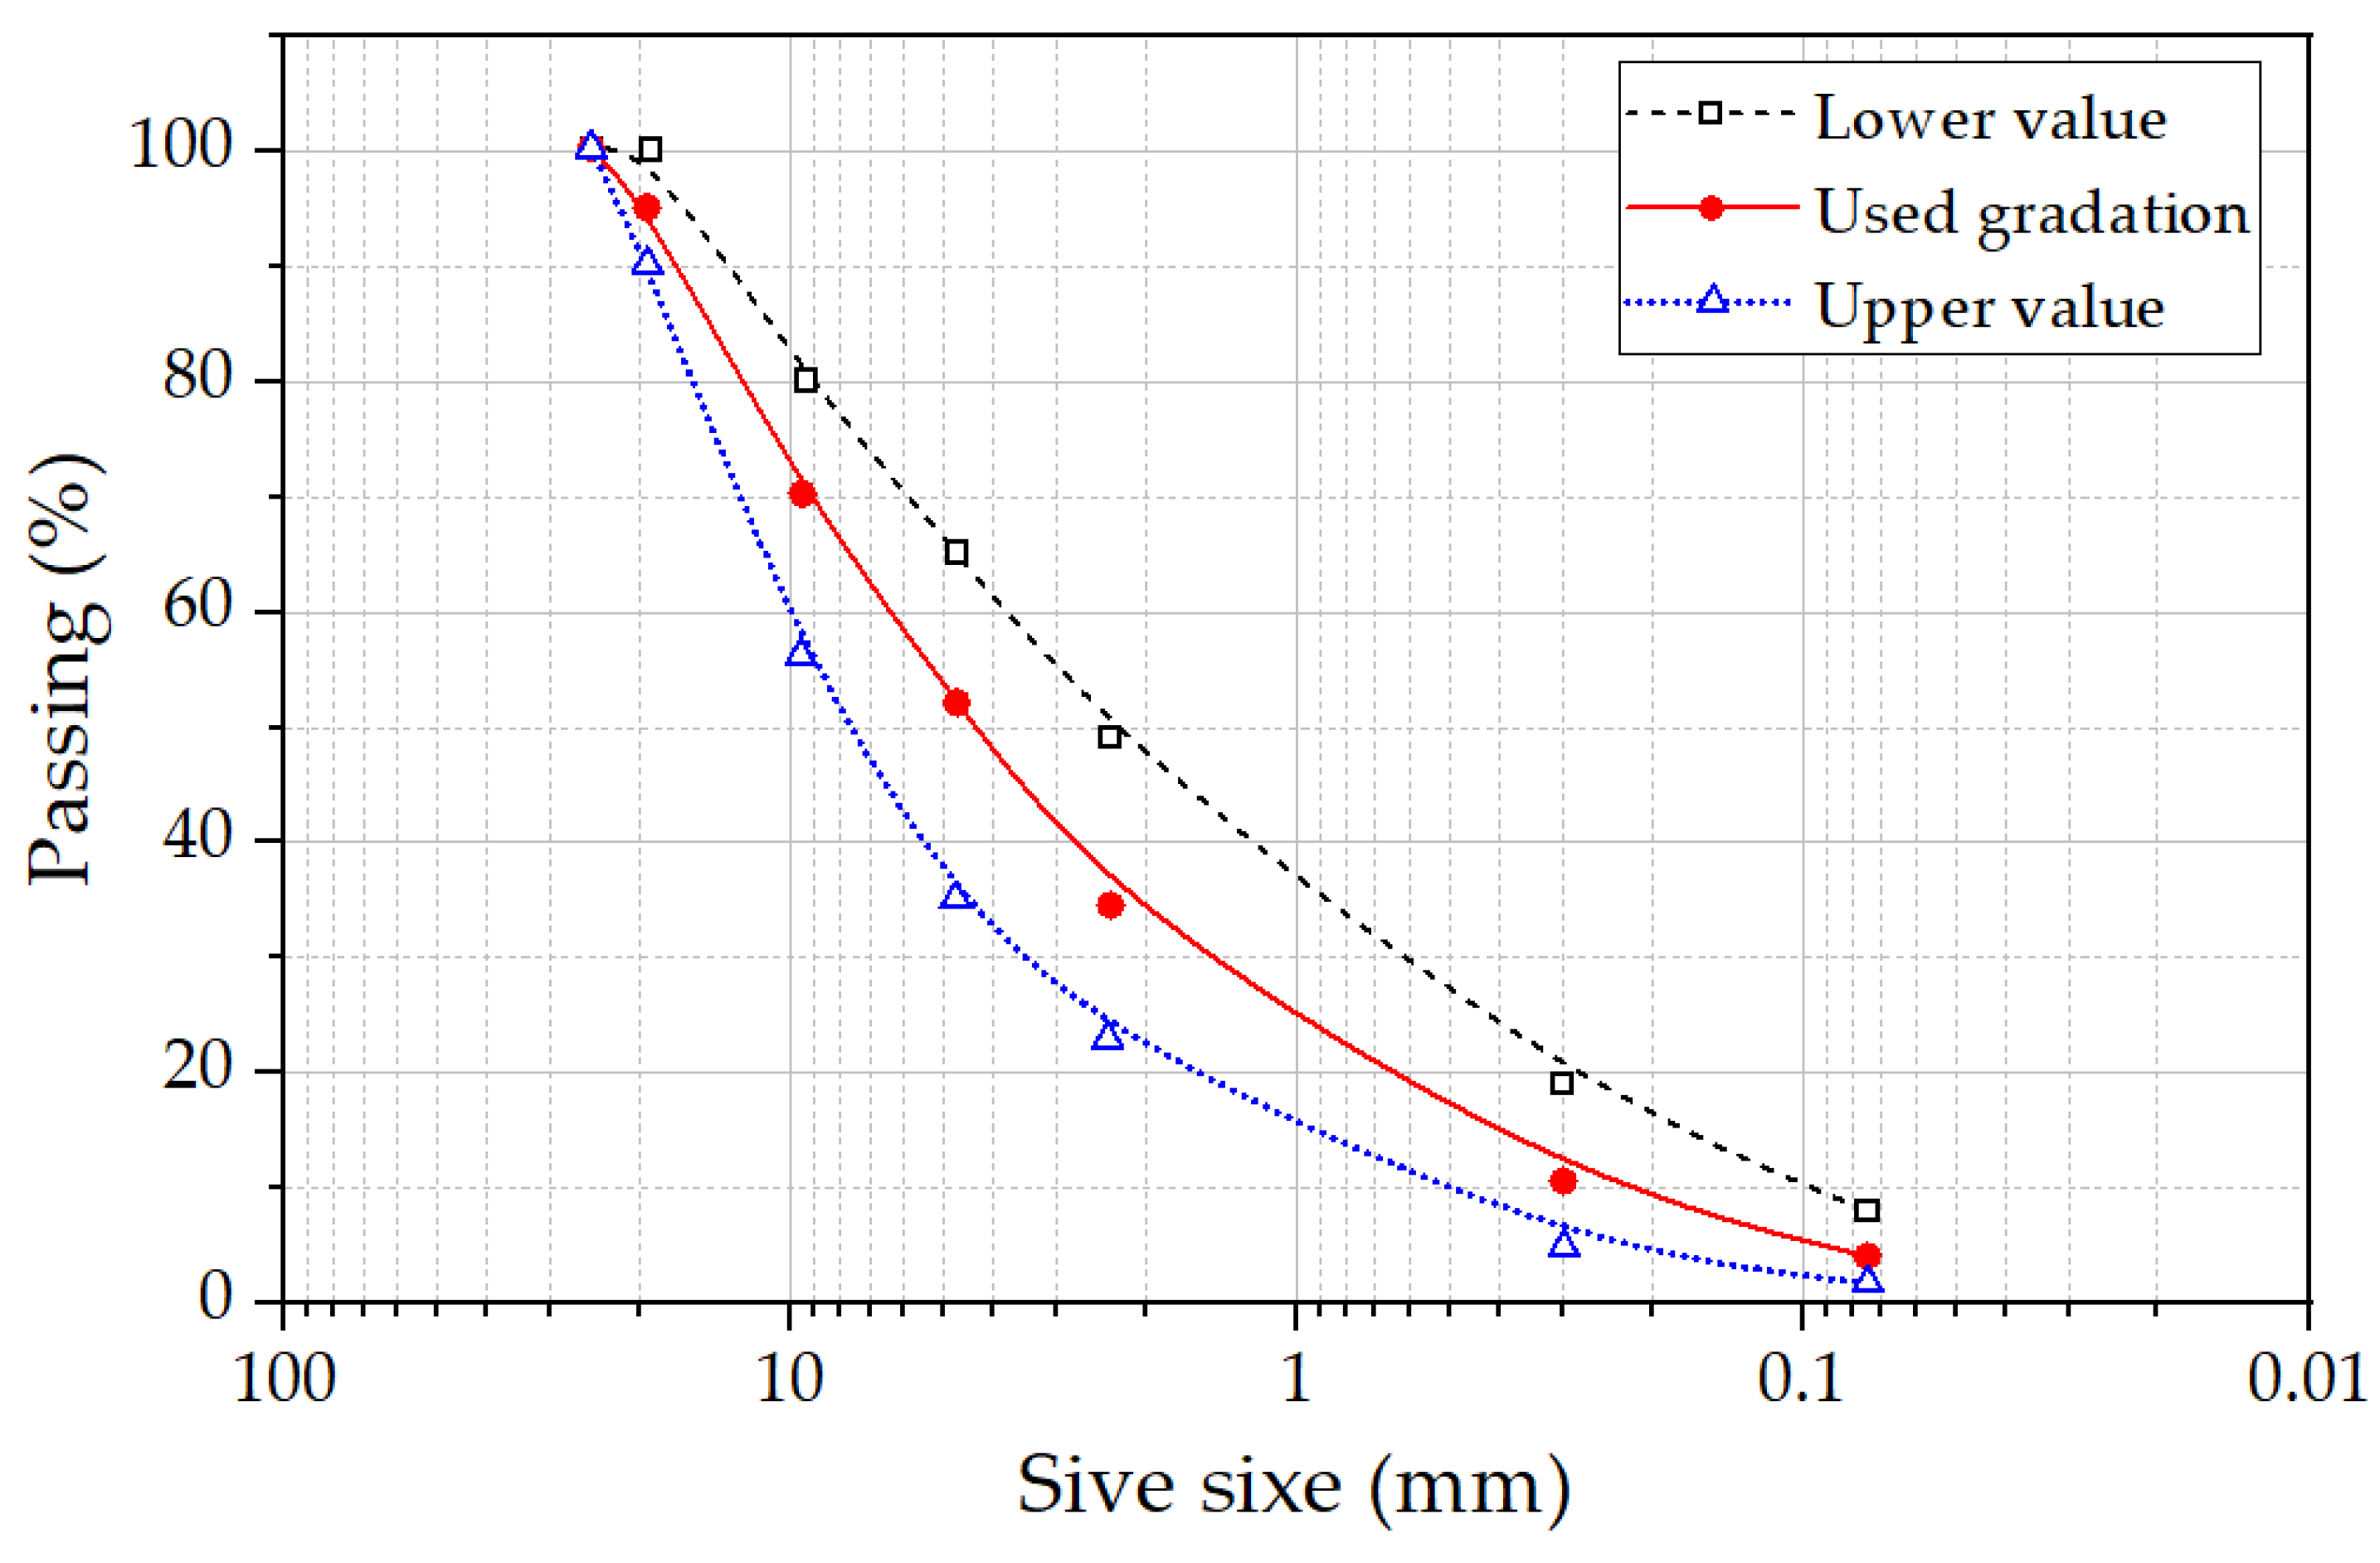
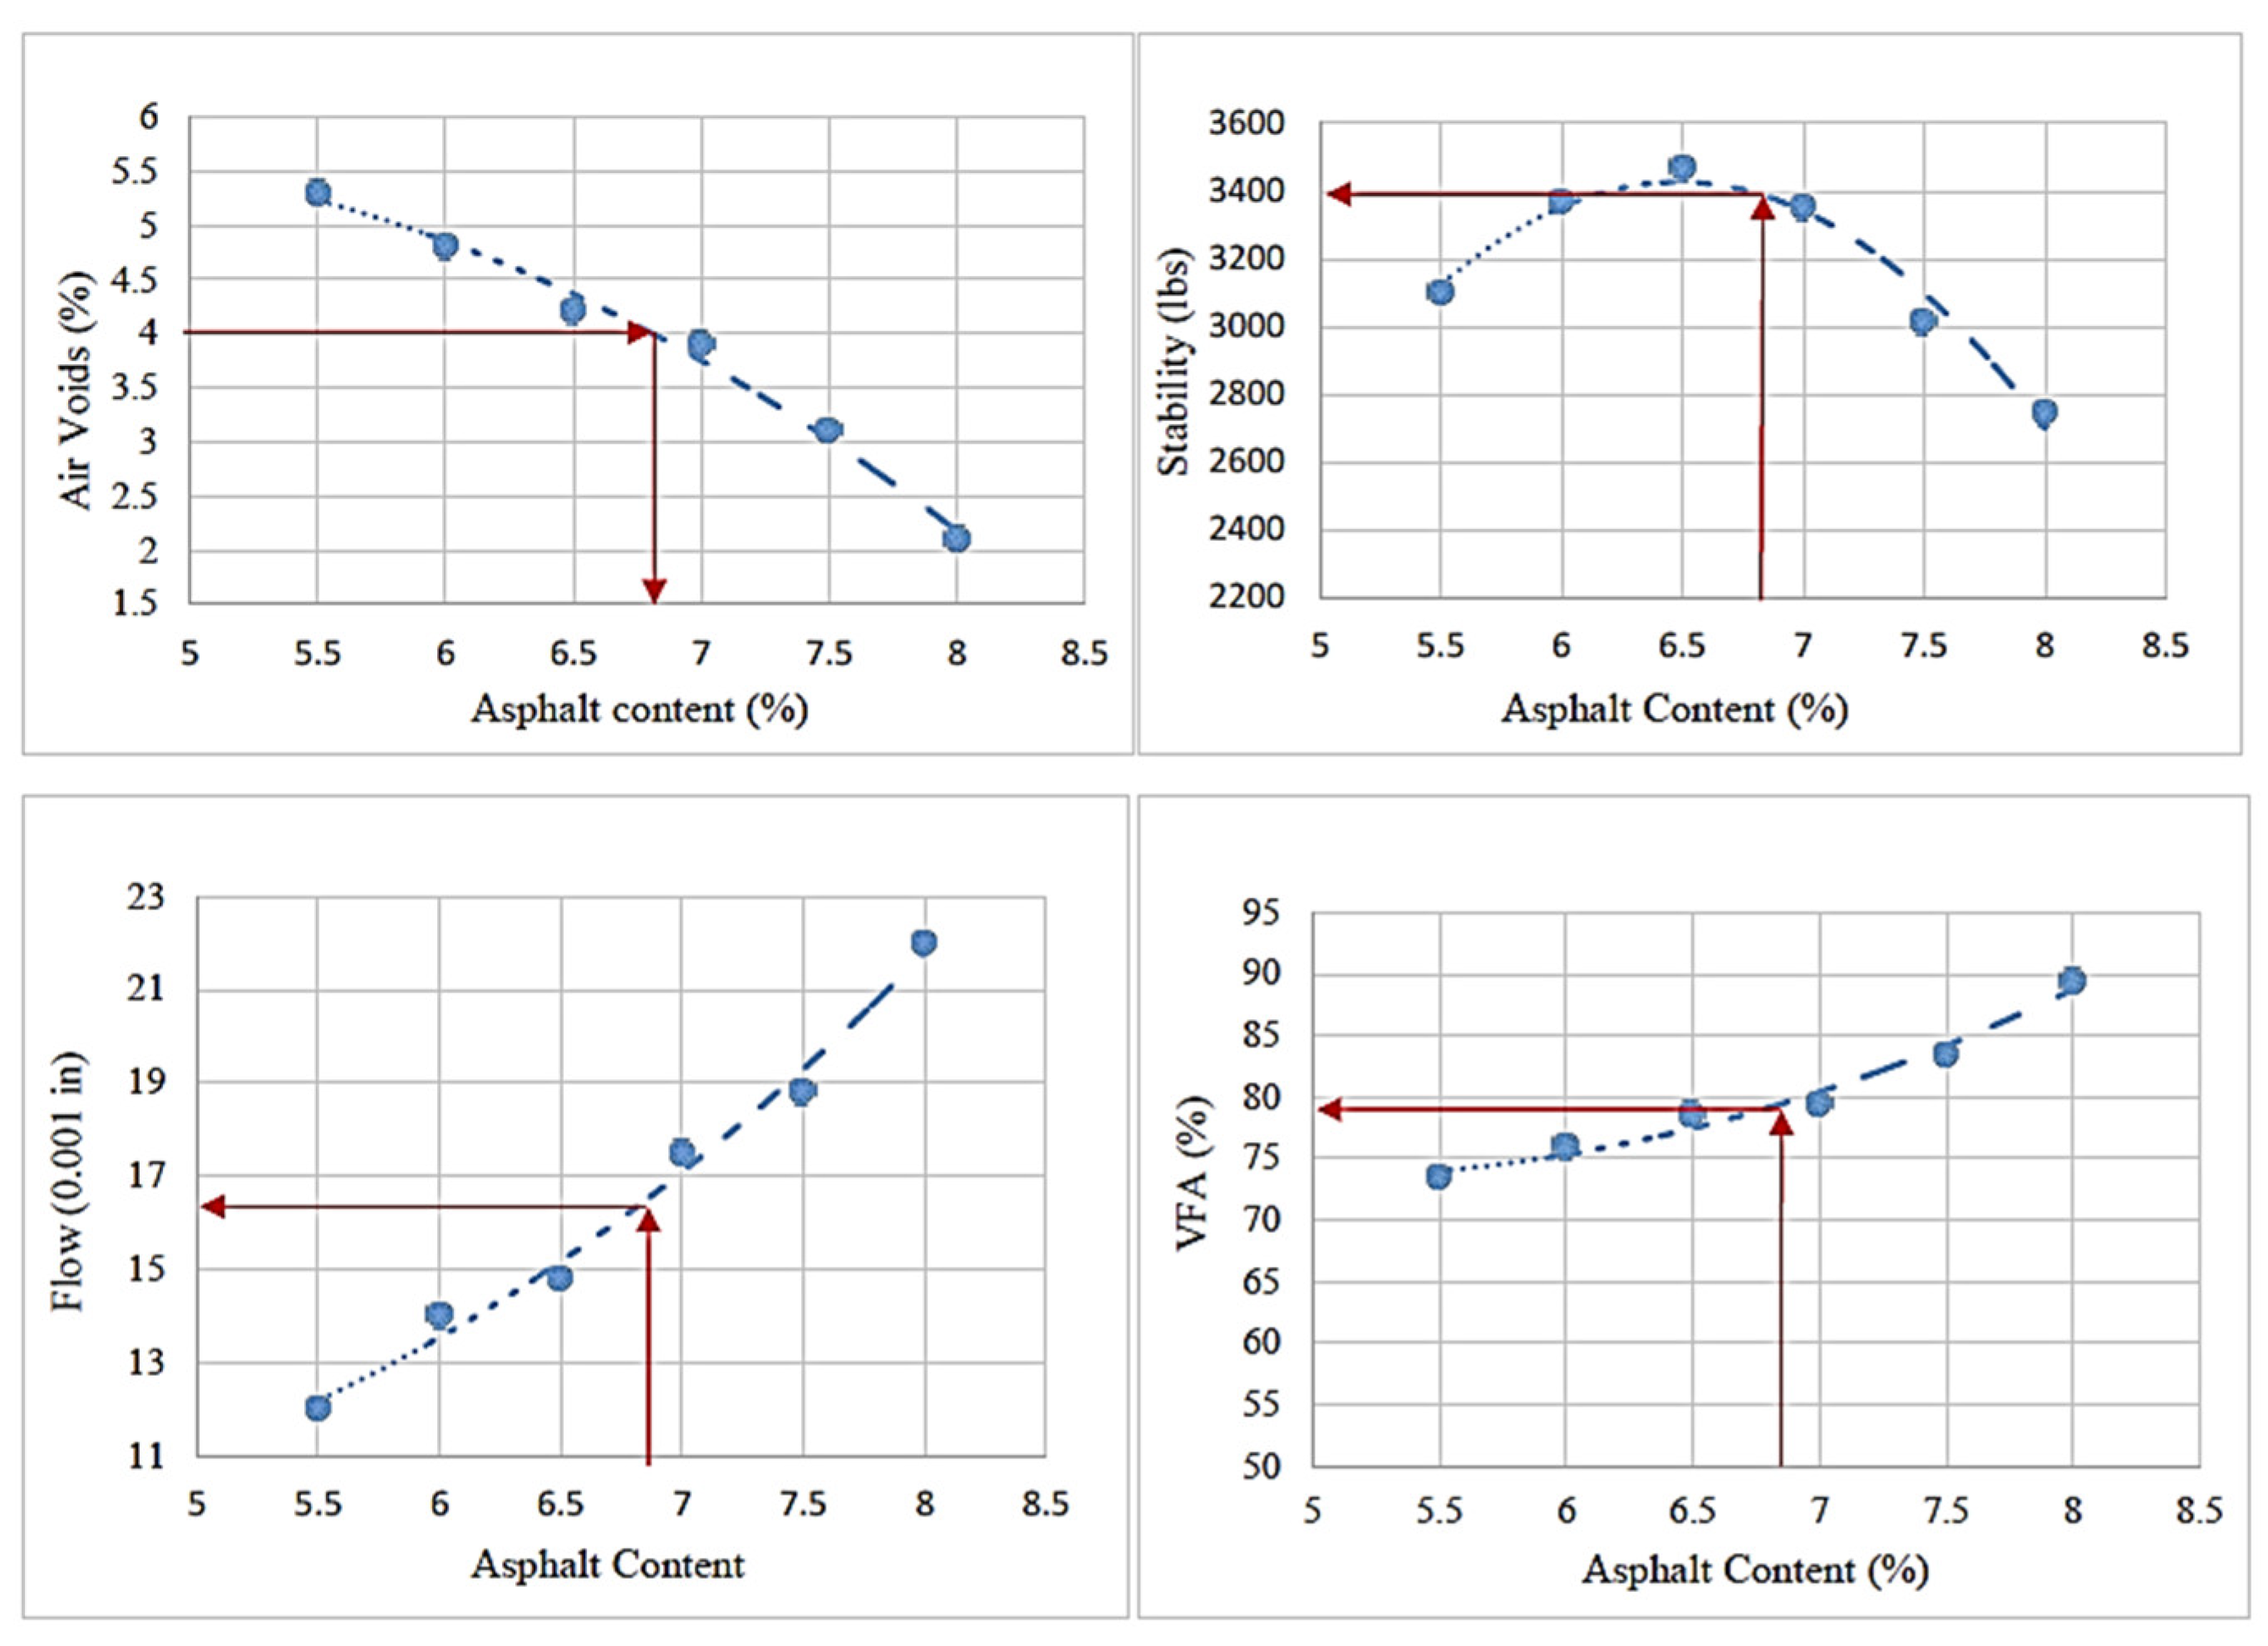
4.2. BA-Mixed HMA
4.2.1. Mix Design
4.2.2. Optimum Binder Content (OBC)
4.3. BA-RAS-Mixed HMA
Mixture Design
5. Experimental Program
5.1. Marshall Test
5.2. Moisture Susceptibility Test
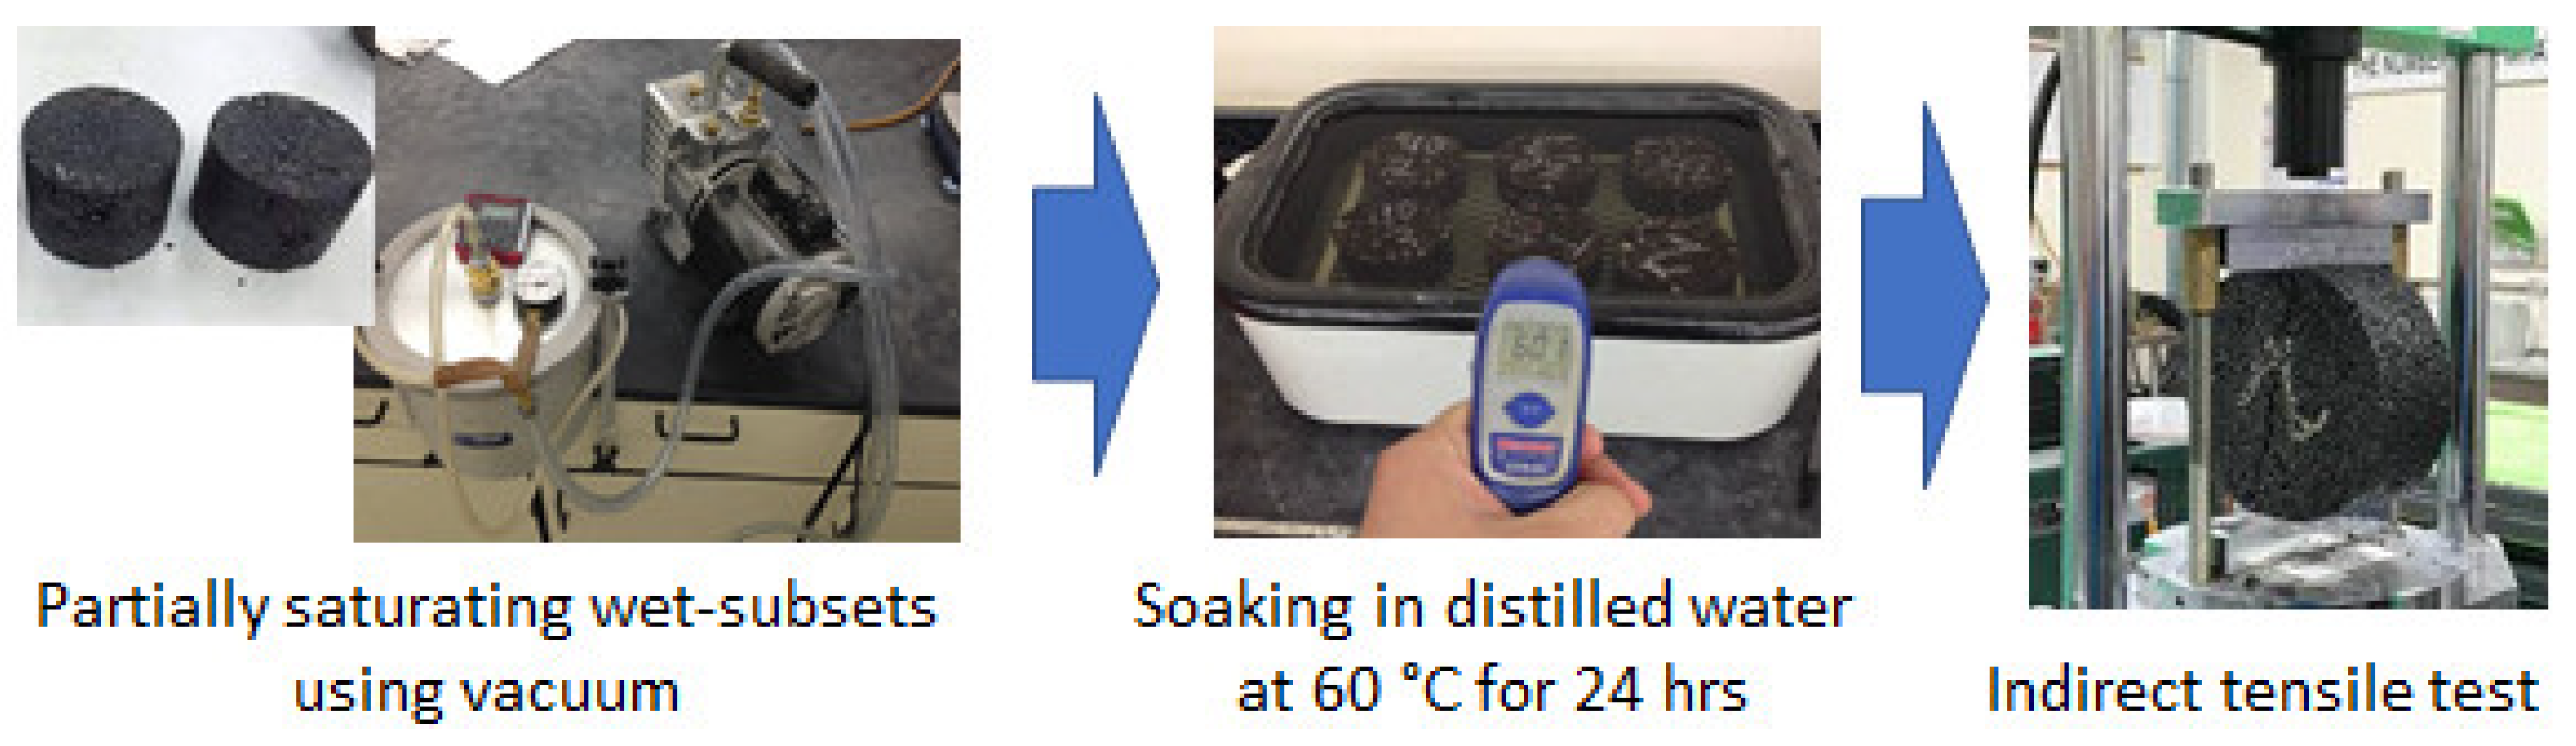
5.3. Indirect Tensile Strength (IDT) Test
5.4. Rutting Test (Asphalt Pavement Analyzer Test)
6. Results and Discussion
6.1. BA Mixed HMA
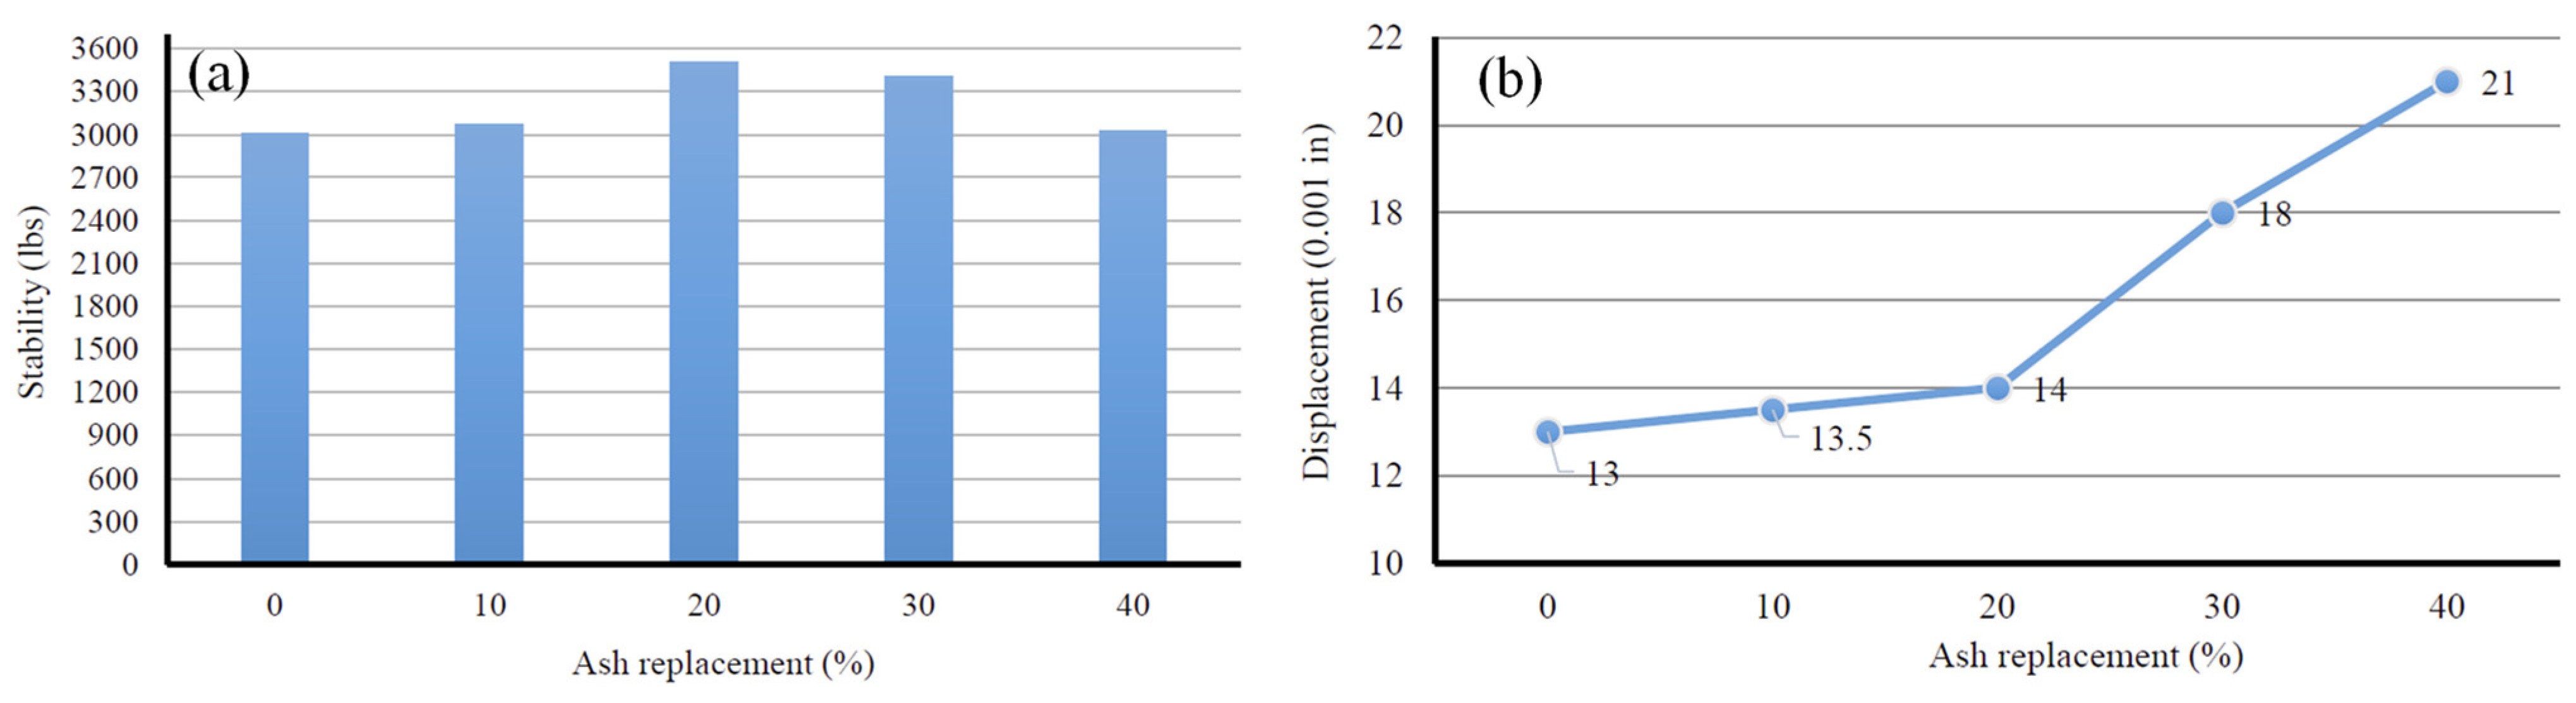
6.1.1. Marshall Test
6.1.2. Moisture Susceptibility Test
6.2. BA-RAS-Mixed HMA
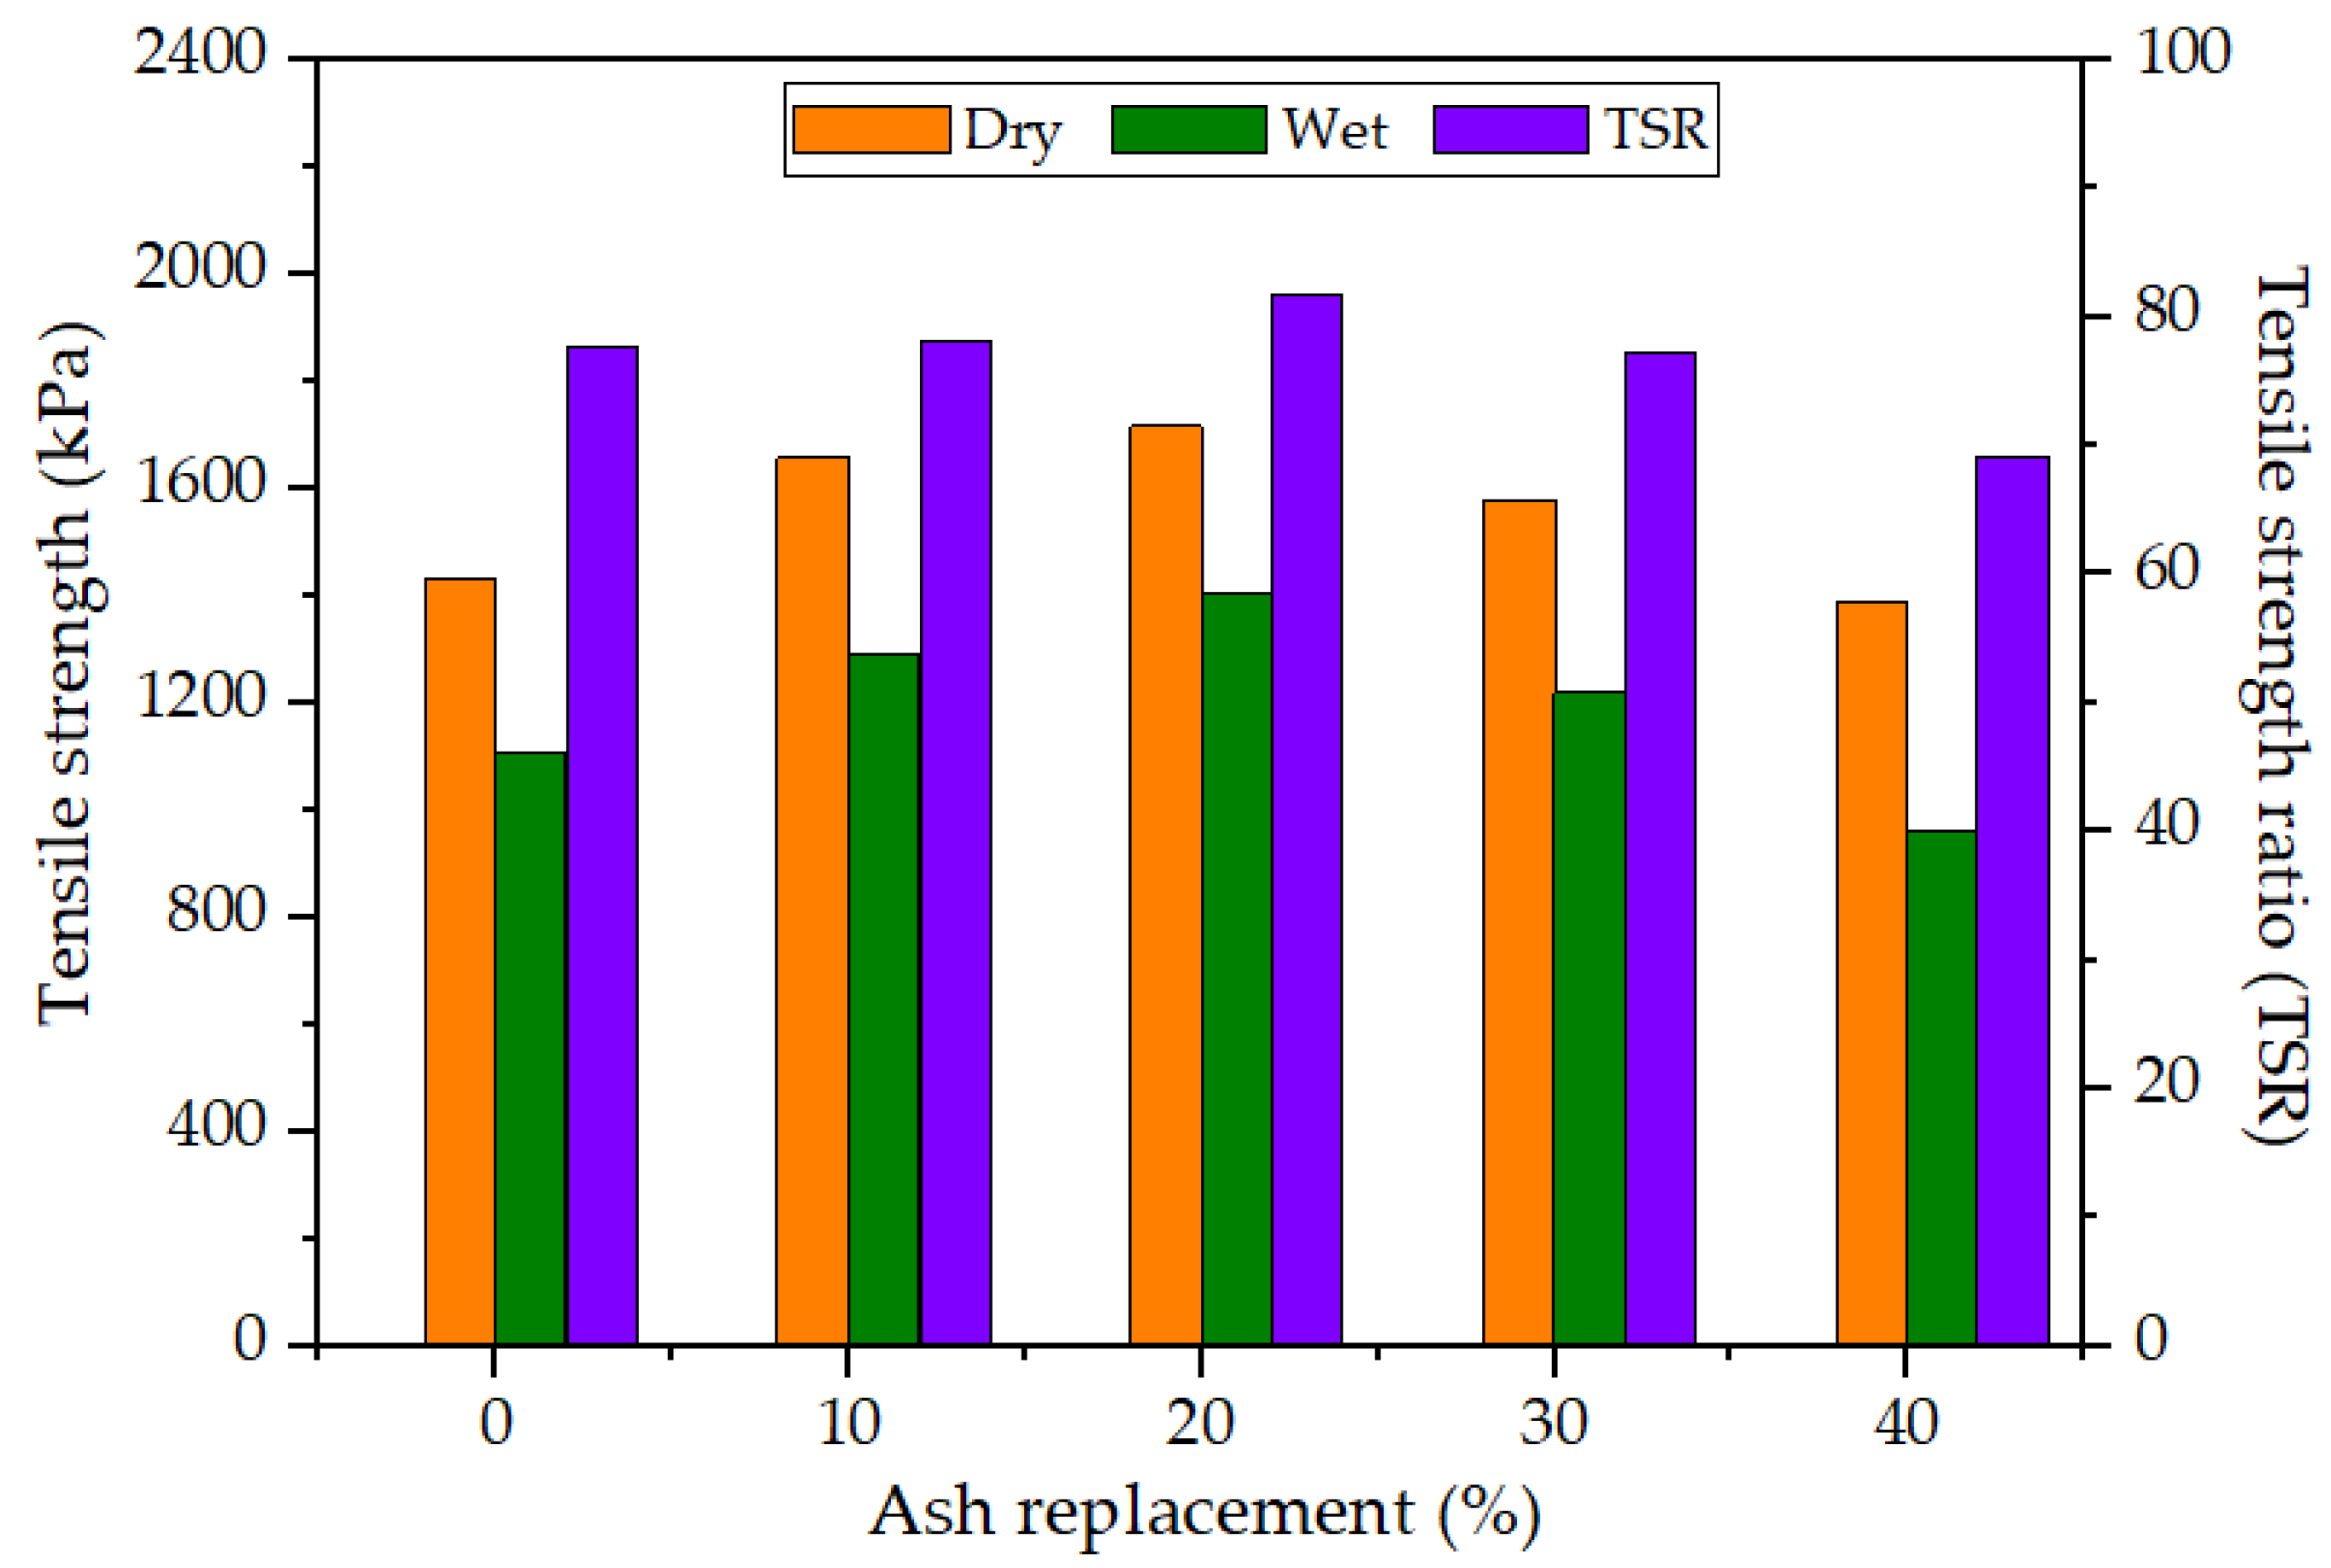
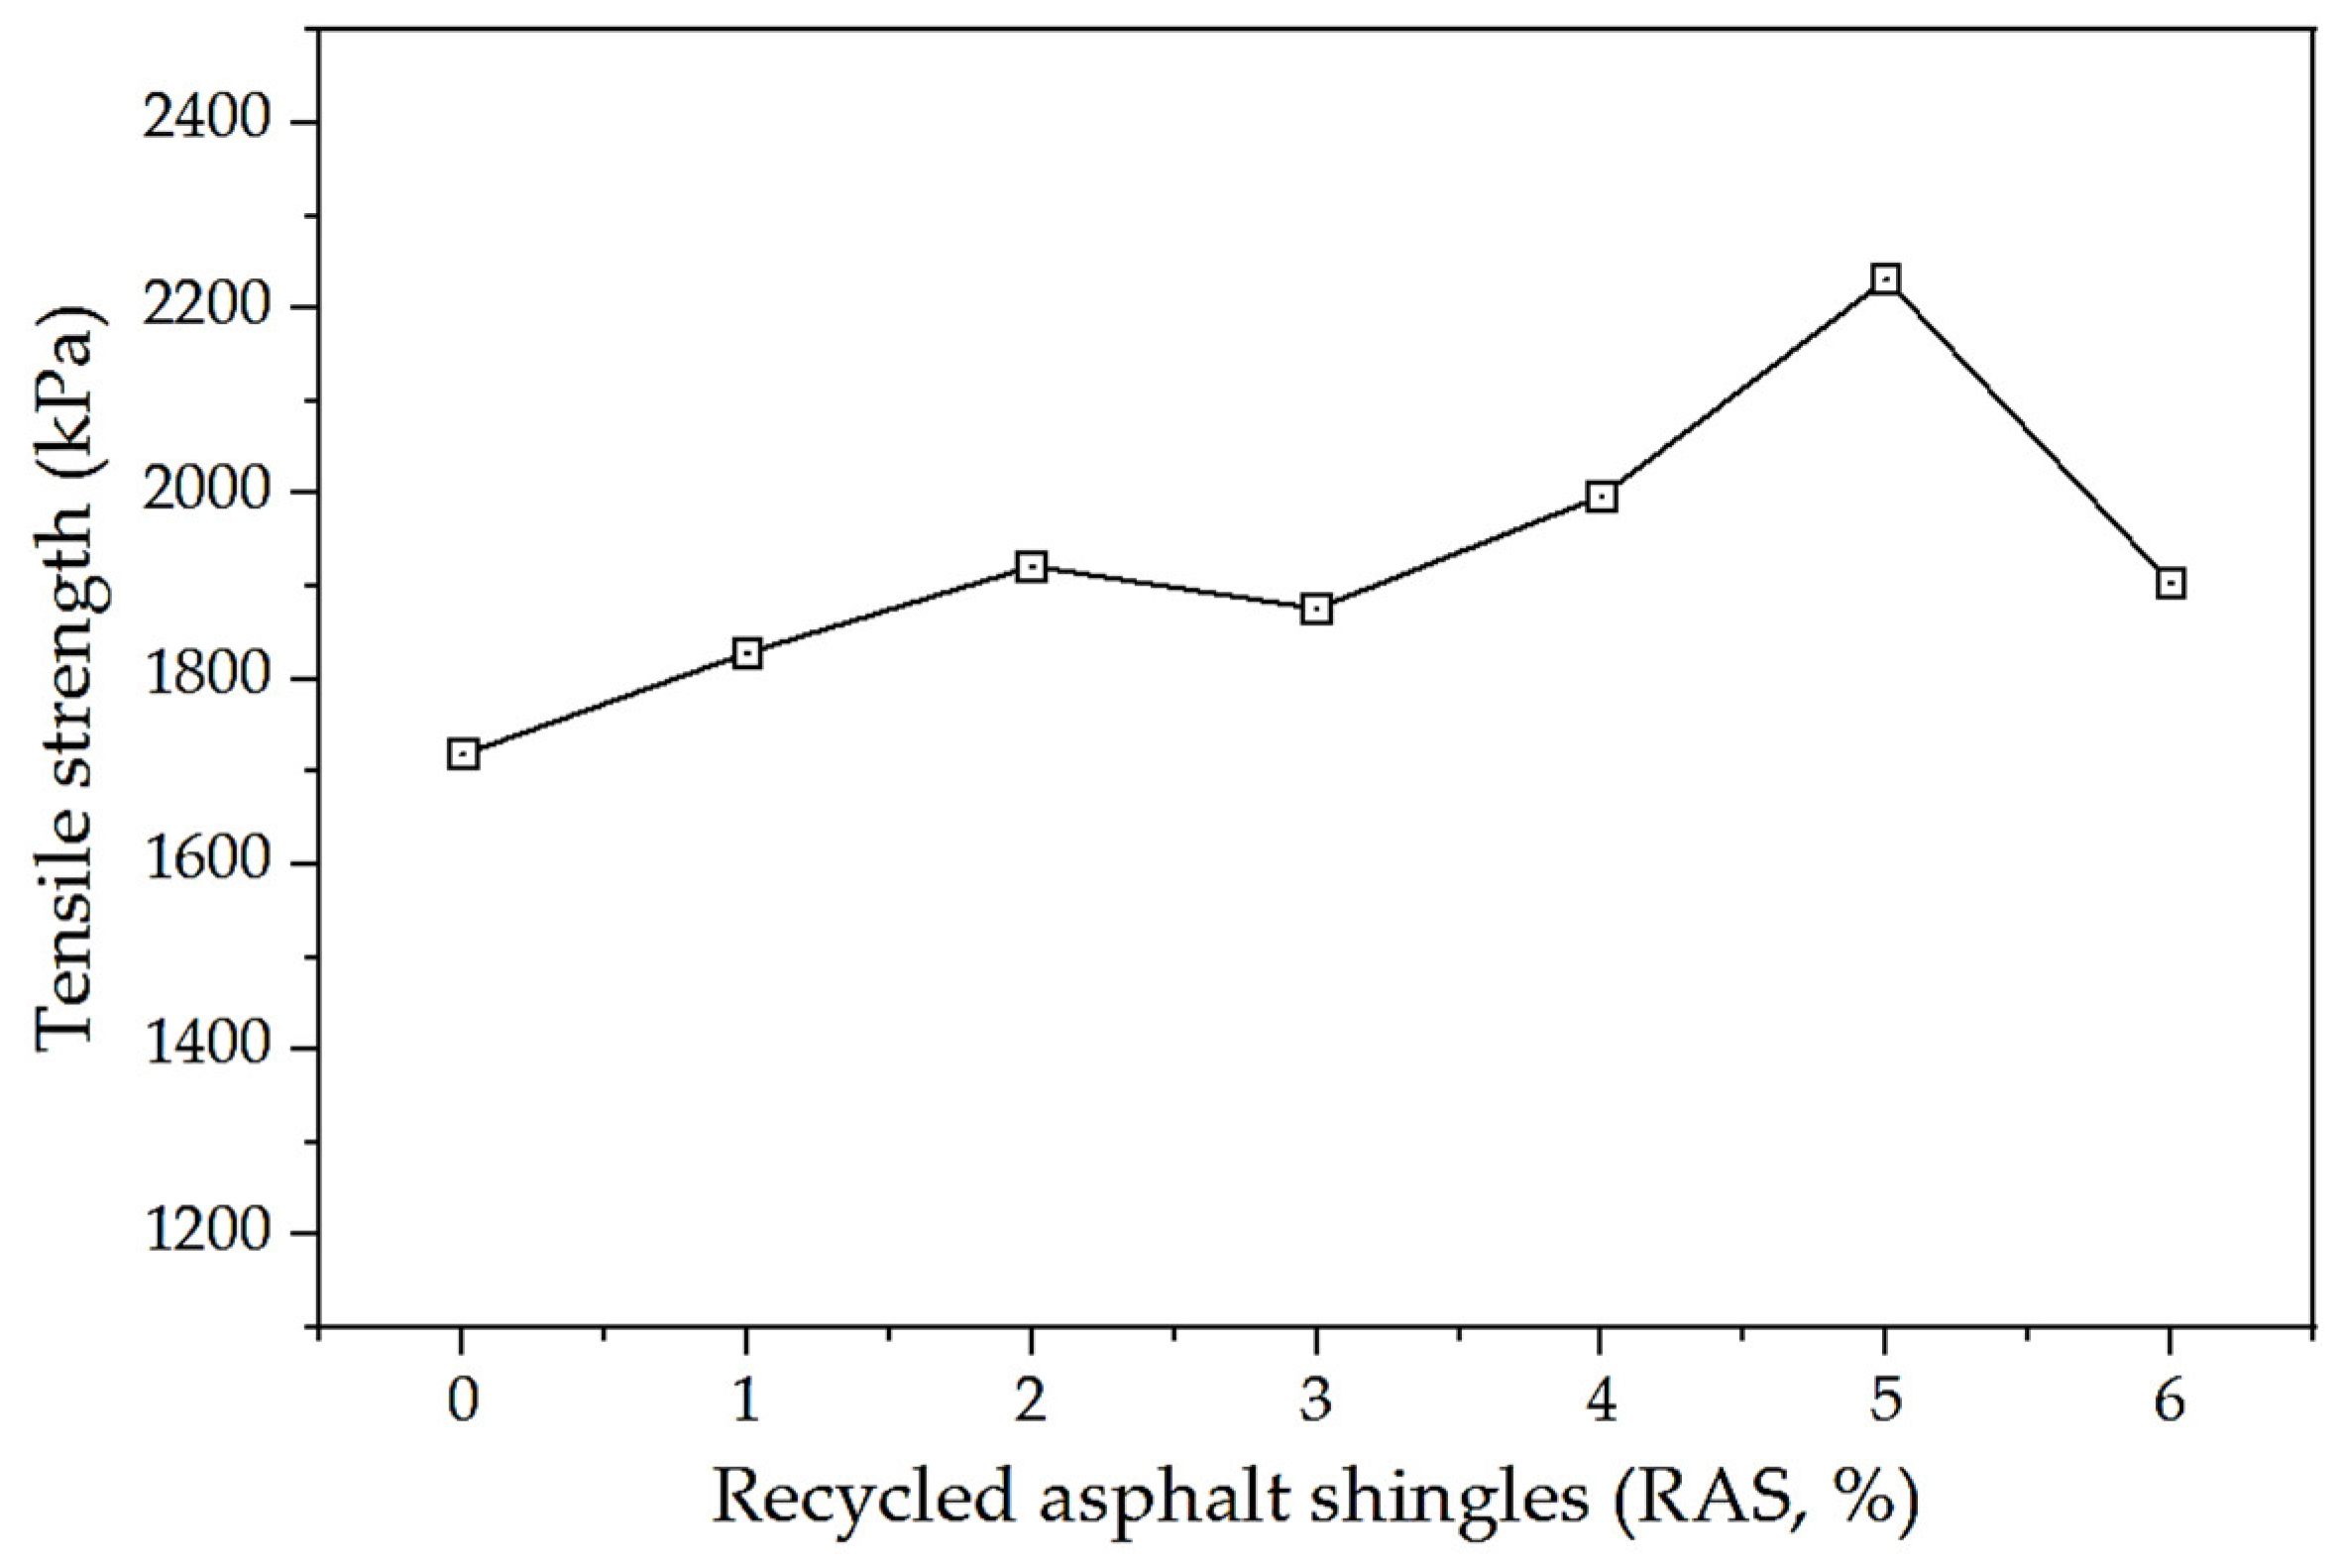
6.2.1. Indirect Tensile Strength Test
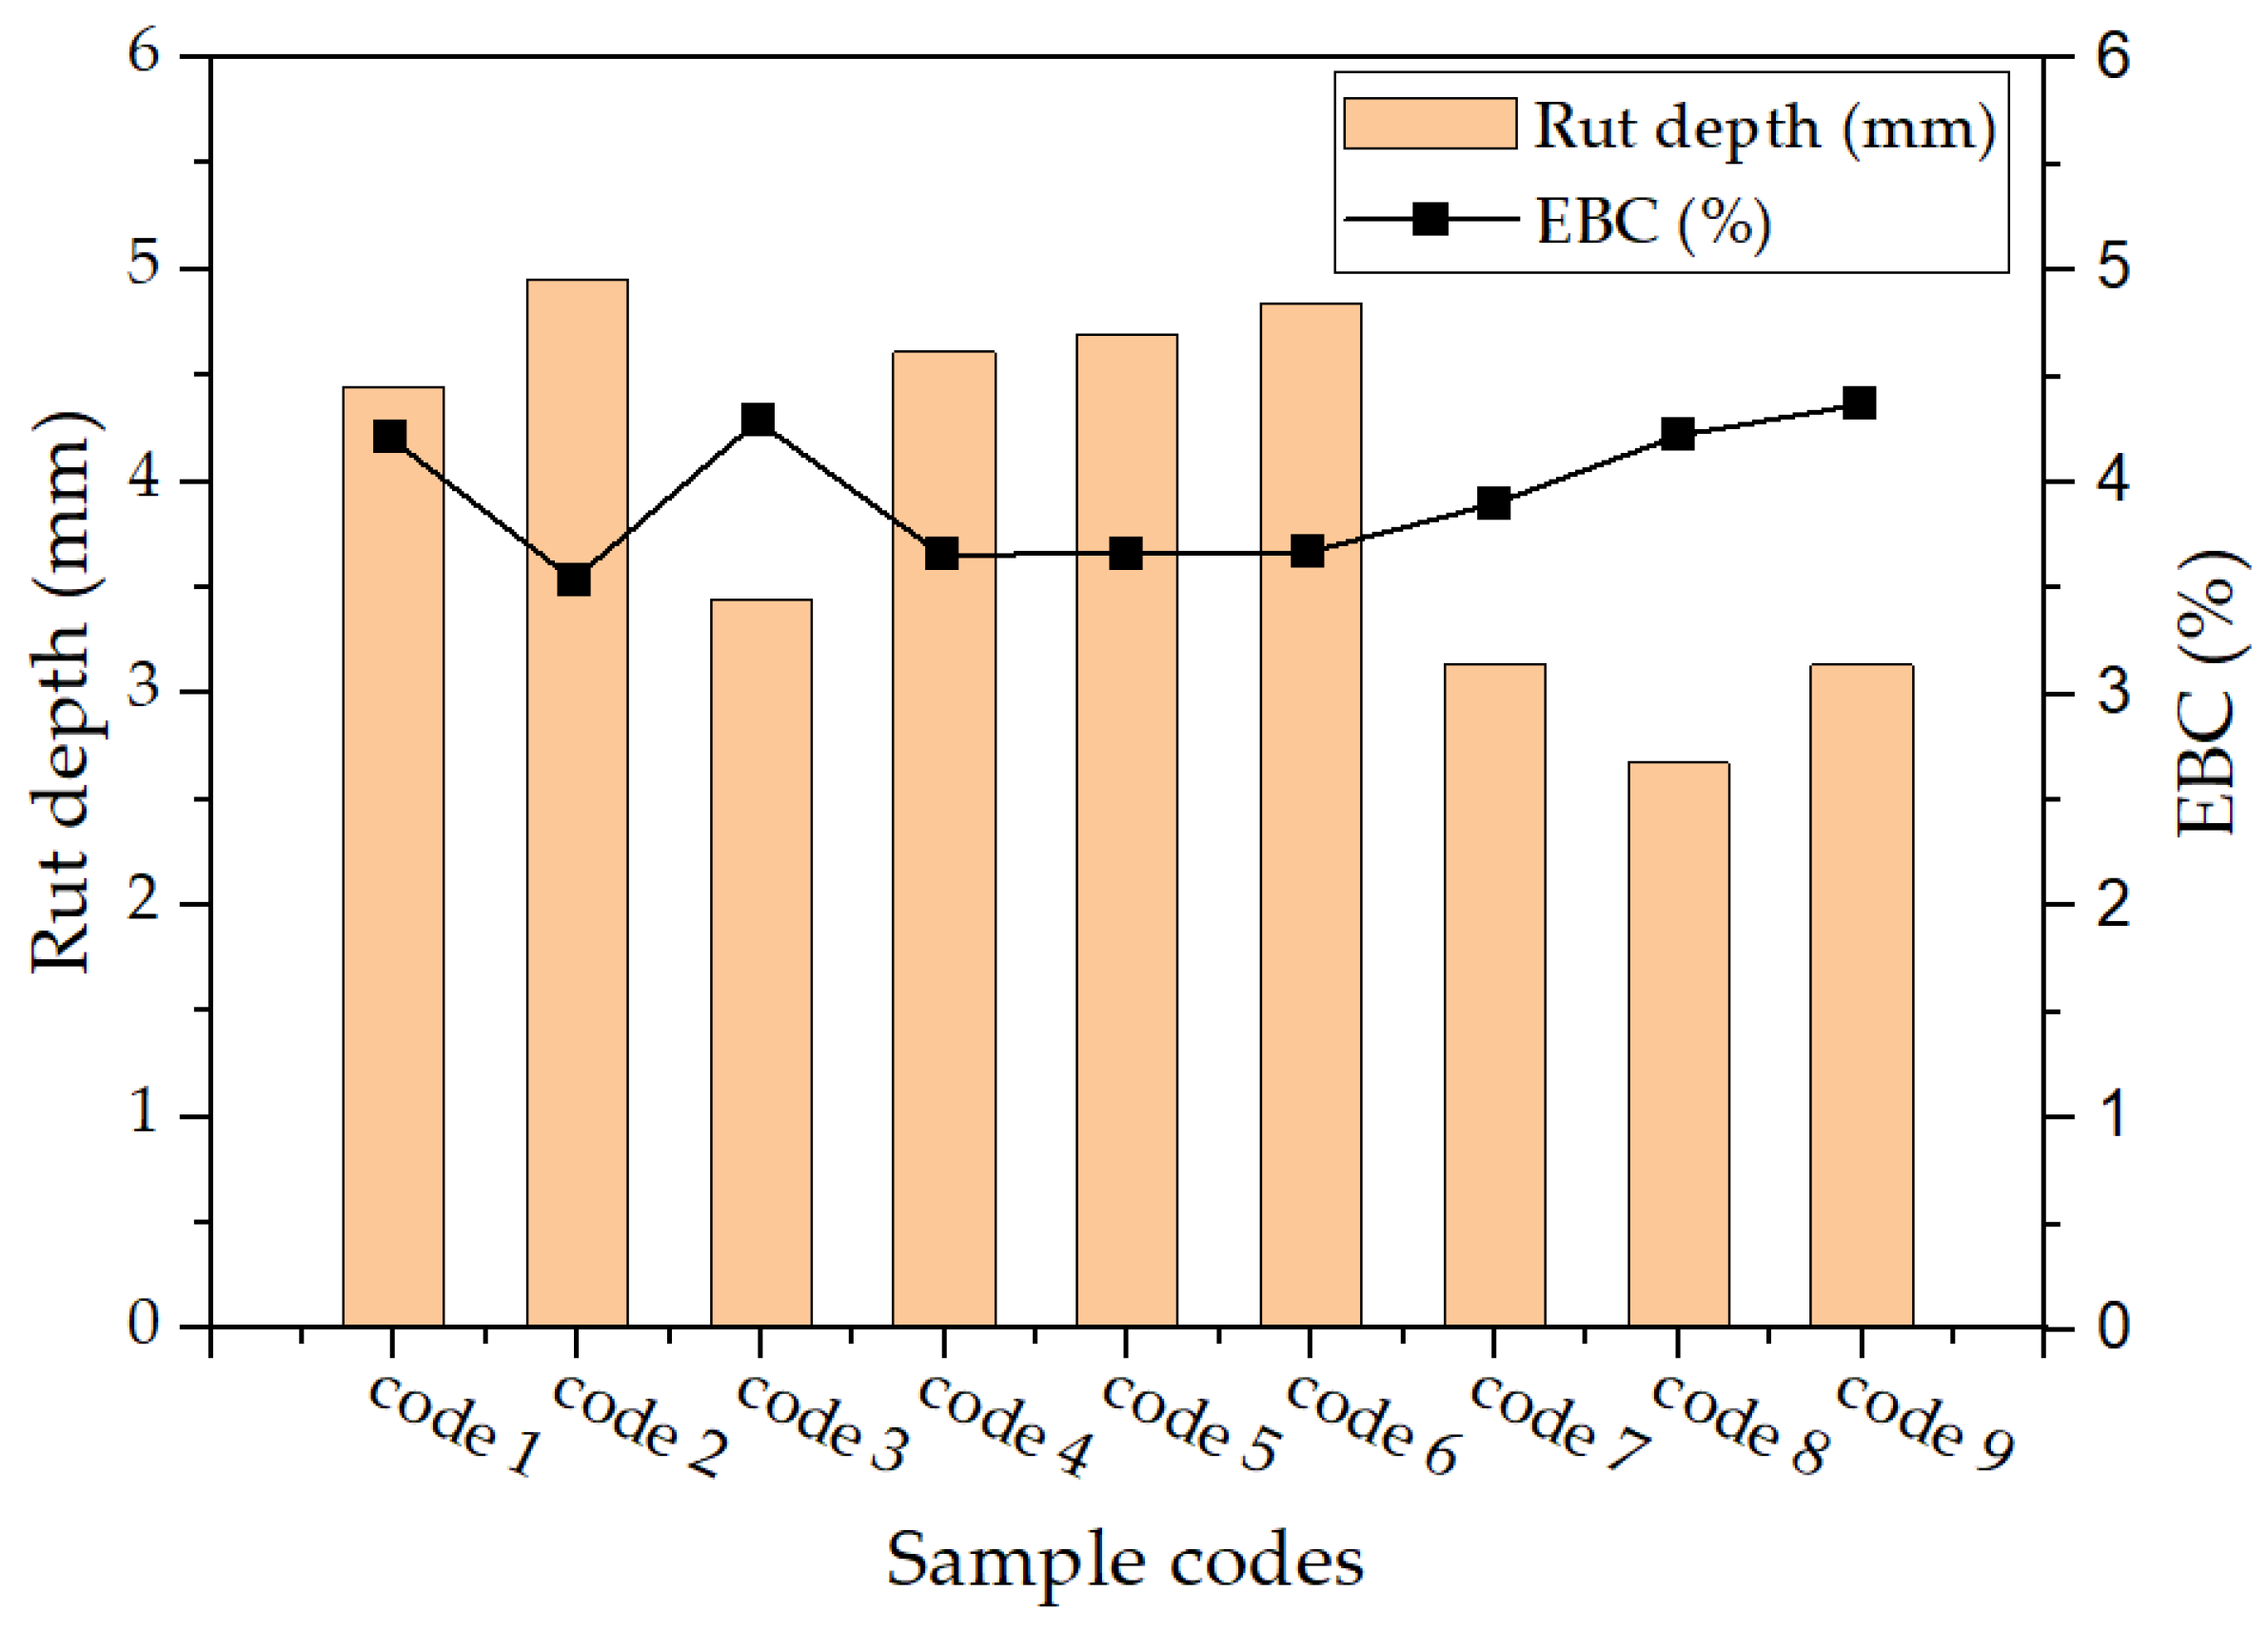
6.2.2. Rutting Test
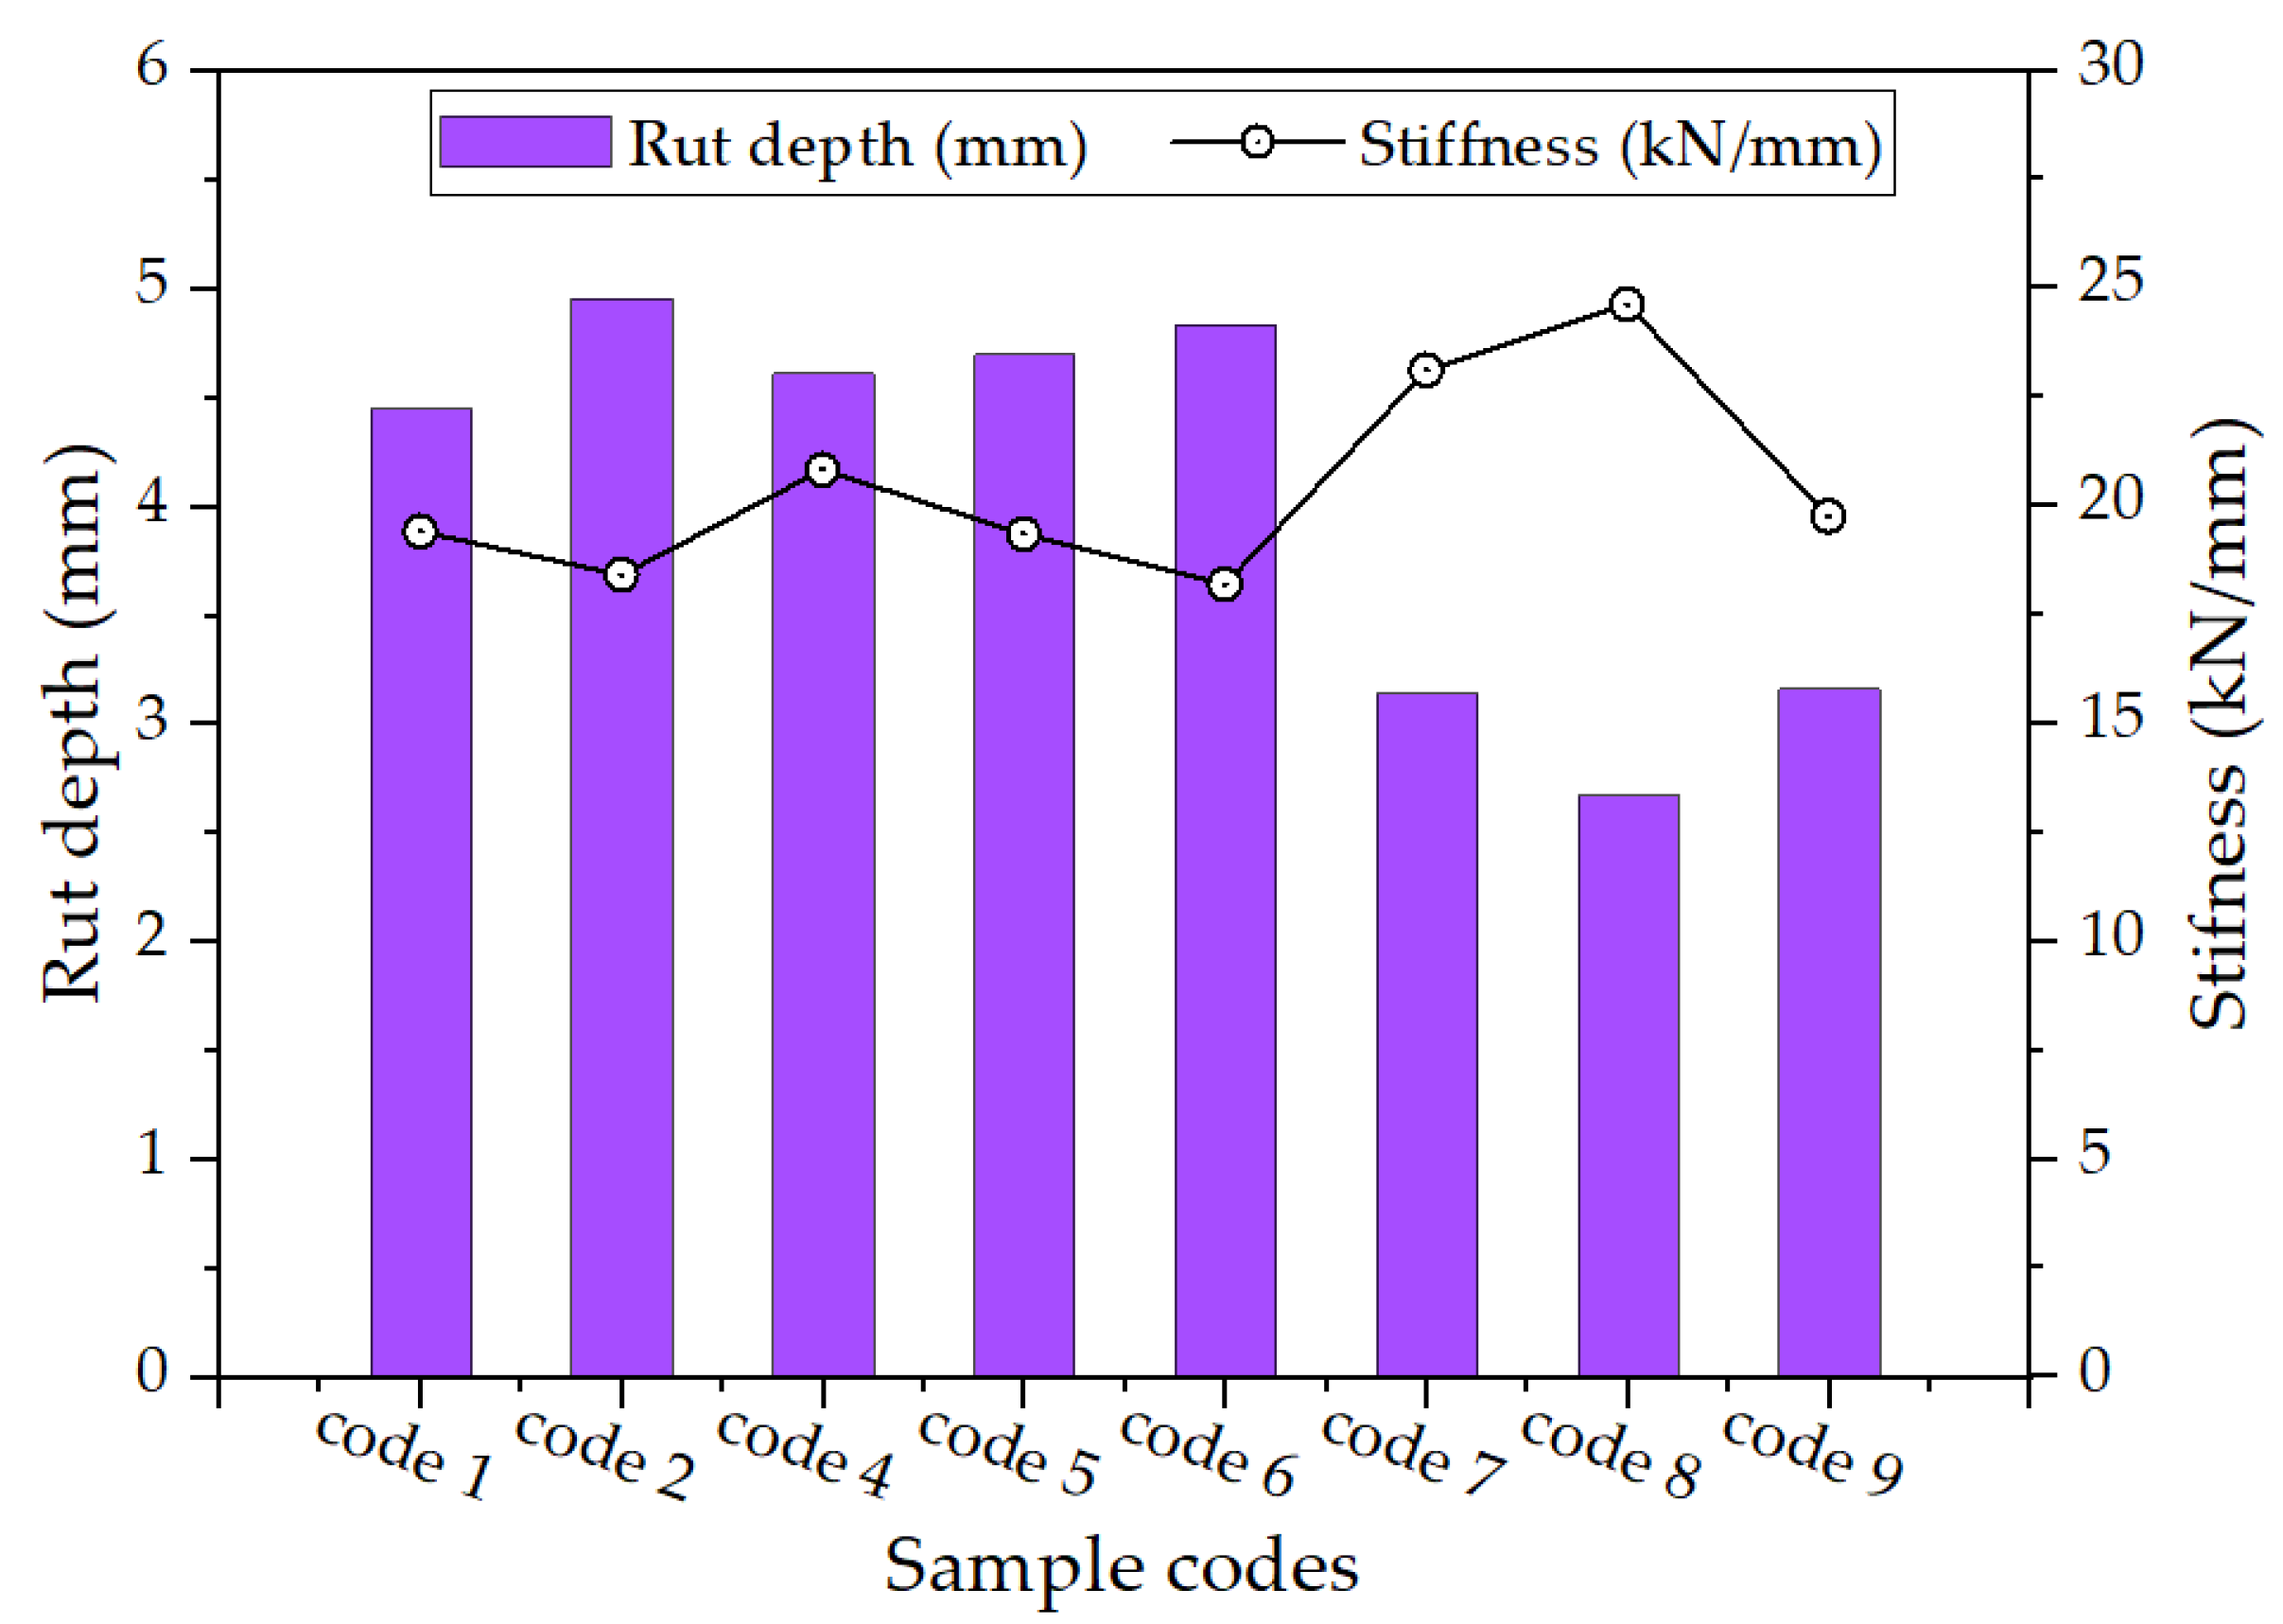
6.3. Correlation Analysis between Stiffness and Rut Depth
7. Conclusions
- The control HMA (0% MSWI BA, 0% RAS) indicates the optimum binder content as 5.7%.
- The optimum replacement of the fine aggregate is 20% MSWI BA in HMA and the 20% BA-mixed HMA shows its optimum binder content as 6.8%. Thus, the 20% replacement of the MSWI BA increases the optimum binder content of the mixture by 1.1%.
- When the 20% MSWI BA replacement is fixed, as the RAS content increases, the strength of the HMA increases. A 5% addition of RAS exhibits the greatest strength of the mixture.
- All mixtures demonstrated greater strength than the control specimen (regular HMA), indicating a greater mechanical performance than typical HMA.
Author Contributions
Funding
Data Availability Statement
Conflicts of Interest
Disclaimer
References
- Paranavithana, S.; Mohajerani, A. Effects of recycled concrete aggregates on properties of asphalt concrete. Resour. Conserv. Recycl. 2006, 48, 1–12. [Google Scholar] [CrossRef]
- Wiles, C.C. Municipal solid waste combustion ash: State-of-the-knowledge. J. Hazard. Mater. 1996, 47, 325–344. [Google Scholar] [CrossRef]
- Chandler, A.J.; Eighmy, T.; Hjelmar, O.; Kosson, D.; Sawell, S.; Vehlow, J.; Van der Sloot, H.; Hartlén, J. Municipal Solid Waste Incinerator Residues; Elsevier: Amsterdam, The Netherlands, 1997. [Google Scholar]
- Wiles, C.C.; Shepherd, P.B. Beneficial Use and Recycling of Municipal Waste Combustion Residues: A Comprehensive Resource Document; National Renewable Energy Laboratory: Golden, CO, USA, 1999. [Google Scholar]
- Astrup, T. Management of APC Residues from WtE Plants. In An Overview of Management Options and Treatment Methods; International Solid Waste Association (ISWA) General Secretariat: Copenhagen, Denmark, 2008. [Google Scholar]
- Psomopoulos, C.; Bourka, A.; Themelis, N.J. Waste-to-energy: A review of the status and benefits in USA. Waste Manag. 2009, 29, 1718–1724. [Google Scholar] [CrossRef] [PubMed]
- U.S. Environmental Protection Agency. Municipal Solid Waste Generation, Recycling, and Disposal in the United States: Facts and Figures for 2010; U.S. Environmental Protection Agency (U.S. EPA): Washington, DC, USA, 2011. [Google Scholar]
- Michaels, T. The 2010 ERC Directory of Waste-to-Energy Plants; Energy Recovery Council: Washington, DC, USA, 2010. [Google Scholar]
- Hasselriis, F. Waste-to-Energy Ash Management in the United States. In Encyclopedia of Sustainability Science and Technology; Springer: New York, NY, USA, 2012; pp. 11737–11758. [Google Scholar]
- Cho, B.H.; Nam, B.H.; An, J.; Youn, H. Municipal solid waste incineration (MSWI) ashes as construction materials—A review. Materials 2020, 13, 3143. [Google Scholar] [CrossRef] [PubMed]
- Haynes, J.; Ledbetter, W.B. Incinerator Residue in Bituminous Base Construction; Texas A&M Transportation Institute: College Station, TX, USA, 1975. [Google Scholar]
- Collins, R.J.; Miller, R.H.; Ciesielski, S.K.; Wallo, E.M.; Boyle, M.J.; Pindzola, D.M.; Tropea, J. Technology for Use of Incinerator Residue as Highway Material; The National Academies of Sciences, Engineering, and Medicine: Washington, DC, USA, 1977. [Google Scholar]
- Federal Highway Administration; Turner-Fairbank Highway Research Center; U.S. Department of Transportation. User Guidelines for Waste and by-Product Materials in Pavement Construction; Report No. FHWA-RD-97-148; FHWA: McLean, VA, USA, 1997. [Google Scholar]
- Chen, J.; Chu, P.; Chang, J.; Lu, H.; Wu, Z.; Lin, K. Engineering and Environmental Characterization of Municipal Solid Waste Bottom Ash as an Aggregate Substitute Utilized for Asphalt Concrete. J. Mater. Civ. Eng. 2008, 20, 432–439. [Google Scholar] [CrossRef]
- Cascione, A.A.; Williams, R.C.; Yu, J. Performance testing of asphalt pavements with recycled asphalt shingles from multiple field trials. Constr. Build. Mater. 2015, 101, 628–642. [Google Scholar] [CrossRef]
- Nam, B.; Maherinia, H.; Behzadan, A. Mechanical characterization of asphalt tear-off roofing shingles in Hot Mix Asphalt. Constr. Build. Mater. 2014, 50, 308–316. [Google Scholar] [CrossRef]
- An, J.; Nam, B.; Youn, H. Investigation on the effect of recycled asphalt shingle (RAS) in Portland cement mortar. Sustainability 2016, 8, 384. [Google Scholar] [CrossRef]
- Cooper, S.B.; Negulescu, I.; Balamurugan, S.S.; Mohammad, L.; Daly, W.H. Binder composition and intermediate temperature cracking performance of asphalt mixtures containing RAS. Road Mater. Pavement Des. 2015, 16, 275–295. [Google Scholar] [CrossRef]
- Wu, S.; Zhang, K.; Wen, H.; DeVol, J.; Kelsey, K. Performance evaluation of hot mix asphalt containing recycled asphalt shingles in Washington State. J. Mater. Civ. Eng. 2016, 28, 04015088. [Google Scholar] [CrossRef]
- Willis, J.R.; Turner, P.; Julian, G.; Taylor, A.J.; Tran, N.; Padula, F. Effects of Changing Virgin Binder Grade and Content on Rap Mixture Properties; National Center for Asphalt Technology Report; NCAT: Auburn, AL, USA, 2012. [Google Scholar]
- Golestani, B.; Moghadas Nejad, F.; Sadeghpour Galooyak, S. Performance evaluation of linear and nonlinear nanocomposite modified asphalts. Constr. Build. Mater. 2012, 35, 197–203. [Google Scholar] [CrossRef]
- Golestani, B.; Nam, B.H.; Moghadas Nejad, F.; Fallah, S. Nanoclay application to asphalt concrete: Characterization of polymer and linear nanocomposite-modified asphalt binder and mixture. Constr. Build. Mater. 2015, 91, 32–38. [Google Scholar] [CrossRef]
- Aparna, R.P.; Bindu, J. Utilization of waste materials as a substitute for the sand drain in clayey soil. Int. J. Geo-Eng. 2023, 14, 2. [Google Scholar] [CrossRef]
- Pushpakumara, B.H.J.; Mendis, W.S.W. Suitability of Rice Husk Ash (RHA) with lime as a soil stabilizer in geotechnical applications. Int. J. Geo-Eng. 2022, 13, 4. [Google Scholar] [CrossRef]
- Ale, T.O. Improving the geotechnical properties of a Nigerian termite reworked soil using pretest drying conditions and sawdust ash. Int. J. Geo-Eng. 2023, 14, 1. [Google Scholar] [CrossRef]
- Kumar, S.; Singh, D. From waste to resource: Evaluating the possibility of incinerator bottom ash composites for geotechnical applications. Int. J. Environ. Sci. Technol. 2023, 1–12. [Google Scholar] [CrossRef]
- AASHTO T316; Standard Method of Test for Viscosity Determination of Asphalt Binder Using Rotational Viscometer. American Association of State Highway and Transportation Officials: Washington, DC, USA, 2019.
- AASTHTO T315; Standard Method of Test for Determining the Rheological Properties of Asphalt Binder Using a Dynamic Shear Rheometer (DSR). American Association of State Highway and Transportation Officials: Washington, DC, USA, 2019.
- AASHTO T53; Standard Method of Test for Softening Point of Bitumen (Ring-and-Ball Apparatus). American Association of State Highway and Transportation Officials: Washington, DC, USA, 2022.
- AASHTO T49; Standard Method of Test for Penetration of Bituminous Materials. American Association of State Highway and Transportation Officials: Washington, DC, USA, 2022.
- AASHTO T48; Standard Method of Test for Flash Point of Asphalt Binder by Cleveland Open Cup. American Association of State Highway and Transportation Officials:: Washington, DC, USA, 2022.
- ASTM C127-12; Standard Test Method for Density, Relative Density (Specific Gravity), and Absorption of Coarse Aggregate. American Society for Testing and Materials: West Conshohocken, PA, USA, 2012.
- ASTM C29/C29M-09; Standard Test Method for Bulk Density (“Unit Weight”) and Voids in Aggregate. American Society for Testing and Materials: West Conshohocken, PA, USA, 2009.
- ASTM C535-12; Standard Test Method for Resistance to Degradation of Large-Size Coarse Aggregate by Abrasion and Impact in the Los Angeles Machine. American Society for Testing and Materials: West Conshohocken, PA, USA, 2012.
- ASTM D6927; Standard Test Method for Marshall Stability and Flow of Asphalt Mixtures. American Society for Testing and Materials: West Conshohocken, PA, USA, 2022.
- ASTM D4867; Standard Test Method for Effect of Moisture on Asphalt Concrete Paving Mixtures. American Society for Testing and Materials: West Conshohocken, PA, USA, 2022.


| Code Number | Sample ID | Description |
|---|---|---|
| Code 1 | V100-B0-A5.7-R0 | 100% virgin coarse and fine aggregates @ 5.7% OAC |
| Code 2 | V100-B20-A5.7-R0 | 100% virgin coarse + 80% virgin fine+20% BA fine agg. @ 5.7% AC |
| Code 3 | V100-B20-A6.8-R0 | 100% virgin coarse + 80% virgin fine+20% BA fine agg. @ 6.8% AC |
| Code 4 | V100-B20-A5.7-R1 | 100% virgin coarse + 80% virgin fine+20% BA fine agg. + 1% RAS @ 5.7% AC |
| Code 5 | V100-B20-A5.7-R2 | 100% virgin coarse + 80% virgin fine+20% BA fine agg. + 2% RAS @ 5.7% AC |
| Code 6 | V100-B20-A5.7-R3 | 100% virgin coarse + 80% virgin fine+20% BA fine agg. + 3% RAS @ 5.7% AC |
| Code 7 | V100-B20-A5.7-R4 | 100% virgin coarse + 80% virgin fine+20% BA fine agg. + 4% RAS @ 5.7% AC |
| Code 8 | V100-B20-A5.7-R5 | 100% virgin coarse + 80% virgin fine+20% BA fine agg. + 5% RAS @ 5.7% AC |
| Code 9 | V100-B20-A5.7-R6 | 100% virgin coarse + 80% virgin fine+20% BA fine agg. + 6% RAS @ 5.7% AC |
| Test | Method | Specification | Results |
|---|---|---|---|
| Rotational viscocity @ 135 °C, 20rpm spindle #21 | AASHTO T316 [27] | 3.0 Max | 0.456 Pa.s |
| Rotational viscocity @ 165 °C, 20rpm spindle #21 | AASHTO T316 [27] | 3.0Max | 0.128 Pa.s |
| Dynamic shear (G*/sinδ, 10 rad/s) | AASHTO T315 [28] | 1.0 min @ 67° | 1.09 kPa |
| Ring and ball soft point | AASHTO T53 [29] | - | 54 °C |
| Penetration @ 25 °C | AASHTO T49 [30] | - | 59 dmm |
| Flash point | AASHTO T48 [31] | 230 °C | 344 °C |
| Properties | Limestone * | MSWI Bottom Ash |
|---|---|---|
| Specific gravity (oven dry) ASTM C127 [32] | 2.4 | 2.2 |
| Absorption capacity ASTM C127 [32] | 3.04% | 12.8% |
| Unit weight (oven dry) ASTM C29 [33] | n/a | 2195 kg/m3 |
| L.A. abrasion mass loss ASTM C53 [34] | 36% | 43% |
| Test Property | Specification | Results |
|---|---|---|
| Marshall stability (1 bf) | 1500 (minimum) | 3005 |
| Flow 0.01 inch | 8–16 | 14.8 |
| Void in total mix (%) | 3–5 | 4 |
| Void filled with Asphalt cement | 70–80 | 78 |
| Sieve No. (Size) | Replacement Ratio of BA | ||||
|---|---|---|---|---|---|
| 0% | 10% | 20% | 30% | 40% | |
| Virgin Agg (g) | BA (g) | BA (g) | BA (g) | BA (g) | |
| 19 mm | 58 | 0 | 0 | 0 | 0 |
| 12.5 mm | 173 | 0 | 0 | 0 | 0 |
| 9.5 mm | 115 | 0 | 0 | 0 | 0 |
| #4 | 207 | 0 | 0 | 0 | 0 |
| #8 | 201 | 20 | 40 | 60 | 80 |
| #16 | 109 | 11 | 22 | 33 | 44 |
| #30 | 92 | 9 | 18 | 28 | 37 |
| #50 | 75 | 7 | 15 | 22 | 30 |
| #100 | 40 | 4 | 8 | 12 | 16 |
| #200 | 31 | 3 | 6 | 9 | 12 |
| Pan | 49 | 5 | 10 | 15 | 20 |
| Test Property | Specification | Results |
|---|---|---|
| Marshall stability (1 bf) | 1500 (minimum) | 3080 |
| Flow 0.01 inch | 8–16 | 16.2 |
| Void in total mix (%) | 3–5 | 4 |
| Void filled with Asphalt cement | 70–80 | 78 |
| Asphalt Content | Coarse Aggregate | Fine Aggregate | RAS as Admixture |
|---|---|---|---|
| 5.7% | limestone aggregate | 20% replacement by MSWI BA | 1, 2, 3, 4, 5, 6% |
Disclaimer/Publisher’s Note: The statements, opinions and data contained in all publications are solely those of the individual author(s) and contributor(s) and not of MDPI and/or the editor(s). MDPI and/or the editor(s) disclaim responsibility for any injury to people or property resulting from any ideas, methods, instructions or products referred to in the content. |
© 2023 by the authors. Licensee MDPI, Basel, Switzerland. This article is an open access article distributed under the terms and conditions of the Creative Commons Attribution (CC BY) license (https://creativecommons.org/licenses/by/4.0/).
Share and Cite
Park, K.; Golestani, B.; Nam, B.H.; Hou, J.; Eun, J. Study on the Combined Effect of Municipal Solid Waste Incineration Bottom Ash and Waste Shingle in Hot Mix Asphalt. Materials 2024, 17, 46. https://doi.org/10.3390/ma17010046
Park K, Golestani B, Nam BH, Hou J, Eun J. Study on the Combined Effect of Municipal Solid Waste Incineration Bottom Ash and Waste Shingle in Hot Mix Asphalt. Materials. 2024; 17(1):46. https://doi.org/10.3390/ma17010046
Chicago/Turabian StylePark, Kyungwon, Behnam Golestani, Boo Hyun Nam, Juan Hou, and Jongwan Eun. 2024. "Study on the Combined Effect of Municipal Solid Waste Incineration Bottom Ash and Waste Shingle in Hot Mix Asphalt" Materials 17, no. 1: 46. https://doi.org/10.3390/ma17010046
APA StylePark, K., Golestani, B., Nam, B. H., Hou, J., & Eun, J. (2024). Study on the Combined Effect of Municipal Solid Waste Incineration Bottom Ash and Waste Shingle in Hot Mix Asphalt. Materials, 17(1), 46. https://doi.org/10.3390/ma17010046