Article

Regularities in the Evolution of Thermoelastic Martensitic Transformations during Cooling/Heating in the Free State and under Load of Titanium Nickelide Alloyed with Niobium

by
Ekaterina S. Marchenko
1,2,
Anatoly A. Klopotov
1,
Gulsharat A. Baigonakova
1,* and
Ilya A. Zhukov
1,2
1
Laboratory of Superelastic Biointerfaces, National Research Tomsk State University, 36 Lenin Ave., 634045 Tomsk, Russia
2
Institute for Problems of Chemical and Energy Technologies, Siberian Branch of the Russian Academy of Sciences, St. Socialist 1, 659322 Biysk, Russia
*
Author to whom correspondence should be addressed.
Materials 2024, 17(1), 175; https://doi.org/10.3390/ma17010175
Submission received: 26 November 2023 / Revised: 25 December 2023 / Accepted: 26 December 2023 / Published: 28 December 2023
(This article belongs to the Special Issue Technology and Applications of Shape Memory Materials)

Abstract

:
This article presents the results of studies of the features of the development of thermoelastic martensitic transformations during cooling/heating in the free state and under load of Ti50Ni49.7−XNbXMo0.3 alloys (X = 0.5, 1.0 and 1.5 at% Nb) with shape memory effects. Using X-ray diffraction analysis, it was found that all the alloys studied at room temperature contained a multiphase mixture consisting of intermetallic compounds with the TiNi (B2, B19′), Ni56Ti29Nb15, and Ti2Ni compositions. Scanning electron microscopy was used to study the microstructure of TiNi (Nb,Mo) alloys and it was found that the distribution of fine Ni56Ti29Nb15 particles in the matrix depends significantly on the concentration of the alloying element. A correlation was established between changes in the structural-phase state in TiNi (Nb,Mo) alloys and the occurrence of the B2↔B19′ martensitic transition in the free state and under load. Based on physical and mechanical studies, the temperature ranges of the martensitic transformations (MT) in the free state and under load were established. Based on the thermodynamic description of the MT and the analysis of the characteristic temperatures of the MT, it was found that the MT mechanism is strongly dependent on the concentration of the alloying element.

1. Introduction

Titanium nickelide and alloys based on it have a set of unique physical and mechanical properties, such as the shape memory effect (SME), superelasticity. The use of this effect in alloys based on titanium nickelide is widely used in engineering and medicine [1]. The representation of SME is due to thermoelastic martensitic transformations (MT) [2]. The synthesis of alloys based on titanium nickelide with specific functional and technological properties is achieved by doping the binary NiTi alloy with a third component and by preliminary thermomechanical treatments. Ti50−XNi50−YNbX+Y alloys have unique properties among ternary alloys. This is because a wide hysteresis of the thermoelastic MT is observed in these alloys [3,4,5,6,7,8,9]. This property allows products and structural elements made of alloys based on TiNi(Nb) to be stored and transported over a wide range of ambient temperatures.
A large number of studies of SME manifestation features have been devoted to ternary alloys with high Nb content. There are the Ti44Ni47Nb9 [10,11], Ti47Ni44Nb9 [12,13], Ti45.81Ni45.76Nb8.43 [14] alloys which have been well studied. On the other hand, TiNi-based alloys with a low Nb concentration have not been extensively studied and are widely used in industry [4,5,6,7,8,9,10,15,16]. It has been found that in this Ti47Ni44Nb9 alloy, β-Nb particles are formed, which extend the thermal hysteresis of the MT. During plastic deformation of TiNi(Nb) alloys, the presence of more plastic β-Nb particles, in comparison with the main matrix based on the TiNi intermetallic compound, contributes to the weakening of the accumulation of energy of the elastic deformation of martensite [4,8,10,17]. One of the main features of Nb-doped TiNi alloys is the large difference in the melting temperatures of the Nb alloying element relative to the two main alloying elements Ti and Ni. This means that the formation of segregations is difficult to avoid. It can therefore be assumed that the addition of small concentrations of Nb to TiNi based alloys is the most optimal.
The aim of this work was to study the features of the development of thermoelastic martensitic transformations during cooling/heating in the free state and under the load of TiNi-based alloys with low Nb concentrations.

2. Materials and Methods

2.1. Alloy Preparation

In the induction furnace ISV-0.004 PI M1, a series of alloys Ti50Ni49.7−XNbXMo0.3 (X = 0.5, 1.0 and 1.5 at% Nb) was melted by remelting spongy titanium and nickel of N1 grade. The composition was determined by the charge. The weight loss of ingots during melting did not exceed 0.01%. The resulting ingots had a weight of 550 g, a length of 300 mm and a diameter of 22 mm. To study the functional properties, samples with dimensions of 50 mm in length and 1 mm × 1 mm in cross section were cut by the electro-erosive method. To carry out structural studies, 1 mm thick plates with dimensions of 10 mm × 10 mm were cut out.

2.2. Structure Characterization Methods

The microstructure of the alloys was studied using a Carl Zeiss Axiovert 40 MAT metallographic microscope (Oberkochen, Germany). The Thermo Scientific Axia ChemiSEM scanning electron microscope (SEM) (Waltham, MA, USA) with an energy dispersive X-ray spectrometer (EDS) was used for the quantitative elemental analysis. To study the microstructure, thin sections were prepared in a standard way. To reveal the microstructure, a solution of hydrofluoric and nitric acids was used (3 mL HF, 2 mL HNO3, 95 mL H2O).
The phase composition of the samples was studied using a DRON-4 and a Shimadzu XRD-6000 diffractometer (Kyoto, Japan) in Cokα and Cukα radiation. A monochromator was used to cut off the β-radiation. X-ray diffraction studies were carried out according to the methods described in [18]. The diffraction patterns were indexed using the PowderCell 2.4 program. The XRD analysis was carried out at the Tomsk Regional Core Shared Research Facilities Center of the National Research Tomsk State University, within grants (nos. 075-15-2021-693 and 13.RFC.21.0012) from the Ministry of Science and Higher Education of the Russian Federation.

2.3. The Study of the Nature of Martensitic Transformation

The study of the nature and sequence of MT was carried out by measuring the temperature dependence of the electrical resistance and by X-ray diffraction analysis. The characteristic temperatures and intervals of manifestation of the MT were determined by the potentiometric method from the temperature dependence of the electrical resistivity. To determine the MT behavior, the electrical resistivity of the samples (50 mm × 1 mm × 1 mm) was measured by the four-point-probe method in a temperature range from −180 to +180 °C [18,19]. The multiple shape memory effect test was carried out by measuring the macrostrain under a tension loading of 2 kg on an Instron testing machine with a cooling–heating chamber.

3. Thermodynamics of Thermoelastic Martensitic Transformations

It has been shown in [19,20] that thermoelastic MT begins when the alloy is overcooled by ΔToverc relative to the chemical equilibrium temperature T0 of the austenite and martensite phases to a lower temperature MS.
At temperature T0, the Gibbs chemical free energy of austenite and martensite is the same. According to the Tong–Weiman formula [19,20], the temperature T is determined by the expression. It should provide a concise and accurate description of the experimental results, their interpretation and the experimental conclusions that can be drawn.
T 0 = M s + A f 2
MS and Af are temperatures at the beginning of the forward MT and the end of the reverse MT.
On the other hand, the relationship between the temperatures MS and T0 can be represented as below:
M s = T 0 Δ T overc
It follows from expression (2) that the temperature of direct MT depends on the magnitude of overcooling, which in turn depends on the external mechanical stresses [19,20].
In the case when direct MT occurs in alloys in the absence of external mechanical stresses, then the energy balance can be written as in [21]:
Δ G ch A M + Δ G nonch A M = 0
Here Δ G ch A M is the chemical driving force of the MT and Δ G nonch A M is the Gibbs free energy of a non-chemical nature. These energies are determined by the expressions in [21]:
Δ G ch A M = Δ H ch A M T × Δ S ch A M
Δ G nonch A M = Δ G rev A M + Δ G fr A M
Here Δ G rev A M is the reversible component of the energy, which is the sum of the elastic and surface energies. These energies are accumulated in the alloy during direct MT and depend on the volume fraction of the martensite phase δ; Δ G fr A M is irreversible non-chemical free energy, which is responsible for the irreversible dissipation of energy in the MT process; Δ S ch A M is entropy of MT.
In [22], expressions were obtained for the characteristic temperatures of the MT:
M s = T 0 Δ G rev 0 Δ S ch Δ G fr Δ S ch
M f = T 0 Δ G rev 1 Δ S ch Δ G fr Δ S ch
A s = T 0 Δ G rev 1 Δ S ch + Δ G fr Δ S ch
A f = T 0 Δ G rev 0 Δ S ch + Δ G fr Δ S ch
Here Δ G rev ( 0 ) and Δ G rev ( 1 ) are the reversible elastic Δ G el and surface energies Δ G s , accumulated in the alloy during direct MT at the volume fraction of the martensite phase δ = 0 and δ = 1, respectively ( Δ G rev = Δ G el + Δ G s ). With direct MT, the entropy of transformation is Δ S ch A M < 0 , and with reverse MT Δ S ch A M > 0 ; then in Equations (6a)–(6d) the entropy is Δ S ch = | Δ S ch A M | .
Transforming Equations (6a) and (6b), we obtain the following expressions:
Δ G fr = Δ S ch 2 ( A f M s )
A f M s = 2 Δ G fr Δ S ch
A s M s = 1 Δ S ch ( 2 Δ G fr Δ G rev )
Δ G rev ( 1 ) = M s M f Δ S ch 2 + ( A f A s ) Δ S ch 2
From the expressions obtained (7)–(9), there are important consequences. First, energy dissipation Δ G fr determines the amount of thermal hysteresis ( A f A s ) . Second, the value of the temperature intervals of direct ( Δ = M s M f ) and reverse ( Δ = A f A s ) MT is dependent in direct proportion to the reversible component of free energy. Third, the temperature difference between the beginning of the direct and the beginning of the reverse ( A s M s ) MT is determined by the ratio between the reversible Δ G rev ( 1 ) and irreversible Δ G fr energies. Fourth, when the relation A s < M s is observed, then the condition Δ G fr < 0.5 Δ G rev ( 1 ) is satisfied.
The theoretical consideration of the features of a thermoelastic MT presented in this section will be used in this paper to analyze the obtained experimental data.

4. Results and Discussion

4.1. Structural and Phase States of TiNi-Based Alloys Doped with Nb

X-ray diffraction studies of TiNi-based alloys doped with Nb have shown that the alloy contains an austenitic phase with a B2 structure, a martensitic phase with a B19′ structure, and a secondary Ti2Ni phase. No data have been found to indicate the formation of additional niobium-based phases. The intensity of reflections from the secondary Ti2Ni phase is low. The estimate shows that the amount of the Ti2Ni phase does not exceed 5%.
Analysis of the X-ray patterns of the alloys studied made it possible to establish that all the X-ray patterns contain structural reflections of the B19′ martensitic phase with high intensity (Figure 1 and Figure 2). Moreover, the ratio between the intensities of the main reflections between the austenitic and martensitic phases depends on the concentration of the alloying element Nb. Thus, in alloys with an alloying element concentration of less than 1.5 at% Nb, the intensity of the main reflection (110)B2 of the austenitic phase B2 is less than the intensity of the reflection ( 1 1 ¯ 1 ) B 19 of the martensite phase B19′, i.e., ( I 110 ( B 2 ) < I 1 1 ¯ 1 ( B 19 ) . In alloys with an alloying element concentration 1.5 at% Nb, on the contrary, I 110 ( B 2 ) > I 1 1 ¯ 1 ( B 19 ) (Figure 1, Figure 2 and Figure 3).
Figure 4 shows the dependence of the ratio of the intensities of the structural line of the martensite phase B19′ to the structural line of the austenite phase B2 on the concentration of Nb atoms in the alloys under study.
It should be noted from this dependence that as the Nb concentration increases, the ratio of the intensity of the reflection ( 1 1 ¯ 1 ) B 19 to the intensity of the reflection (110)B2 decreases. This indicates that alloying alloys based on titanium nickelide with niobium leads to an increase in the stability of the high-temperature B2 phase at room temperature relative to the B19′ martensitic phase.
The unit cell parameter of the B2 phase was determined for alloys with different contents of niobium. Based on the obtained values of the unit cell parameters, we calculated the change in the atomic volume in the B2 phase as a function of the Nb concentration (Figure 5).
It can be seen that with an increase in the concentration of niobium atoms, an increase in the lattice parameter and atomic volume of the B2 phase is observed. This indicates that some of the Nb atoms are dissolved in the B2 matrix phase. It should be noted here that a nonlinear increase in the lattice parameter is observed depending on the concentration of the alloying element. This may indicate a more significant dissolution of Nb atoms in the crystal lattice in the TiNi compound with the B2 structure, or it may also indicate the formation of a larger amount of Ti2Ni secondary phase particles than in other alloys with a lower concentration of the Nb alloying element.
The resulting increase in the lattice parameter demonstrates an increase in the atomic volume per ion in the crystal lattice of the B2 phase. This phenomenon correlates with the fact that the size of the atoms of the Nb alloying element is larger than the size of the atoms of the main alloy-forming elements Ti and Ni (RTi = 0.1462 nm, RNi = 0.1246 nm and RNb = 0.1468 nm). Niobium, according to microanalysis data, dissolved in the matrix phase with the B2 (B19′) structure in an amount from 0.18 to 0.49 at%.

4.2. Microstructure of TiNi-Based Alloys Doped with Nb

Figure 6, Figure 7, Figure 8, Figure 9 and Figure 10 show micrographs of Nb-doped TiNi-based alloys. Analysis of the micrographs revealed a mixture of the solid solution melt with areas of granular crystallization and eutectics. The microstructure of each alloy is different and depends on the concentration of the alloying element. In all the alloys studied, particles of arbitrary geometry with sizes in the order of 1–2 µm were found, located both along the grain boundaries and within the grain body in the form of individual small inclusions and local accumulations (Figure 6, Figure 9 and Figure 10. Individual grain boundaries are occupied by another type of particle, Ti2Ni of 0.2 to 1 µm in size, formed in the form of chains (Figure 6, Figure 9 and Figure 10).
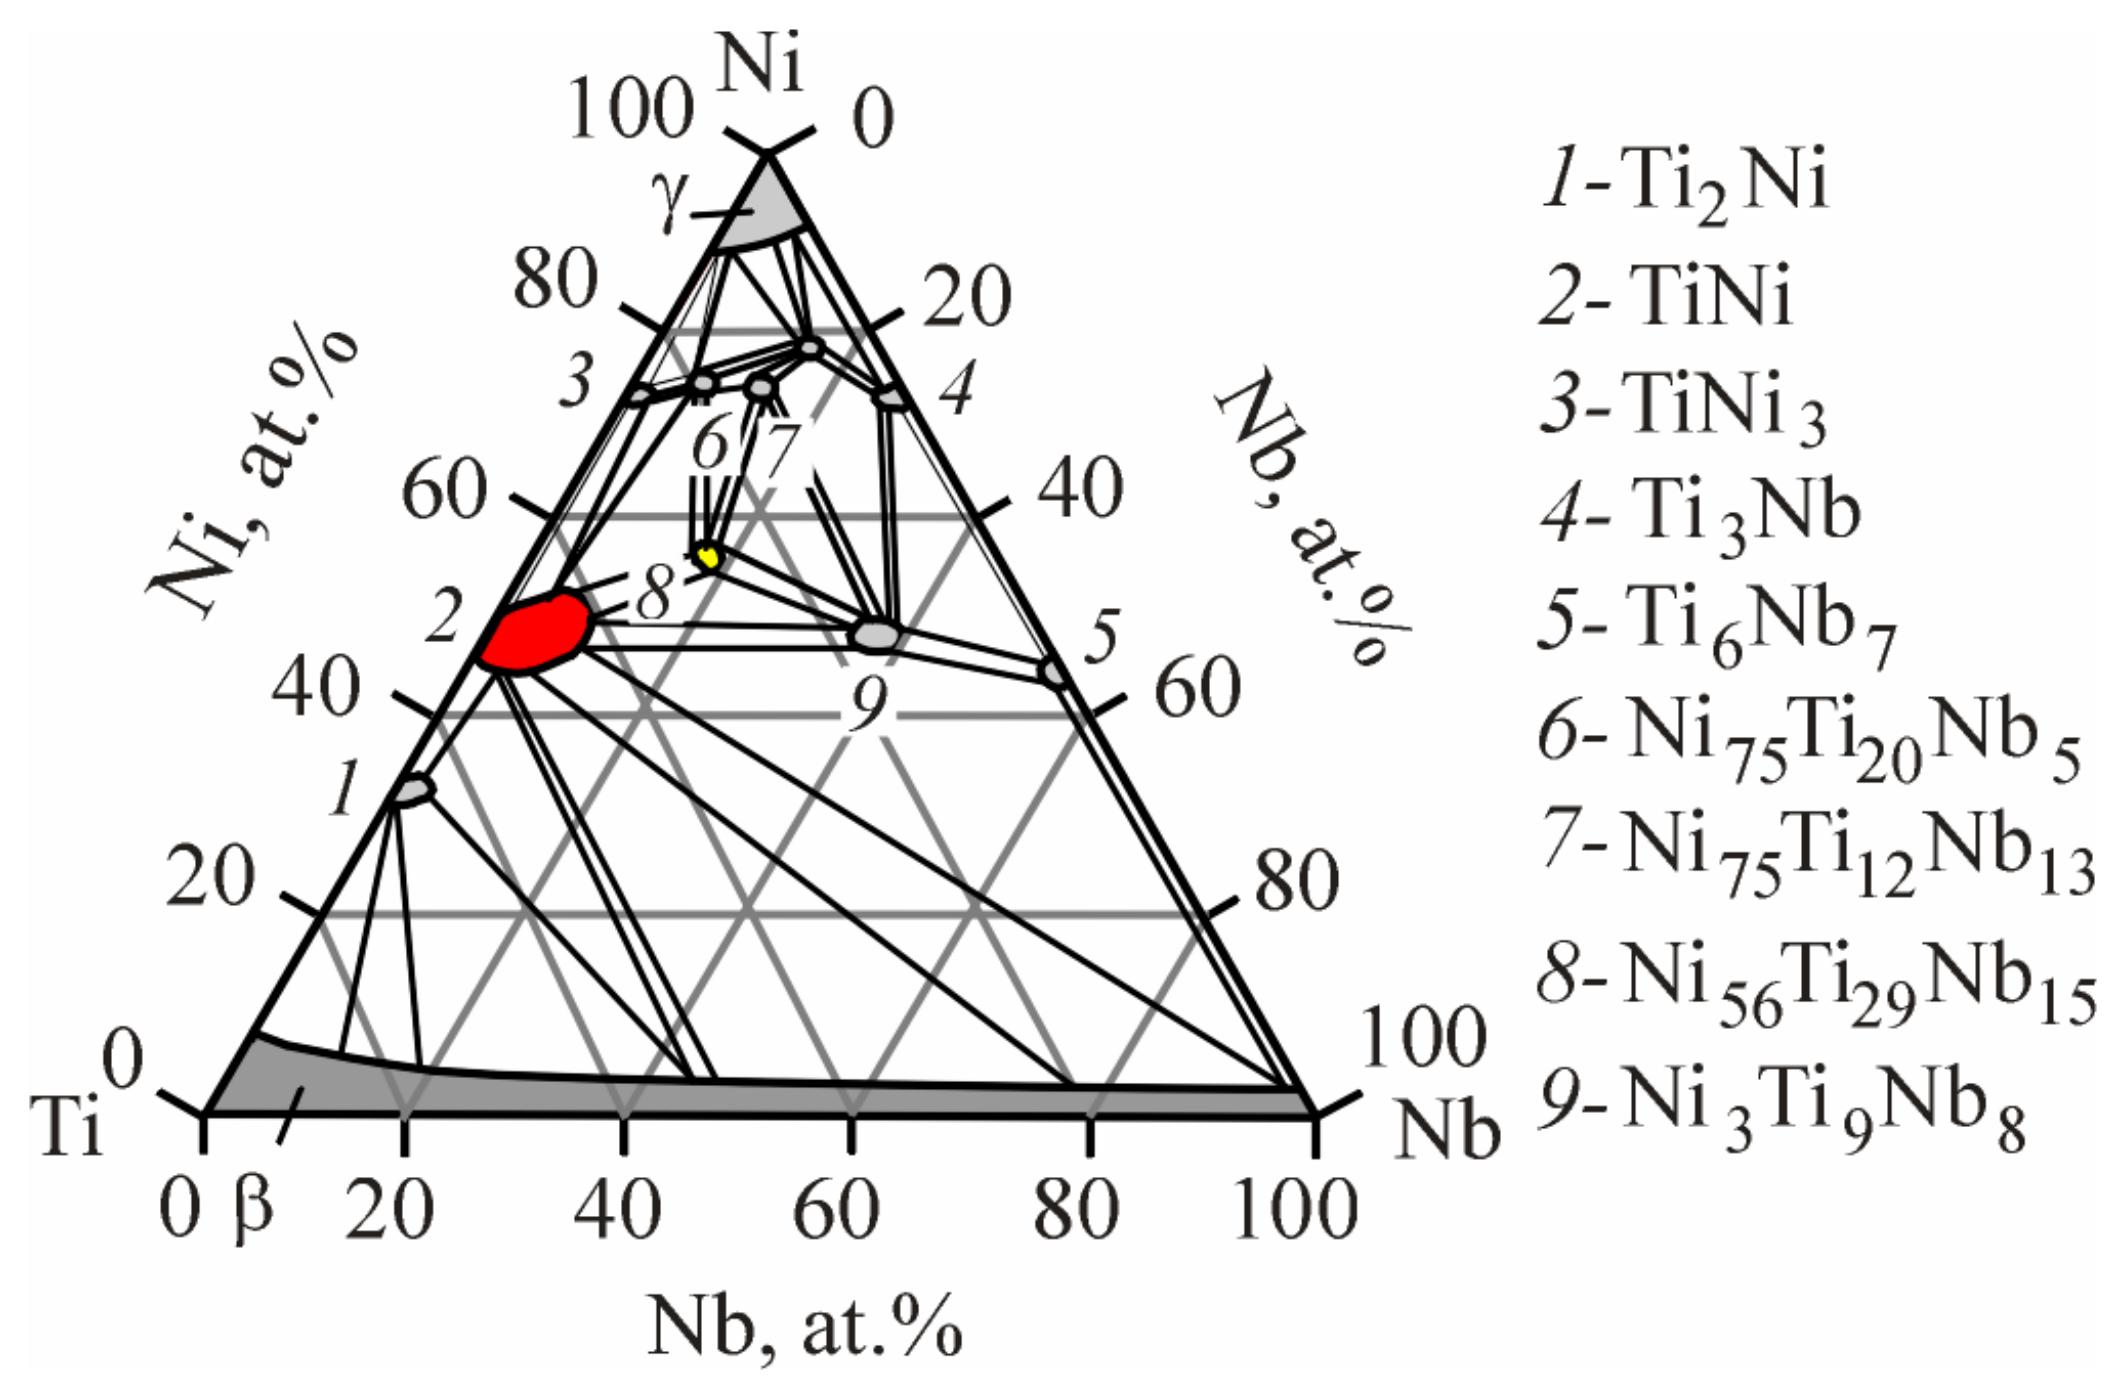
Ti50Ni49.2Nb0.5Mo0.3 alloy. Qualitative and quantitative microanalysis of the Ti50Ni49,2Nb0.5Mo0,3 alloy was carried out by scanning electron microscopy (Figure 6, Table 1). Elemental distribution maps and local quantitative microanalysis made it possible to identify the matrix based on the intermetallic compound B2—TiNi, Ti2Ni, and Ni56Ti29Nb15 phases (Figure 6a–c). The Ni56Ti29Nb15 phase crystallizes in the form of light particles in the grain body. According to the results of EDS microanalysis (Ni = 54–57 at%, Ti 28–31 at% and Nb = 13–16 at%) and comparison of the data with the Ti-Ni-Nb triple state diagram [23] (Figure 7), it can be assumed that this is a phase of the Ni56Ti29Nb15 type. The presence of a Ti2Ni secondary intermetallic phase along the grain boundaries of the TiNi matrix was also observed (Figure 6c). As a result of Ti redistribution, Ti2Ni particles are formed from the TiNi matrix phase. This leads to an increase in the nickel concentration in the matrix phase. The average grain size in the alloy of this composition is 15 μm. It was also found that the area inside the grains contains a small amount of Nb particles (up to 0.28 at%) in addition to titanium and nickel, indicating dissolution of Nb in the matrix phase.
A feature of the phase diagram of the Ti-Ni-Nb ternary system is that it reflects the features of the phase diagrams of the Ti-Ni, Ni-Nb and Ti-Nb binary systems only in limited areas adjacent to the sides and corners of the isothermal triangle [23,24]. In the Ti-Nb binary system, immediately after solidification, the components form a continuous solid solution over the entire plane in temperature-concentration coordinates, and this state extends to low temperatures. In the Ti-Ni and Ni-Nb systems, on the other hand, there are intermediate intermetallic compounds with narrow regions of homogeneity [24]. On the side of the isothermal Ti-Ni triangle at a temperature of 800 °C in the Ti-Ni-Nb ternary system, in the region of equiatomic composition, the TiNi compound crystallizes in a cubic bcc lattice with the B2 structure. Within the Ti-Ni-Nb isothermal triangle, the formation of the ternary compounds TixNiyNbz with limited areas of homogeneity is observed (Figure 7). This phenomenon indicates a tendency to release intermetallic compounds of complex composition. It can be seen that the compound closest to the homogeneity region of the TiNi compound is the Ni56Ti29Nb15 compound (Figure 7, region 8). This is in good agreement with the fact that when TiNi based alloys are alloyed with Nb, the detected particles in the alloys studied have chemical compositions close to the composition of the compound.
In order to obtain precise information on the microstructure and phase composition of the material, thin foils were prepared for TEM. The technique of sample preparation included ionic thinning of the internal volumes of the material. The results of the structural analysis are shown in Figure 8. The corresponding microdiffraction patterns show reflections from the matrix B2 (TiNi) phase characterized by a volume-centered cubic lattice (Figure 8a). In addition to the main matrix phase, the most frequently encountered particles of Ti2Ni second phases are present in the samples (Figure 8c). The samples contain martensite lamellae with several orientational variants belonging to the B19′ phase (Figure 8b).
Ti50Ni48.7Nb1Mo0.3 alloy. Based on the analysis of quantitative microanalysis data, it was found that in the Ti50Ni48.7Nb1Mo0.3 alloy (Figure 9), the volume fraction of secondary phases decreases and particles of the Ni56Ti29Nb15 phase crystallize only along the grain boundaries (Figure 9). It was also found that the introduction of 1 at% Nb leads to a decrease in the amount of eutectic in the alloy. The average grain size in the alloy of this composition is 12 μm. Quantitative elemental analysis indicates the dissolution of Nb particles (0.28–0.45 at%) in the matrix and the precipitation of a phase with the composition Ni56Ti29Nb15 (Table 2).
Ti50Ni48.2Nb1.5Mo0.3 alloy. Analysis of micrographs of Ti50Ni48.2Nb1.5Mo0.3 alloys made it possible to establish that the alloy consists of a solid solution with areas of dendritic crystallization (Figure 10). In this alloy, during crystallization, a microstructural state without eutectic is formed, in contrast to alloys with 0.5 and 1 at%. The data of quantitative microanalysis are presented in Table 3. The Ti50Ni48.2Nb1.5Mo0.3 alloy consists of a TiNi solid solution with a small amount of Nb and Mo dissolved in it and areas of dendritic crystallization. Particles of the Ni56Ti29Nb15 phase crystallize along the boundaries of dendritic cells. In the alloy of this composition, a high content of Ti2Ni particles is observed, which is confirmed by the data of X-ray diffraction analysis.
It has been established that the average grain size in alloys with an increase in the Nb concentration to 1 at% decreases from 15 to 12 µm. This fact can be related to the fact that in these alloys, as was shown above, particles of the Ni56Ti29Nb15 compound are formed, which are located mainly along the grain boundaries and have an obstructive effect on the development and growth of grains. Thus, in alloys based on titanium nickelide of various compositions, similar structures are formed with features of distribution density, size, secondary phases, and their accumulations. A more uniform structure is observed in the Ti50Ni48.7Nb1Mo0.3 alloy with a predominant distribution of particles based on niobium along the grain boundaries.

4.3. Temperature Dependences of Electrical Resistance in Nb-Doped TiNi-Based Alloys

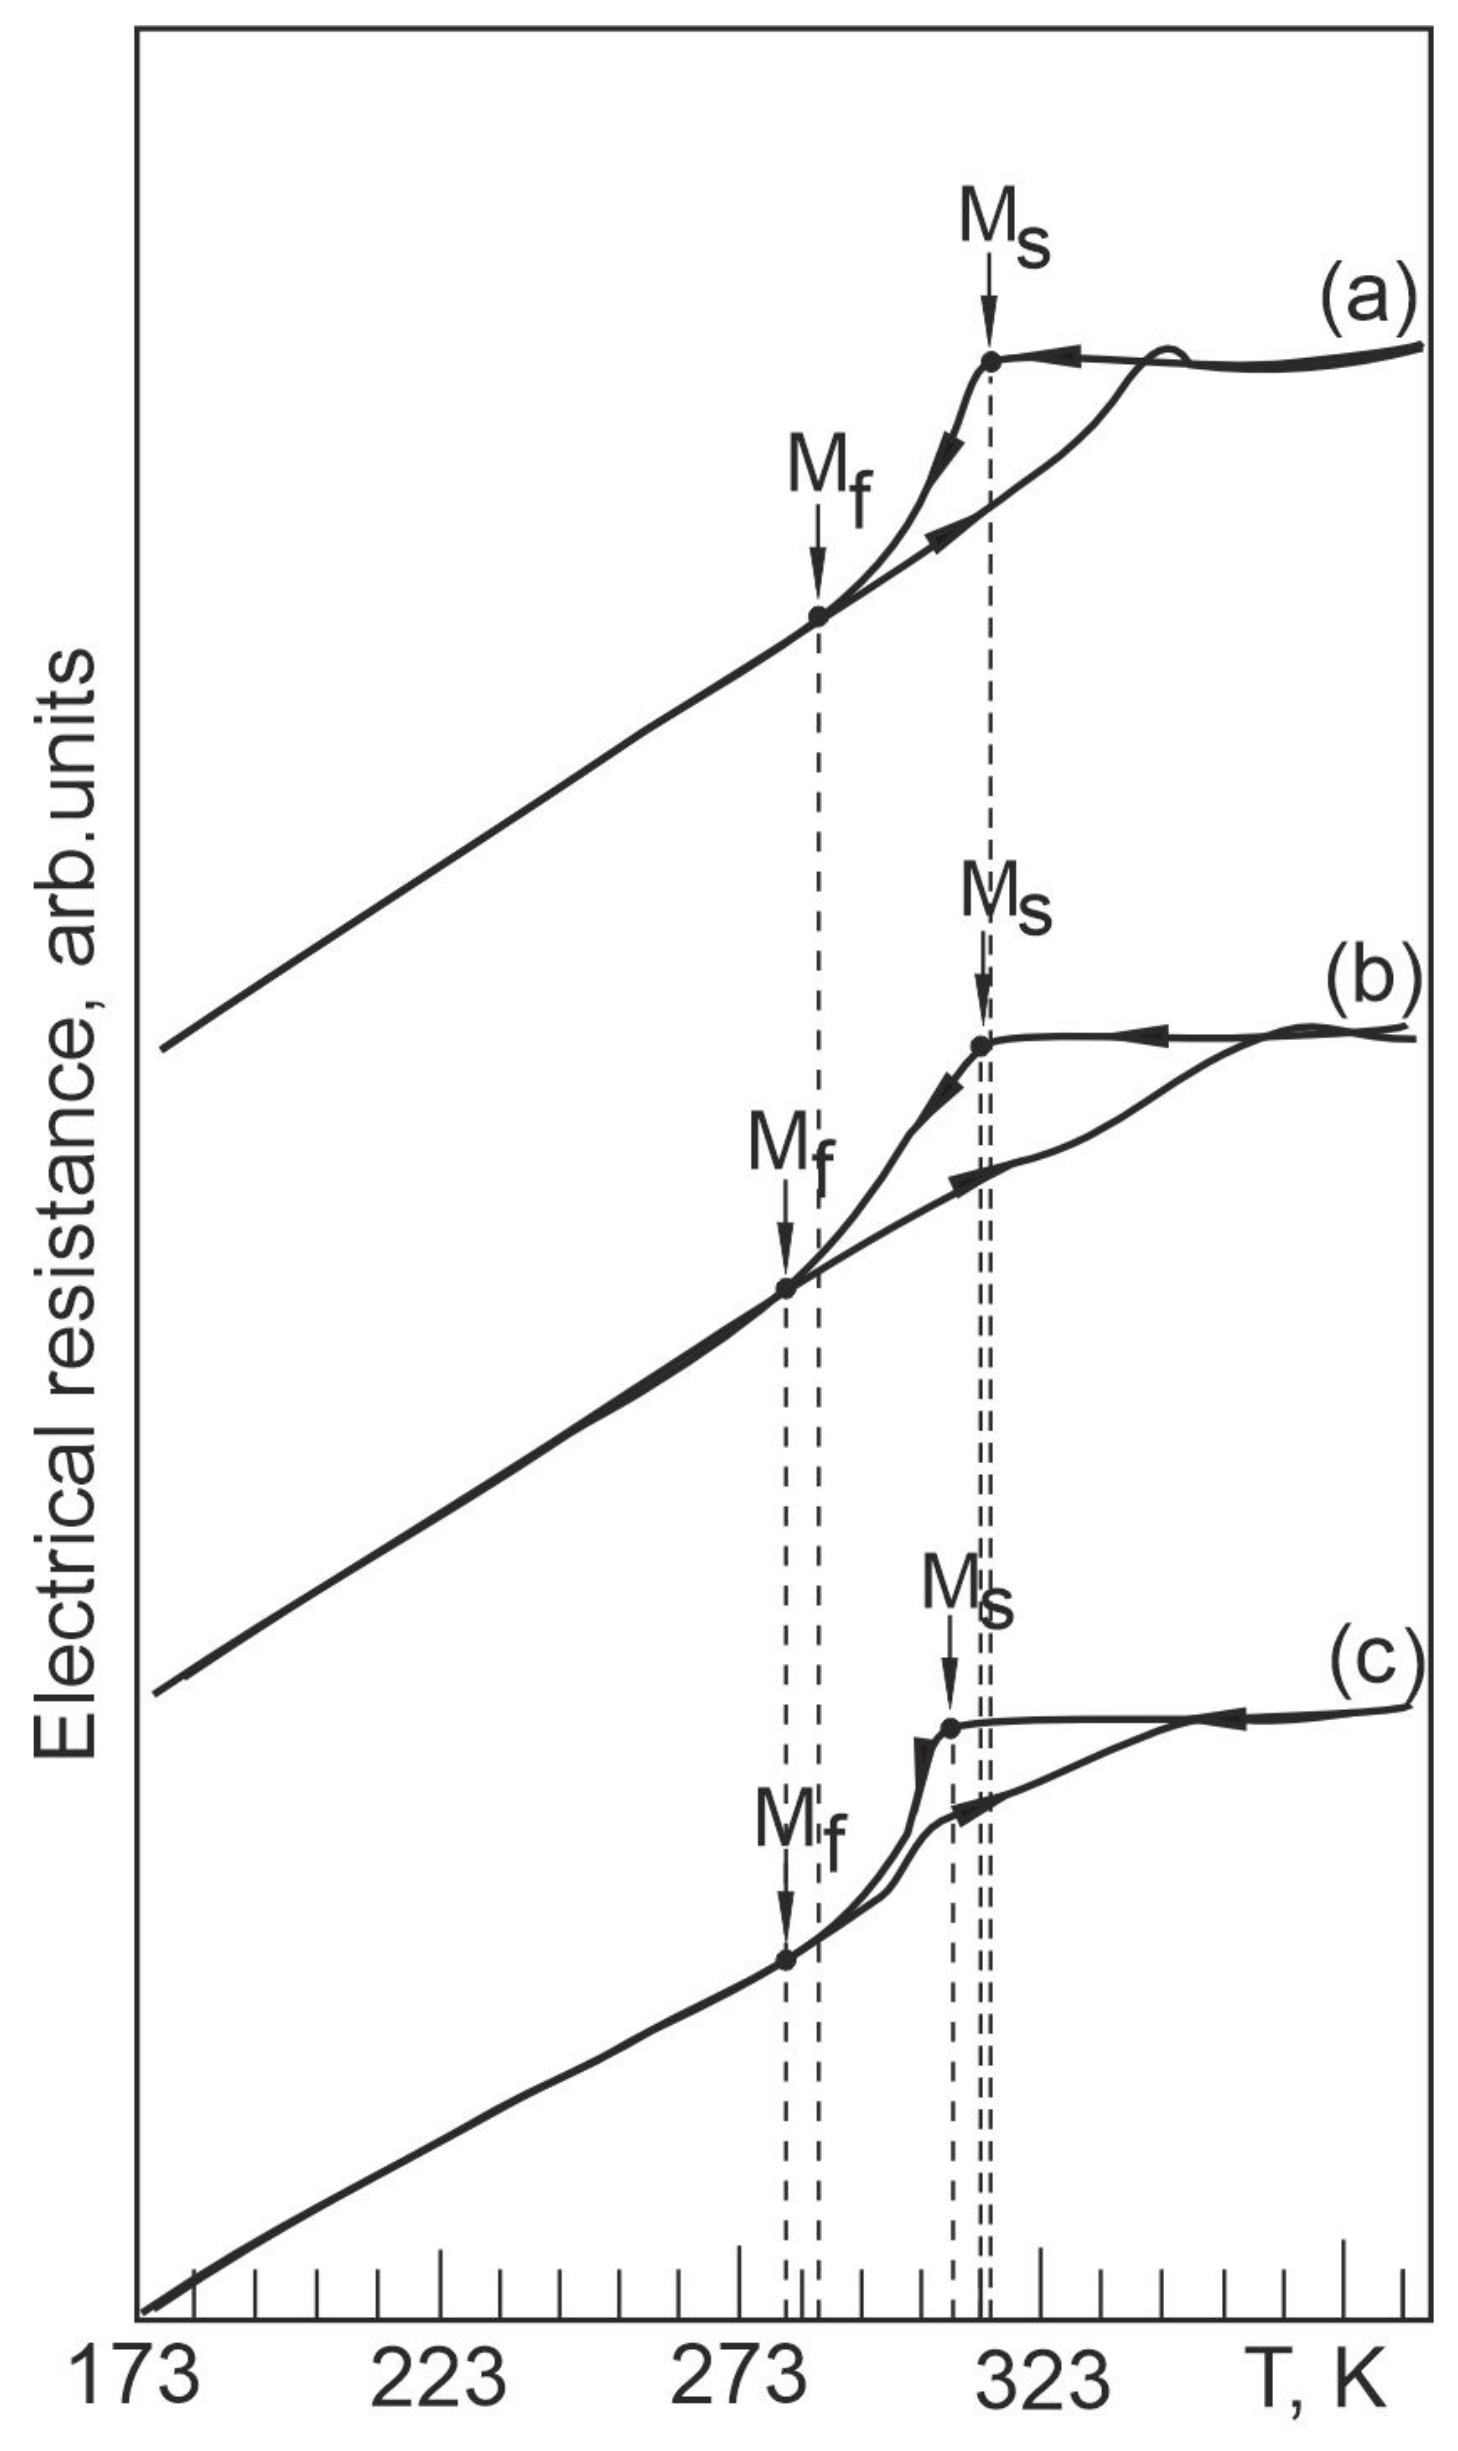
To determine the temperature ranges of the MT during cooling/heating in the free state in TiNi-based alloys doped with Nb, the temperature dependences of the electrical resistance were obtained (Figure 11). The nature of the change in ρ(T) indicates that a single-stage MT occurs in the alloys studied from the initial B2 phase to the B19′ martensitic phase. Previously using X-ray diffraction analysis, it was found that the matrices of the studied alloys responsible for the thermoelastic martensitic transformations are in a two-phase state: austenitic B2 phase and martensite phase B19′ (see Section 4.1). According to the literature data on ternary TiNi(Nb) alloys [10,15,25] and our X-ray diffraction data, it can be concluded that the B2→B19′ MT occurs in these alloys.
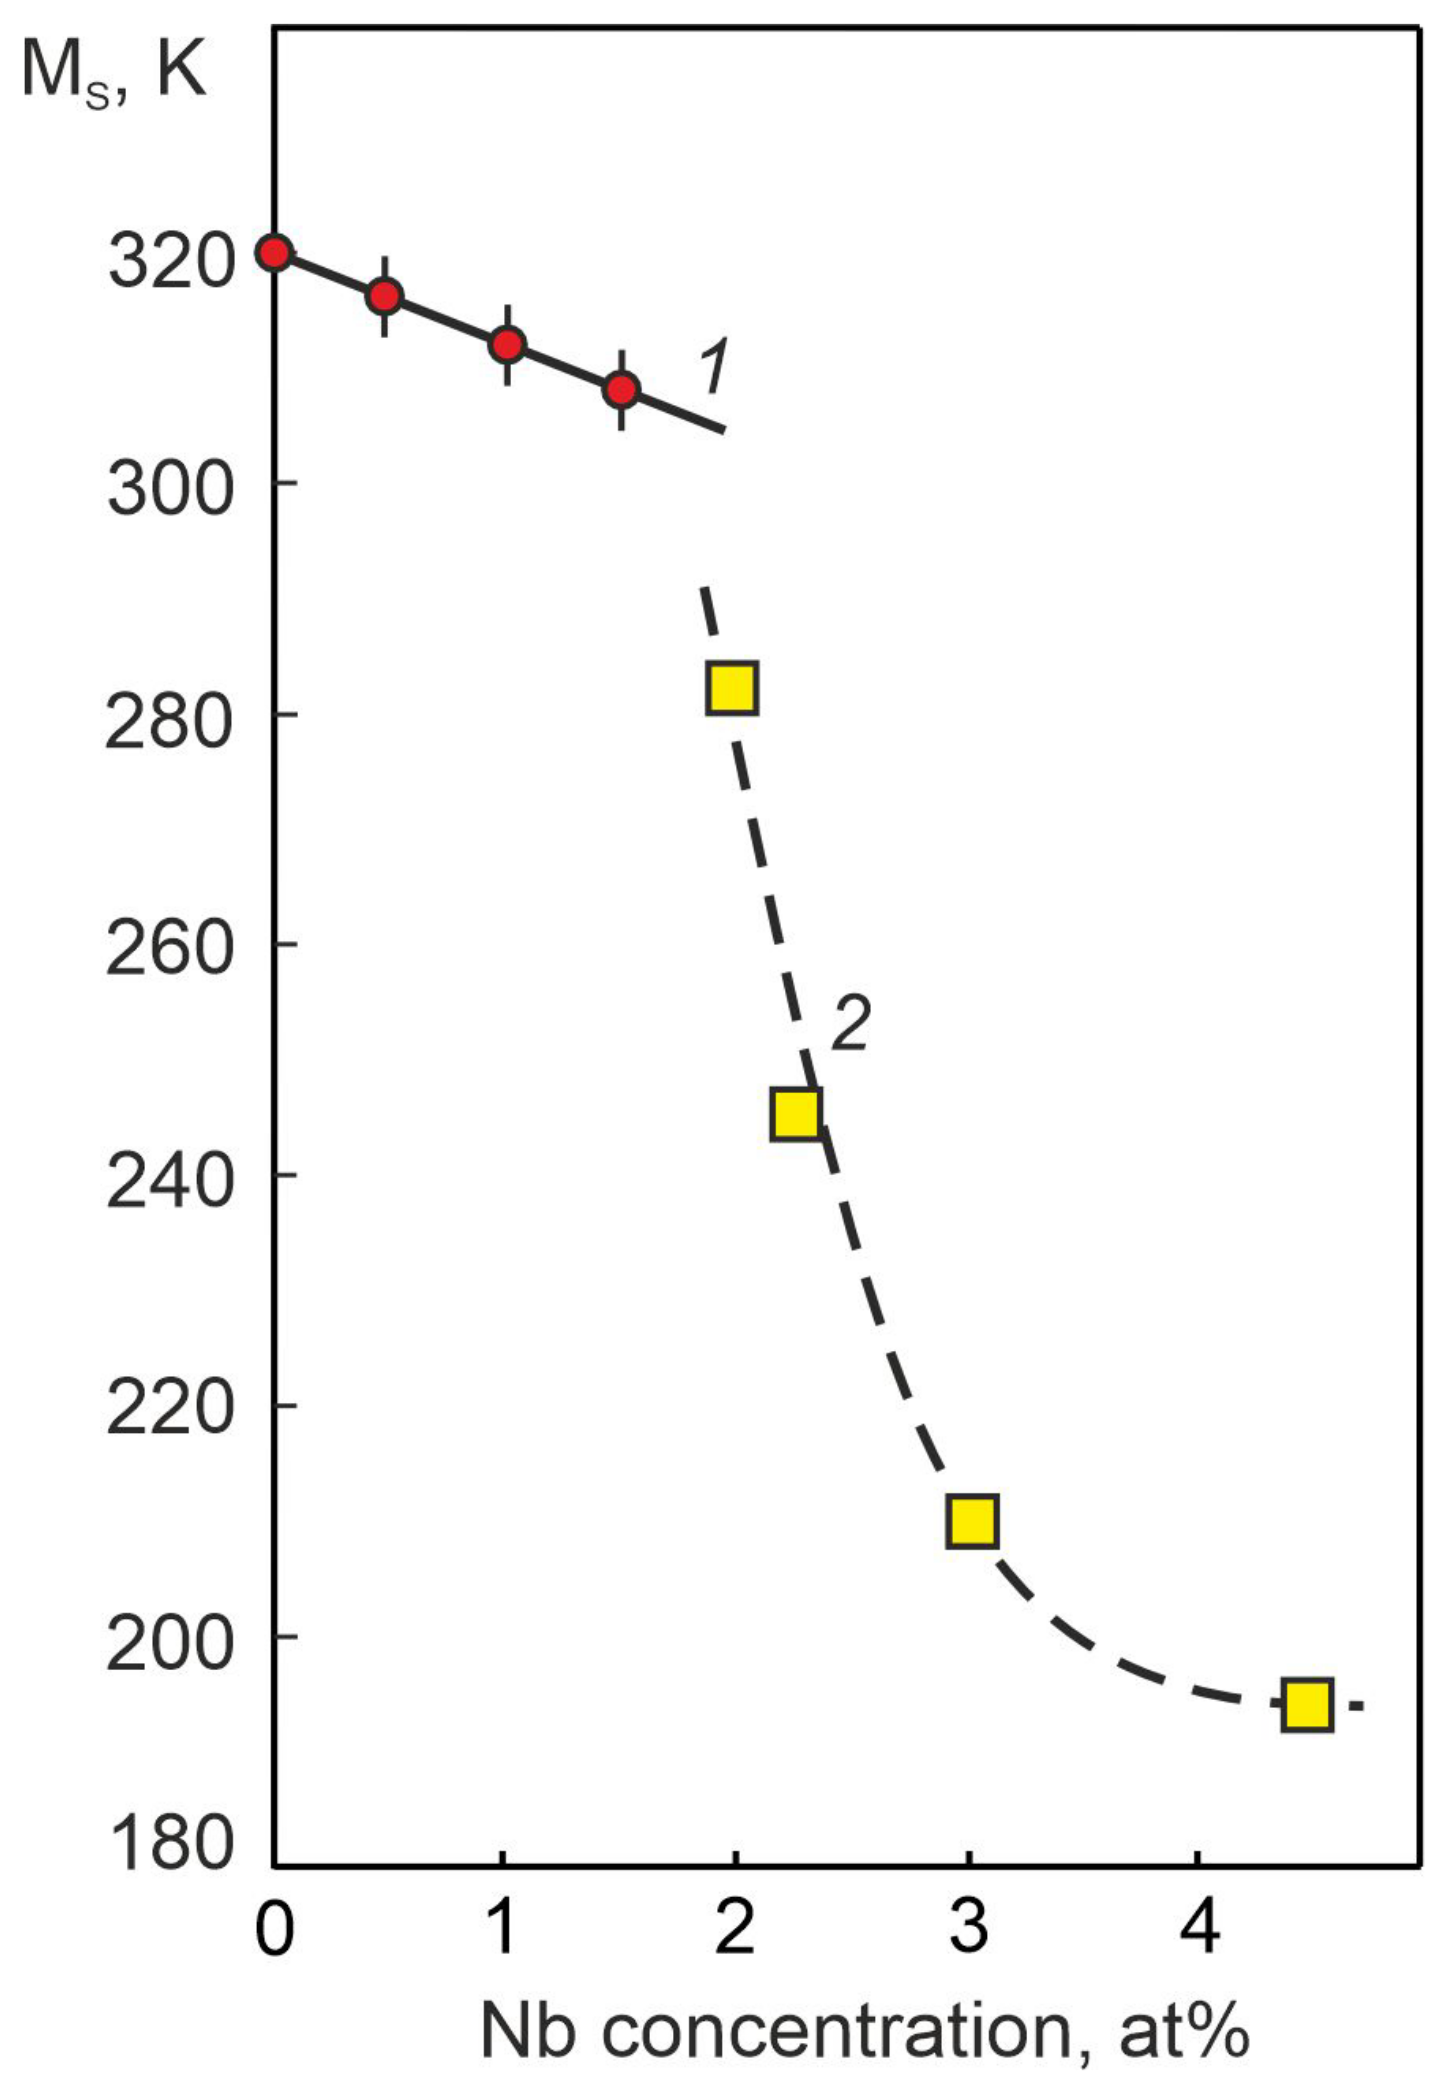
An analysis of the obtained data showed that with an increase in the Nb concentration, the MT shifts to the region of low temperatures. Based on these temperature dependences, the concentration dependence of the temperature of the beginning of the forward MT MS was obtained (Figure 12). It can be seen that alloying TiNi-based alloys with niobium according to the Ti50Ni50−XNbX scheme leads to a noticeable decrease in the MS temperature.
In the literature, there are no works devoted to the study of the effect of low concentrations of Nb atoms during alloying of alloys based on titanium nickelide according to the Ti50Ni50−XNbX scheme on structure and phase composition. However, there are a number of works devoted to the study of the effect of doping with Nb atoms from 2 to 20 at% Nb of titanium nickelide according to the Ti50−XNi50NbX and Ti50−YNi50−XNbY+X schemes on the structural-phase states in wide temperature ranges [3,4,5,6,10,11,12,15,26,27,28]. Based on the analysis of literature data, the temperature dependence of the electrical resistance for TiNi-based alloys doped with Nb according to the Ti50−XNi50NbX scheme was plotted (Figure 12, curve 2). A more intense decrease in the temperature of the onset of thermoelastic MT MS is observed than in alloys based on TiNi alloyed with Nb according to the scheme Ti50Ni50−xNbX. These data correlate with the results obtained in [29], where it was found that Nb atoms prefer to occupy titanium positions on the crystal lattice sites in TiNi and Ti2Ni intermetallic compounds rather than nickel positions. This tendency contributes to the stability of the B2 phase in TiNi (Nb) alloys doped according to the Ti50−XNi50NbX scheme and, consequently, to a more intense decrease in the MT temperature with an increase in the concentration of the alloying component.

4.4. Shape Memory Effect in Nb-Doped TiNi-Based Alloys

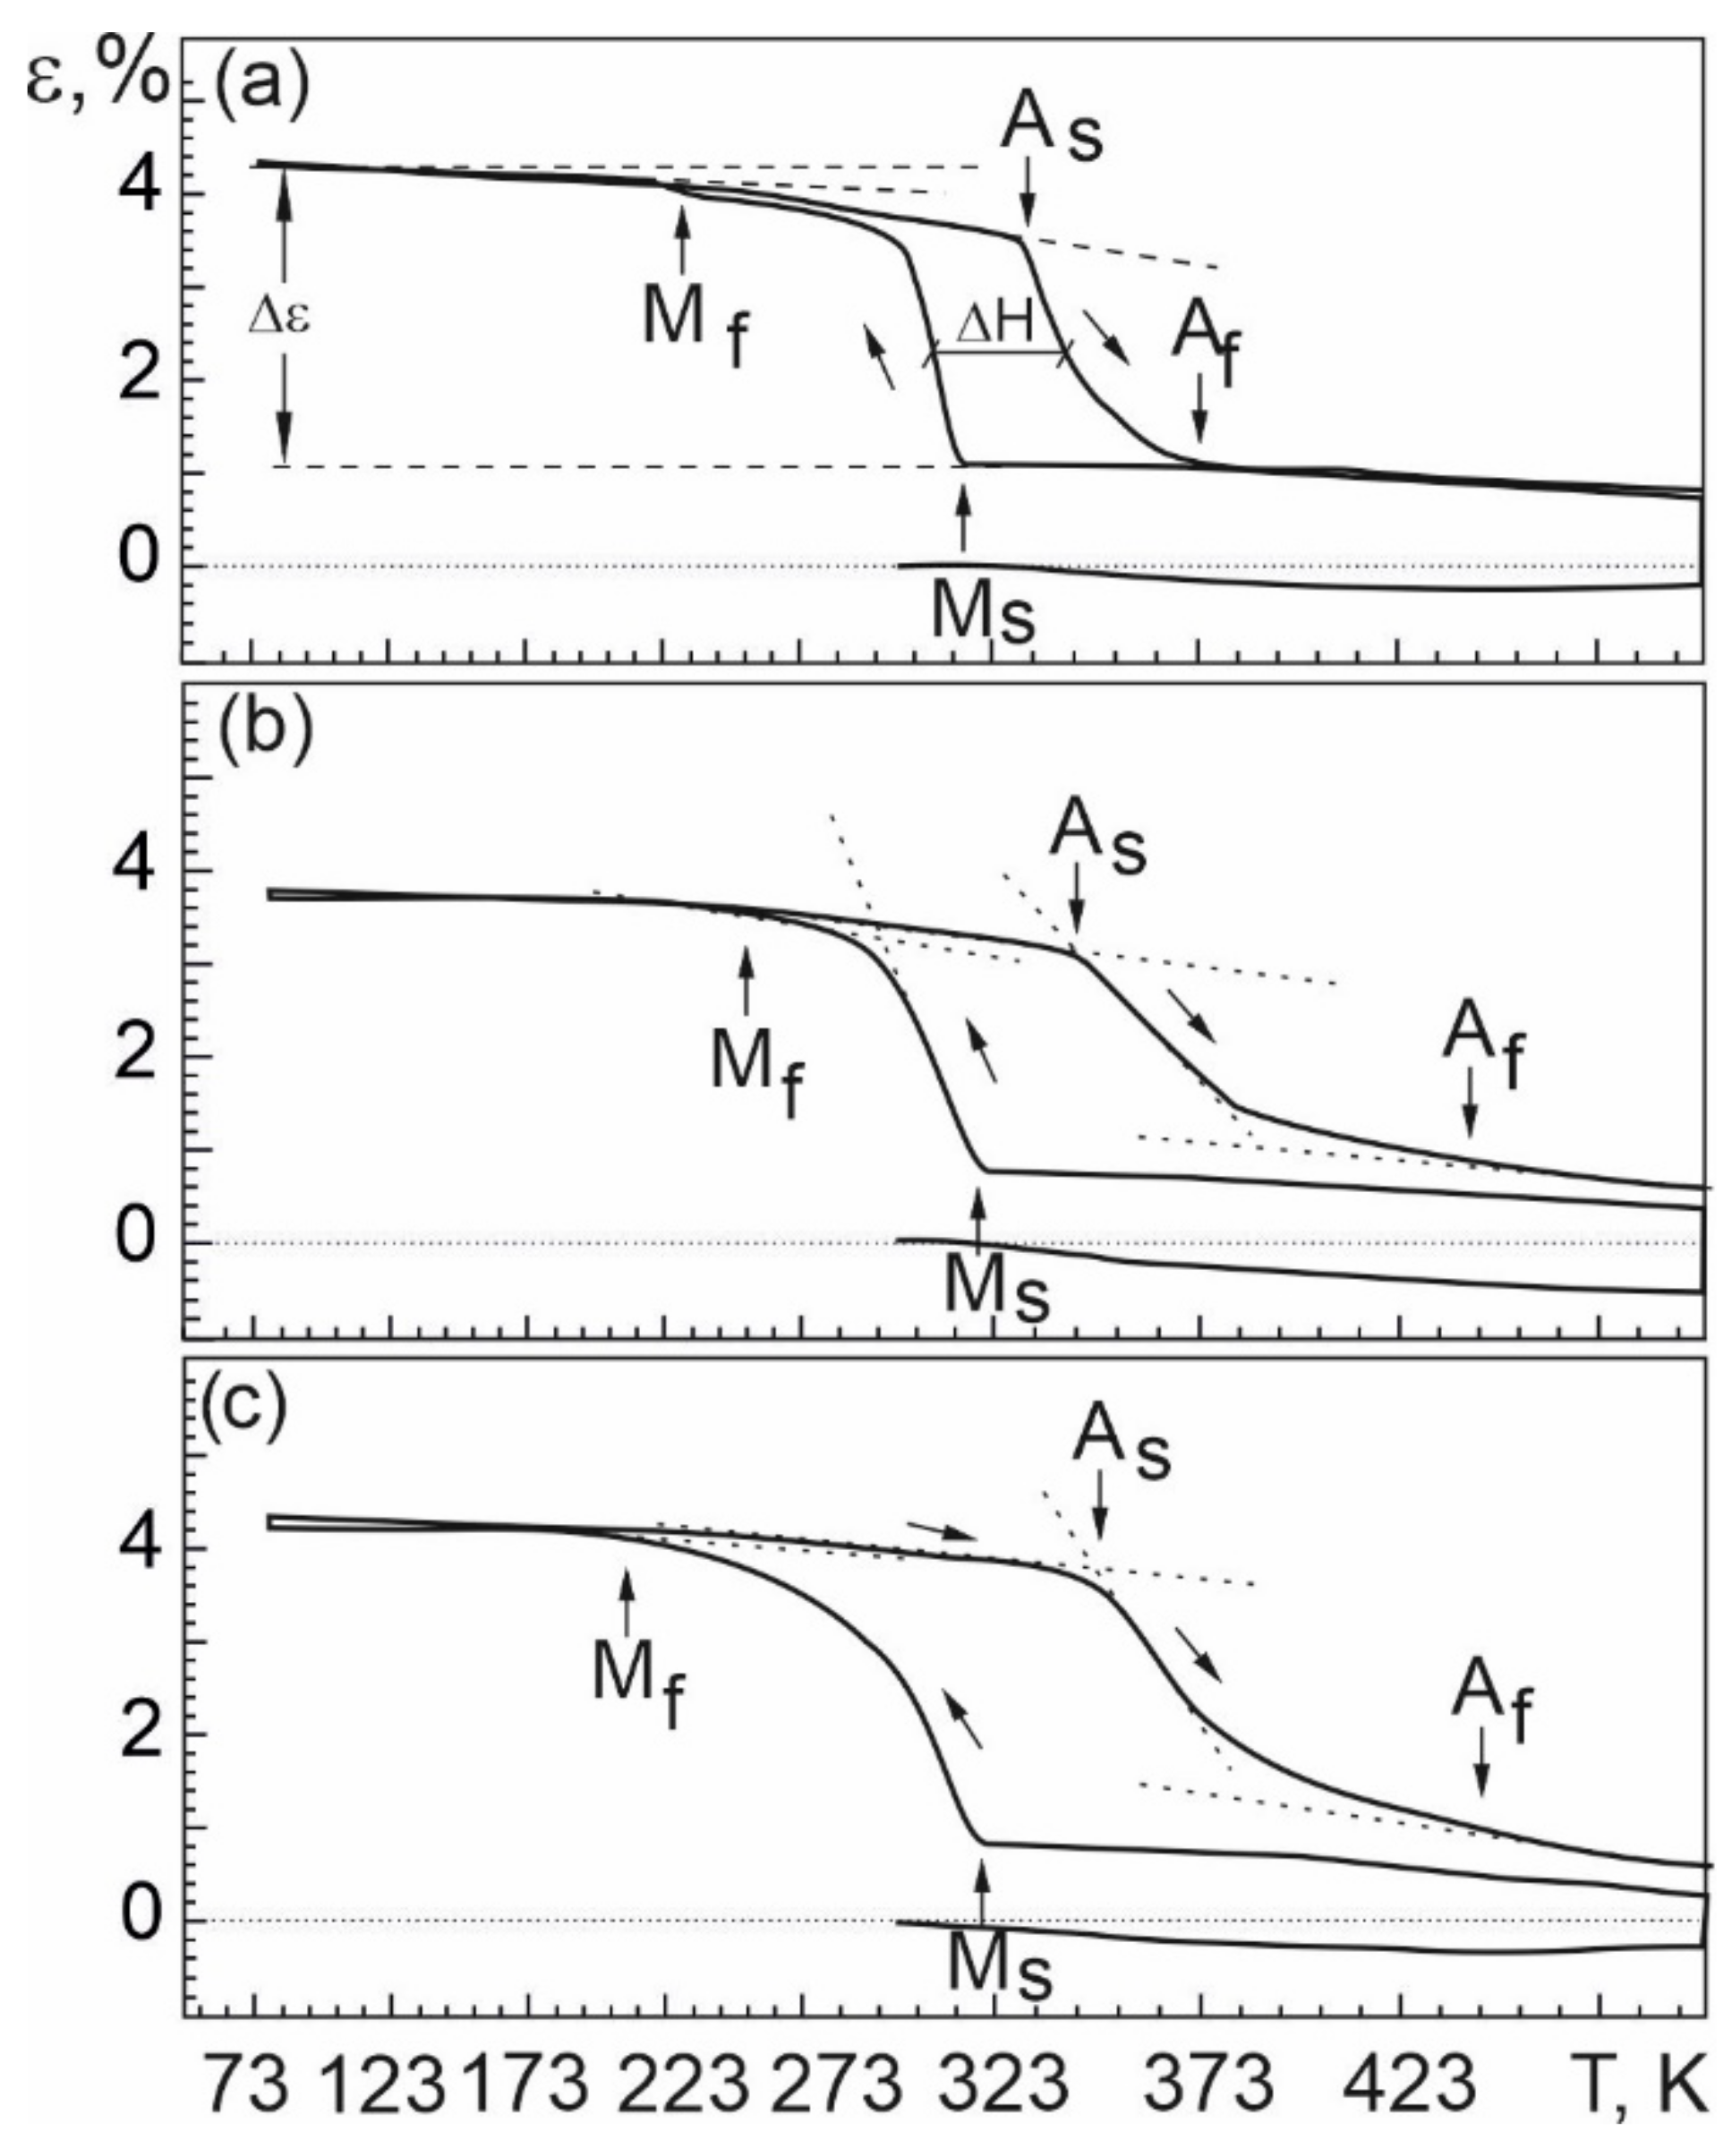
As a result of experimental studies, the temperature dependences of the accumulation and recovery of deformation under multiple shape memory effects in the alloys were obtained (Figure 13). From these ε(T) dependences, the characteristic temperatures of the MT (MS, Mf, AS, Af) and the temperature MT intervals under load were determined [1,2].
Using the thermodynamic description of thermoelastic MTs and the experimental values of the characteristic MT temperatures obtained on samples under load and without load, we evaluated how Nb doping affects the ratio of the reversible Δ G r e v ( 1 ) and irreversible Δ G f r components of the nonchemical free energy. The thermodynamic analysis of the MT features without load (in free state) and under load was carried out based on the analysis of the temperature interval A f M s in TiNi-based with Nb. This is due to the fact that, according to Equation (7), the value of the temperature interval A f M s depends on the Gibbs irreversible free energy Δ G f r .
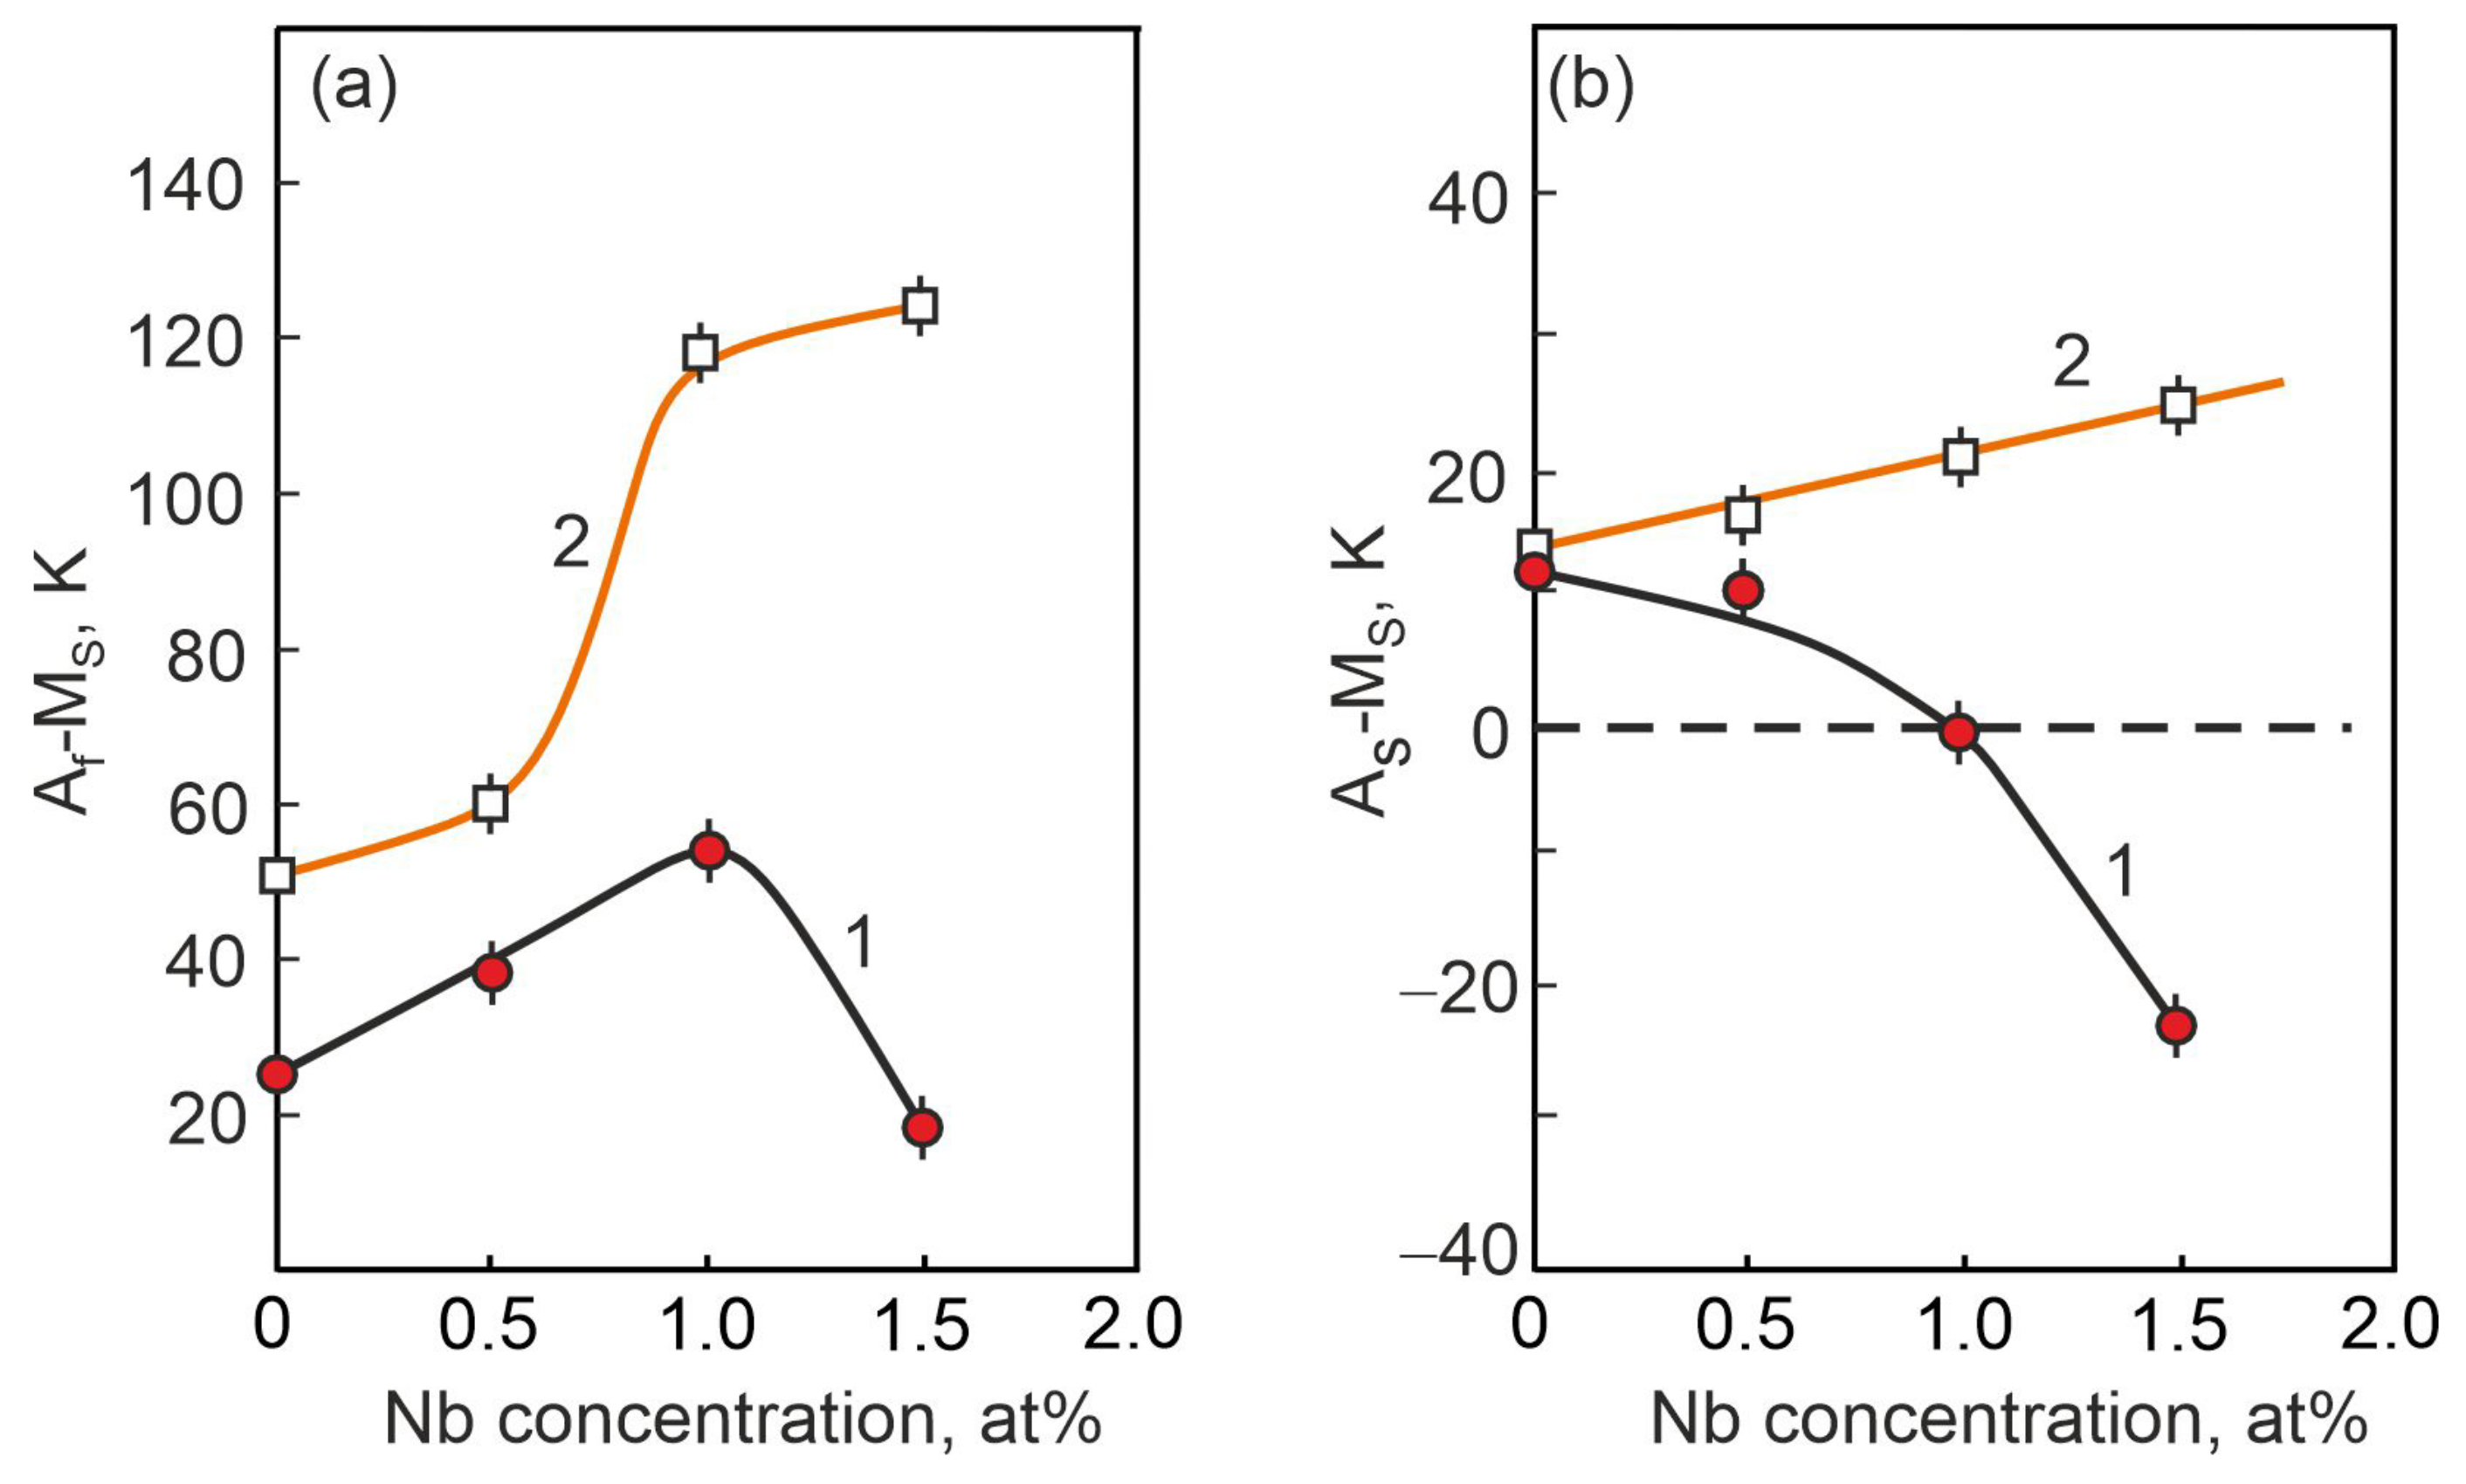
Figure 14a shows the concentration dependences of the MT characteristic temperatures, obtained on the basis of the ρ(T) given in Figure 11. It can be seen that the change of the characteristic temperatures of the direct MT (Ms and Mf) and the reverse MT ( A f and A s ) on the concentration of the alloying component Nb have different functional dependences. This reflects the different influence of the concentration of the alloying element on the mobility of the interfacial boundaries in the case of forward and reverse MT. This is confirmed by the concentration curves of the difference in the characteristic temperatures of the MT A f M s , shown in Figure 14a. The Nb doping of the titanium nickelide up to 1 at% leads to a linear increase in the temperature interval A f M s . Further doping with Nb atoms leads to a decrease in the temperature interval A f M s . Such a change in the temperature range A f M s is due to structural changes in the alloy: a significant increase in the lattice parameter aB2 of the matrix phase based on titanium nickelide with the B2 structure (Figure 5), due to a higher dissolution of Nb atoms in the solid solution (Table 3), as well as a higher content of the Ti2N phase particles. The value of the temperature interval A f M s , according to Equation (7), depends on the Gibbs irreversible free energy Δ G f r . Thus, a decrease in the temperature range A f M s in the Ti50Ni48.2Nb1.5Mo0.3 alloy leads to a decrease in the irreversible Gibbs free energy Δ G f r .
Figure 14b shows an analysis of the concentration dependences of the characteristic MT temperatures under the load, obtained on the basis of the ε(T) given in Figure 13. With an increase in the Nb concentration in titanium nickelide alloy, the characteristic MT temperatures under the load MS, AS, Af increase, while the Mf temperature changes monotonically with an increase in the concentration of Nb atoms. At the same time, with an increase in the concentration of niobium, an increase in the interval of manifestation of the SME is observed due to the difference between the temperatures Af − Mf. It is possible that Ti2Ni and Ni56Ti29Nb15 particles make an additional contribution to the expansion of the MT temperature range, preventing the completion of the forward and reverse MT by reducing the temperatures Mf and increasing Af (Figure 14). Different functional dependences of the onset temperatures of the direct MT MS in TiNi (Nb,Mo) alloy samples in the free state and under the load are probably due to particles precipitated along the grain boundaries. The presence of these particles along the grain boundaries, as the temperature of the alloy decreases under load, promotes the transition and facilitates the formation of martensite crystals. During cooling in the unstressed state, the grain boundary particles are an obstacle to the onset of MT.
Further analysis of the features of the MT flow in samples without load and under load was carried out on the basis of the above thermodynamic relations (1)–(9). There is a completely different dependence of the thermal hysteresis Af − Ms of the MT on the concentration of the Nb in TiNi-based alloys, determined when studying the MT under load (Figure 15, curve 2), compared to a similar dependence obtained when studying the MT in the free state (Figure 15, curve 1). In Figure 15 (curve 2), the temperature interval Af − Ms increases stepwise with an increase in the concentration of Nb atoms from 0.5 at% Nb to 1 at%. Such a change in the temperature interval Af − Ms with concentration reflects a sharp increase in the irreversible Gibbs free energy ΔGfr (according to Equation (7)).
According to expression (7), the values of Af − Ms depend on the irreversible non-chemical free energy Δ G f r which is responsible for the irreversible dissipation of energy during the MT. The width of the thermal hysteresis Af − Ms of the MT in alloy samples with an alloying element concentration of up to 0.5 at% Nb is slightly greater under load than in the same alloys without load. This indicates that in alloys under load during MT, the irreversible component of the non-chemical free energy Δ G f r is higher than in alloys without load. In alloys with higher concentrations of the alloying element up to 1.5 at% Nb, a significant increase in irreversible non-chemical energy Δ G f r is observed. Whereas in this significantly same alloy with an alloying element concentration of 1.5 at% Nb, the MT flow without load and the energy dissipation during the MT are less (Figure 15a). According to the data of [20], the main contribution to the energy dissipation Δ G f r is made by the work on overcoming the stresses of resistance to the motion of the interfacial boundary. This work depends on the value of the Peierls energy barrier in the initial matrix and on the forces of interaction of interfacial boundaries with various defects (interstitial atoms, dislocations, dispersed particles) contained in the initial phase. Thus, in the Ti50Ni48.2Nb1.5Mo0.3 alloy, the precipitation of Ni56Ti29Nb15 particles, both along the grain boundaries and in the grain body, has no additional effect on the dissipation energy Δ G f r during the motion of interfacial boundaries during MT. Whereas in the same alloy with the MT flow under load, the presence of precipitated particles leads to additional energy dissipation and is reflected by an increase in the values of Δ G f r .
A further search of MT features in the alloys was carried out on the basis of an analysis of the well-experimentally determined AS − MS temperature range, which depends on the difference between the irreversible Gibbs free energy Δ G f r and the reversible one Δ G r e v , according to Equation (8). The concentration dependence of the AS − MS MT temperature range flowing without load (Figure 15b, curve 1) shows a negative value of the AS − MS temperature difference for the Ti50Ni48.2Nb1.5Mo0.3. alloy. This indicates that the reversible Gibbs free energy ΔGrev is more than twice as large as the irreversible Gibbs free energy ΔGfr. This phenomenon correlates with a decrease in the Gibbs irreversible free energy ΔGfr, which manifests itself in a decrease in the temperature interval Af − Ms in the Ti50Ni48.2Nb1.5Mo0.3 alloy (Figure 15a, curve 1). In the same alloy, a completely different concentration dependence of the AS − MS MT temperature range under load is observed (Figure 15b, curve 2), which was obtained from the analysis of the ε(T) dependences. It can be seen that the AS − MS temperature range increases linearly with increasing Nb concentration in titanium nickelide. And as a result, in the Nb-doped TiNi alloy, martensitic transformation under load proceeds under different conditions, when the irreversible Gibbs free energy Δ G f r is more than twice the reversible Gibbs free energy Δ G f r , according to Equation (8).
Thus, in the Ti50Ni48.2Nb1.5Mo0.3 alloy, in addition to the precipitation of dispersed Ni56Ti29Nb15 particles, both along the grain boundaries and in the grain body, a significant increase in the lattice parameter and atomic volume of the B2 phase is observed (Figure 5). This phenomenon reflects a more significant dissolution of the alloying element atoms in the B2 matrix phase based on the TiNi alloy. Such an additional dissolution of Nb atoms in the B2 matrix phase leads to a change in the forces of interatomic interaction. This manifests itself in a decrease in the temperature of the onset of MT MS (Figure 12, curve 1) and a significant increase in the intensity of the (110)B2 reflection on the X-ray pattern (Figure 4 and Figure 5). In our case, the established structural changes reflect an increase in the stability of the B2 austenite phase. As a consequence, the increase in the stability of the austenite phase B2 correlates with the increase in the irreversible Gibbs free energy ΔGfr during the MT flow under load, reflecting that a higher value of the MT driving force is required.
Accordingly, a decrease in the temperature Ms reflects an increase in the stabilization of the B2 matrix phase and is accompanied by a change in the lattice parameters of the phases [30,31]. As noted earlier, an important fact here is the correlation in the change in the lattice parameter of the B2 phase depending on the Nb concentration in the three-component TiNi(Nb) alloys (Figure 5). This phenomenon is associated with the magnitude of overcooling of the alloy relative to the temperature T0 at which the chemical Gibbs energy of the austenitic and martensitic phases is the same. Based on Equations (1) and (2), we can estimate the value of the temperature interval of alloy overcooling, which depends on external mechanical stresses [20]. Such an assessment was performed and the results are presented in Figure 16. It can be clearly seen that for the MT to proceed under load, in alloys with an alloying element concentration of more than 1.0 at% Nb, more significant overcooling is necessary. Whereas for the MT to proceed without load, such a value of overcooling in the same alloys is not required. These data correlate with the conclusions obtained from the results of the analysis of the concentration dependences of the AS − MS temperature range (Figure 15b).

5. Conclusions

  • Structural studies showed that all alloys at room temperature consist of intermetallic compounds with the TiNi (B2, B19′), Ti2Ni, and Ni56Ti29Nb15 compositions. It was found that in the Ti50Ni48.2Nb1.5Mo0.3 alloy, a microstructural state without eutectic is formed during crystallization, in contrast to alloys with 0.5 and 1 at% Nb. It was established that the doping of TiNi alloys with niobium leads to an increase in the stability of high-temperature B2 phase. An increase in the lattice parameter and atomic volume of the B2 phase indicates that some of the Nb atoms are dissolved in the B2 matrix phase. The observed significant change in the structural-phase state has a significant effect on the features of the martensitic transition in the free state and under load.
  • In order to determine the characteristics of martensitic transformation in the free state and under load in TiNiNb based alloys, temperature dependences of electrical resistivity and temperature dependences of strain accumulation and recovery under multiple shape memory effects were obtained. The dependencies indicate that a single stage B2–B19′ MT occurs in the alloys studied. From the experimental data, characteristic temperatures and intervals of MT were determined. Using the thermodynamic description of thermoelastic MT and the experimental values of the characteristic temperatures based on the dependences obtained in the free state and under load, the influence of Nb alloying on the ratio of the reversible and irreversible components of the non-chemical free energy was evaluated. These studies play an important role in determining the behavior of the alloys under different operating conditions, namely in the free state and under load.
  • The width of the thermal hysteresis Af − Ms, corresponding to the irreversible energy dissipation during MT, was determined. In the experiments under load, it was found that the alloys show a significant increase in the irreversible free energy dissipation during MT, whereas in the free state the energy dissipation during MT is much lower in the same alloys. This indicates that the irreversible component of the non-chemical free energy is higher in the loaded alloys during MT than in the unloaded alloys, and that particle precipitation has an additional influence on the dissipation energy during interfacial boundary motion under load.
  • The temperature difference AS − MS between the beginning of the direct and the beginning of the reverse MT, determined by the ratio between the reversible and irreversible energies, was established. Based on the analysis of the concentration dependence of the temperature interval AS − MS during MT under load, it was found that alloying with Nb causes the reversible Gibbs free energy Δ G r e v to be more than twice as large as the irreversible Gibbs free energy Δ G f r . In the same alloy, a completely different concentration dependence of the temperature interval AS − MS MT occurring under load is observed when the irreversible Gibbs free energy exceeds more than twice the reversible Gibbs free energy.
  • The MT mechanism strongly depends on the concentration of the alloying element, and this is reflected in the change in the ratio between the reversible Δ G r e v and irreversible Δ G f r Gibbs free energies at MT flow without load and under load. These changes in the concentration dependences of the MT temperature intervals in the alloys studied in the free state and under load depend on the precipitation of particles along the grain boundaries and in the grain body and on the changes in lattice parameter and atomic volume in the austenitic B2 phase.
  • Based on the analysis of the concentration dependences of the temperature T0 of the chemical equilibrium of the austenitic and martensitic phases, it was found that for the MT to occur under load, in alloys with an alloying element concentration of more than 1.0 at% Nb, a more significant overcooling is required than for MT without load.

Author Contributions

Conceptualization, E.S.M. and A.A.K.; methodology, E.S.M. and A.A.K.; formal analysis, E.S.M., G.A.B. and A.A.K.; investigation, I.A.Z., G.A.B. and E.S.M.; resources, E.S.M.; data curation, I.A.Z.; writing—original draft preparation, E.S.M. and I.A.Z.; writing—review and editing, G.A.B. and A.A.K.; supervision, E.S.M.; project administration, E.S.M.; funding acquisition, I.A.Z. All authors have read and agreed to the published version of the manuscript.

Funding

The study of the martensitic transformation was supported by the Mega grant from the Government of the Russian Federation No. 220 of 9 April 2010 (Agreement No. 075-15-2021-612 of 4 June 2021). The structure research was funded by the Ministry of Science and Higher Education of the Russian Federation (grant No. 075-15-2020-803 with the Zelinsky Institute of Organic Chemistry of the RAS).

Institutional Review Board Statement

Not applicable.

Informed Consent Statement

Not applicable.

Data Availability Statement

Data are contained within the article.

Conflicts of Interest

The authors declare no conflict of interest.

References

  1. Lagoudas, D. Shape Memory Alloys: Modeling and Engineering Applications; Springer Science and Business Media: Berlin/Heidelberg, Germany, 2008; p. 436. [Google Scholar]
  2. Otsuka, K.; Shimizu, K.; Suzuki, Y. Shape Memory Alloys; Funakubo, H.M., Ed.; Nova Science Publishers, Inc.: Hapog, NY, USA, 1990; p. 224. [Google Scholar]
  3. Piao, M.; Miyazaki, S.; Otsuka, K. Characteristic of deformation and transformation in Ti44Ni47Nb9 shape memory alloy materials. Mater. Trans. JIM 1992, 4, 346–353. [Google Scholar] [CrossRef]
  4. He, X.M.; Rong, L.J.; Yan, D.S.; Li, Y.Y. TiNiNb wide hysteresis shape memory alloy with low niobium content. Mater. Sci. Eng. A 2004, 371, 193–197. [Google Scholar] [CrossRef]
  5. Cai, W.; Meng, X.L.; Zhao, L.C. Recent development of TiNi-based shape memory alloys. Curr. Opin. Solid. State Mater. Sci. 2005, 9, 296–302. [Google Scholar] [CrossRef]
  6. Picornell, C.; Pons, J.; Paulscn, A. Burst-like reverse martensitic transformation during heating, cooling and under isothermal conditions in stabilized Ni-Ti-Nb. Scr. Mater. 2020, 180, 23–28. [Google Scholar] [CrossRef]
  7. Choi, E.; Nam, T.H.; Chung, Y.S.; Kim, Y.W.; Lee, S.Y. Behavior of NiTiNb SMA wires under recovery stress or prestressing. Nano Res. Lett. 2012, 7, 66. [Google Scholar] [CrossRef] [PubMed]
  8. Xi, R.; Jiang, H.; Kustov, S. Influence of Nb addition and process parameters on the microstructure and phase transformation behavior of NiTiNb ternary shape memory alloys fabricated by laser powder bed fusion. Scr. Mater. 2023, 222, 114996. [Google Scholar] [CrossRef]
  9. Fan, Q.C.; Zhang, Y.; Zhang, Y.H.; Wang, Y.Y.; Yang, E.H.; Huang, S.K.; Wen, Y.H. Influence of Ni/Ti ratio and Nb addition on martensitic transformation behavior of NiTiNb alloys. J. Alloy. Compd. 2019, 790, 1167–1176. [Google Scholar] [CrossRef]
  10. He, X.M.; Rong, L.J. Effect of deformation on the stress-induced martensitic transformation in (Ni47Ti44)100−xNbx shape memory alloys with wide hysteresis. Met. Mater. Int. 2006, 12, 279–288. [Google Scholar] [CrossRef]
  11. Bao, Z.; Guo, S.; Xiao, F.; Zhao, X. Development of NiTiNb in-situ composite with high damping capacity and high yield strength. Prog. Nat. Sci. 2011, 21, 293–300. [Google Scholar] [CrossRef]
  12. He, X.M.; Zhao, L.Z.; Zhang, S.F.; Duo, S.W.; Zhang, R.F. Study of the thermal physical properties of Ti47Ni44Nb9 wide hysteresis shape memory alloy. Mater. Sci. Eng. A 2006, 441, 167–169. [Google Scholar] [CrossRef]
  13. Piotrowski, B.; Zineb, B.; Patoor, E.; Eberhardt, A. Modeling of niobium precipitates effect on the Ni47Ti44Nb9 shape memory alloy behavior. Int. J. Plast. 2012, 36, 130–147. [Google Scholar] [CrossRef]
  14. Rius, J.M.; Cladera, A.; Mas, B.; Ribas, C. Shear behaviour of beams strengthened using different Ni-Ti-Nb shape memory alloy wire configurations and design proposal based on the compression chord capacity model (CCCM). Eng. Struct. 2022, 268, 114724. [Google Scholar] [CrossRef]
  15. Fu, X.; Guojun, M.; Xinqing, Z.; Huibin, X. Effects of Nb content on yield strength of NiTiNb alloys in martensite state. Chin. J. Aeronaut. 2009, 22, 658–662. [Google Scholar] [CrossRef]
  16. Zhang, F.; Zhang, L.; Wang, F.; Zhang, H. Effects of Nb additions on the precipitate morphology and hardening behavior of Ni-rich Ni55Ti45 alloys. J. Alloys Compd. 2018, 735, 2453–2461. [Google Scholar] [CrossRef]
  17. Silva, J.D.; Macieira, G.F.C.; Santos, E.S.; Santos, L.A.; Buono, V.T.L. Role of Nb on the phase stability and morphology of Ti-Ni-Cu-Nb alloys. J. Mater. Res. Technol. 2022, 20, 1428–1436. [Google Scholar] [CrossRef]
  18. Mirkin, L.I. X-ray Diffraction Analysis: Indexing of Radiographs; Science: Moscow, Russia, 1981; p. 496. [Google Scholar]
  19. Otsuka, K.; Ren, X. Physical metallurgy of Ti–Ni-based shape memory alloys. Prog. Mater. Sci. 2005, 50, 511–678. [Google Scholar] [CrossRef]
  20. Chumlyakov, Y.I.; Kireeva, I.V.; Panchenko, E.Y.; Timofeeva, E.E. Mechanisms of Thermoelastic Martensitic Transformations in High-Strength Single Crystals of Alloys Based on Iron and Titanium Nickelide; Chumlyakov, Y.I., Ed.; NTL: Tomsk, Russia, 2016; p. 244. [Google Scholar]
  21. Ortin, J.; Planes, A. Thermodynamic analysis of thermal measurements inthermoelastic martensitic transformation. Acta. Mettall. 1988, 36, 1873–1889. [Google Scholar] [CrossRef]
  22. Doroczi, L.; Palanki, Z.; Szabo, S.; Beke, D.L. Stress dependence of non-chemical free energy contribution in Cu-Al-Ni shape memory alloys. Mater. Sci. Eng. 2004, 378, 274–277. [Google Scholar] [CrossRef]
  23. Guanjun, Y.; Shiming, H. Experimental investigation on the 800 °C isothermal section of the Ti-Ni-Nb ternary system. Rare Met. Mater. Eng. 1997, 26, 18–22. [Google Scholar]
  24. Massalski, T.B. Binary Alloy Phase Diagrams; American Society for Metals: Chardon, OH, USA, 1984; Volume 1, 224p. [Google Scholar]
  25. Matsumoto, S.; Tokunaga, T.; Ohtani, H.; Hasebc, M. Thermodynamic analysis of the phase equilibria of the Nb-Ni-Ti system. Mater. Trans. 2005, 46, 2920–2930. [Google Scholar] [CrossRef]
  26. He, X.M.; Xiang, J.H.; Li, M.S.; Duo, S.W.; Guo, S.B.; Zhang, R.F.; Rong, L.J. Temperature memory effect induced by incomplete transformation in TiNi-based shape memory alloy. J. Alloys Compd. 2006, 422, 338–341. [Google Scholar] [CrossRef]
  27. Zhao, X.; Yan, X.; Yang, Y.; Xu, H. Wide hysteresis NiTi(Nb) shape memory alloys with low Nb content (4.5 at.%). Mater. Sci. Eng. A 2006, 438–440, 575–578. [Google Scholar] [CrossRef]
  28. Abramov, V.Y.; Aleksandrova, N.M.; Borovkov, D.V.; Khmelevskaya, I.Y. Martensitic transformation and functional properties of thermally and thermomechanically treated Ti-Ni-Nb based alloys. Mater. Sci. Eng. A 2006, 438–440, 553–557. [Google Scholar] [CrossRef]
  29. Shi, H.; Frenzel, J.; Martinez, G.T.; Van Rompaey, S.; Bakulin, A.; Kulkova, S.; Van Aert, D. Schryvers, Site occupation of Nb atoms in ternary Ni-Ti-Nb shape memory alloys. Acta Mater. 2014, 74, 85–95. [Google Scholar] [CrossRef]
  30. Prokoshkin, S.D.; Korotitskiy, A.V.; Brailovski, V. On the lattice parameters of phases in binary TiNi shape memory alloys. Acta Mater. 2004, 52, 4479–4492. [Google Scholar] [CrossRef]
  31. Lobodyuk, V.A.; Estrin, E.I. Martensitic Transformations; Phizmatlit: Moscow, Russia, 2009; p. 352. [Google Scholar]
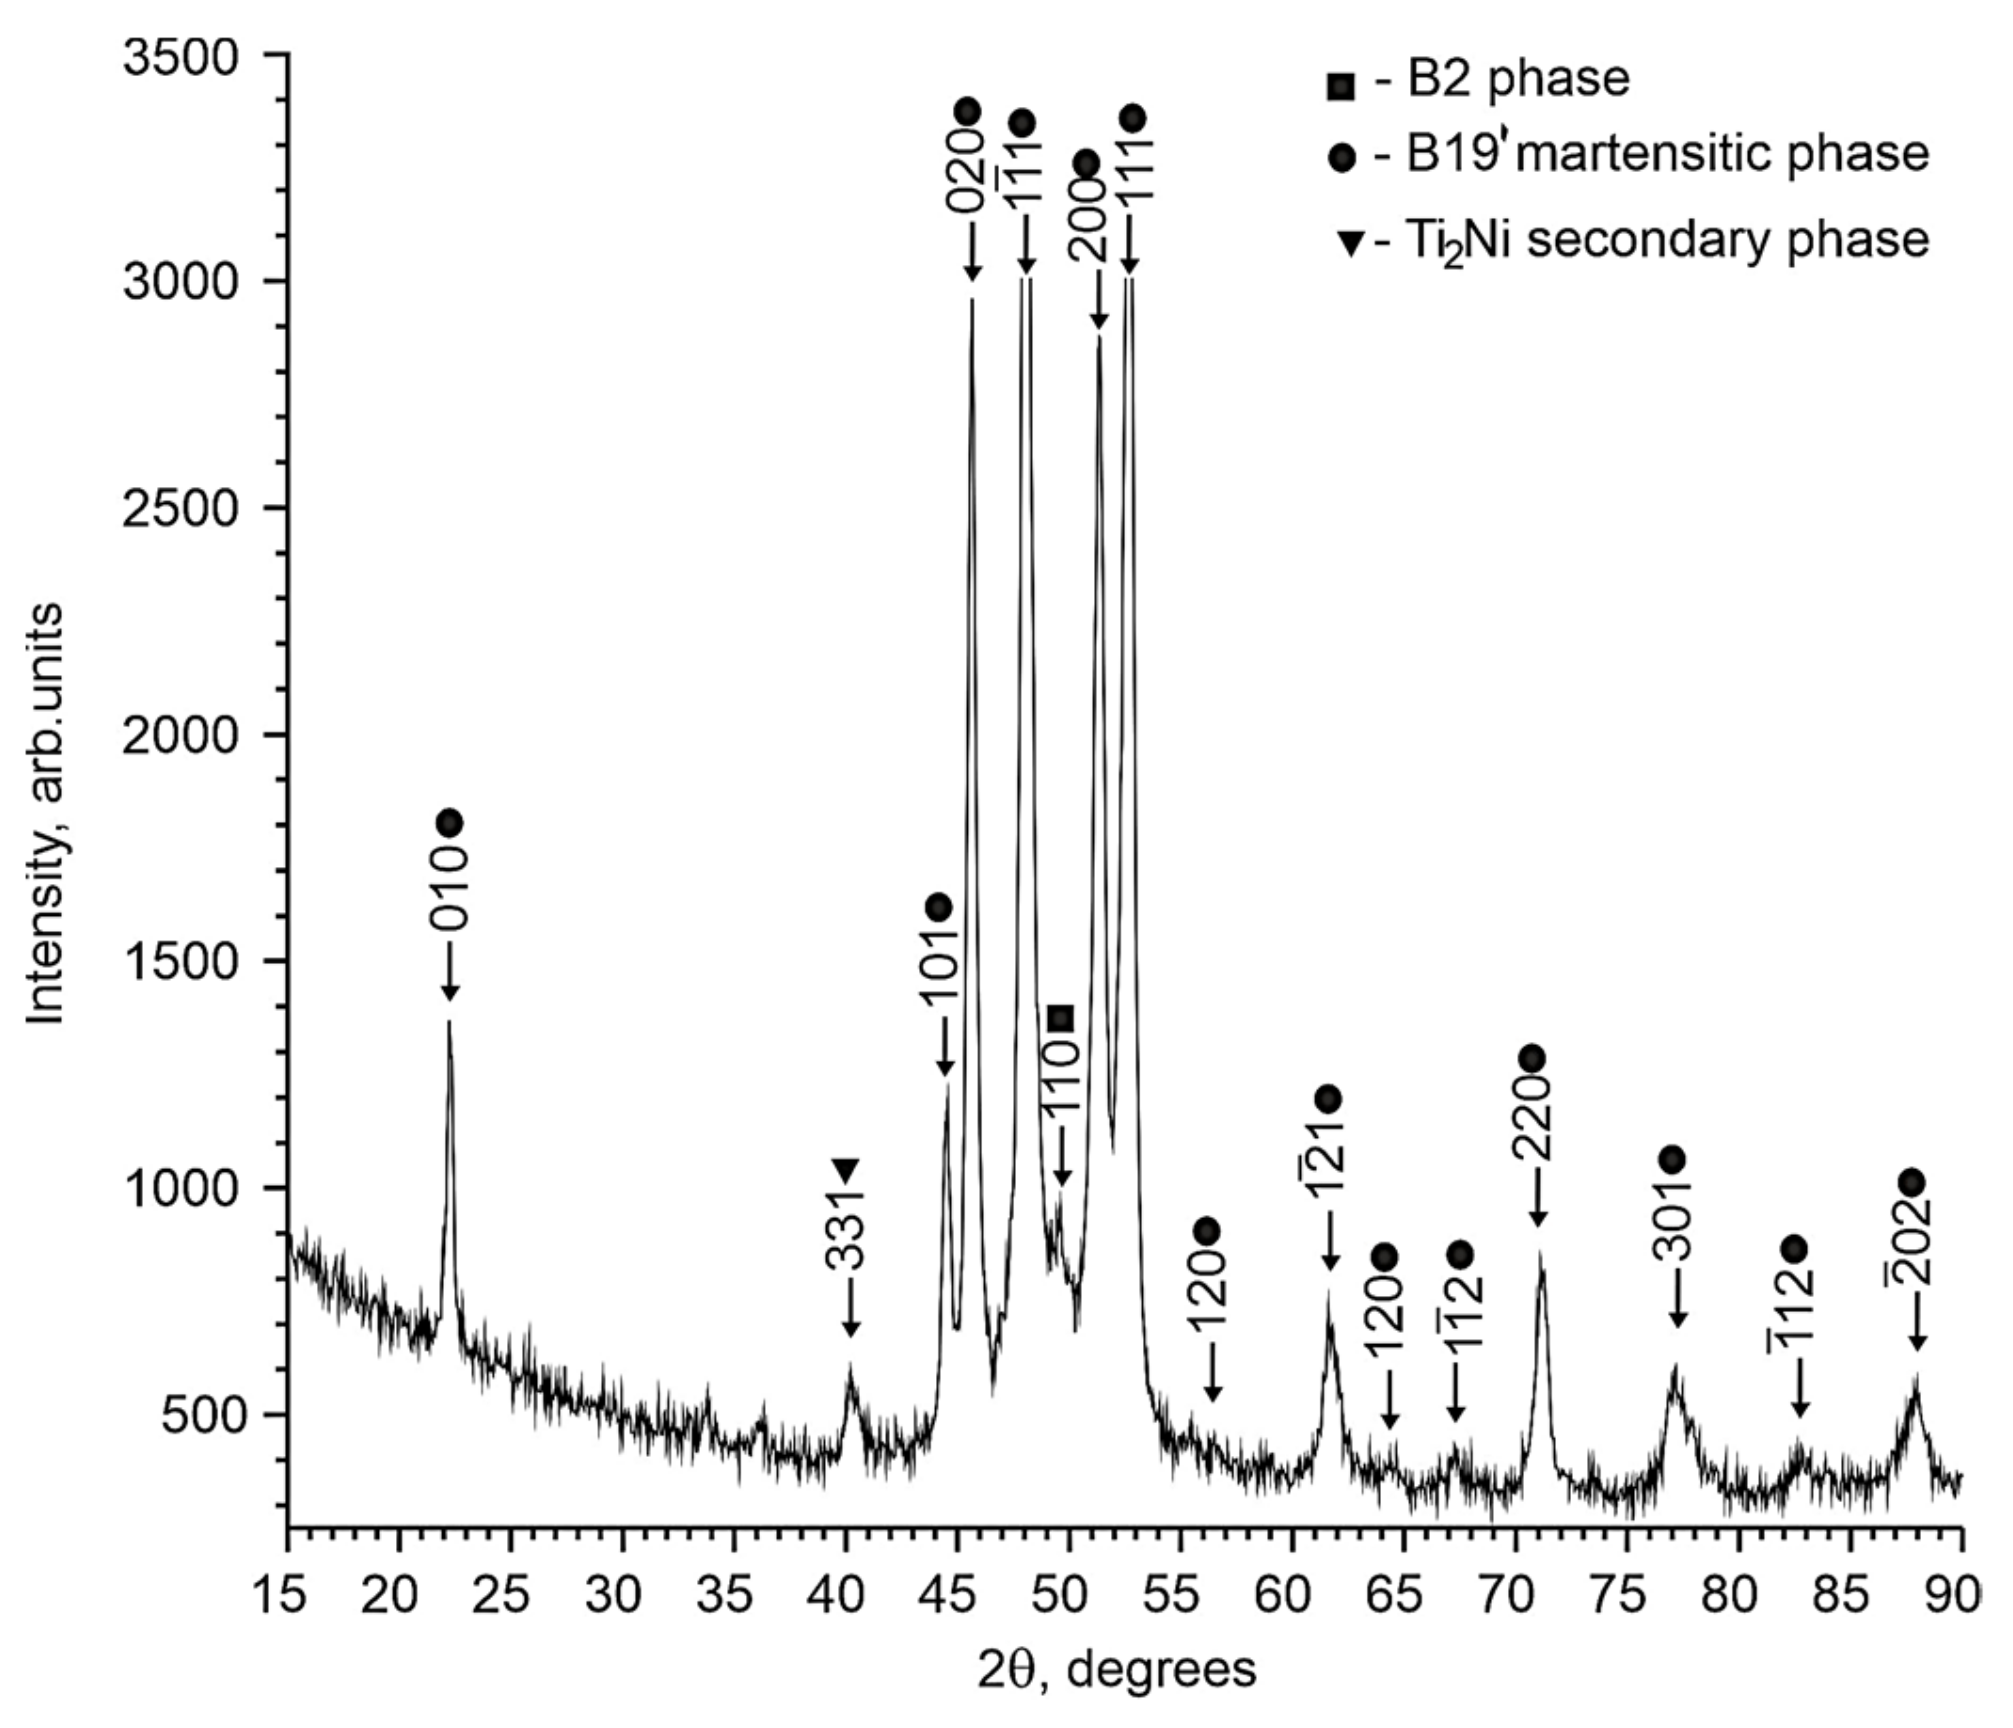
Figure 1. X-ray diffraction pattern of the Ti50Ni49.2Nb0.5Mo0.3 alloy sample, obtained with Cokα radiation.
Materials 17 00175 g001
Figure 2. X-ray diffraction pattern of the Ti50Ni48.7Nb1Mo0.3 alloy sample obtained with Cukα radiation.
Materials 17 00175 g002
Figure 3. X-ray diffraction pattern of the Ti50Ni48.2Nb1.5Mo0.3 alloy sample obtained with Cukα radiation.
Materials 17 00175 g003
Figure 4. Dependence of the ratio of reflection intensities 1 1 ¯ 1 on the martensitic phase with the B19′ structure and (110) on the austenitic phase with the B2 structure on the concentration of Nb atoms.
Materials 17 00175 g004
Figure 5. Concentration dependences of the unit cell parameter in the B2 phase (a) and atomic volume (b) in TiNi alloys doped with niobium.
Materials 17 00175 g005
Figure 6. Microstructure of the Ti50Ni49.2Nb0.5Mo0.3 alloy obtained by optical (a,b) and scanning electron microscopy (c) with corresponding EDS maps.
Materials 17 00175 g006
Figure 7. The 800 °C isothermal triangle of the Ti-Ni-Nb ternary system.
Materials 17 00175 g007
Figure 8. TEM image of the Ti50Ni49.2Nb0.5Mo0.3 alloy structure with corresponding diffraction patterns of B2 (a), B19′ (b) and Ti2Ni (c).
Materials 17 00175 g008
Figure 9. Microstructure of the Ti50Ni48.7Nb1Mo0.3 alloy obtained by optical (a,b) and scanning electron microscopes (c) with corresponding EDS maps.
Materials 17 00175 g009
Figure 10. Microstructure of the Ti50Ni48.2Nb1.5Mo0.3 alloy obtained by optical (a,b) and scanning electron microscopes (c) with corresponding EDS maps.
Materials 17 00175 g010
Figure 11. Dependences of electrical resistance ρ(t) on temperature in Ti50Ni49.2Nb0.5Mo0.3 (a), Ti50Ni48.7Nb1Mo0.3 (b), Ti50Ni48.2Nb1.5Mo0.3 (c) alloys.
Materials 17 00175 g011
Figure 12. Dependences of temperature MS on Nb concentration in alloys doped with Nb: (1)—Ti50Ni49.7−XNbXMo0.3 alloys according to our experimental data; (2)—Ti50−XNi50NbX alloys according to the literature data [4,10,15].
Materials 17 00175 g012
Figure 13. Multiple SME in alloys: Ti50Ni49.2Nb0.5Mo0.3 (a), Ti50Ni48.7Nb1Mo0.3 (b), Ti50Ni48.2Nb1.5Mo0.3 (c).
Materials 17 00175 g013
Figure 14. Dependences of the MT characteristic temperature based on the temperature dependences of the electrical resistance curves (a) and mechanical ε(T) tests (b).
Materials 17 00175 g014
Figure 15. Dependences of the difference between the characteristic temperatures of MT Af − Ms (a) and As − Ms (b) on the Nb concentration in alloys obtained from the temperature dependences of the electrical resistance curves (curve 1) and mechanical ε(T) tests (curve 2).
Materials 17 00175 g015
Figure 16. Dependences of the overcooling value ΔToverc of the alloy in the MT region relative to To on the concentration of Nb in alloys, obtained from the temperature dependences of the electrical resistance curves (curve 1) and from the dependencies ε(T) under load (curve 2).
Materials 17 00175 g016
Table 1. Quantitative elemental composition of the structural components of the Ti50Ni49.2Nb0.5Mo0.3 alloy.
Structural ComponentComposition, at%
TiNiMoNb
B2 matrix41.3 ± 0.558.3 ± 0.50.14 ± 0.10.3 ± 0.5
Ti2Ni particles65.4 ± 0.534.6 ± 0.5
Ni56Ti29Nb15 particles29.8 ± 0.555.9 ± 0.514.3 ± 0.5
Table 2. Quantitative elemental composition of the structural components of the Ti50Ni48.7Nb1Mo0.3.
Structural ComponentComposition, at%
TiNiMoNb
B2 matrix40.1 ± 0.559.2 ± 0.50.2 ± 0.10.4 ± 0.1
Ti2Ni particles63.3 ± 0.536.7 ± 0.5
Ni56Ti29Nb15 particles30.3 ± 0.553.6 ± 0.516.1 ± 0.5
Table 3. Quantitative elemental composition of the structural components of the Ti50Ni48.2Nb1.5Mo0.3.
Structural ComponentComposition, at%
TiNiMoNb
B2 matrix38.0 ± 0.561.2 ± 0.50.3 ± 0.10.5 ± 0.1
Ti2Ni particles61.5 ± 0. 538.6 ± 0.5
Ni56Ti29Nb15 particles29.3 ± 0.554.8 ± 0.516.0 ± 0.1
Disclaimer/Publisher’s Note: The statements, opinions and data contained in all publications are solely those of the individual author(s) and contributor(s) and not of MDPI and/or the editor(s). MDPI and/or the editor(s) disclaim responsibility for any injury to people or property resulting from any ideas, methods, instructions or products referred to in the content.