
Distribution and Morphology of α-Al, Si and Fe-Rich Phases in Al–Si–Fe Alloys under an Electromagnetic Field


Abstract
1. Introduction
2. Materials and Methods
- -
- “α-Al-first” alloy (Figure 1, solid blue line)—the α-Al phase precipitates first from the liquid alloy starting at 610 °C (composition Al–Si7.837Fe0.521), and similarly, the “α-Al-2-first” alloy with the Al–Si4.861Fe0.306 composition where the α-Al phase also starts to precipitate first but at 630 °C. In both alloys, other phases (Al–Si eutectics and iron intermetallics) may precipitate at the eutectic point, at 575 °C;
- -
- “β-first” alloy (Figure 1, solid red line)—the β-Al5FeSi phase precipitates first from the liquid alloy starting at 610 °C (composition Al–Si12.795Fe1.705), and similarly, the “β-2-first” alloy with the Al–Si12.911Fe2.372 composition where the β-Al5FeSi phase also starts to precipitate first but at 630 °C. In both alloys the remaining phases (Al–Si eutectics and α-Al) precipitate at the eutectic point, at 575 °C;
- -
- “Si-first” alloy (Figure 1, solid green line) —Si crystals precipitate first from the liquid alloy starting at 610 °C (composition Al–Si14.877Fe0.871), and similarly, the “Si-2-first” alloy with the Al–Si16.187Fe0.858 composition where Si crystals also start to precipitate first but at 630 °C. In both alloys other phases (α-Al and β-Al5FeSi) precipitate at the eutectic point, at 575 °C.
- -
- “α-Al/β” alloy (Figure 1, dashed violet line), α-Al and β-Al5FeSi phases precipitate simultaneously (along the monovariant line) first from the liquid alloy starting at 610 °C (composition Al–Si7.508Fe1.687), the remaining phases (Al–Si eutectics) precipitate at the eutectic point, at 575 °C;
- -
- “α-Al/Si” alloy (Figure 1, dashed yellow line), α-Al and Si crystals precipitate simultaneously (along the monovariant line, composition Al–Si12.587Fe0.443), other phases (Al–Si eutectics) precipitate at the eutectic point. Here, the liquidus temperature (not 610 °C) and composition were in the middle of the monovariant line, in order to keep iron and differ from the “eutectic point” alloy;
- -
- “β/Si” alloy (Figure 1, dashed grey line), δ phases, Si crystals (and β-Al5FeSi later) precipitate simultaneously first from the liquid alloy starting at 610 °C (composition Al–Si15.136Fe1.678), the remaining phases (Al–Si eutectics) precipitate at the eutectic point.
3. Results
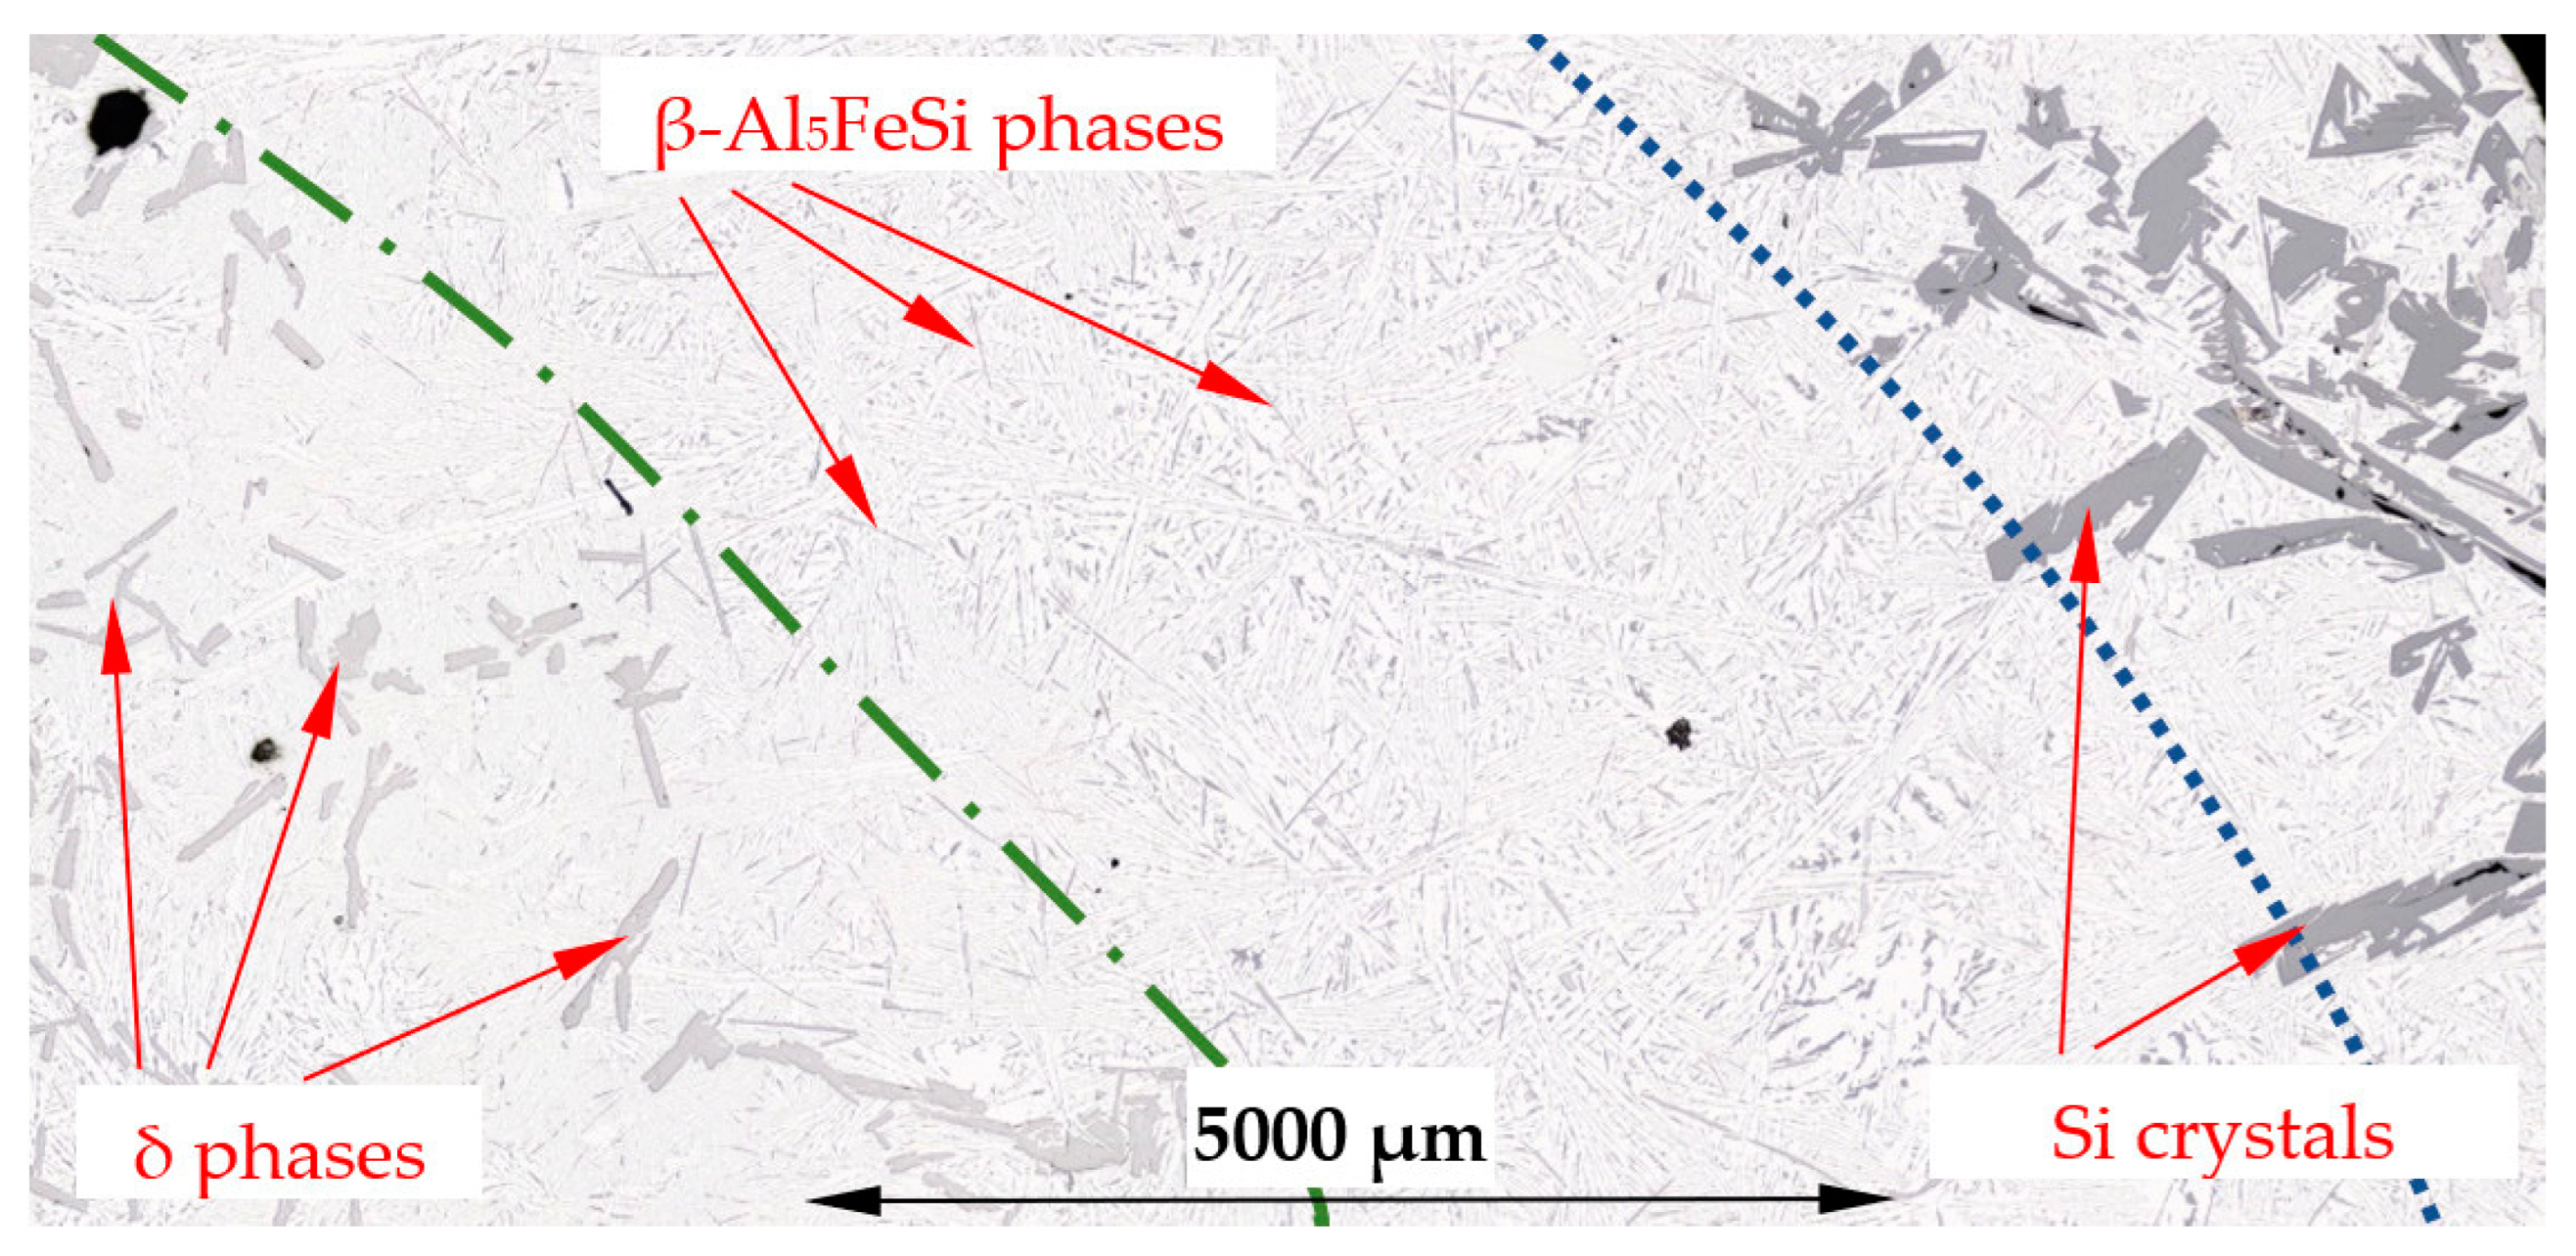
3.1. Microstructure
3.2. Parameters Characterising the Microstructure
3.3. Precipitation Sequence
4. Discussion
4.1. Spheroids, Rosettes and Dendrites
4.2. Eutectics
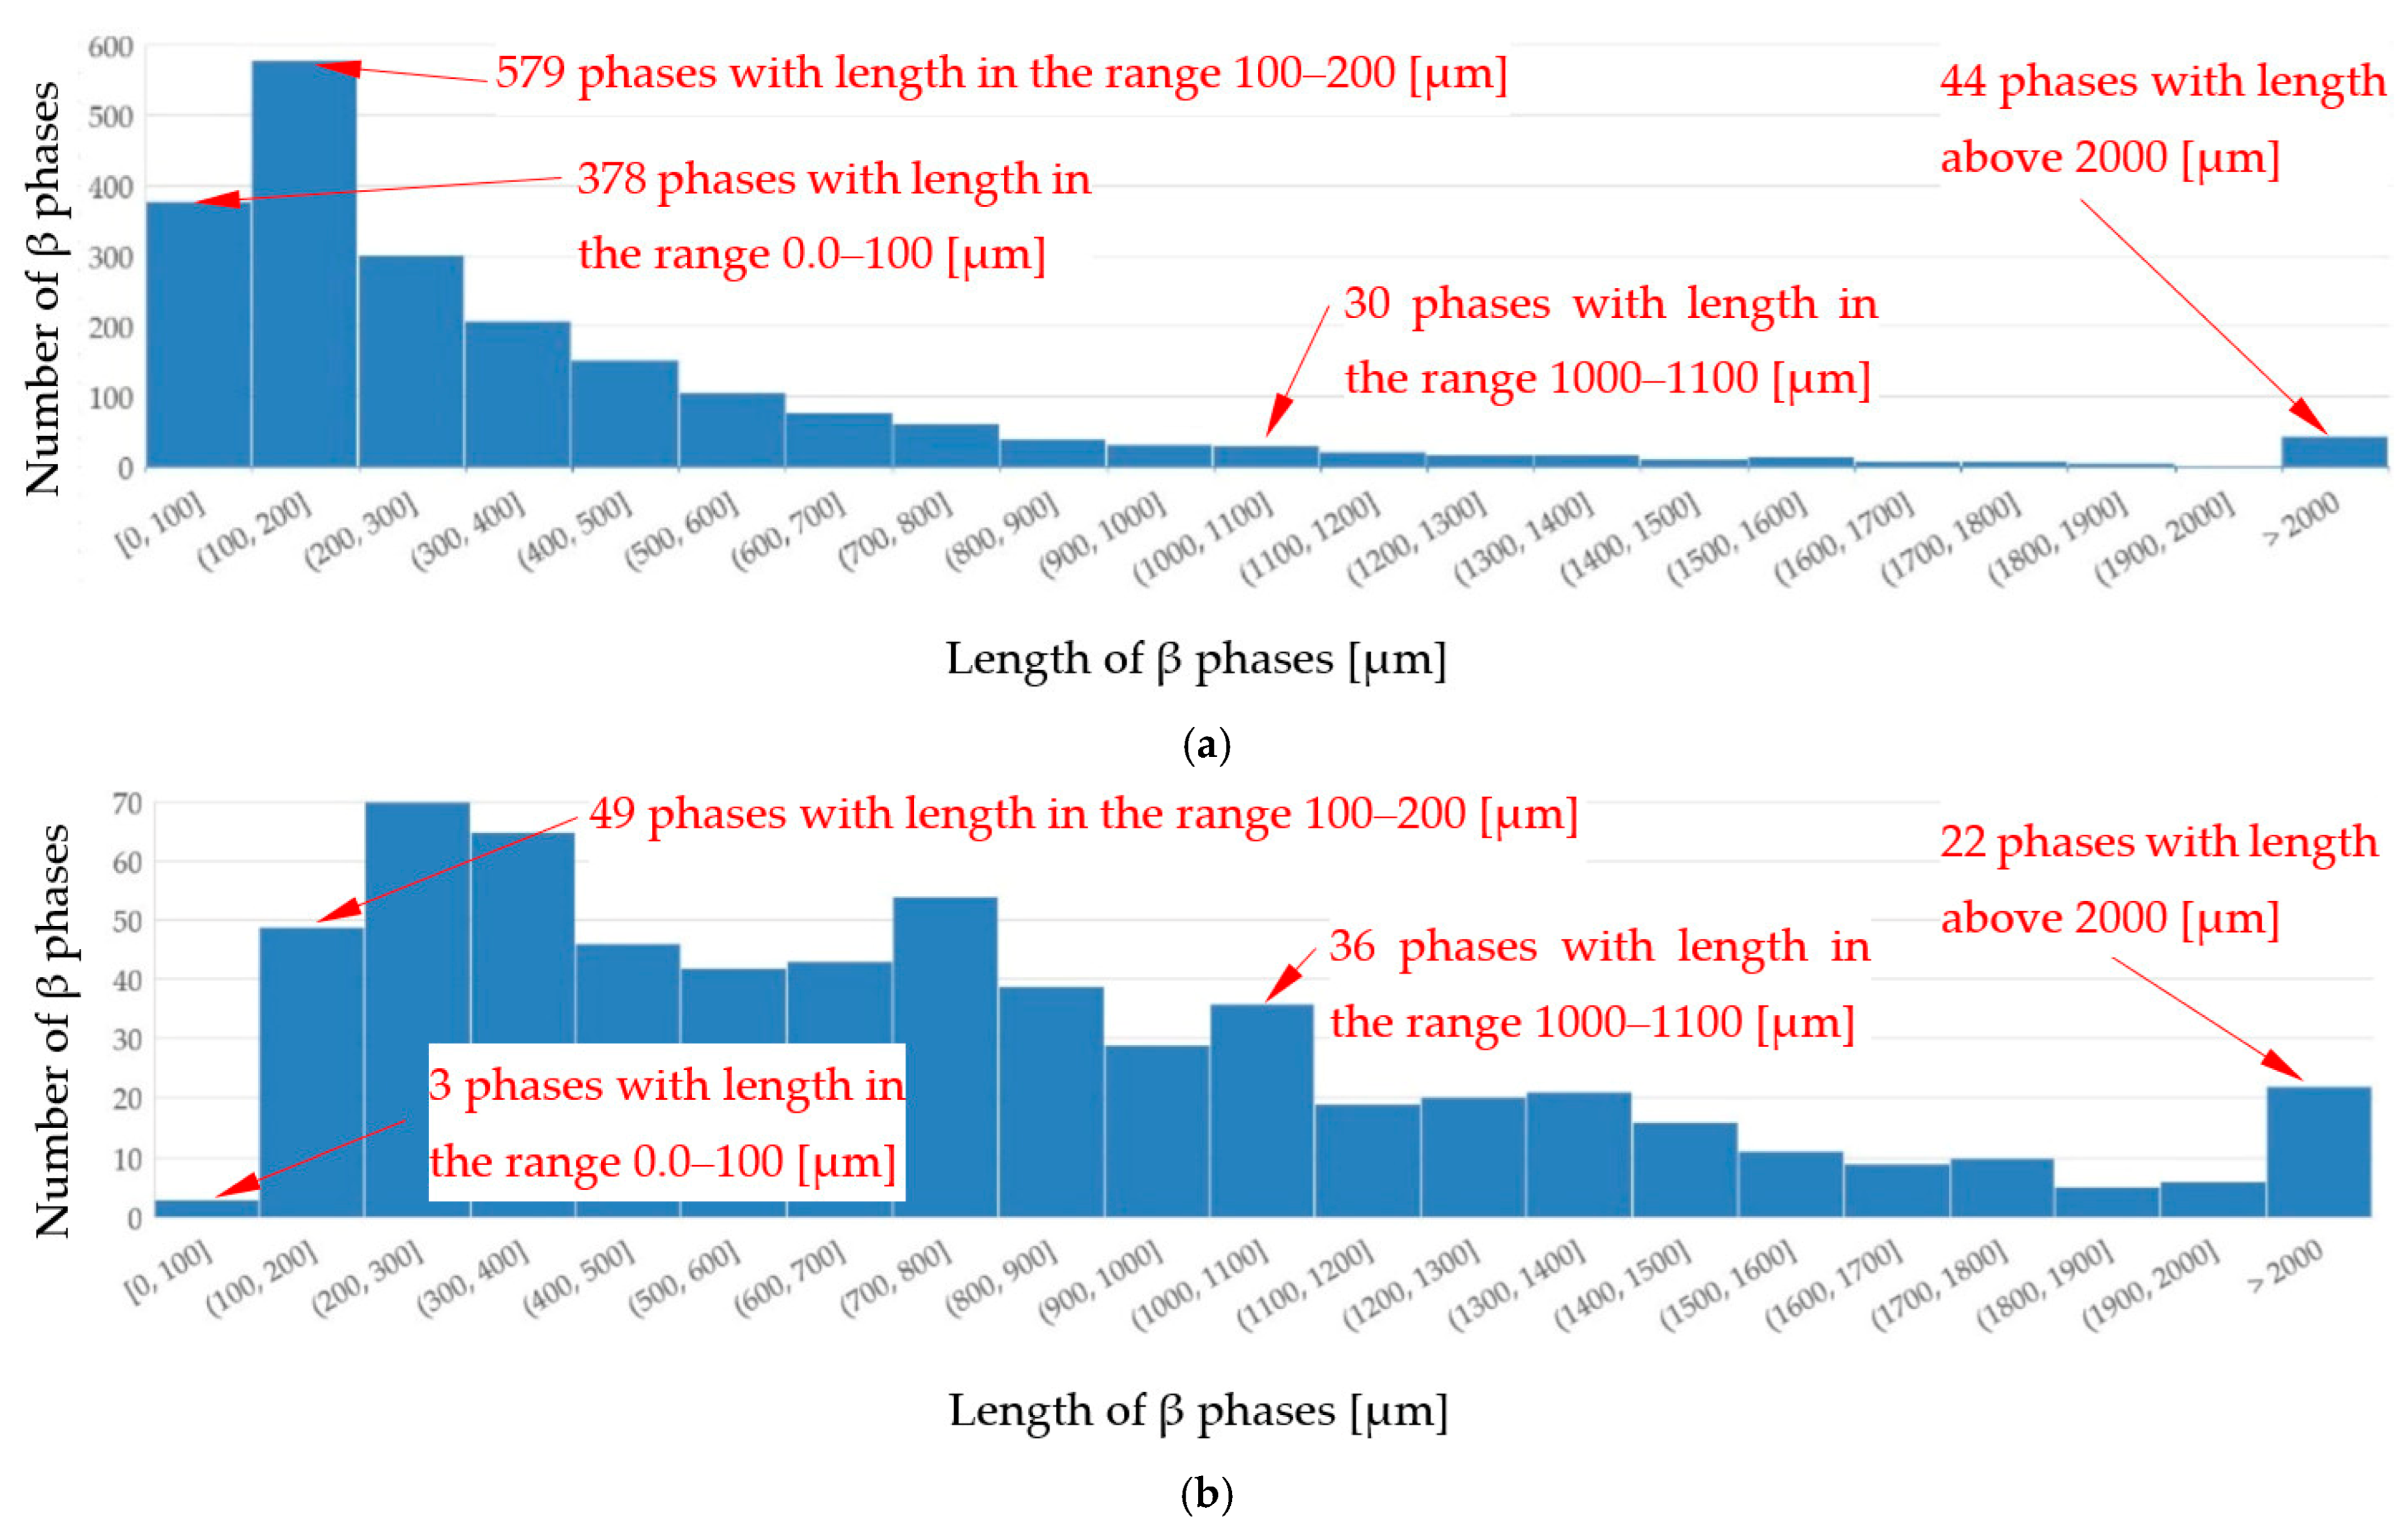
4.3. β-Al5FeSi Intermetallics
4.4. Separation of Iron Rich δ-Phases
4.5. Reduction of Si Crystals
4.6. Solidification by Stirring
5. Conclusions
- The forced flow induced by electric coils produced mainly rosettes instead of equiaxed dendrites, changed the solidification time and secondary dendrite arm spacing λ2, decreased the specific surface Sv of α-Al and modified Al–Si eutectics;
- Forced convection caused a decrease in the number density and an increase in the length of β-Al5FeSi in alloys, where β iron-rich phases precipitate first, moving initially as only one in the liquid alloy. The free growth of β-Al5FeSi in the flowing melt led to longer needles and more even lengths, whereas without stirring, very short and very long plates were observed. The melt flow effect on β-Al5FeSi phases depends on the similarly occurring phases and the precipitation sequence;
- Electromagnetic stirring caused a decrease in the number density and an increase in the length of iron-rich δ-AlFeSi_T4 phases and changed their position across the cylindrical sample in the β/Si alloy, where δ together with Si, is the first precipitating phase;
- Separation of iron-rich δ and β phases and Si crystals was observed, together with a modification of their dimensions and number density. In the β/Si alloy, in which the iron-rich phases precipitate similarly to the Si crystals along the monovariant line, different specific locations of phases across the cylindrical sample were found and this suggests mechanical separation by force from the horizontal vertical flows generated by electromagnetic stirring;
- A significant reduction in Si crystals was observed in the alloys where Si crystals precipitate as the first phase. Stirring increased the average length (by 17% and 20%) of Si crystals, but greatly reduced the number density (by 89% and 74%) and moved Si phases into the thin layer outside the cylindrical sample. The reduction in the number of Si crystals appears to be caused by the flow leading to a lower temperature gradient, the mixing and homogenization of the Si concentration and the movement of the Si element to Al–Si eutectics;
- The present separation of δ and β phases and Si crystals, and their modification are completely new and require further investigation. It seems that the application of RMF as well as complex flows and centrifugal force may play an important role in the removal of iron from foundry aluminum alloys. It may also open new design and production concepts for products with gradient structure and diverse properties, and control of Si content in the production of metallurgical grade silicon for the solar photovoltaic industry;
- Forced convection changes microstructures in different ways and its efficiency depends on the chemical composition of the alloys, phase growth sequences and the phases present;
- The present study provides an understanding of the influence of flow on individual phases and gives a picture of what changes can occur in technical alloys with complex chemical compositions.
Funding
Institutional Review Board Statement
Informed Consent Statement
Data Availability Statement
Conflicts of Interest
References
- Mondolfo, L.F. Aluminium Alloys: Structure and Properties; Butterworths & Co.: London, UK, 1976. [Google Scholar]
- Glazoff, M.V.; Zolotorevsky, V.S.; Belov, N.A. Casting Aluminum Alloys; Elsevier Science Pub Co.: Amsterdam, The Netherlands, 2007; ISBN 978-0-08-045370-5. [Google Scholar] [CrossRef]
- Nong, G. (Ed.) Aluminum Alloys; MDPI: Basel, Switzerland, 2018. [Google Scholar]
- Flemings, M. Behavior of metal alloys in the semisolid state. Metall. Mat. Trans. B 1991, 22, 957–981. [Google Scholar] [CrossRef]
- Pola, A.; Tocci, M.; Kapranos, P. Microstructure and Properties of Semi-Solid Aluminum Alloys: A Literature Review. Metals 2018, 8, 181. [Google Scholar] [CrossRef]
- Modigell, M.; Pola, A.; Tocci, M. Rheological Characterization of Semi-Solid Metals: A Review. Metals 2018, 8, 245. [Google Scholar] [CrossRef]
- Jiang, J.; Xiao, G.; Che, C.; Wang, Y. Microstructure, Mechanical Properties and Wear Behavior of the Rheoformed 2024 Aluminum Matrix Composite Component Reinforced by Al2O Nanoparticles. Metals 2018, 8, 460. [Google Scholar] [CrossRef]
- Li, Y.; Zhou, R.; Li, L.; Xiao, H.; Jiang, Y. Microstructure and Properties of Semi-solid ZCuSn10P1 Alloy Processed with an Enclosed Cooling Slope Channel. Metals 2018, 8, 275. [Google Scholar] [CrossRef]
- Nafisi, S.; Ghomashchi, R. Semi-Solid Processing of Aluminum Alloys; Springer: Berlin/Heidelberg, Germany, 2016. [Google Scholar]
- Eslami, M.; Payandeh, M.; Deflorian, F.; Jarfors, A.E.W.; Zanella, C. Effect of Segregation and Surface Condition on Corrosion of Rheo-HPDC Al–Si Alloys. Metals 2018, 8, 209. [Google Scholar] [CrossRef]
- Mohammed, M.N.; Omar, M.Z.; Al-Zubaidi, S.; Alhawari, K.S.; Abdelgnei, M.A. Microstructure and Mechanical Properties of Thixowelded AISI D2 Tool Steel. Metals 2018, 8, 316. [Google Scholar] [CrossRef]
- Beil, W.L.; Brollo, G.L.; Zoqui, E.J. A Continuous Casting Device with Electromagnetic Stirring for Production of SSM Feedstock Using Al-Si Alloys. Mat. Res. 2021, 24, 3. [Google Scholar] [CrossRef]
- Wang, H.; Davidson, C.J.; St. John, D.H. Semisolid microstructural evolution of AlSi7Mg during partial remelting. Mater. Sci. Eng. A 2004, 368, 159–167. [Google Scholar] [CrossRef]
- Brollo, G.L.; Proni, C.T.W.; Zoqui, E.J. Thixoforming of an Fe-Rich Al-Si-Cu Alloy—Thermodynamic Characterization, Microstructural Evolution, and Rheological Behavior. Metals 2018, 8, 332. [Google Scholar] [CrossRef]
- Haga, T.; Suziki, S. Casting of aluminum alloy ingots for thixoforming using a cooling slope. J. Mater. Process. Tech. 2001, 118, 169–172. [Google Scholar] [CrossRef]
- Pacheco, M.G. Electromagnetic Processing of Molten Light Alloys Reinforced by Micro/Nanoparticles. Ph.D. Thesis, Universite Grenoble Alpes UGA, Grenoble, France, 13 March 2017. [Google Scholar]
- Das, A.; Ji, S.; Fan, Z. Solidification microstructures obtained by a novel twin screw liquidus casting method. In Proceedings of the 7th International Conference on Demi-Solid Processing of Alloys and Composites, Tsukuba, Japan, 25–27 September 2002; pp. 689–694. [Google Scholar]
- Li, M.; Murakami, Y.; Matsui, I.; Omura, N.; Tada, S. Imposition Time Dependent Microstructure Formation in 7150 Aluminum Alloy Solidified by an Electromagnetic Stirring Technique. Mater. Trans. 2018, 59, 1603–1609. [Google Scholar] [CrossRef]
- He, M.; Zhang, Z.; Mao, W.; Li, B.; Bai, Y.; Xu, J. Numerical and Experimental Study on Melt Treatment for Large-Volume 7075 Alloy by a Modified Annular Electromagnetic Stirring. Materials 2019, 12, 820. [Google Scholar] [CrossRef]
- Jin, C.K. Microstructure of Semi-Solid Billets Produced by Electromagnetic Stirring and Behavior of Primary Particles during the Indirect Forming Process. Metals 2018, 8, 271. [Google Scholar] [CrossRef]
- Nakato, H.; Oka, M.; Itoyama, S.; Urata, M.; Kawasaki, T.; Hashiguchi, K.; Okano, S. Continous Semi-Solid Casting Process for Aluminum Alloy Billets. Mater. Trans. 2002, 43, 24–29. [Google Scholar] [CrossRef]
- Sree Manu, K.M.; Barekar, N.S.; Lazaro-Nebreda, J.; Patel, J.B.; Fan, Z. In-situ microstructural control of A6082 alloy to modify second phase particles by melt conditioned direct chill (MC-DC) casting process—A novel approach. J. Mater. Process. Tech. 2021, 295, 117170. [Google Scholar] [CrossRef]
- Lazaro-Nebreda, J.; Patel, J.B.; Fan, Z. Improved degassing efficiency and mechanical properties of A356 aluminum alloy castings by high shear melt conditioning (HSMC) technology. J. Mater. Process. Tech. 2021, 294, 117146. [Google Scholar] [CrossRef]
- Zhang, Y.; Patel, J.B.; Lazaro-Nebreda, J.; Fan, Z. Improved Defect Control and Mechanical Property Variation in High-Pressure Die Casting of A380 Alloy by High Shear Melt Conditioning. JOM 2018, 70, 2726–2730. [Google Scholar] [CrossRef]
- Belov, N.A.; Aksenov, A.A.; Eskin, D.G. Iron in Aluminium Alloys—Impurity and Alloying Element, 1st ed.; Taylor and Francis Group: London, UK, 2002. [Google Scholar] [CrossRef]
- Shabestari, S.G. The effect of iron and manganese on the formation of intermetallic compounds in aluminum-silicon alloys. Mater. Sci. Eng. 2004, 383, 289–298. [Google Scholar] [CrossRef]
- Thermo-Calc 4.1—Software Package from Thermo-Calc Software AB. Stockholm. Sweden. Available online: http://www.thermocalc.se (accessed on 5 March 2023).
- Mikolajczak, P.; Ratke, L. Intermetallic phases and microstructure in AlSi alloys influenced by fluid flow. Suppl. Proc. Gen. Pap. Sel. 2011, 3, 825–832. [Google Scholar] [CrossRef]
- Mikolajczak, P.; Ratke, L. Thermodynamic assessment of mushy zone in directional solidification. Arch. Foundry Eng. 2015, 15, 101–109. [Google Scholar] [CrossRef]
- Mikolajczak, P. Microstructural Evolution in AlMgSi Alloys during Solidification under Electromagnetic Stirring. Metals 2017, 7, 89. [Google Scholar] [CrossRef]
- Nafisi, S.; Emad, D.; Shehata, T.; Ghomashchi, R. Effects of electromagnetic stirring and superheat on the microstructural characteristics of Al-Si-Fe alloy. Mater. Sci. Eng. A 2006, 432, 71–83. [Google Scholar] [CrossRef]
- Fang, X.; Shao, G.; Liu, Y.Q.; Fan, Z. Effects of intensive forced melt convection on the mechanical properties of Fe containing Al-Si based alloys. Mater. Sci. Eng. A 2007, 445, 65–72. [Google Scholar] [CrossRef]
- Steinbach, S.; Euskirchen, N.; Witusiewicz, V.; Sturz, L.; Ratke, L. Fluid flow effects on intermetallic phases in Al-cast alloys. Trans. Indian Inst. Met. 2007, 60, 137–141. [Google Scholar] [CrossRef]
- Mikolajczak, P.; Ratke, L. Effect of stirring induced by rotating magnetic field on β-Al5FeSi intermetallic phases during directional solidification in AlSi alloys. Int. J. Cast Met. Res. 2013, 26, 339–353. [Google Scholar] [CrossRef]
- Das, A.; Ji, S.; Fan, Z. Morphological development of solidification structures under forced fluid flow: A Monte Carlo simulation. Acta Mater. 2002, 50, 4571–4585. [Google Scholar] [CrossRef]
- Birol, Y. Evolution of globular microstructures during processing of aluminum slurries. Trans. Nonferrous Met. Soc. China 2013, 23, 1–6. [Google Scholar] [CrossRef]
- Li, T.; Lin, X.; Huang, W. Morphological evolution during solidification under stirring. Acta Mater. 2006, 54, 4815–4824. [Google Scholar] [CrossRef]
- Martinez, R.A.; Flemings, M.C. Evolution of particle morphology in semisolid processing. Met. Mater. Trans. A 2005, 36, 2205–2210. [Google Scholar] [CrossRef]
- Ji, S.; Fan, Z.; Bevis, M. Semi-solid processing of engineering alloys by a twin-screw rheomoulding process. Mater. Sci. Eng. 2001, 299, 210–217. [Google Scholar] [CrossRef]
- Niroumand, B.; Xia, K. 3D study of the structure of primary crystals in a rheocast Al-Cu alloy. Mater. Sci. Eng. 2000, 283, 70–75. [Google Scholar] [CrossRef]
- Birol, Y. A357 thixoforming feedstock produced by cooling slope casting. J. Mater. Process. Tech. 2007, 186, 94–101. [Google Scholar] [CrossRef]
- Mullis, A. Growth induced dendritic bending and rosette formation during solidification in a shearing flow. Acta Mater. 1999, 47, 1783–1789. [Google Scholar] [CrossRef]
- Kurz, W.; Fisher, D. Fundamentals of Solidification; Trans Tech Public: Bäch, Switzerland, 1992; pp. 85–90. [Google Scholar]
- Mendoza, R.; Alkemper, J.; Voorhees, P. The morphological evolution of dendritic microstructures during coarsening. Metall. Mater. Trans. A 2003, 34, 481–489. [Google Scholar] [CrossRef]
- Dantzig, J.A.; Rappaz, M. Solidification; EPFL Press: Lausanne, Switzerland, 2009; ISBN 9780849382383. [Google Scholar]
- Stefanescu, D. Science and Engineering of Casting and Solidification; Springer: Boston, MA, USA, 2009; ISBN 978-0-387-74609-8. [Google Scholar] [CrossRef]
- Wang, C.Y.; Beckermann, C. Equiaxed Dendritic Solidification with Convection: Part II. Numerical Simulations for an Al-4 Wt Pct Cu Alloy. Metall. Mater. Trans. A 1996, 27, 2765. [Google Scholar] [CrossRef]
- Hunt, J.D. Pattern formation in solidification. Sci. Technol. Adv. Mater. 2001, 2, 147–155. [Google Scholar] [CrossRef]
- Hunt, J.D.; Lu, S.Z. Numerical modeling of cellular/dendritic array growth: Spacing and structure predictions. Metall. Mater. Trans. A 1996, 27, 611–623. [Google Scholar] [CrossRef]
- Kattamis, T.Z.; Flemings, M.C. Dendrite morphology. Microsegregation and Homogenization of low alloy steel. Trans. Met. Soc. AIME 1965, 233, 992–999. [Google Scholar]
- Rappaz, M.; Boettinger, W. On dendritic solidification of multicomponent alloys with unequal liquid diffusion coefficients. Acta Mater. 1999, 47, 3205–3219. [Google Scholar] [CrossRef]
- Bouchard, D.; Kirkaldy, J.S. Prediction of dendrite arm spacing in unsteady- and steady-state heat flow. Metall. Mater. Trans. B 1997, 28, 651–663. [Google Scholar] [CrossRef]
- Steinbach, S.; Ratke, L. The influence of fluid flow on the microstructure of directionally solidified AlSi-base alloys. Metall. Mater. Trans. A 2007, 38, 1388–1394. [Google Scholar] [CrossRef]
- Mortensen, A. On the rate of dendrite arm coarsening. Metall. Mater. Trans. A 1991, 22, 569–574. [Google Scholar] [CrossRef]
- Voorhees, P.W.; Glicksman, M.E. Ostwald ripening during liquid phase sintering—Effect of volume fraction on coarsening kinetics. Metall. Mater. Trans. A 1984, 15, 1081–1089. [Google Scholar] [CrossRef]
- Ferreira, A.F.; Castro, J.A.; Ferreira, L.O. Predicting Secondary-Dendrite Arm Spacing of the Al—4.5wt%Cu Alloy During Unidirectional Solidification. Mater. Res. 2017, 20, 68–75. [Google Scholar] [CrossRef]
- Bellon, B.; Boukellal, A.K.; Isensee, T.; Wellborn, O.M.; Trumble, K.P.; Krane, M.J.M.; Titus, M.S.; Tourret, D.; Llorca, J. Multiscale prediction of microstructure length scale in metallic alloy casting. Acta Mater. 2021, 207, 116686. [Google Scholar] [CrossRef]
- Mullis, A.M. The effects of fluid flow on the secondary arm coarsening during dendritic solidification. J. Mater. Sci. 2003, 38, 2517–2523. [Google Scholar] [CrossRef]
- Diepers, H.J.; Beckerman, C.; Steinbach, I. Simulation of convection and ripening in a binary alloy mush using the phase field method. Acta Mater. 1999, 47, 3663–3678. [Google Scholar] [CrossRef]
- Kasperovich, G.; Genau, A.; Ratke, L. Mushy zone coarsening in an AlCu30 alloy accelerated by a rotating magnetic field. Metall. Mater. Trans. A 2011, 42, 1657–1666. [Google Scholar] [CrossRef]
- Ratke, L.; Thieringer, W.K. The influence of particle motion on Ostwald ripening in liquids. Acta Mater. 1985, 33, 1793–1802. [Google Scholar] [CrossRef]
- Marsh, S.P.; Glicksman, M.E. Overview of geometric effects on coarsening of mushy zones. Metall. Mater. Trans. A 1996, 27, 557–567. [Google Scholar] [CrossRef]
- Loué, W.R.; Suéry, M. Microstructural evolution during partial remelting of AlSi7Mg alloys. Mater. Sci. Eng. A 1995, 203, 1–13. [Google Scholar] [CrossRef]
- Jackson, K.A.; Hunt, J.D. Lamellar and rod eutectic growth. Trans. AIME 1966, 236, 1129–1142. [Google Scholar]
- Sous, S. Instationäre Erstarrung Eutektischer Al-Si Legierungen. Ph.D. Thesis, RWTH, Aachen, Germany, 2000. [Google Scholar]
- Ren, Z.; Junze, J. Formation of a separated eutectic in Al-Si eutectic alloy. J. Mater. Sci. 1992, 27, 4663–4666. [Google Scholar] [CrossRef]
- Mikolajczak, P. Effect of Rotating Magnetic Field on Microstructure in AlCuSi Alloys. Metals 2021, 11, 1804. [Google Scholar] [CrossRef]
- Yu, J.M.; Wanderka, N.; Rack, A.; Daudin, R.; Boller, E.; Markötter, H.; Manzoni, A.; Vogel, F.; Arlt, T.; Manke, I.; et al. Formation of intermetallic δ phase in Al-10Si-0.3Fe alloy investigated by in-situ 4D X-ray synchrotron tomography. Acta Mater. 2017, 129, 194–202. [Google Scholar] [CrossRef]
- Li, T.X. Application of Electromagnetic Separation in Aluminum Melt. Ph.D. Thesis, Shanghai Jiao Tong University, Shanghai, China, 2004. [Google Scholar]
- Van Der Donk, H.M.; Nijhof, G.H. Method for Refining an Aluminum Scrap Smelt. U.S. Patent 5,741,348, 21 April 1998. [Google Scholar]
- Matsubara, H.; Izawa, N.; Nakanishi, M. Macrosegregation in Al-11 mass%Si alloy containing 2 mass%Fe solidified under centrifugal force. J. Japan Inst. Light Met. 1998, 48, 93–97. [Google Scholar] [CrossRef]
- Kim, J.H.; Yoon, E.P. Elimination of Fe element in A380 aluminum alloy scrap by electromagnetic force. J. Mater. Sci. Lett. 2000, 19, 253–255. [Google Scholar] [CrossRef]
- Jie, J.C.; Zou, Q.C.; Wang, H.W.; Sun, J.L.; Lu, Y.P.; Wang, T.M.; Li, T.J. Separation and purification of Si from solidification of hypereutectic Al-Si melt under rotating magnetic field. J. Cryst. Growth 2014, 399, 43–48. [Google Scholar] [CrossRef]
- Wenzhou, Y.; Wenhui, M.; Guoqiang, L.; Haiyang, X.; Li, S.; Dai, Y. Effect of electromagnetic stirring on the enrichment of primary silicon from Al-Si melt. J. Cryst. Growth 2014, 405, 23–28. [Google Scholar] [CrossRef]
- Ma, X.; Lei, Y.; Yoshikawa, T.; Zhao, B.; Morita, K. Effect of solidification conditions on the silicon growth and refining using Si-Sn melt. J. Cryst. Growth. 2015, 430, 98–102. [Google Scholar] [CrossRef]
- Zhu, K.; Hu, J.; Ma, W.; Wei, K.; Lv, T.; Dai, Y. Effect of solidification parameters and magnetic field on separation of primary silicon from hypereutectic Ti-85 wt.% Si melt. J. Cryst. Growth. 2019, 522, 78–85. [Google Scholar] [CrossRef]
- Li, Y.; Liu, L.; Chen, J. Effect of mechanical stirring on silicon purification during Al-Si solvent refining. J. Cryst. Growth. 2021, 553, 125943. [Google Scholar] [CrossRef]
- Ban, B.; Li, Y.; Zou, Q.; Zhang, T.; Chen, J.; Dai, S. Refining of metallurgical grade Si by solidification of Al-Si melt under electromagnetic stirring. J. Mater. Process. Tech. 2015, 222, 142–147. [Google Scholar] [CrossRef]
- Zhang, Y.; Miao, X.; Shen, Z.; Han, Q.; Song, C.; Zhai, Q. Macro segregation formation of the primary silicon phase in directionally solidified Al-Si hypereutectic alloys under the impact of electric currents. Acta Mater. 2015, 97, 357–366. [Google Scholar] [CrossRef]
- Li, J.; Ni, P.; Wang, L.; Tan, Y. Influence of direct electric current on solidification process of Al-Si alloy. Mat. Sci. Semicond. Process. 2017, 61, 79–84. [Google Scholar] [CrossRef]
- Lv, G.; Bao, Y.; Zhang, Y.; He, Y.; Ma, W.; Leu., Y. Effects of electromagnetic directional solidification conditions on the separation of primary silicon from al-Si alloy with high Si content. Mat. Sci. Semicond. Process. 2018, 81, 139–148. [Google Scholar] [CrossRef]
- Yoshikawa, T.; Morita, K. Refining of Si by the solidification of Si-Al melt with electromagnetic force. ISIJ Int. 2005, 45, 967–971. [Google Scholar] [CrossRef]
- Huang, F.; Zhao, L.; Liu, L.; Hu, Z.; Chen, R.; Dong, Z. Separation and purification of Si from Sn-30Si alloy by electromagnetic semi-continuous directional solidification. Mat. Sci. Semicond. Process. 2019, 99, 54–61. [Google Scholar] [CrossRef]
- He, Y.; Yang, X.; Duan, L.; Li, S.; Chen, Z.; Ma, W.; Lv, G.; Xing, A. Silicon separation and purification process from hypereutectic aluminum-silicon for organosilicon use. Mat. Sci. Semicond. Process. 2021, 121, 105333. [Google Scholar] [CrossRef]
- Jiang, W.; Yu, W.; Li, J.; You, Z.; Li, C.; Lv, X. Segregation and morphological evolution of Si phases during electromagnetic directional solidification of hypereutectic Al-Si alloys. Materials 2018, 12, 10. [Google Scholar] [CrossRef] [PubMed]
- Xue, H.; Lv, G.; Ma, W.; Chen, D.; Yu, J. Separation mechanism of primary silicon from hypereutectic Al-Si melts under alternating electromagnetic fields. Met. Mater. Trans. 2015, 46, 2922–2932. [Google Scholar] [CrossRef]
- Li, X.; Ren, Z.; Fautrelle, Y. Effect of a high magnetic field on the distribution of the solute Si and the morphology of the primary Si phase. Mater. Lett. 2009, 63, 1235–1238. [Google Scholar] [CrossRef]
- Sun, J.L.; Zou, Q.C.; Jie, J.C.; Li, T. Separation of primary Si and impurity boron removal from Al-30%Si-10%Sn melt under a traveling magnetic field. China Foundry 2016, 13, 284–288. [Google Scholar] [CrossRef]
- Zou, Q.; Tian, H.; Zhang, Z.; Sun, C.; Jie, J.; Han, N.; An, X. Controlling segregation behavior of primary Si in hypereutectic Al-Si alloy by electromagnetic stirring. Metals 2020, 10, 1129. [Google Scholar] [CrossRef]
- Zou, Q.; Han, N.; Zhang, Z.; Jie, J.; Xu, F.; An, X. Enhancing segregation behavior of impurity by electromagnetic stirring in the solidification process of Al-30Si alloy. Metals 2020, 10, 155. [Google Scholar] [CrossRef]
- Zou, Q.; Jie, J.; Wang, T.; Li, T. An efficient method to purify metallurgical grade Si by electromagnetic semi-continuous casting of Al-30Si melt. Mater. Lett. 2016, 185, 59–62. [Google Scholar] [CrossRef]


| Aluminum Alloys | RMF [mT] {Solid. Time [s]} | Dendrites | |
|---|---|---|---|
| λ2 [µm] | Sv [µm−1] | ||
| “α-Al-first” alloy Al–Si7.837Fe0.521 | 0{676} | 95 [8.9] (34/332) 93:100:95:91 [9.7:8.9:9.3:8.4] | 0.029 [0.003] 0.027:0.032:0.031:0.029 [0.004:0.004:0.002:0.004] |
| 11{815} | 89 [7.5] (37/222) (−6%) 92:94:87:84 [7.0:9.4:5.6:6.1] | 0.017 [0.001] (−41%) 0.018:0.016:0.016:0.019 [0.001:0.001:0.001:0.001] | |
| “α-Al-2-first” alloy Al–Si4.861Fe0.306 | 0{795} | 112 [10] (38/359) 122:115:120:101 [8.5:12.3:7.6:8.0] | 0.022 [0.002] 0.020:0.022:0.021:0.029 [0.001:0.001:0.001:0.002] |
| 11{779} | 102 [7.5] (36/216) (−9%) 104:100:100:105 [8.4:6.4:9.2:6.8] | 0.015 [0.001] (−32%) 0.016:0.014:0.015:0.016 [0.001:0.001:0.001:0.001] | |
| “β-first” alloy Al–Si12.795Fe1.705 | 0{519} | 22.5 [6.6] (19/194) 17:19:22:51 [2.1:2.4:3.8:3.1] | 0.069 [0.027] 0.161:0.131:0.071:0.040 [0.013:0.017:0.007:0.002] |
| 11{504} | 36 [12] (21/220) (60%) 15:32:66:42 [1.8:3.5:7.3:10.3] | 0.040 [0.036] (−42%) 0.179:0.076:0.037:0.033 [0.017:0.006:0.009:0.001] | |
| “β-2-first” alloy Al–Si12.911Fe2.372 | 0{525} | 22 [9.0] (13/108) 20:-:70:18 [0.1:-:5.2:2.0] | 0.081 [0.023] 0.155:0.064:0.056:0.129 [0.007:0.014:0.003:0.013] |
| 11{469} | 60 [12] (27/173) (170%) -:82:68:53 [-:8.8:11.5:12.1] | 0.035 [0.006] (−57%) -:0.031:0.035:0.043 [-:0.002:0.004:0.008] | |
| “Si-first” alloy Al–Si14.877Fe0.871 | 0{560} | 12 [2.1] (3/27) 12:-:-:- [2.1:-:-:-] | 0.087 [0.008] 0.087:-:-:- [0.008:-:-:-] |
| 11{624} | 41 [10.3] (5/59) (240%) 32:54:-:36 [7.2:17.1:-:0.0] | 0.061 [0.009] (−30%) 0.089:0.054:-:0.058 [0.001:0.006:-:0.006] | |
| “Si-2 first” alloy Al–Si16.187Fe0.858 | 0{535} | 19 [1.2] (2/13) 19:-:-:- [1.2:-:-:-] | 0.092 [0.002] 0.092:-:-:- [0.002:-:-:-] |
| 11{599} | 27 [3.7] (4/47) (42%) 24:38:-:- [0.9:0.0:-:-] | 0.083 [0.004] (−10%) 0.083:-:-:- [0.004:-:-:-] | |
| “α-Al/β” alloy Al–Si7.508Fe1.687 | 0{841} | 71 [4.5] (35/355) 72:71:74:66 [2.5:4.4:4.9:4.9] | 0.031 [0.002] 0.030:0.030:0.032:0.030 [0.002:0.002:0.001:0.001] |
| 11{854} | 79 [7.7] (25/252) (11%) 79:72:87:84 [8.6:7.2:4.3:9.7] | 0.030 [0.002] (−3%) 0.033:0.030:0.031:0.028 [0.001:0.002:0.002:0.001] | |
| “α-Al/Si” alloy Al–Si12.587Fe0.443 | 0{523} | 57 [11.1] (19/186) 85:-:77:45 [10.0:-:9.7:6.2] | 0.033 [0.003] 0.034:-:0.034:0.033 [0.002:-:0.003:0.006] |
| 11{481} | 77 [8.3] (31/219) (35%) 61:71:85:80 [12.2:7.4:4.8:6.9] | 0.028 [0.003] (−15%) 0.033:0.026:0.029:0.028 [0.005:0.001:0.002:0.001 | |
| “β/Si” alloy Al–Si15.136Fe1.678 | 0{556} | 20 [3.1] (2/23) 26:17:-:- [0.1:0.1:-:-] | 0.076 [0.012] 0.076:-:-:- [0.012:-:-:-] |
| 11{557} | 71 [9.9] (6/50) (255%) 61:-:-:90 [9.9:-:-:5.7] | 0.036 [0.006] (−53%) 0.040:-:-:0.030 [0.006:-:-:0.001] | |
| “eutectic point” alloy Al–Si12.674Fe0.895 | 0{471} | 69 [9.5] (21/137) 56:72:58:79 [15.3:8.2:11.9:5.8] | 0.033 [0.005] 0.040:0.032:0.038:0.029 [0.006:0.002:0.007:0.002] |
| 11{517} | 52 [18.5] (15/140) (−25%) 81:122:84:30 [16.5:0.0:9.2:7.6] | 0.041 [0.013] (24%) 0.031:0.037:0.038:0.069 [0.002:0.004:0.002:0.013] | |
| Aluminum Alloys | RMF [mT] {Solid. Time [s]} | Fe Phases β-Al5FeSi | Al–Si Eutectics | |
|---|---|---|---|---|
| Lβ [μm] | nβ [mm−2] | λE [μm] | ||
| “α-Al-first” alloy Al–Si7.837Fe0.521 | 0{676} | 9.40 [0.527] (85) 7.10:8.65:8.49:10.49 [0.249:0.330:0.382:0.630] | 6.55 3.70:2.77:5.55:14.19 | 6.5 [0.43] 5.3:5.3:6.3:8.9 |
| 11{815} | 8.07 [0.373] (195) (−14%) 10.05:7.51:6.84:7.65 [0.448:0.265:0.310:0.343] | 15.04 (130%) 16.35:11.72:15.11:16.96 | 7.8 [0.81] (20%) 12.3:6.7:5.7:8.1 | |
| “α-Al-2-first” alloy Al–Si4.861Fe0.306 | 0{795} | 4.52 [0.224] (88) 4.39:4.19:3.46:5.91 [0.158:0.129:0.149:0.293] | 6.79 6.17:3.70:8.95:8.33 | 2.99 [0.27] 2.82:2.17:2.72:4.31 |
| 11{779} | 4.61 [0.176] (117) (2%) 5.71:3.72:4.56:4.52 [0.237:0.085:0.184:0.135] | 9.02 (33%) 6.17:5.55:12.34:12.03 | 5.91 [0.45] (98%) 7.72:4.41:6.18:5.09 | |
| “β-first” alloy Al–Si12.795Fe1.705 | 0{519} | 407 [51.9] (2130) 326:366:479:418 [32.3:40.6:51.7:65.6] | 7.52 27.56:10.77:6.43:5.42 | 7.10 [0.77] 3.40:5.18:7.74:11.03 |
| 11{504} | 780 [53.5] (614) (92%) 859:783:832:723 [50.7:54.0:55.6:51.8] | 2.17 (−71%) 2.85:1.68:2.42:2.11 | 6.68 [0.74] (−6%) 3.21:5.83:8.80:9.88 | |
| “β-2-first” alloy Al–Si12.911Fe2.372 | 0{525} | 408 [42.7] (1177) 401:297:443:553 [38.2:26.2:42.7:58.6] | 8.31 11.1:17.2:7.90:4.42 | 6.87 [1.59] 3.2:4.52:10.52:10.89 |
| 11{469} | 717 [53.2] (359) (76%) 634:705:681:778 [49.1:50.5:52.4:56.2] | 2.54 (−70%) 4.07:2.79:2.62:2.16 | 8.75 [1.56] (27%) 2.42:4.62:12.85:15.08 | |
| “Si-first” alloy Al–Si14.877Fe0.871 | 0{560} | 394 [23.4] (327) 326:432 [19.1:24.7] | 0.58 0.84:0.50 | 11.54 [1.68] 5.90:9.92:17.58:15.40 |
| 11{624} | 286 [25.6] (728) (−27%) 257:323 [21.0:30.0] | 1.29 (122%) 1.11:1.59 | 10.18 [1.51] (−12%) 4.28:9.41:9.45:17.56 | |
| “Si-2-first” alloy Al–Si16.187Fe0.858 | 0{535} | 241 [18.7] (655) 196:401 [15.6:20.1] | 1.16 1.85:0.50 | 12.82 [1.61] 7.32:9.68:15.59:20.65 |
| 11{599} | 236 [19.2] (959) (−2%) 230:281 [19.7:14.4] | 1.69 (46%) 2.06:0.75 | 12.72 [1.27] (−1%) 9.94:7.76:14.70:18.62 | |
| “α-Al/β” alloy Al–Si7.508Fe1.687 | 0{841} | 109 [8.4] (1840) 92:117:114:115 [8.4:9.1:7.6:8.1] | 105 118:106:94:101 | 4.44 [0.40] 2.83:3.51:5.11:6.73 |
| 11{854} | 127 [11.5] (1347) (17%) 177:120:130:99 [14.3:11.1:11.3:8.5] | 77 (−26%) 60:69:76:101 | 9.11 [1.78] (105%) 8.61:7.69:12.38:8.42 | |
| “α-Al/Si” alloy Al–Si12.587Fe0.443 | 0{523} | 42 [9.4] (1226) 23:39:77:58 [2.1:3.1:22.9:5.7] | 70 109:75:41:54 | 12.50 [1.89] 5.88:10.23:19.44:17.58 |
| 11{481} | 38 [3.0] (2592) (−10%) 36:40:38:39 [2.4:2.6:3.2:3.9] | 147 (110%) 169:177:127:116 | 16.83 [1.47] (35%) 10.80:16.44:21.49:19.6 | |
| “β/Si” alloy Al–Si15.136Fe1.678 | 0{556} | 128 [7.1] (1857) 130:144:109 [6.7:7.4:6.8:-] | 13.1 13.8:9.0:20.7 | 9.83 [1.48] 7.06:5.40:10.41:19.65 |
| 11{557} | 100 [9.6] (1830) (−22%) 138:161:170 [7.0:9.8:11.2] | 7.22 (−45%) 2.48:11.42:7.96 | 10.23 [1.60] (4%) 5.97:6.39:13.15:17.32 | |
| “eutectic point” alloy Al–Si12.674Fe0.895 | 0{471} | 163 [11.6] (1064) 140:155:156:175 [7.6:9.4:12.8:12.0] | 15.04 15.29:17.59:14.45:14.57 | 14.66 [1.54] 9.86:13.48:20.17:15.94 |
| 11{517} | 112 [7.7] (2199) (−31%) 131:93:138:104 [9.2:6.6:10.3:5.4] | 31.08 (107%) 30.11:41.13:26.50:30.67 | 15.02 [1.89] (2%) 14.88:17.37:21.04:7.74 | |
| Aluminum Alloys | RMF [mT] | Fe-Phases (δ-Phases) | Si Crystals | ||
|---|---|---|---|---|---|
| Lδ [µm] | nδ [mm−2] | LSi [µm] | nSi [mm−2] | ||
| “Si-first” alloy Al–Si14.877Fe0.871 | 0 | - | - | 898 [41.5] -:898 [-:41.5] | 0.067 0.0:0.090 |
| 11 | - | - | 1047 [94.5] (17%) -:1047 [-:94.5] | 0.007 (−89%) 0.0:0.016 | |
| “Si-2-first” alloy Al–Si16.187Fe0.858 | 0 | - | - | 891 [42.9] -:891 [-:42.9] | 0.141 0.0:0.277 |
| 11 | - | - | 1072 [47.1] (20%) -:1072 [-:47.1] | 0.037 (−74%) 0.0:0.135 | |
| “β/Si” alloy Al–Si15.136Fe1.678 | 0 | 240 [15.6] (812) 210:250:276 [12.7:15.8:19.0] | 5.74 5.36:6.05:5.85 | 565 [38.5] 714:528:512 [51.7:30.6:35.3] | 0.276 0.161:0.248:0.574 |
| 11 | 307 [20.6] (679) (28%) 306:217:341 [20.9:9.6:18.2] | 2.40 (−58%) 5.60:0.09:0.70 | 851 [60.6] (51%) 759:379:1008 [38.5:18.2:71.5] | 0.223 (−19%) 0.196:0.060:0.630 | |
| Alloy | Reaction | Temperature Range of Reaction | Mass Fraction of Solid Phases [%] (the Rest is Liquid Alloy) at the Temperature [°C] | ||||
|---|---|---|---|---|---|---|---|
| Temperature | α-Al | β-Al5FeSi | δ-AlFeSi_T4 | Al–Si Eutectics | |||
| “α-Al first” alloy Al–Si7.837Fe0.521 | L → α-Al + L | 610–575.83 | 575.83 | 42.75 | 0 | 0 | 0 |
| L → α-Al + β-Al5FeSi + Si | 575.83–575.02 | 575.02 | 91.96 | 1.92 | 0 | 6.12 | |
| “α-Al-2 first” alloy Al–Si4.861Fe0.306 | L → α-Al + L | 630–578.86 | 578.86 | 68.09 | 0 | 0 | 0.0 |
| L → α-Al + β-Al5FeSi + Si | 578.86–575.02 | 575.02 | 95.66 | 1.12 | 0 | 3.22 | |
| “β first” alloy Al–Si12.795Fe1.705 | L → β- β-Al5FeSi + L | 610–575.21 | 575.21 | 0 | 3.10 | 0 | 0.0 |
| L → α-Al + β-Al5FeSi + Si | 575.21–575.02 | 575.02 | 83.17 | 6.33 | 0 | 10.50 | |
| “β-2 first” alloy Al–Si12.911Fe2.372 | L → β-Al5FeSi + L | 630–575.61 | 575.61 | 0 | 5.64 | 0 | 0.0 |
| L → α-Al + β-Al5FeSi + Si | 575.61–575.02 | 575.02 | 80.95 | 8.80 | 0 | 10.25 | |
| “Si first” alloy Al–Si14.877Fe0.871 | L → Si + L | 610–575.03 | 575.03 | 0.0 | 0.0 | 0 | 2.52 |
| L → α-Al + β-Al5FeSi + Si | 575.03–575.02 | 575.02 | 83.69 | 3.23 | 0 | 13.08 | |
| “Si-2 first” alloy Al–Si16.187Fe0.858 | L → Si + L | 630–575.03 | 575.03 | 0 | 0 | 0 | 4.02 |
| L → α-Al + β-Al5FeSi + Si | 575.03–575.02 | 575.02 | 82.40 | 3.18 | 0 | 14.42 | |
| “α-Al/β” alloy Al–Si7.508Fe1.687 | L → α-Al + β-Al5FeSi + L | 610.0–575.03 | 575.03 | 47.81 | 4.68 | 0 | 0.0 |
| L → α-Al + β-Al5FeSi + Si | 575.03–575.02 | 575.02 | 88.60 | 6.26 | 0 | 5.14 | |
| “α-Al/Si” alloy Al–Si12.587Fe0.443 | L → α-Al + Si + L | 576.04–575.03 | 575.03 | 45.03 | 0.0 | 0 | 5.65 |
| L → α-Al + β-Al5FeSi + Si | 575.03–575.02 | 575.02 | 87.37 | 1.64 | 0 | 10.99 | |
| “β/Si” alloy Al–Si15.136Fe1.678 | L → δ-AlFeSi_T4 + Si + L | 610–596.14 | 596.14 | 0.0 | 0 | 1.09 | 0.97 |
| L → β-Al5FeSi + Si + L | 596.14–575.03 | 575.03 | 0.0 | 3.11 | 0.0 | 2.70 | |
| L → α-Al + β-Al5FeSi + Si | 575.03–575.02 | 575.02 | 80.87 | 6.23 | 0.0 | 12.90 | |
| “eutectic point” alloy Al–Si12.674Fe0.895 | L → α-Al + β-Al5FeSi + Si | 575.03–575.02 | 575.02 | 85.86 | 3.31 | 0.0 | 10.83 |
| Aluminum Alloys (TL [°C]) | Main Effect of Forced Convection on Microstructure Parameters by Electromagnetic Stirring RMF | Parameters Change in % | ||||||
|---|---|---|---|---|---|---|---|---|
| λ2 [µm] | Sv [µm−1] | Lβ [μm] | nβ [mm−2] | λE [μm] | LSi [µm] | nSi [mm−2] | ||
| α-Al-first (610 °C) | Decreased specific surface of α-Al dendrites and increased number density of β-phases | −6% | −41% | −14% | 130% | 20% | - | - |
| α-Al-2-first (630 °C) | −9% | −32% | 2% | 33% | 98% | - | - | |
| β-first (610 °C) | Increased length and decreased number density of β-phases | 60% | −42% | 92% | −71% | −6% | - | - |
| β-2-first (630 °C) | 170% | −57% | 76% | −70% | 27% | - | - | |
| Si-first (610 °C) | Decreased number density of Si crystals and placement in the outside of specimen | 240% | −30% | −27% | 122% | −12% | 17% | −89% |
| Si-2 first (630 °C) | 42% | −10% | −2% | 46% | −1% | 20% | −74% | |
| α-Al/β (610 °C) | Only slightly changed α-Al dendrites and β-phases | 11% | −3% | 17% | −26% | 105% | - | - |
| α-Al/Si (610 °C) | Increased number density of β-phases | 35% | −15% | −10% | 110% | 35% | - | - |
| β/Si (610 °C) | Separation of δ-phases Increased size of Si crystals by decreased number density | 255% | −53% | −22% | −45% | 4% | 51% | −19% |
| eutectic point (576 °C) | Decreased length and increased number density of β-phases | −25% | 24% | −31% | 107% | 2% | - | - |
Disclaimer/Publisher’s Note: The statements, opinions and data contained in all publications are solely those of the individual author(s) and contributor(s) and not of MDPI and/or the editor(s). MDPI and/or the editor(s) disclaim responsibility for any injury to people or property resulting from any ideas, methods, instructions or products referred to in the content. |
© 2023 by the author. Licensee MDPI, Basel, Switzerland. This article is an open access article distributed under the terms and conditions of the Creative Commons Attribution (CC BY) license (https://creativecommons.org/licenses/by/4.0/).
Share and Cite
Mikolajczak, P. Distribution and Morphology of α-Al, Si and Fe-Rich Phases in Al–Si–Fe Alloys under an Electromagnetic Field. Materials 2023, 16, 3304. https://doi.org/10.3390/ma16093304
Mikolajczak P. Distribution and Morphology of α-Al, Si and Fe-Rich Phases in Al–Si–Fe Alloys under an Electromagnetic Field. Materials. 2023; 16(9):3304. https://doi.org/10.3390/ma16093304
Chicago/Turabian StyleMikolajczak, Piotr. 2023. "Distribution and Morphology of α-Al, Si and Fe-Rich Phases in Al–Si–Fe Alloys under an Electromagnetic Field" Materials 16, no. 9: 3304. https://doi.org/10.3390/ma16093304
APA StyleMikolajczak, P. (2023). Distribution and Morphology of α-Al, Si and Fe-Rich Phases in Al–Si–Fe Alloys under an Electromagnetic Field. Materials, 16(9), 3304. https://doi.org/10.3390/ma16093304