Abstract
In this work, iron niobate (FeNbO4) was prepared via two processes based on the sol-gel method: colloidal gel and polymeric gel. The obtained powders were submitted to heat treatments at different temperatures based on the results obtained via differential thermal analysis. The structures of the prepared samples were characterized via X-ray diffraction and the morphology was characterized via scanning electron microscopy. The dielectric measurements were performed in the radiofrequency region using the impedance spectroscopy technique and in the microwave range using the resonant cavity method. The influence of the preparation method was noticeable in the structural, morphological and dielectric properties of the studied samples. The polymeric gel method promoted the formation of monoclinic and orthorhombic iron niobate at lower temperatures. The differences in the samples’ morphology were also remarkable, both in the size and shape of the grains. The dielectric characterization revealed that the dielectric constant and the dielectric losses had the same order of magnitude and similar trends. A relaxation mechanism was identified in all the samples.
1. Introduction
In recent decades, the interest in the research of ceramic materials based on lead-free metal oxides has grown due to their excellent catalytic, chemical, magnetic and electrical properties. Among the most studied oxides are the perovskites ABO3 (where A = Li, Na, La, etc., and B = Nb, Fe, etc.) and the mixed metallic oxides ABO4 (where A, B = Bi, V, Zn, Ce, Co, Fe, Nb, etc.), which are prepared using different physical and chemical methods, due to their potential applicability in numerous fields, namely, in gas sensor, catalytic and photodetector technologies [1,2,3,4,5,6,7,8].
From these, one of the well-known mixed metallic oxides is the iron niobate, FeNbO4, which possesses both magnetic and electric properties and shows potential in a wide variety of applications. Among these applications, solar energy conversion, gas sensors, catalysts, photoanode material and a precursor in the preparation of single-phase Pb(Fe0.5Nb0.5)O3 are highlighted in the literature [2,3,9].
Iron niobates exhibit three different crystalline phases depending on the annealing temperature: a monoclinic phase (wolframite type, space group P2/c), which forms at a temperature below 1080 °C; an orthorhombic phase of α-PbO2-type (space group Pbcn), which can be obtained at 1080 °C ≤ T ≤ 1380 °C; and the tetragonal rutile phase (space group P42/mnm), which is formed above T = 1380 °C and below the melting point (T ≈ 1450 °C), as shown in Figure 1 [2,8,9,10]. A further monoclinic structure, which crystallizes in the GaNbO4 type (space group C2) was reported by Brunner and Gruehn [11] and was obtained via the gas transport preparation method in the temperature range of 600–900 °C [8].
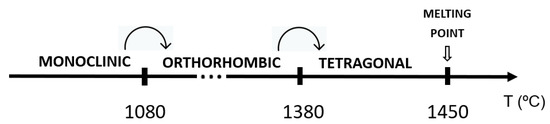
Figure 1.
Temperature evolution of the FeNbO4 polymorphs (adapted from [2]).
Figure 2 shows the three main polymorphs of the FeNbO4 compound. The monoclinic structure is based on the zig-zag arrangement along the c-axis of FeO6 and NbO6 octahedra. These chains of octahedrons are connected by sharing the corner oxygen atoms along the a- and b-axes. The orthorhombic structure is similar; however, the iron and niobium atoms appear randomly distributed. The tetragonal structure is identical to the orthorhombic structure, yet the arrangement of octahedrons occurs linearly [8,9].
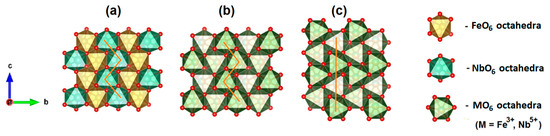
Figure 2.
Schematic illustrations of crystal structures of FeNbO4 (drawn using VESTA software, version 3): (a) monoclinic; (b) orthorhombic; (c) tetragonal.
Over recent decades, several studies were presented to improve the synthesis of FeNbO4, either through the optimization of the starting materials or through the optimization of the processing method. The ultimate goal of ceramic processing is to achieve the desired phase while keeping the sequence of steps as simple as possible. As is recognized, both the starting materials and the processing history critically affect the properties of the final product, and thus, it is crucial to evaluate the different processing techniques [6,12]. Considering that purity and reactivity are key factors, it is also necessary to contemplate the characteristics of the crystal phases formed and the relationships between the method of preparation and the properties of the obtained product [12].
In 1996, Tena et al. prepared FeNbO4 using three different methods: the solid-state reaction method and two processes based on the sol-gel method. In the solid-state reaction method, Nb2O5 and Fe2O3 were used as precursors, which were mixed in stoichiometric amounts and homogenized in acetone in a planetary ball mill for 20 min. In the case of the processes based on the sol-gel method, two types of gel were produced: colloidal and polymeric. For the preparation of the colloidal gel, NbCl5 and FeCl3·6H2O were used, while in the polymeric gel route, NbCl5 and FeCl3·6H2O were the precursors. To obtain the colloidal gel samples, NbCl5 was dispersed in water via vigorous stirring. Then, FeCl3·6H2O was added and the mixture was stirred vigorously at 70 °C. Thereafter, an NH4OH solution was added until gelation occurred (pH = 5–6). Finally, the gel obtained was dried with an infrared lamp. In the polymeric gel method, a solution of NbCl5 dissolved in ethanol was subjected to continuous stirring at 70 °C for 15 h. FeCl3·6H2O was added, keeping the mixture at 70 °C for 24 h, and finally acidified with HNO3. The samples were thermally treated at temperatures between 300 and 1000 °C for 12 h. According to the authors, the presence of FeNbO4 with an orthorhombic structure as the only crystal phase formed was detected in samples treated at 1000 °C. However, there is no information about which of the methods produced this single-phase sample. Besides this, the authors did not present the results of the structural characterization performed [13].
In 1999, Ananta et al. synthesized FeNbO4 via the solid-state reaction method, using Fe2O3 and Nb2O5 as precursors. The samples obtained were calcined at temperatures between 1075 and 1150 °C over periods between 2 and 5 h. This study showed that the Fe2O3 phase coexisted with the monoclinic FeNbO4 phase for treatment temperatures below 1100 °C. By increasing the calcination temperature to 1150 °C, the monoclinic FeNbO4 completely converted to an orthorhombic structure [6].
In 2002, Theissmann et al. presented the synthesis of FeNbO4 via the sol-gel method using NbCl5 and FeCl3·6H2O as precursors. In the sample treated at 1050 °C for 12 h, pure monoclinic FeNbO4 was identified. The authors pointed out that, contrary to what was verified in the previous works cited by them, the secondary phase FeNb2O6 was not identified [14].
In 2008, Cho et al. prepared FeNbO4 via the solid-state reaction method and a hydrothermal method. In the case of the solid-state reaction method, Fe2O3 and Nb2O5 were used as precursors, with the sample being treated at 1000 °C. For the hydrothermal method, the precursors Fe(NO3)2·6H2O and NbCl5 were dissolved separately in water and ethanol, respectively, under constant magnetic stirring. To the obtained niobium ethoxide solution was added an aqueous iron nitrate solution. The pH of the solution was adjusted using NH4OH. The mixture was placed in an autoclave, heated to 180 °C and maintained for 12 h with stirring, followed by natural cooling to room temperature. The reddish-brown precipitate obtained was collected by centrifugation and washed with distilled water and ethanol. After drying at 90 °C in an oven, the powder was heat treated at 600, 800 and 1000 °C. In the sample prepared via the solid-state method, monoclinic FeNbO4 was identified after a heat treatment at 1000 °C, while via the hydrothermal method and a heat treatment of 600 °C, the authors claimed to have obtained pure orthorhombic FeNbO4 [15].
In 2014, Babu et al. prepared FeNbO4 via the hydrothermal method using Fe(NO3)3·9H2O and NbCl5 as precursors. The authors followed the procedure proposed by Cho et al., which is described above. Thermal treatments were carried out at 600 and 800 °C and the authors claimed to have obtained pure orthorhombic FeNbO4 in both samples; however, at 600 °C, there was still amorphous material present [16].
Again in 2014, Li et al. prepared FeNbO4 via the solid-state reaction method using Fe2O3 and Nb2O5 as precursors. The samples were subjected to two heat treatments at 1000 °C for 24 h and only monoclinic FeNbO4 was identified [17].
Devesa et al. synthesized FeNbO4 in 2016 via the sol-gel method using NbCl5 and Fe(NO3)3·9H2O as precursors. The samples were thermally treated at temperatures between 500 and 1200 °C for 4 h. In the samples treated between 500 and 1000 °C, monoclinic FeNbO4 was identified, as well as an additional phase of Fe2O3 with content equal to or less than 5%. For the heat treatment of 1200 °C, a single-phase sample of monoclinic FeNbO4 was obtained [18].
In 2019, Ahmed et al. prepared FeNbO4 by applying several methods, such as the co-precipitation method, the surfactant-assisted co-precipitation method, the hydrothermal method and the sol-gel method. The co-precipitation method employed Fe(NO3)3·9H2O and C4H4NNbO9·xH2O as precursors. Using NH4OH, the pH of the solutions was adjusted to 2, 7 and 10. In the surfactant-assisted co-precipitation method, ethylene glycol, polyethylene-400 and sodium dodecyl sulfate were added to the precursors utilized in the previously described process. In the hydrothermal method, the solutions formed by the precursors with the pH adjusted to the same values were subjected to heating in an autoclave for 24 h. Finally, in the sol-gel method, the precursors C6H5FeO7 and C4H4NNbO9·xH2O were used. In addition to the solution initially obtained with a pH equal to 2, solutions with pHs of 7 and 10 were prepared using NH4OH for this adjustment. Regardless of the preparation method, the obtained powders were thermally treated at 1100 °C for 6 h. In the samples prepared via co-precipitation, in addition to monoclinic FeNbO4, the phases Fe2O3 and NbO2 were identified. The samples prepared via the surfactant-assisted co-precipitation method had two phases: monoclinic FeNbO4 and NbO2. In the samples prepared via the hydrothermal method and the sol-gel method, the monoclinic FeNbO4 and the secondary phase Fe2O3 were identified [2].
In 2019, Lakshminarasimhan et al. synthesized FeNbO4 via the solid-state reaction method using Fe2O3 and Nb2O5 as precursors. The powder produced was calcined at 750 °C for 12 h and then at 1200 °C for 24 h. In the sample removed from the oven and placed in contact with air, pure-phase orthorhombic FeNbO4 was identified. In the case of the sample whose cooling took place inside the oven, according to its inertia, the pure phase of monoclinic FeNbO4 was identified [19].
In 2020, Liu et al. prepared FeNbO4 via the solid-state method using Fe2O3 and Nb2O5 as precursors. The pure monoclinic phase was formed after thermal treatment at 1050 °C for 5 h, with cooling occurring at a rate of 5 °C/min. Reheating the sample at 1200 °C for 0.5 h, followed by cooling in air, promoted the formation of orthorhombic FeNbO4 [20].
In 2021, Bezerra et al. carried out the synthesis of FeNbO4 via the solid-state reaction method with Fe2O3 and Nb2O3 as precursors. The obtained powders were thermally treated at 1200 °C for 4 h, obtaining monoclinic FeNbO4 [21].
Despite the several studies devoted to the production and characterization of iron niobate, it is still challenging to synthesize a single-phase m-FeNbO4 and/or o-FeNbO4 ceramic, with the authors reporting different secondary phases. Besides the precursors and amorphous material, FeNb2O6 and/or Fe4Nb2O9 can be regularly formed [6,14]. Ananta et al. [6] also declared that over a wide range of calcination conditions, the single-phase m-FeNbO4 cannot be produced easily. This statement can be corroborated by the analysis of the mentioned works. Besides this, contradictory information can be found, namely, considering that there are works that announced the formation of single-phase o-FeNbO4 at low treatment temperatures of 600 and 800 °C [15,16] when the transition from m-FeNbO4 to o-FeNbO4 is expected at temperatures close to 1080 °C [2,8,9,10].
For the reasons mentioned above and the importance of the synthesis process and starting materials in the final product, FeNbO4 synthesis requires more investigation.
In this work, FeNbO4 samples were prepared using two processes based on the sol-gel method, namely, the colloidal gel method and the polymeric gel method, and were heat-treated at temperatures between 400 °C and 1200 °C. The structural and morphological studies were accomplished via X-ray diffraction and scanning electron microscopy, respectively.
The dielectric characterization of the obtained samples was performed in the radiofrequency range from 100 Hz to 1 MHz and in the microwave range at 2.7 GHz using the impedance spectroscopy technique and the resonant cavity method, respectively.
2. Materials and Methods
2.1. Synthesis
In this work, the obtained powders were prepared via two different procedures, both based on the sol-gel method: the colloidal gel method and the polymeric gel method.
For the colloidal gel method, stoichiometric amounts of the precursors NbCl5 (Merck (Kenilworth, NJ, USA), >98%) and FeCl3 (Riedel-de Haën (Charlotte, NC, USA), >98%) were used. The FeCl3 was added to the NbCl5, which was previously dispersed in deionized water. The mixture was vigorously stirred at 60 °C until a gel was formed. To adjust the pH to 2.4, NH4OH (Alfa Aesar (Haverhill, MA, USA)) was added. The mixture was calcined at 300 °C for 6 h. To establish the heat-treatment temperatures, the obtained powders were subject to thermal measurements, which were carried out with Hitachi STA7300 equipment (Hitachi, Woodland, CA, USA) in a nitrogen atmosphere in a temperature range from room temperature to 1100 °C with a heating rate of 5 °C/min.
For the polymeric gel method, stoichiometric amounts of the precursors NbCl5 (Merck, >98%) and Fe(C5H7O2)3 (Aldrich (St. Louis, MO, USA), >97%) were used. The NbCl5 was previously dissolved in ethanol and stirred at 70 °C for 1 h. The Fe(C5H7O2)3 was added and the stirring was continued at 70 °C for 3 h, and the obtained mixture was calcined at 300 °C for 6 h. The obtained powder was subject to the same thermal measurements.
Figure 3a,b show the flow chart for the preparation of the samples via the colloidal gel and the polymeric gel methods, respectively. These diagrams include the heat-treatment temperatures, which were performed in a conventional electric furnace using a dwell time of 4 h and a heating rate of 5 °C/min. Before the heat-treatment process, the obtained powders were pressed into pellets and cylinders (5–7 mm in diameter) due to the requirements of the electrical measurement techniques.
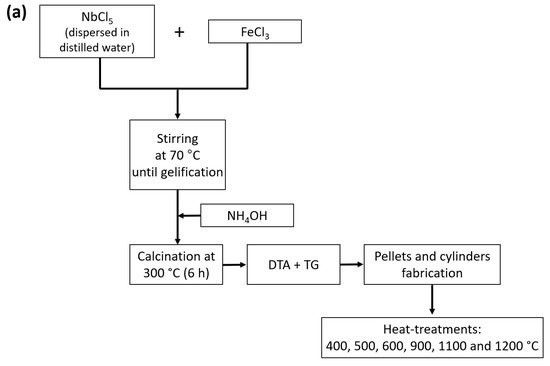
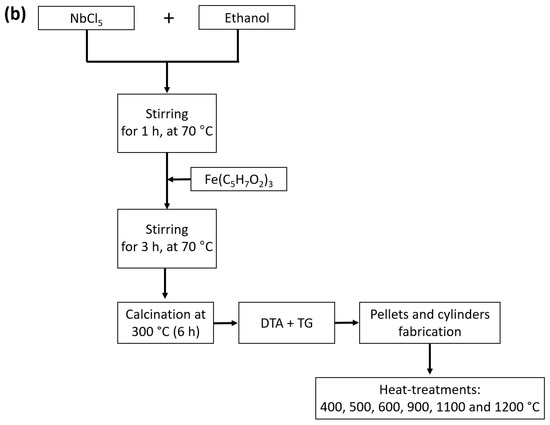
Figure 3.
Flow chart for the (a) colloidal gel and (b) polymeric gel methods.
Figure 4a shows the results from the differential thermal analysis (DTA) for both methods, allowing for the evaluation of the temperatures at which crystalline phases can be formed. Only exothermic phenomena were identified, and these phenomena were more pronounced in the powder prepared via the colloidal gel method. Besides this, the thermogram representing the colloidal gel method suggested that for temperatures above 1100 °C, an exothermic phenomenon should probably exist. Based on these results, the selected temperatures for the heat treatments in the powders obtained from both methods were governed by the colloidal gel method thermogram, with temperatures between 400 and 1200 °C.
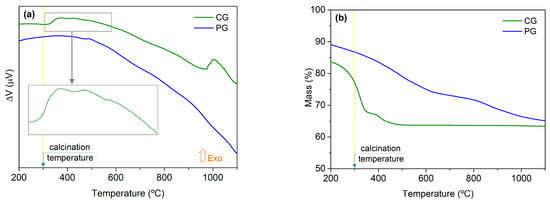
Figure 4.
Thermograms of the obtained powders: (a) DTA; (b) TGA.
Figure 4b shows depicted the results from the thermogravimetric analysis (TGA), where one can see that in the powders prepared via the colloidal gel method, the weight loss stabilized at 500 °C. In the powders prepared via the polymeric gel method, the weight loss was smoother but extended to at least 1100 °C.
The thermal measurements were carried out with Hitachi STA7300 equipment in a nitrogen atmosphere in a temperature range from room temperature up to 1100 °C with a heating rate of 5 °C/min.
Hereafter, the preparation methods, namely, colloidal gel and polymeric gel, are designated as CG and PG, respectively, and the samples are designated as HT followed by the corresponding treatment temperature, e.g., HT 400 for the sample treated at 400 °C.
2.2. Characterization
The X-ray diffraction (XRD) data were collected in an Aeris-PanAnalytical diffractometer (CuKα radiation, λ = 1.54060 Å) at 15 kV and 30 mA with a curved graphite monochromator, an automatic divergence slit, a progressive receiving slit and a flat plane sample holder in a Bragg–Brentano parafocusing optics configuration. Intensity data were collected in the 2θ angle range of 10°–60° via the step counting method (step 0.02° in 1 s). To confirm the crystal structure and acquire supplementary structural information about the samples, Rietveld refinement was carried out using Profex [22].
The morphologies of the samples were analyzed via scanning electron microscopy (SEM). The images were obtained on a TESCAN-Vega III instrument. Before the microscopic observation, the samples were covered with carbon.
The density measurements were performed via the Archimedes method using a RADWAG-As220.R2 analytical balance with the specific density measurement device for solid materials. The balance had a measuring accuracy of ±0.1 mg and the fluid used was ethanol. The measurements were made at room temperature (22 °C) and 10 times for each sample. After the measurement for each sample, a dry process was undertaken in an oven with forced circulation at 100 °C for 1 h. Then, and before any new measure, each sample was kept in a desiccator with silica gel for a period longer than 2 h to ensure the same sample temperature and dryness.
The electrical measurements in the frequency range from 100 Hz to 1 MHz were performed on the pellets using the precision impedance analyzer Agilent 4294A (Santa Clara, CA, USA) in the Cp−Rp configuration at room temperature. The electrodes were made by covering the opposite sides of the samples with silver conductive paste. The real (ε′) and imaginary (ε″) parts of the complex permittivity were obtained using the following relation:
where Cp represents the capacitance, Rp the resistance, d the sample thickness, A the electrode (pellet) area, ε0 the empty space permittivity and ω the angular frequency [23].
The measurements of the complex permittivity in the microwave range were made at ≈2.8 GHz at room temperature in a resonant cavity operating in the TE105 mode and coupled to an HP 8753D Network Analyzer. When the sample was positioned in the center of the cavity, where the electric field was maximal, the variation in the resonant frequency Δf and the inverse of the quality factor Δ(1/Q) of the resonant cavity could be correlated to the permittivity values [24]. The real part of the complex permittivity was obtained through the shift in the resonant frequency of the cavity and the imaginary part using the change in the inverse of the quality factor of the cavity. Applying the small perturbation theory and considering only the first-order perturbation in the electric field caused by the sample [24,25], ε′ and ε″ could be calculated using Equation (2):
where K is a constant related to the depolarization factor that depends on geometric parameters; V and v are the volumes of the cavity and the cylindrical sample, respectively; and f0 is the resonance frequency of the cavity. Using a sample with a known dielectric constant, commonly polytetrafluorethylene (PTFE), with the same shape and dimensions as the ceramic samples, the constant K could be determined and, consequently, ε′ and ε″ could be calculated.
3. Results
3.1. Structural Characterization
The crystalline phases were identified via XRD, as shown in Figure 5a–f.
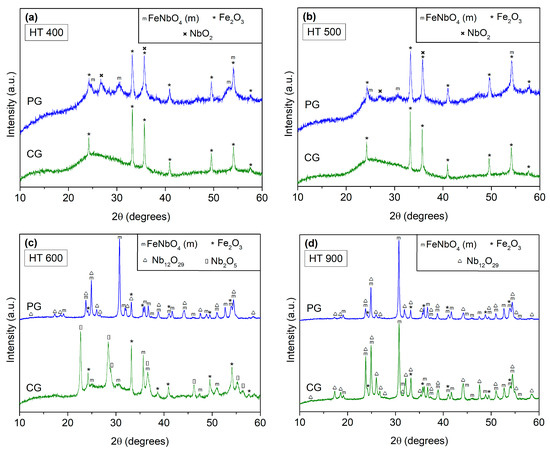
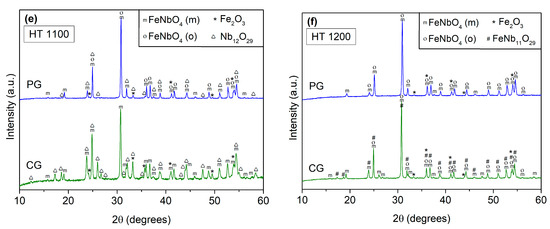
Figure 5.
X-ray diffraction patterns of the prepared samples: (a) HT 400; (b) HT 500; (c) HT 600; (d) HT 900; (e) HT 1100; (f) HT 1200.
In the heat treatments performed at 400 and 500 °C, Figure 5a and Figure 6b show that regardless of the preparation method, the presence of amorphous material was noticeable. However, in the powders prepared via the PG method, besides the secondary phases Fe2O3 and NbO2, monoclinic FeNbO4 (m-FeNbO4) was identified. With the CG method, the only crystalline phase present was the Fe2O3. In the samples treated at 600 °C with the PG method, besides the phases previously obtained, a new phase, namely, Nb12O29, was formed. In the sample prepared via the CG method, two new phases were formed: the Nb2O5 and the desired monoclinic FeNbO4.
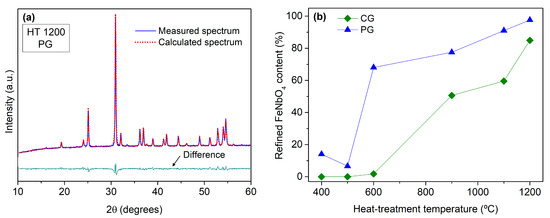
Figure 6.
(a) Measured and calculated spectrum of the sample treated at 1200 °C and prepared via the polymeric gel method; (b) variation percentage of the FeNbO4 content as a function of the heat-treatment temperature, as estimated via the Rietveld analysis.
Increasing the treatment temperature to 900 °C, both samples showed the same composition: monoclinic FeNbO4 and the secondary phases Fe2O3 and Nb12O29.
Considering the heat treatment at 1100 °C, the sample prepared via the CG method maintained the three phases previously identified. However, with the PG method, besides these phases, the diffraction pattern showed peaks consistent with orthorhombic FeNbO4 (o-FeNbO4).
Finally, with the heat treatment at 1200 °C, the polymorphs m-FeNbO4 and o-FeNbO4 were present in both samples, along with the secondary phase Fe2O3. The CG method promoted the formation of an additional phase, namely, FeNb11O29.
Comparing these preparation procedures, one can assume that with the PG route, the monoclinic and the orthorhombic FeNbO4 can be formed at lower temperatures when compared with the CG method. Even so, the result achieved with both methods, that is, the temperature of transition between monoclinic and orthorhombic structure, was aligned with the literature.
The content of each crystalline phase identified in the prepared samples was estimated via Rietveld’s refinement method using Profex [22]. Figure 6a shows the measured and calculated spectra for the HT 1200 sample prepared via the PG method. Figure 6b presents the evolution of the percentage of the FeNbO4 content with the increase in the heat-treatment temperature. Besides the earlier formation of FeNbO4 with the PG method already mentioned, this graphic also shows that regardless of the treatment temperature, the content of FeNbO4 was always higher in the samples prepared via the PG route.
Table 1 displays the percentage of each crystalline phase identified in the samples and also the Rietveld fitting parameters, which show the good quality of the fitting [26] and the consistency of the presented results.

Table 1.
Crystalline phases identification and percentages estimated via the Rietveld analysis for the prepared samples, along with the Rietveld fitting parameters.
As many of the authors mentioned in the Introduction section, single-phase m-FeNbO4 or o-FeNbO4 was not achieved. However, with the PG method and a 4 h heat treatment at 1200 °C, only FeNbO4 and the starting material Fe2O3, with a content inferior to 3%, were identified.
This structural characterization shows that contrary to what was previously reported, it is possible to obtain m-FeNbO4 using the CG and PG methods. Furthermore, contrasting with the literature, the secondary phases FeNb2O6 and Fe4Nb2O9 were not identified.
The development of materials that can be obtained with lower sintering temperatures in a reduced processing time is also advantageous. In our previous work [18], pure m-FeNbO4 was obtained via the sol-gel method but with a stirring time of 7 days. Additionally, in the referenced works where wet chemical methods were applied, elevated stirring and heat-treatment times were adopted.
3.2. Morphological Characterization
Figure 7 shows the SEM micrographs of the samples prepared via the CG method.
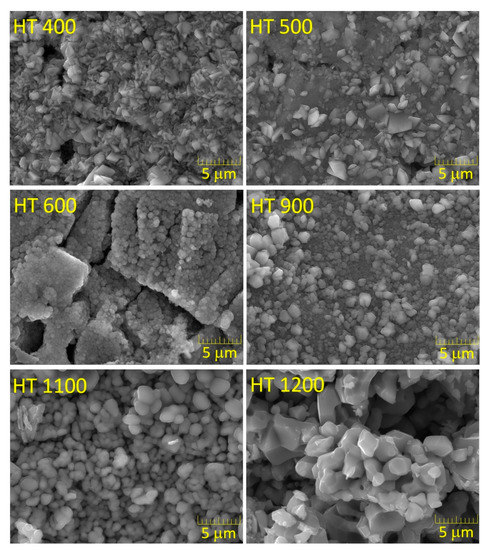
Figure 7.
SEM micrographs of the samples prepared via the colloidal gel method.
The HT 400 and HT 500 samples were composed of particles with an angular shape and significant heterogeneity in terms of size. The heat treatment at 600 °C promoted a substantial change in the morphology of the material since both the shape and size of the grains were very similar in this sample. This evolution could have been due to the conversion of the amorphous material and the formation of new crystalline phases. With the heat treatment at 900 °C, the grain growth was visible, which is a factor that contributed to the heterogeneity of the sample. With the increase in the treatment temperature, the particles became progressively bigger, with this increase being more pronounced in the HT 1200 sample, possibly due to the decrease in the Fe2O3 content.
Figure 8 shows the SEM micrographs of the samples prepared via the PG method.
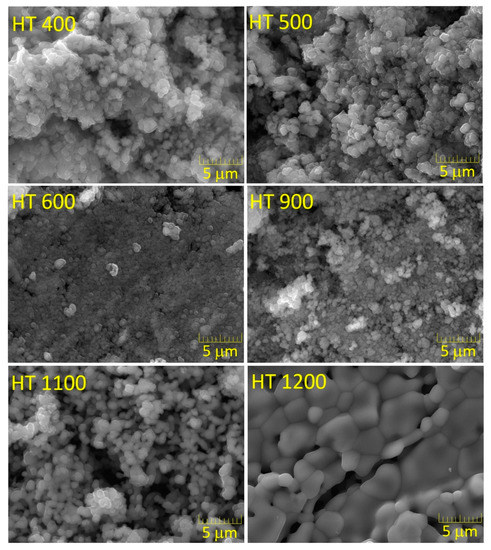
Figure 8.
SEM micrographs of the samples prepared via the polymeric gel method.
The morphologies of the HT 400, HT 500, HT 600 and HT 900 samples were similar. The slight decrease in the particle size promoted by the heat treatment at 600 °C could be due to the decomposition of the amorphous material.
As seen in the case of the CG method, the increase in the treatment temperature promoted grain growth; however, these changes were much more distinctive in the HT 1200 sample, where the grains could be greater than 5 μm, with the grain’s boundary being very well defined.
The grain size distributions for the HT 1200 samples prepared via both methods are shown in Figure 9. The data collection was performed using two SEM images to improve the statistical calculation [27]. In the sample prepared via the CG method, the average grain size was 2.23 μm, with only 2% of the analyzed grains being greater than 5 μm. For the sample obtained via the PG method, the average grain size was 2.73 μm, with 6.25% of the analyzed grains being greater than 5 μm.
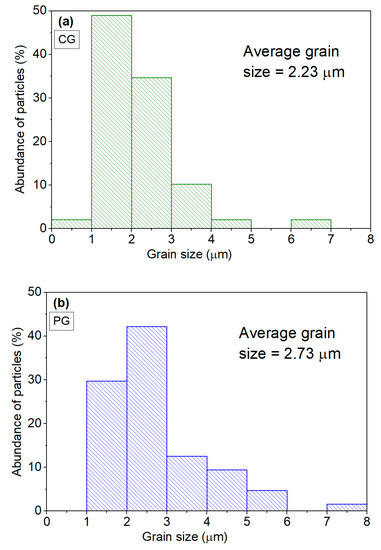
Figure 9.
Grain size distribution of the HT 1200 sample prepared via the (a) colloidal gel and (b) polymeric gel methods.
Despite the structural differences, the grain size distribution and, consequently, the average grain size were very similar in both samples.
3.3. Density Measurements
Table 2 shows the experimental densities of the HT 400 to HT 1100 samples. In general, the heat treatment promoted the densification of the samples. Moreover, independent of the treatment temperature, the density of the samples prepared via the PG method was always higher. This fact can be explained by the higher content of m-FeNbO4, which presents a higher theoretical density than the secondary phases.
Table 2.
Measured densities of the samples prepared via the colloidal gel and polymeric gel methods.
Considering the samples with higher amounts of m-FeNbO4, namely, HT 1100 for the CG method and HT 900 for the PG method, the calculations showed that the experimental density was 81.3% of the theoretical density in both cases, with the samples presenting a theoretical density of 5.14 and 5.24 g/cm3, respectively.
The theoretical density was obtained using the following equation [28]
where ω1, ω2 and ω3 are the mass fractions presented in Table 1, and ρ1, ρ2 and ρ3 are the theoretical densities of Fe2O3 (5.27 g/cm3), m-FeNbO4 (5.38 g/cm3) and Nb12O29 (4.57 g/cm3), according to the Pearson’s Crystal Data database [29] and the references [8,30,31], respectively.
The good densification of the samples was associated with a low porosity, which is a physical characteristic that can be related to lower dielectric losses [32].
3.4. Dielectric Characterization
The dielectric constants ε′ and the dielectric losses ε″ of the samples prepared by the colloidal gel method, as measured at room temperature and in the frequency range of 100 Hz to 1 MHz, are shown in Figure 10.
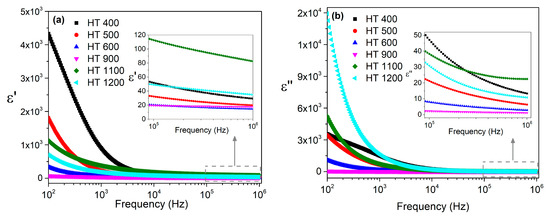
Figure 10.
Frequency dependence of the (a) dielectric constants and (b) dielectric losses at room temperature for the samples prepared via the colloidal gel method.
In the low-frequency region, the dielectric constant decreased sharply with the frequency, with the HT 400 sample showing higher values. In the high-frequency region, the ε′ values decreased smoothly, with the HT 1100 sample standing out.
The dielectric losses presented a similar trend; however, in the low-frequency region, the sample with the higher grain size, i.e., HT 1200, presented higher ε″ values.
The dielectric constants ε′ and the dielectric losses ε″ of the samples prepared by the polymeric gel method, as measured at room temperature and in the frequency range of 100 Hz to 1 MHz, are presented in Figure 11. The abrupt decrease in the low-frequency region, followed by a smooth decrease for higher values of frequency, of ε′ and ε″ was similar to the behavior of the samples prepared via the colloidal method. The dielectric constants and losses obtained for the samples prepared via the two methods were of the same order of magnitude.
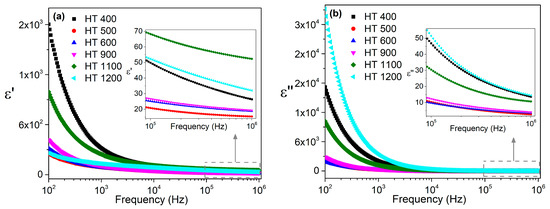
Figure 11.
Frequency dependence of the (a) dielectric constants and (b) dielectric losses at room temperature for the samples prepared via the polymeric gel method.
Comparing the present results with pure m-FeNbO4 prepared via the sol-gel method [18], one can see lower values for the dielectric constant; however, the losses were also several orders of magnitude lower. These differences can be attributed to the existence of secondary phases, but also due to the less successful densification of the samples.
In addition, the dissipation factor or loss tangent tanΔ is often used to characterize the dielectric loss of a material and is given by [33]
The real part of any dielectric function varies monotonically with frequency, whereas its imaginary part may display a maximum as a function of frequency. However, the loss tangent behaves like an imaginary part. Whenever a maximum occurs, the peak location can be represented by the relaxation time, which is defined as the inverse angular frequency at the maximum of the imaginary part [33].
After analyzing the loss tangent for the studied samples, with the results depicted in Figure 12, it was possible to conclude that the HT 400, HT 500 and HT 600 samples prepared via the CG method had a relaxation phenomenon at room temperature in the frequency range used. The increase in the treatment temperature was followed by a decrease in the frequency of the peak, which means that the increase in the treatment temperature culminated in an increase in the relaxation time.
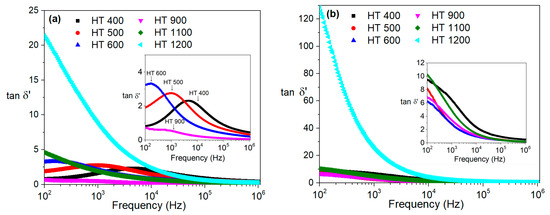
Figure 12.
Loss tangent at room temperature for the samples prepared via the (a) colloidal gel and (b) polymeric gel methods.
Since these relaxation phenomena were not perceptible with the complex permittivity formalism, other approaches were used.
Several dielectric functions can be used to describe the frequency-dependent properties of a material. Among them, the most commonly applied are the complex dielectric constant (ε*), complex electric modulus (M*), complex impedance (Z*) and complex admittance (Y*) [34].
The real and imaginary parts of the electric modulus are related to the permittivity via the following equations [35]:
where M′ and M″ are the real and imaginary parts of the complex modulus.
One of the benefits of employing the modulus formalism to study the dielectric relaxation phenomena is the fact that the large variations in permittivity and conductivity that occur at low frequencies are minimized. Consequently, the recurrent constraints of the electrode nature and contact, space charge injection phenomena and absorbed impurity conduction effects, which could obscure the relaxation mechanism in the permittivity representation, can be overcome. Moreover, the contribution of electrode polarization effects on the modulus data can be reduced, ensuring good ohmic contact between the electrodes and the sample, namely, through the use of silver paint contacts [36,37].
The real and imaginary parts of the impedance can be obtained from the following relations:
With the application of different formalisms, different relaxation times are obtained; however, all of them describe the same relaxation process, but from different points of view [33].
Figure 13 and Figure 14 show the imaginary parts of the modulus and impedance of the samples prepared by both methods at room temperature and in the frequency range of 100 Hz to 1 MHz.
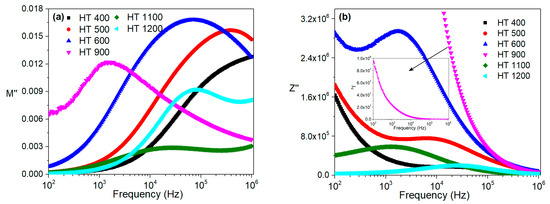
Figure 13.
Frequency dependence of the imaginary parts of the (a) modulus and (b) impedance at room temperature for the samples prepared via the colloidal gel method.
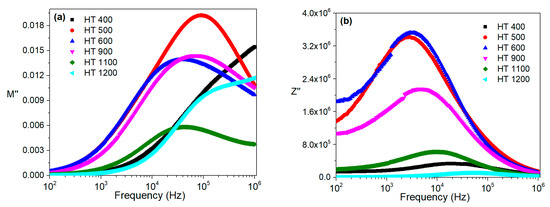
Figure 14.
Frequency dependence of the imaginary parts of the (a) modulus and (b) impedance at room temperature for the samples prepared via the polymeric gel method.
Regarding the modulus formalism, for the CG method (Figure 13a), one can infer that the HT 400 sample had a relaxation mechanism, with the peak maximum occurring at a frequency higher than 1 MHz. The remaining samples had relaxation phenomena that were clearly visible in the analyzed frequency range. With the impedance formalism (Figure 13b), the relaxation mechanism of the HT 900 sample was not visible.
For the PG method, the modulus representation, which is depicted in Figure 14a, shows that all the samples, except for HT 400, had a relaxation process between 100 Hz and 1 MHz. This observation was confirmed by the impedance formalism (Figure 14b), where all the samples had one peak.
Figure 15 shows the dielectric constant, the dielectric losses and the loss tangent obtained at room temperature at ≈2.7 GHz. The dielectric constant and dielectric losses showed the same trend, regardless of the preparation method. As was observed for the radiofrequency range measurements, in the microwave region, the order of magnitude of the calculated ε′ and ε″ were the same for both methods.
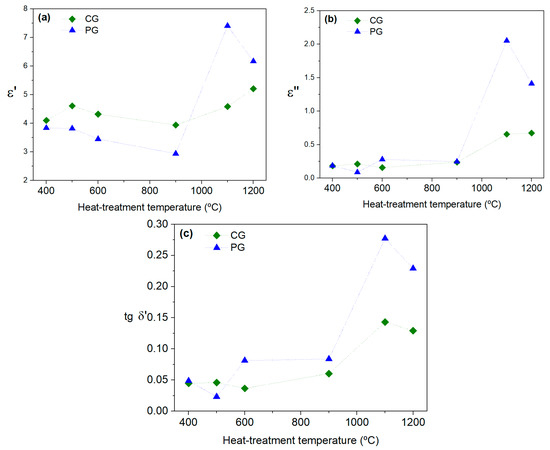
Figure 15.
(a) Dielectric constants, (b) dielectric losses and (c) loss tangents at room temperature for the samples prepared via the colloidal gel and polymeric gel methods.
The loss tangent was generally higher for the samples prepared via the PG method and increased with the increase in the treatment temperature. However, both methods generated samples with tanΔ smaller than one.
4. Conclusions
Monoclinic and orthorhombic iron niobate were successfully prepared via the CG and the PG methods, which is an achievement that contrasts with the literature since with these methods, only the formation of o-FeNbO4 was reported.
For the PG method, the m-FeNbO4 was already present in the sample that was heat-treated at 400 °C, with the conversion into o-FeNbO4 starting at 1100 °C. For the CG method, the formation of m-FeNbO4 and o-FeNbO4 occurred at 400 °C and 1200 °C, respectively.
Considering the powders that were treated at the higher temperature, the sample from the PG method had a combination of monoclinic and orthorhombic FeNbO4, as well as a secondary phase with a content smaller than 5%. The CG method produced a sample also with m-FeNbO4 and o-FeNbO4, but with two secondary phases totaling about 15% of its content. Taking into consideration the previous statements and the fact that the processing procedures had similar stages, it is possible to conclude that the PG method has higher potential.
The heat treatment promoted the densification of the samples, with both methods showing promising results.
The dielectric characterization of the HT 1100 and HT 1200 samples showed that the increase in the o-FeNbO4 content may have contributed to the decrease in the dielectric constants and the increase in the losses. The samples from both methods started by benefiting from the formation of this polymorph; however, the increase in its content had a negative effect, which was visible in the HT 1200 sample created using the PG method. In this sample, the increase in the o-FeNbO4 coincided with the decrease in the dielectric constant and the increase in the dielectric loss, with this last effect showing an attenuation with the increase in the frequency.
Considering the room temperature dielectric properties of m-FeNbO4 prepared via the sol-gel method, the samples prepared via the GG and PG methods presented losses that were also several orders of magnitude lower, which can be considered a promising result.
At room temperature, in the frequency range analyzed, all the samples showed one relaxation mechanism.
Author Contributions
Conceptualization, S.D.; methodology, S.D.; validation, S.D. and M.G.; formal analysis, S.D.; investigation, S.D., F.G. and M.G.; resources, M.G.; data curation, S.D.; writing—original draft preparation, S.D.; writing—review and editing, S.D., F.G. and M.G.; supervision, M.G.; project administration, M.G. All authors have read and agreed to the published version of the manuscript.
Funding
FEDER funds through the COMPETE 2020 Program and National Funds through FCT—Portuguese Foundation for Science and Technology under the projects LA/P/0037/2020, UIDP/50025/2020 and UIDB/50025/2020 of the Associate Laboratory Institute of Nanostructures, Nanomodelling and Nanofabrication—i3N.
Institutional Review Board Statement
Not applicable.
Informed Consent Statement
Not applicable.
Data Availability Statement
The raw/processed data required to reproduce these findings cannot be shared at this time, as the data also form part of an ongoing study.
Conflicts of Interest
The authors declare no conflict of interest.
References
- Mani, R.; Achary, S.N.; Chakraborty, K.R.; Deshpande, S.K.; Joy, J.E.; Nag, A.; Gopalakrishnan, J.; Tyagi, A.K. Dielectric properties of some MM′O4 and MTiM′O6 (M = Cr, Fe, Ga; M′ = Nb, Ta, Sb) rutile-type oxides. J. Solid State Chem. 2010, 183, 1380–1387. [Google Scholar] [CrossRef]
- Ahmed, S.H.; Bakiro, M.; Alzamly, A. Effect of pH and surfactant on band gap properties of monoclinic FeNbO4 prepared via different routes. Nano-Struct. Nano-Objects 2019, 20, 100400. [Google Scholar] [CrossRef]
- Gnanasekar, K.I.; Jayaraman, V.; Prabhu, E.; Gnanasekaran, T.; Periaswami, G. Electrical and sensor properties of FeNbO4: A new sensor material. Sens. Actuators B Chem. 1999, 55, 170–174. [Google Scholar] [CrossRef]
- Akbari, A.; Amini, M.; Tarassoli, A.; Eftekhari-Sis, B.; Ghasemian, N.; Jabbari, E. Transition metal oxide nanoparticles as efficient catalysts in oxidation reactions. Nano-Struct. Nano-Objects 2018, 14, 19–48. [Google Scholar] [CrossRef]
- Ramana, E.V.; Figueiras, F.; Graca, M.P.F.; Valente, M.A. Observation of magnetoelectric coupling and local piezoresponse in modified (Na0.5Bi0.5)TiO3-BaTiO3–CoFe2O4 lead-free composites. Dalton Trans. 2014, 43, 9934–9943. [Google Scholar] [CrossRef] [PubMed]
- Ananta, S.; Brydson, R.; Thomas, N.W. Synthesis, formation and characterisation of FeNbO4 powders. J. Eur. Ceram. Soc. 1999, 19, 489–496. [Google Scholar] [CrossRef]
- Alvarez, G.; Font, R.; Portelles, J.; Zamorano, R.; Valenzuela, R. Modulated non-resonant microwave power absorption of FeNbO4 powders. Rev. Mex. Física 2007, 53, 143–145. [Google Scholar]
- Schmidbauer, E.; Schneider, J. Electrical Resistivity, Thermopower, and 57Fe Mössbauer Study of FeNbO4. J. Solid State Chem. 1997, 134, 253–264. [Google Scholar] [CrossRef]
- Leiva, H.; Sieber, K.; Khazai, B.; Dwight, K.; Wold, A. Structural and electronic relationships between conducting iron niobates and iron tungstates. J. Solid State Chem. 1982, 44, 113–118. [Google Scholar] [CrossRef]
- Kumari, T.S.D.; Gandhi, R.V.; Rahul, G.; Kamalanathan, G.; Kumar, T.P.; Jeyakumar, D.; Lakshminarasimhan, N. Electrochemical lithium insertion behavior of FeNbO4: Structural relations and in situ conversion into FeNb2O6 during carbon coating. Mater. Chem. Phys. 2014, 145, 425–433. [Google Scholar] [CrossRef]
- Brunner, H.; Gruehn, R. Synthesis and structure of a new polymorph of FeNbO4. Z. Naturforsch. B Chem. Sci. 1976, 31, 318–320. [Google Scholar] [CrossRef]
- Ananta, S.; Brydson, R.; Thomas, N.W. Synthesis, formation and characterisation of MgNb2O6 powder in a columbite-like phase. J. Eur. Ceram. Soc. 1999, 19, 355–362. [Google Scholar] [CrossRef]
- Tena, M.A.; Garcia-Belmonte, G.; Bisquert, J.; Escribano, P.; Colomer, M.T.; Jurado, J.R. Impedance spectroscopy studies of orthorhombic FeNbO4. J. Mater. Sci. 1996, 31, 2043–2046. [Google Scholar] [CrossRef]
- Theissmann, R.; Ehrenberg, H.; Weitzel, H.; Fuess, H. Nanostructured cation distribution in FeNbO4: A synchrotron powder diffraction and transmission electron microscopy investigation. J. Mater. Sci. 2002, 37, 4431–4436. [Google Scholar] [CrossRef]
- Cho, I.S.; Lee, S.; Noh, J.H.; Choi, G.K.; Jung, H.S.; Kim, D.W.; Hong, K.S. Visible-Light-Induced Photocatalytic Activity in FeNbO4 Nanoparticles. J. Phys. Chem. C 2008, 112, 18393–18398. [Google Scholar] [CrossRef]
- Babu, R.; Kelkar, S.; Kashid, V.; Achary, S.N.; Salunke, H.G.; Gupta, N.M. Photophysical, bandstructural, and textural properties of o-FeNbO4 in relation to its cocatalyst-assisted photoactivity for water oxidation. RSC Adv. 2014, 4, 33435–33445. [Google Scholar] [CrossRef]
- Li, Q.J.; Xia, S.Q.; Wang, X.Y.; Xia, W.; Yu, Y.; Cui, Y.M.; Zhang, J.; Zheng, C.; Cheng, C.; Li, Y.W.; et al. The colossal dielectric properties of FeNbO4. J. Alloy. Compd. 2014, 616, 577–580. [Google Scholar] [CrossRef]
- Devesa, S.; Graça, M.P.; Henry, F.; Costa, L.C. Dielectric properties of FeNbO4 ceramics prepared by the sol-gel method. Solid State Sci. 2016, 61, 44–50. [Google Scholar] [CrossRef]
- Lakshminarasimhan, N.; Kumar, A.K.N.; Chandrasekaran, S.S.; Murugan, P. Structure-magnetic property relations in FeNbO4 polymorphs: A spin glass perspective. Prog. Solid State Chem. 2019, 54, 20–30. [Google Scholar] [CrossRef]
- Liu, X.; Xie, D.; Irvine, J.T.S.; Ni, J.; Ni, C. An FeNbO4-based oxide anode for a solid oxide fuel cell (SOFC). Electrochim. Acta 2020, 335, 135692. [Google Scholar] [CrossRef]
- Bezerra Júnior, M.H.; Abreu, T.O.; do Carmo, F.F.; de Morais, J.E.V.; Oliveira, R.G.M.; Silva, M.A.S.; de Andrade, H.D.; Quiroz Júnior, I.S.; Mota, J.C.M.; Sombra, A.S.B. Impedance spectroscopy analysis of an FeNbO4 matrix with different additions of TiO2 and the effects of temperature variation. J. Mater. Sci. Mater. Electron. 2022, 32, 5936–5944. [Google Scholar] [CrossRef]
- Doebelin, N.; Kleeberg, R. Profex: A graphical user interface for the Rietveld refinement program BGMN. J. Appl. Crystallogr. 2015, 48, 1573–1580. [Google Scholar] [CrossRef] [PubMed]
- Devesa, S.; Graça, M.P.; Costa, L.C. Impedance spectroscopy study of Bi1.34Fe0.66Nb1.34O6.35 ceramics. J. Electron. Mater. 2021, 50, 4135–4144. [Google Scholar] [CrossRef]
- Devesa, S.; Soreto, S.; Graça, M.P.; Costa, L.C. Design, Characterization and Test Performances of a Resonant Cavity for Complex Permittivity Measurements Using the Small Perturbation Technique. In Electrical Measurements: Introduction, Concepts and Applications; Graça, M.P., Ed.; Nova Science Publishers: New York, NY, USA, 2018; pp. 69–89. [Google Scholar]
- Costa, L.C.; Aoujgal, A.; Graça, M.P.F.; Hadik, N.; Achour, M.E.; Tachafine, A.; Carru, J.C.; Oueriagli, A.; Outzourit, A. Microwave dielectric properties of the system Ba1-xSrxTiO3. Phys. B Condens. Matter 2010, 405, 3741–3744. [Google Scholar] [CrossRef]
- Toby, B.H. R factors in Rietveld analysis: How good is good enough? Powder Diffr. 2006, 21, 67–70. [Google Scholar] [CrossRef]
- Tishkevich, D.I.; Zubar, T.I.; Zhaludkevich, A.L.; Razanau, I.U.; Vershinina, T.N.; Bondaruk, A.A.; Zheleznova, E.K.; Dong, M.; Hanfi, M.Y.; Sayyed, M.I.; et al. Isostatic Hot Pressed W–Cu Composites with Nanosized Grain Boundaries: Microstructure, Structure and Radiation Shielding Efficiency against Gamma Rays. Nanomaterials 2022, 12, 1642. [Google Scholar] [CrossRef]
- Li, C.; Yin, C.; Deng, M.; Shu, L.; Khaliq, J. Tunable microwave dielectric properties in SrO-V2O5 system through compositional modulation. J. Am. Ceram. Soc. 2020, 103, 2315–2321. [Google Scholar] [CrossRef]
- Cenzual, K. Pearson's Crystal Data®: Crystal Structure Database for Inorganic Compounds; Villars, P., Ed.; ASM International: Materials Park, OH, USA, 2007. [Google Scholar]
- Sorescu, M.; Diamandescu, L.; Tarabasanu-Mihaila, D.; Teodorescu, V.S.; Howard, B.H. Hydrothermal synthesis and structural characterization of (1−x)α-Fe2O3–xSnO2 nanoparticles. J. Phys. Chem. Solids 2004, 65, 1021–1029. [Google Scholar] [CrossRef]
- Norin, R. The Crystal Structure of Nb12O29(o-rh). Acta Chem. Scand. 1963, 17, 1391. [Google Scholar] [CrossRef]
- Devesa, S.; Teixeira, S.S.; Rooney, A.P.; Graça, M.P.; Cooper, D.; Costa, L.C. Structural, morphological and dielectric properties of ErNbO4 prepared by the sol-gel method. J. Phys. Chem. Solids 2020, 146, 109619. [Google Scholar] [CrossRef]
- Cao, W.; Gerhardt, R. Calculation of various relaxation times and conductivity for a single dielectric relaxation process. Solid State Ion. 1990, 42, 213–221. [Google Scholar] [CrossRef]
- Macdonald, J.R.; Johnson, W.B. Fundamentals of impedance spectroscopy. In Impedance Spectroscopy: Theory, Experiment, and Applications; Barsoukov, E., Macdonald, J.R., Eds.; Wiley: Hoboken, NJ, USA, 2018; pp. 1–20. [Google Scholar] [CrossRef]
- Tang, Z.; Wu, K.; Huang, Y.; Li, J. High breakdown field CaCu3Ti4O12 ceramics: Roles of the secondary phase and of Sr doping. Energies 2017, 10, 1031. [Google Scholar] [CrossRef]
- Chilaka, N.; Ghosh, S. Dielectric studies of poly (ethylene glycol)-polyurethane/poly (methylmethacrylate)/montmorillonite composite. Electrochim. Acta 2014, 134, 232–241. [Google Scholar] [CrossRef]
- Tsangaris, G.M.; Psarras, G.C.; Kouloumbi, N. Electric modulus and interfacial polarization in composite polymeric systems. J. Mater. Sci. 1998, 33, 2027–2037. [Google Scholar] [CrossRef]
Disclaimer/Publisher’s Note: The statements, opinions and data contained in all publications are solely those of the individual author(s) and contributor(s) and not of MDPI and/or the editor(s). MDPI and/or the editor(s) disclaim responsibility for any injury to people or property resulting from any ideas, methods, instructions or products referred to in the content. |
© 2023 by the authors. Licensee MDPI, Basel, Switzerland. This article is an open access article distributed under the terms and conditions of the Creative Commons Attribution (CC BY) license (https://creativecommons.org/licenses/by/4.0/).