Effect of Rice Husk Ash on the Properties of Alkali-Activated Slag Pastes: Shrinkage, Hydration and Mechanical Property


Abstract
:1. Introduction
2. Materials and Methods
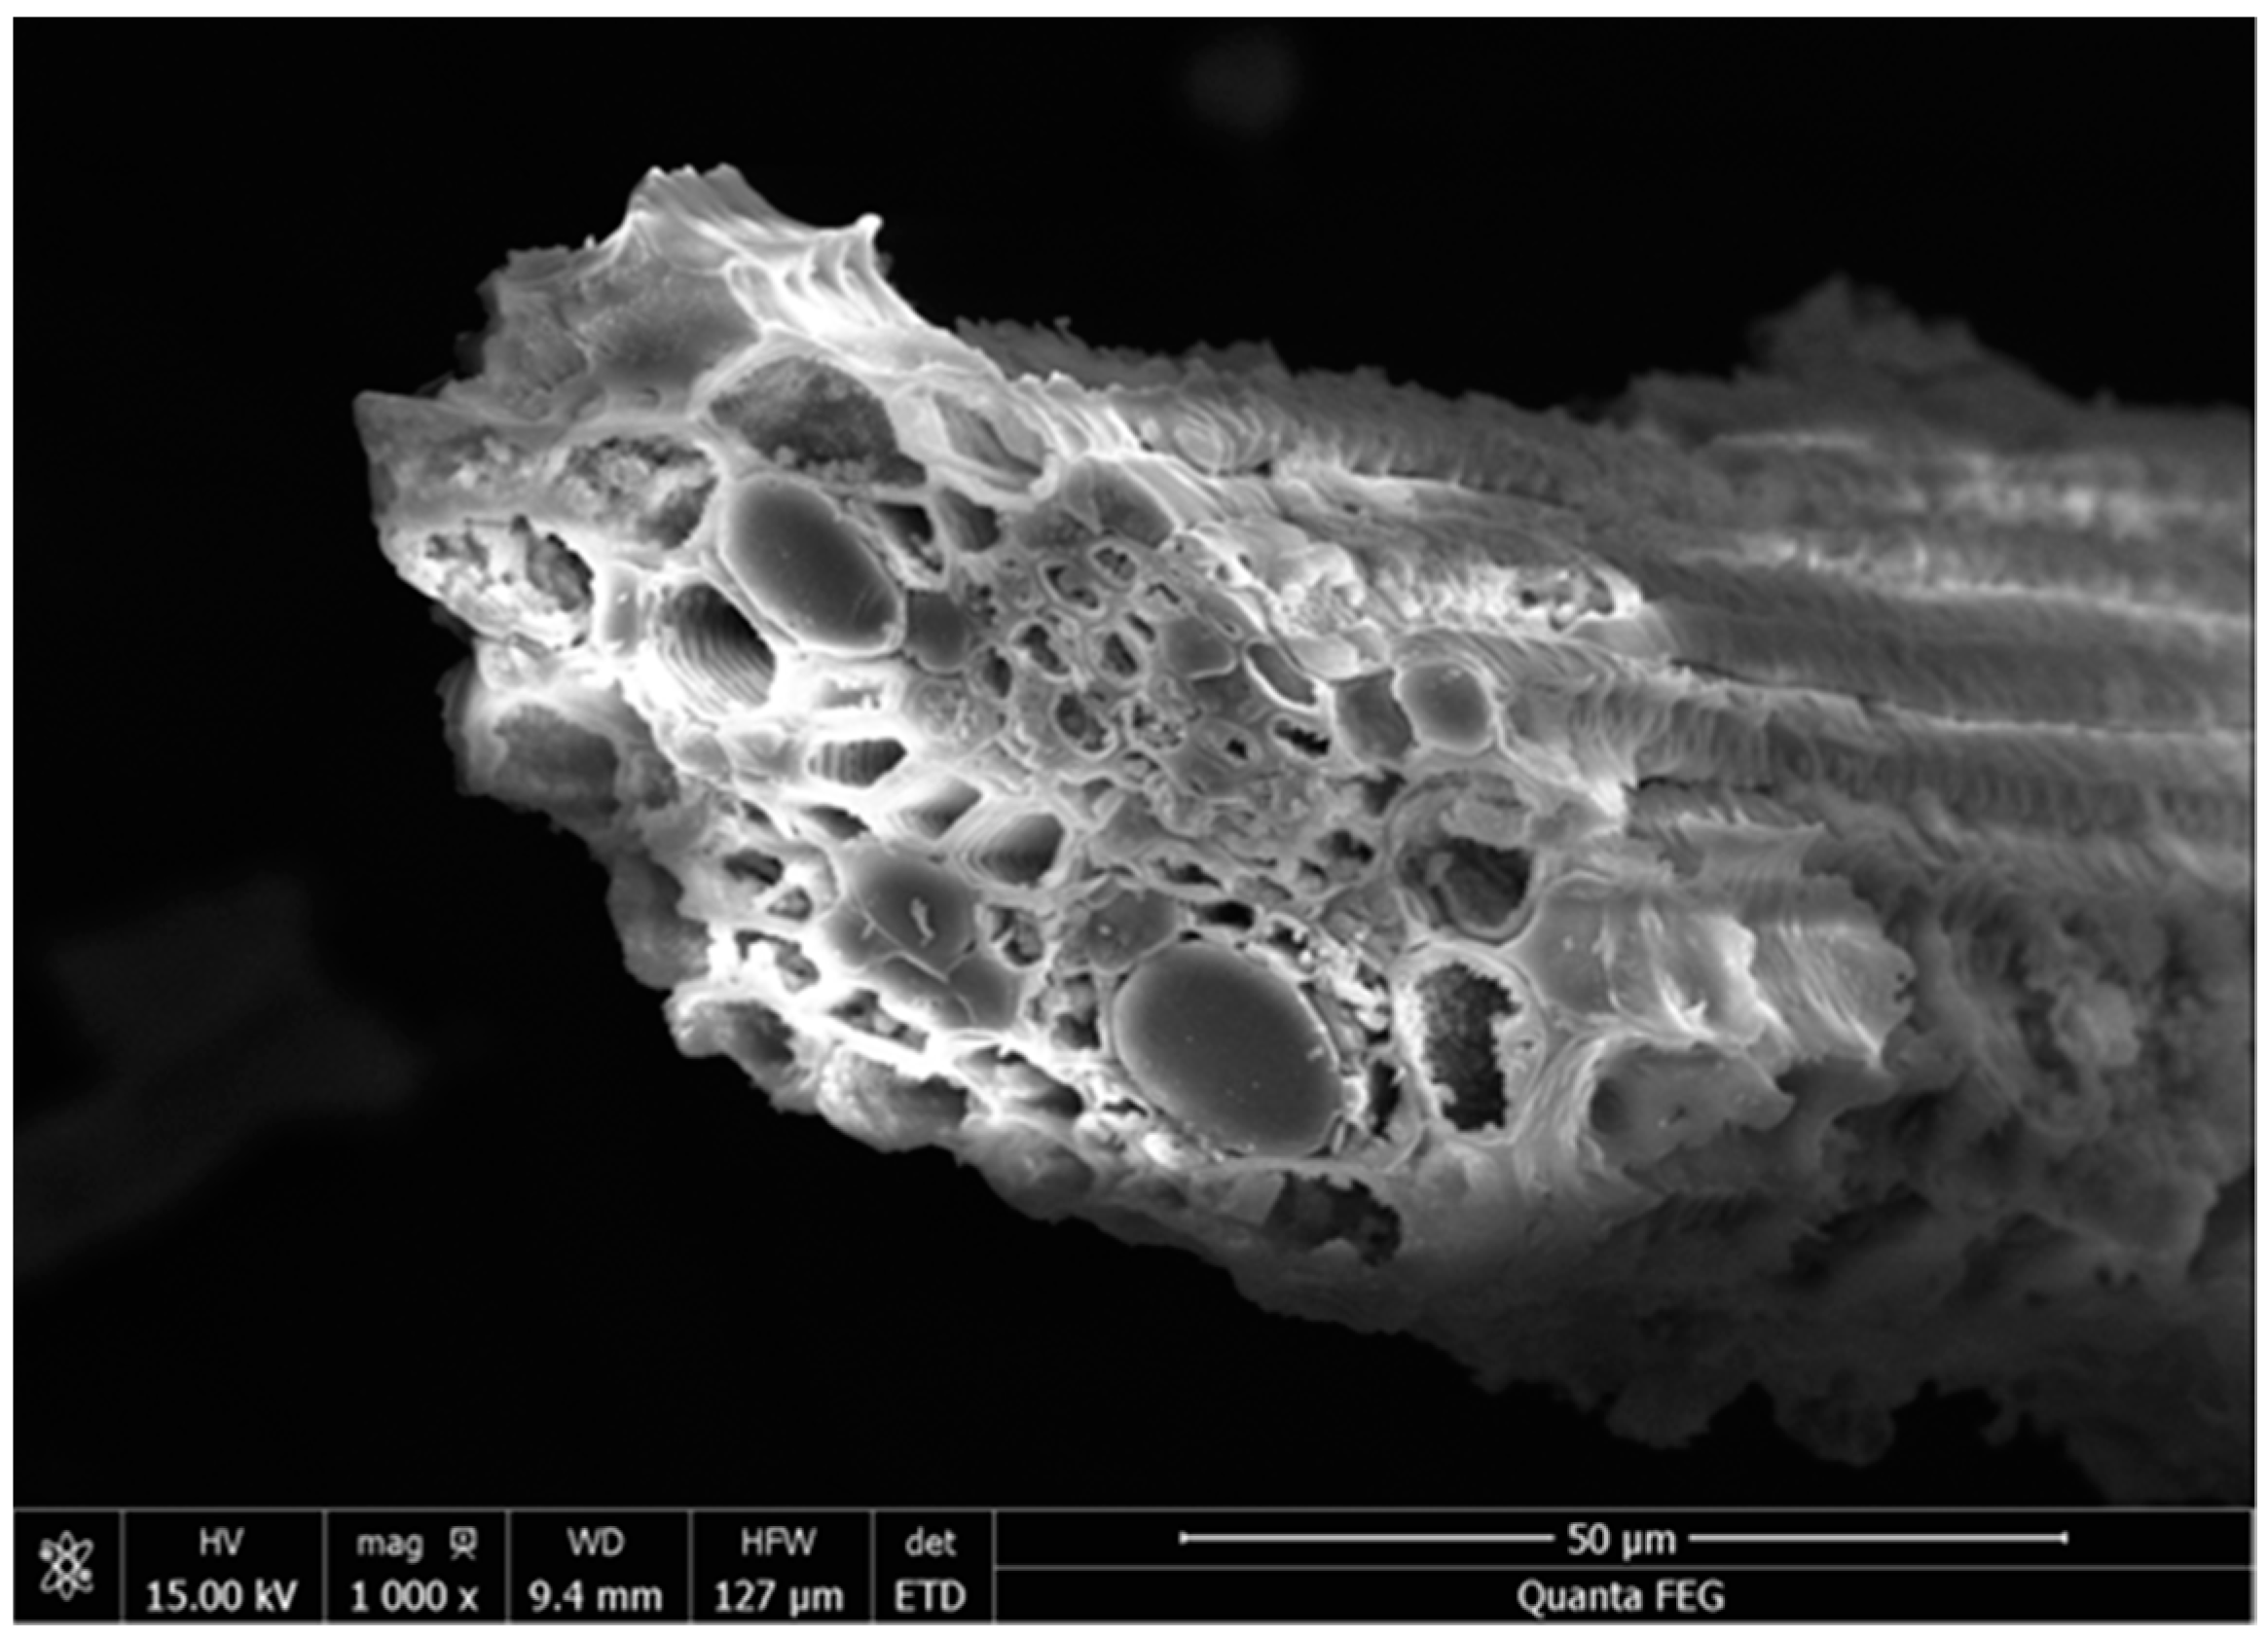
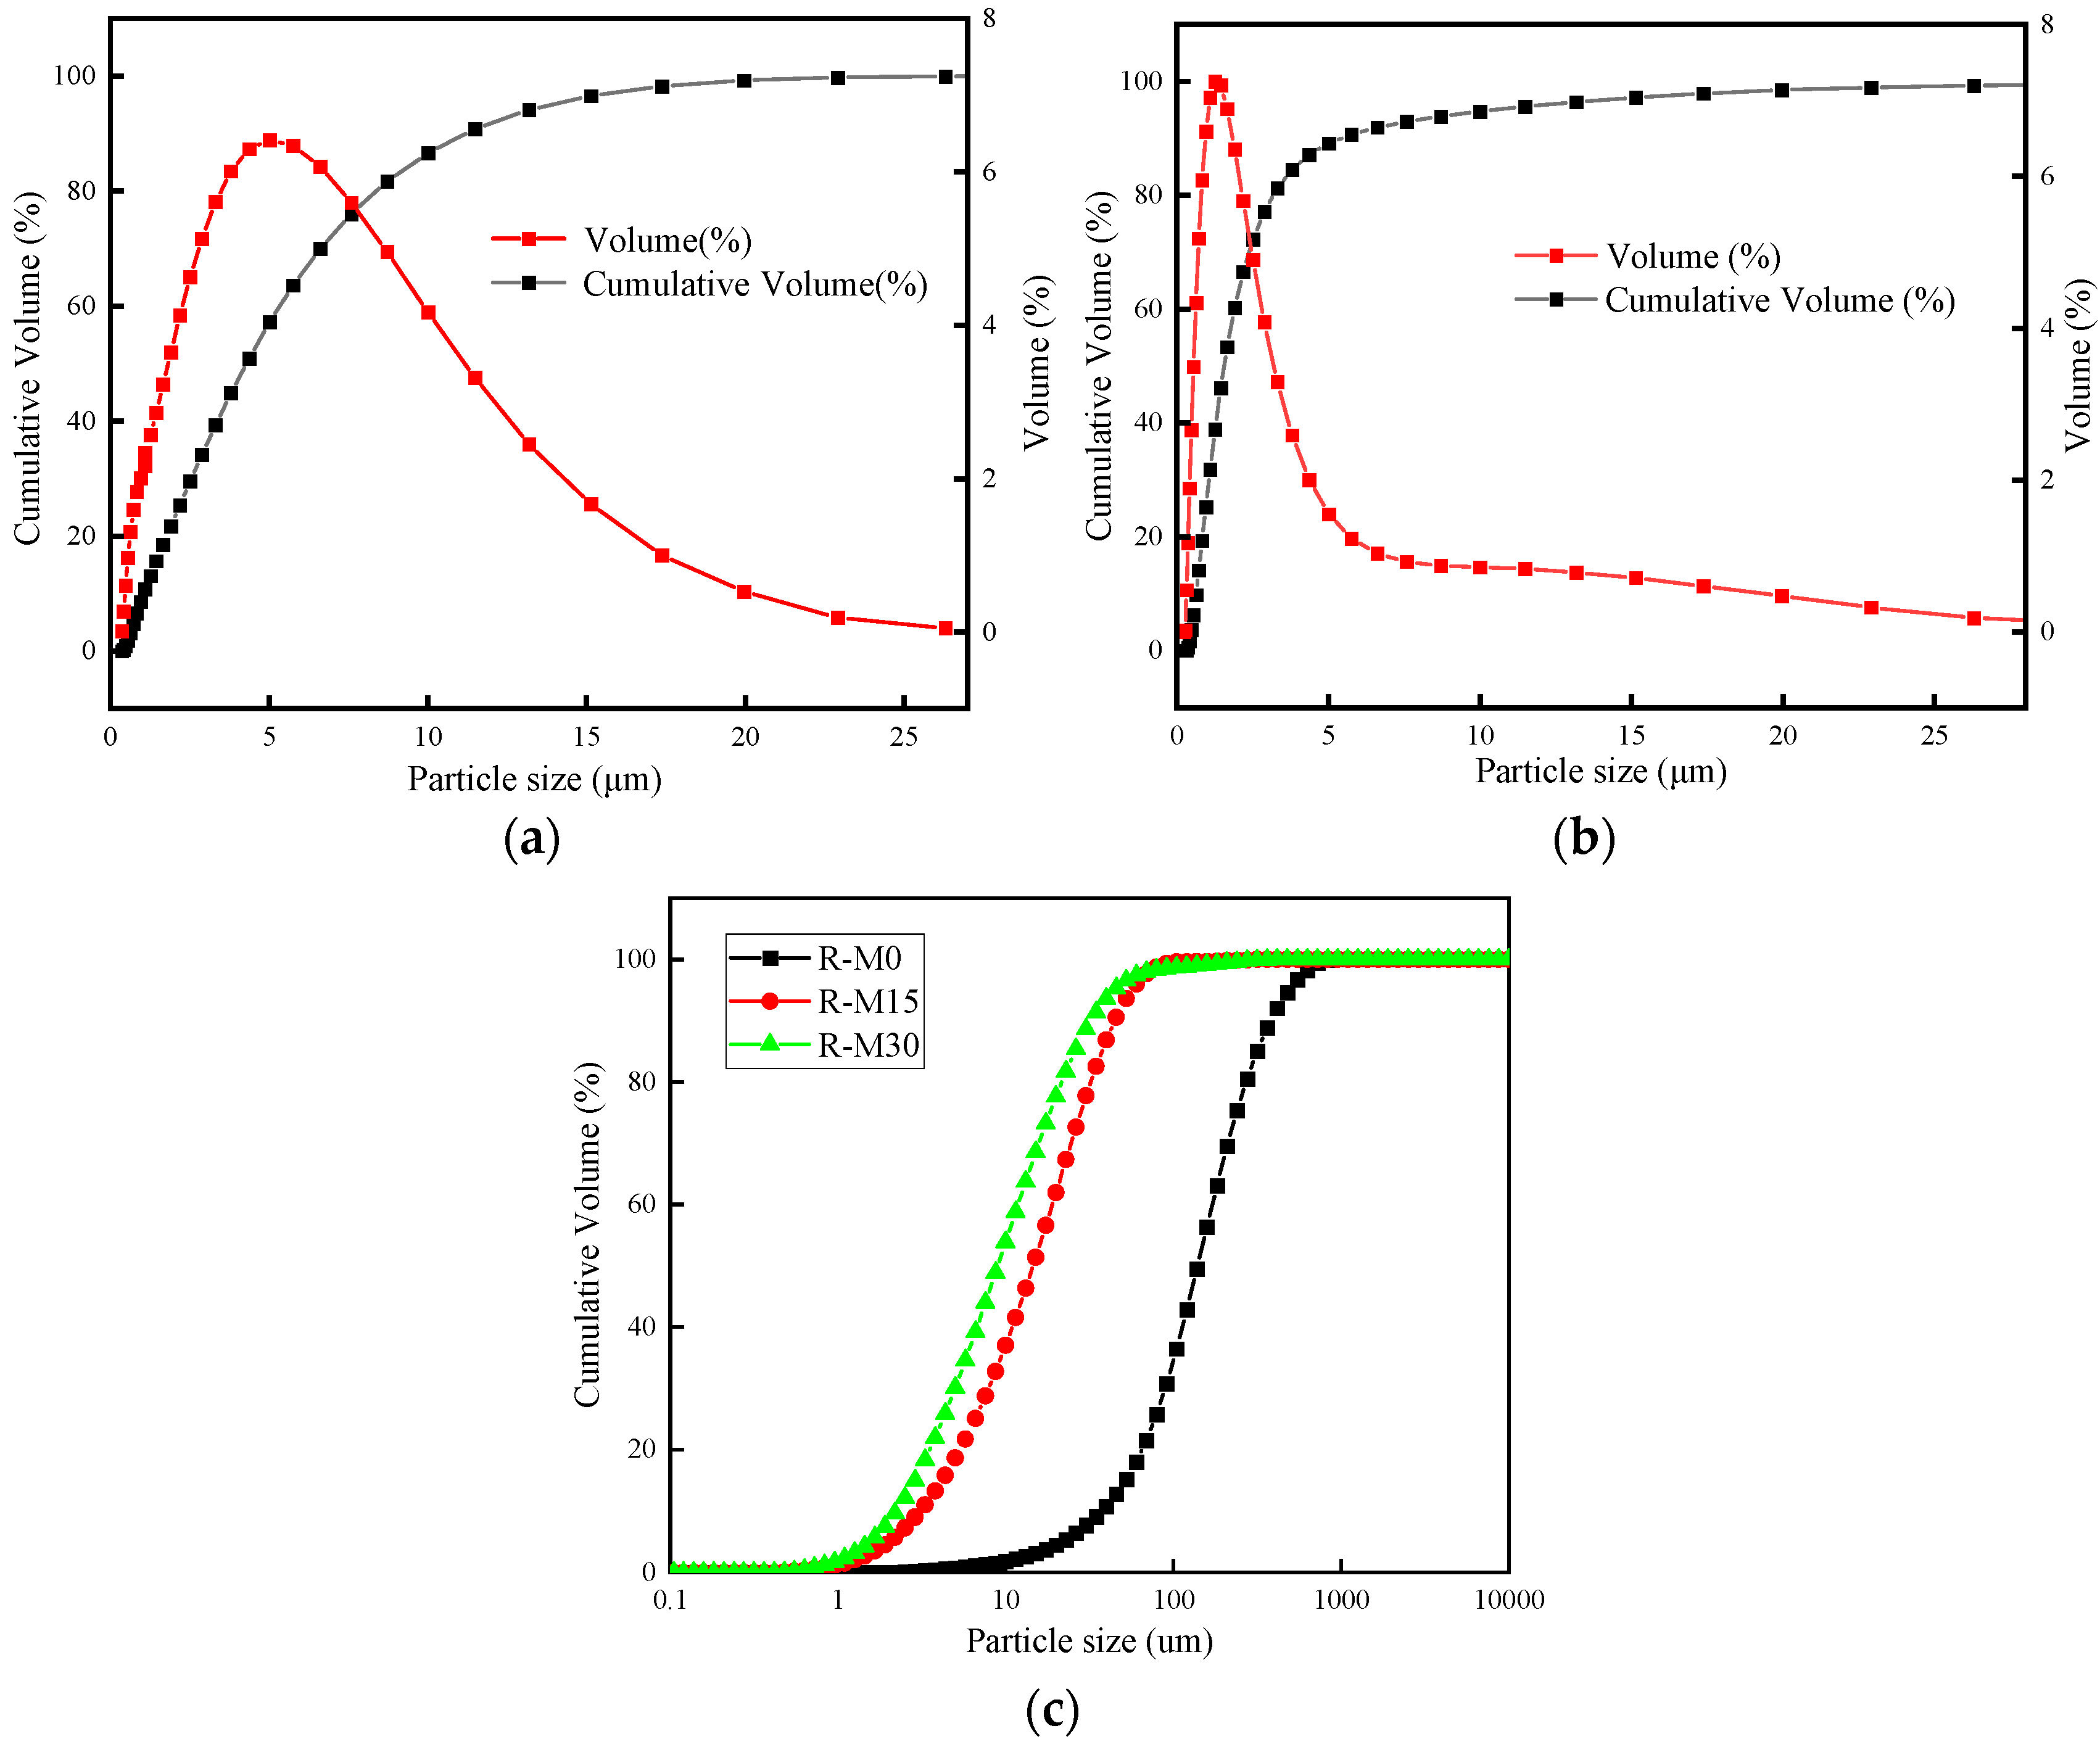
2.1. Materials
2.2. Sample Preparation
2.3. Testing Methods
2.3.1. Fluidity and Setting Time
2.3.2. Chemical Shrinkage
2.3.3. Autogenous Shrinkage
2.3.4. Drying Shrinkage
2.3.5. Isothermal Calorimetry
2.3.6. XRD
2.3.7. BET
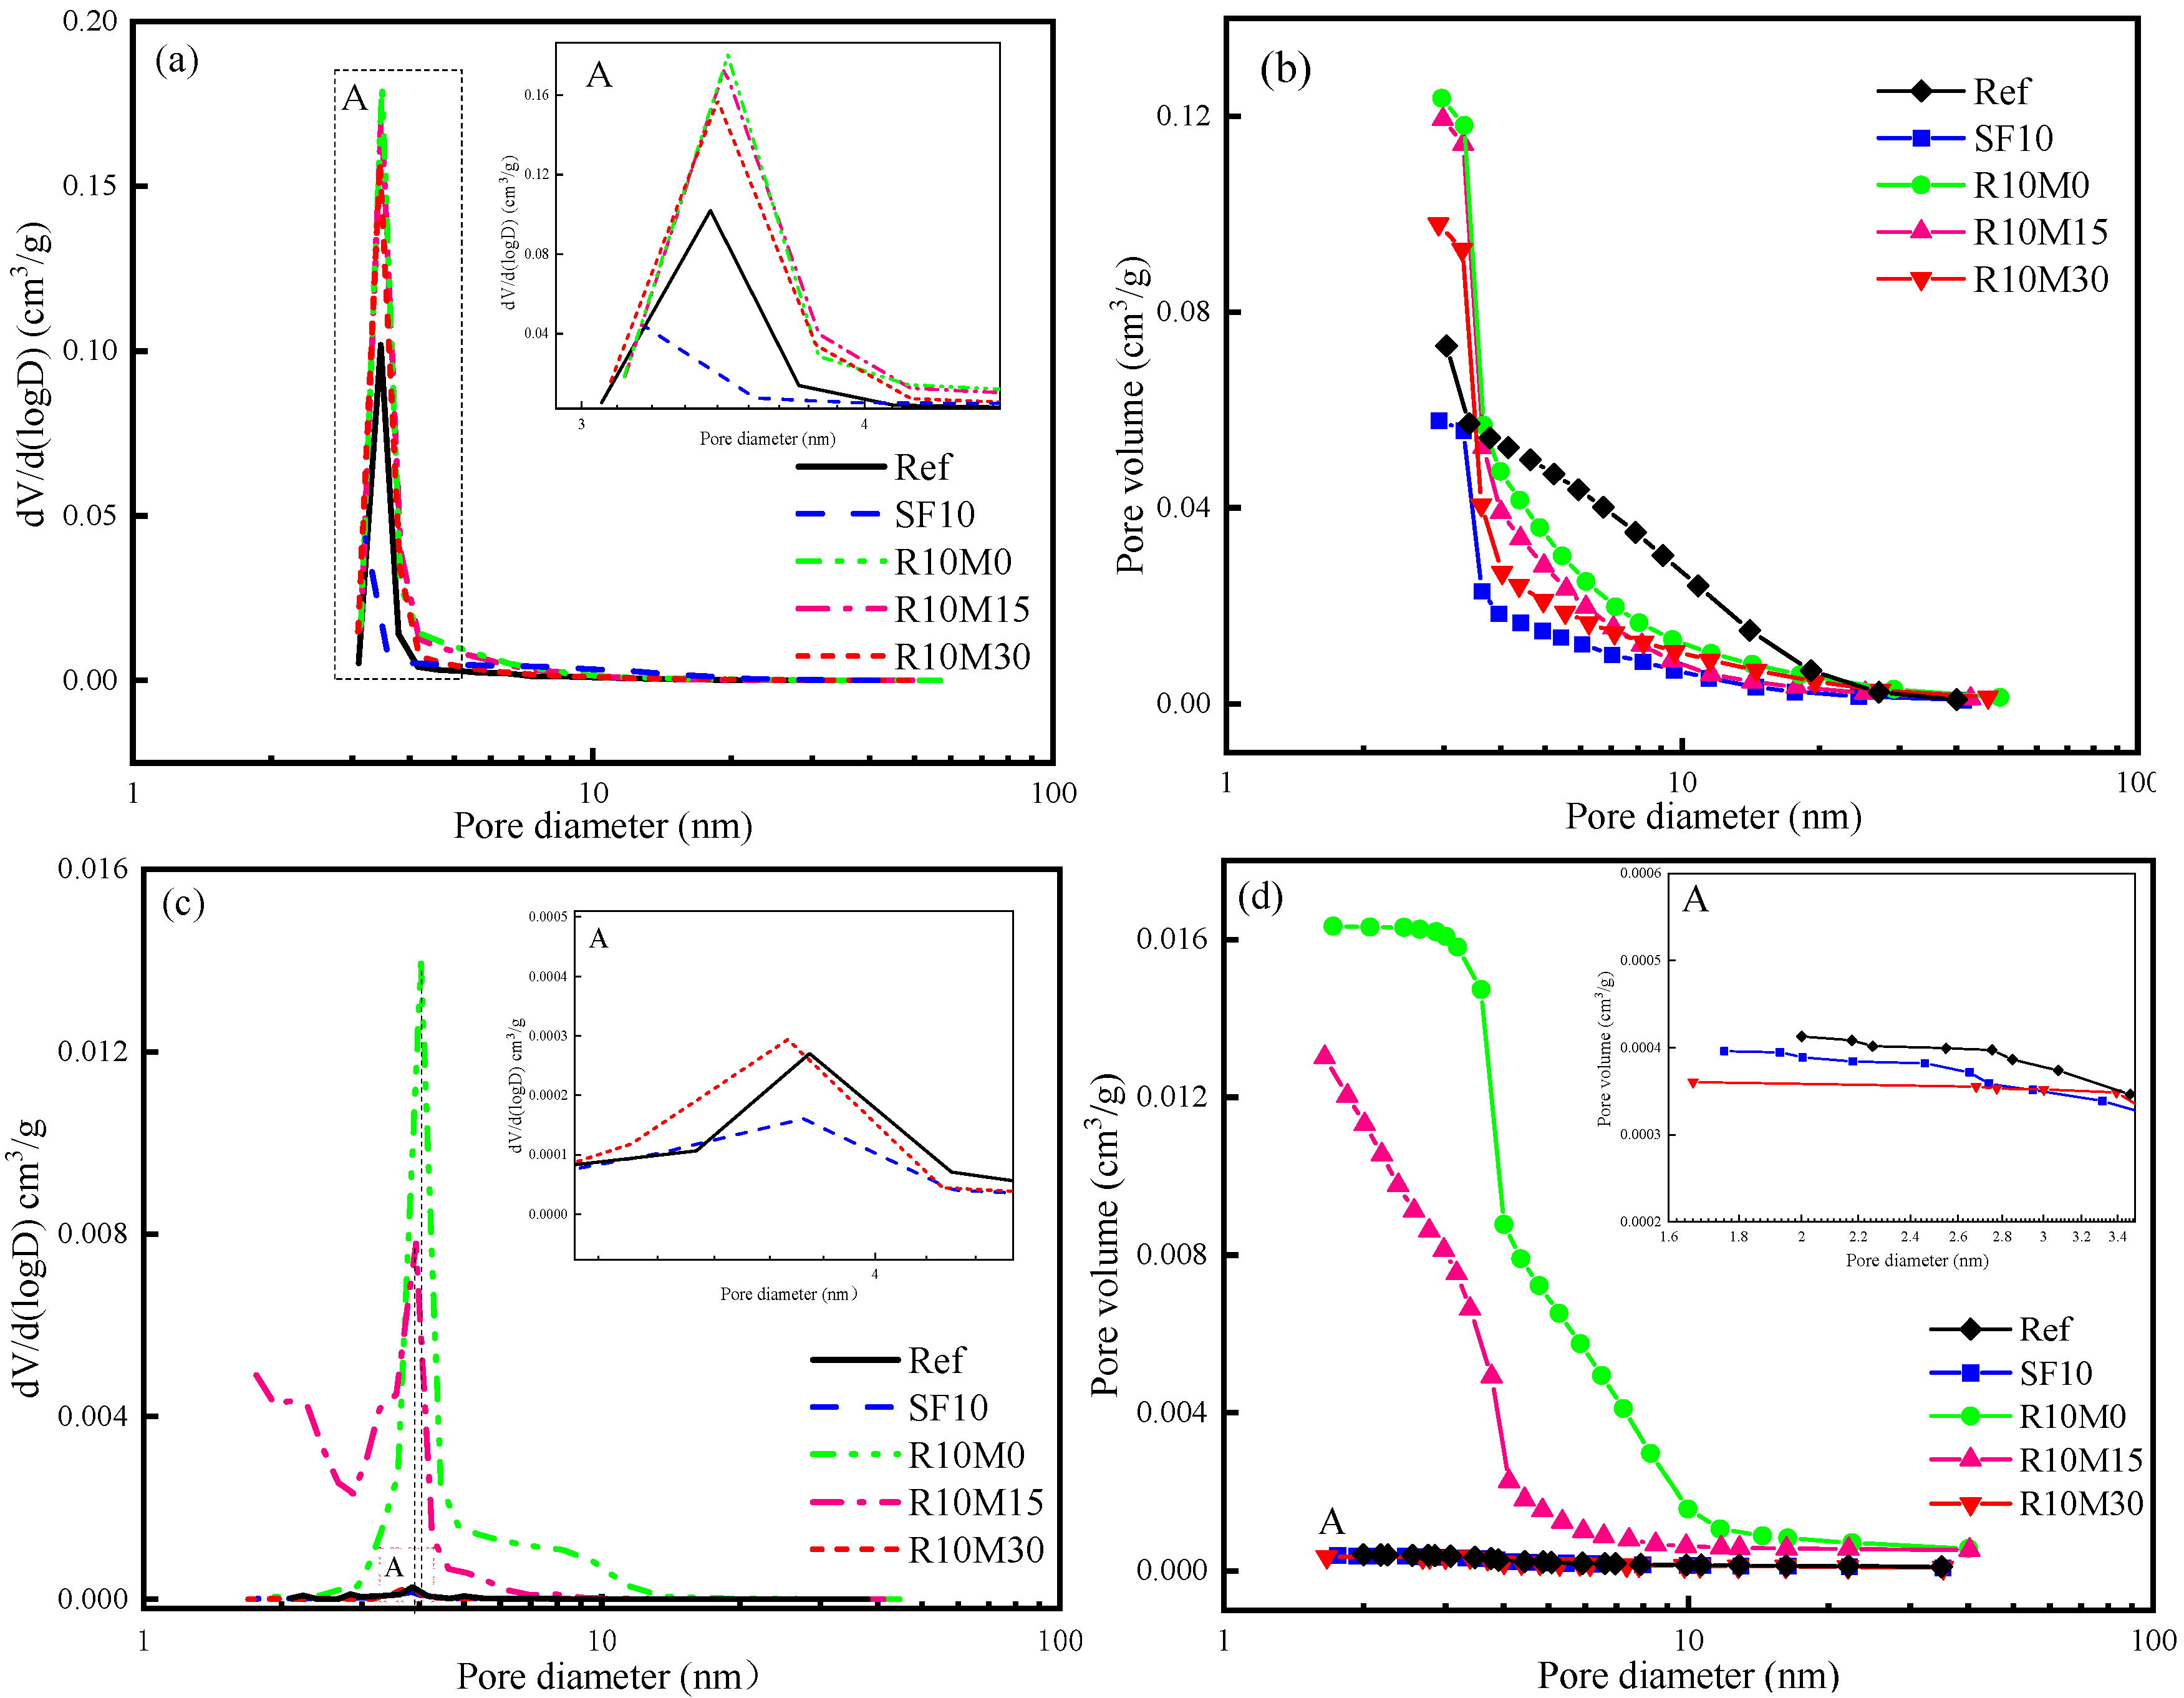
2.3.8. Solid State NMR
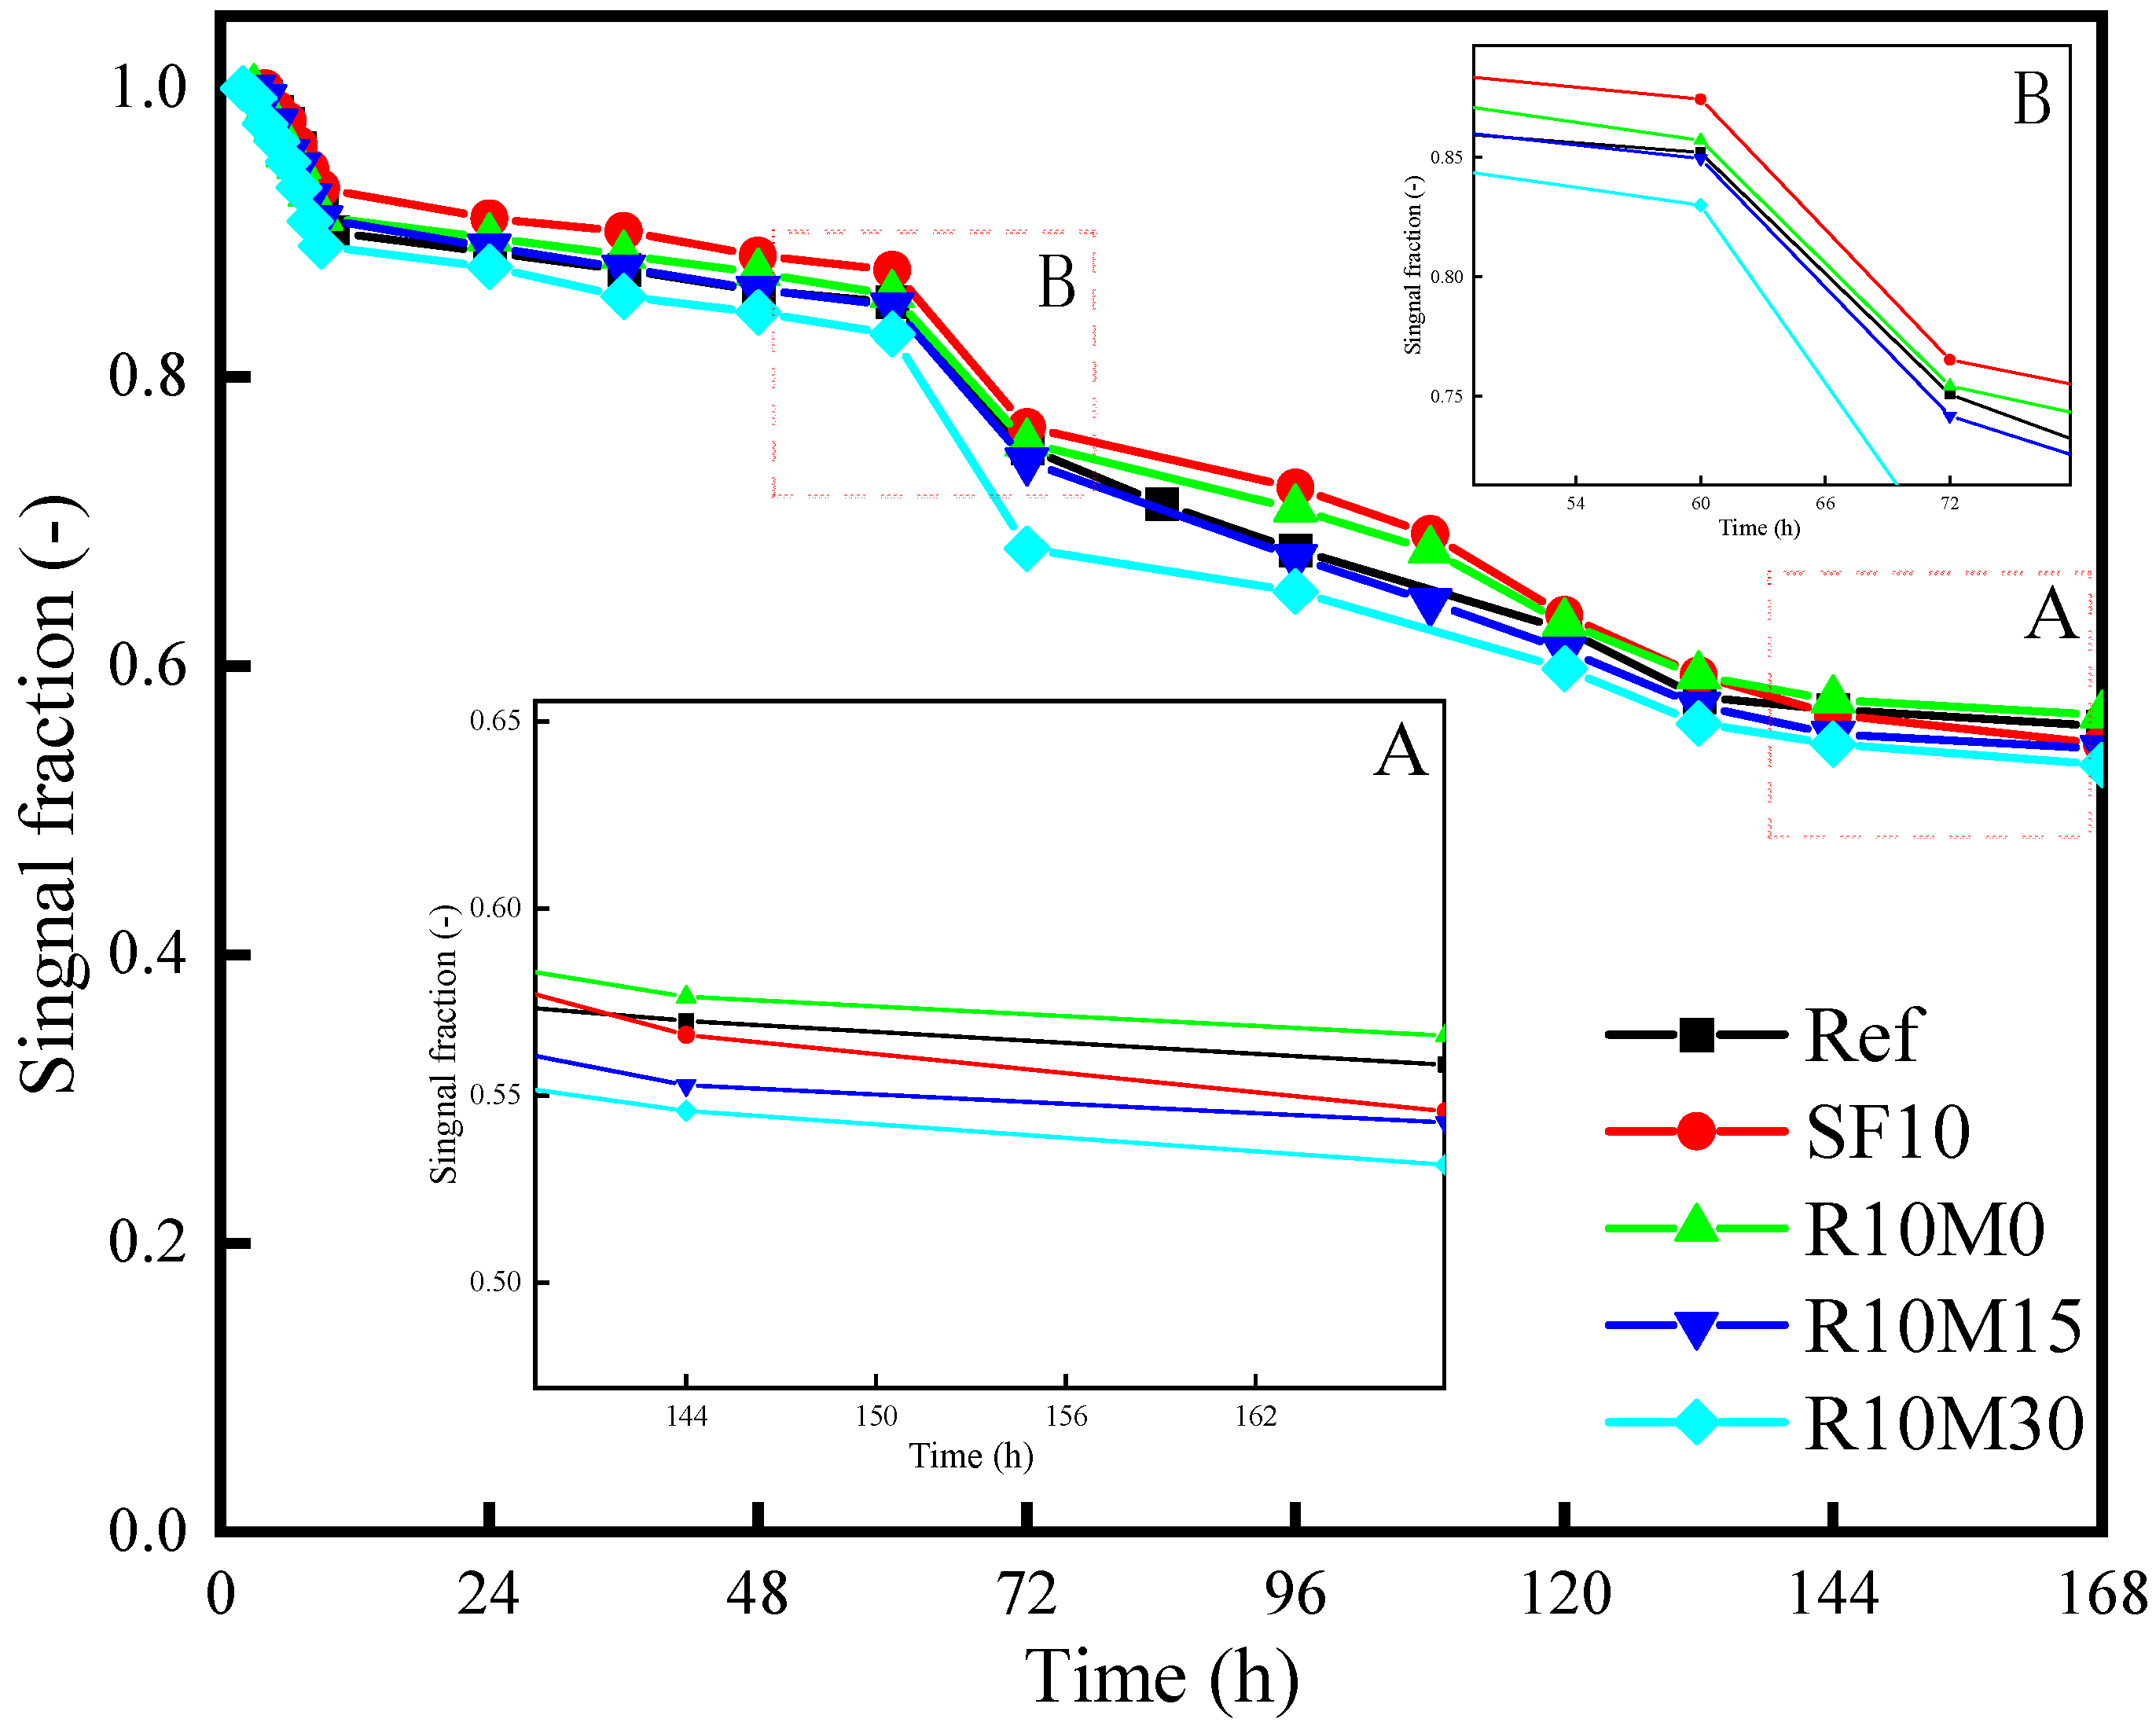
2.3.9. 1H Low Field NMR
2.3.10. Compressive Strength
3. Results
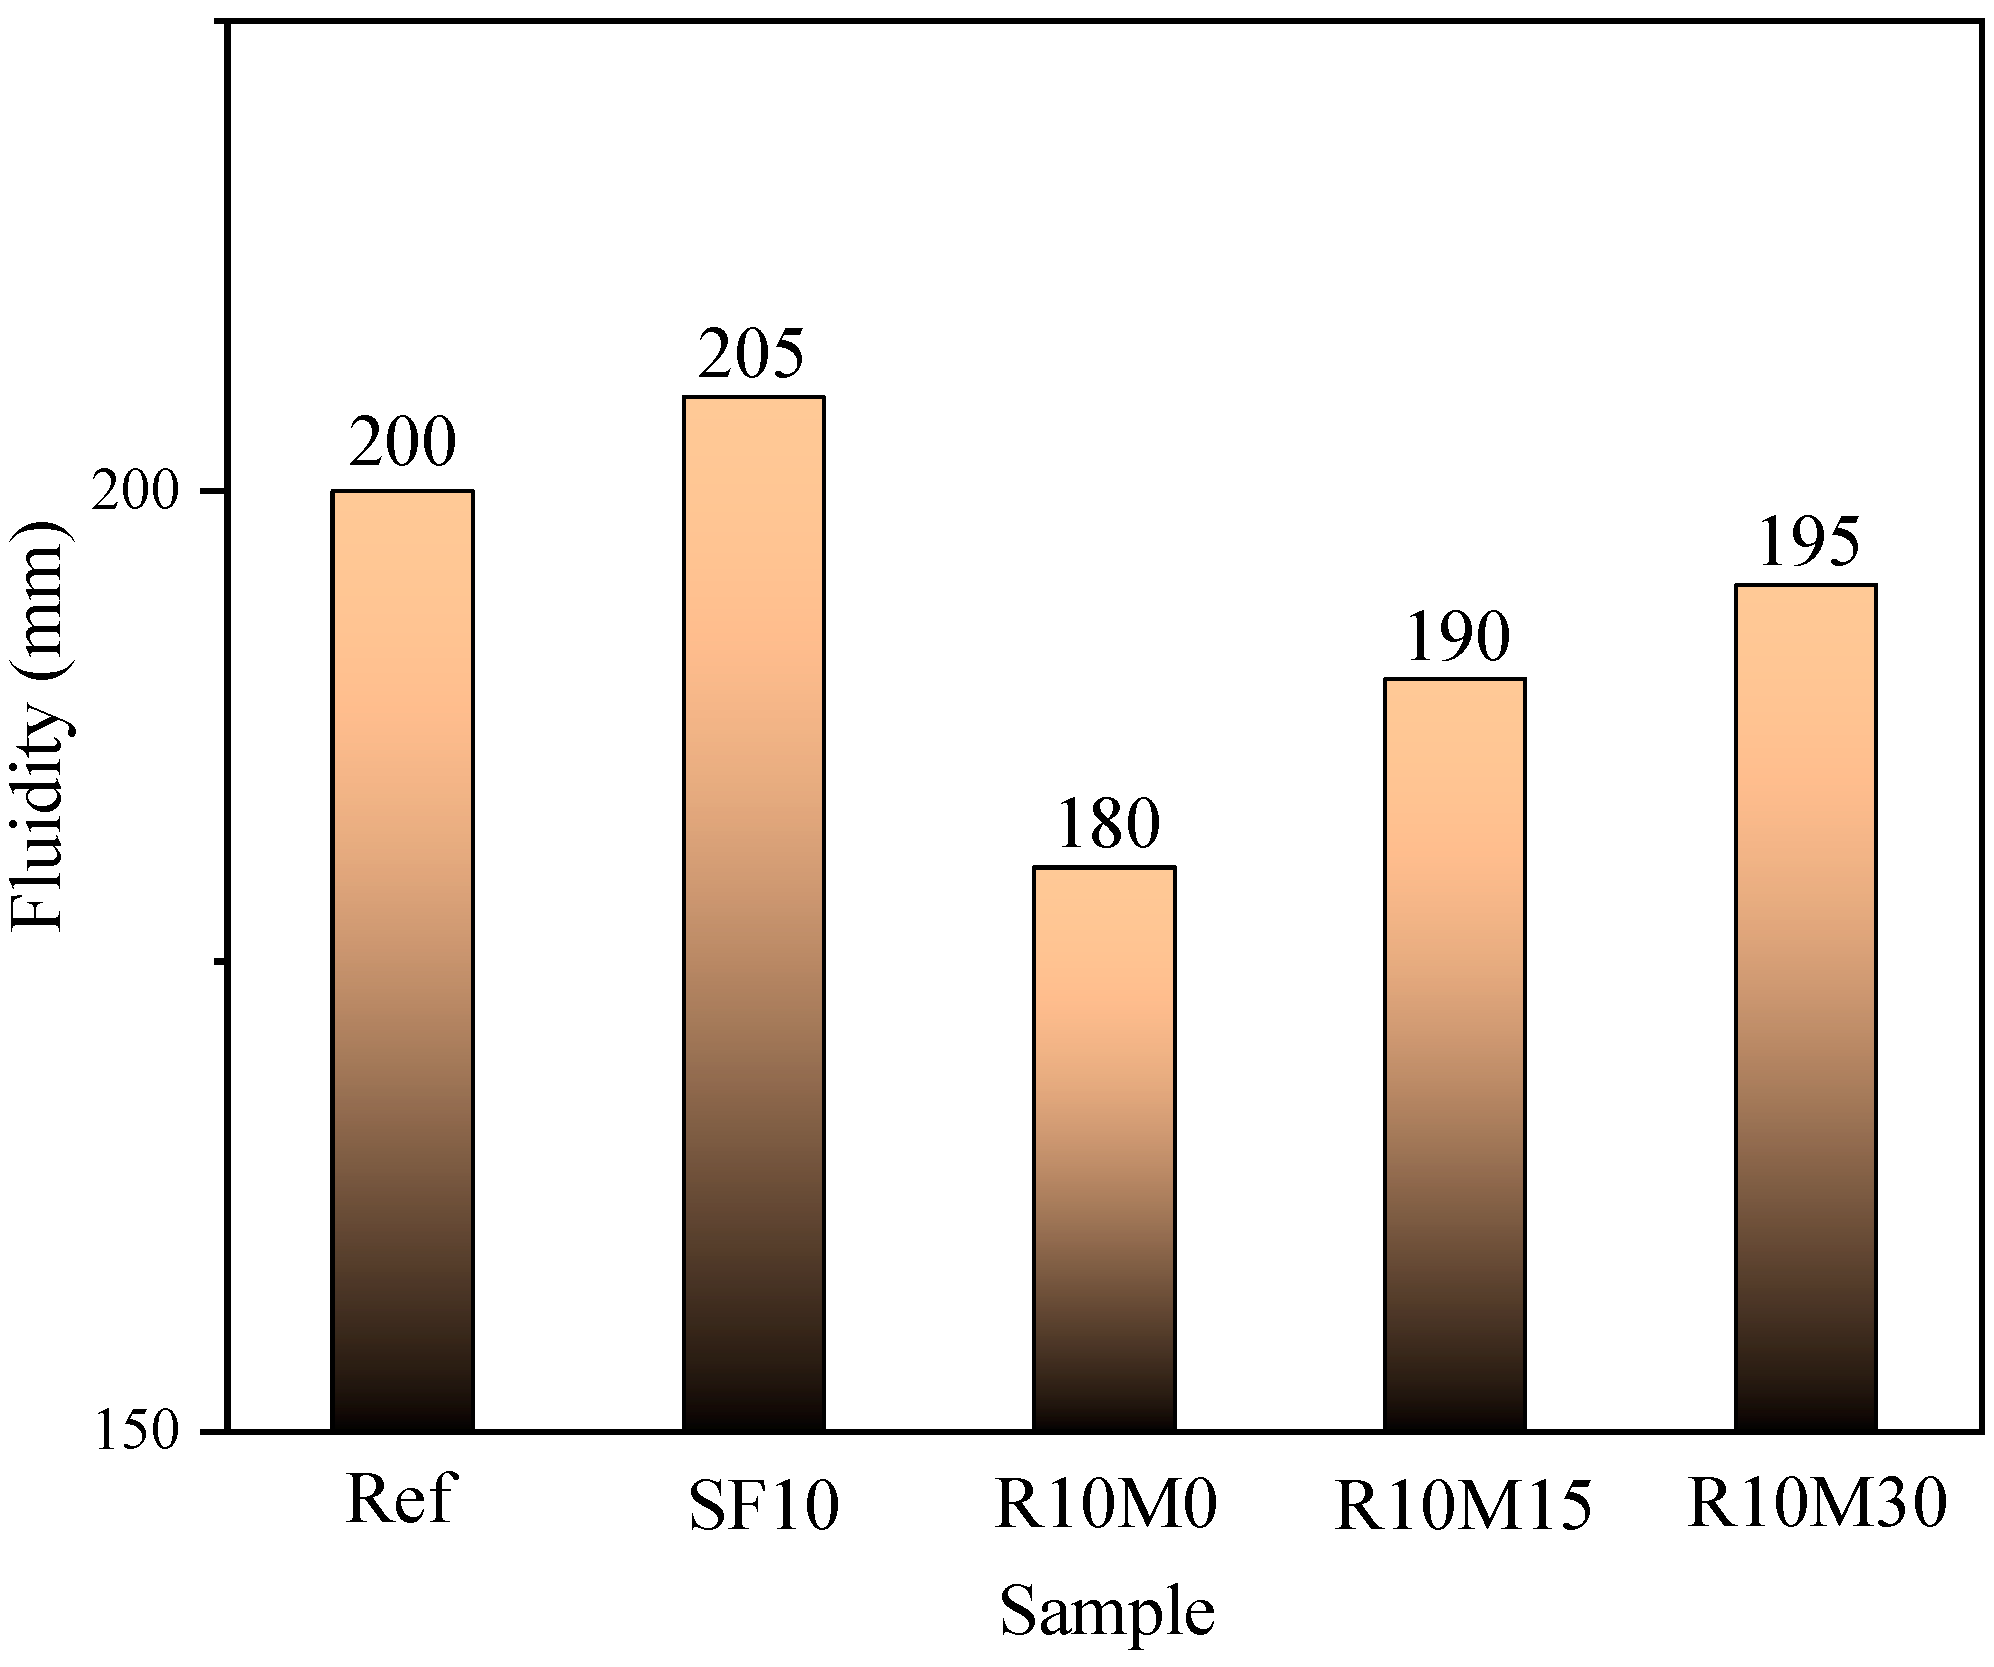
3.1. Fluidity
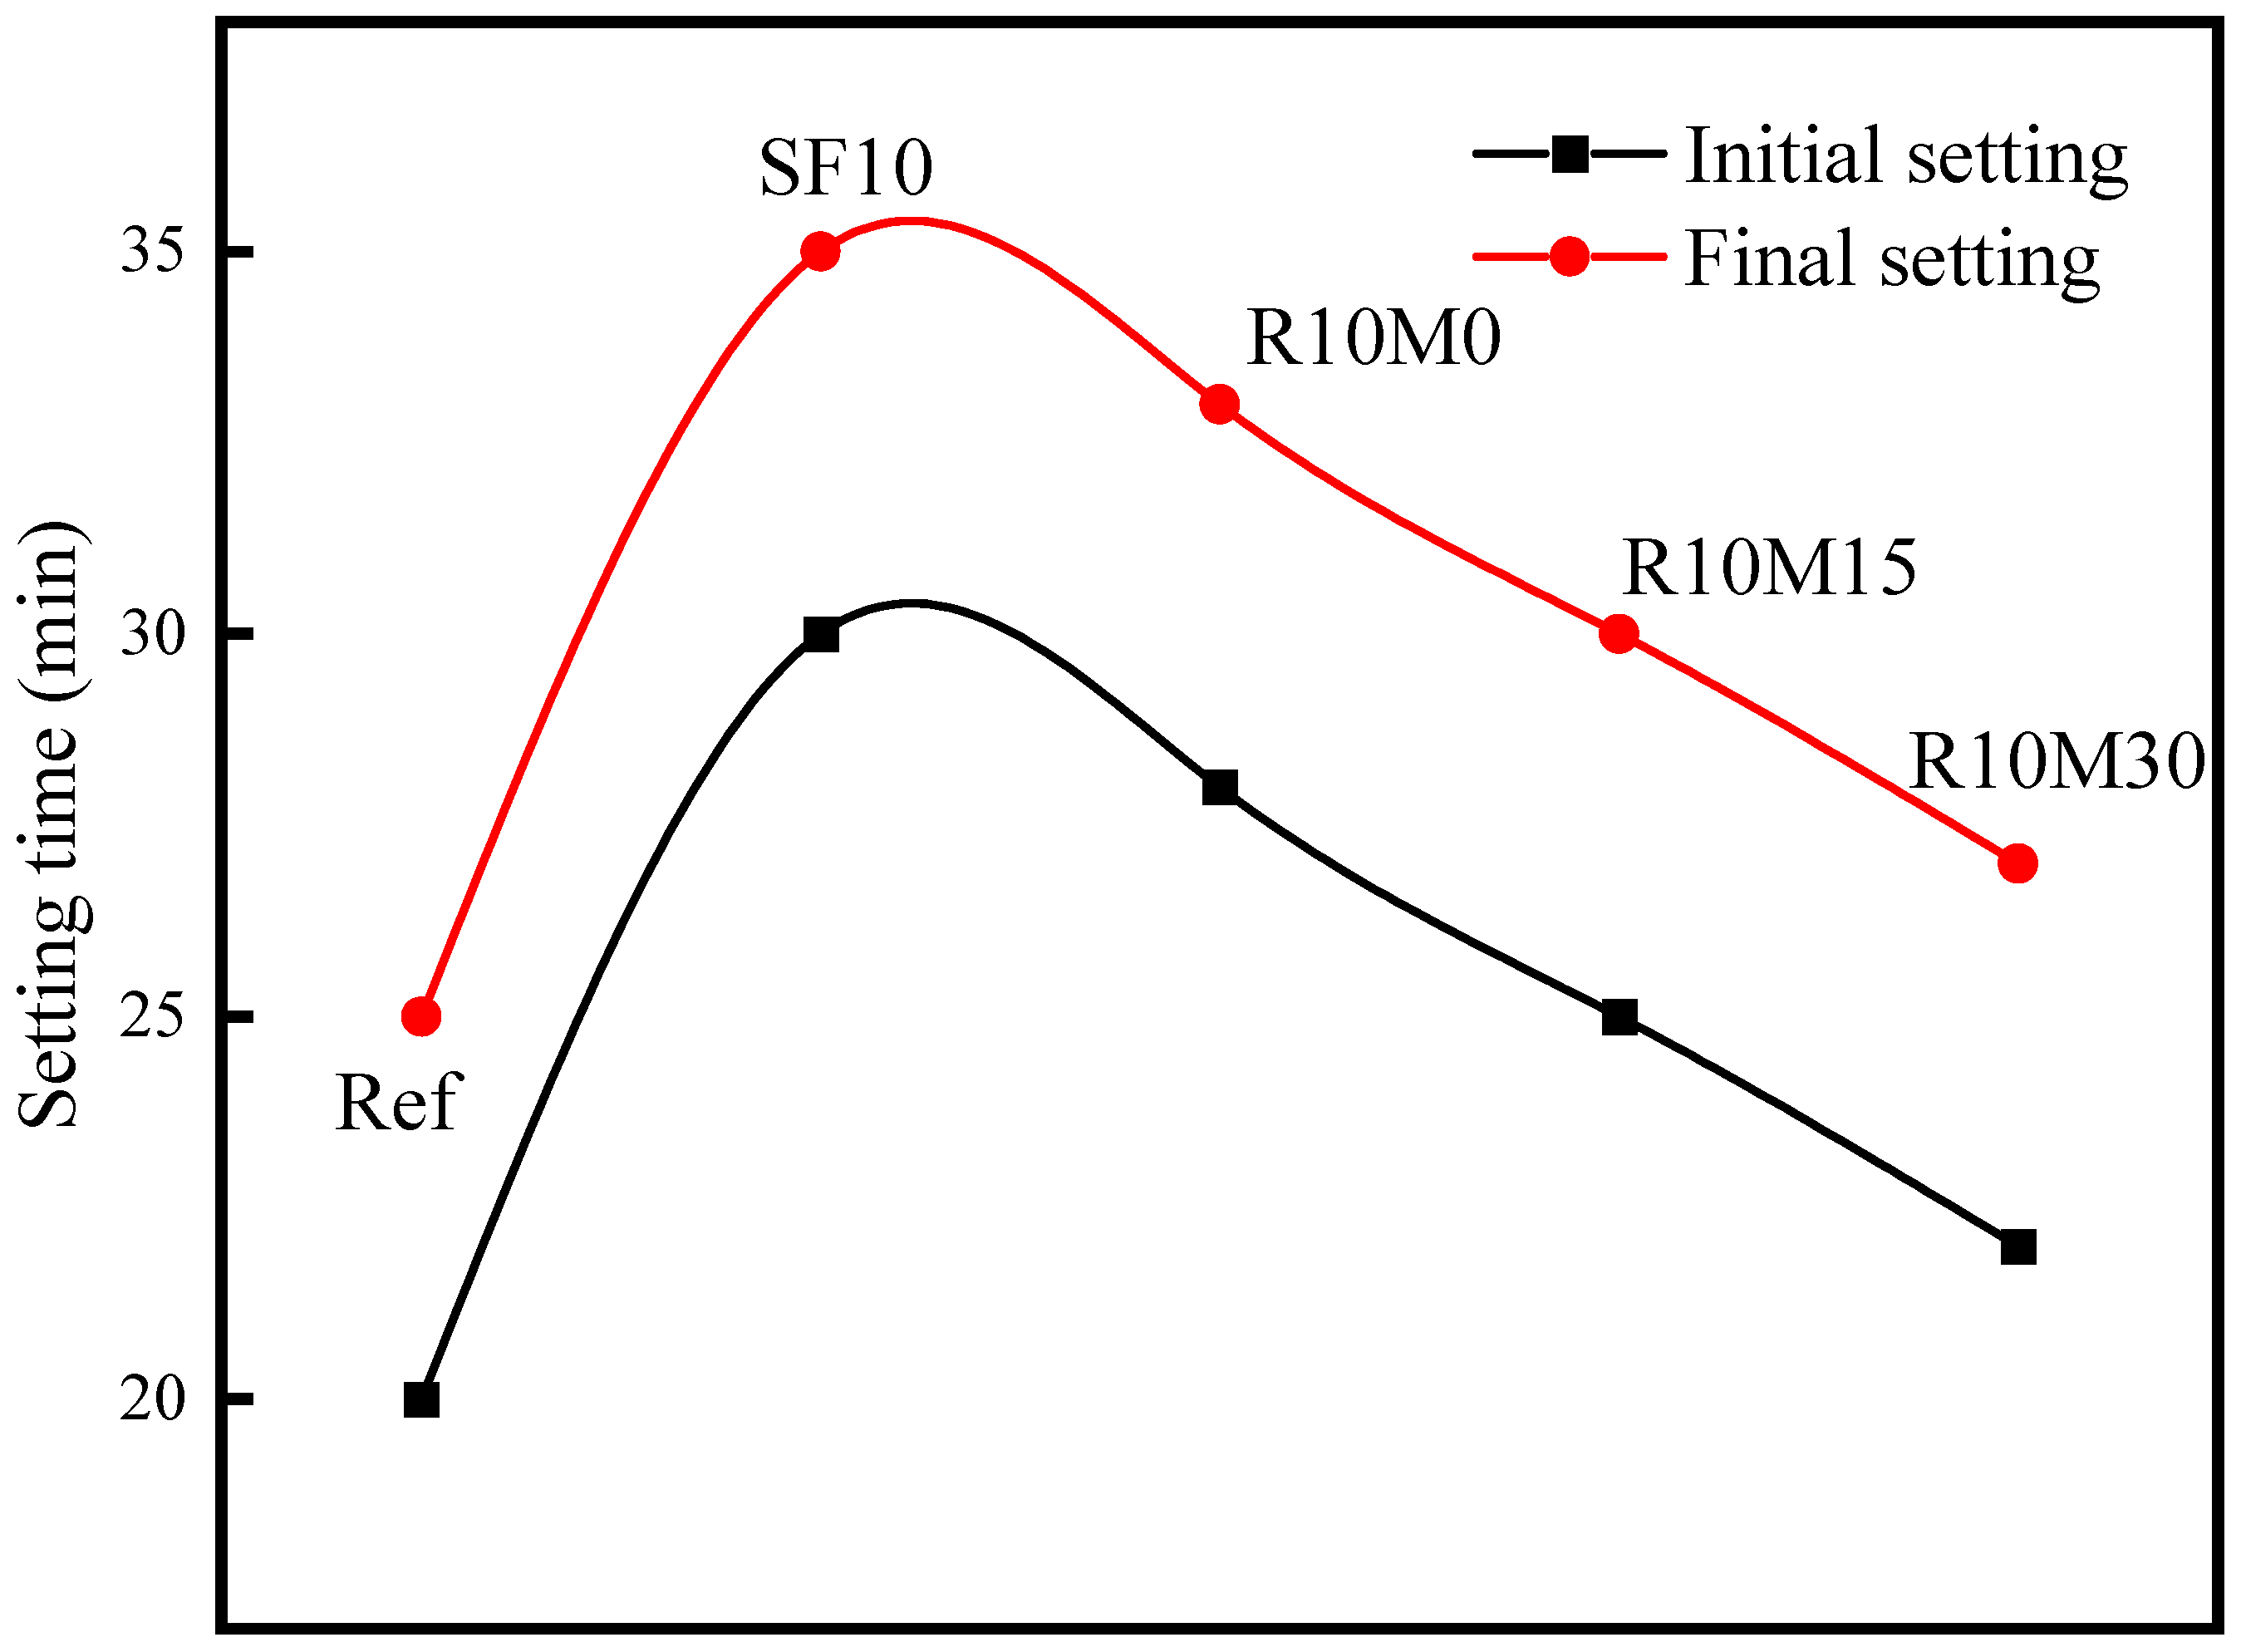
3.2. Setting Time
3.3. Hydration Properties
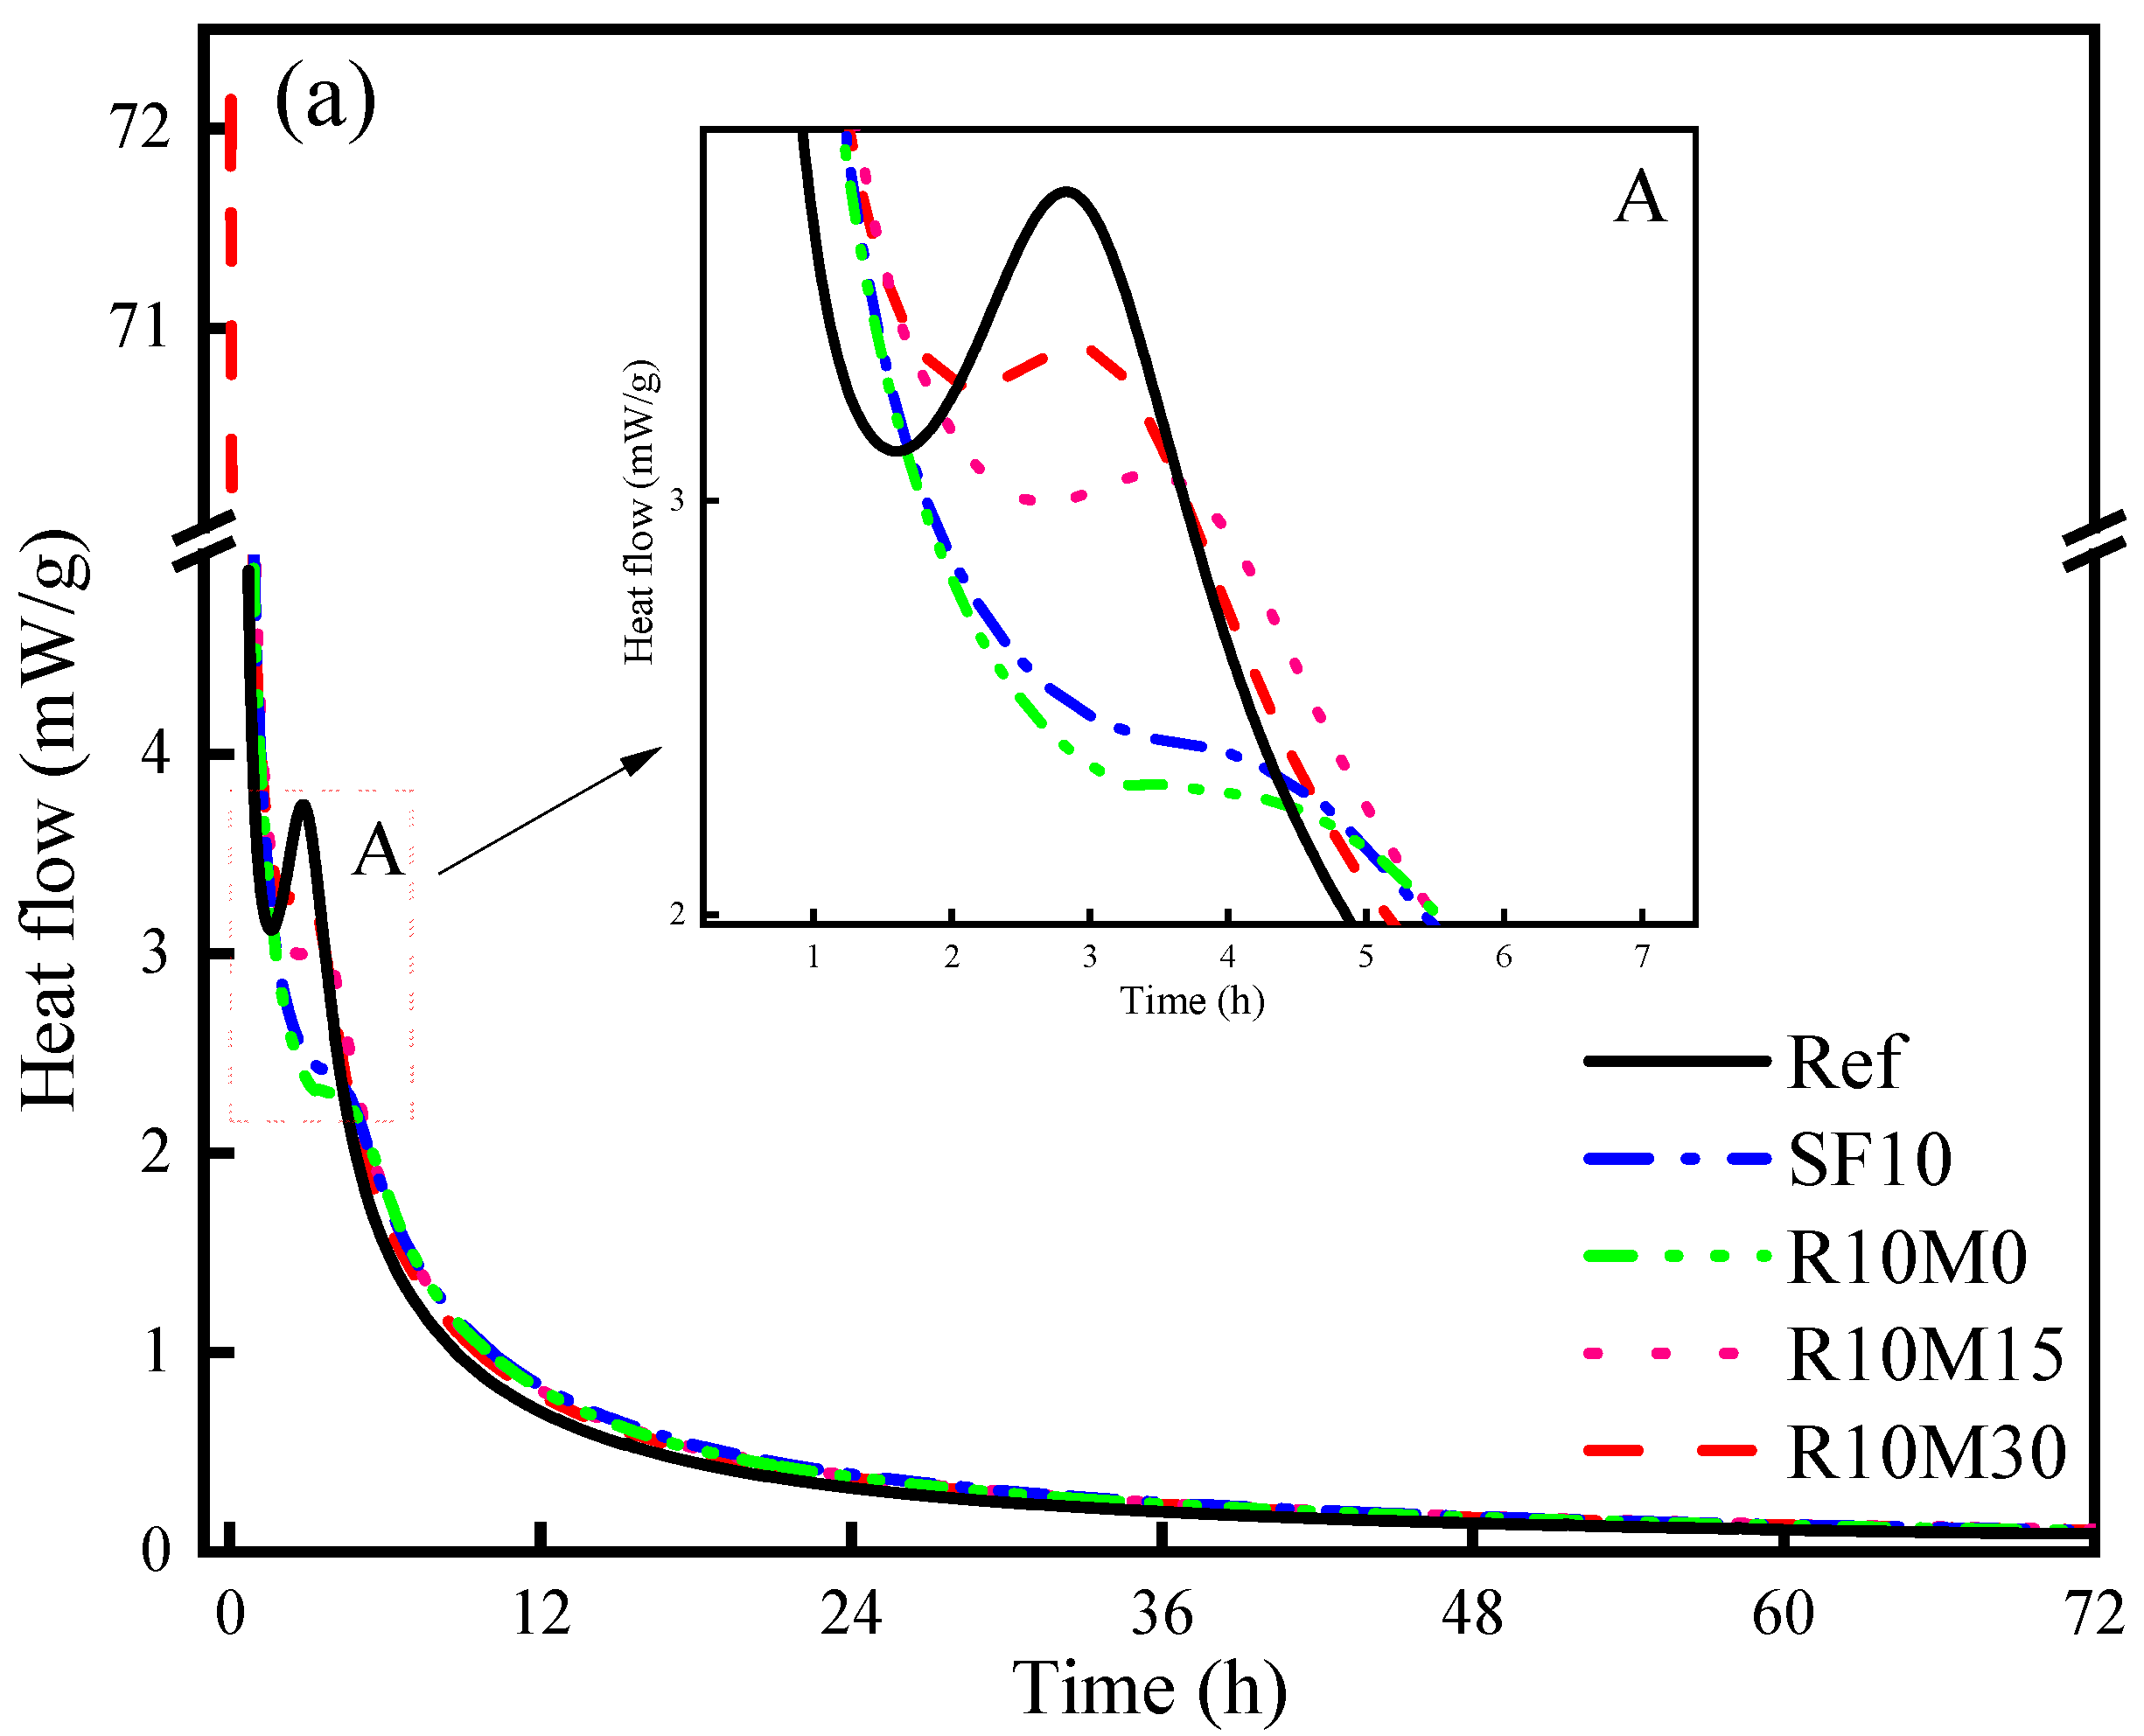
3.3.1. Isothermal Calorimetry
3.3.2. XRD
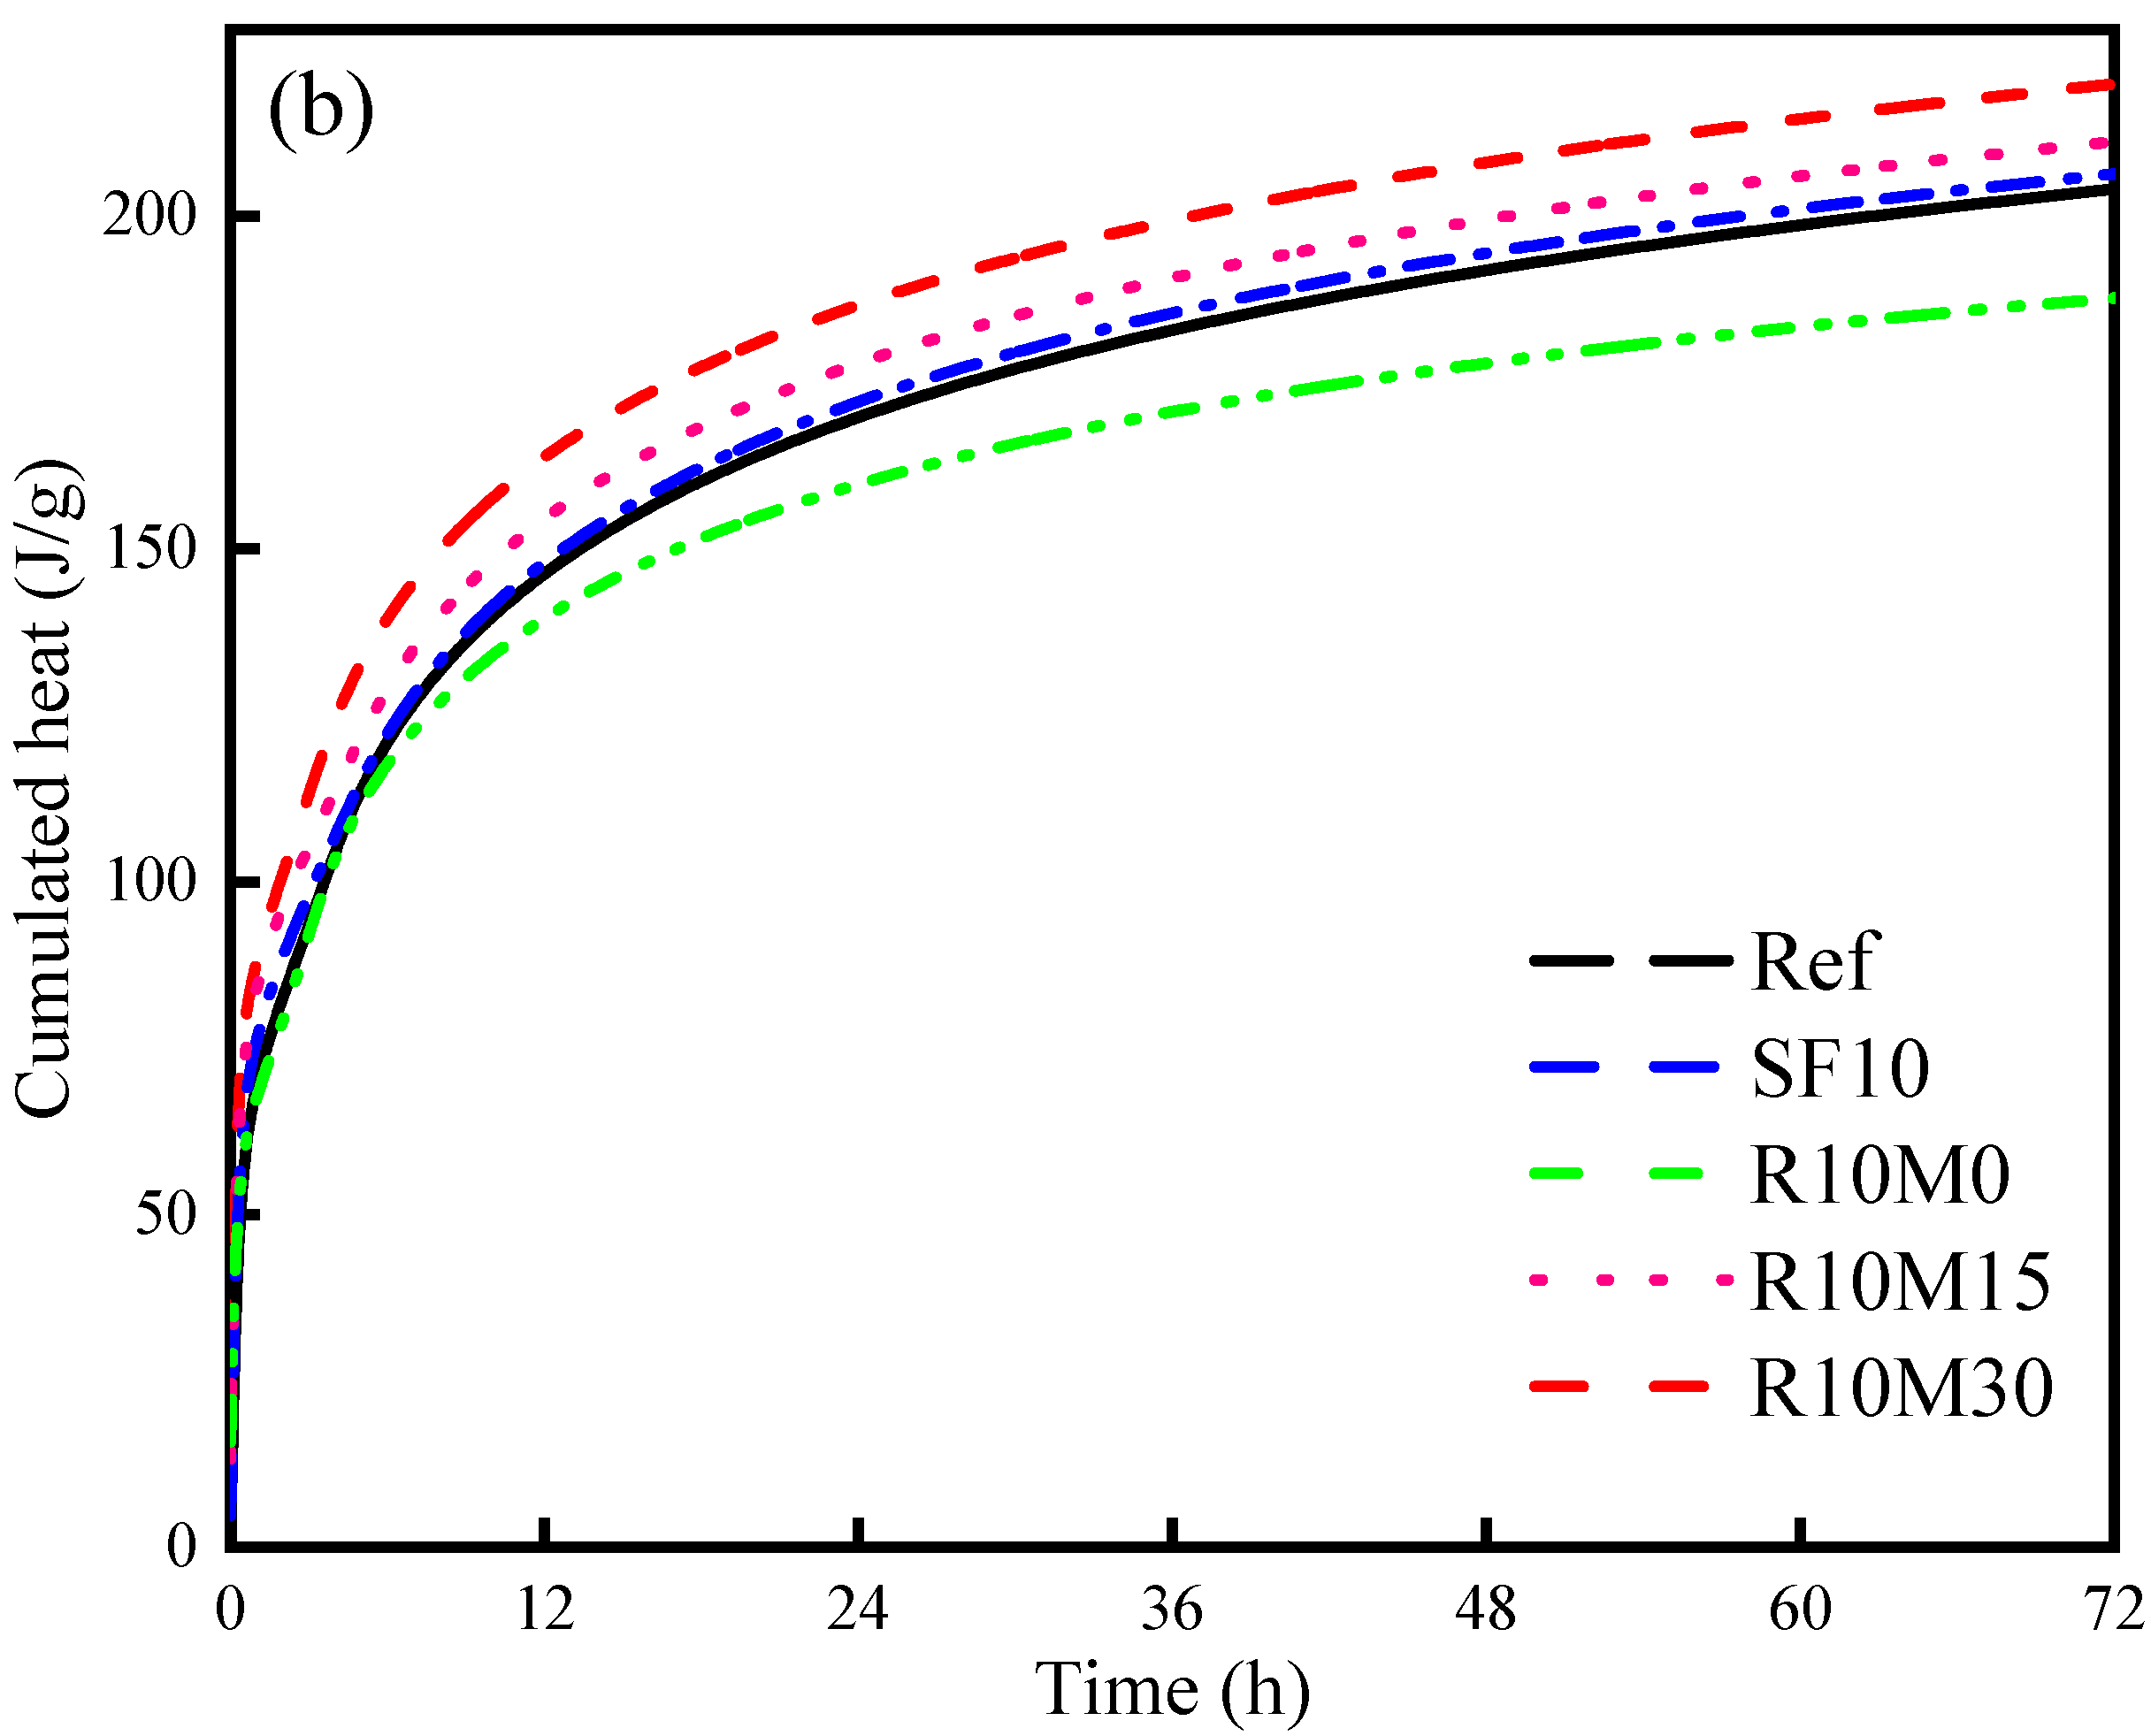
3.3.3. Pore Structure
3.3.4. Solid State NMR Analysis
3.3.5. 1H Low Field NMR
3.4. Shrinkage Performance
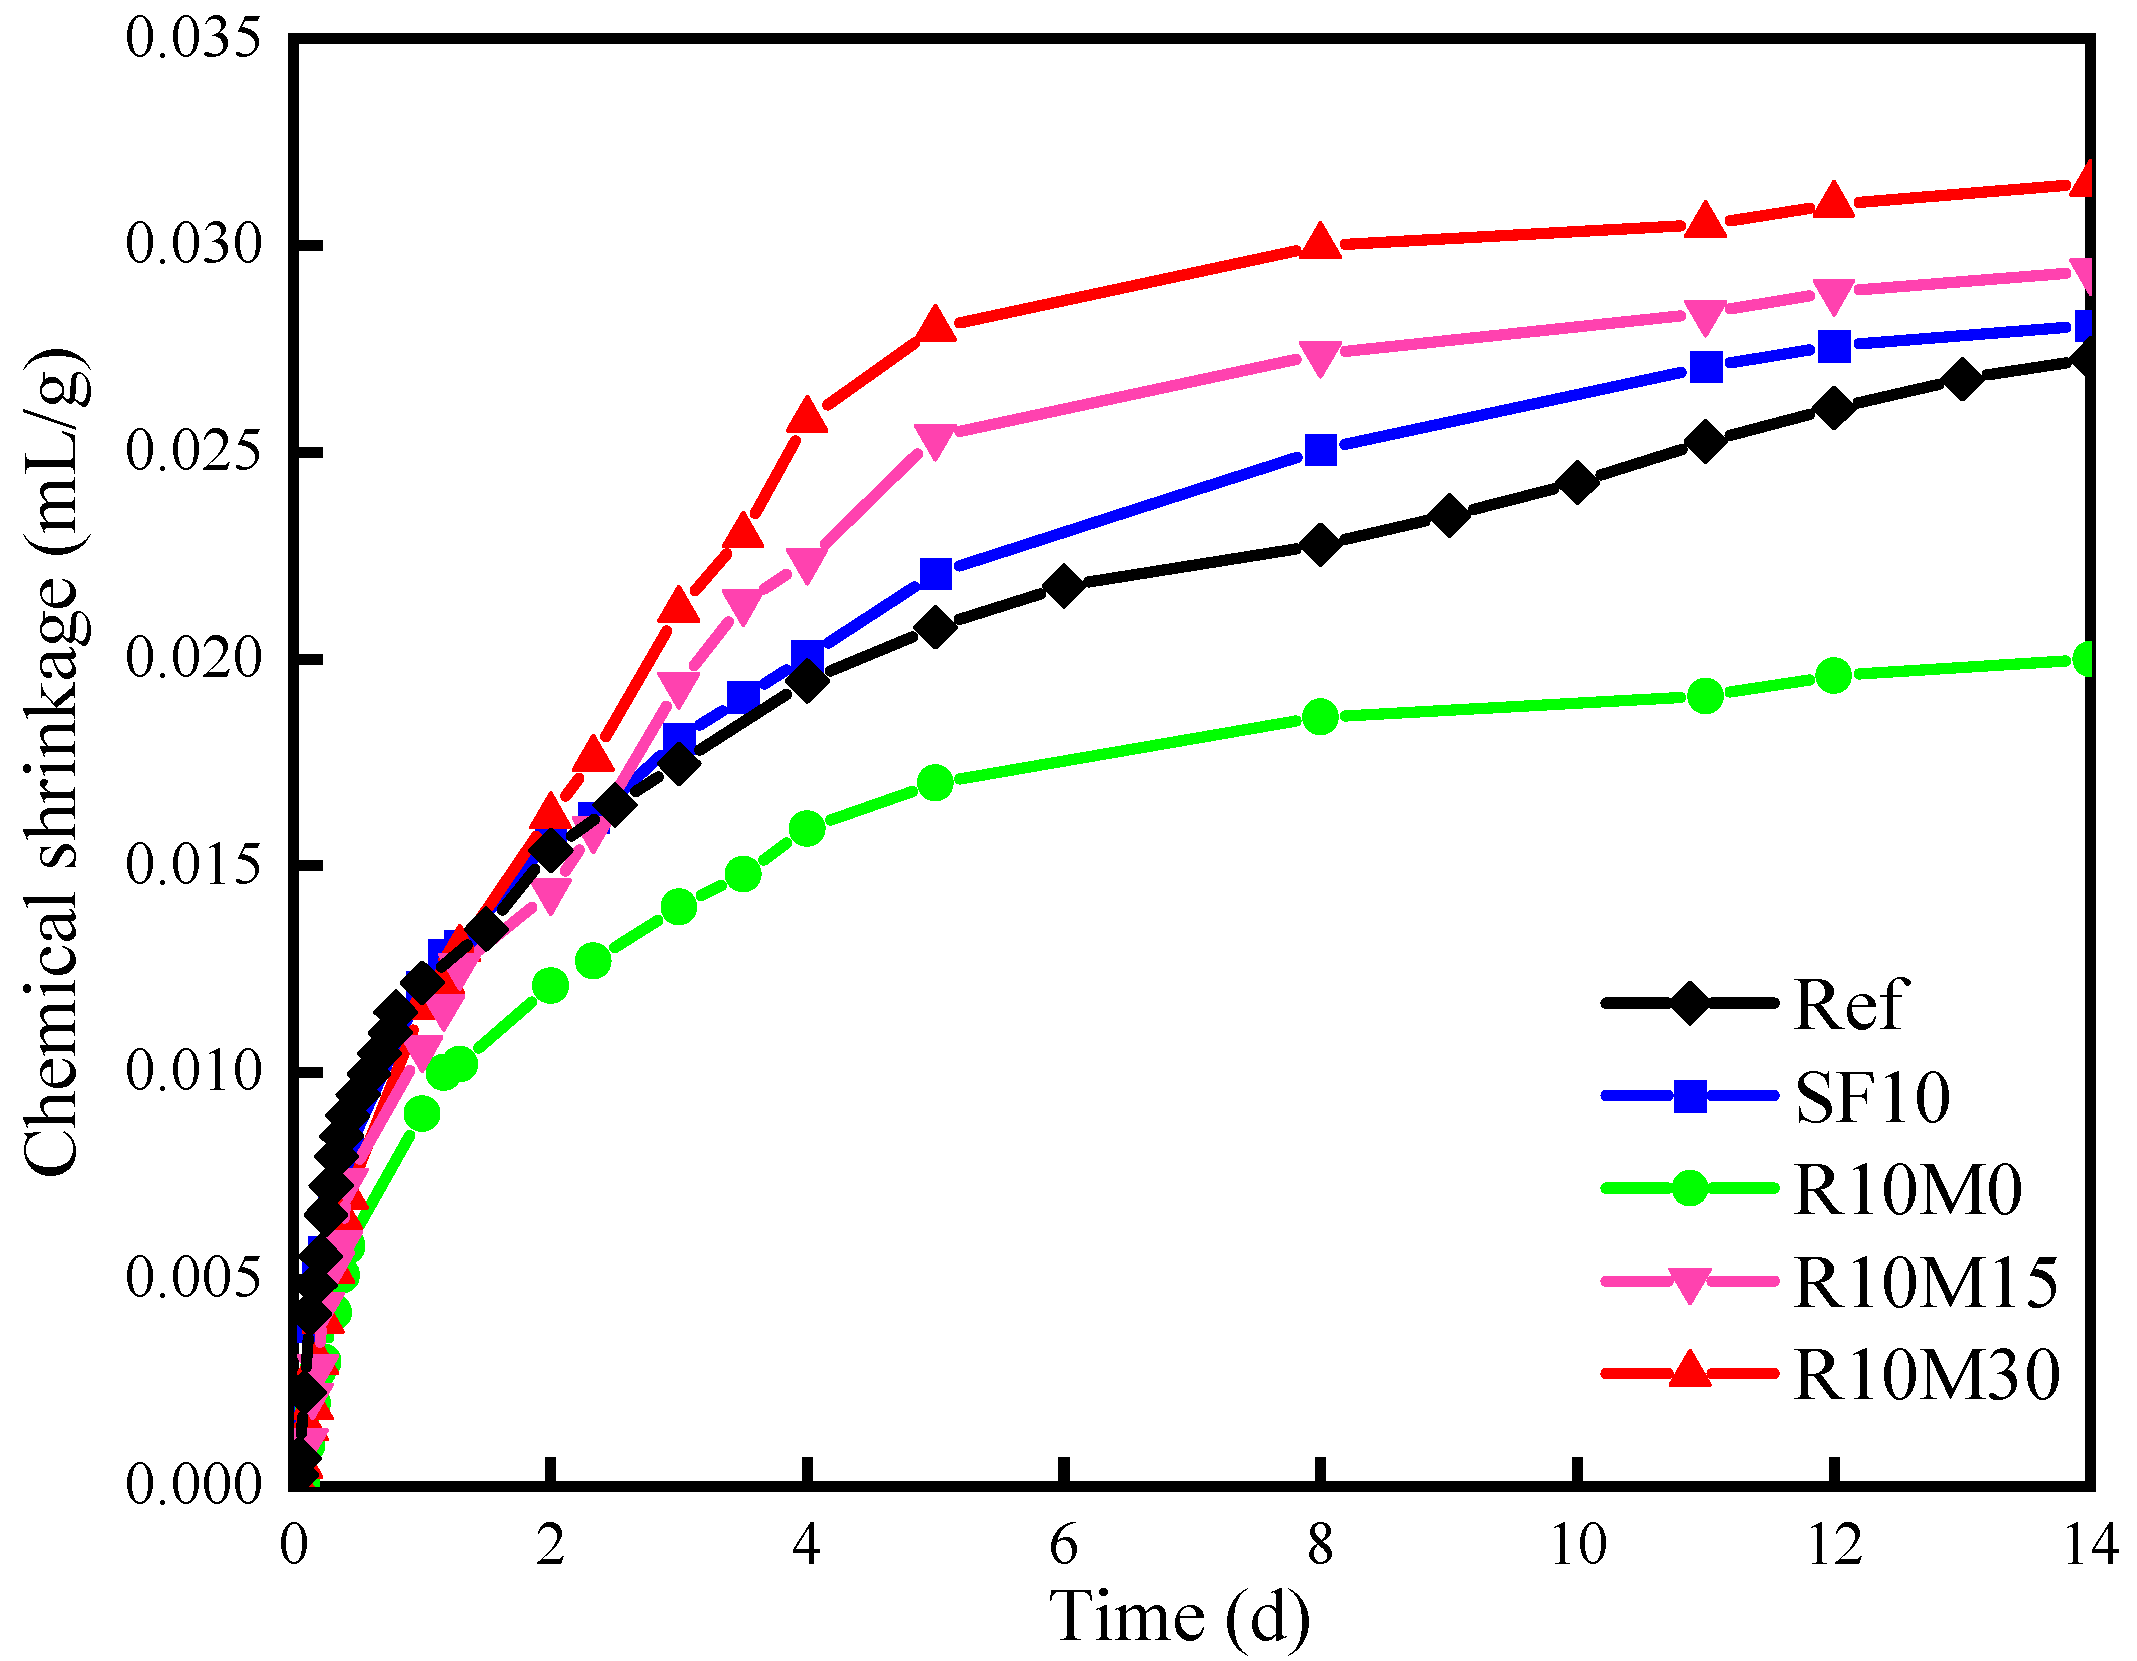
3.4.1. Chemical Shrinkage
3.4.2. Autogenous Shrinkage
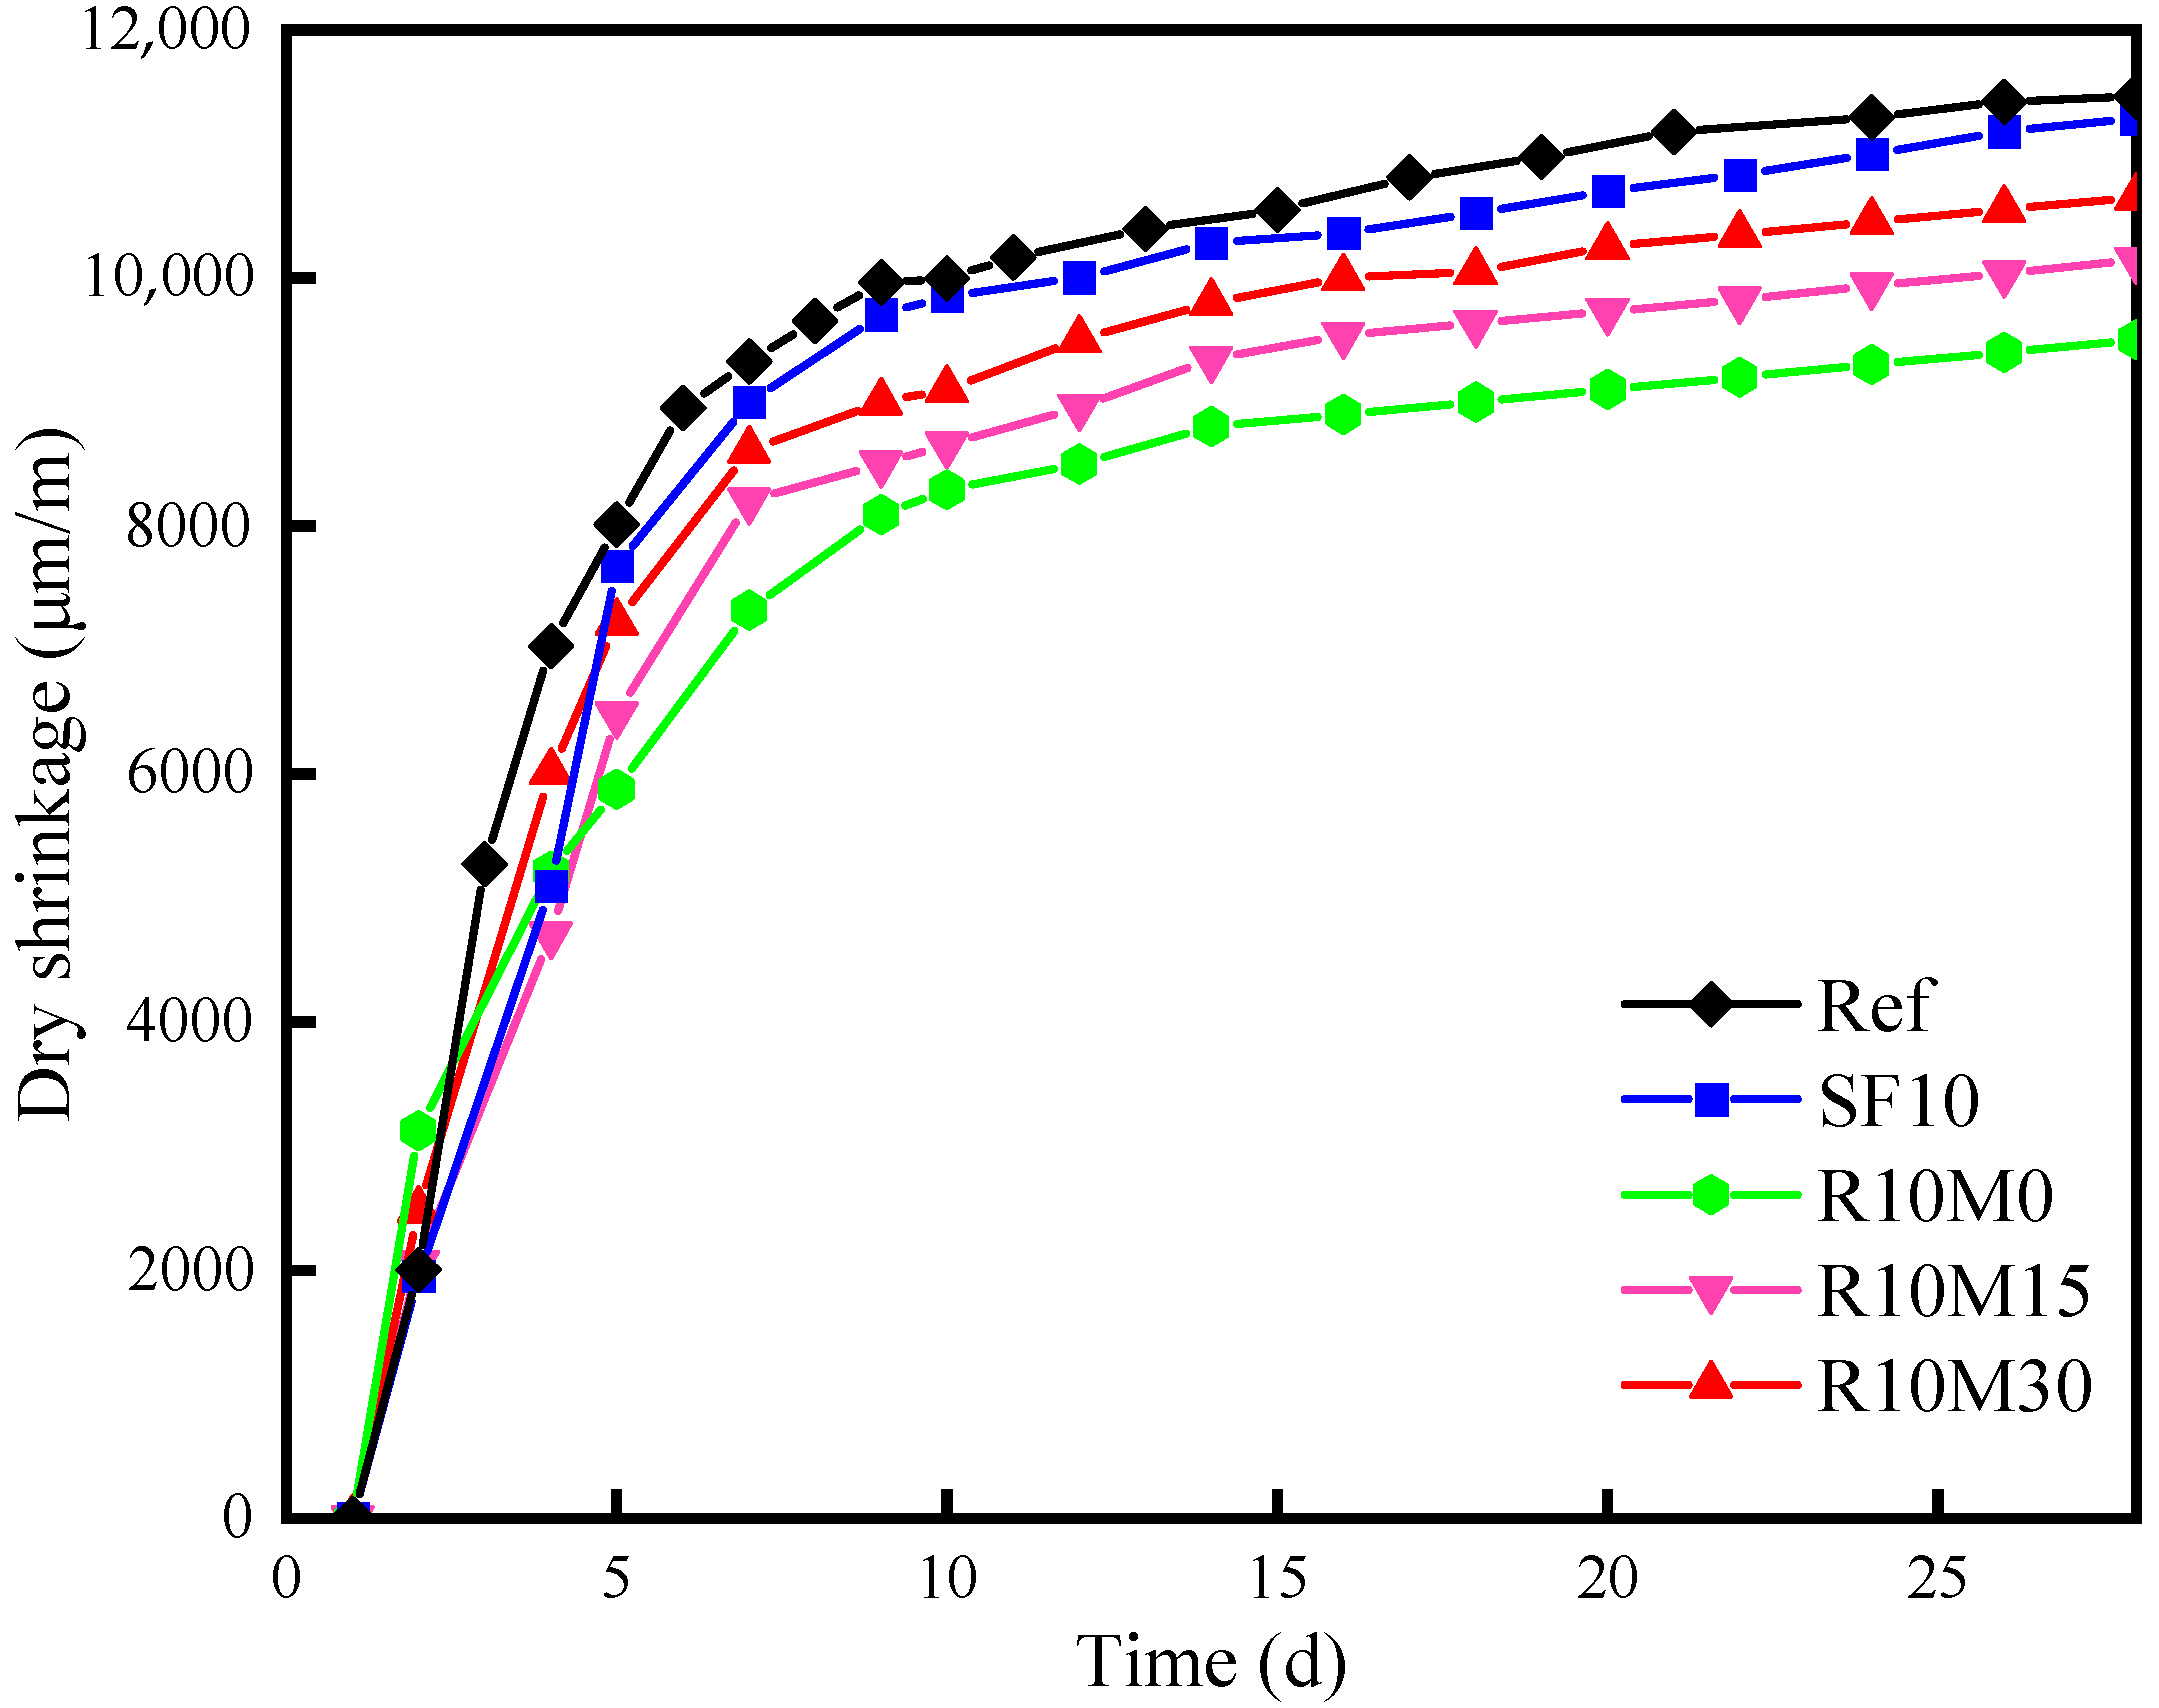
3.4.3. Drying Shrinkage
3.5. Mechanical Property
4. Discussion
4.1. Hydration Kinetics
4.2. Shrinkage-Mitigating Mechanism of RHA
5. Conclusions
- The incorporation of RHA will cause the fluidity loss of AAS pastes, and the loss degree decreases with the decrease of RHA average pore diameter. Fluidity loss is induced by water uptake of internal pores. In addition, RHA can prolong the setting time of AAS pastes, and the setting time is shortened with the decrease of the average pore diameter;
- RHA retards the arrival time of hydration reaction peak of AAS pastes, while this retarding effect is mitigated with the decreased average pore diameter of RHA. However, RHA increases the cumulative hydration heat of AAS pastes. In addition, the hydration degree of AAS pastes is also promoted by adding RHA;
- The incorporation of RHA increases the chemical shrinkage of AAS pastes. However, RHA can alleviate autogenous shrinkage at 7 days and drying shrinkage at 28 days of AAS pastes. The alleviating effect deteriorated with the decrease of the average pore diameter of RHA;
- The incorporation of RHA coarsens the early pore structure of AAS pastes and increased the total porosity of samples. However, with the progress of hydration reaction, the internal pore structure is refined at later age, and the total porosity decreases;
- The incorporation of RHA can significantly enhance the compressive strength of AAS pastes at later age. For example, by adding 10% RHA with a D50 of 8.3 μm, the compressive strength of AAS pastes can reach 155 MPa at 28 days, increasing by 13 MPa compared with that of AAS pastes without RHA.
Author Contributions
Funding
Institutional Review Board Statement
Informed Consent Statement
Data Availability Statement
Conflicts of Interest
References
- Chen, P.; Shi, Z.; Cao, S.; Liu, P.; Rong, X.; Wang, L. Mechanical properties of alkali-activated slag lightweight aggregate concrete. J. Clean. Prod. 2022, 359, 132136. [Google Scholar] [CrossRef]
- Sun, Y.; Zhang, S.; Rahul, A.V.; Tao, Y.; Van Bockstaele, F.; Dewettinck, K.; Ye, G.; De Schutter, G. Rheology of alkali-activated slag pastes: New insight from microstructural investigations by cryo-SEM. Cem. Concr. Res. 2022, 157, 106806. [Google Scholar] [CrossRef]
- Najm, O.; El-Hassan, H.; El-Dieb, A. Optimization of alkali-activated ladle slag composites mix design using taguchi-based TOPSIS method. Constr. Build. Mater. 2022, 327, 126946. [Google Scholar] [CrossRef]
- Araújo Júnior, N.T.; Lima, V.M.E.; Torres, S.M.; Basto, P.E.A.; Melo Neto, A.A. Experimental investigation of mix design for high-strength alkali-activated slag concrete. Constr. Build. Mater. 2021, 291, 123387. [Google Scholar] [CrossRef]
- Zheng, X.; Liu, H.; You, S.; Easa, S.; Cheng, K.; Chen, Z.; Ji, T. Cracking resistance and sustainability assessment of alkali-activated slag concrete incorporating lightweight aggregate. Cem. Concr. Compos. 2022, 131, 104556. [Google Scholar] [CrossRef]
- Sun, J.; Zhang, Z.; Zhuang, S.; He, W. Hydration properties and microstructure characteristics of alkali–activated steel slag. Constr. Build. Mater. 2020, 241, 118141. [Google Scholar] [CrossRef]
- Puertas, F.; Torres-Carrasco, M. Use of glass waste as an activator in the preparation of alkali-activated slag. Mechanical strength and paste characterisation. Cem. Concr. Res. 2014, 57, 95–104. [Google Scholar] [CrossRef]
- Collins, F.G.; Sanjayan, J.G. Workability and mechanical properties of alkali activated slag concrete. Cem. Concr. Res. 1999, 29, 455–458. [Google Scholar] [CrossRef]
- Rashad, A.M.; Zeedan, S.R.; Hassan, A.A. Influence of the activator concentration of sodium silicate on the thermal properties of alkali-activated slag pastes. Constr. Build. Mater. 2016, 102, 811–820. [Google Scholar] [CrossRef]
- Puertas, F.; Amat, T.; Fernández-Jiménez, A.; Vázquez, T. Mechanical and durable behaviour of alkaline cement mortars reinforced with polypropylene fibres. Cem. Concr. Res. 2003, 33, 2031–2036. [Google Scholar] [CrossRef]
- Bakhareva, T.; Sanjayana, J.G.; Cheng, Y.-B. Sulfate attack on alkali-activated slag concrete. Cem. Concr. Res. 2002, 32, 211–216. [Google Scholar] [CrossRef]
- Li, Z.; Nedeljković, M.; Chen, B.; Ye, G. Mitigating the autogenous shrinkage of alkali-activated slag by metakaolin. Cem. Concr. Res. 2019, 122, 30–41. [Google Scholar] [CrossRef]
- Zheng, W.; He, J.; Tong, Y.; He, J.; Song, X.; Sang, G. Investigation of effects of reactive MgO on autogenous and drying shrinkage of near-neutral salt activated slag cement. Ceram. Int. 2022, 48, 5518–5526. [Google Scholar] [CrossRef]
- Qu, Z.Y.; Yu, Q.; Ji, Y.D.; Gauvin, F.; Voets, I.K. Mitigating shrinkage of alkali activated slag with biofilm. Cem. Concr. Res. 2020, 138, 106234. [Google Scholar] [CrossRef]
- Provis, J.L.; van Deventer, J.S.J. Geopolymers and Other Alkali-Activated Materials. In Lea’s Chemistry of Cement and Concrete; 2019; pp. 779–805. Available online: https://www.sciencedirect.com/science/article/pii/B9780081007730000162?via%3Dihub (accessed on 2 April 2023). [CrossRef]
- Zhang, S.; Niu, D.; Luo, D. Enhanced hydration and mechanical properties of cement-based materials with steel slag modified by water glass. J. Mater. Res. Technol. 2022, 21, 1830–1842. [Google Scholar] [CrossRef]
- Sun, B.; Ye, G.; de Schutter, G. A review: Reaction mechanism and strength of slag and fly ash-based alkali-activated materials. Constr. Build. Mater. 2022, 326, 126843. [Google Scholar] [CrossRef]
- Ng, C.; Alengaram, U.J.; Wong, L.S.; Mo, K.H.; Jumaat, M.Z.; Ramesh, S. A review on microstructural study and compressive strength of geopolymer mortar, paste and concrete. Constr. Build. Mater. 2018, 186, 550–576. [Google Scholar] [CrossRef]
- Eliche-Quesada, D.; Calero-Rodríguez, A.; Bonet-Martínez, E.; Pérez-Villarejo, L.; Sánchez-Soto, P.J. Geopolymers made from metakaolin sources, partially replaced by Spanish clays and biomass bottom ash. J. Build. Eng. 2021, 40, 102761. [Google Scholar] [CrossRef]
- Pérez-Villarejo, L.; Bonet-Martínez, E.; Eliche-Quesada, D.; Sánchez-Soto, P.J.; Rincón-López, J.M.; Castro-Galiano, E. Biomass fly ash and aluminium industry slags-based geopolymers. Mater. Lett. 2018, 229, 6–12. [Google Scholar] [CrossRef]
- Thomas, B.S.; Yang, J.; Mo, K.H.; Abdalla, J.A.; Hawileh, R.A.; Ariyachandra, E. Biomass ashes from agricultural wastes as supplementary cementitious materials or aggregate replacement in cement/geopolymer concrete: A comprehensive review. J. Build. Eng. 2021, 40, 102332. [Google Scholar] [CrossRef]
- Anto, G.; Athira, K.; Nair, N.A.; Sai, T.Y.; Yadav, A.L.; Sairam, V. Mechanical properties and durability of ternary blended cement paste containing rice husk ash and nano silica. Constr. Build. Mater. 2022, 342, 127732. [Google Scholar] [CrossRef]
- Chindasiriphan, P.; Yokota, H.; Kawabata, Y.; Pimpakan, P. Combined effect of rice husk ash and superabsorbent polymer on self-healing capability of mortar. Constr. Build. Mater. 2022, 338, 127588. [Google Scholar] [CrossRef]
- Zhang, Z.; Liu, S.; Yang, F.; Weng, Y.; Qian, S. Sustainable high strength, high ductility engineered cementitious composites (ECC) with substitution of cement by rice husk ash. J. Clean. Prod. 2021, 317, 128379. [Google Scholar] [CrossRef]
- Hu, L.; He, Z.; Zhang, S. Sustainable use of rice husk ash in cement-based materials: Environmental evaluation and performance improvement. J. Clean. Prod. 2020, 264, 121744. [Google Scholar] [CrossRef]
- Van, V.-T.-A.; Rößler, C.; Bui, D.-D.; Ludwig, H.-M. Mesoporous structure and pozzolanic reactivity of rice husk ash in cementitious system. Constr. Build. Mater. 2013, 43, 208–216. [Google Scholar] [CrossRef]
- Zhang, Z.; Yang, F.; Liu, J.-C.; Wang, S. Eco-friendly high strength, high ductility engineered cementitious composites (ECC) with substitution of fly ash by rice husk ash. Cem. Concr. Res. 2020, 137, 106200. [Google Scholar] [CrossRef]
- Wansom, S.; Janjaturaphan, S.; Sinthupinyo, S. Characterizing pozzolanic activity of rice husk ash by impedance spectroscopy. Cem. Concr. Res. 2010, 40, 1714–1722. [Google Scholar] [CrossRef]
- Nair, D.G.; Jagadish, K.S.; Fraaij, A. Reactive pozzolanas from rice husk ash: An alternative to cement for rural housing. Cem. Concr. Res. 2006, 36, 1062–1071. [Google Scholar] [CrossRef]
- Zhu, H.; Zhai, M.; Liang, G.; Li, H.; Wu, Q.; Zhang, C.; Hua, S. Experimental study on the freezing resistance and microstructure of alkali-activated slag in the presence of rice husk ash. J. Build. Eng. 2021, 38, 102173. [Google Scholar] [CrossRef]
- Vo, D.-H.; Hwang, C.-L.; Yehualaw, M.D.; Liao, M.-C. The influence of MgO addition on the performance of alkali-activated materials with slag−rice husk ash blending. J. Build. Eng. 2020, 33, 101605. [Google Scholar] [CrossRef]
- Alomayri, T.; Adesina, A.; Das, S. Influence of amorphous raw rice husk ash as precursor and curing condition on the performance of alkali activated concrete. Case Stud. Constr. Mater. 2021, 15, e00777. [Google Scholar] [CrossRef]
- GB/T 8077-2012; Test Method for the Homogeneity of Concrete Admixtures. China Building Materials Academy: Beijing, China, 2012.
- GB/T 1346-2011; Test Methods for Water Requirement of Normal Consistency, Setting Time and Soundness of the Portland Cement. China Building Materials Academy: Beijing, China, 2011.
- ASTM C1608-17; Standard Test Method for Chemical Shrinkage of Hydraulic Cement Pastes. ASTM: West Conshohocken, PA, USA, 2017.
- ASTM C1968; Standard Test Method for Autogenous Strain of Cement Paste and Mortar. ASTM: West Conshohocken, PA, USA, 2013; pp. 1–8.
- GB/T 50082-2009; Standard Test Method for Long-Term Performance and Durability of Ordinary Concrete. China Building Materials Academy: Beijing, China, 2009.
- GB/T 17671-1999; Method of Testing Cements-Determination of Strength. China Building Materials Academy: Beijing, China, 1999.
- Saludung, A.; Azeyanagi, T.; Ogawa, Y.; Kawai, K. Effect of silica fume on efflorescence formation and alkali leaching of alkali-activated slag. J. Clean. Prod. 2021, 315, 128210. [Google Scholar] [CrossRef]
- de Sensale, G.R.; Ribeiro, A.B.; Gonçalves, A. Effects of RHA on autogenous shrinkage of Portland cement pastes. Cem. Concr. Compos. 2008, 30, 892–897. [Google Scholar] [CrossRef]
- Chen, W.; Li, B.; Wang, J.; Thom, N. Effects of alkali dosage and silicate modulus on autogenous shrinkage of alkali-activated slag cement paste. Cem. Concr. Res. 2020, 141, 106322. [Google Scholar] [CrossRef]
- Uzal, B.; Turanlı, L.; Yücel, H.; Göncüoğlu, M.C.; Çulfaz, A. Pozzolanic activity of clinoptilolite: A comparative study with silica fume, fly ash and a non-zeolitic natural pozzolan. Cem. Concr. Res. 2010, 40, 398–404. [Google Scholar] [CrossRef]
- Liang, G.; Zhu, H.; Li, H.; Liu, T.; Guo, H. Comparative study on the effects of rice husk ash and silica fume on the freezing resistance of metakaolin-based geopolymer. Constr. Build. Mater. 2021, 293, 123486. [Google Scholar] [CrossRef]
- Gao, X.; Yu, Q.L.; Brouwers, H.J.H. Apply 29Si, 27Al MAS NMR and selective dissolution in identifying the reaction degree of alkali activated slag-fly ash composites. Ceram. Int. 2017, 43, 12408–12419. [Google Scholar] [CrossRef]
- Schneider, J.; Cincotto, M.A.; Panepucci, H. 29Si and 27Al high-resolution NMR characterization of calcium silicate hydrate phases in activated blast-furnace slag pastes. Cem. Concr. Res. 2001, 31, 993–1001. [Google Scholar] [CrossRef]
- Jeong, Y.; Yum, W.S.; Jeon, D.; Oh, J.E. Strength development and microstructural characteristics of barium hydroxide-activated ground granulated blast furnace slag. Cem. Concr. Compos. 2017, 79, 34–44. [Google Scholar] [CrossRef]
- L’Hôpital, E.; Lothenbach, B.; Le Saout, G.; Kulik, D.; Scrivener, K. Incorporation of aluminium in calcium-silicate-hydrates. Cem. Concr. Res. 2015, 75, 91–103. [Google Scholar] [CrossRef]
- Nair, D.G.; Fraaij, A.; Klaassen, A.A.K.; Kentgens, A.P.M. A structural investigation relating to the pozzolanic activity of rice husk ashes. Cem. Concr. Res. 2008, 38, 861–869. [Google Scholar] [CrossRef]
- Jiang, D.; Li, X.; Lv, Y.; Zhou, M.; He, C.; Jiang, W.; Liu, Z.; Li, C. Utilization of limestone powder and fly ash in blended cement: Rheology, strength and hydration characteristics. Constr. Build. Mater. 2019, 232, 117228. [Google Scholar] [CrossRef]
- Friedemann, K.; Stallmach, F.; Kärger, J. NMR diffusion and relaxation studies during cement hydration—A non-destructive approach for clarification of the mechanism of internal post curing of cementitious materials. Cem. Concr. Res. 2006, 36, 817–826. [Google Scholar] [CrossRef]
- Snoeck, D.; Pel, L.; De Belie, N. Superabsorbent polymers to mitigate plastic drying shrinkage in a cement paste as studied by NMR. Cem. Concr. Compos. 2018, 93, 54–62. [Google Scholar] [CrossRef]
- Nestle, N.; Kühn, A.; Friedemann, K.; Horch, C.; Stallmach, F.; Herth, G. Water balance and pore structure development in cementitious materials in internal curing with modified superabsorbent polymer studied by NMR. Micropor. Mesopor. Mater. 2009, 125, 51–57. [Google Scholar] [CrossRef]
- Van, V.-T.-A.; Rößler, C.; Bui, D.-D.; Ludwig, H.-M. Rice husk ash as both pozzolanic admixture and internal curing agent in ultra-high performance concrete. Cem. Concr. Compos. 2014, 53, 270–278. [Google Scholar] [CrossRef]
- Ramezanianpour, A.A.; Moeini, M.A. Mechanical and durability properties of alkali activated slag coating mortars containing nanosilica and silica fume. Constr. Build. Mater. 2018, 163, 611–621. [Google Scholar] [CrossRef]
- Van Tuan, N.; Ye, G.; van Breugel, K.; Copuroglu, O. Hydration and microstructure of ultra high performance concrete incorporating rice husk ash. Cem. Concr. Res. 2011, 41, 1104–1111. [Google Scholar] [CrossRef]
- Li, Y.; Yin, J.; Yuan, Q.; Huang, L.; Li, J. Greener strain-hardening cementitious composites (SHCC) with a novel alkali-activated cement. Cem. Concr. Compos. 2022, 134, 104735. [Google Scholar] [CrossRef]
- Rostami, M.; Behfarnia, K. The effect of silica fume on durability of alkali activated slag concrete. Constr. Build. Mater. 2017, 134, 262–268. [Google Scholar] [CrossRef]


| Materials | CaO | SiO2 | Al2O3 | Na2O | K2O | MgO | SO3 | P2O5 | Fe2O3 | LOI |
|---|---|---|---|---|---|---|---|---|---|---|
| Slag | 32.63 | 38.96 | 15.46 | 0.30 | 0.40 | 7.50 | 2.55 | - | 0.34 | 1.29 |
| SF | 0.03 | 96.80 | 0.15 | - | - | - | - | 0.03 | 0.2 | 0.79 |
| RHA | 0.81 | 94.63 | 0.09 | 0.06 | 1.33 | 0.50 | 0.40 | 0.60 | - | 1.3 |
| Sample No. | Slag/g | Water Glass/g | NaOH/g | NSP/g | SF/g | RHA/g | W/B |
|---|---|---|---|---|---|---|---|
| Ref | 450 | 183.6 | 26.6 | 4.5 | 0 | 0 | 0.5 |
| SF10 | 405 | 183.6 | 26.6 | 4.5 | 45 | 0 | 0.5 |
| R10M0 | 405 | 183.6 | 26.6 | 4.5 | 0 | 45 | 0.5 |
| R10M15 | 405 | 183.6 | 26.6 | 4.5 | 0 | 45 | 0.5 |
| R10M30 | 405 | 183.6 | 26.6 | 4.5 | 0 | 45 | 0.5 |
| Sample | Q0 (%) | Q1-a (%) | Q1-b (%) | Q2(1Al) (%) | Q2-b (%) | Q2-p (%) | Q4 (%) | Rs (%) |
|---|---|---|---|---|---|---|---|---|
| Ref | 39.36 | 9.98 | 5.11 | 20.82 | 20.50 | 4.23 | 0 | 60.64 |
| SF10 | 29.99 | 4.92 | 17.39 | 14.55 | 26.88 | 4.16 | 2.11 | 67.90 |
| R10M0 | 44.64 | 8.3 | 5.36 | 8.22 | 15.18 | 18.3 | 0 | 55.36 |
| R10M15 | 30.69 | 7.53 | 7.59 | 14.87 | 23.78 | 15.55 | 0 | 69.31 |
| R10M30 | 30.03 | 8.07 | 15.92 | 18.49 | 18.97 | 8.54 | 0 | 69.97 |
Disclaimer/Publisher’s Note: The statements, opinions and data contained in all publications are solely those of the individual author(s) and contributor(s) and not of MDPI and/or the editor(s). MDPI and/or the editor(s) disclaim responsibility for any injury to people or property resulting from any ideas, methods, instructions or products referred to in the content. |
© 2023 by the authors. Licensee MDPI, Basel, Switzerland. This article is an open access article distributed under the terms and conditions of the Creative Commons Attribution (CC BY) license (https://creativecommons.org/licenses/by/4.0/).
Share and Cite
Tian, B.; Li, X.; Lv, Y.; Xu, J.; Ma, W.; He, C.; Chen, Y.; Jian, S.; Wang, W.; Zhang, C.; et al. Effect of Rice Husk Ash on the Properties of Alkali-Activated Slag Pastes: Shrinkage, Hydration and Mechanical Property. Materials 2023, 16, 3148. https://doi.org/10.3390/ma16083148
Tian B, Li X, Lv Y, Xu J, Ma W, He C, Chen Y, Jian S, Wang W, Zhang C, et al. Effect of Rice Husk Ash on the Properties of Alkali-Activated Slag Pastes: Shrinkage, Hydration and Mechanical Property. Materials. 2023; 16(8):3148. https://doi.org/10.3390/ma16083148
Chicago/Turabian StyleTian, Bo, Xiangguo Li, Yang Lv, Jinsheng Xu, Weinan Ma, Chenhao He, Yang Chen, Shouwei Jian, Weizhen Wang, Cheng Zhang, and et al. 2023. "Effect of Rice Husk Ash on the Properties of Alkali-Activated Slag Pastes: Shrinkage, Hydration and Mechanical Property" Materials 16, no. 8: 3148. https://doi.org/10.3390/ma16083148
APA StyleTian, B., Li, X., Lv, Y., Xu, J., Ma, W., He, C., Chen, Y., Jian, S., Wang, W., Zhang, C., & Wu, K. (2023). Effect of Rice Husk Ash on the Properties of Alkali-Activated Slag Pastes: Shrinkage, Hydration and Mechanical Property. Materials, 16(8), 3148. https://doi.org/10.3390/ma16083148