Abstract
We report the synthesis of Fe3O4/graphene (Fe3O4/Gr) nanocomposite for highly selective and highly sensitive peroxide sensor application. The nanocomposites were produced by a modified co-precipitation method. Further, structural, chemical, and morphological characterization of the Fe3O4/Gr was investigated by standard characterization techniques, such as X-ray diffraction (XRD), scanning electron microscopy (SEM), transmission electron microscope (TEM) and high-resolution TEM (HRTEM), Fourier transform infrared (FTIR), and X-ray photoelectron spectroscopy (XPS). The average crystal size of Fe3O4 nanoparticles was calculated as 14.5 nm. Moreover, nanocomposite (Fe3O4/Gr) was employed to fabricate the flexible electrode using polymeric carbon fiber cloth or carbon cloth (pCFC or CC) as support. The electrochemical performance of as-fabricated Fe3O4/Gr/CC was evaluated toward H2O2 with excellent electrocatalytic activity. It was found that Fe3O4/Gr/CC-based electrodes show a good linear range, high sensitivity, and a low detection limit for H2O2 detection. The linear range for the optimized sensor was found to be in the range of 10–110 μM and limit of detection was calculated as 4.79 μM with a sensitivity of 0.037 µA μM−1 cm−2. The cost-effective materials used in this work as compared to noble metals provide satisfactory results. As well as showing high stability, the proposed biosensor is also highly reproducible.
1. Introduction
Nanocomposites (NCs) are used in many applications including adsorption and photodegradation of dyes [1,2,3], pharmaceuticals [4,5], as well as in computers and electronics [6,7], sensors [8,9], heat transfer [10,11], energy storage, renewable energy and supercapacitors [12,13,14]. NCs are also explored in several applications, such as, drug delivery [15,16], hyperthermia [17,18], tissue engineering [19,20], biosensing [21,22,23], energy conversion, and microwave adsorption [24,25]. The NCs are considered as nanomatrix for two or more nanoscale materials which present better performance as compared to their individual counterparts [26]. NCs materials have advantageous and unique properties owing to their boosted physical and chemical properties, high surface area, greater electron transfers ability, and exclusive optical properties [27,28].
Recently, NCs developed using carbon cloth aligned with different nanoparticles for various electrochemical applications. Carbon fiber cloth or/carbon cloth (CFC or/CC) is an alternative to the conventional glassy carbon electrode, screen printed, and carbon paste which are used to fabricate working electrodes in electrochemical-based techniques [29]. The carbon fiber cloth (CFC) is usually made of the polyacrylonitrile-based carbon fiber with high conductivity, excellent flexibility and high porosity with adjustable size proper-ty [29,30]. The CC is employed in various electrochemical-based techniques such as fuel cells, supercapacitors, and sensors and biosensors applications [31,32,33].
Khorablou et al. [30] modified carbon cloth with Au nanoparticles and polythiophene for the detection of methadone. The prepared flexible NCs bear excellent sensitivity and selectivity toward methadone. Similarly, Liu et al. [34] have prepared Cu-coordinated molecularly imprinted polymers (Cu-MIP) and flexible carbon-cloth-supported Ag nanoparticles. The prepared materials were used as working electrodes for detection of perphenazine. The sensor provides satisfactory results with high sensitivity, good selectivity, and promising reproducibility and anti-interference ability. Ahmed et al. [35] proposed a histamine electrochemical biosensor based on a MIP, fabricated using Au inverse opal electrode. To improve the electrical characteristics of substrate, 3,4-ethylenedioxythiophene (EDOT) was electropolymerized on a scaffold of Au electrode. The biosensor exhibited high selectivity, good stability with a limit of detection (LOD) of 1.07 nm, and a linear response from 50 nm–500 µm. Moreover, Xu et al. [36] have proposed an electrochemical enzyme-free biosensor for glucose detection using conductive Ni/Co bimetal metal oxide framework (MOF) which was grown on carbon cloth using facile hydrothermal method. The proposed flexible sensor exhibits a low detection limit of 100 nM (S/N = 3), excellent linearity range of 0.3 μM–2.312 mM, high sensitivity of 3250 μA mM−1 cm−2, and a fast response time of 2 s under optimized conditions.
Among the most important sensors, the hydrogen peroxide (H2O2) sensor is in high demand and studied by various researchers. The precise H2O2 detection is of important concern due to its involvement in many fields, such as, chemical, biological, pharmaceuticals, clinical, environmental, and food processing industry. Therefore, it is necessary to have a H2O2 sensor with high sensitivity, good reproducibility, fast response, and high stability [37,38]. The sensor based on Fe3O4 shows excellent stability and electro-catalytic action against a different type of sample [37]. Zhang et al. designed the electrochemical sensor from the nanoparticles of iron oxide-polymer for the detection of H2O2. Cao et al. employed the co-precipitation method for the preparation of iron oxide NPs and characterized them by several techniques (EDX, SEM, and XRD). Fe3O4 NPs-based electrode materials showed a good response against the detection of H2O2. For the detection of H2O2, high sensitivity and good limit of detection were found [38]. Lin et al. have used the Fe3O4 and iron oxide/chitosan-based sensor for the detection of H2O2 in buffer solution. The electro-catalytic performance was measured by cyclic voltammetry at low voltage and also checks the response of H2O2 with the help of improved glassy carbon (GC) electrode with Fe3O4. The improved electrode of iron oxide/chitosan revealed good sensitivity and high stability with a considerable limit of detection [39].
In another study, Cao et al. used a co-precipitation method for the fabrication of NCs of ferric oxide-ferrous oxide and analyzed by different techniques (EDX, TEM, SEM, and XRD). The prepared Fe3O4-Fe2O3 is used as an electrode for the detection of hydrogen peroxide and finds a LOD of 200 μM in 10 mM buffer solution at pH 7 [40]. Ates et al. fabricated NCs materials from biochar (BC) and Fe3O4 (Fe) and pasted them on the glassy carbon for the detection of H2O2. For sensing H2O2 in the real sample, the detection limit was arranged between 0.5 mM and 10 mM. From the results of reproducibility and sensitivity, it is clearly shown that Fe3O4-biochar is a good sensing material for the detection of H2O2 [41]. Cui et al. have also used the co-precipitation method for the fabrication of NCs of cobalt-doped iron oxide and characterized it by several techniques (SEM, XRD, and EDX). The SEM results show the spinal shape NPs forms of Co-doped Fe3O4 and LOD of H2O2 were found at 10 mM with a pH of 7 [42]. Sun et al. employed dumbbell-shaped Pt- and Pd-doped iron oxide NPs for the detection of H2O2 in buffer solution. Different impurities of Pt and Pd in Fe3O4 were used for H2O2 sensing and found the LOD of 5 × 10⁻⁹ M and analyzed that NPs of Pd-Pt-Fe3O4 are excellent for the detection of H2O2 in the real sample as well as in the biomedical field [43]. Xu et al. employed the dual mode sensor (colorimetric sensor and electrochemical sensor) for the detection of H2O2 in the linear range from 1.0 μM to 120 μM. They prepared the NCs of iron oxide-molybdenum disulfide-gold (Fe3O4-MoS2-Au). The limit of detection from electrochemical (EC) and colorimetric sensing was 0.08 μM and 0.109 μM, respectively [44].
Iron oxide NPs, despite their large surface area, tend to aggregate due to large magnetic dipole interaction. Therefore, iron oxide NPs-based sensors show poor sensing performance [45]. Iron oxide nanoparticles (NPs) with carbon-based compounds result in excellent biosensor applications. Due to the unique electrochemical properties of various nano allotropes of carbon reinforced with Fe3O4 NPs, they show better performance for the detection of H2O2. Zhao et al. [46] have demonstrated a real sample H2O2 sensor based on 3D graphene (Gr)-supported Fe3O4 quantum dots. H2O2 released from living cells is in very small quantities so it is a huge challenge to detect in situ detection of H2O2. The Fe3O4/3DGr NCs was found to be very efficient in situ detection with an outstanding reproducibility and very high sensitivity and selectivity of 274.15 mAM−1cm−2. The sensor also revealed LOD of ~78 nm and a fast response time of 2.8 s. In a similar study, Yousefinejad et al. [47] have proposed a novel NCs for the detection of H2O2 in nanomolar range. The proposed NCs comprise carbon dots and iron oxide (Fe3O4) NPs. The LOD for hydrogen peroxide was determined to be 1.0 × 10⁻⁹ M and linear range was found to be from 1.0 × 10⁻⁸ M to1.0 × 10−3 M.
Cai et al. have prepared the ternary NCs materials of GO (graphene oxide, Fe3O4 and PG (pristine graphene) and analyzed by transmission electron microscope (TEM) which clears that the NPs of Fe3O4 are arranged on the sheets of PG and GO. They employed this sensor for the detection of H2O2 and dopamine and found the LOD of 90 nM for hydrogen peroxide and 180 nM for dopamine [48]. Zhao et al. have synthesized a sensor by spraying the particles of platinum on NCs of Fe3O4/rGO and checked the electrochemical performance peroxide sensing. This sensor is very fast and sensitive for the detection of H2O2 and also very stable and compatible as compared to the other reported sensors. The limit of detection was 1.58 × 10⁻⁶ M, sensitivity was 6.9 μA mM−1 [49]. Cai et al. also made the ternary materials of GO (graphene oxide), PG (pristine graphene), and Fe3O4 by co-precipitation method and checked by SEM and XPS. With the help of SEM, it concludes that the ternary compound of GO, PE, and Fe3O4 has outstanding performance for the detection of dopamine as compared to the binary compound of Go and Fe3O4. The finding limit of detection by this sensor was about 370 nM [50]. Hence, carbonaceous materials provide an excellent platform for biosensors due to their excellent thermal conductivity, high charge mobility and extraordinary electrochemical catalytic activity and shielding properties [51]. However, there is not much literature available on Fe3O4/Gr NCs for H2O2 sensing. Therefore, due to the unique chemical structure and electronic properties of NCs materials, it is required to explore such NCs prepared by different methods for H2O2 sensing.
To further explore the sensing abilities of Fe3O4/Gr NC, we have successfully synthesized these NCs via chemical co-precipitation method. The electrochemical performance of bare electrodes, Fe3O4/CC and Fe3O4/Gr NCs, was analyzed. All sensing parameters such as, LOD, sensitivity, selectivity, stability, and reproducibility were performed. Fe3O4/Gr/CC shows the better sensing ability such as high selectivity and high reproducibility toward H2O2. Moreover, Fe3O4/Gr/CC NCs-based flexible electrodes show a good linear range and a low detection limit for H2O2 detection.
2. Experimental
2.1. Materials Used in Synthesis
To obtain Fe3+/Fe2+ ions we have used 99.9% pure ferric chloride hexahydrate and ferrous sulfate heptahydrate salt which was procured from Sigma-Aldrich (St. Louis, MO, USA). Graphene nanopowder was purchased from Iljin Nano Tech, Seoul, Republic of Korea. HCl (35%) and H2O2 were purchased from Sinopharm Chemical Reagent Co., Ltd., (Shanghai, China). Polymeric carbon fiber cloth was purchased from AvCarb Material Solutions (Lowell, MA, USA) and polymeric carbon fiber cloth (pCFC or CC) with a thickness of 356 microns and basis weight of 132 g/m2, grade of HCB with a plain weave construction.
2.2. Synthesis of Nanocomposite
Nanocomposite was synthesized by conventional chemical co-precipitation method. First, in a separate beaker, both salts of iron (Fe2+/Fe3+) were taken in 1:2 ratios and dissolved in distilled water to obtain a clear aqueous solution. Second, ultrasonic treatment was given to as-received graphene powder in distilled water for 3 h and solid graphene sample was collected from aqueous solution using a centrifuge at 3000× g RPM. Both samples of iron oxide were transferred into the aqua treated graphene suspension and the mixtures were stirred for 30 min. A 2M NaOH aqueous solution was added into the mixture drop by drop with continuous stirring until the whole solution turns into black precipitates. Additionally, 10 mL of hydrazine hydrate was added to the solution to stop the oxidation of graphene into graphene oxide during NCs preparation. The precipitates obtained from nanocomposite were washed several times by using distilled water and dried in an oven at 70–80 °C for 4–5 h. A schematic representation of Fe3O4/Gr NCs fabrication is illustrated in Scheme 1.
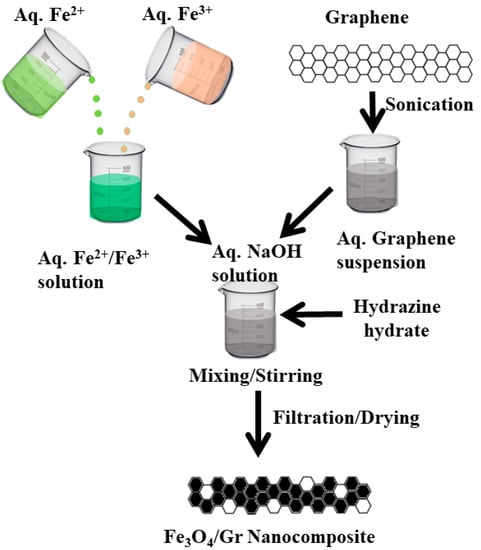
Scheme 1.
Schematic representation for the fabrication of Fe3O4/Gr.
2.3. Characterization
The investigation of nanocomposite was done by X-ray diffraction using Cu Kα radiation (λ = 1.54156 Å) with D8AαS advanced X-ray diffractometer to obtain phase and crystallite size. Particle size and morphology were observed by scanning electron microscopy (FESEM, JEOL, JSM-7600F, Tokyo, Japan). The chemical bonding characteristics were explored using Fourier transform infrared (FTIR) spectroscopy (ATR-FT-IR model Nicolet IS 10). For TEM images, a transmission electron microscope (TEM/HRTEM, JEOL, JEM-2100F) was used and operated at 120 kV for nanocomposite samples. A X-ray photoelectron spectroscopy was carried out by ESCALAB250 equipment outfitted with an Al K X-ray source.
2.4. Electrode Fabrication Process
For the fabrication of working electrodes, the surface of the CC is washed with ethanol/water under sonication and dried at room temperature. The 100 mg powder of each material (GO, Gr, and Fe3O4/Gr) is dispersed individually in the 1 mL of Nafion solution (binder) in order to generate a well dispersed slurry. The prepared slurry was dropped carefully onto the CC (1 cm × 2 cm) with a marked area of 1 cm2 and dried at room temperature. The fabricated electrodes were denoted as GO/CC, Gr/CC, and Fe3O4/Gr/CC and results were compared with bare CC. The fabricated flexible electrodes such as GO/CC, Gr/CC, and Fe3O4/Gr/CC were used as the working electrodes for the electrochemical measurements. The electrochemical tests were carried out on a potentiostat (VersaSTAT 3, Princeton Research, Princeton, NJ, USA) with a standard three electrode system. The Ag/AgCl was used as a reference electrode (filled with 3.0 M KCl) and a platinum gauge as a counter electrode.
3. Results and Discussion
3.1. X-ray Diffraction (XRD)
From the XRD patterns, a significant peak of graphene was observed at two theta angles of 26.49° corresponding to the (002) plane of graphene [52], as represented in Figure 1a. The rest of the peaks are related to iron oxide which were observed at 30.19°, 35.55°, 43.18°, 53.63°, 57.11°, 62.82°, and 74.42° corresponding to (220), (311), (400), (422), (511), (440), and (622) crystal planes respectively. The iron oxide peaks intensity and relevant angles match with the JCPDS card no. 01-082-1553 which assures the cubic spinel structure and crystalline nature of the powder nanocomposite sample [53]. The crystal size was calculated using Scherrer equation which was found to be 14.5 nm.
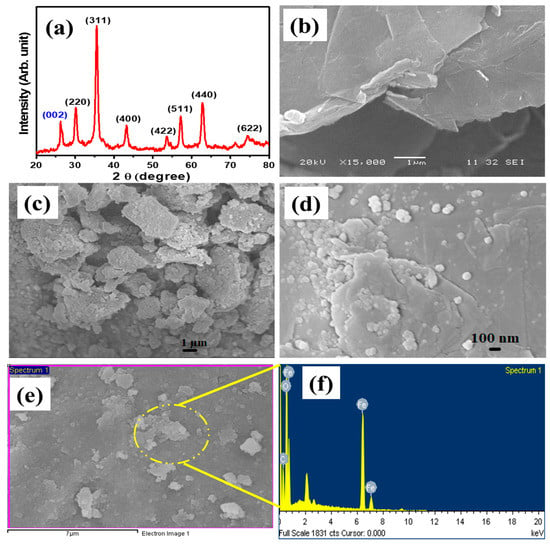
Figure 1.
(a) XRD pattern of Fe3O4/Gr nanocomposite, (b) SEM image of graphene, (c,d) SEM image of Fe3O4/Gr nanocomposite, (e,f) SEM image and EDS analysis.
3.2. Scanning Electron Microscopy (SEM) and Energy Dispersive X-ray Spectroscopy (EDX)
The morphology of graphene and Fe3O4/Gr NCs was studied and represented in Figure 1. The Figure 1b shows the SEM image of graphene. The SEM image was taken with a magnification of 15,000 times under an electron beam accelerated with a 20 kV. The image shows multiple graphene sheets spread over each other. At the edge, many aggregates of graphene sheets with multi thick layers are visible. There may be some functional groups found attached on the surface of graphene sheets. It may be due to the fact that during the synthesis process some functional groups such as (−OH and −COOH) still get attached and they can tune the electronic and chemical properties of graphene [54]. The SEM image in Figure 1c shows that at low magnification, several nanosheets of graphene can be seen decorated with Fe3O4 NPs. The spherical shape of Fe3O4 NPs in the form of clusters is grafted onto the nanosheets of graphene. Further analysis shows the random distribution of various clusters of Fe3O4 NPs on the graphene (Figure 1d). The nanospheres of iron oxide are spread on the surface of graphene sheets individually and most of the particles are aggregated. These clusters are helpful during electrochemical reactions by providing a more reactive site and extending the link of the Fe3O4 nanospheres with the analytes [55]. Additionally, SEM image, FTIR and RAMAN spectra are presented in Figure 2.
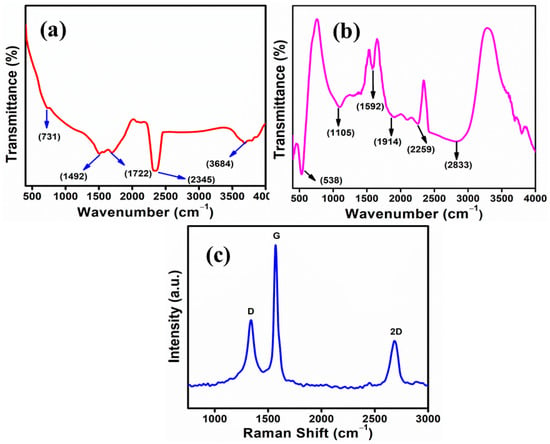
Figure 2.
(a) FTIR spectra of graphene, (b) FTIR spectra of Fe3O4/Gr nanocomposite, and (c) RAMAN spectra of graphene.
The standard method for measuring the elemental make-up and composition of materials in the scanning or transmission electron microscope (SEM/TEM) is energy dispersive X-ray spectrometry (EDXS). EDS is typically used in place of the frequently abbreviated EDXS. An elemental breakdown of the Fe3O4/Gr nanocomposite is shown in the energy-dispersive X-ray spectra (Figure 1d,e). It thus validates the formation of Fe3O4/Gr nanocomposite. The elemental composition for Fe, O, and C atoms was obtained and presented in Table 1.

Table 1.
Elemental composition of Fe3O4/Gr nanocomposite from SEM-EDX analysis.
3.3. Fourier Transform Infrared Spectroscopy (FTIR)
NCs of iron oxide and graphene were analyzed using FTIR to identify their chemical structure. Figure 2a presents the FTIR spectra of graphene where certain peaks are visible due to the attached functional group. However, peaks at 731 cm−1, 1492 cm−1, and 1722 cm−1 appeared with weak intensity which are attributed to the C=C bending, C-H bending, and C=O stretching, respectively [56,57,58]. The other strong peak is observed at 2345 cm−1 which is attributed to the O=C=O and another band appears at 3684 cm−1 which is attributed to O-H stretching. However, these bands are due to the partial oxidation of graphene-to-graphene oxide [59]. But most of the peaks which are due to partial oxidation of graphene, vanished in Fe3O4/Gr nanocomposite. In Figure 2b, the FTIR spectrum displays the peaks of nanocomposites (Fe3O4/Graphene) at different wavenumbers. Absorption peak of Fe3O4/graphene nanocomposites is observed at 538 cm−1, 1105 cm−1, 1592 cm−1, 2259 cm−1, and 2833 cm−1. First peak appeared at 538 cm−1 denoted the stretching vibration mode of Fe-O [53,60]. Two broad absorption peaks appear at 2833 cm−1 due to the stretching of C-H mode [61] and at 1105 cm−1 represents the stretching vibration of C=C mode [53,62] while another peak appear at 1592 cm−1 also denoted the stretching vibration mode of C=C [53,63,64]. The peak observed at 2259 cm−1 specifying the stretch vibration mode of C≡C [65]. Thus, corresponding peaks are related to the FTIR spectra of Fe3O4/Gr NCs and differ from the peaks of Gr/GO used as precursor in the synthesis of NCs.
3.4. RAMAN Spectroscopy
Figure 2c presents the RAMAN spectroscopy of graphene. RAMAN analysis is a helpful technique which provides eminence features. The peak intensities, positions, and shapes of the curve give useful information in graphene and related materials [66]. From Figure 2c, we observe three different peaks appearing at 1338 cm−1, 1571 cm−1, and 2688 cm−1. The bands appearing at 1338 cm−1 and 2688 cm−1 are assigned to the D band and 2D band respectively. The band appears at 1571 cm−1 is assigned to the G band. The Id/Ig ratio was found to be less than 1 which shows that graphene has less defects [66,67]. The intensity of the 2D band is observed to be less than D and G band which explains that the graphene used in this study is the multilayer graphene (MLG) [66,67].
3.5. TEM and HRTEM Analysis
Figure 3 represents the TEM and HRTEM images of the Fe3O4/Gr matrix which analyzes the particle size and morphology of iron oxide nanoparticles. Figure 3a shows the spherical shaped Fe3O4 nanoparticles decorated on the graphene sheets ranging from 5–10 nm in size. Figure 3b demonstrates the Fe3O4 nanoparticles encircled at a point, presented in yellow color while at other points a rectangle is marked which represents the graphene sheets. Figure 3c, d is the enlargement of the point which is marked for Fe3O4 and graphene sheets respectively. The interplanar lattice space calculated for the Fe3O4 nanoparticles was found to be 0.25 nm while for graphene sheets it was calculated 0.34 nm.
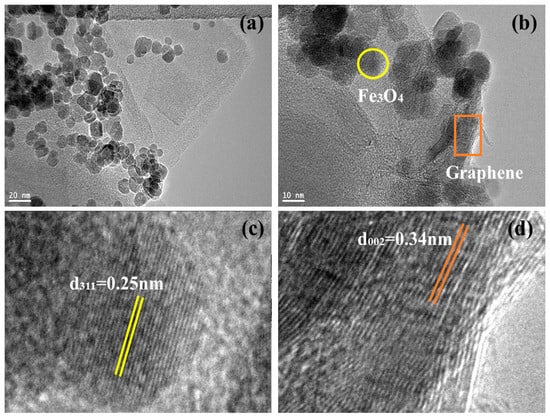
Figure 3.
(a) TEM image of Fe3O4/Gr nanocomposite, (b–d) HRTEM images of nanocomposites showing Fe3O4 nanoparticles presented in circle shape (yellow color) corresponding to (311) plane with 0.25 nm interplanar lattice spacing (c) and rectangular shape shows the graphene (orange color) corresponds to (002) plane with 0.34 nm interplanar lattice spacing, presented in (d).
3.6. X-ray Photoelectron Spectroscopy (XPS)
XPS survey scan of Fe3O4/Gr nanocomposites is shown in Figure 4a. The presence of peaks related to carbon, oxygen, and iron in the prepared material of Fe3O4/Gr nanocomposites confirms the nanocomposite synthesis. Figure 4b shows that there are 2p core levels of iron, such as, Fe 2p1/2 with binding energy of 723.9 eV and Fe 2p3/2 with binding energy of 710 eV. In Fe3O4, Fe exists in two states i.e., Fe2+ and Fe3+, so the peak observed at 710.2 eV (red color) corresponds to Fe2+ states and the peak observed at 712.6 eV (cyan color) corresponds to Fe3+ in Fe 2p3/2. Moreover, at 718 eV (green color), a satellite peak was observed, indicating that there is partial oxidation of Fe3O4 to Fe2O3 [68,69]. Figure 4c, d shows the spectrum of 1s core level of oxygen and carbon, respectively. In Figure 4c the peak of the oxygen atom appears at 530.2 eV (red color) attributed to the Fe-O bond and at 531.2 eV (green color) attributed to O-H bonds. The scan of C 1s core level spectrum is shown in Figure 4d. The peak in C 1s is obtained at 284.7 eV (red color) corresponding to C=C sp2 carbon atom and at 285.3 eV (green color) attributed to C-C sp3 atom. Moreover, the peak appearing at 287.5 eV (blue color) corresponds to C-O bonds which may be due to the functionalized group attached on graphene [70,71,72]. The XPS data also show that no reaction takes place between graphene nanosheets and iron oxide nanoparticles [11].
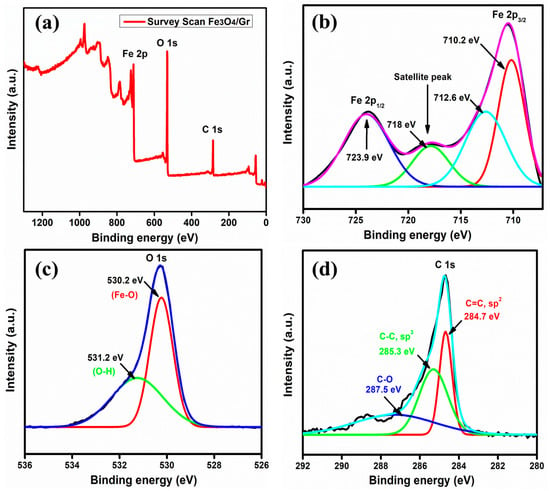
Figure 4.
XPS spectra of Fe3O4/Gr nanocomposite. (a) Survey scan, (b) Fe 2p3/2 and Fe 2p1/2, (c) O 1s, and (d) C 1s spectra.
4. Fabrication of Fe3O4/Gr /CC and Electrochemical Performances
4.1. Fabrication of Fe3O4/Gr/CC and Sensing toward H2O2
At room temperature, the fabrication of Fe3O4/Gr/CC flexible electrode was carried out and the schematic representation is shown in Scheme 2 and the detailed process is described in Section 2.4.
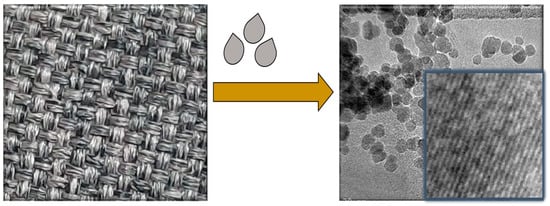
Scheme 2.
Schematic representation for the fabrication of Fe3O4/Gr/CC.
On a computer-controlled three-electrode system, the electrochemical sensing experiments of all the fabricated electrodes (GO/CC, Gr/CC, and Fe3O4/Gr/CC) were performed and results were compared with bare CC. The fabricated electrodes were employed as working electrodes, while a platinum and Ag/AgCl electrode served as the counter and reference electrode, respectively. Using cyclic voltammetry (CV), the testing of each electrode in phosphate buffer solution (PBS) was performed (Figure 5a). The fabricated electrodes (GO/CC, Gr/CC, and Fe3O4/Gr/CC) were tested in 0.1 M PBS (PH = 7.0) at a scan rate of 0.08 V s−1, the electrochemical behaviors of GO/CC, Gr/CC, and Fe3O4/Gr/CC were examined, and results were compared with CC (Figure 5a). The electro-catalytic properties of the GO/CC, Gr/CC, and Fe3O4/Gr/CC were examined in the 0.1 M PBS (pH = 7.0) at a scan rate of 0.08 V s−1 using cyclic voltammogram (CV). Figure 5a represents the current response of each electrode in PBS and shows pCC has negligible current response. Other electrodes have displayed higher current response. This not only confirms the successful modification of CC’s surface, but also shows the credibility of each electrode for electrochemical performance. This higher electrocatalytic property of Fe3O4/Gr/CC may be ascribed to the good electrocatalytic properties of the Fe3O4/Gr. Furthermore, the charge kinetics of the Fe3O4/Gr/CC, GO/CC, Gr/CC, and CC were explored in 0.1 M PBS (pH = 7.0) using electrochemical impedance spectroscopy (EIS) as shown in Figure 5b. From Figure 5b, we observe that a wide semicircle was observed for GO/CC and Gr/CC (Figure 5b), thus large charge-transfer resistance can be expected. However, CC and Fe3O4/Gr/CC displayed a low semicircle as compared to GO/CC and Gr/CC, thus would have smaller charge-transfer resistance (Figure 5b). The low-frequency portions of the EIS plot with smaller semicircles of Fe3O4/Gr/CC have better conducting properties with the diffusion-controlled process and demonstrated better electrocatalytic properties.
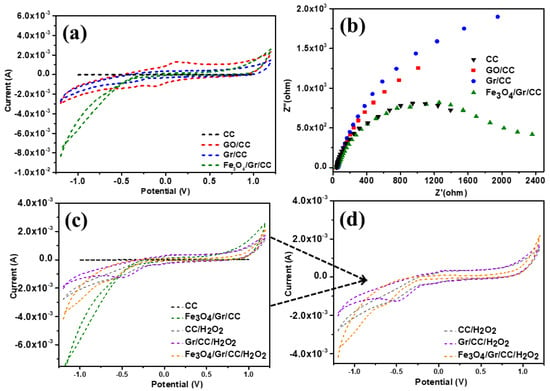
Figure 5.
Electrochemical test of fabricated electrodes, (a) CV and (b) EIS of CC, GO/CC, Gr/CC, and Fe3O4/Gr/CC in 0.1 M PBS (pH = 7.0), (c) comparative CVs of CC, Gr/CC, and Fe3O4/Gr/CC in 0.1 M PBS (pH = 7.0) with and without H2O2 at a scan rate of 0.08 V s−1 (d) CVs of CC, Gr/CC, Fe3O4/Gr/CC with H2O2 in 0.1M PBS, pH=7.0 (CC/ H2O2, Gr/CC/ H2O2, Fe3O4/Gr/CC/ H2O2).
Additionally, we looked into the electrochemical capabilities of the Fe3O4/Gr/CC for sensing of H2O2 (Figure 5c). Figure 5c displays the CV curves of the Fe3O4/Gr/CC and CC in 0.1 M PBS with a pH of 7.0 and a scan rate of 0.08 V s−1. For the bare CC, a poor current response was observed. For the Fe3O4/Gr/CC, an improved current response toward the detection of H2O2 that may arise due to the reduction/oxidation was observed. This high current response originated due to the good electrocatalytic properties of Fe3O4/Gr/CC. Moreover, we have observed good current response for Gr/CC and CC toward H2O2. Figure 5d provides the enlargement image of Figure 5c where CV curves for CC/H2O2, Gr/CC/H2O2, and Fe3O4/Gr/CC/H2O2 are compared.
Using CV, it was also investigated how different H2O2 concentrations affected the electrochemical performance of Fe3O4/Gr/CC (Figure 6a). With a scan rate of 0.08 Vs−1, we were able to get various CV curves of Fe3O4/Gr/CC in the presence of varying concentrations of H2O2 from 10 μM to 110 μM (Figure 6a,b). The observations obviously demonstrated that the current response for reduction has increased at each addition of H2O2. The calibration plot for linearity check between the peak current response and concentration of H2O2 revealed that this improved current response was linear (Figure 6c). The linear equation was observed as y = −3.70091E−5 x −0.00122, and R2 = 0.995.
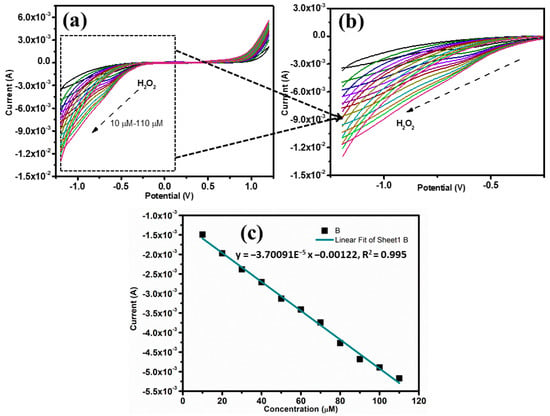
Figure 6.
(a) CVs shows electrochemical performance with different H2O2 concentrations in 0.1 M PBS (pH = 7.0) at a scan rate of 0.08 Vs−1; (b) enlargement of 5a which show the linearity of the sensing performance of Fe3O4/Gr/CC; and (c) a calibration plot for varying concentrations versus peak current.
Additionally, we have also looked at the effects of various scan speeds on the Fe3O4/Gr/CC toward H2O2 for the electrocatalytic reduction H2O2 for sensing application (Figure 7). Figure 7 displays the CVs of Fe3O4/Gr/CC that were obtained at various applied scan speeds of 20–210 mVs−1 in 0.1 M PBS (pH 7.0) containing initial concentration of H2O2. We noticed that as the scan rate increased from 20 to 210 mVs−1, the peak current response at the reduction side increases as the scan speed increases. The obtained results show the responses of peak current at 20 to 210 mVs−1 and a linear plot can be obtained. This plot further provides the information that indicates the linear increase in the response of the peak current and suggests the process is diffusion controlled for the sensing of H2O2 [73].
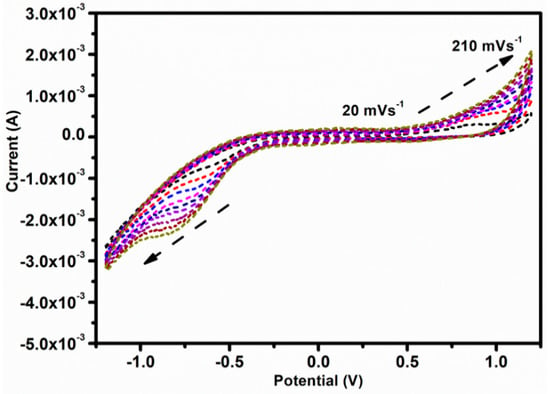
Figure 7.
CVs of Fe3O4/Gr/CC obtained at various applied scan speeds of 20–210 mVs−1 in 0.1 M PBS (pH 7.0).
4.2. Limit of Detection and Sensitivity of Flexible Sensor
The limit of detection (LOD) and sensitivity of fabricated Fe3O4/Gr/CC sensors can be estimated using the previous method reported [74,75]. For this, we used Equations (1) and (2), which were mentioned below, to find out the LOD and sensitivity of the Fe3O4/Gr/CC for the sensing of H2O2:
where σ = standard error, and S = slope.
Limit of detection (LOD) = 3.3 (σ/S)
Sensitivity = Slope/area of the working electrode
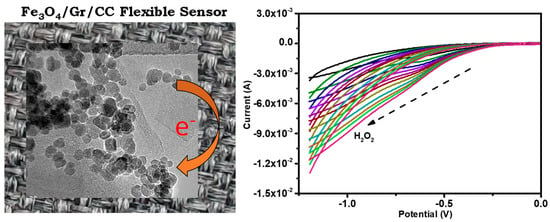
The sensitivity, LOD, and linear range of the Fe3O4/Gr/CC toward H2O2 using an electrochemical approach were recorded as 0.037 µA μM−1 cm−2, 4.79 μM, and 10–110 μM respectively, and the plausible mechanism can be seen in Scheme 3. Scheme 3 shows the micrographic images which show the transformation of H2O2 to H2O + O2 with the electrochemical cyclic voltammetry graph. The graph shows the gradual changes in the detection slope of H2O2. The reduction/oxidation takes place at the surfaces of an electrode (Fe3O4/Gr/CC electrode) and helps in the detection of H2O2 (Scheme 3). The reduction of H2O2 carried out by Fe3O4/Gr NC via electron transfer leads to the formation of hydroxyl ions (OH−), and after combining produced water and oxygen molecules [75].
Scheme 3.
Schematic for the mechanism towards the detection of H2O2 on Fe3O4/Gr/CC.
4.3. Test of Analytical Parameters (Selectivity, Repeatability, Reproducibility, and Stability) for Fe3O4/Gr/CC as Flexible Sensor
One of the most essential analytical parameters for sensors is selectivity. Several bodies, including glucose (Glu), uric acid (UA), ascorbic acid (AA), dopamine (DA), nitrophenol (NP), chlorophenol (CP), nitrophenol (NP), and sodium chloride (NaCl) were applied to test the anti-interference performance of Fe3O4/Gr/CC, as shown in Figure 8a. There was no noticeable current change after the addition of interfering species, and the current response to the addition of H2O2 was unaffected, confirming the exceptional selectivity. Further, CV curves were used to test the repeatability of the modified electrode (Fe3O4/Gr/CC) in order to evaluate the accuracy of the sensor. The results were repeatable, with a relative standard deviation (RSD) of 3.27% (four repeated runs at single electrode) (Figure 8b).
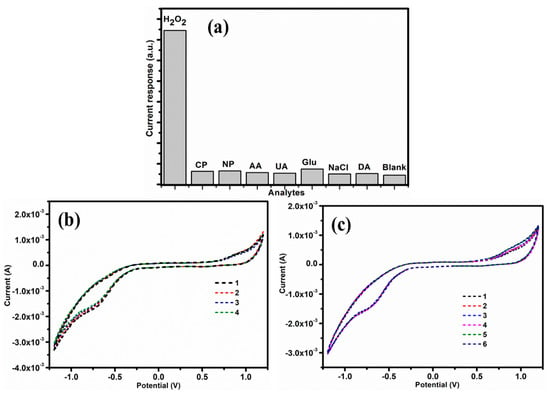
Figure 8.
(a) Selectivity test of Fe3O4/Gr/CC with various interference, (b) repeatability, and (c) reproducibility test.
The reproducibility of Fe3O4/Gr/CC sensor was tested by fabricating six independent electrodes and RSD of current responses for the sensing of H2O2 was revealed to be 3.04%. (Figure 8c). A stability was also assessed by evaluating the current response toward H2O2 for 10 days with the retention of 93.01–94.7% of its initial current response and advising good stability. Thus, the presented sensor has acceptable selectivity, reproducibility, and stability.
In comparison with fabricated electrodes consisting of graphene, CNTs, MOFs, noble metals, and metal oxides, we presented a rather economical sensing platform (Table 2). The CC is a suitable, cost-effective substrate with flexible properties, good conductivity, and tunable size, in contrast to certain typical electrodes [30]. Designing a sensing platform based on the CC with variable sizes results in fast analyte adsorption because of its synergistic and structural features. We can see from Table 2 that low detection limit was obtained using Fe3O4/Gr/CC for the H2O2 detection with a good linear range. The noble metal-containing electrodes such as Ag NPs/SnO2/GCE, AgNPs/PQ11/graphene, and Pt NPs/UiO-66/GCE were even found comparable in terms of LOD (Table 2). The graphene–MWCNT/GCE, rGO–Fe2O3–GCE, CuGa2O4/GCE shows either narrow LOW or comparable as compared to Fe3O4/Gr/CC. As a result, we have a sensor with good LOD, adaptable characteristics, and a low cost.

Table 2.
Comparison of sensing performance of some reported peroxide sensors with the present work.
5. Conclusions
The simplistic and facile fabrication of a new type of flexible Fe3O4/Gr/CC was achieved by the co-precipitation method. This modified carbon cloth-based electrode exhibited excellent physical and electrochemical properties. When a carbon fiber cloth-based electrode was used as a flexible electrochemical sensor for H2O2 determination, the modified electrode demonstrated high sensitivity, a wide linear range, and a low detection limit. The results show the high sensitivity of 0.037 µA μM−1 cm−2 with a limit of detection of 4.79 μM and linearity range was measured from 10 μM to 110 μM. The sensor also revealed good reproducibility and high selectivity. It is expected that the flexible and freestanding Fe3O4/Gr/CC will provide a modular approach for materials to be manufactured in the future due to its ease of preparation, compatibility with in vivo work, and availability in many potential applications.
Author Contributions
N.S.: methodology/supervision/resources/editing. M.I.: curation/resources, data/writing—original draft, investigation/writing—original draft. M.E.K.: data/writing—original draft, data curation, conceptualization/validation. A.M.: data curation, conceptualization/validation. M.M.A.: writing—original draft, investigation/writing—original draft, data curation, conceptualization/validation. T.Y.: resources/editing. I.M.M.: review and editing. M.A.H.: review and editing. M.J.A.: review and editing. A.A.J.: review and editing. All authors have read and agreed to the published version of the manuscript.
Funding
This research work was funded by Institutional Fund Projects under grant no. (IFPRC-049-135-2020). Therefore, authors gratefully acknowledge technical and financial support from the Ministry of Education and King Abdulaziz University, Jeddah, Saudi Arabia.
Institutional Review Board Statement
Not applicable.
Informed Consent Statement
Not applicable.
Data Availability Statement
The data presented in this study are available from the corresponding authors upon reasonable request.
Acknowledgments
This research work was funded by Institutional Fund Projects under grant no. (IFPRC-049-135-2020). Therefore, authors gratefully acknowledge technical and financial support from the Ministry of Education and King Abdulaziz University, Jeddah, Saudi Arabia.
Conflicts of Interest
The authors declare that there is no conflict of interest.
References
- Chandrabose, G.; Dey, A.; Gaur, S.S.; Pitchaimuthu, S.; Jagadeesan, H.; Braithwaite, N.S.J.; Selvaraj, V.; Kumar, V.; Krishnamurthy, S. Removal and degradation of mixed dye pollutants by integrated adsorption-photocatalysis technique using 2-D MoS2/TiO2 nanocomposite. Chemosphere 2021, 279, 130467–130485. [Google Scholar] [CrossRef]
- Thilagavathi, T.; Venugopal, D.; Thangaraju, D.; Marnadu, R.; Baskaran, P.; Imran, M.; Shkir, M.; Ubaidullah, M.; AlFaify, S. A facile co-precipitation synthesis of novel WO3/NiWO4 nanocomposite with improved photocatalytic activity. Mater. Sci. Semicond. Process. 2021, 133, 105970–105989. [Google Scholar] [CrossRef]
- Imran, M.; Md Mottahir, A.; Shahir, H.; Ashraf Ali, M.; Shkir, M.; Akbar, M.; Tansir, A.; Ajeet, K.; Kashif, I. Highly photocatalytic active r-GO/Fe3O4 nanocomposites development for enhanced photocatalysis application: A facile low-cost preparation and characterization. Ceram. Int. 2021, 47, 31973–31982. [Google Scholar] [CrossRef]
- Tayebee, R.; Esmaeili, E.; Maleki, B.; Khoshniat, A.; Chahkandi, M.; Mollania, N. Photodegradation of methylene blue and some emerging pharmaceutical micropollutants with an aqueous suspension of WZnO-NH2@H3PW12O40 nanocomposite. J. Mol. Liq. 2020, 317, 113928–113947. [Google Scholar] [CrossRef]
- Nasseh, N.; Tariq Al-Musawi, J.; Mohammad Reza, M.; Rodriguez-Couto, S.; Ayat Hossein, P. A comprehensive study on the application of FeNi3@SiO2@ZnO magnetic nanocomposites as a novel photo-catalyst for degradation of tamoxifen in the presence of simulated sunlight. Environ. Pollut. 2020, 261, 114127–114150. [Google Scholar] [CrossRef]
- Saleem, K.; Leandro, L. Recent advances of conductive nanocomposites in printed and flexible electronics. Smart Mater. Struct. 2017, 26, 83001–83027. [Google Scholar]
- Magisetty Ravi, P.; Deepak, P.; Rushikesh, A.; Anuj, S.; Balasubramanian, K. β-Phase Cu-phthalocyanine/acrylonitrile butadiene styrene terpolymer nanocomposite film technology for organic electronic applications. J. Phys. Chem. C 2019, 123, 28081–28092. [Google Scholar] [CrossRef]
- El Rhazi, M.; Majid, S.; Elbasri, M.; Salih, F.E.; Oularbi, L.; Lafdi, K. Recent progress in nanocomposites based on conducting polymer: Application as electrochemical sensors. Int. Nano Lett. 2018, 8, 79–99. [Google Scholar] [CrossRef]
- Munonde Tshimangadzo, S.; Philiswa Nomngongo, N. Nanocomposites for Electrochemical Sensors and Their Applications on the Detection of Trace Metals in Environmental Water Samples. Sensors 2021, 21, 131. [Google Scholar] [CrossRef]
- Hussain, S.; Md Mottahir, A.; Imran, M.; Nasser, Z.; Abdul, A.; Kashif, I.; Haider, M.; Afzal, K. Fe3O4 nanoparticles decorated with multi-walled carbon nanotubes based magnetic nanofluid for heat transfer application. Mater. Lett. 2020, 274, 128043–128049. [Google Scholar] [CrossRef]
- Imran, M.; Nasser, Z.; Tansir, A.; Saad Alshehri, M.; Mohammed Rehaan, C.; Shahir, H.; Abdul, A.; Mushtaq Ahmad, D.; Afzal, K. Carbon-coated Fe3O4 core–shell super-paramagnetic nanoparticle-based ferrofluid for heat transfer applications. Nanoscale Adv. 2021, 3, 1962–1975. [Google Scholar] [CrossRef] [PubMed]
- Feng, Y.; Tang, W.; Zhang, Y.; Zhang, T.; Shang, Y.; Chi, Q.; Chen, Q.; Lei, Q. Machine learning and microstructure design of polymer nanocomposites for energy storage application. High Volt. 2021, 7, 242–250. [Google Scholar] [CrossRef]
- Farji, M. Development of Photovoltaic Cells: A Materials Prospect and Next-Generation Futuristic Overview. Braz. J. Phys. 2021, 51, 1916–1928. [Google Scholar] [CrossRef]
- Liu, P.; Yan, J.; Guang, Z.; Huang, Y.; Li, X.; Huang, W. Recent advancements of polyaniline-based nanocomposites for supercapacitors. J. Power Sources 2019, 424, 108–130. [Google Scholar] [CrossRef]
- Shariatinia, Z. Biopolymeric nanocomposites in drug delivery. Adv. Biopolym. Syst. Drug Deliv. 2020, 593, 233–290. [Google Scholar]
- Sivanesan, I.; Judy, G.; Manikandan, M.; Juhyun, S.; Selvaraj, M.; Jaewook, O. Green Synthesized Chitosan/Chitosan Nanoforms/Nanocomposites for Drug Delivery Applications. Polymers 2021, 13, 2256–2263. [Google Scholar] [CrossRef]
- Soni Abhishek, K.; Rashmi, J.; Bheeshma Pratap Singh, N.; Naveen, K.; Raghumani Singh, N. Near-infrared-and magnetic-field-responsive NaYF4:Er3+/Yb3+@SiO2@AuNP@Fe3O4 nanocomposites for hyperthermia applications induced by fluorescence resonance energy transfer and surface plasmon absorption. ACS Appl. NanoMaterials 2019, 2, 7350–7361. [Google Scholar]
- Salmanian, G.; Hassanzadeh-Tabrizi, S.A.; Koupaei, N. Magnetic chitosan nanocomposites for simultaneous hyperthermia and drug delivery applications: A review. Int. J. Biol. Macromol. 2021, 184, 618–635. [Google Scholar] [CrossRef]
- Hassan, M.; Dave, K.; Chandrawati, R.; Dehghani, F.; Gomes, V.G. 3D printing of biopolymer nanocomposites for tissue engineering: Nanomaterials, processing and structure-function relation. Eur. Polym. J. 2019, 121, 109340–109356. [Google Scholar] [CrossRef]
- Zuluaga-Vélez, A.; Quintero-Martinez, A.; Orozco, L.M.; Sepúlveda-Arias, J.C. Silk fibroin nanocomposites as tissue engineering scaffolds–A systematic review. Biomed. Pharmacother. 2021, 141, 111924–111950. [Google Scholar] [CrossRef]
- Gagandeep, K.; Anupreet, K.; Harpreet, K. Review on nanomaterials/conducting polymer-based nanocomposites for the development of biosensors and electrochemical sensors. Polym.-Plast. Technol. Mater. 2021, 60, 502–519. [Google Scholar]
- Dakshayani, B.S.; Kakarla Raghava, R.; Amit, M.; Nagaraj, P.; Shweta Malode, J.; Soumen, B.; Naveen, S.; Anjanapura Raghu, V. Role of conducting polymer and metal oxide-based hybrids for applications in amperometric sensors and biosensors. Microchem. J. 2019, 147, 7–24. [Google Scholar] [CrossRef]
- Zou, R.; Teng, X.; Lin, Y.; Lu, C. Graphitic carbon nitride-based nanocomposites electrochemiluminescence systems and their applications in biosensors. TrAC Trends Anal. Chem. 2020, 132, 116054–116075. [Google Scholar] [CrossRef]
- Sun, H.; Yang, Z.; Chen, X.; Qiu, L.; You, X.; Chen, P.; Peng, H. Photovoltaic wire with high efficiency attached onto and detached from a substrate using a magnetic field. Angew. Chem. 2013, 125, 8434–8438. [Google Scholar] [CrossRef]
- Sun, H.; Che, R.; You, X.; Jiang, Y.; Yang, Z.; Deng, J.; Qiu, L.; Peng, H. Cross-stacking aligned carbon-nanotube films to tune microwave absorption frequencies and increase absorption intensities. Adv. Mater. 2014, 26, 8120–8125. [Google Scholar] [CrossRef] [PubMed]
- Sun, X.; Sun, H.; Li, H.; Peng, H. Developing polymer composite materials: Carbon nanotubes or graphene. Adv. Mater. 2013, 25, 5153–5176. [Google Scholar] [CrossRef]
- Mudassir, H.; Arghya Narayan, B.; Lee, M. Enhanced thermo-optical performance and high BET surface area of graphene@PVC nanocomposite fibers prepared by simple facile deposition technique: N2 adsorption study. J. Ind. Eng. Chem. 2015, 21, 828–834. [Google Scholar]
- Liu, Y.; Li, L.; Run, W.; Jieyun, L.; Jiwei, H.; Wenzhi, Z. Multi-mode photocatalytic performances of CdS QDs modified CdIn2S4/CdWO4 nanocomposites with high electron transfer ability. J. Nanoparticle Res. 2018, 20, 319. [Google Scholar] [CrossRef]
- Zhang, Y.; Liu, Z.; Wang, Y.; Kuang, X.; Ma, H.; Wei, Q. Directly assembled electrochemical sensor by combining self-supported CoN nanoarray platform grown on carbon cloth with molecularly imprinted polymers for the detection of Tylosin. J. Hazard. Mater. 2020, 398, 122778–122783. [Google Scholar] [CrossRef]
- Khorablou, Z.; Shahdost-Fard, F.; Razmi, H. Flexible and highly sensitive methadone sensor based on gold nanoparticles/polythiophene modified carbon cloth platform. Sens. Actuators B Chem. 2021, 344, 130284–130296. [Google Scholar] [CrossRef]
- Asadian, E.; Shahrokhian, S.; Zad, A.I. ZIF-8/PEDOT@flexible carbon cloth electrode as highly efficient electrocatalyst for oxygen reduction reaction. Int. J. Hydrogen Energy 2020, 45, 1890–1900. [Google Scholar] [CrossRef]
- Mishra, A.; Shetti, N.P.; Basu, S.; Raghava Reddy, K.; Aminabhavi, T.M. Carbon cloth-based hybrid materials as flexible electrochemical supercapacitors. ChemElectroChem 2019, 6, 5771–5786. [Google Scholar] [CrossRef]
- Akbar, M.; Mazin Zamzami, A. Construction of carbon cloth modified-Al2O3-g-C3N4 sensor for non-enzymatic electrochemical detection of hydrogen peroxide. Diam. Relat. Mater. 2023, 132, 109600–109609. [Google Scholar]
- Liu, Y.; Xia, Y.; Tang, Y.; Chen, Y.; Cao, J.; Zhao, F.; Zeng, B. A ratiometric electrochemical sensor based on Cu-coordinated molecularly imprinted polymer and porous carbon supported Ag nanoparticles for highly sensitive and selective detection of perphenazine. Anal. Chim. Acta 2022, 1227, 340301. [Google Scholar] [CrossRef]
- Shahzad, A.; Arshiya, A.; Ahmed, S.; Haidyrah Anis Ahmad, C.; Imran, M.; Afzal, K. Hierarchical Molecularly Imprinted Inverse Opal-Based Platforms for Highly Selective and Sensitive Determination of Histamine. ACS Appl. Polym. Mater. 2022, 4, 2783–2793. [Google Scholar]
- Xu, Z.; Wang, Q.; Hui, Z.; Zhao, S.; Zhao, Y.; Wang, L. Carbon cloth-supported nanorod-like conductive Ni/Co bimetal MOF: A stable and high-performance enzyme-free electrochemical sensor for determination of glucose in serum and beverage. Food Chem. 2021, 349, 129202. [Google Scholar] [CrossRef]
- Zhang, L.; Zhai, Y.; Gao, N.; Wen, D.; Dong, S. Sensing H2O2 with layer-by-layer assembled Fe3O4–PDDA nanocomposite film. Electrochem. Commun. 2008, 10, 1524–1526. [Google Scholar] [CrossRef]
- Cao, G.S.; Wang, P.; Li, X.; Wang, Y.; Wang, G.; Li, J. Hydrogen peroxide electrochemical sensor based on Fe3O4 nanoparticles. Micro Nano Lett. 2014, 9, 16–18. [Google Scholar] [CrossRef]
- Akbar, M.; Mohammad, E.K.; Taeho, Y.; Moo Hwan, C. Na, O-co-doped-graphitic-carbon nitride (Na, O-g-C3N4) for nonenzymatic electrochemical sensing of hydrogen peroxide. Appl. Surf. Sci. 2020, 525, 146353–146366. [Google Scholar]
- Cao, G.S.; Wang, P.; Li, X.; Wang, Y.; Wang, G.; Li, J. A sensitive nonenzymatic hydrogen peroxide sensor based on Fe3O4-Fe2O3 nanocomposites. Bull. Mater. Sci. 2015, 38, 163–167. [Google Scholar] [CrossRef]
- Ates, A.; Oskay, K.O. Preparation and characterization of nanosized Fe3O4-biochar electrocatalysts with large surface area for H2O2 sensing. Surf. Interfaces 2022, 202229, 101733–101742. [Google Scholar] [CrossRef]
- Cui, X.; Sun, Y.Q.; Ma, R.; Song, X.C. A hydrogen peroxide electrochemical sensor based on Co-doped Fe3O4 nanoparticles. In Advanced Materials Research; Trans Tech Publications Ltd.: Stafa-Zurich, Switzerland, 2014; Volume 941, pp. 377–380. [Google Scholar]
- Sun, X.; Guo, S.; Liu, Y.; Sun, S. Dumbbell-like PtPd–Fe3O4 nanoparticles for enhanced electrochemical detection of H2O2. Nano Lett. 2012, 12, 4859–4863. [Google Scholar] [CrossRef]
- Xu, W.; Fei, J.; Yang, W.; Zheng, Y.; Dai, Y.; Sakran, M.; Zhou, X. A colorimetric/electrochemical dual-mode sensor based on Fe3O4@MoS2-Au NPs for high-sensitivity detection of hydrogen peroxide. Microchem. J. 2022, 181, 107825–107834. [Google Scholar] [CrossRef]
- Lin, M.S.; Leu, H.J. A Fe3O4-based chemical sensor for cathodic determination of hydrogen peroxide. Electroanal. Int. J. Devoted Fundam. Pract. Asp. Electroanal. 2005, 17, 2068–2073. [Google Scholar] [CrossRef]
- Zhao, Y.; Huo, D.; Bao, J.; Yang, M.; Chen, M.; Hou, J.; Fa, H.; Hou, C. Biosensor based on 3D graphene-supported Fe3O4 quantum dots as biomimetic enzyme for in situ detection of H2O2 released from living cells. Sens. Actuators B Chem. 2017, 244, 1037–1044. [Google Scholar] [CrossRef]
- Yousefinejad, S.; Rasti, H.; Hajebi, M.; Kowsari, M.; Sadravi, S.; Honarasa, F. Design of C-dots/Fe3O4 magnetic nanocomposite as an efficient new nanozyme and its application for determination of H2O2 in nanomolar level. Sens. Actuators B Chem. 2017, 247, 691–696. [Google Scholar] [CrossRef]
- Cai, L.; Hou, B.; Shang, Y.; Xu, L.; Zhou, B.; Jiang, X.; Jiang, X. Synthesis of Fe3O4/graphene oxide/pristine graphene ternary composite and fabrication of electrochemical sensor to detect dopamine and hydrogen peroxide. Chem. Phys. Lett. 2019, 736, 136797–136807. [Google Scholar] [CrossRef]
- Zhao, X.; Li, Z.; Chen, C.; Wu, Y.; Zhu, Z.; Zhao, H.; Lan, M. A novel biomimetic hydrogen peroxide biosensor based on Pt flowers-decorated Fe3O4/graphene nanocomposite. Electroanalysis 2017, 29, 1518–1523. [Google Scholar] [CrossRef]
- Cai, L.; Shang, Y.; Jiang, X. Synthesis of Fe3O4/graphene oxide/pristine graphene composite and its application in an electrochemical sensor. J. Phys. Conf. Ser. 2020, 1622, 12096–12109. [Google Scholar] [CrossRef]
- Reddy, Y.V.M.; Shin, J.H.; Palakollu, V.N.; Sravani, B.; Choi, C.H.; Park, K.; Shetti, N.P. Strategies, advances, and challenges associated with the use of graphene-based nanocomposites for electrochemical biosensors. Adv. Colloid Interface Sci. 2022, 304, 102664–102673. [Google Scholar] [CrossRef]
- Asgar, H.; Deen, K.M.; Riaz, U.; Rahman, Z.U.; Shah, U.H.; Haider, W. Synthesis of graphene via ultrasonic exfoliation of graphite oxide and its electrochemical characterization. Mater. Chem. Phys. 2018, 206, 7–11. [Google Scholar] [CrossRef]
- Boruah, P.K.; Sharma, B.; Hussain, N.; Das, M.R. Magnetically recoverable Fe3O4/graphene nanocomposite towards efficient removal of triazine pesticides from aqueous solution: Investigation of the adsorption phenomenon and specific ion effect. Chemosphere 2017, 168, 1058–1067. [Google Scholar] [CrossRef]
- Adetayo, A.; Runsewe, D. Synthesis and fabrication of graphene and graphene oxide: A review. Open J. Compos. Mater. 2019, 9, 207–228. [Google Scholar] [CrossRef]
- Jolivet, J.P.; Chanéac, C.; Tronc, E. Iron oxide chemistry. From molecular clusters to extended solid networks. Chem. Commun. 2004, 5, 481–483. [Google Scholar]
- Si, Y.; Samulski, E.T. Synthesis of water-soluble graphene. Nano Lett. 2008, 8, 1679–1682. [Google Scholar] [CrossRef]
- Titelman, G.I.; Gelman, V.; Bron, S.; Khalfin, R.L.; Cohen, Y.B.P.H.; Bianco-Peled, H. Characteristics and microstructure of aqueous colloidal dispersions of graphite oxide. Carbon 2005, 43, 641–649. [Google Scholar] [CrossRef]
- Stankovich, S.; Dikin, D.A.; Piner, R.D.; Kohlhaas, K.A.; Kleinhammes, A.; Jia, Y.; Ruoff, R.S. Synthesis of graphene-based nanosheets via chemical reduction of exfoliated graphite oxide. Carbon 2007, 45, 1558–1565. [Google Scholar] [CrossRef]
- Kang, L.; Sato, R.; Zhang, B.; Takeda, Y.; Tang, J. Experimental dispersion of the third-order optical susceptibility of graphene oxide. Opt. Mater. Express 2020, 10, 3041–3050. [Google Scholar] [CrossRef]
- Rashidi Nodeh, H.; Wan Ibrahim, W.A.; Ali, I.; Sanagi, M.M. Development of magnetic graphene oxide adsorbent for the removal and preconcentration of As (III) and As (V) species from environmental water samples. Environ. Sci. Pollut. Res. 2016, 23, 9759–9773. [Google Scholar] [CrossRef]
- Bakheet, A.A.A.A.; Zhu, X. Separation/analysis of Congo red by using poly (ionic liquid) immobilized magnetic nanoparticles magnetic solid phase extraction coupled with fluorescence spectrophotometry. Science 2017, 5, 113–118. [Google Scholar]
- Cheng, M.M.; Huang, L.J.; Wang, Y.X.; Zhao, Y.C.; Tang, J.G.; Wang, Y.; Wickramasinghe, S.R. Synthesis of graphene oxide/polyacrylamide composite membranes for organic dyes/water separation in water purification. J. Mater. Sci. 2019, 54, 252–264. [Google Scholar] [CrossRef]
- Eivazzadeh-Keihan, R.; Radinekiyan, F.; Maleki, A.; SalimiBani, M.; Azizi, M. A new generation of star polymer: Magnetic aromatic polyamides with unique microscopic flower morphology and in vitro hyperthermia of cancer therapy. J. Mater. Sci. 2020, 55, 319–336. [Google Scholar] [CrossRef]
- Adzmi, F.; Meon, S.; Musa, M.H.; Yusuf, N.A. Preparation, characterisation and viability of encapsulated Trichoderma harzianum UPM40 in alginate-montmorillonite clay. J. Microencapsul. 2012, 29, 205–210. [Google Scholar] [CrossRef] [PubMed]
- Win, T.T.; Khan, S.; Bo, B.; Zada, S.; Fu, P. Green synthesis and characterization of Fe3O4 nanoparticles using Chlorella-K01 extract for potential enhancement of plant growth stimulating and antifungal activity. Sci. Rep. 2021, 11, 21996. [Google Scholar] [CrossRef] [PubMed]
- Ferrari, A.C.; Basko, D.M. Raman spectroscopy as a versatile tool for studying the properties of graphene. Nat. Nanotechnol. 2013, 8, 235–246. [Google Scholar] [CrossRef] [PubMed]
- Wu, J.B.; Lin, M.L.; Cong, X.; Liu, H.N.; Tan, P.H. Raman spectroscopy of graphene-based materials and its applications in related devices. Chem. Soc. Rev. 2018, 47, 1822–1873. [Google Scholar] [CrossRef]
- Dar, M.I.; Shivashankar, S.A. Single Crystalline Magnetite, Maghemite, and Hematite Nanoparticles with Rich Coercivity. RSC Adv. 2014, 4, 4105–4113. [Google Scholar]
- Imran, M.; Abutaleb, A.; Ashraf Ali, M.; Tansir, A.; Akhalakur Rahman, A.; Shariq, M.; Dinesh, L.; Afzal, K. UV light enabled photocatalytic activity of α-Fe2O3 nanoparticles synthesized via phase transformation. Mater. Lett. 2020, 258, 126748–126759. [Google Scholar] [CrossRef]
- Afzal, K.; Shiraz, S.; Chacko, J. The fabrication of stable superhydrophobic surfaces using a thin Au/Pd coating over a hydrophilic 3C-SiC nanorod network. Appl. Surf. Sci. 2015, 353, 964–972. [Google Scholar]
- Khan, A.; Habib, M.R.; Jingkun, C.; Xu, M.; Yang, D.; Yu, X. New insight into the metal-catalyst-free direct chemical vapor deposition growth of graphene on silicon substrates. J. Phys. Chem. C 2021, 125, 1774–1783. [Google Scholar] [CrossRef]
- Khan, A.; Cong, J.; Kumar, R.R.; Ahmed, S.; Yang, D.; Yu, X. Chemical Vapor Deposition of Graphene on Self-Limited SiC Interfacial Layers Formed on Silicon Substrates for Heterojunction Devices. ACS Appl. Nano Mater. 2022, 5, 17544–17555. [Google Scholar] [CrossRef]
- Akbar, M.; Mohammad Ehtisham, K.; Waleed, A.; Taeho, Y. Fabrication of Electrochemical Sensor Using SnO2-Modified-TiO2 Nanocomposite for Detection of Hydrazine. J. Electrochem. Soc. 2021, 168, 67518–67527. [Google Scholar]
- Khursheed, A.; Haekyoung, K. Fabrication of Nitrogen-Doped Reduced Graphene Oxide Modified Screen Printed Carbon Electrode (N-rGO/SPCE) as Hydrogen Peroxide Sensor. Nanomaterials 2022, 12, 2443–2457. [Google Scholar]
- Ahmad, K.; Mobin, S.M. Design and fabrication of cost-effective and sensitive non-enzymatic hydrogen peroxide sensor using Co-doped δ-MnO2 flowers as electrode modifier. Anal. Bioanal. Chem. 2021, 413, 789–798. [Google Scholar] [CrossRef] [PubMed]
- Woo, S.; Kim, Y.R.; Chung, T.D.; Piao, Y.; Kim, H. Synthesis of a graphene–carbon nanotube composite and its electrochemical sensing of hydrogen peroxide. Electrochim. Acta 2012, 59, 509–514. [Google Scholar] [CrossRef]
- Xu, Z.; Yang, L.; Xu, C. Pt@ UiO-66 heterostructures for highly selective detection of hydrogen peroxide with an extended linear range. Anal. Chem. 2015, 87, 3438–3444. [Google Scholar] [CrossRef]
- Karimi, M.A.; Banifatemeh, F.; Hatefi-Mehrjardi, A.; Tavallali, H.; Eshaghia, Z.; Deilamy-Rad, G. A novel rapid synthesis of Fe2O3/graphene nanocomposite using ferrate (VI) and its application as a new kind of nanocomposite modified electrode as electrochemical sensor. Mater. Res. Bull. 2015, 70, 856–864. [Google Scholar] [CrossRef]
- Miao, Y.E.; He, S.; Zhong, Y.; Yang, Z.; Tjiu, W.W.; Liu, T. A novel hydrogen peroxide sensor based on Ag/SnO2 composite nanotubes by electrospinning. Electrochim. Acta 2013, 99, 117–123. [Google Scholar] [CrossRef]
- Yin, H.; Shi, Y.; Dong, Y.; Chu, X. Synthesis of spinel-type CuGa2O4 nanoparticles as a sensitive non-enzymatic electrochemical sensor for hydrogen peroxide and glucose detection. J. Electroanal. Chem. 2021, 885, 115100–115123. [Google Scholar] [CrossRef]
- Liu, S.; Tian, J.; Wang, L.; Li, H.; Zhang, Y.; Sun, X. Stable aqueous dispersion of graphene nanosheets: Noncovalent functionalization by a polymeric reducing agent and their subsequent decoration with Ag nanoparticles for enzymeless hydrogen peroxide detection. Macromolecules 2010, 43, 10078–10083. [Google Scholar] [CrossRef]
- Fan, L.; Zhang, Q.; Wang, K.; Li, F.; Niu, L. Ferrocene functionalized graphene: Preparation, characterization and efficient electron transfer toward sensors of H2O2. J. Mater. Chem. 2012, 22, 6165–6170. [Google Scholar] [CrossRef]
Disclaimer/Publisher’s Note: The statements, opinions and data contained in all publications are solely those of the individual author(s) and contributor(s) and not of MDPI and/or the editor(s). MDPI and/or the editor(s) disclaim responsibility for any injury to people or property resulting from any ideas, methods, instructions or products referred to in the content. |
© 2023 by the authors. Licensee MDPI, Basel, Switzerland. This article is an open access article distributed under the terms and conditions of the Creative Commons Attribution (CC BY) license (https://creativecommons.org/licenses/by/4.0/).