Article

Single Crystalline Films of Ce3+-Doped Y3MgxSiyAl5−x−yO12 Garnets: Crystallization, Optical, and Photocurrent Properties

1
Institute of Physics, Kazimierz Wielki University in Bydgoszcz, 85-090 Bydgoszcz, Poland
2
Institute of Materials for Electronics and Energy Technology (i-MEET), Department of Materials Science and Engineering VI, University of Erlangen-Nürnberg, 91058 Erlangen, Germany
3
SSI Institute for Single Crystals, National Academy of Sciences of Ukraine, 61178 Kharkiv, Ukraine
4
Institute of Experimental Physics, Faculty of Mathematics, Physics and Informatics, University of Gdansk, Wita Stwosza 57, 80-308 Gdansk, Poland
*
Authors to whom correspondence should be addressed.
Materials 2023, 16(5), 1869; https://doi.org/10.3390/ma16051869
Submission received: 22 December 2022 / Revised: 19 February 2023 / Accepted: 21 February 2023 / Published: 24 February 2023

Abstract

:
This research focuses on LPE growth, and the examination of the optical and photovoltaic properties of single crystalline film (SCF) phosphors based on Ce3+-doped Y3MgxSiyAl5−x−yO12 garnets with Mg and Si contents in x = 0–0.345 and y = 0–0.31 ranges. The absorbance, luminescence, scintillation, and photocurrent properties of Y3MgxSiyAl5−x−yO12:Ce SCFs were examined in comparison with Y3Al5O12:Ce (YAG:Ce) counterpart. Especially prepared YAG:Ce SCFs with a low (x, y < 0.1) concentration of Mg2+ and Mg2+–Si4+ codopants also showed a photocurrent that increased with rising Mg2+ and Si4+ concentrations. Mg2+ excess was systematically present in as-grown Y3MgxSiyAl5−x−yO12:Ce SCFs. The as-grown SCFs of these garnets under the excitation of α–particles had a low light yield (LY) and a fast scintillation response with a decay time in the ns range due to producing the Ce4+ ions as compensators for the Mg2+ excess. The Ce4+ dopant recharged to the Ce3+ state after SCF annealing at T > 1000 °C in a reducing atmosphere (95%N2 + 5%H2). Annealed SCF samples exhibited an LY of around 42% and similar scintillation decay kinetics to those of the YAG:Ce SCF counterpart. The photoluminescence studies of Y3MgxSiyAl5−x−yO12:Ce SCFs provide evidence for Ce3+ multicenter formation and the presence of an energy transfer between various Ce3+ multicenters. The Ce3+ multicenters possessed variable crystal field strengths in the nonequivalent dodecahedral sites of the garnet host due to the substitution of the octahedral positions by Mg2+ and the tetrahedral positions by Si4+. In comparison with YAG:Ce SCF, the Ce3+ luminescence spectra of Y3MgxSiyAl5−x−yO12:Ce SCFs greatly expanded in the red region. Using these beneficial trends of changes in the optical and photocurrent properties of Y3MgxSiyAl5−x−yO12:Ce garnets as a result of Mg2+ and Si4+ alloying, a new generation of SCF converters for white LEDs, photovoltaics, and scintillators could be developed.

1. Introduction

White light-emitting diodes (WLEDs) are quickly displacing conventional sources of light due to their high energy efficiency, extended exportation time, high luminous efficiency, and environmental friendliness [1]. These devices, including yellow-emitting Y3Al5O12:Ce (YAG:Ce) garnet powders and blue LED chips, are regarded as standard WLED light sources [2]. High-power WLEDs can be produced using YAG:Ce crystals, translucent ceramic phosphors [3,4,5], eutectics [6], and epitaxial structures [7,8] combined with blue LEDs. As a result of the garnet structure’s high degree of flexibility, which permits various cation substitutions in the octahedral {A}, dodecahedral [B] and tetrahedral (C) sites, it is possible to alter the composition of {Y}3[Al]2(Al)3O12 garnets in order to optimize its Ce3+ spectroscopic properties and fulfill the demand of WLED applications. For the development of high-power white LEDs, a new class of garnet phosphors based on Ce3+-doped A3B2C3O12 ({A} = Ca, Y and rare earth ions; [B] = Sc, Ga, Mg, Al; (C) = Al, Si, Ga) garnets were also proposed [9,10,11,12,13,14,15,16,17,18]. Recent publications [9,10,11,12] also covered the spectroscopic characteristics of Ce3+ ions in garnets with Ca2+, Mg2+, and Si4+ dopants in the respective {A}, [B], and (C) positions of the garnet host. According to [9], YAG:Ce displayed a lower threshold of thermal quenching of the Ce3+ luminescence than that of the Ca3Sc2Si3O12:Ce garnet.
Nonetheless, the impact of the simultaneous Mg2+–Si4+ pair codoping on the optical characteristics of a single Ce3+-doped YAG crystal has not been investigated in detail. This is mainly connected with difficulties in the crystallization of a solid Y3MgxSiyAl5−x−yO12:Ce solution with conventional growth methods such as the Czochralski or micropulling down techniques. A good answer to this issue is the liquid-phase epitaxy (LPE) technique. The LPE method enables receiving a wide variety of optical materials in single crystalline film form with an extremely low concentration of host defects for the basic research of the optical properties of these materials, and the creation of various luminescent materials on their base for various applications such as laser media [19,20,21], scintillators [22,23,24,25], cathodoluminescent [26,27,28] and scintillating screens [29,30,31], thermoluminescent detectors [32,33,34], and WLED converters [35,36].
The first attempts to obtain Ce3+-doped Y3−xCaxAl5−xSixO12:Ce, Ca3Sc2Si3O12:Ce, and Ca2RSc2Si3O12:Ce ({R} = Y, Lu) garnets in SCF form using the LPE technique for the fabrication of optoelectronic components as blue LED converters or scintillators were presented in our previous works [37,38,39,40].
The optical and photovoltaic characteristics of Y3MgxSiyAl5−x−yO12:Ce SCFs with the values of x and y varying in the x = 0–0.345 and y = 0–0.31 ranges are examined in this study, along with new systematic results on growth. The LPE technique was used to produce the SCFs of these garnets onto undoped YAG substrates (see also [37,38,39,40]). Meanwhile, LPE growth methods may also be utilized to create the composite film–substrate epitaxial structures of these garnets for high-power WLED converters. Furthermore, considering that only phosphors based on YAG:Ce crystals or ceramics are available for producing high-power WLEDs under blue LED excitations, the development of this new type of phosphor is a very promising trend in solid-state lighting technology [2,3]. At the same time, we consider the rare-earth and transition metals doped of the SCFs of silicate garnet as potential raw materials for developing novel SCF cathodoluminescent screens, scintillators, and photovoltaic devices [7,8,37,38,39,40].

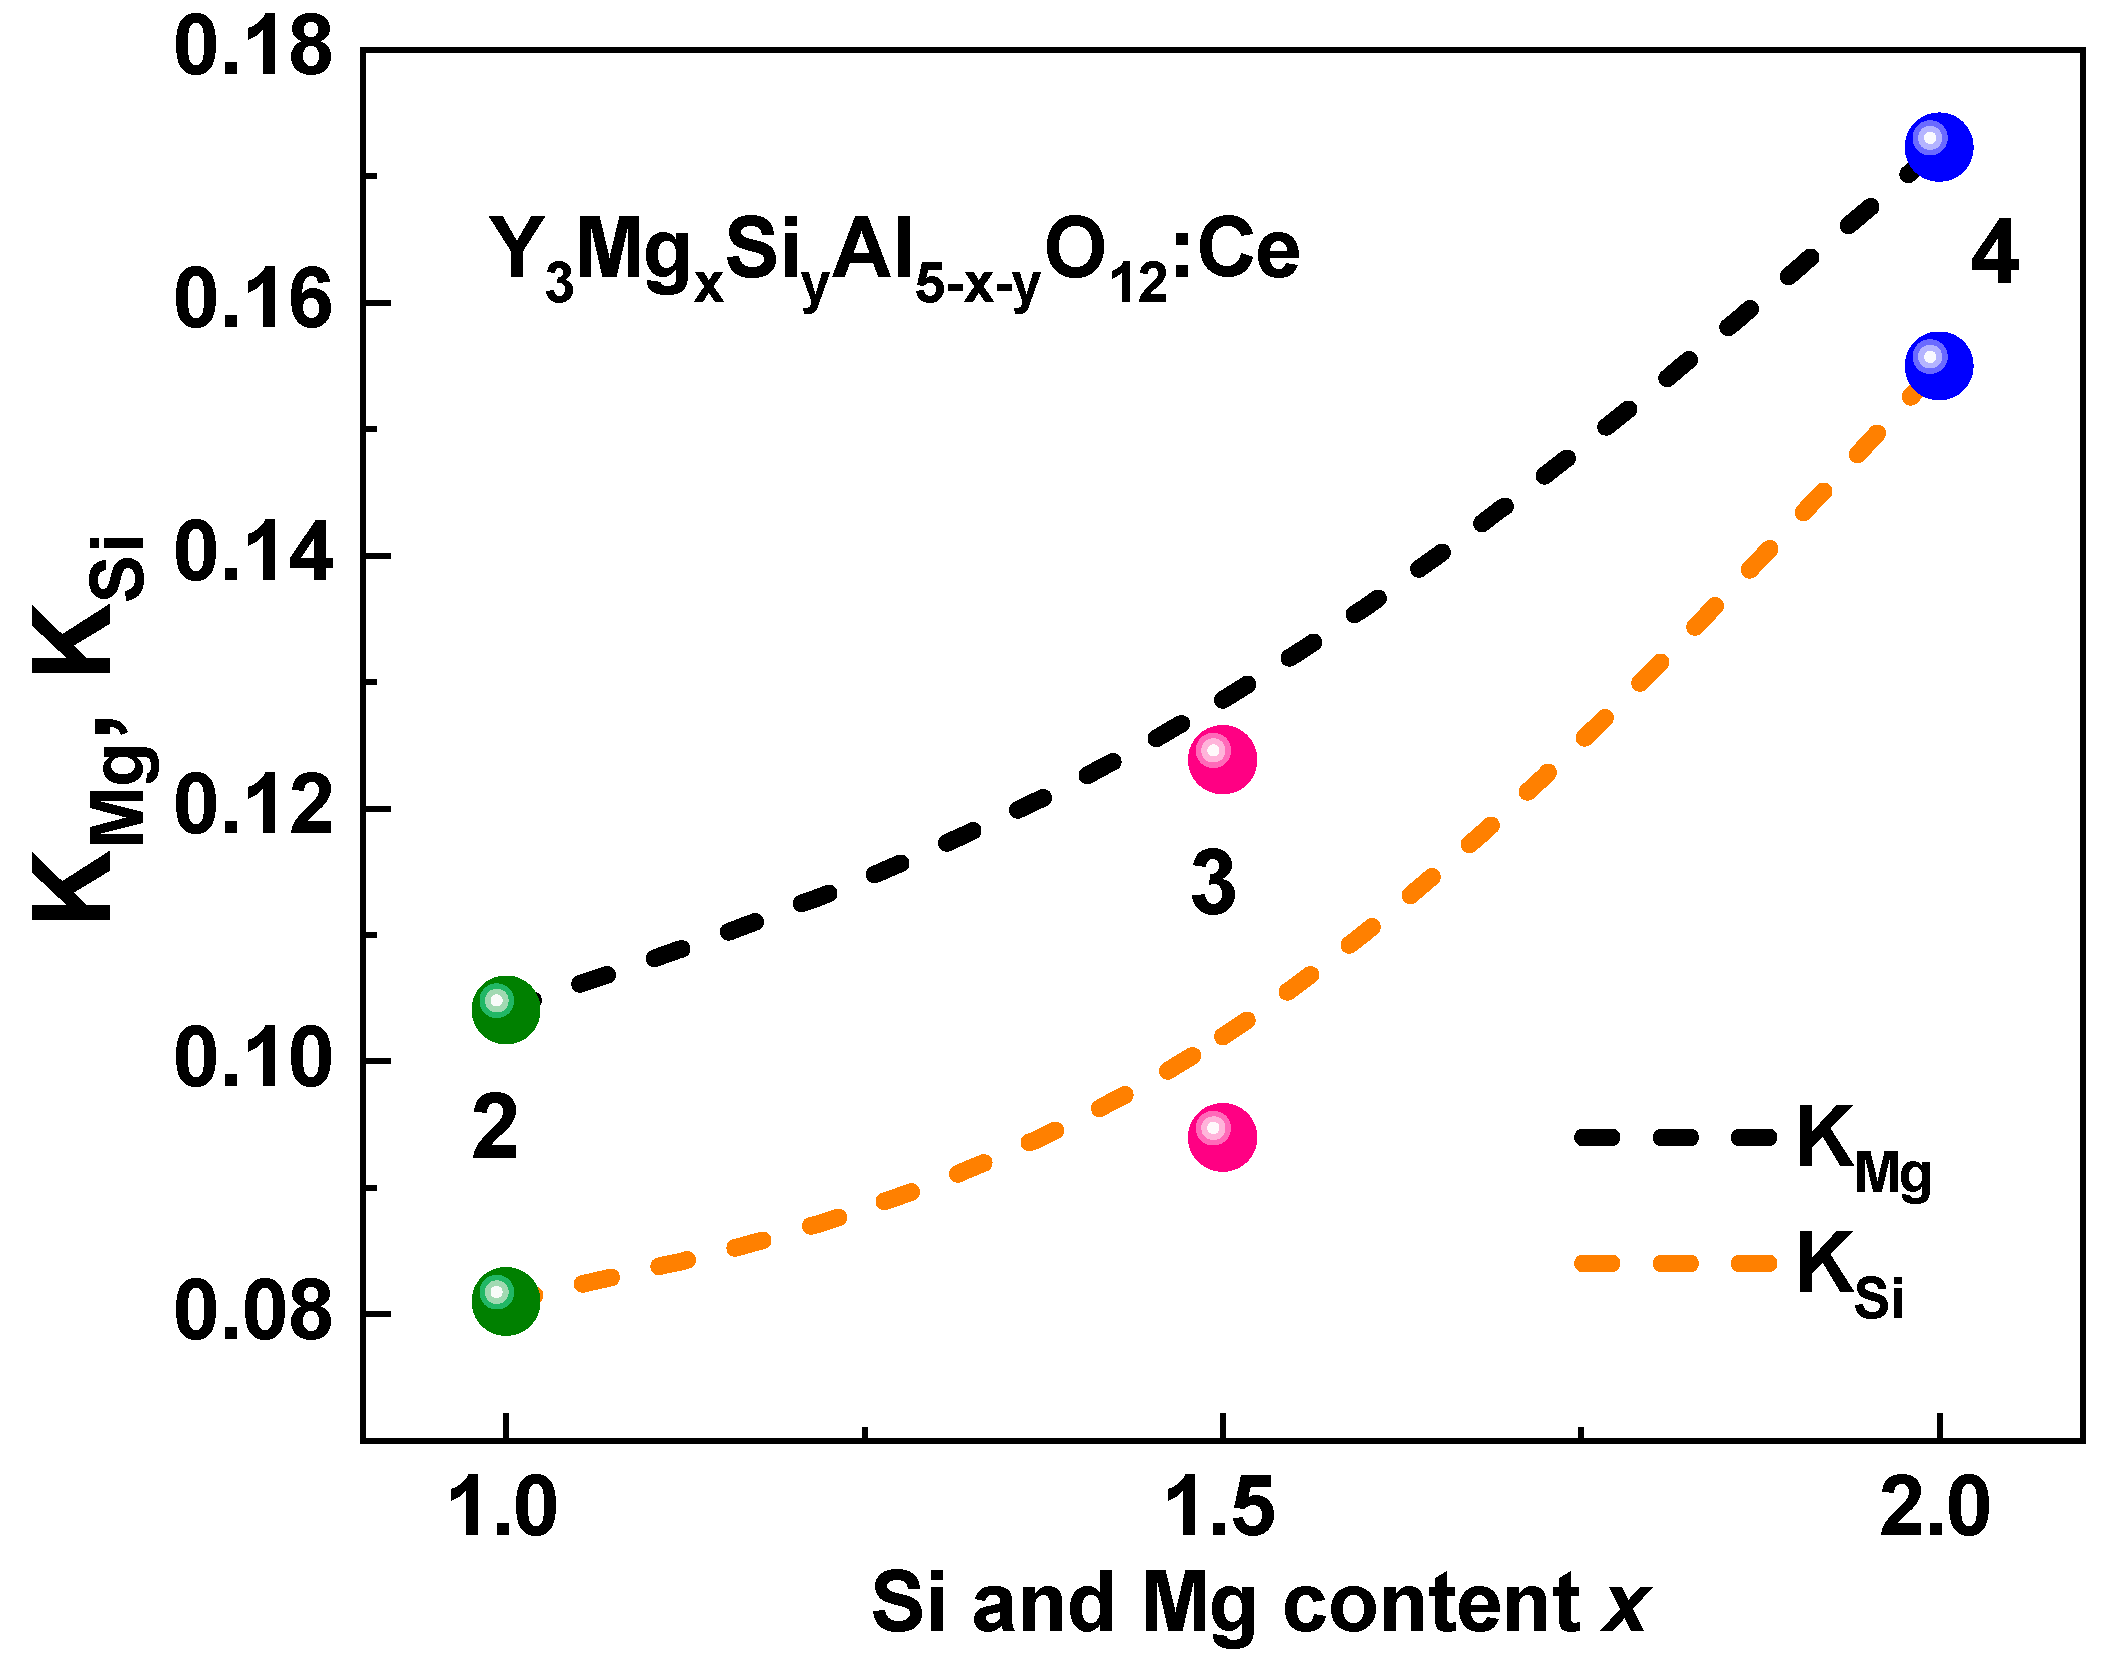
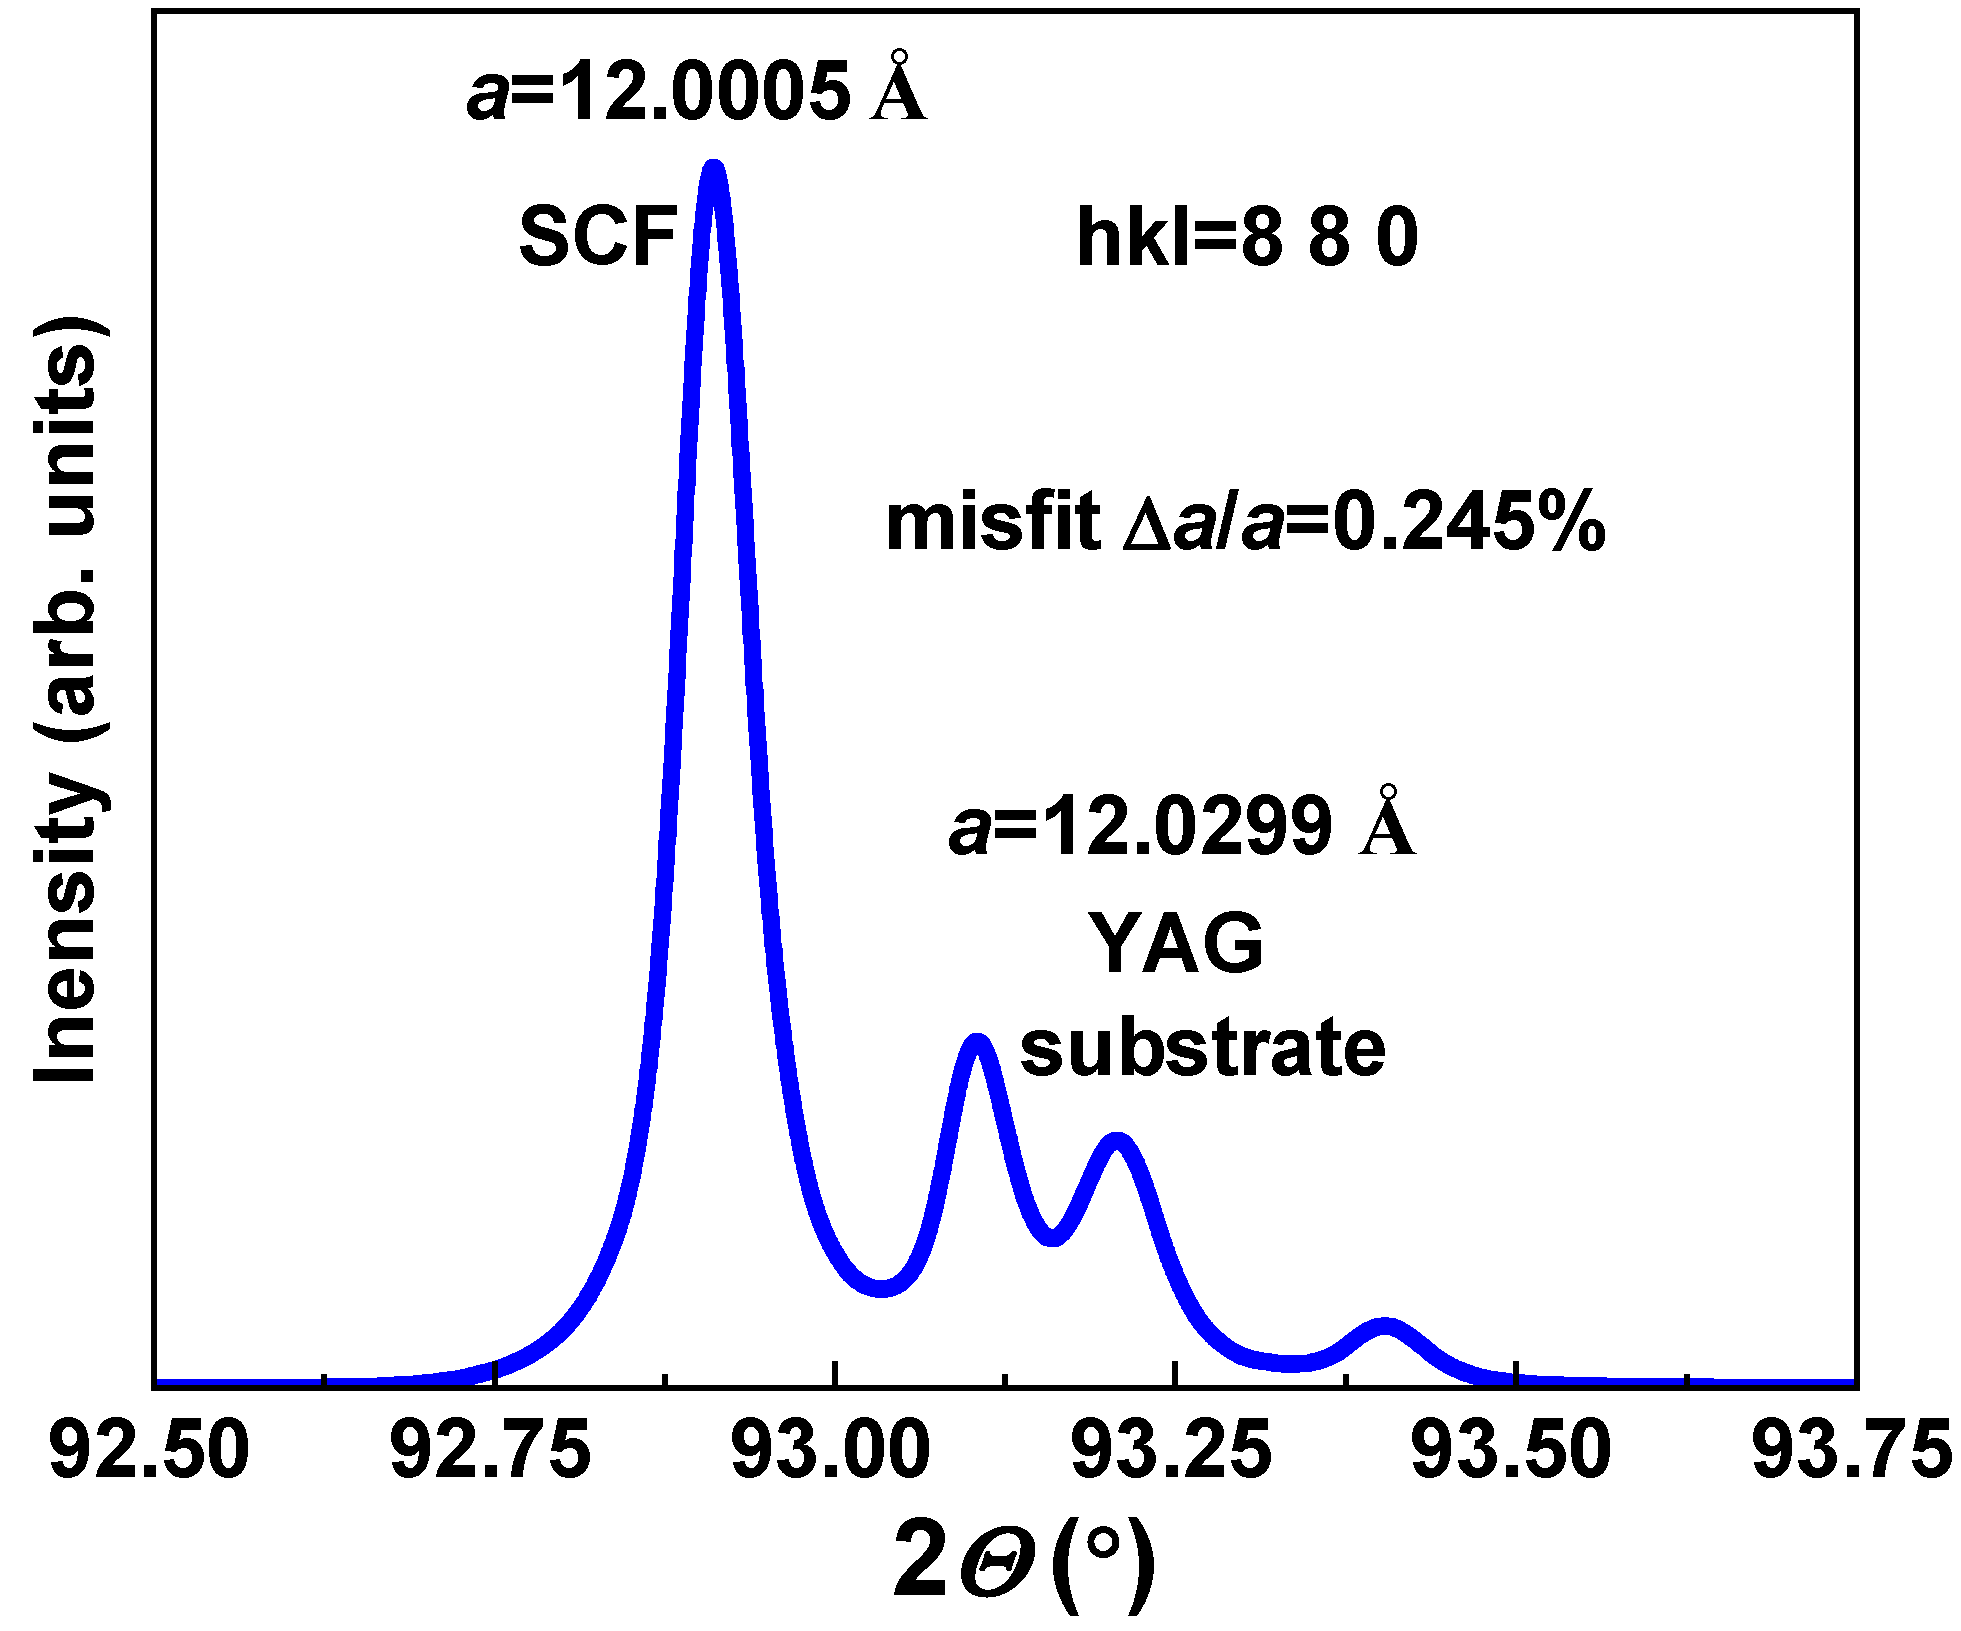
2. Growth of Y3MgxSiyAl5−x−yO12:Ce Single Crystalline Films

Using the LPE technique, three sets of optically perfect Y3MgxSiyAl5−x−yO12:Ce SCF samples with nominal equimolar Mg and Si contents in a melt solution equal to x, y = 1, 1.5, and 2 were grown onto YAG substrates with a (110) orientation from the supercooling melt–solution (MS) based on the PbO–B2O3 flux (Table 1). Additionally, another set of samples with nominal Mg and Mg–Si contents in MS in the 0–0.1 range were grown using the LPE method in order to study the photocurrent characteristics of doped Y3MgxSiyAl5−x−yO12:Ce SCFs (Table 1). The initial components for LPE growth were PbO, B2O3, Y2O3, Al2O3, SiO2, and CeO2 oxides of 4N purity.
The SCF contents of the SCF samples were measured using an EDX detector with a SEM JEOL JSM-820 electron microscope. The measurements were performed at five different points of the samples, and the results are averaged. The contents of the Y3MgxSiyAl5−x−yO12:Ce SCFs under study and the reference YAG:Ce SCF sample are presented in Table 1.
The segregation coefficients of Mg2+ and Si4+ ions in Y3MgxSiyAl5−x−yO12:Ce SCFs were defined from the microanalytical measurement of the compositions of these SCF samples grown at the nominal Mg(x) and Si(y) contents of these cations in the corresponding MS (Figure 1). Significant changes in the segregation coefficients of Mg and Si ions in the LPE growth of Y3MgxSiyAl5−x−yO12:Ce SCFs were caused by variations in the ratio of Mg/Si/Al cations in the MS (Figure 1). In particular, when the nominal Mg and Si contents in the MS increased in the x = 1–2 range, the segregation coefficients of the Mg2+ and Si4+ ions in as-grown films were nonlinearly changed in the 0.08–0.155 and 0.105–0.17 ranges, respectively. As a result, the real Mg and Si ion amounts in the Y3MgxSiyAl5−x−yO12:Ce SCF samples were varied correspondingly in the x = 0.104–0.345 and y = 0.081–0.31 ranges, respectively. Following the change in SCF growth temperature, the segregation coefficient of Ce3+ ions in the above-mentioned garnet hosts changed from 0.017 to 0.025. As a result, the Ce content in the SCF samples was only in the range of 0.175–0.225 at. % at the average Ce concentration in the MS of around 10 mole %.
The real concentrations of Mg and Si in SCFs are not equal, even at equimolar amounts of these ions in the MS, especially at the low contents of these dopants (Table 1). The Mg2+ concentration was systematically higher than the Si4+ content, as Table 1 demonstrates. This indicates that, for the local charge compensation of Mg2+ excess, various 4+ ion states can be formed, for instance, Ce4+ ions or Pb4+ flux-related ions. The local charge compensation of Mg2+ excess can also occur through the formation of O centers or oxygen vacancies [41,41]. Regarding Y3MgxSiyAl5−x−yO12 SCFs, we could predict the presence of both forms of charge compensation of Mg2+ excess: the dominant creation of the oxygen vacancies or O2− centers at relatively low Mg2+–Si4+ contents, and the preferential formation of Ce4+ and Pb4+ states at relatively high Mg–Si amounts (Figure 1).
The structural quality of Y3Mgx SiyAl5−x−yO12:Ce SCFs with varying Mg and Si contents, grown using the LPE method onto YAG substrates with (110) orientation with a lattice constant of 11.9930 Ȧ, was characterized using XRD measurements, performed using a modified DRON 4 spectrometer (Cu radiation) (Figure 2). The mismatch between the lattice constants of SCF and YAG substrates as Δa = (aSCF – asub)/asub × 100% being equal to 0.245% was evaluated from the respective XRD patterns of the SCF sample grown from an MS with a nominal Y3Mg2Si2Al3O12:Ce composition and real Y2.96Ce0.04Mg0.345Si0.31Al4.345O12 content (Figure 2). Additionally, we estimated that the lattice constant of the mentioned garnet composition from the XRD pattern was equal to 12.0224 Ȧ.

3. Experimental Methods and Technique

The absorption (Figure 3), cathodoluminescence (CL) (Figure 4), photoluminescence (PL) (Figure 5), and PL excitation (PLE) (Figure 6) spectra, and the PL decay kinetics (Figure 8 and Table 2) were recorded to characterize the optical and luminescence properties of Y3Mgx SiyAl5−x−yO12:Ce SCFs. We also measured the scintillation decay kinetics and photoelectron light yield (LY) of these SCF samples under excitation with α-particles from a 239Pu (5.15 MeV) source (Table 3 and Figure 9). The photocurrent (PC) excitation spectra of especially prepared Y3Mgx SiyAl5−x−yO12:Ce SCFs (Samples 5–8 in Table 1)) with reduced nominal Mg2+ and Mg2+–Si4+ contents in the x, y = 0–0.1 range were investigated on a custom setup consisting of a 150 W xenon lamp (LOT Quantum Design) coupled to a grating monochromator (Omni-λ 1509) operating in the 250–1000 nm spectral range as a source of excitation; a digital electrometer (Keysight B2987A) for photocurrent measurement; an optical chopper at 5 Hz to modulate the excitation light to increase the signal-to-noise ratio; a lock-in amplifier (Signal Recovery 7270, Ametek Scientific Instruments) to extract the photocurrent signal.
A SEM JEOL JSM-820 electron microscope with a Stellar Net grating spectrometer operating in the 200–1120 nm spectral range was used to measure the CL spectra. An Edinburgh FS5 spectrometer was used to study the PL emission and excitation spectra, and PL decay kinetics of the SCF samples. Using a Hamamatsu H6521 PMP, multichannel analyzer, and digital TDS3052 oscilloscope setup, the scintillation LY with a shaping time of 12 s and decay kinetics were measured under excitation with α-particles of 239Pu (5.15 MeV) source. Furthermore, the absorption, luminescence, scintillation, and PC properties of the Y3MgxSiy Al5−x−yO12:Ce SCFs were compared with the properties of the reference YAG:Ce SCF sample. All PC and luminescence measurements were carried out at room temperature (RT).

4. Absorption, Luminescence, and Photoconductivity Properties of Y3MgxSiyAl5−x−yO12:Ce Films

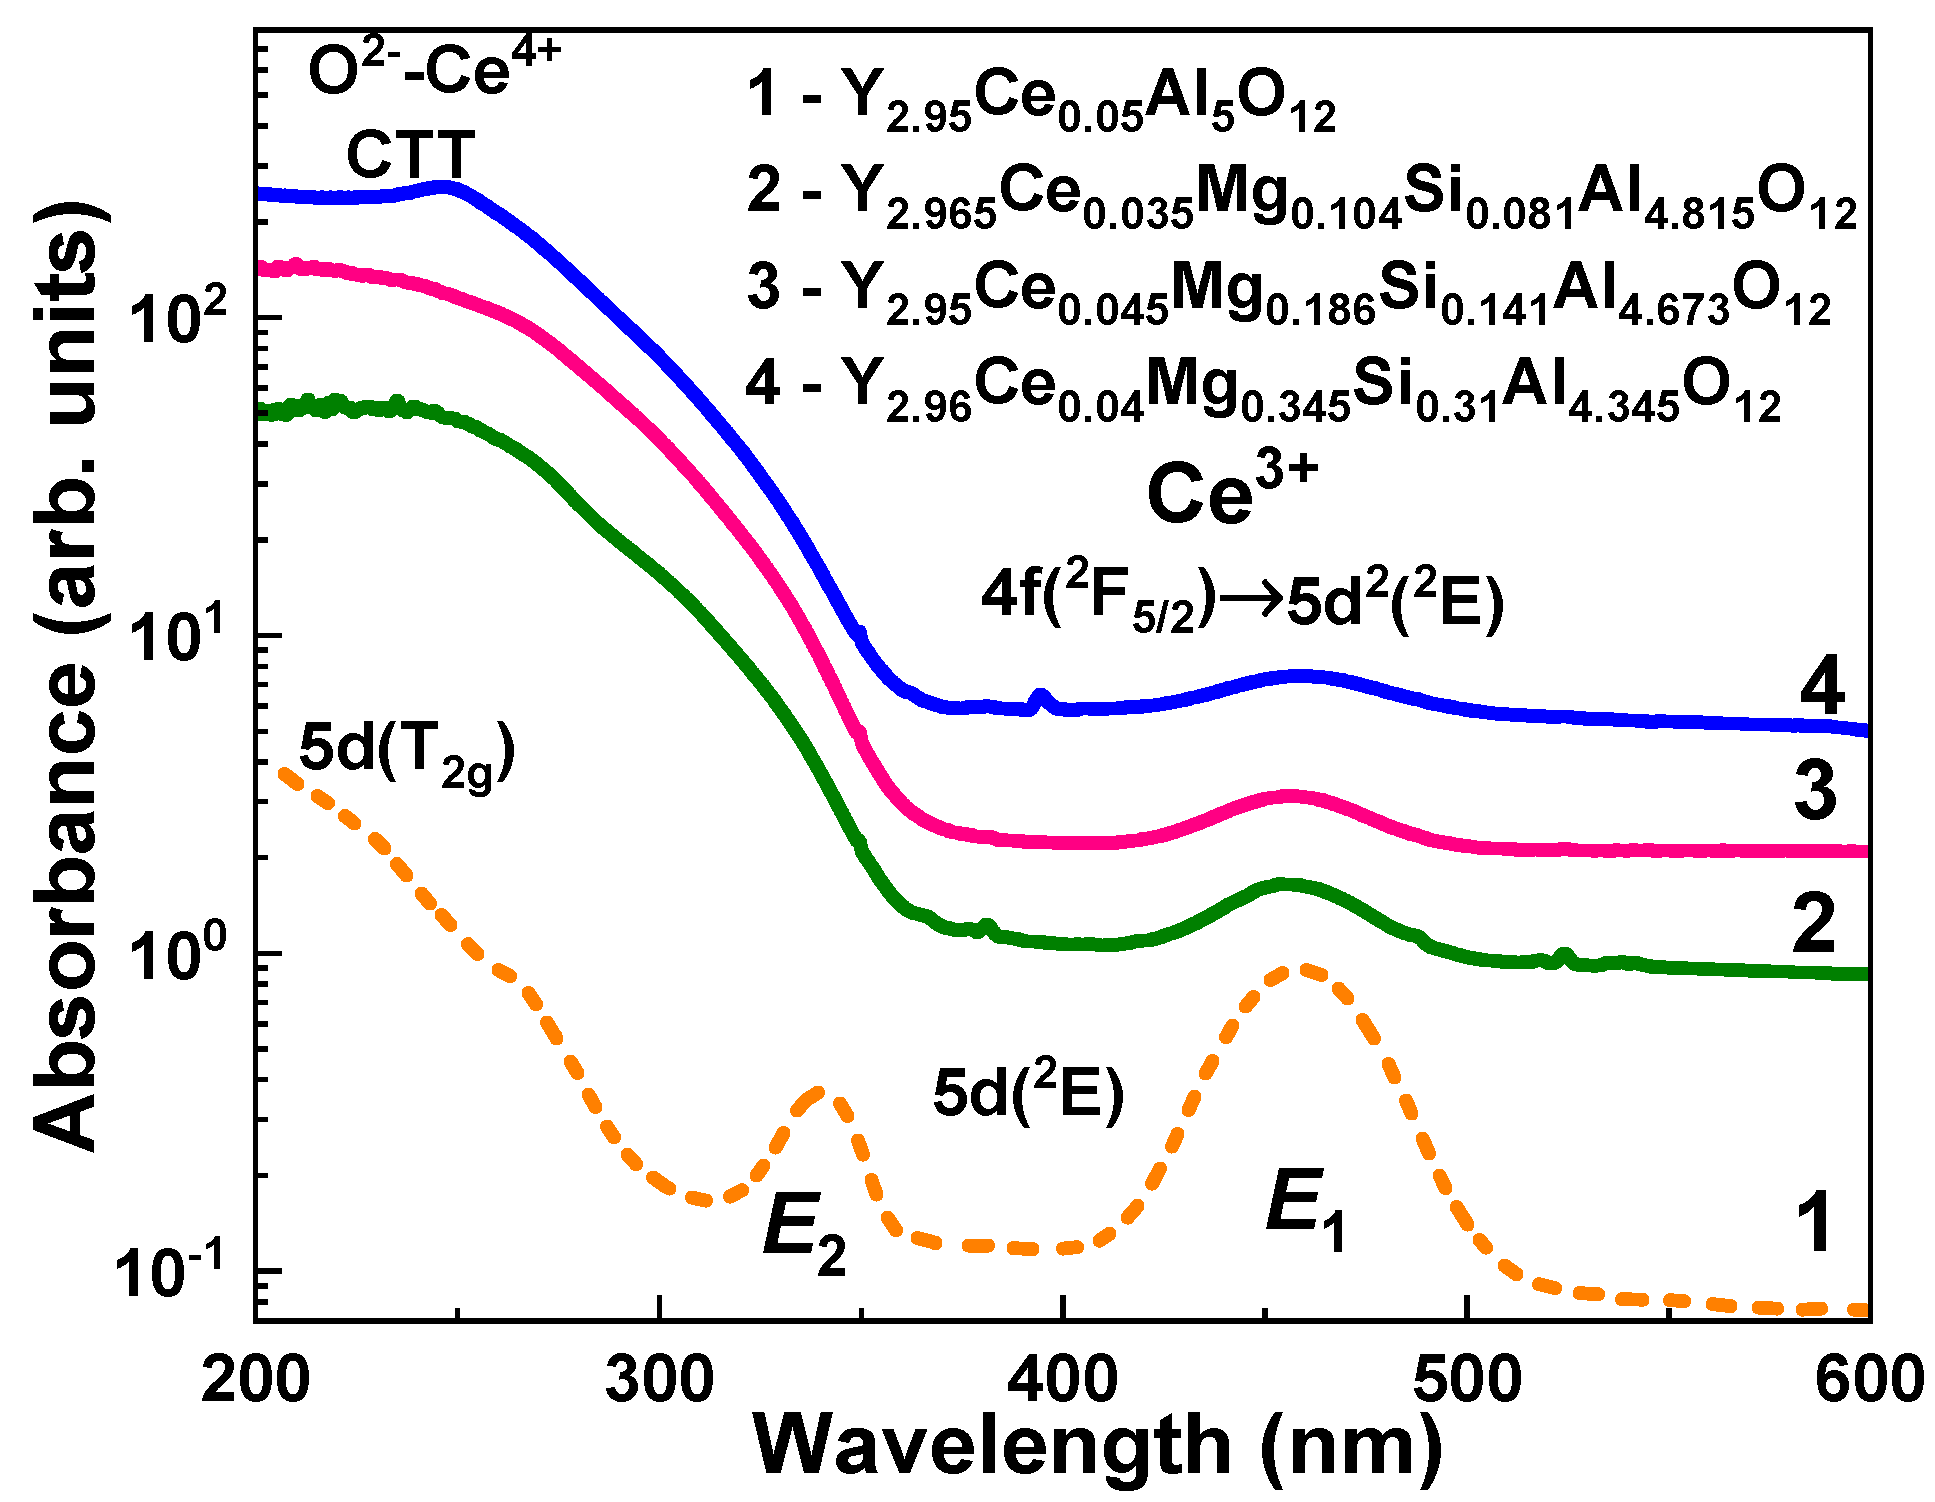
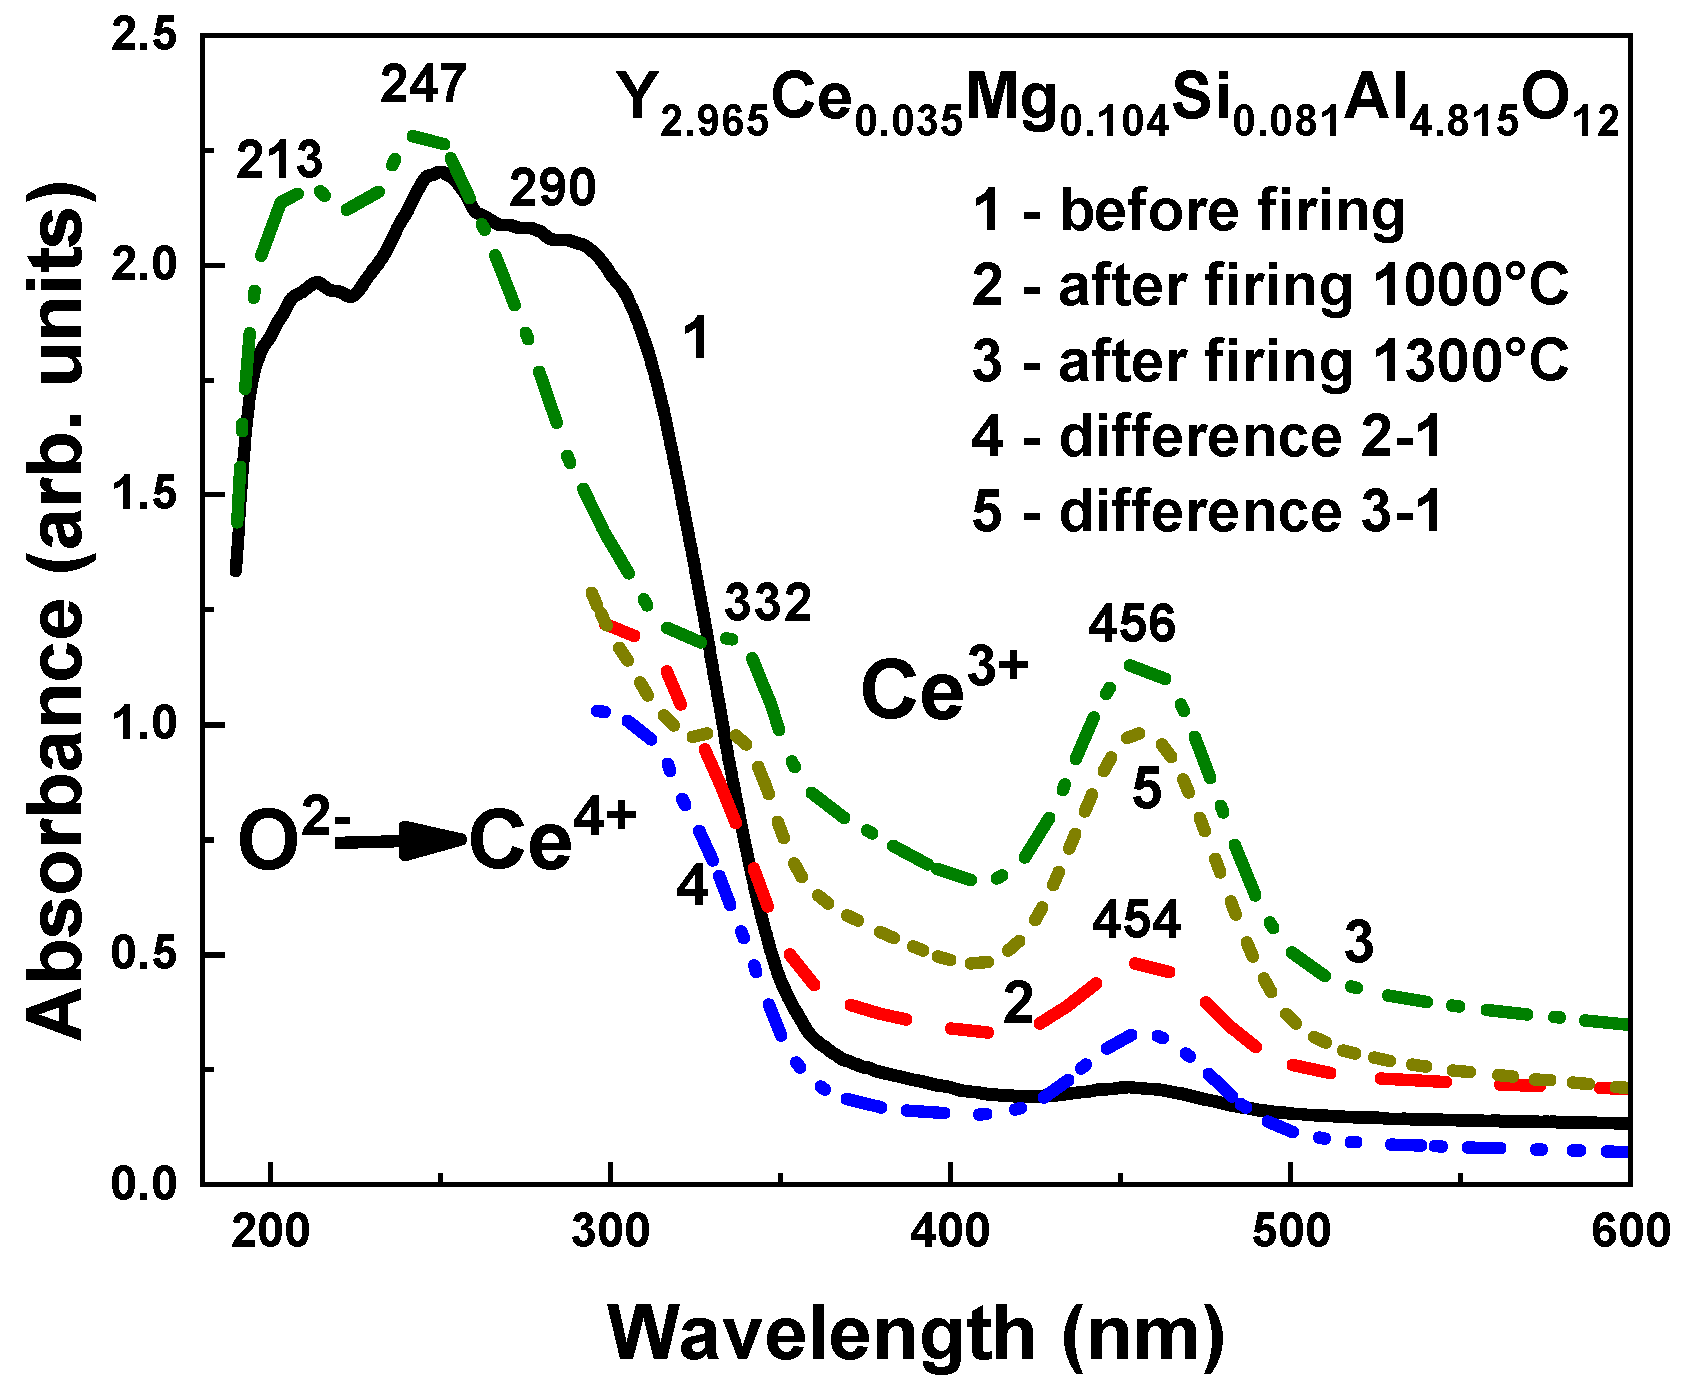
4.1. Absorption Spectra

Figure 3 shows the absorption spectra of Y3MgxSiyAl5−x−yO12:Ce SCFs with various Mg/Si contents in comparison with the spectra of the YAG:Ce SCF. The detected E1 and E2 absorption bands peaked at 458.5 and 340 nm, respectively, corresponding to the 4f1(2F5/2) → 5d (T2g) transitions of Ce3+ ions (Figure 3, curve 1). The 4f1(2F5/2) → 5d (T2g) transitions of Ce3+ ions are responsible for the bumps at 230 nm in the spectra of these SCFs. The maximal positions of the E1 band in the Y3MgxSiyAl5−x−yO12:Ce SCFs with different Mg/Si amounts were slightly shifted in the 456–459 nm range compared to the maximum of the respective band at 458.5 nm in YAG:Ce SCF (Figure 3, Curves 2–4).
In addition to these bands, another wide band that peaked at about 248 nm was present in the absorption spectra of the Y3MgxSiyAl5−x−yO12:Ce SCFs. This band strongly overlapped with the E2 band (Figure 3, Curves 2–4). The position of this band was close to the identical transitions in Ca2+ and Mg2+ codoped crystals, and the single crystalline films of Lu3Al5O12:Ce and Gd3Ga3Al2O12:Ce and Lu3Al5O12:Ce garnets [42,43,44,45,46,47,48,49]. This suggests that the nature of this band may be related to the O2− → Ce4+ charge transfer transitions (CTT) [42,43,44,45,46,47,48,49]. Indeed, the Ce3+ and Ce4+ valence states coexist in the as-grown Y3MgxSiyAl5−x−yO12:Ce SCFs, as confirmed by the existence of the respective absorption bands of these centers, as shown in Figure 3. The relative concentrations of these centers were highly influenced by Mg/Si/Ce contents and SCF crystallization conditions. Specifically, the intensity of the Ce3+ E1 band decreased with increasing Mg2+ and Si4+ contents in the x = 0.104–0.345 and y = 0.081–0.31 ranges, probably as a result of the Ce3+ → Ce4+ recharge. The beginning of the O2− → Ce4+ CTT in the studied SCFs could even be shifted to 400 nm, causing a large overlap of the E2 absorption bands of the Ce3+ ions.
In addition to Ce3+-associated bands, the absorption spectra of the Y3MgxSiyAl5−x−yO12:Ce SCFs grown from PbO-based flux had bands peaking at 260–263 nm. These bands correspond to the 1S03P1 transitions of Pb2+ ions as the main flux pollution in the SCFs grown from PbO-based flux [21]. The comparable band in the YAG:Ce SCF analogue peaked at 263 nm (Figure 3, Curve 1).

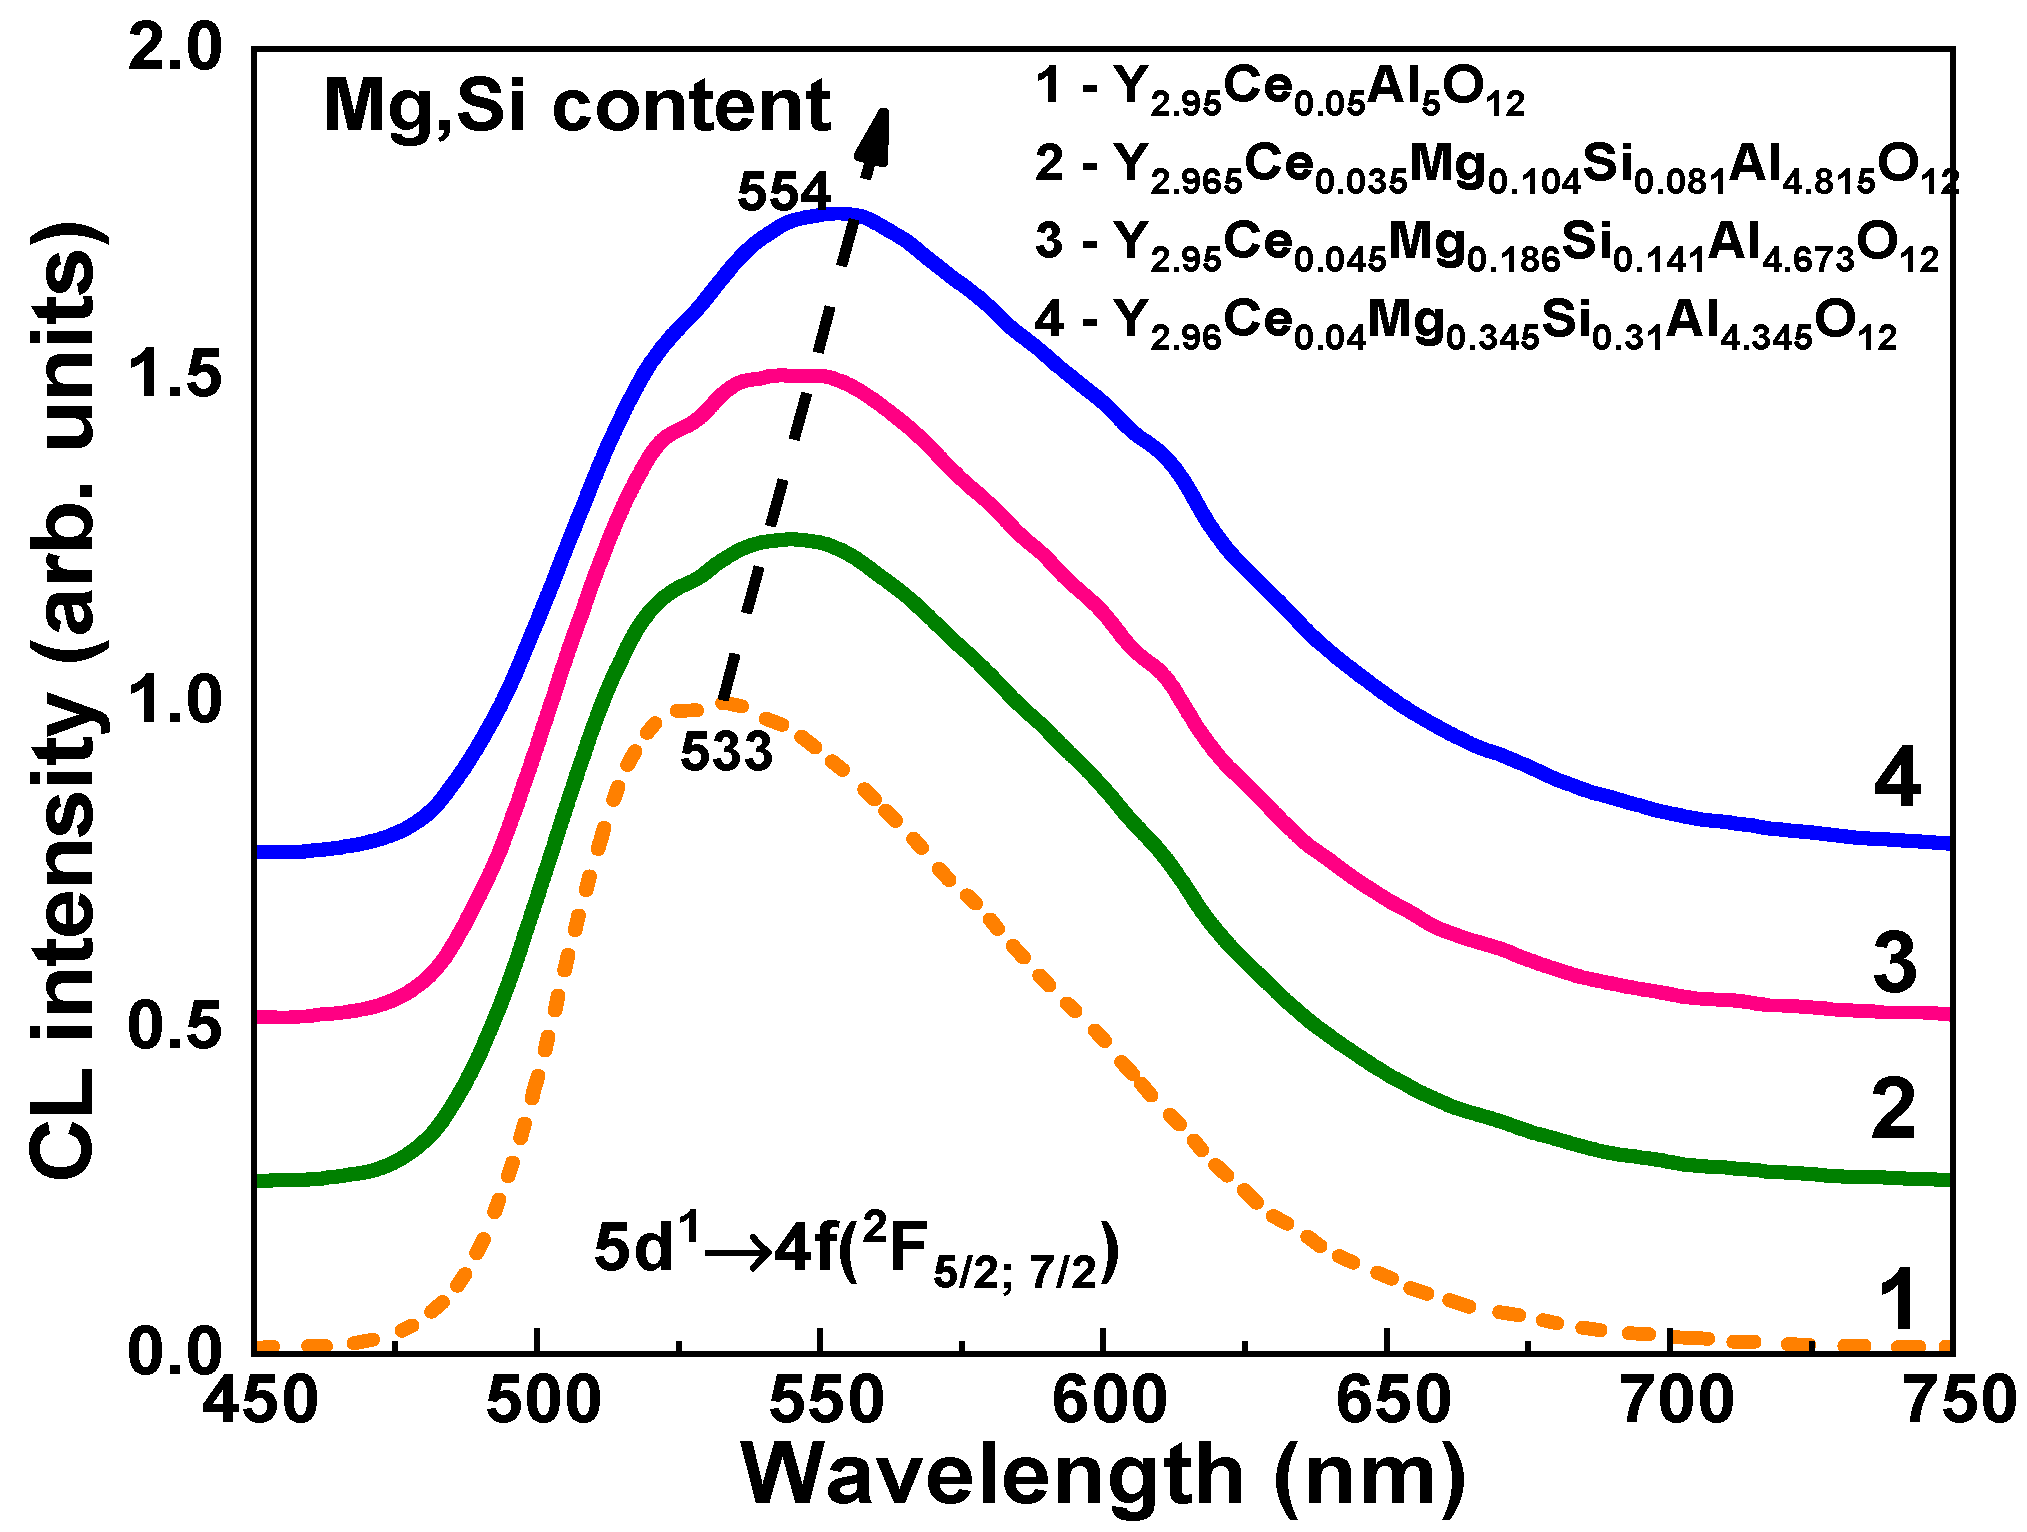
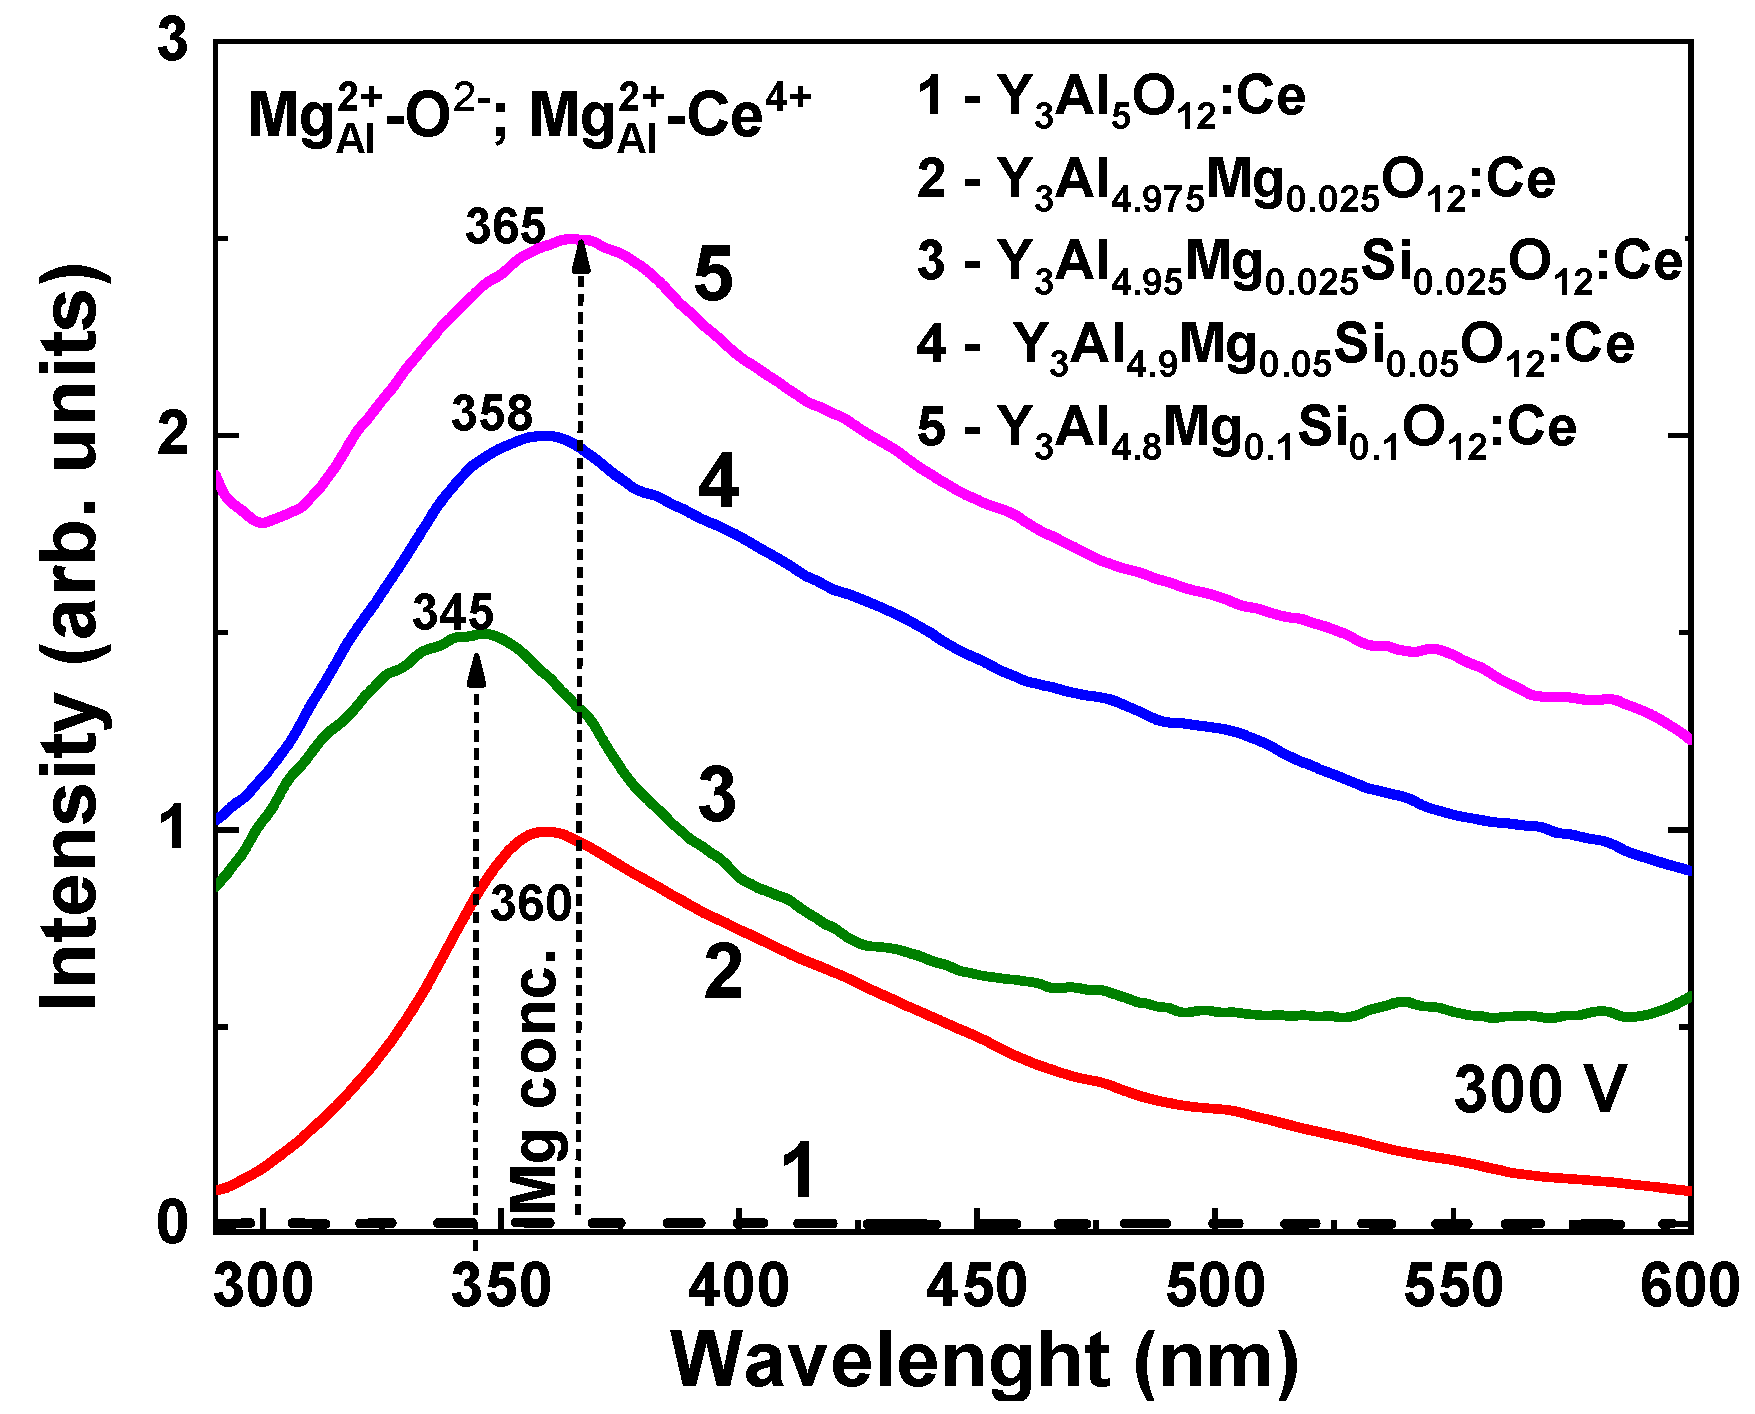
4.2. Cathodoluminescence Spectra

The normalized CL spectra of Y3MgxSiyAl5−x−yO12:Ce SCF samples at RT with various Mg/Si contents are presented in Figure 4 (Curves 2–4) in comparison with their YAG:Ce counterpart (curve 1). The dominant luminescence band in the YAG:Ce SCF with the maximum at 533 nm (Figure 4, Curve 1) occurred in this garnet and corresponded to the Ce3+ ion’s 5d1 → 4f(2F5/2; 7/2) transitions. With increasing Mg and Si contents, the location of these bands in Y3MgxSixAl5−2xO12:Ce SCFs displayed a strong red shift up to 554 nm (Figure 4, Curves 2–4). In contrast to YAG:Ce SCFs, the CL spectra of Y2.96Ce0.04Mg0.345 Si0.31Al4.345O12 SCF were actually red-shifted by 21 nm. Furthermore, the Ce3+ emission bands in Y3MgxSiyAl5−x−yO12:Ce SCFs were noticeably wider than those in YAG:Ce. Namely, in Y2.96Ce0.04 Mg0.345Si0.31Al4.345O12, the respective FWHM value of the Ce3+ emission band was equal to 0.466 eV, but in the YAG:Ce SCF, it was only 0.396 eV (Figure 4).

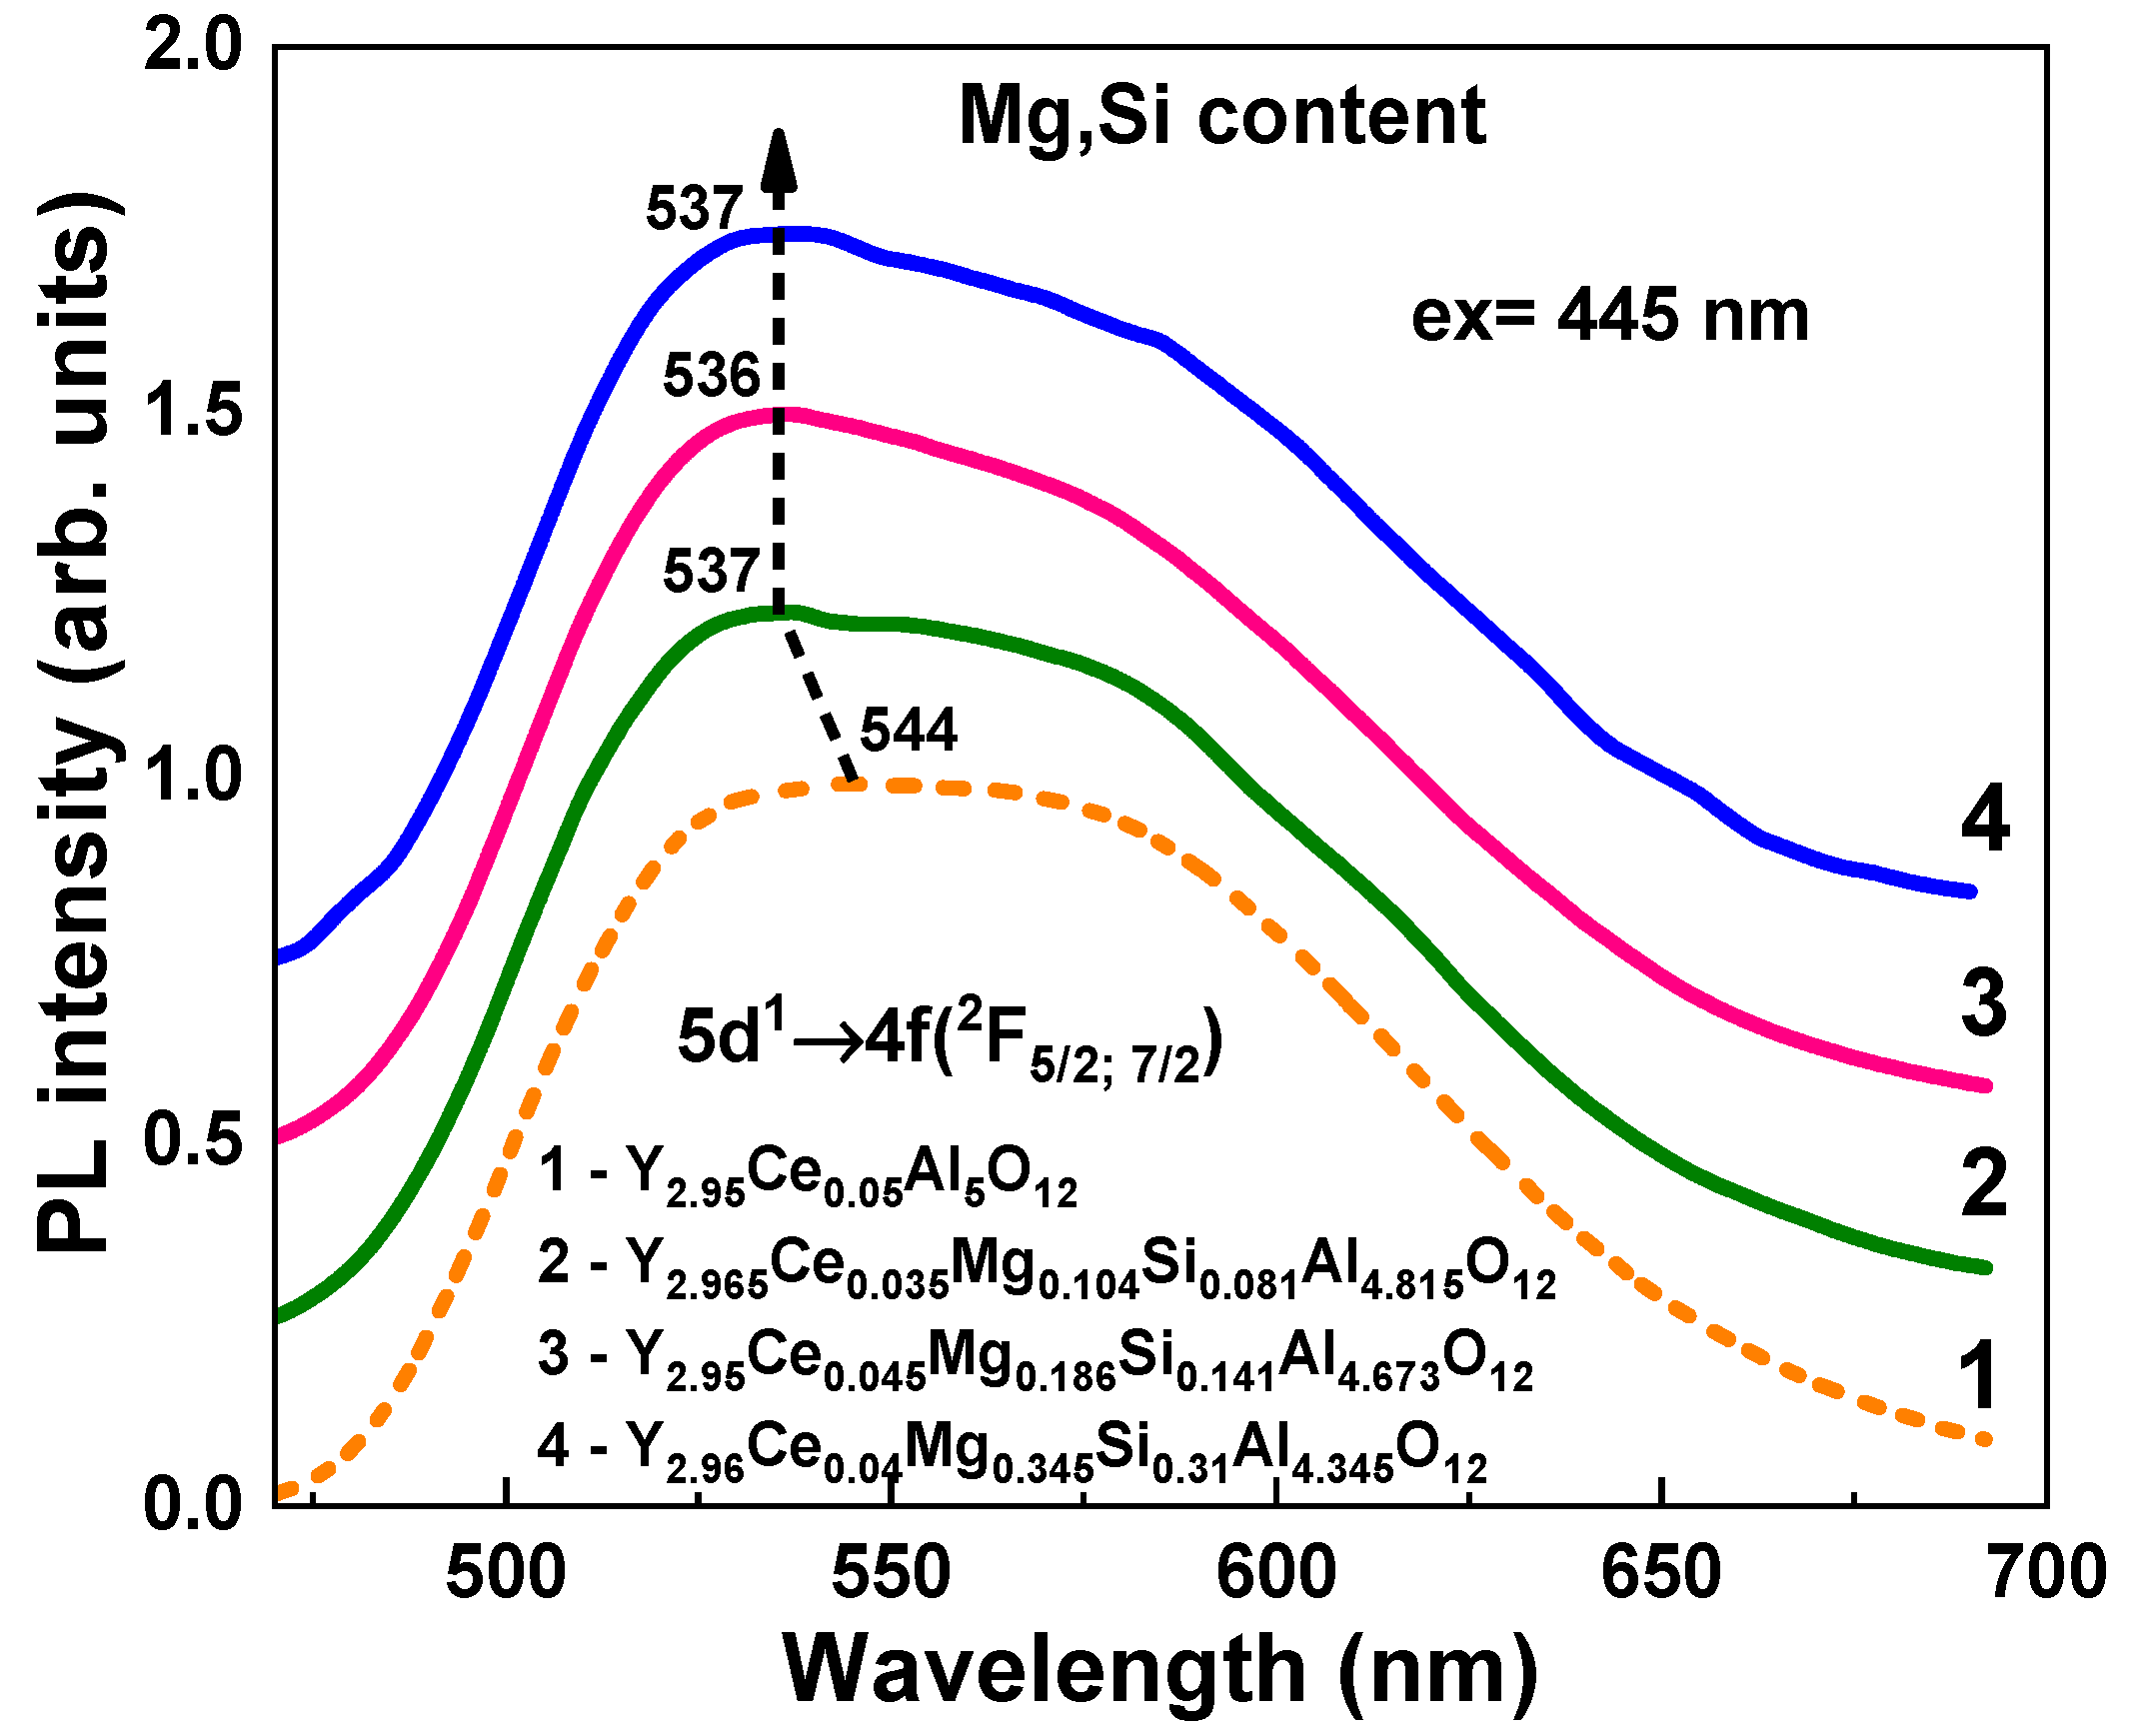
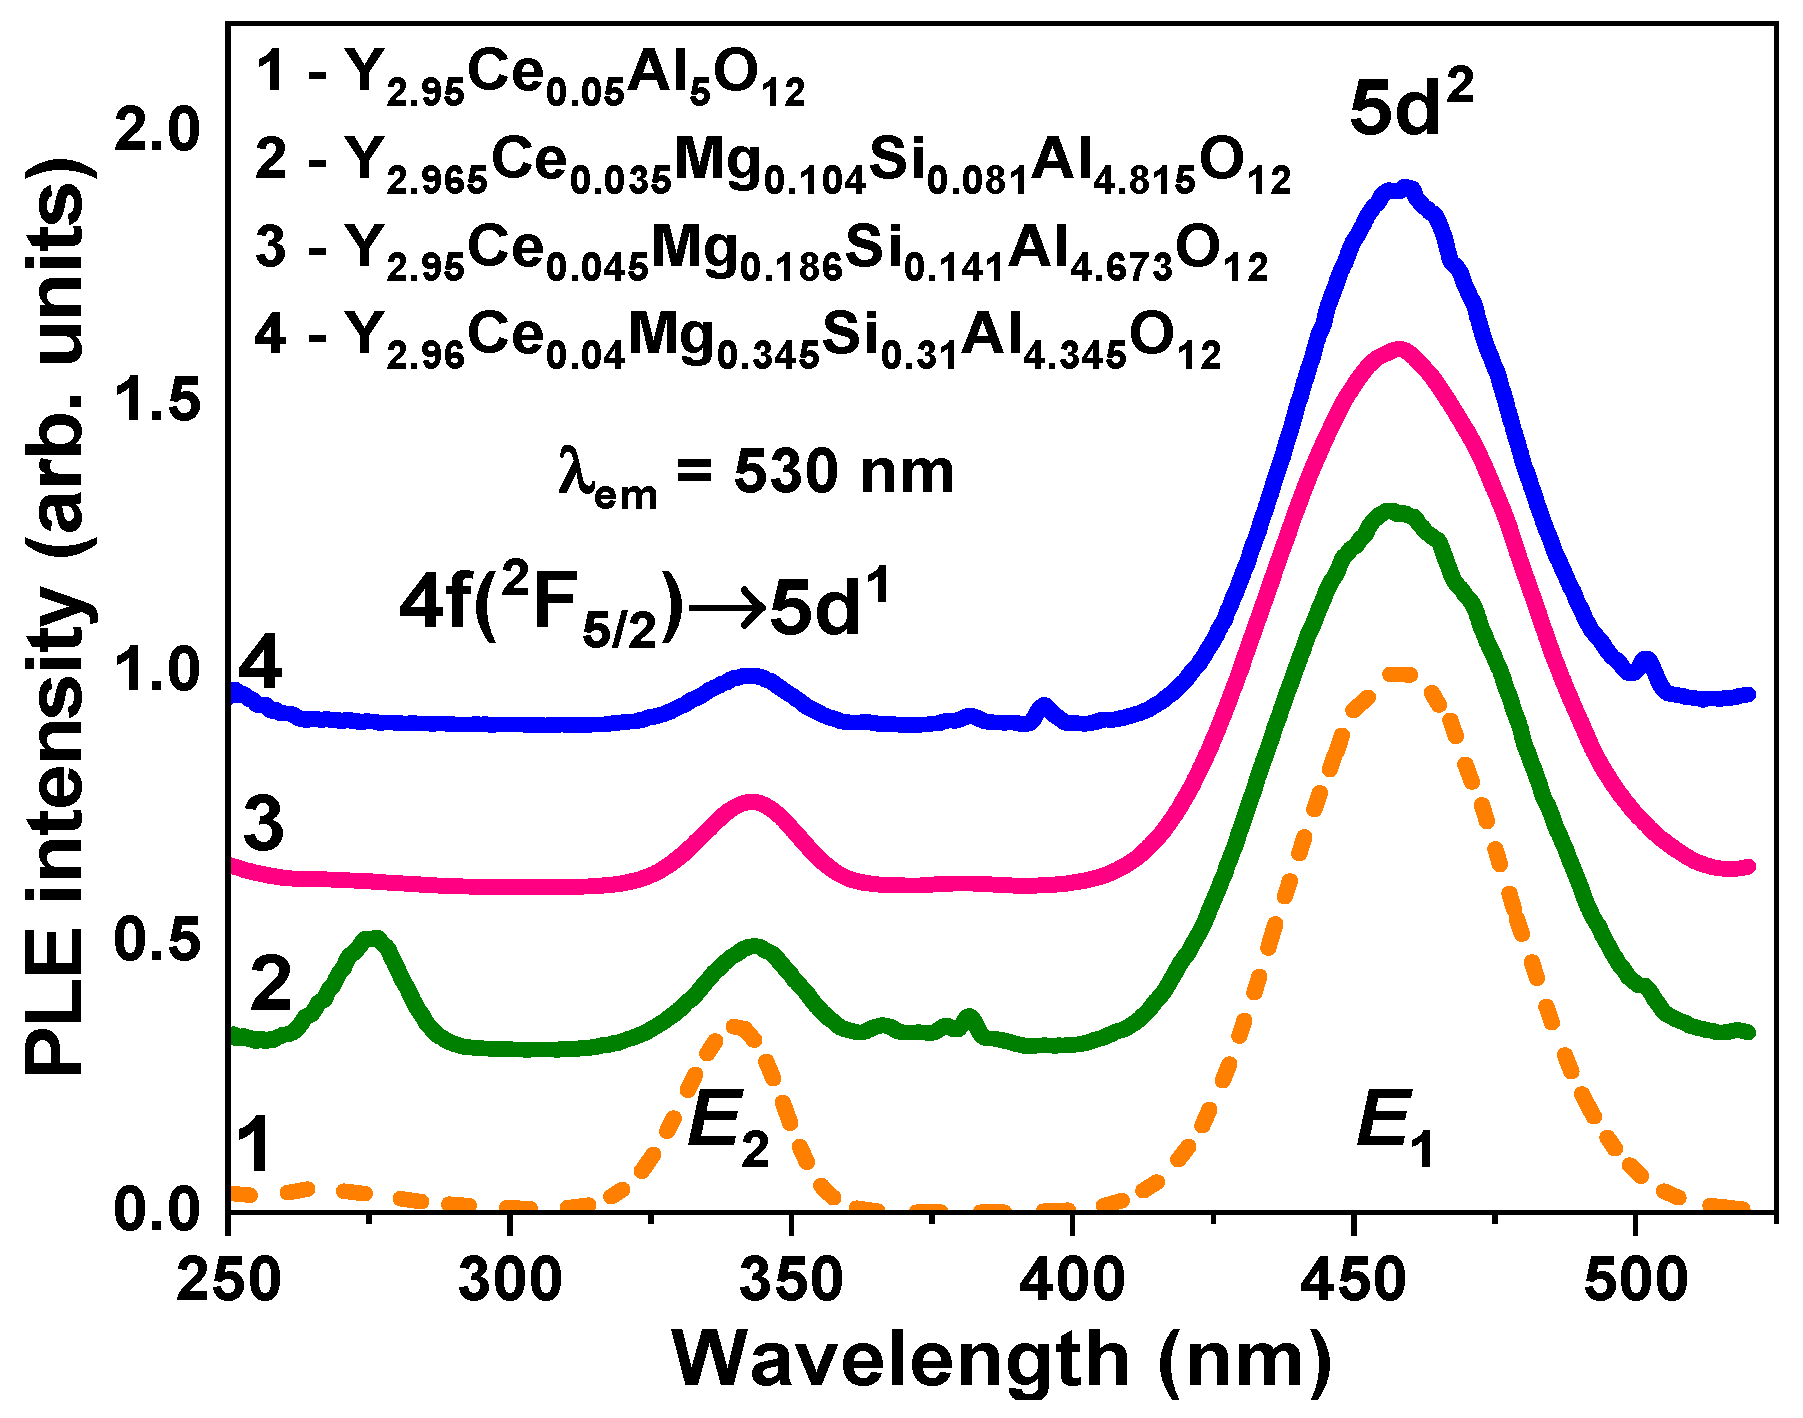
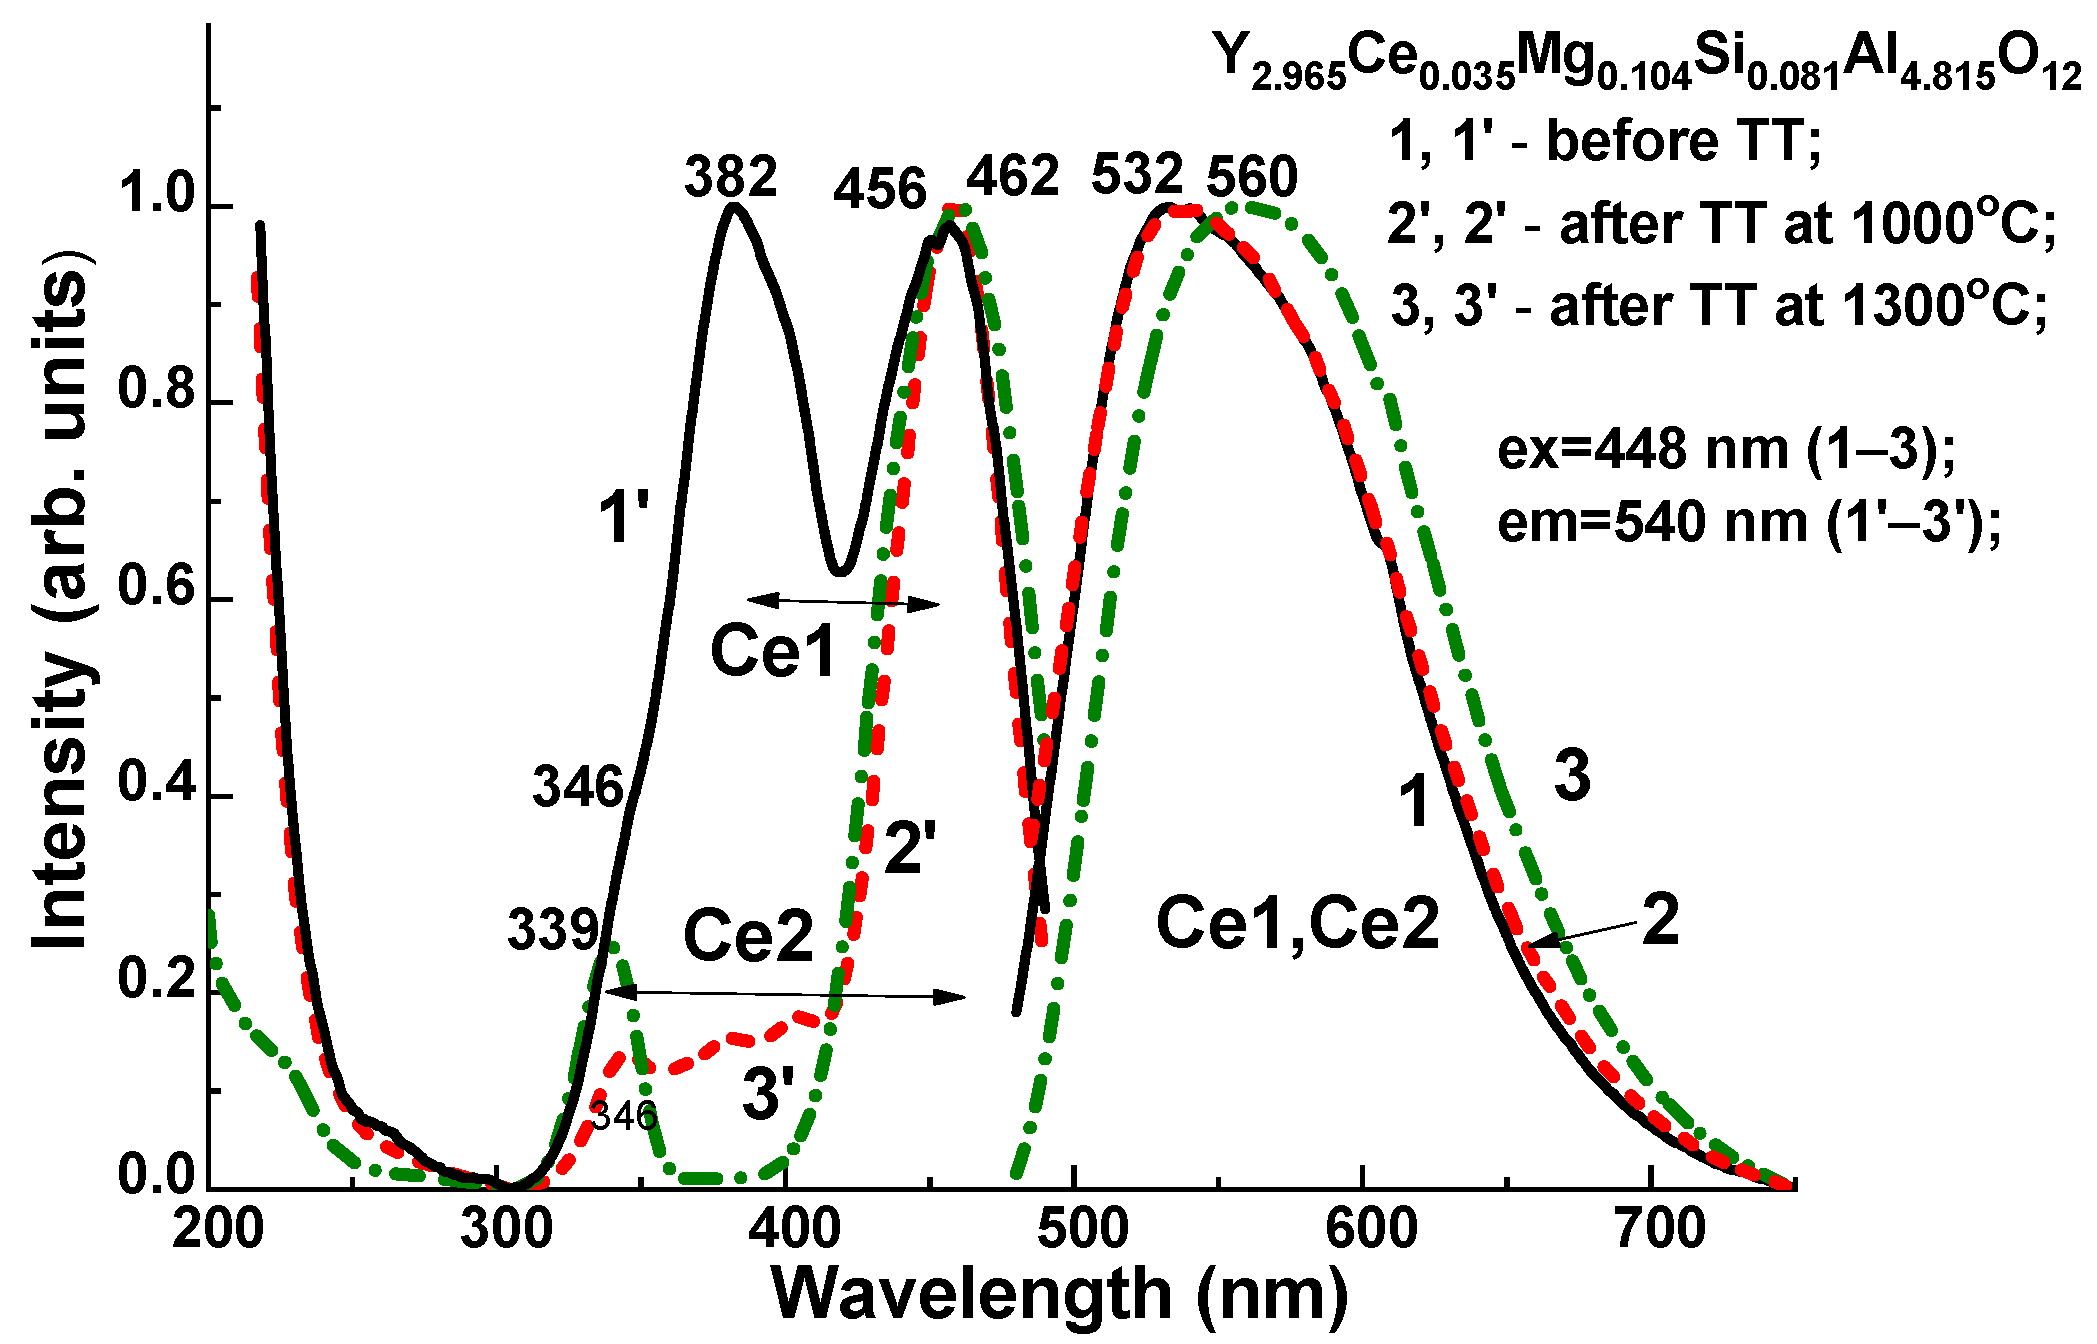
4.3. Photoluminescence Spectra

Under stimulation in the vicinity of the E1 Ce3+ absorption band at 445 nm, the wide PL band in Y3MgxSiyAl5−x−yO12:Ce SCFs peaked at 550 nm for the Y2.95Ce0.05Al5O12 and at approximately 536 nm for other SCFs with varied Mg/Si contents. This PL band corresponded to the radiative 5d1 → 4f(2F5/2,7/2) transitions of Ce3+ ions (Figure 5). The position of the PL emission bands and their FHWM in Y3MgxSiyAl5−x−yO12:Ce SCFs under 450 nm excitation, however, reveal a more complex dependency on the x and y values than that indicated by the CL spectra (Figure 4). In particular, the PL spectra of Y3MgxSiyAl5−x−yO12:Ce SCFs had a considerable blue shift relative to the spectra of YAG:Ce SCF, which was only 7–8 nm (Figure 5). Furthermore, the PL spectra of these SCFs were notably narrower than the YAG:Ce counterpart. Namely, for the Y2.965Ce0.045Mg0.186Si0.141Al4.763O12 and Y2.96Ce0.04Mg0.345Si0.31Al4.635O12 SCFs, the respective FWHM values were 0.478 and 0.467 eV in comparison with FWHM = 0.495 eV for the YAG:Ce SCF. Therefore, the PL spectra of Y3MgxSiyAl5−x−yO12:Ce SCFs showed different trends with changing the Mg2+–Si4+ concentrations compared with the corresponding CL spectra (Figure 4). This further indicates the complicated nature of the Ce3+ center formation in these garnets and the influence of some variables on the process.
Two E1 and E2 bands with peaks at 460 nm and in the 340–343 nm range, respectively, were observed in the excitation spectra of the Ce3+ luminescence in Y3MgxSiyAl5−x−yO12:Ce SCFs. These bands were associated with the 4f(2F5/2) → 5d1,2 transitions of Ce3+ ions in these garnets (Figure 6). Namely, for Samples 2–4 of the Y3MgxSiyAl5−x−yO12:Ce SCFs (Figure 6), difference ΔE = E2E1, which was proportional to the crystal field strength in the dodecahedral position of the garnet, was equal to 0.894, 0.901, and 0.907 eV, respectively. These ΔE values significantly differed from the ΔE = 0.935 eV value in the YAG:Ce SCF. Additionally, the Stokes shift was much smaller in the Y3MgxSiyAl5−x−yO12:Ce SCF samples (Sample 2: 90 nm and 0.448 eV; Sample 3: 81 nm and 0.406 eV; Sample 4: 79 nm and 0.396 eV) in comparison with that in the YAG:Ce SCF (91.5 nm; 0.451 eV).
Even at the significantly large content of Mg2+ ions in the 0.31–0.345 range, the bands that peaked at 275 and around 375 nm in the excitation spectra, related to the intrinsic transitions of F+ centers [40,50], were not found in the excitation spectra of the Ce3+ luminescence in the Y3MgxSiyAl5−x−yO12:Ce SCFs (Figure 6). Such results contradict the results of Y3−xCaxSiyAl5−yO12:Ce SCFs, where the creation of F+ centers was observed for the compensation of the excess of divalent Ca2+ ions [40]. However, the results for Y3MgxSiyAl5−x−yO12:Ce SCFs correlate well with the investigation results of the Gd3Al5−xGaxO12:Ce,Mg crystal [41], where the emission of F+ was also not found. Therefore, the excess of Mg2+ ions in the Y3MgxSiyAl5−x−yO12:Ce SCFs was compensated by other mechanisms that are probably connected with the creation of Ce4+ states or/and O2−–Mg2+ pair centers [41].
Figure 7 shows the decay kinetics of the Ce3+ ion emission in the Y3MgxSiyAl5−x−yO12:Ce SCFs with various Mg and Si contents under excitation at 340 nm near the E2 Ce3+ ion absorption bands compared to the YAG:Ce SCF counterpart. The decay kinetics of the Y3MgxSiyAl5−x−yO12:Ce SCFs (Figure 7, Curves 2–4) was significantly nonexponential in contrast to the YAG:Ce SCF (Figure 7, Curve 1) and similar to that of other A2+–Si4+ (A = Ca, Mg)-based garnets [37,38,40,43,44]. As the x and y values rose, the corresponding decay curves became faster and more nonexponential. Due to this fact, the decay curves may have been extrapolated by the three components, each with a decay time value t at intensity decay levels of 1/e, 0.1, and 0.001 (Figure 7). Table 2 lists the corresponding decay times of τ1/e, τ1/10, and τ1/100.
Figure 7. RT decay kinetics of Ce3+ luminescence at 530 nm in Y3MgxSiyAl5−x−yO12:Ce SCFs with various Mg and Si contents (Curves 2–4) under excitation at 404 nm and registration of PL at 530 nm, compared with the decay kinetics of Ce3+ emission in YAG:Ce SCF (curve 1). The respective approximations of the decay curves are presented by the dashed lines.
Materials 16 01869 g007
Similarly to the results in [37,38,40,43,44], we assumed that the formation of Ce4+ valence states was the primary cause of the nonexponential decay kinetics of the Ce3+ luminescence in the as-grown Y3MgxSiyAl5−x−yO12:Ce SCFs. The intervalence charge transfer (IVCT) transitions that cause quick nonradiative decay channels could also impact the acceleration of the Ce3+ decay in the presence of Ce4+ ions [51,52,53]. Recent studies described this effect for Ce3+/Ce4+ couples in garnets and sulfides [52,53]. Additionally, we recently demonstrated that Ce4+ ions, which serve as highly efficient electron trapping centers, may significantly accelerate the decay kinetics of Ce3+ luminescence under excitation with the energies in the vicinity of O2− → Ce4+ CTTs [38,39,40,41,42,43,44]. The initiation of the O2− → Ce4+ transitions is also possible under 340 nm excitation in the E2 Ce3+ absorption band in garnets due to the substantial FWHM value of the mentioned CTT bands [42,43,44]. The charge transfer of Ce4+ into the Ce3+ state and the subsequent reverse transformation of Ce3+ into Ce4+ ions allowed for us to observe the luminescence of Ce3+ ions under 340 nm excitation [38,39,40,41,42,43,44].
According to this supposition, the fast components of the cerium luminescence with a lifetime of t1/e = 1.1–13 ns in Y3MgxSiyAl5−x−yO12:Ce SCFs under 340 nm excitation may have been caused by Ce4+ centers, whereas the slower components, with decay times of t1/20 = 10–45 and 30–156 ns, were mostly caused by Ce3+ ion radiative transitions. Ce3+ luminescence in YAG:Ce SCF had decay time constants of t1/e = 60.5 ns, t1/20 = 140 ns, and t1/100 = 293 ns (Figure 7, Curve 1).
The existence of the fast component of the Ce3+ luminescence in the ns range was interesting, and the nonexponential shape of the decay curves in the garnet compounds containing Ca–Mg–Si ions could have been connected to the formation of Ce3+ multicenters [38,39,40]. The energy transfer processes between different Ce3+ emitting centers could correspond to such a nonexponential form of the decay curves [38,39]. Nevertheless, the presence of Ce4+ centers in the as-grown SCFs substantially masked the contribution of the above-mentioned energy transfer mechanisms to the nonexponential PL decay kinetics of the Ce3+ luminescence. Consequently, it was only possible to analyze the impact of the energy transfer mechanisms between Ce3+ multicenters after the elimination of Ce4+ centers by using the thermal treatment of SCFs in a reducing atmosphere [38].

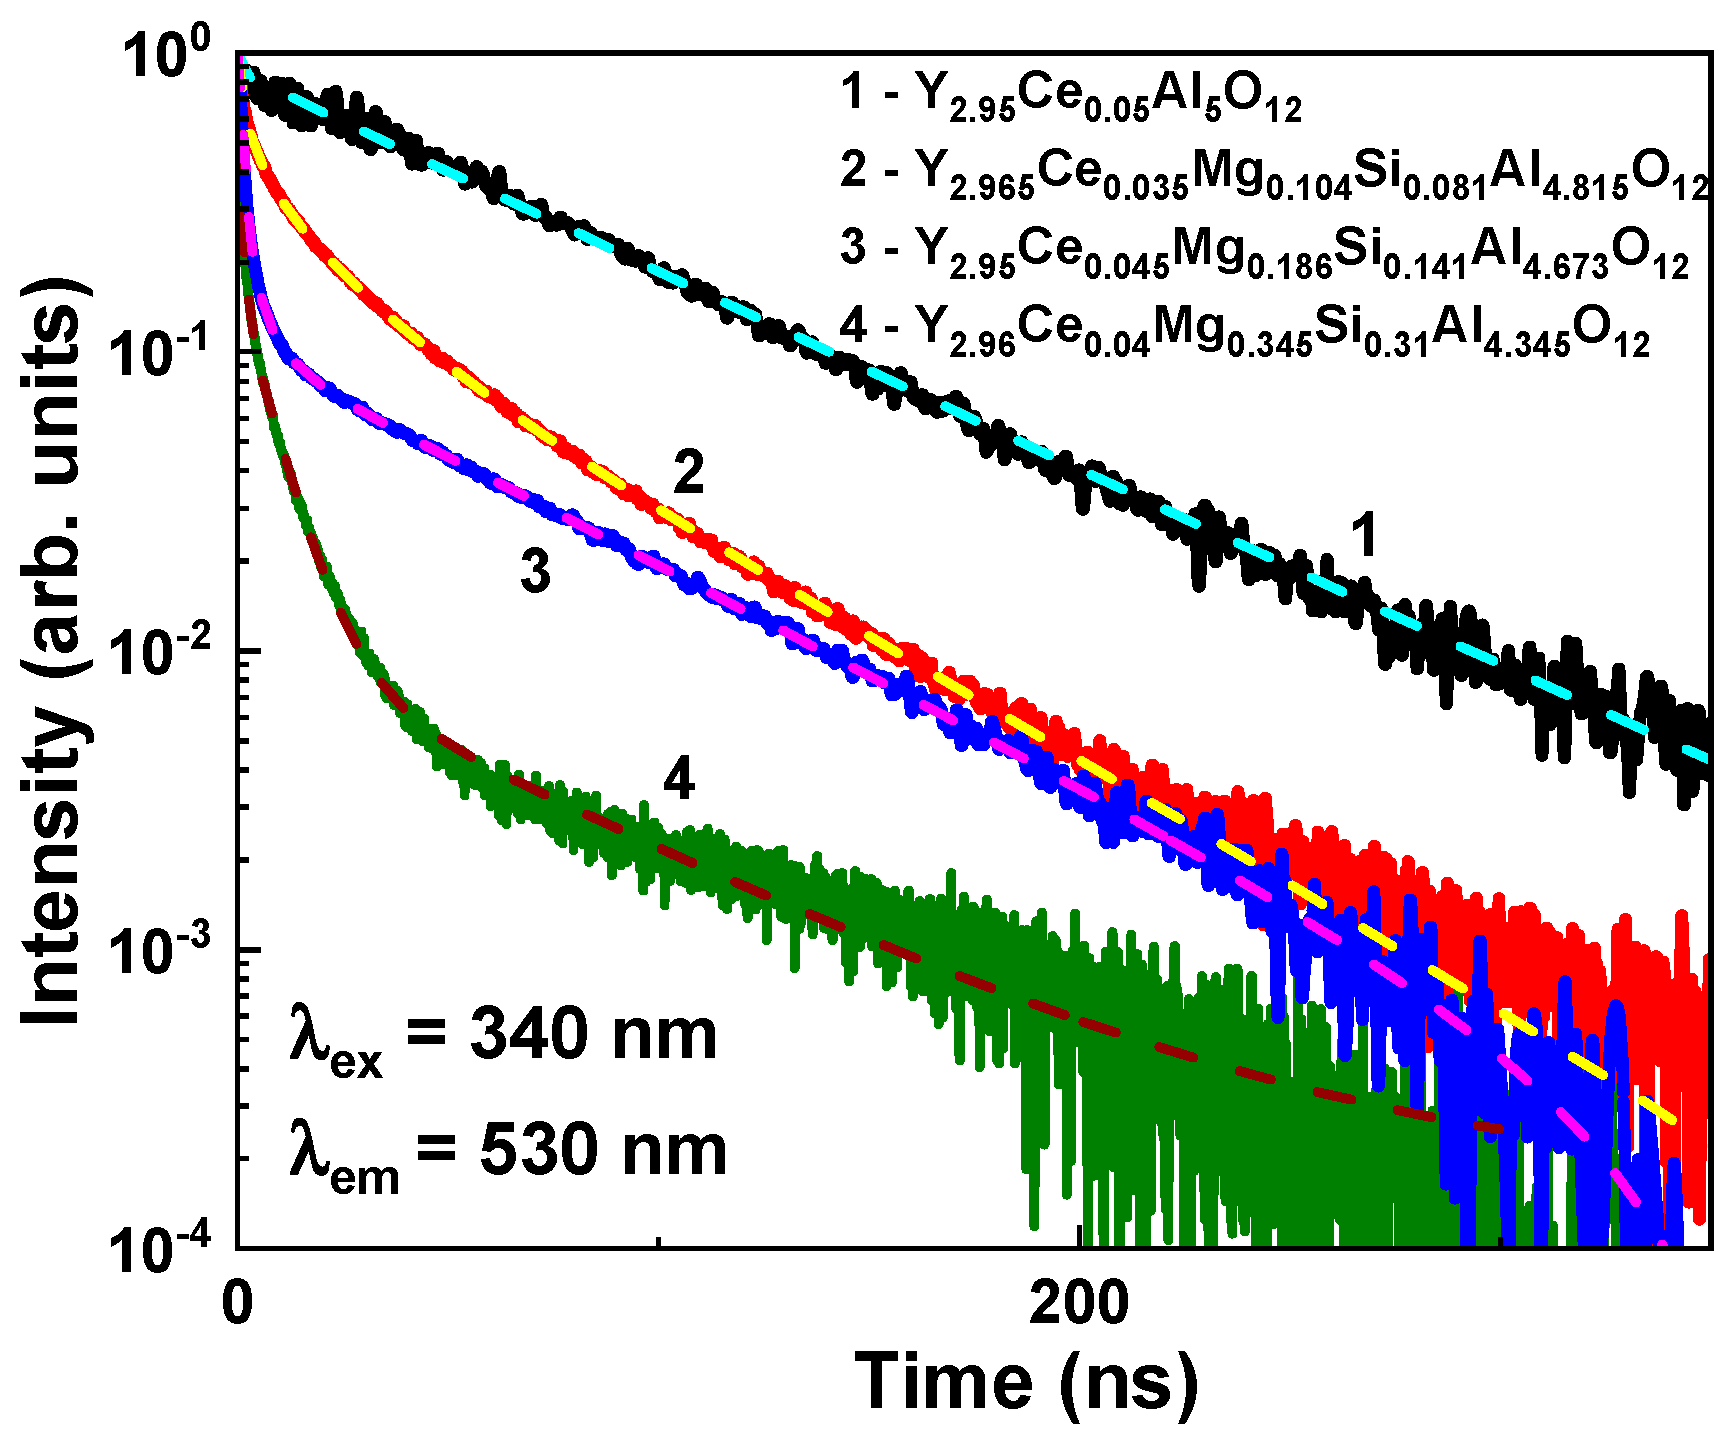
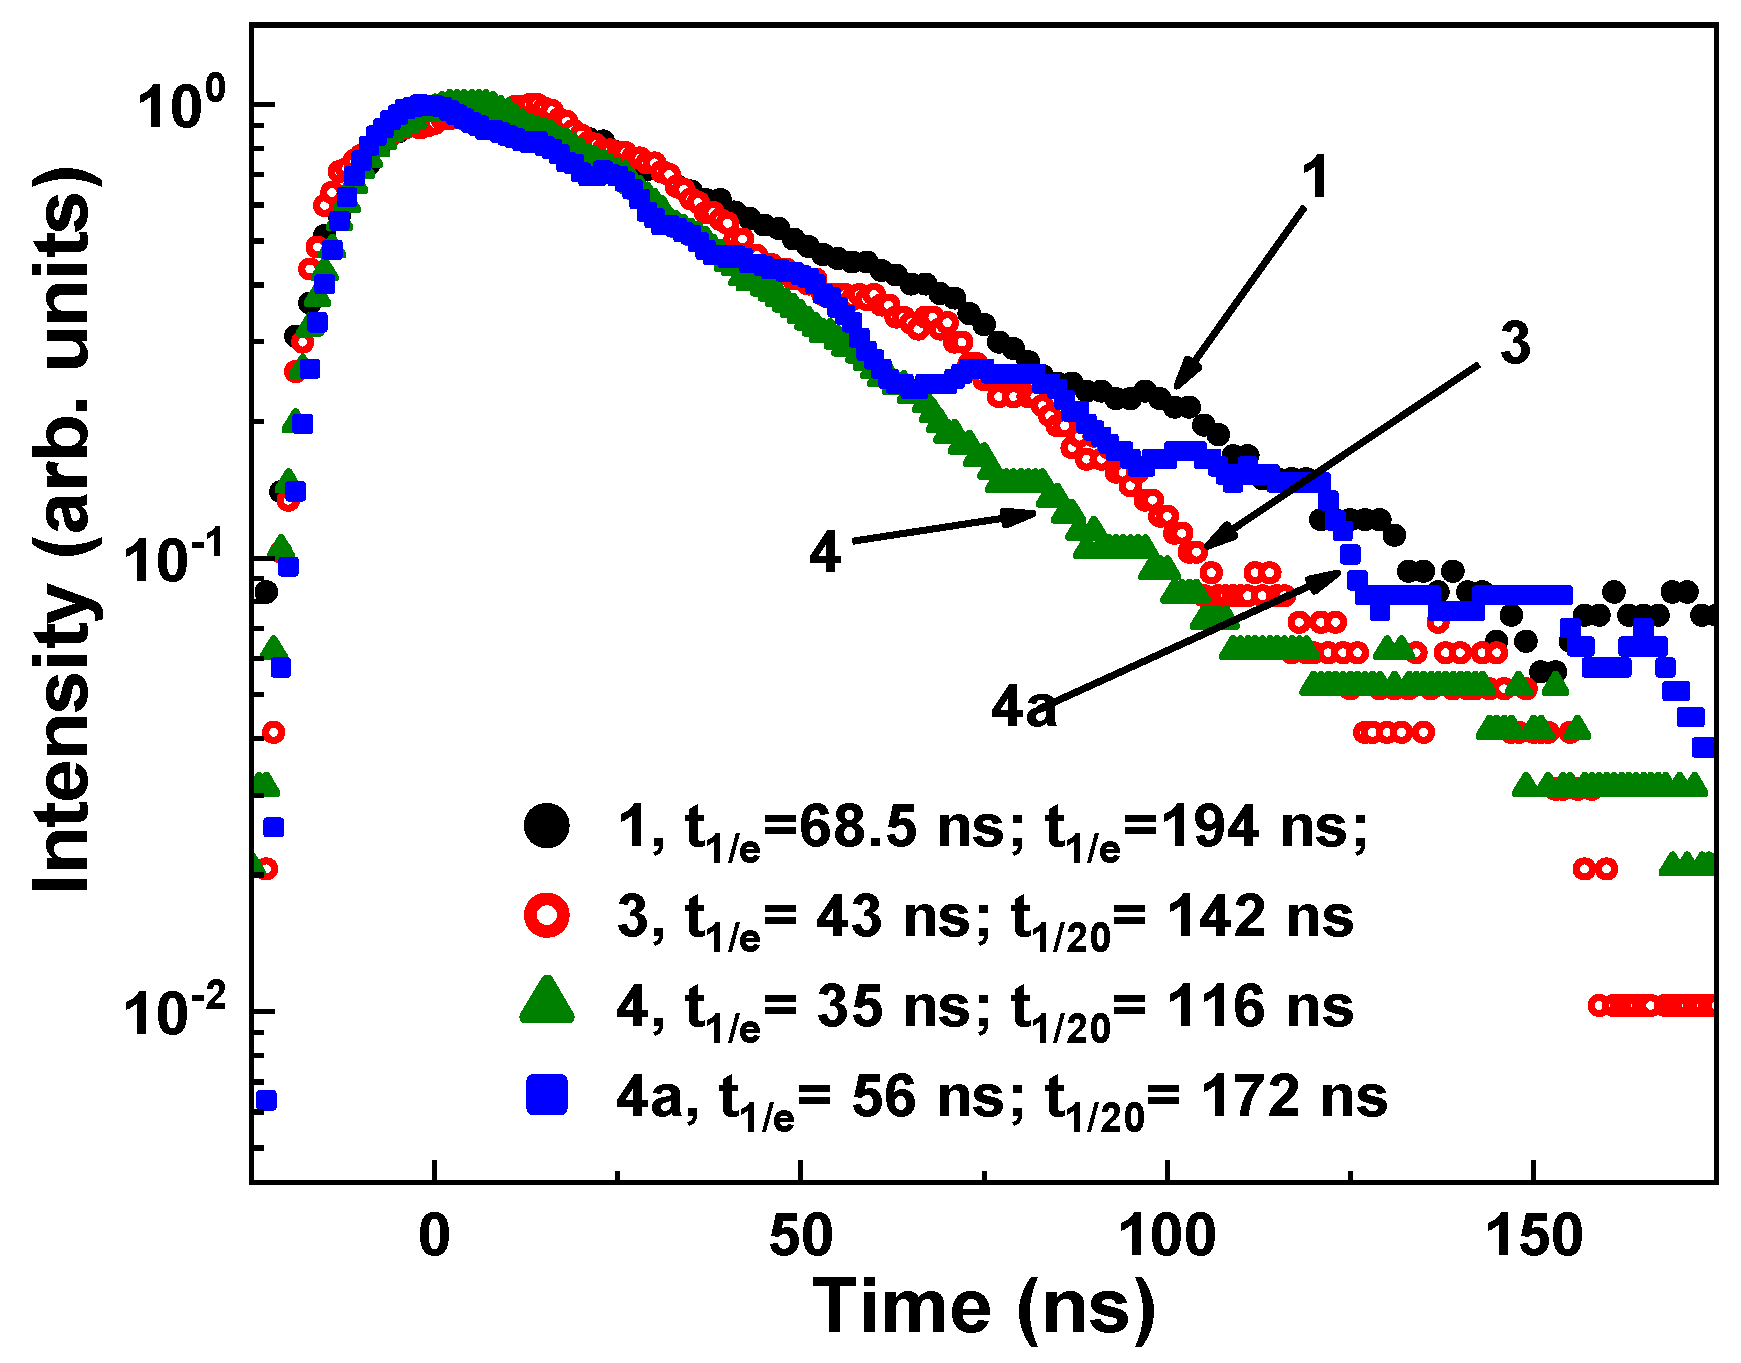
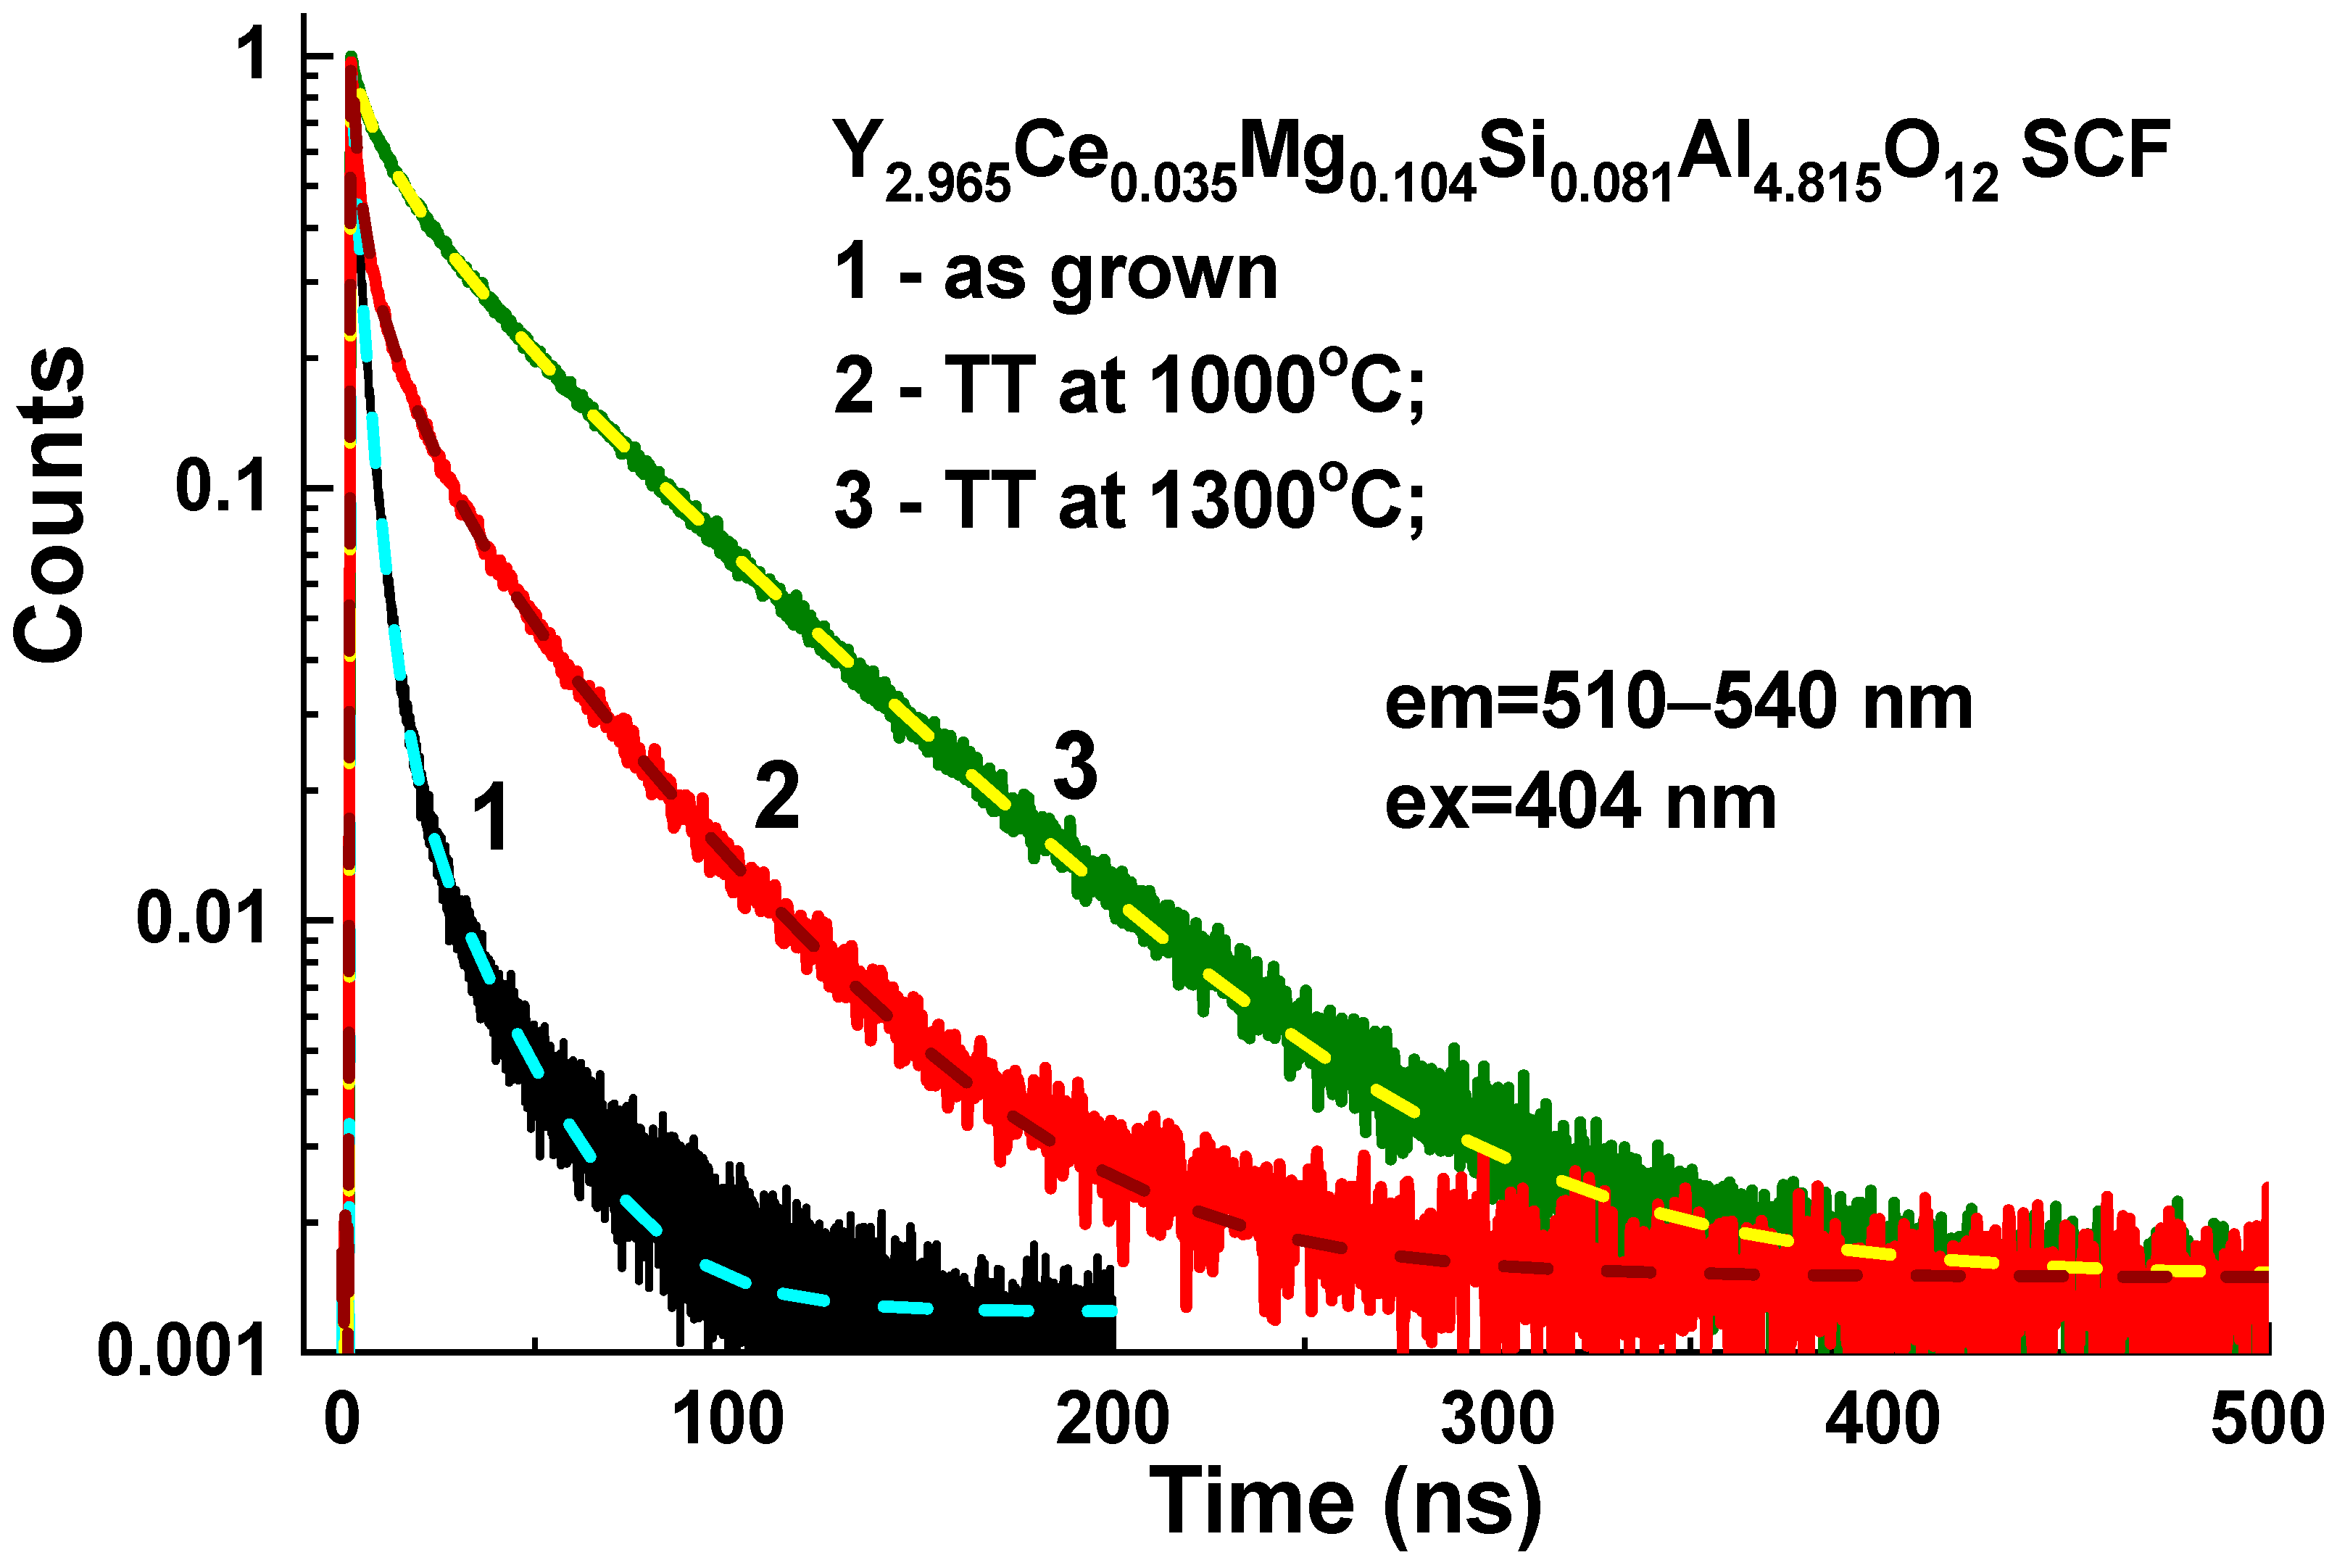
4.4. Scintillation Properties Y3MgxSiyAl5−x−yO12:Ce SCFs

Because the majority of Ce3+ ions in the as-grown samples had been recharged to the Ce4+ state, Mg–Si-codoped SCFs had a low scintillation efficiency. Namely, the as-grown Y3MgxSiyAl5−x−yO12:Ce SCFs showed a significantly reduced scintillation LY in comparison with that of the YAG:Ce SCF reference sample, which had a LY of 2600 photons/MeV under α-particle excitation with a 239Pu (5.15 MeV) source (Table 3). In general, such scintillation properties of Y3MgxSiyAl5−x−yO12:Ce SCFs are similar to those of Y3−xCaxAl5−ySiyO12:Ce [40] and Ca2YMgScSi3O12:Ce [37,38,39] SCFs, as well as (Lu,Y)2SiO5:Ce SCFs [54], where the predominant Ce4+ valence state of cerium ions in the SCFs, grown from the PbO-based flux, causes their poor-scintillation light output.
Figure 8 and Table 3 show the scintillation decay kinetics of the Y3MgxSiy Al5−x−yO12:Ce SCFs depending on Mg–Si contents. When Mg–Si concentrations increased, the scintillation response of these SCFs notably accelerate. Namely, for SCF Samples 3 and 4 with Mg/Si contents x/y = 0.186/0.141 and 0.345/0.31, respectively, the corresponding decay times were equal to t1/e = 43 and 35 ns; and t1/10 = 142 ns and 116 ns, respectively, in comparison with t1/e = 68.5 ns and t1/10 = 194 ns for the YAG:Ce SCF (Table 3). Additionally, this effect was well-correlated with the considerable drop in the LY of Y3MgxSiyAl5−x−yO12:Ce SCFs when the Mg/Si content increased (Table 2).

4.5. Photocurrent Properties of Y3MgxSiyAl5−x−yO12:Ce SCFs

The photocurrent (PC) excitation spectra of special set of Y3MgxSiyAl5−x−yO12:Ce SCFs with reduced Mg and Si contents between 0.025 and 0.1 for x and y values are presented in Figure 9. Such reduced amounts of codopants (less than 0.05 at %), substituting the octa- and tetrahedral sites of garnet host, were used to ensure the isolated nature of the substitutional defects. In this way, the photoconductive behavior of the doped crystal was in the isolated donor/acceptor regime, analogously to doped semiconductors. The excessive concentration of donor/acceptor states may lead to the formation of quasiband states, and impairs the photoconductive response of the SCF system.
Since the photocurrent signal of the wide band-gap oxides is extremely weak, the excitation measurements were performed via the modulated light technique and extracted using a lock-in amplifier. For this reason, the absolute value of the photocurrent intensity could not be retained, but it was estimated to be in the 0.1–1 pA range.
The Mg–Si-free YAG:Ce SCF did not show any visible PC under excitation in the 250–600 nm range (Figure 9, Curve 1). However, the single Mg2+ and double Mg2+–Si4+ codoping of YAG:Ce SCF led to the appearance of PCs, and the value of such PCs increases with increasing Mg2+ and Si4+ concentrations in the films. The maxima of the complex PC excitation band in Y3MgxSiyAl5−x−yO12:Ce SCFs were observed in the 345–365 range (Figure 9). Such complex bands consist of at least two low-energy and high-energy sub-bands. Interestingly, the maximum of the complex PC band was slightly shifted from 360 to 345 nm at Mg and Mg–Si concentration x = 0.025, and later shifted to 358 and 365 nm when Mg–Si content increased to x = 0.05 and 0.1, respectively (Figure 9).
Figure 9. PC excitation spectra of YAG:Ce (Curve 1) and Y3MgxSiyAl5−x−yO12:Ce SCFs (Curves 2–5) with different nominal Mg and Si contents x, y = 0.025–0.1 (see Table 1).
Materials 16 01869 g009
Taking into account the advanced Mg2+ concentrations in the SCFs under study with respect to the content of Si4+ ions and partial compensation of such Mg2+ advance by Ce4+ formation (Table 1), and the absence of F+ and F-related centers formation in these samples, the observed bands in the PC excitation spectra could probably be connected with the creation of Mg2+–Ce4+ and Mg2+–O2− centers with local and charge compensation. The above-mentioned shift in the maxima of PC bands could have been caused by the relative concertation of the mentioned pair centers at different contents of Mg and Si ions.
The mechanism of charge and volume compensation of the Mg2+ excess in Y3MgxSiyAl5−x−yO12:Ce SCFs was different than that in LPE-grown Y3−xCaxAl5−y SiyO12:Ce SCFs (see [40] for details), where the observed Ca2+ advance in the SCF samples was compensated with the Ce4+ and F+ center formation.

5. Optical Properties of Y3MgxSiyAl5−x−yO12:Ce SCFs Annealing in Reducing Atmosphere

The optical characteristics of Sample 2 (Y2.965Ce0.035Mg0.104Si0.081Al4.815O12 SCF) were also investigated after 12 h of thermal treatment (TT) at 1000–1300 °C in a 95% N2–5% H2 reducing atmosphere (Figure 10, Figure 11 and Figure 12). The relative concentrations of the Ce4+ and Ce3+ centers in the above-mentioned SCF sample were significantly altered by the TT in such a reducing atmosphere as a result of the O2− + 2 Ce4+ → VO + 2 Ce3+ reaction, where Vo is the oxygen vacancy, as can be seen from the absorption spectra of the as-grown and annealed samples of this film in Figure 10.
The structure of the emission and excitation bands connected to various Ce3+ centers noticeably change because of annealing of this SCF sample in the reducing atmosphere. In particular, the maximum of the Ce3+ emission band was located at 532 nm in the untreated Y2.965Ce0.035Mg0.104 Si0.081Al4.815O12 SCF, and excited in the bands that peaked at 382 and 456 nm (Figure 11, Curve 1). We assumed that the above-described bands may have been connected with the Ce1 center. The difference between the locations of the E1 and E2 excitation bands for such a Ce1 center could be equal to 0.526 eV. The Stokes shift was proportional to the difference between the emission and low-energy excitation bands, and for the Ce1 center, it was equivalent to 76 nm (0.388 eV).
However, as a result of the TT of the Y2.965Ce0.035Mg0.104Si0.081Al4.815O12 SCF at 1300 °C, the maximum of the Ce3+ emission spectrum was noticeably shifted to 560 nm, the intensity of the excitation band peaked at 382 nm significantly decreases, and a new excitation band appears with a maximum at 339 nm. The mentioned shift in emission and excitation spectra can be attributed to an increase in the relative concentration of Ce2 centers in the SCF sample after TT. The difference between the locations of the E1 and E2 excitation bands for such a Ce2 center was equal to 0.972 eV. Therefore, due to the larger crystal field strength of Ce2 centers than that of Ce1 centers, the position of the emission band of the Ce2 center was red-shifted relative to the Ce1 center. The difference between the positions of the emission and low-energy excitation bands was proportional to the Stokes shift and equal to 98 nm (0.469 eV) for the Ce2 center.
Lastly, we could assume that the Ce1 and Ce2 centers had been formed when Ce3+ ions replaced Y3+ cations with different local environment caused by the nonuniform distribution of the Mg2+ and Si4+ cations in the octahedral and tetrahedral position of the garnet host. This assumption about the nature of the Ce1 and Ce2 centers was supported by the corresponding changes in the absorption and PL excitation spectra, and by the PL emission spectra and decay kinetics of PL (Figure 12, Table 4) in the Y2.965Ce0.035 Mg0.104Si0.081Al4.815O12 SCF, which were related to the change in the concentration of the Ce4+ and Ce3+ centers after reducing TT in the 1000–1300 °C range. Since Ce2 centers in the as-grown samples had the predominant Ce4+ valence state, it was difficult to record these centers in the PL emission and excitation spectra, and decay kinetics of the Ce3+ luminescence (Figure 3, Figure 4, Figure 5, Figure 6 and Figure 7). However, when the Ce4+ ions recharged to the Ce3+ states during the TT at temperatures between 1000 and 1300 °C, it was also possible to observe the Ce2 centers in the PL spectra and the decay kinetics of the Ce3+ emission (Figure 10, Figure 11 and Figure 12).

6. Conclusions

The single crystalline films (SCFs) of Y3MgxSiyAl5−x−yO12:Ce garnet at x and y changing from 0 to 0.345 and 0.31, respectively, were crystallized using the LPE growth method from a melt solution based on the PbO–B2O3 flux onto Y3Al5O12 (YAG) substrates at the SCF–substrate misfit from 0 up to 0.245%. The segregation coefficients of Mg and Si ions in these SCFs were varied in the 0.08–0.155 and 0.105–0.17 ranges, respectively, when the nominal concentration of these dopants in the melt solution was changed in the x, y = 0–2 range. Additionally, Mg2+ excess was systematically present in the as-grown Y3MgxSiyAl5−x−yO12:Ce SCFs, which was presumable compensated by the Ce4+ ion and Mg2+–O2− center formation. Especially prepared Mg2+/Mg2+–Si4+ codoped YAG:Ce SCFs with low concentrations of manganese and silicon ions also demonstrated the appearance of a photocurrent that increased with rising Mg2+ and Si4+ contents in the films.
The absorption and luminescence properties of Y3MgxSiyAl5−x−yO12:Ce SCFs were studied and compared with the properties of the reference YAG:Ce SCF sample. As a result of the Mg2+–Si4+ pair codoping, the cathodoluminescence spectra of Ce3+ ions in the Y3MgxSiyAl5−x−yO12:Ce SCFs were noticeably extended in the red range compared to those of the YAG:Ce SCFs due to the Ce3+ multicenter formation in the dodecahedral sites of the lattice of the mentioned mixed garnets. Furthermore, we confirmed the formation of two types of Ce3+ centers of Y3MgxSiyAl5−x−yO12:Ce in the emission and excitation spectra of the Ce3+ photoluminescence in the SCFs of these garnets. These two centers (Ce1 and Ce2) possessed various local surroundings due to replacement with the Mg2+ and Si4+ ions of Al3+ cations in the octahedral and tetrahedral sites of the garnet host and were characterized by differing spectral behaviors.
The as-grown Y3MgxSiyAl5−x−yO12:Ce SCF samples exhibited poor scintillation properties. Under α–particle excitation through the 239Pu (5.15 MeV) source, these SCFs had a fast scintillation response with decay times in the t1/e = 30–43.5 ns and t1/20 = 79–148 ns ranges, but a relative low light yield (LY) of 14–19% in comparison with the reference YAG:Ce SCF. However, the LY of Y3MgxSiyAl5−x−yO12:Ce SCFs could increase after their annealing in a reducing atmosphere (95% N2 + 5% H2) at a temperature above the SCF growth temperature.
The simultaneous formation of the Ce4+ and Ce3+ valence states was also observed in the Y3MgxSiyAl5−x−yO12:Ce SCFs due to the nonuniform distribution of the Mg2+ and Si4+ cations and charge compensation requirement. The presence of Ce4+ ions in the as-grown SCFs was confirmed via the presence of the O2− → Ce4+ absorption band that peaked at 247 nm. The Ce4+ centers were also responsible for the acceleration of the initial stage of the cerium photoluminescence decay profiles, and for the presence of fast components with a lifetime in the range of a few ns in these SCFs. The annealing of the samples in the reducing atmosphere at temperatures over 1000 °C resulted in the Ce4+ → Ce3+ recharge in the Y3MgxSiyAl5−x−yO12:Ce SCFs, and also led to the more exponential-like decay kinetics of the Ce3+ luminescence in these SCFs. This allows for studying the energy transfer processes between different Ce3+ centers in this garnet.

Author Contributions

V.G., SCF growth of and writing Section 2; T.Z., absorption and scintillation property measurements of the films; A.S., measurements of the PL decay kinetics of the samples; P.P., analysis of the photocurrent results and paper preparation; A.O. and M.B., influence analysis of the thermal treatment on the optical properties of films; A.F. XRD measurements; S.M., T.L. and N.M., film photovoltaic property investigation; Y.Z., conception of the main paper idea, analysis of the whole experimental materials, and paper writing and correction. All authors have read and agreed to the published version of the manuscript.

Funding

The work was performed in the frameworks of the NCN Opus 17 no. 2019/33/B/ST3/00406 and NCN Miniatura no. 2021/05/X/ST8/00298 projects.

Institutional Review Board Statement

Not applicable.

Informed Consent Statement

Not applicable.

Data Availability Statement

Not applicable.

Conflicts of Interest

The authors declare no conflict of interest.

References

  1. Bardsley, N.; Bland, S.; Pattison, L.; Pattison, M.; Stober, K.; Welsh, F.; Yamada, M. Solid-State Lighting R&D. Multi-Year Program Plan; US Department of Energy: Washington, DC, USA, 2014.
  2. Sun, C.C.; Chang, Y.Y.; Yang, T.H.; Chung, T.Y.; Chen, C.C.; Lee, T.X.; Li, D.R.; Lu, C.Y.; Ting, Z.Y.; Glorieux, B.; et al. Packaging efficiency in phosphor-converted white LEDs and its impact to the limit of luminous efficacy. J. Solid State Light. 2014, 1, 19. [Google Scholar] [CrossRef] [Green Version]
  3. Raukas, M.; Kelso, J.; Zheng, Y.; Bergenek, K.; Eisert, D.; Linkov, A.; Jermann, F. Ceramic phosphors for light conversion in LEDs. ECS J. Solid. State Sci. Technol. 2013, 2, R3168–R3176. [Google Scholar] [CrossRef]
  4. Cantore, M.; Pfaff, N.; Farrell, R.M.; Speck, J.S.; Nakamura, S.; DenBaars, S.P. High luminous flux from single crystal phosphor-converted laser-based white lighting system. J. Opt. Exp. 2015, 24, 251040. [Google Scholar] [CrossRef] [PubMed]
  5. Nizhankovskyi, S.V.; Tan’ko, A.V.; Savvin, Y.N.; Krivonogov, S.I.; Budnikov, A.T.; Voloshin, A.V. Single crystalline YAG:Ce phosphor for powerful solid-state sources of white light. The influence of production conditions on luminescence properties and lighting characteristics. J. Opt. Spectrosc. 2016, 120, 915–921. [Google Scholar] [CrossRef]
  6. Li, S.; Zhu, Q.; Tang, D.; Liu, X.; Ouyang, G.; Cao, L.; Hirosaki, N.; Nishimura, T.; Huang, Z.; Xie, R.J. Al2O3:YAG: Ce composite phosphor ceramic: A thermally robust and efficient color converter for solid state laser lighting. J. Mater. Chem. C 2016, 4, 8648–8654. [Google Scholar] [CrossRef]
  7. Markovskyi, A.; Gorbenko, V.; Zorenko, T.; Nizhankovskiy, S.; Fedorov, A.; Zorenko, Y. Composite color converters based on Tb3Al5O12:Ce single crystalline films and Y3Al5O12:Ce crystal substrates. J. Phys. Status Solidi-Rapid Res. Lett. 2021, 15, 2100173. [Google Scholar] [CrossRef]
  8. Markovskyi, A.; Gorbenko, V.; Nizhankovskiy, S.; Zorenko, T.; Pakuła, M.; Kaczmarek, M.; Fedorov, A.; Zorenko, Y. Novel composite color converters based on Tb1.5Gd1.5Al5O12:Ce single crystalline films and Y3Al5O12:Ce crystal substrates. CrystEngComm 2022, 27, 4975–4982. [Google Scholar] [CrossRef]
  9. Setlur, A.A.; Heward, W.J.; Gao, Y.; Srivastava, A.M.; Chandran, R.G.; Shankar, M.V. Crystal Chemistry and Luminescence of Ce3+-Doped Lu2CaMg2(Si,Ge)3O12 and Its Use in LED Based Lighting. J. Chem. Mater. 2006, 18, 3314. [Google Scholar] [CrossRef]
  10. Shimomura, Y.; Honma, T.; Shigeiwa, M.; Akai, T.; Okamoto, K.; Kijima, N. Sensors and Displays: Principles, Materials, and Processing-Photoluminescence and Crystal Structure of Green-Emitting Ca3Sc2Si3O12: Ce3+ Phosphor for White Light Emitting Diodes. J. Electrochem. Soc. 2007, 154, J35. [Google Scholar] [CrossRef]
  11. Katelnikovas, A.; Bettentrup, H.; Uhlich, D.; Sakirzanovas, S.; Jüstel, T.; Kareiva, A. Synthesis and optical properties of Ce3+-doped Y3Mg2AlSi2O12 phosphors. J. Lumin. 2009, 129, 1356–1361. [Google Scholar] [CrossRef]
  12. Kishore, M.S.; Kumar, N.P.; Chandran, R.G.; Setlur, A.A. Solid Solution Formation and Ce3+ Luminescence in Silicate Garnets. Electrochem. Solid-State Lett. 2010, 13, J77. [Google Scholar] [CrossRef]
  13. Zhong, J.; Zhuang, W.; Xing, X.; Liu, R.; Li, Y.; Liu, Y.; Hu, Y. Synthesis, Crystal Structures, and Photoluminescence Properties of Ce3+-Doped Ca2LaZr2Ga3O12: New Garnet Green-Emitting Phosphors for White LEDs. J. Phys. Chem. 2014, 119, 5562–5569. [Google Scholar] [CrossRef]
  14. Pan, Z.; Xu, Y.; Hu, Q.; Li, W.; Zhou, H.; Zheng, Y. Combination cation substitution tuning of yellow-orange emitting phosphor Mg2Y2Al2Si2O12:Ce3+. J. RSC Adv. 2015, 5, 9489–9496. [Google Scholar] [CrossRef]
  15. Li, G.; Tian, Y.; Zhao, Y.; Lin, J. Recent progress in luminescence tuning of Ce3+ and Eu2+-activated phosphors for pc-WLEDs. J. Chem. Soc. Rev. 2015, 44, 8688–8713. [Google Scholar] [CrossRef]
  16. Shang, M.; Fan, J.; Lian, H.; Zhang, Y.; Geng, D.; Lin, J. A double substitution of Mg2+–Si4+/Ge4+ for Al (1)3+–Al (2)3+ in Ce3+-doped garnet phosphor for white LEDs. J. Inorg. Chem. 2014, 53, 7748–7755. [Google Scholar] [CrossRef] [PubMed]
  17. Du, Y.; Shao, C.; Dong, Y.; Yang, Q. Electroluminescent properties of WLEDs with the structures of Ce:YAG single crystal/blue chip and Sr2Si5N8:Eu2+/Ce:YAG single crystal/blue chip. J. Disp. Technol. 2016, 12, 323–327. [Google Scholar] [CrossRef]
  18. Zhao, B.Y.; Liang, X.; Chen, Z.; Xie, C.; Luo, L.; Zhang, Z.; Xiang, W. Studies on optical properties and Ce concentration of Ce: YAG single crystal for WLEDs. Chem. J. Chin. Univ. 2014, 25, 230–236. [Google Scholar] [CrossRef]
  19. Ferrand, B.; Chambazand, B.; Couchaud, M. Liquid phase epitaxy: A versatile technique for the development of miniature optical components in single crystal dielectric media. J. Opt. Mater. 1999, 11, 101–114. [Google Scholar] [CrossRef]
  20. Molva, E. Microchip lasers and their applications in optical microsystems. J. Opt. Mater. 1999, 11, 289–299. [Google Scholar] [CrossRef]
  21. Klimczak, M.; Malinowski, M.; Sarnecki, J.; Piramidowicz, R.J. Luminescence properties in the visible of Dy:YAG/YAG planar waveguides. J. Lumin. 2009, 129, 1869–1873. [Google Scholar] [CrossRef]
  22. Zorenko, Y.; Novosad, S.S.; Pashkovskii, M.V.; Lyskovich, A.B.; Savitskii, V.G.; Batenchuk, M.M.; Malyutenkov, P.S.; Patsagan, N.I.; Nazar, I.V.; Gorbenko, V.I. Epitaxial structures of garnets as scintillation detectors of ionizing radiation. J. Appl. Spectrosc. 1990, 52, 645–649. [Google Scholar] [CrossRef]
  23. Zorenko, Y.; Gorbenko, V.; Konstankevych, I.; Grinevand, B.; Globus, M. Scintillation properties of Lu3Al5O12:Ce single-crystalline films. J. Nucl. Instrum. Methods Phys. Res. 2002, 486, 309–314. [Google Scholar] [CrossRef]
  24. Witkiewicz-Lukaszek, S.; Gorbenko, V.; Zorenko, T.; Syrotych, Y.; Mares, J.A.; Nikl, M.; Sidletskiy, O.; Bilski, P.; Yoshikawa, A.; Zorenko, Y. Composite detectors based on single crystalline films and single crystals of garnet compounds. J. Mater. 2022, 15, 1249. [Google Scholar] [CrossRef]
  25. Prusa, P.; Kucera, M.; Mares, J.A.; Hanus, M.; Beitlerova, A.; Onderisinova, Z.; Nikl, M. Scintillation properties of the Ce-doped multicomponent garnet epitaxial films. Opt. Mater. 2013, 35, 2444–2448. [Google Scholar] [CrossRef]
  26. Robertson, J.M.; Van Tol, M.V. Cathodoluminescent garnet layers. J. Thin Solid Film 1984, 114, 221–240. [Google Scholar] [CrossRef]
  27. Hrytskiv, Z.D.; Zorenko, Y.; Gorbenko, V.; Pedanand, A.D.; Shkliarsyi, V.I. Single crystalline film screens for cathode-ray tubes: New life of television scanning optical microscopy. J. Radiat. Meas. 2007, 42, 933–936. [Google Scholar] [CrossRef]
  28. Schauer, P.; Lalinský, O.; Kucera, M. Overview of S(T)EM electron detectors with garnet scintillators: Some potentials and limits. J. Microsc. Res. Tech. 2021, 84, 753–770. [Google Scholar] [CrossRef]
  29. Koch, A.; Raven, C.; Spanne, P.; Snigirev, A. X-ray imaging with submicrometer resolution employing transparent luminescent screens. J. Opt. Soc. Amer. A Opt. 1998, 15, 1940–1951. [Google Scholar] [CrossRef] [Green Version]
  30. Martin, T.; Koch, A. Recent developments in X-ray imaging with micrometer spatial resolution. J. Synchrotron Radiat. 2006, 13, 180–194. [Google Scholar] [CrossRef] [Green Version]
  31. Riva, F.; Douissard, P.-A.; Martin, T.; Carla, F.; Zorenko, Y.; Dujardin, C. Epitaxial growth of gadolinium and lutetium-based aluminum perovskites thin film for X-rays micro-imaging applications. CrystEngComm 2016, 18, 608–615. [Google Scholar] [CrossRef]
  32. Zorenko, Y.; Gorbenko, V.; Savchyn, V.; Fedorov, A.; Kuklinski, B.; Grinberg, M.; Bilski, P.; Gieszczyk, W.; Twardak, A.; Mandowski, A.; et al. Luminescent properties of YAlO3:Mn single crystalline films. J. Opt. Mater. 2012, 34, 1979–1983. [Google Scholar] [CrossRef]
  33. Witkiewicz-Lukaszek, S.; Gorbenko, V.; Zorenko, T.; Zorenko, Y.; Gieszczyk, W.; Mrozik, A.; Bilski, P. Composite thermoluminescent detectors based on the Ce3+ doped LuAG/YAG and YAG/LuAG epitaxial structures. J. Radiat. Meas. 2019, 126, 106–140. [Google Scholar] [CrossRef]
  34. Witkiewicz-Lukaszek, S.; Gorbenko, V.; Bilski, P.; Mrozik, A.; Zorenko, T.; Fedorov, A.; Zorenko, Y. LPE growth of composite thermoluminescent detectors based on the Lu3-xGdxAl5O12:Ce single crystalline films and YAG:Ce crystals. J. Cryst. 2020, 10, 189. [Google Scholar] [CrossRef] [Green Version]
  35. Markovskyi, A.; Gorbenko, V.; Zorenko, T.; Yokosawa, T.; Will, J.; Spiecker, E.; Batentschuk, M.; Elia, J.; Fedorov, A.; Zorenko, Y. LPE growth of Tb3Al5O12:Ce single crystalline film converters for WLED application. CrystEngComm 2021, 23, 3212–3219. [Google Scholar] [CrossRef]
  36. Markovsky, A.; Gorbenko, V.; Yokosawa, T.; Will, J.; Spiecker, E.; Batentschuk, M.; Elia, J.; Fedorov, A.; Pakuła, M.; Kaczmarek, M.; et al. Structural, luminescence and photoconversion properties of Lu3Al5O12:Ce single crystalline film phosphors for WLED application. J. Alloy. Compd. 2022, 929, 167159. [Google Scholar] [CrossRef]
  37. Gorbenko, V.; Zorenko, T.; Paprocki, K.; Iskaliyeva, A.; Fedorov, A.; Schröppel, F.; Levchuk, I.; Osvet, A.; Batentschuk, M.; Zorenko, Y. Epitaxial growth of single crystalline film phosphors based on the Ce3+-doped Ca2YMgScSi3O12 garnet. CrystEngComm 2017, 19, 3689–3697. [Google Scholar] [CrossRef]
  38. Gorbenko, V.; Zorenko, T.; Pawlowski, P.; Iskaliyeva, A.; Paprocki, K.; Suchocki, A.; Zhydachevskii, Y.; Fedorov, A.; Khaidukov, N.; Van Deun, R.; et al. Luminescent and scintillation properties of Ce3+ doped Ca2RMgScSi3O12 (R=Y, Lu) single crystalline films. J. Lumin. 2018, 195, 362–370. [Google Scholar] [CrossRef]
  39. Gorbenko, V.; Zorenko, T.; Witkiewicz, S.; Paprocki, K.; Iskaliyeva, A.; Kaczmarek, A.M.; Van Deun, R.; Khaidukov, M.N.; Batentschuk, M.; Zorenko, Y. Luminescence of Ce3+ multicenters in Ca2+-Mg2+-Si4+ based garnet phosphors. J. Lumin. 2018, 199, 245–250. [Google Scholar] [CrossRef]
  40. Gorbenko, V.; Zorenko, T.; Witkiewicz-Łukaszek, S.; Shakhno, A.; Osvet, A.; Batentschuk, M.; Fedorov, A.; Zorenko, Y. Crystallization and investigation of the structural and optical properties of Ce3+ doped Y3-xCaxAl5-ySiyO12 single crystalline film phosphors. J. Cryst. 2021, 11, 788. [Google Scholar] [CrossRef]
  41. Bartosiewicz, K.; Markovskyi, A.; Horiai, T.; Szymański, D.; Kurosawa, S.; Yamaji, A.; Yoshikawa, A.; Zorenko, Y. A study of Mg2+ ions effect on atoms segregation, defects formation, luminescence and scintillation properties in Ce3+ doped Gd3Al2Ga3O12 single crystals. J. Alloy. Compd. 2022, 905, 164154. [Google Scholar] [CrossRef]
  42. Wu, Y.; Meng, F.; Li, Q.; Koschan, M.; Melcher, C.L. Role of Ce4+ in the Scintillation Mechanism of Codoped Gd3Ga3Al2O12∶Ce. Phys. Rev. Appl. 2014, 2, 044009. [Google Scholar] [CrossRef] [Green Version]
  43. Tyagi, M.; Meng, F.; Koschan, M.; Donnald, S.B.; Rothfuss, H.; Melcher, C.L. Effect of codoping on scintillation and optical properties of a Ce-doped Gd3Ga3Al2O12 scintillator. J. Phys. D Appl. Phys. 2013, 46, 475302. [Google Scholar] [CrossRef]
  44. Liu, S.; Feng, X.; Zhou, Z.; Nikl, M.; Shi, Y.; Pan, Y. Effect of Mg2+ co-doping on the scintillation performance of LuAG:Ce ceramics. Phys. Status Solidi (RRL)-Rapid Res. Lett. 2013, 8, 105–109. [Google Scholar] [CrossRef]
  45. Babin, V.; Herman, P.; Kucera, M.; Nikl, M.; Zazubovich, S. Effect of Mg2+ co-doping on the photo- and thermally stimulated luminescence of the (Lu,Gd)3(Ga,Al)5O12:Ce epitaxial films. J. Lumin. 2019, 215, 116608. [Google Scholar] [CrossRef]
  46. Lalinsky, O.; Schauer, P.; Kucera, M. Influence of Mg-to-Ce Concentration Ratio on Cathodoluminescence in LuAG and LuGAGG Single-Crystalline Films. Phys. Status Solidi A 2019, 216, 1801016. [Google Scholar] [CrossRef]
  47. Prusa, P.; Kučera, M.; Babin, V.; Bruza, P.; Parkman, T.; Panek, D.; Beitlerova, A.; Mares, J.A.; Hanus, M.; Lučeničová, Z.; et al. Tailoring and Optimization of LuAG:Ce Epitaxial Film Scintillation Properties by Mg Co-Doping. Cryst. Growth Des. 2018, 18, 4998–5007. [Google Scholar] [CrossRef]
  48. Schauer, P.; Lalinský, O.; Kučera, M.; Lučeničová, Z.; Hanuš, M. Effect of Mg co-doping on cathodoluminescence properties of LuGAGG:Ce single crystalline garnet films. Opt. Mater. 2017, 72, 359–366. [Google Scholar] [CrossRef]
  49. Babin, V.; Boháček, P.; Jurek, K.; Kučera, M.; Nikl, M.; Zazubovich, S. Dependence of Ce3+—Related photo- and thermally stimulated luminescence characteristics on Mg2+ content in single crystals and epitaxial films of Gd3(Ga,Al)5O12:Ce,Mg. Opt. Mater. 2017, 83, 290–299. [Google Scholar] [CrossRef]
  50. Zorenko, Y.; Zorenko, T.; Voznyak, T.; Mandowski, A.; Xia, Q.; Batentschuk, M.; Fridrich, J. Luminescence of F+ and F centers in Al2O3-Y2O3 oxide compounds. IOP Conf. Ser. Mater. Sci. Eng. 2010, 15, 012060. [Google Scholar] [CrossRef]
  51. Barandiarán, Z.; Meijerink, A.; Seijo, L. Configuration coordinate energy level diagrams of intervalence and metal-to-metal charge transfer states of dopant pairs in solids. Phys. Chem. Chem. Phys. 2015, 17, 19874–19884. [Google Scholar] [CrossRef] [Green Version]
  52. Kulesza, D.; Cybińska, J.; Seijo, L.; Barandiarán, Z.; Zych, E. Anomalous red and infrared luminescence of Ce3+ ions in SrS: Ce sintered ceramics. J. Phys. Chem. C 2015, 119, 27649–27656. [Google Scholar] [CrossRef]
  53. Phung, Q.M.; Barandiarán, Z.; Seijo, L. Structural relaxation effects on the lowest 4f–5d transition of Ce3+ in garnets. J. Theor. Chem. Acc. 2015, 134, 37. [Google Scholar] [CrossRef]
  54. Zorenko, Y.; Gorbenko, V.; Savchyn, V.; Zorenko, T.; Grinyov, B.; Sidletskiy, O.; Fedorov, A. Growth and luminescent properties of Ce and Ce–Tb doped (Y,Lu,Gd)2SiO5:Ce single crystalline films. J. Cryst. Growth 2014, 401, 577–583. [Google Scholar] [CrossRef]
Figure 1. Dependence of Mg and Si segregation coefficients in LPE-grown Y3MgxSiyAl5−x−yO12:Ce SCFs (Samples 2–4), while the nominal Mg and Si contents in MS changed in the x = 1–2 range.
Materials 16 01869 g001
Figure 2. XRD pattern (880) of Y2.96Ce0.04Mg0.345Si0.31Al4.345O12 SCF (Sample 4) grown onto a YAG substrate. The lattice mismatch of the film and substrate was 0.245%.
Materials 16 01869 g002
Figure 3. RT absorbance spectra of Y3MgxSiyAl5−x−yO12:Ce samples (the curves correspond to the samples with numbers in accordance with Table 1). SCFs with various Mg and Si contents in the x = 0.104–0.345 and y = 0.081–0.31 ranges (Curves 2–4) compared to the CL spectra of the YAG:Ce SCF (Curve 1).
Materials 16 01869 g003
Figure 4. Normalized to the maximal emission band RT CL spectra of the Y3MgxSiyAl5−x−yO12:Ce SCFs with various Mg and Si contents in the x = 0.104–0.345 and y = 0.081–0.31 ranges (Curves 2–4) compared to the CL spectra of the YAG:Ce SCF (Curve 1).
Materials 16 01869 g004
Figure 5. Normalized (to the maximal emission band) RT PL spectra of Y3MgxSiyAl5−x−yO12:Ce SCFs (Curves 2–4) with varying Mg and Si contents (Curves 2–4) in comparison to the PL spectra of YAG:Ce SCF (Curve 1) under excitation in the range of the Ce3+ absorption band at 445 nm.
Materials 16 01869 g005
Figure 6. Normalized (to the maximum of the excitation band) RT PLE spectra of Ce3+ ion luminescence at 530 nm in Y3MgxSixAl5−x−yO12:Ce SCFs with varying Mg and Si contents (Curves 2–4) compared to the respective PLE spectra in the YAG:Ce SCF (Curve 1).
Materials 16 01869 g006
Figure 8. Scintillation decay kinetics of Y3MgxSiyAl5−x−yO12:Ce SCF Samples 3 (x/y = 0.186/0.141), 4 (x/y = 0.345/0.31), and 4a in comparison with the respective kinetics of YAG:Ce SCF (Sample 1) under excitation with α-particles using a 239Pu (5.15 MeV) source. Sample 4a: the scintillation decay kinetics of SCF Sample 4 after annealing at 1300 °C in an N2 95% + H2 5% reducing atmosphere.
Materials 16 01869 g008
Figure 10. Influence of thermal treatment at 1000 and 1300 °C in a 95% N2–5% H2 atmosphere on the absorption spectra of the as-grown Y2.965Ce0.035Mg0.104Si0.081Al4.815O12 SCF sample (curve 1). Curves 4 and 5 represent the difference in the spectra of the untreated and annealed samples at 1000 °C (Curve 4) and 1300 °C (Curve 5).
Materials 16 01869 g010
Figure 11. Influence of thermal treatment on the emission spectra (Curves 1–3) and excitation spectra (Curves 1′–3′) of Ce3+ luminescence in the Y2.965Ce0.035Mg0.104Si0.081Al4.815O12 SCF in an N2 95% + H2 5% atmosphere at 1300 °C.
Materials 16 01869 g011
Figure 12. RT decay kinetics of the Ce3+ luminescence at 510–545 nm in the Y2.965Ce0.035Mg0.104 Si0.081Al4.815O12 SCF under excitation at 404 nm and registration of PL at 530 nm before (Curve 1) and after TT in reducing N2+H2 (95 + 5%) atmosphere at 1000 °C (Curve 2) and 1300 °C (Curve 3).
Materials 16 01869 g012
Table 1. Nominal (in MS) and actual (in film) compositions of Y3MgxSiyAl5−x−yO12:Ce and YAG:Ce SCFs, LPE grown onto YAG substrates from MS based on the PbO–B2O3 flux. n. m., not measured.
SamplesNominal Film Content in MSReal SCF Content
1Y3Al5O12:CeY2.95Ce0.05Al5O12
2Y3MgSiAl4O12:CeY2.965Ce0.035Mg0.104Si0.081Al4.815O12
3Y3Mg1.5Si1.5Al2O12:CeY2.95Ce0.045Mg0.186Si0.141Al4.673O12
4Y3Mg2Si2AlO12:CeY2.96Ce0.04Mg0.345Si0.31Al4.345O12
5Y3Mg0.025Al4.975O12:Cen.m.
6Y3Mg0.025Si0.025Al4.95O12:Cen.m.
7Y3Mg0.05Si0.05Al4.9O12:Cen.m.
8Y3Mg0.1Si0.1Al4.8O12:CeY2.965Ce0.045Mg0.01Si0.01Al4.98O12
Table 2. LY and decay times of the PL at RT in Y3MgxSiyAl5−x−yO12:Ce SCFs with various Mg and Si contents under 404 nm excitation and 530 nm PL registration. Decay times were calculated from the parameters of three exponential approximations of the decay curves presented in Figure 7. The accuracy of decay time parameter determination was about ±5%.
NoLY, %t1, nsA1t2, nsA2t3, nsA3
1100 67.820.99
2193.860.2317.890.2452.810.18
3171.690.329.010.1495.090.11
4141.850.166.240.2760.740.12
Table 3. The decay time of RT PL in Y3MgxSiyAl5−x−yO12:Ce SCFs with varying Mg and Si contents under 404 nm excitation and 530 nm PL registration.
NoReal SCF ContentLY, %t1/e, nst1/10, ns
1Y2.95Ce0.05Al5O1210068.5194
3Y2.95Ce0.045Mg0.186Si0.141Al4.673O121943142
4Y2.96Ce0.04Mg0.345Si0.31Al4.345O121435116
4aY2.96Ce0.04Mg0.345Si0.31Al4.345O124256172
Table 4. Parameters of three exponential approximations of the decay curves presented in Figure 12. The accuracy of the decay time parameter determination was about ±5%.
No.t1, nsA1t2, nsA2t3, nsA3
13.790.5311.090.9219.610.14
23.610.2716.030.2750.710.47
32.470.2512.470.2340.580.16
Disclaimer/Publisher’s Note: The statements, opinions and data contained in all publications are solely those of the individual author(s) and contributor(s) and not of MDPI and/or the editor(s). MDPI and/or the editor(s) disclaim responsibility for any injury to people or property resulting from any ideas, methods, instructions or products referred to in the content.

