Abstract
A series of dithienothiophene S,S-dioxide (DTTDO) dyes was designed, synthesized, and investigated for their suitability in fluorescent cell imaging. Synthetized (D-π-A-π-D)-type DTTDO derivatives have molecule lengths close to the thickness of the phospholipid membrane, and they contain on both ends two positively charged or neutral polar groups to increase their solubility in water and to ensure simultaneous interaction with polar groups of the inner and outer part of the cellular membrane. DTTDO derivatives exhibit absorbance and emission maxima in the 517–538 nm and 622–694 nm range, respectively, and a large Stokes shift up to 174 nm. Fluorescence microscopy experiments revealed that these compounds selectively intercalate into cell membranes. Moreover, a cytotoxicity assay conducted on a model human live cells indicates low toxicity of these compounds at the concentrations required for effective staining. With suitable optical properties, low cytotoxicity, and high selectivity against cellular structures, DTTDO derivatives are proven to be attractive dyes for fluorescence-based bioimaging.
1. Introduction
The plasma membrane, also called the cell membrane, is an indispensable element of all living cells and constitutes a natural semipermeable barrier between intracellular components and the outside environment. The cell membrane mainly consists of a lipid bilayer (made up of two layers of phospholipids), cholesterols, proteins, glycoproteins, and glycolipids. The proportions between each component are not constant but depend on the type of cell, its stage of development, and changes in the environment [1]. They are also responsible for different cell membrane functions. While cholesterol incorporated in the lipid bilayer is responsible for maintaining appropriate membrane fluidity at different conditions, proteins, glycoproteins, and glycolipids play an important role in cellular membrane functions essential for cell survival and its communication with the surrounding [2]. Thus, besides a structural protection and separation function, the plasma membrane also regulates the transport of substances in and out of the cell, controls metabolic processes, is involved in cell signaling and apoptotic and nonapoptotic cell death processes, cell-cell communication, as well as maintaining intracellular homeostasis [3,4,5,6,7]. The aberrations in plasma membrane functions and properties can be an essential indicator of the cell condition and numerous diseases [2], hence visualization and monitoring of these changes are of great importance from the viewpoint of an early medical diagnosis and basic research in cell biology.
Among the methods used for lipid membrane analysis, fluorescent imaging turned out to be one of the most effective techniques, because of its high sensitivity, non-destructive nature, and capability to monitor cellular processes in real-time [8]. From the large toolbox of fluorescent probes encompassing fluorescent proteins [9], quantum dots (QDs) [10,11], and small organic dyes [12,13], especially the last one, gained the greatest popularity in membrane staining (Figure 1). This can be mainly attributed to their low cost of production, good chemical stability, easy tuning of optical and physical properties, and ability to be precisely located in specific parts of cell membranes. Moreover, due to their smaller size than fluorescent proteins and QDs, small organic dyes disturb much less membrane-dependent cellular processes.
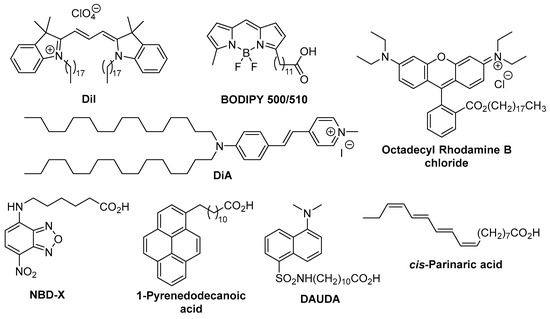
Figure 1.
Representative commercially available cell membrane probes.
Although the strategy in the construction of membrane-specific fluorescent probes is rather simple and based on the introduction of a hydrophilic head and hydrophobic tail to the fluorophore, their practical realization is not trivial. For example, compounds with a high lipophilic character can easily cross the plasma membrane and gather in lipid drops [14] or other internal membranes. Additionally, low solubility in the biological environment may result in their precipitation before reaching the membrane. Despite good water solubility and membrane affinity fluorescent probes should also exhibit high quantum efficiency under physiological conditions, high photostability, and broadly tuneable absorption and emission properties. Dyes active in the red or near-infrared (NIR) region are particularly interesting and highly demanded [15,16]. Advantages include significantly reduced autofluorescence from the biological sample and enhanced tissue penetration depth. Moreover, the long excitation wavelength decreases the photodamage of biological material. Another aspect that should be addressed at the design stage of the fluorescent markers is their potential fluorogenic character [17,18]. Fluorescent markers which do not exhibit fluorescence in water but are highly fluorescent in lipid membranes simplify the staining procedures and ensure observation without interference from the non-bounded probe. The presence of additional functional groups in the fluorescent probes which enables their further bioconjugation is also an advantage. Until the present day, a lot of membrane-specific fluorophores have been synthesized [19,20,21,22,23,24,25,26,27,28,29,30,31,32,33,34,35,36,37,38,39,40,41,42] based on such fluorescent scaffolds as benzothiadiazole [20,21], coumarin [21,22], BODIPY [23,24,25], squaraine [26], Nile Red [27], chromone [28], perylene [29], fluorene [30], styrylpyridinium salts [31,32,33,34], nitrobenzodiazole [35], oligo and polythiophenes [36,37,38], cyanine [39], oxazolopyridine [40] or aminostyryl derivatives [41,42]. Unfortunately, many of the commercially available fluorescent dyes have some disadvantages which reduce their application potential. For example, the problems with low solubility and the tendency to undergo aggregation are difficulties that are often encountered in the case of long-chain cyanines (such as Dil, DiR, and DiO) [43] and squaraine dyes [44]. Additionally, squaraine dyes are also highly chemically unstable in a biological environment. On the other hand, despite strong fluorescence in the far red/NIR region and good photostability, cyanine dyes exhibit intrinsically small Stokes shift that limits their application in multicolor bioimaging and may produce excitation and scattered light interferences. Therefore, new, non-toxic, photostable, and biocompatible fluorogenic markers with a high photoluminescence quantum yield and large Stokes shift are highly desirable.
In the present manuscript, we report a concise and efficient synthesis of a new class of dithieno [3,2-b:2′,3′-d]thiophene 4,4-dioxide (DTTDO) derivatives as highly selective fluorogenic red emitting plasma membrane probes (Figure 2). These compounds have a D-π-A-π-D architecture, where electron-donating dialkylaminophenyl groups (D) are connected with a strong electron-accepting DTTDO moiety (A) via a conjugated π linker. To ensure water solubility and simultaneous electrostatic interaction with a polar inner and outer part of the plasma membrane, DTTDO fluorophores are equipped with hydrophilic groups X at both ends. The distance between these terminal groups is about 3.6 nm and it roughly corresponds to the thickness of the phospholipid membrane. Investigation of the optical properties, cytotoxicity determined against selected human cell types, and the application of DTTDO fluorophores to plasma membrane staining in living cells, are also presented.
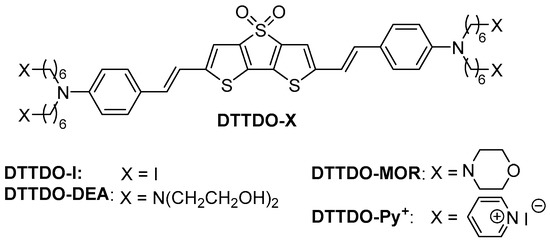
Figure 2.
Structures of synthesized DTTDO derivatives.
2. Results and Discussion
2.1. Synthesis of DTTDO Dyes
The synthesis of DTTDO derivatives started with commercially available diester 1 (also simply accessible from thiophene via a known three-step procedure [45]) (Scheme 1). The reduction of diester 1 with LiAlH4 followed by chlorination of crude diol 2 formed with an excess of thionyl chloride gave dichloride 3 in 96% overall yield. Heating of compound 3 with an excess of P(OEt)3 resulted in the formation of bisphosphonate 4, which in the next step was subjected to the oxidation reaction with 3.5 eq of m-CPBA at room temperature. The oxidation process proceeded in a highly regioselective manner to afford as a sole product sulfone 5 in 97% yield. When the same reaction was conducted with a smaller excess of m-CPBA (2.5 eq), next to sulfone 5 sulfoxide 6 was isolated in 26% yield.
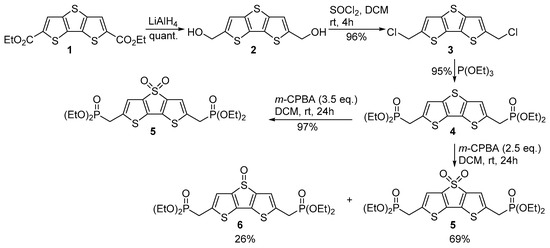
Scheme 1.
Synthesis of bisphosphonate 5.
Oxidation of the sulfur atom in the central thiophene ring of bisphosphonate 4 strongly affects its optical and electronic properties (Table 1). As evidenced by fluorescence and UV-VIS measurements, the maximum absorption (λabs) and emission (λem) wavelengths of sulfoxide 6 are red-shifted by 60 and 130 nm, respectively, in comparison to the unoxidized counterpart. On the other hand, the oxidation of sulfoxide 6 to sulfone 5 has a much lower impact on the change of its optical properties and results in a small blue shift of λabs (8 nm) and λem (27 nm). Absorption and emission spectra of bisphosphonates 4–6 are available in Supplementary Materials.

Table 1.
Optical properties of unoxidized and oxidized bisphosphonates 4–6 recorded in dichloromethane.
The origin of the regioselectivity in the oxidation of 4 can be elucidated by analysis of local aromaticity and local reactivity descriptors. For this purpose, DFT calculations of dual descriptors ) [46], nucleus-independent chemical shifts (NICS) [47], and the geometry-based harmonic oscillator model of aromaticity (HOMA) [48], for model compounds DTT, DTTMO, and DTTDO were conducted (Figure 3). As indicated by local aromaticity indices the middle thiophene ring in DTT is less aromatic than ring A and it could be expected that this ring should undergo oxidation (Table 2). A similar conclusion can be drawn from the analysis of dual descriptors which shows that the S(4) sulfur atom has the highest negative value (−0.133) which makes it the most susceptible place for an electrophilic attack in a whole DTT moiety. Sulfur oxidation induces a change in the geometry of the planar thiophene ring. In DTTMO the oxidized thiophene ring has an envelope conformation with the sulfur and oxygen atoms directed toward the opposite sides of the plane defined by the carbon skeleton. Lower values of local aromatic indices for ring B in DTTMO than for the corresponding ring in DTT indicate that the observed deviation from planarity by about 8 deg is sufficiently high to hamper effective electron delocalization in this ring and in consequence, to reduce its aromatic character. Further oxidation proceeds on the same (less stabilized) thiophene ring and leads to the planar thiophene dioxide which has an antiaromatic character. Sulfur oxidation also exerts influence on the molecular frontier orbitals. Their energy decreases with chemical oxidation. Because the decrease of the LUMO orbital energy is higher than that of the HOMO orbital energy, it results in a smaller energy gap compared to the non-oxidized counterpart.
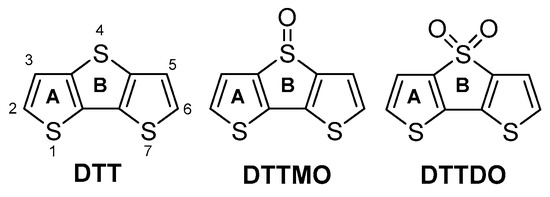
Figure 3.
Structure, ring letters (A, B), and atom numbering of DTT and its oxidized derivatives.
Table 2.
Calculated aromaticity indexes, dual descriptors, and energy of frontier orbitals of DTT, DTTMO, and DTTDO.
The reaction sequence leading from bisphosphonate 5 to DTTDO-based dyes is presented in Scheme 2. The key intermediate DTTDO-I was prepared in the Horner-Wadsworth-Emmons olefination reaction of bisphosphonate 5 with aldehyde 7. Next, the transformation of four terminal iodide groups in DTTDO-I into the corresponding quaternary ammonium salt DTTDO-Py+ was achieved by treatment of DTTDO-I with an excess of pyridine. DTTDO-MOR was obtained in the nucleophilic substitution reaction of DTTDO-I with morpholine. A similar reaction of DTTDO-I with bis(2-hydroxyethyl)amine afforded DTTDO-DEA in 88% yield.
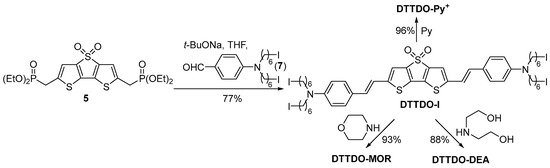
Scheme 2.
Synthesis of DTTDO derivatives.
2.2. Optical Properties of DTTDO Derivatives
To determine the optical properties of the DTTDO derivatives their UV-VIS and fluorescence spectra in five solvents of different polarity (water, DMSO, MeOH, THF, and DCM) were recorded. Stokes shift (∆λ), fluorescence quantum yield (Ф), as well as absorption (λabs) and emission (λem) maxima of these compounds, are shown in Table 3 while Figure 4 presents their normalized fluorescence and UV-VIS spectra.
Table 3.
Maximum absorption (λabs), emission (λem), Stokes shift (∆λ), and quantum yield (Ф) of DTTDO derivatives in different solvents a.
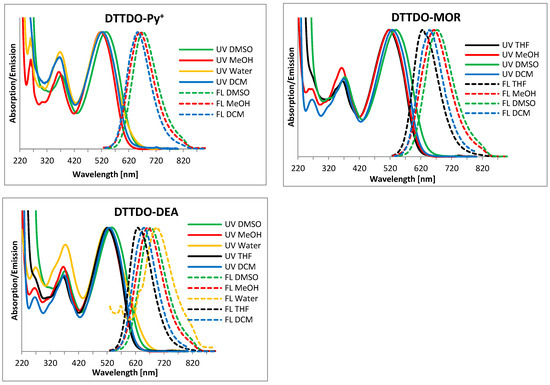
Figure 4.
Normalized fluorescence (dotted line) and UV-VIS (solid line) spectra of DTTDO derivatives in different solvents.
Due to the presence of quaternary ammonium and hydroxyl groups in DTTDO-Py+, and DTTDO-DEA, respectively, these compounds are well soluble in water, DMSO, DCM, and MeOH but only DTTDO-DEA turned out to be also soluble in THF. Although it was possible to obtain the fluorescence spectrum of DTTDO-Py+ in THF, the broad and low-intensity absorption spectrum did not allow us to reliably determine its maxima. On the other hand, DTTDO-MOR which has four terminal morpholinyl groups is insoluble in H2O but well soluble in other organic solvents. All investigated compounds have λabs maxima in the range of 517–538 nm.
Both water-soluble compounds do not exhibit (DTTDO-Py+) or exhibit (DTTDO-DEA) only a very weak fluorescence in water but their fluorescence is easily detected when dissolved in organic solvents. Because pendant groups attached to the six-carbon atom alkyl chain do not participate in the π-electron delocalization, the optical properties of DTTDO derivatives are largely independent of their type. For a given solvent, the observed difference between λabs or λem maxima is only in the range of a few nanometers.
As all of the investigated compounds have a permanent dipole moment due to the presence of a strong electron-withdrawing sulphonyl group, it could be expected that absorption and emission spectra could be affected by the solvent polarity. While in the case of UV-VIS spectra such a relationship was not seen, for emission spectra a bathochromic shift of λem to a longer wavelength was observed with an increase of the solvent dielectric constant (Figure 5).
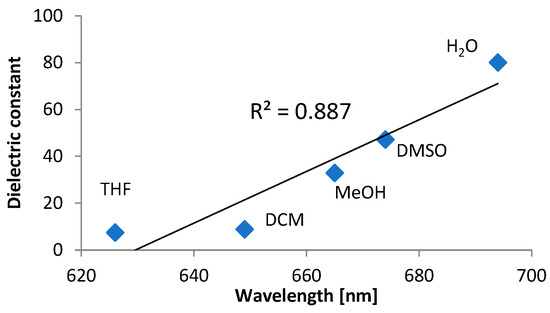
Figure 5.
Correlation between maximum emission wavelength of DTTDO-DEA and solvent dielectric constant.
It indicates that the exited state of DTTDO derivatives is more polarized than the ground state and polar solvent molecules better stabilize orbitals involved in the electronic transition. The highest λem maximum (694 nm) and the larger Stokes shift (174 nm) were observed for DTTDO-DEA in water.
Also, the fluorescence quantum yield of DTTDO derivatives strongly depends on the solvent polarity. While in DMSO the Ф values are low and do not exceed a few percent, they are significantly higher (about 3 times) in less polar dichloromethane. Because DTTDO derivatives are not soluble in a solvent of a low polarity it was not possible to determine their Ф in e.g., hexane or cyclohexane which would better mimic properties of the plasma membrane. The highest fluorescence quantum yield of 19.5% was registered for DTTDO-DEA in DCM.
2.3. Detection of Fluorescent Signal Inside the Cells
To determine the applicability and selectivity of DTTDO derivatives to cell imaging their staining properties under different cellular conditions were investigated. Microscopic observation revealed that analyzed compounds penetrated living cells and effectively stained selected cellular structures. Furthermore, no modification in the standard cell culture conditions containing antibiotics and Fetal Bovine Serum was required to observe a fluorescent signal, making it possible to use these compounds for real-time microscopic observations (Figure 6).
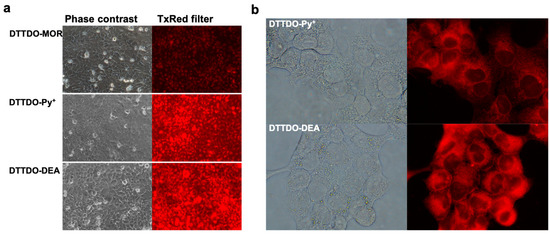
Figure 6.
Intercellular fluorescence of DTTDO derivatives in living human keratinocytes (a) and squamous carcinoma cells (b) after incubation under standard cell culture conditions in a complete medium containing FBS and antibiotics. Compounds concentration 10 µM, incubation time—24 h. Left panel—phase contrast, right panel—fluorescent images with TxRed filter (λex = 540–580 nm, λDM = 595 nm, λBA = 600–660 nm). Magnification and exposure time: 10×, 600 ms for (a) and 60×, 2 s for (b), respectively.
While the obtained results showed efficient staining of cell structures with an inconsiderable medium background for all tested DTTDO derivatives, the intensity of fluorescent signal inside the cells differed depending on the compound. Among all tested dyes, the lowest fluorescence intensity was observed for DTTDO-MOR. Both the remaining compounds demonstrated strong labeling of cells. To quantify the intracellular fluorescence signal, additional fluorescence intensity measurements were performed. For this purpose, the compounds were added to cell cultures and incubated in standard conditions for one hour in a complete medium. Before the measurements, the cells were washed twice to eliminate the background error and ensure, that obtained fluorescence value represented the signal from the cells. The obtained data confirmed the results from microscopy observations, indicating DTTDO-MOR as the least effective among the tested dyes, and DTTDO-DEA as the most efficient one (Figure 7). Furthermore, the results revealed, that a one-hour incubation is sufficient to observe the fluorescent signal from all the tested compounds inside living cells.
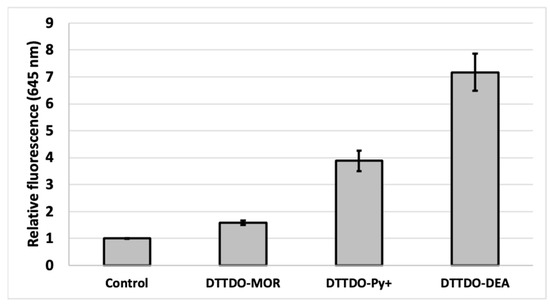
Figure 7.
The intensity of fluorescence in A431 cells after 1 h treatment with DTTDO derivatives. Results represent the mean fluorescent value at λem = 645/40 nm with λex = 530/25 nm calculated to control cells (cells treated with DMSO). Compounds concentration 10 µM.
2.4. Cytotoxicity
For an assessment of the possibility to use DTTDO derivatives for staining purposes in living cells their impact on cell viability in the concentration range that allows effective cell staining was estimated. To evaluate the cytotoxic properties of the tested dyes, two types of model cells: cancer and non-cancerous human cells were selected. Cancer cells were represented by epidermoid squamous carcinoma cells (A431), while human keratinocytes were used as the model of normal cells.
In the concentration range used (0.1–10 μM), no significant toxic effect was observed after a 24-h incubation of the cells with the compounds both in the case of A431 cancer cells and in non-cancerous keratinocytes. The cell survival rate remained above 70% for all tested compounds (Figure 8). At a concentration enabling efficient cell staining, none of the tested compounds exhibited cytotoxicity after 24 h of incubation. The above results indicate that these compounds can be safely used for living cell staining.
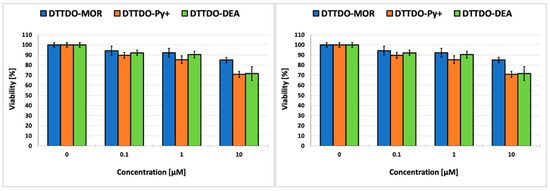
Figure 8.
Cytotoxicity of tested compounds for human epidermoid squamous carcinoma cells (A431) (left panel) and human keratinocytes (right panel) after 24 h incubation. Results represent the mean cell viability calculated with reference control (cells treated with DMSO—100% viability).
3. Materials and Methods
3.1. Synthesis of DTTDO Derivatives
3.1.1. General Remarks
All water- and air-sensitive reactions were conducted in the neutral gas atmosphere using freshly distilled dry solvents. Dry THF and DCM were prepared by distillation over Na/benzophenone and calcium hydride, respectively. Commercial-grade reagents and solvents were used without further purification except as indicated above. NMR spectra were recorded on Bruker AV Neo 400 (Bruker, Billerica, MA, USA) or Avance III 600 (Bruker) spectrometers. 1H, 13C, and 31P chemical shifts are reported relative to the residual proton resonance in the deuterated solvents or referred to 85% phosphoric acid, respectively. All chemical shifts (δ) are given in ppm. HRMS measurements were performed on a Finnigan MAT 95 (Thermo Fisher Scientific, Waltham, MA, USA) or Waters Synapt HDMS (Waters Corporation, Milford, MA, USA) mass spectrometer. Melting points are uncorrected. 4-(N,N-bis(6-iodohexyl)amino)benzaldehyde (7) was prepared according to the literature procedure [41]. NMR spectra of all synthesized compounds are available in Supplementary Materials.
3.1.2. Synthetic Procedures
2,6-Bis(hydroxymethyl)dithieno[3,2-b:2′,3′-d]thiophene (2): To a suspension of LiAlH4 (0.49 g, 12.8 mmol) in THF (10 mL) at 0 °C a suspension of 2,6-diethyl dithieno [3,2-b:2′,3′-d]thiophene dicarboxylate (1) (1.75 g, 5.1 mmol) in THF (10 mL) was added in several portions. The reaction mixture was stirred at room temperature for 1 h, and AcOEt (10 mL) followed by water (20 mL) was added carefully. The mixture was extracted with AcOEt (3 × 30 mL) and the combined organic layers were dried over anhydrous magnesium sulfate. Evaporation of the solvent under reduced pressure afforded the crude diol 2 (1.31 g, quant.) as a white solid, which was used in the next step without purification. Mp 156–158 °C; 1H NMR (400 MHz, DMSO-d6) δ 7.31 (s, 2H, CH), 5.99–5.39 (br s, 2H, OH), 4.68 (s, 4H, CH2); 13C NMR (126 MHz, DMSO-d6) δ 147.65 (CCH2), 139.50 (CH), 129.30, 118.17, 58.99 (CH2); Anal. calcd. for C10H8O2S3 (256.35): C, 46.85; H, 3.15; S, 37.52. Found: C, 46.72; H, 3.12; S, 37.33.
2,6-Bis(dichloromethyl)dithieno[3,2-b:2′,3′-d]thiophene (3): Thionyl chloride (1.78 g, 15 mmol) was added to a suspension of diol 2 (1.28 g, 5 mmol) in DCM (20 mL) and a mixture was stirred at room temperature for 4 h. The reaction mixture was carefully poured into a saturated ice-cold NaHCO3 aqueous solution and extracted with DCM (3 × 30 mL). The combined organic layers were dried over anhydrous magnesium sulfate. Filtration followed by concentration under reduced pressure yielded 3 (1.40 g, 96%) as a greyish solid which was used in the next reaction without further purification. Mp 190–192 °C (decomposition); 1H NMR (400 MHz, CDCl3) δ 7.29 (s, 2H, CH), 4.88 (s, 4H, CH2Cl); 13C NMR (126 MHz, CDCl3) δ 141.39, 140.65 (CH), 131.79, 121.41 (CCH2), 41.48 (CH2); HRMS(EI) m/z: [M]+ calcd. for C10H6Cl2S3 291.9009, found 291.9023; Anal. calcd. for C10H8Cl2S3 (293.24): C, 40.96; H, 2.06; S, 32.80. Found: C, 40.78; H, 2.30; S, 32.70.
2,6-Bis[(diethoxyphosphoryl)methyl]dithieno[3,2-b:2′,3′-d]thiophene (4): Dichloride 3 (1.40 g, 4.8 mmol) and triethyl phosphate (9.96 g, 60 mmol, 10.3 mL) were heated at 150 °C for 24 h. An excess of triethyl phosphate was removed under reduced pressure and the residue was purified by column chromatography (diethyl ether/acetone 5:1) affording 4 (2.26 g, 95%) as a yellow solid. Mp 80–82 °C; Rf = 0.2 (diethyl ether/acetone 5:1); 31P NMR (81 MHz, CDCl3) δ 23.48; 1H NMR (400 MHz, CDCl3) δ 7.17 (d, JHP = 3.7 Hz, 2H, CH), 4.10 (quint, 8H, POCH2), 3.42 (d, JHP = 21.2 Hz, 4H, PCH2), 1.30 (t, JHH = 7.1 Hz, 12H, CH3); 13C NMR (400 MHz, CDCl3) δ 140.19, 133.39 (d, JCP = 10.3 Hz, C-CH2), 130.24, 120.96 (d, JCP = 9.1 Hz, CH), 62.73 (d, JCP = 7.0 Hz, POCH2), 29.32 (d, JCP = 143.3 Hz, CH2P), 16.58 (d, JCP = 6.0 Hz, CH3); HRMS(CI) m/z: [M+H]+ calcd. for C18H27O6P2S3 497.0446, found 497.0445.
2,6-Bis[(diethoxyphosphoryl)methyl]dithieno[3,2-b:2′,3′-d]thiophene-4,4-dioxide (5): To a solution of bisphosphonate 4 (2.26 g, 4.6 mmol) in CH2Cl2 (20 mL), m-CPBA (2.78 g, 16.1 mmol) was added and a mixture was stirred at room temperature for 24 h. A saturated aqueous solution of NaHCO3 (20 mL) was added and the mixture was extracted with CH2Cl2 (3 × 20 mL). The combined organic layers were washed with H2O (20 mL) and dried over anhydrous magnesium sulfate. After evaporation of the solvent, the residue was purified by column chromatography (CH2Cl2/acetone 10:1) affording dioxide 5 (2.33 g, 97%) as a yellow solid. Mp 116–118 °C; Rf = 0.42 (CH2Cl2/acetone 2:1); 31P NMR (81 MHz, CDCl3): δ 22.12; 1H NMR (101 MHz, CDCl3) δ 7.04 (d, JHP = 3.4 Hz, 2H, CH), 4.16–4.09 (m, 8H, POCH2), 3.34 (d, JHP = 21.1 Hz, 4H, CH2), 1.32 (t, JHH = 7.1 Hz, 12H, CH3); 13C NMR (400 MHz, CDCl3) δ 141.73, 138.67 (d, JCP = 11.1 Hz, CCH2), 135.21, 119.96 (d, JCP = 9.7 Hz, CH), 63.00 (d, JCP = 7.1 Hz, POCH2), 29.12 (d, JCP = 144.2 Hz, CH2P), 16.58 (d, JCP = 6.3 Hz, CH3); HRMS(CI) m/z: [M+H]+ calcd. for C18H27O8P2S3 529.0343, found 529.0337.
6-Bis[(diethoxyphosphoryl)methyl]dithieno[3,2-b:2′,3′-d]thiophene-4-oxide (6): When oxidation of bisphosphonate 4 was carried out according to the above procedure but using a smaller excess of m-CPBA (2.5 eq.), next to 4,4-dioxide 5, sulphoxide 6 was isolated as a yellow solid in 26% yield. Mp 82–84 °C; Rf = 0.13 (CH2Cl2/acetone 2:1); 31P NMR (81 MHz, CDCl3) δ 22.59; 1H NMR (400 MHz, CDCl3) δ 7.22 (d, JHP = 3.4 Hz, 2H, CH), 4.16–4.08 (m, 8H, OCH2), 3.36 (d, JHP = 21.0 Hz, 4H, PCH2), 1.32 (td, JHP = 7.1, JHH = 1.5 Hz, 12H, CH3); 13C NMR (101 MHz, CDCl3): δ 148.76, 137.81, 137.01 (d, JCP = 11.1 Hz, CCH2), 123.67 (d, JCP = 9.6 Hz, CH), 62.90 (OCH2), 29.11 (d, JCP = 144.3 Hz, CH2P), 16.60 (d, JCP = 6.2 Hz, CH3); HRMS(ES+) m/z: [M+H]+ calcd. for C18H27O7P2S3 513.0394, found 513.0407.
2,6-Bis{4-[N,N-bis(6-iodohexyl)amino]styryl}dithieno[3,2-b:2′,3′-d]thiophene-4,4-dioxide (DTTDO-I): Bisphosphonate 5 (0.39 g, 0.74 mmol) and aldehyde 7 (0.84 g, 1.55 mmol) were dissolved in THF (60 mL) at 0 °C. Sodium tert-butoxide (1.10 mL 2M in THF, 2.21 mmol) was added and the cooling bath was removed. After stirring for 4.5 h the reaction mixture was quenched with a 5% HCl solution and extracted with CHCl3 (3 × 50 mL). The combined organic layers were dried over anhydrous MgSO4. After evaporation of the solvents under reduced pressure, the remaining material was purified by column chromatography (petroleum ether/ethyl acetate 10:1) to give DTTDO-I (0.70 g, 77%) as a dark red solid. Mp 249–250 °C; Rf = 0.45 (ethyl acetate); 1H NMR (600 MHz, CDCl3) δ 7.31 (d, J = 8.6 Hz, 4H, CPhH), 6.99 (s, 2H, CDTTDOH), 6.87 (d, J = 16.0 Hz, 2H, CH=CH), 6.84 (d, J = 16.0 Hz, 2H, CH=CH), 6.59 (d, J = 8.5 Hz, 4H, CPhH), 3.29 (t, J = 7.6 Hz, 8H, NCH2), 3.20 (t, J = 6.9 Hz, 8H, CH2I), 1.84 (quint, J = 7.1 Hz, 8H, CH2CH2I), 1.61 (quint, J = 7.6 Hz, 8H, NCH2CH2), 1.46 (quint, J = 7.4 Hz, 8H, CH2CH2CH2I), 1.36 (quint, J = 7.5 Hz, 8H, NCH2CH2CH2); 13C NMR (151 MHz, CDCl3) δ 149.28 (2C, CDTTDO), 148.41 (2C, NCPh), 142.51 (2C, CDTTDO), 132.30 (2C, CDTTDO), 131.05 (2C, CH=CH), 128.37 (4C, HCPh), 123.24 (2C, CHCPh), 115.93 (2C, HCDTTDO), 115.68 (2C, CH=CH), 111.85 (4C, HCPh), 51.02 (4 C, NCH2), 33.52 (4C, CH2CH2CH2), 30.46 (4C, CH2CH2CH2), 27.27 (4C, CH2CH2CH2), 26.18 (4C, CH2CH2CH2), 7.09 (4C, CH2I); HRMS (ES+) m/z: [M+H]+ calcd for C48H63I4N2O2S3 1303.1235; found 1303.1234; Anal. calcd. for C48H62I4N2O2S3 (1302.83): C, 44.25; H, 4.80; S, 7.38; N, 2.15. Found: C, 44.35; H, 4.68; S, 7.20.
2,6-Bis(4-{N,N-bis[6-(pyridinium)hexyl]amino}styryl)dithieno[3,2-b:2′,3′-d]thiophene-4,4-dioxide (DTTDO-Py+). A solution of tetraiodide DTTDO-I (50 mg, 0.038 mmol) and pyridine (1 mL) in methanol (4 mL) was stirred at 45 °C for 8 h. The solvent and pyridine were evaporated under reduced pressure and the residue was dissolved in methanol. Precipitation with diethyl ether afforded DTTDO-Py+ (60 mg, 96%) as a dark purple solid. Mp 125–6 °C; 1H NMR (400 MHz, DMSO-d6) δ 9.08 (d, J = 5.4 Hz, 8H, H(2)Py), 8.61 (tt, J = 7.7, 1.4 Hz, 4H, H(4)Py), 8.17 (dd, J = 7.8, 6.5 Hz, 8H, H(3)Py), 7.47 (s, 2H, HCDTTDO), 7.37 (d, J = 8.5 Hz, 4H, CPhH), 7.12 (d, J = 16.0 Hz, 2H, CH=CH), 7.00 (d, J = 16.0 Hz, 2H, CH=CH), 6.62 (d, J = 8.5 Hz, 4H, CPhH), 4.59 (t, J = 7.5 Hz, 8H, CH2N+), 3.31 (br s, 8H, CH2N), 1.92 (quint, J = 7.1 Hz, 8H, CH2CH2N+), 1.58–1.24 (m, 24H, CH2). 13C NMR (101 MHz, DMSO) δ 149.47 (2C, CDTTDO), 147.94 (2C, CPhN), 145.48(4C, C(4)Py), 144.68 (8C, C(2)Py), 141.93 (2C, CDTTDO), 131.25 (2C, CDTTDO), 130.79 (2C, CH=CH), 128.34 (4C, CPhH), 128.07(8C, C(3)Py), 122.51 (2C, CAr), 115.80 (2C, HCDTTDO), 115.28 (2C, CH=CH), 111.44 (4C, CPhH), 60.62 (4C, CH2N+), 49.88 (4C, CH2N), 30.69 (4C, CH2CH2N+), 26.61 (4C, CH2), 25.77 (4C, CH2), 25.33 (4C, CH2); HRMS (ES+) m/z: [M-I]+ calcd for C68H82I3N6O2S3 1491.2799; found 1491.2795; Anal. calcd. for C68H82I4N6O2S3 (1619.24): C, 50.44; H, 5.10; S, 5.94. Found: C, 50.32; H, 5.12; S, 6.12.
2,6-Bis(4-{N,N-bis[6-(4-morpholinyl)hexyl]amino}styryl)dithieno[3,2-b:2′,3′-d]thiophene-4,4-dioxide (DTTDO-MOR): DTTDO-I (58 mg, 0.045 mmol) and morpholine (0.387 mg, 4.45 mmol) were dissolved in THF (12 mL) and heated at 70 °C for 8 h. Volatile ingredients were removed under reduced pressure, and a saturated aqueous solution of NaHCO3 (5 mL) was added. The mixture was extracted with DCM (3 × 30 mL). The combined organic extracts were washed with water (5 mL) and dried over Na2SO4. Solvent evaporation followed by the purification of the crude material by column chromatography (DCM/MOH = 10:1.5) afforded DTTDO-MOR (47 mg, 93%) as a dark purple solid. Mp 53–5 °C; Rf = 0.3 (DCM/MeOH = 10:1.5); 1H NMR (400 MHz, CDCl3) δ 7.57 (d, J = 8.3 Hz, 4H, CPhH), 7.52 (s, 2H, CDTTDOH), 7.14 (d, J = 16.2 Hz, 2H, CH=CH), 7.10 (d, J = 15.8 Hz, 2H, CH=CH), 6.85 (d, J = 8.5 Hz, 4H, CPhH), 3.99 (t, J = 4.7 Hz, 16H, OCH2), 3.55 (t, J = 7.6 Hz, 8H, CPhNCH2), 2.70 (br s, 16H, NCH2CH2O), 2.60 (t, J = 7.6 Hz, 8H, OCH2CH2NCH2), 1.90–1.72 (m, 16H, CH2), 1.65–1.56 (m, 16H, CH2); 13C NMR (101 MHz, CDCl3) δ 149.26 (2C, CDTTDO), 148.41 (2C, CPhN), 142.43 (2C, CDTTDO), 132.26 (2C, CDTTDO), 131.03 (2C, CH=CH), 128.31 (4C, CPhH), 123.00, 115.89 (2C, CDTTDOH), 115.55 (2C, CH=CH), 111.72 (4C, CPhH), 67.06 (8C, OCH2), 59.19 (4C, OCH2CH2NCH2), 53.89 (8C, NCH2CH2O), 51.10 (4C, CPhNCH2), 27.53 (4C, CH2), 27.39 (4C, CH2), 27.20 (4C, CH2), 26.66 (4C, CH2); HRMS (ES+) m/z: [M+H]+ calcd for C64H95N6O2S3 1139.6483; found 1139.6475; Anal. calcd. For C64H94N6O6S3 (1139.67): C, 67.45; H, 8.31; S, 8.44. Found: C, 67.66; H, 8.35; S, 8.30.
2,6-Bis[4-(N,N-bis{6-[bis(2-hydroxyethyl)amino]hexyl}amino)styryl]dithieno[3,2-b:2′,3′-d]thiophene-4,4-dioxide (DTTDO-DEA): A solution of DTTDO-I (53 mg, 0.041 mmol) and diethanolamine (0.35 g, 3.33 mmol) in THF (12 mL) was heated at 70 °C for 6 h. Volatile ingredients were evaporated under reduced pressure. Then, saturated aqueous NaHCO3 solution (5 mL) was added and the mixture was extracted with CH2Cl2 (3 × 20 mL). The combined organic extracts were washed with water and dried over Na2SO4. Solvent evaporation followed by the purification of the crude material by column chromatography (DCM/MeOH/Et3N = 5:15:0.4) afforded DTTDO-DEA (43 mg, 88%) as a dark purple solid. Mp 76–78 °C; 1H NMR (400 MHz, CD3OD) δ 7.13 (d, J = 7.9 Hz, 4H, CPhH), 6.89 (s, 2H, CDTTDOH), 6.62 (br s, 4H, CH=CH), 6.48 (d, J = 7.9 Hz, 4H, CPhH), 3.59 (t, J = 5.9 Hz, 16H, OCH2), 3.16 (br s, 8H), 2.62 (t, J = 5.9 Hz, 16H, NCH2CH2O), 2.51 (t, J = 7.2 Hz, 8H, CPhNCH2), 1.55–1.39 (m, 16H, CH2), 1.32–1.22 (m, 16H, CH2); 13C NMR (101 MHz, CD3OD) δ 151.03, 149.63, 143.38, 133.25, 131.93 (2C, CH=CH), 129.61 (4C, CPhH), 124.43, 116.75 (2C, CDTTDOH), 116.33 (2C, CH=CH), 112.81 (4C, CPhH), 60.69 (8C, OCH2), 57.58 (8C, NCH2CH2O), 56.24 (4C, OCH2CH2NCH2), 51.95 (4C, CPhNCH2), 28.65 (4C, CH2), 28.55 (4C, CH2), 28.23 (4C, CH2), 27.88 (4C, CH2); HRMS (ES+) m/z: [M+H]+ calcd for C64H103N6O10S3 1211.6890; found 1211.6898; Anal. calcd. for C64H102N6O10S3 (1211.73): C, 63.44; H, 8.49; S, 6.94. Found: C, 63.71; H, 8.40; S, 6.81.
3.2. Computational Methods
Geometries of all compounds were optimized without symmetry restrictions at the Second Order Møller-Plesset perturbation theory (MP2) [49] using the frozen-core approximation and triple-zeta Dunning’s correlation-consistent cc-pVTZ basis set [50] (atomic coordinates of DTT, DTTMO, and DTTDO are available in Supplementary Materials). Stationary points found on the potential energy surface were confirmed to be equilibrium structures by calculation of vibrational frequencies at the same level as the geometry optimization. These optimized structures were subsequently used for single-point calculations of molecular properties. All DFT and wave-function-based calculations were performed using Gaussian 09 D.01 [51]. “Ultrafine” integration grid and tight convergence criteria were applied in all cases. Nucleus-independent chemical shifts (NICS) [47] and harmonic oscillator model of aromaticity (HOMA) [48] index were employed for the analyses of the local aromaticity. The HOMA index was calculated according to the following formula
where N is the number of bonds in the considered ring, is constant for a specific pair of connected atoms, Ropt is an optimal bond length for a fully delocalized π-electron reference system, and Ri,j is the actual bond length between i and j atoms. For fully aromatic rings HOMA is equal 1, which means that each bond length is equal to the optimal value Ropt. Pre-calculated constants proposed by Krygowski [48] were taken for HOMA index calculations (CC bond: αCC = 257.7, Ropt = 1.388; CS bond: αCS = 94.09, Ropt = 1.677). The NICS index, which is defined as the opposite value of magnetic shielding at the specified location in space, was calculated at the mp2/cc-pVTZ geometries using m06L [52] functional and cc-pVTZ basis set. The negative NICS value indicates the presence of an induced diatropic ring current (aromatic character) whereas the positive one specifies a paratropic ring current and denotes antiaromaticity. Following the recommendation of Schleyer and co-workers [47], in our aromaticity analysis, the NICS variant denoted as NICS(1)zz was applied and the absolute magnetic shielding was calculated 1 Å above the ring critical point. To predict favorable reactive sites and reactivity character dual descriptor for nucleophilicity and electrophilicity was calculated [46]. This index is defined as the difference between nucleophilic and electrophilic Fukui functions [53] and is expressed by the following formula:
Numerical values of are defined within the range {−1; 1}.The positive value indicates that the site is favored for the nucleophilic attack, whereas the negative one suggests that the site is more susceptible to the reaction with electrophiles. Dual descriptors were calculated using the PBE0 [54] functional and aug-cc-pVTZ [55,56] basis set. Calculation of the HOMA aromaticity index and local reactivity dual descriptors was conducted using Multiwfn 3.8 software [57].
3.3. Optical Characterization
The absorption and emission spectra were recorded on Shimadzu UV-VIS spectrophotometer UV 2700 (Shimadzu Scientific, Kyoto, Japan) and Horriba Scientific FluoroMax+ spectrofluorimeter (Horriba Scientific, Kyoto, Japan), respectively, at room temperature. All measurements were conducted using spectrophotometric grade solvents. Fluorescence spectra were recorded after excitation at maximum absorption wavelength. Fluorescence quantum yield (Ф) was calculated using Rhodamine 101 in EtOH as a reference (Ф = 1).
3.4. Cell Culture Conditions
The biological part of the research was performed using two types of human cells: cancer—squamous carcinoma cells (A431) and non-cancerous—human keratinocytes. The human keratinocytes came from Leibniz Institute DSMZ-German Collection of Microorganisms and Cell Cultures (Braunschweig, Germany). The A431 cells were purchased from American Type Culture Collection (ATCC, Manassas, Virginia, USA). Both types of cells were cultured in Dulbecco’s modified Eagle’s medium (DMEM) (Sigma-Aldrich, St. Louis, MO, USA) supplemented with 10% fetal bovine serum (FBS) (Sigma-Aldrich, St. Louis, MO, USA) and 100 U/mL penicillin and 100 μg/mL streptomycin (Invitrogen). Cells were grown at 37 °C under a 5% CO2 atmosphere. For each experiment, cells were counted using ScepterTM 2.0 Cell Counter (Merck, Darmstadt, Germany).
3.5. Measurements of Cellular Fluorescence Intensity
The A431 cells were seeded into 96-well black plates for fluorescent measurements at a concentration of 10,000 cells per well and then allowed to adhere for 24 h in the cell culture incubator under standard conditions (37 °C and 5% CO2). After that time, the culture medium from each well was removed and the new medium containing tested compounds at a concentration of 10 μM was added. Cells were incubated with tested dyes for 1 h under standard cell culture conditions (37 °C and 5% CO2). After treatment, the medium containing DTTDO derivatives was removed and cells were washed twice with PBS buffer to avoid a possible background signal. After washing, cell fluorescence was measured by Synergy HT microplate reader (Bio-Tek, Winooski, VT, USA) at an excitation and emission wavelength range of λex = 530/25 and λem = 645/40 nm, respectively.
The cells treated only with DMSO were used as a control. The mean fluorescence value of these cells was used as a reference. The fluorescence value for DTTDO-treated cells was calculated related to the control sample. Each experiment was performed thrice in three repetitions.
3.6. Cell Viability Test
The cytotoxicity of compounds was assessed using the MTT test, based on the measurement of the activity of mitochondrial dehydrogenase, which converts yellow tetrazolium salts ((3-(4,5-dimethyl-2-thiazolyl)-2,5-diphenyltetrazolium bromide) into water-insoluble formazan. The tests were performed based on the previously described procedure [58]. The cells were seeded into 96-well plates at a concentration of 10,000 cells per well and left under standard conditions (37 °C, 5% CO2) for 24 h. Then, the culture medium was removed and a fresh medium containing DMSO (negative control), SDS (positive control), or test compounds dissolved in DMSO was added. After a 24-h incubation, the (3-(4,5-dimethyl-2-thiazolyl)-2,5-diphenyltetrazolium bromide was added to the culture medium. After a 2-h incubation at 37 °C, the medium was removed, and 100 µL of isopropanol was added to each well and shaken for an hour at room temperature. The absorbance was measured at 570 nm (evaluation of formazan amount) and 630 nm (reference value) using a Synergy HT plate reader (Bio-Tek) with KC4 3.2 Rev 2 software (Bio-Tek). The compounds were tested at concentrations of 0.1, 1, and 10 µM. The final amount of DMSO in each well was 1%. Each variant was repeated at least three times in each experiment. The cytotoxicity level of each compound was calculated relative to the negative control (DMSO-treated cells) set at 100%. Each viability point represents the mean value from at least three independent experiments performed thrice.
3.7. Visualization of Compounds Inside the Cell
For the fluorescence microscopy imaging 50,000 cells were seeded into each well of a 24-well plate and incubated in standard conditions (37 °C, 5% CO2) for 24 h. Then, the medium was removed and a new medium containing DTTDO derivatives at the final concentration of 10 μM was added. Cells were then cultured with tested compounds in a cell culture incubator under standard conditions (37 °C, 5% CO2). At the 24 h time point, the fluorescence of the cells was observed using a Nis Eclipse Ti microscope (Nikon, Tokyo, Japan). The microscopic observations were performed immediately on the plates without changing the cell culture medium. Cells were observed using a TxRed filter (λex = 540–580 nm, λDM = 595 nm, λBA = 600–660 nm; DM is a dichroic mirror and BA is an absorption filter). Data were recorded and analyzed using Nis-Elements BR 4.30.00 software (Nikon).
4. Conclusions
In summary, the simple and effective synthesis of a series of fluorescent 2,6-divinyl DTTDO derivatives was accomplished in six steps starting from 2,6-diethyl dithienothiophene dicarboxylate in 66–60% overall yield. The key steps of the synthesis involved the preparation of tetraiodide DTTDO-I in the Horner-Wadsworth-Emmons reaction of bisphosphonate 5 with aldehyde 7, followed by its conversion into the appropriate DTTDO derivatives in the reaction with different nucleophiles. The synthesized compounds turned out to be selective fluorescent dyes for staining membranous structures of the cells. They exhibit emission in the red light for which autofluorescence from the biological samples is highly reduced. Moreover, their fluorogenic properties and negligible cytotoxicity effects at the concentration required for effective staining enable real-time observations of living cells under standard cell culture conditions in a whole cell medium containing serum and antibiotics. Additionally, DTTDO dyes are also suitable for multicolor experiments with compounds that exhibit green or blue fluorescence.
Supplementary Materials
The following supporting information can be downloaded at: https://www.mdpi.com/article/10.3390/ma16051806/s1: absorption and emission spectra of bisphosphonates 4–6; atomic coordinates of DTT, DTTMO, and DTTDO optimized at the mp2/cc-pVTZ level; NMR spectra of all synthesized compounds.
Author Contributions
Conceptualization, R.Ż.; Investigation, A.R., J.K., R.P. and R.Ż.; Methodology, R.P. and R.Ż.; Writing—original draft, R.P. and R.Ż.; Writing—review and editing, R.Ż. All authors have read and agreed to the published version of the manuscript.
Funding
This research received no external funding.
Institutional Review Board Statement
Not applicable.
Informed Consent Statement
Not applicable.
Data Availability Statement
The data presented in this study are available in Supplementary Materials.
Conflicts of Interest
The authors declare no conflict of interest.
References
- Noutsi, P.; Gratton, E.; Chaieb, S. Assessment of Membrane Fluidity Fluctuations during Cellular Development Reveals Time and Cell Type Specificity. PLoS ONE 2016, 11, e0158313. [Google Scholar] [CrossRef]
- Hung, M.-C.; Link, W. Protein localization in disease and therapy. J. Cell Sci. 2011, 124, 3381–3392. [Google Scholar] [CrossRef]
- Lingwood, D.; Simons, K. Lipid Rafts As a Membrane-Organizing Principle. Science 2010, 327, 46–50. [Google Scholar] [CrossRef]
- Sezgin, E.; Levental, I.; Mayor, S.; Eggeling, C. The Mystery of Membrane Organization: Composition, Regulation and Roles of Lipid Rafts. Nat. Rev. Mol. Cell Biol. 2017, 18, 361–374. [Google Scholar] [CrossRef]
- Rello, S.; Stockert, J.C.; Moreno, V.; Gamez, A.; Pacheco, M.; Juarranz, A.; Canete, M.; Villanueva, A. Morphological criteria to distinguish cell death induced by apoptotic and necrotic treatments. Apoptosis 2005, 10, 201–208. [Google Scholar] [CrossRef]
- Shynkar, V.V.; Klymchenko, A.S.; Kunzelmann, C.; Duportail, G.; Muller, C.D.; Demchenko, A.P.; Freyssinet, J.-M.; Mély, Y. Fluorescent Biomembrane Probe for Ratiometric Detection of Apoptosis. J. Am. Chem. Soc. 2007, 129, 2187–2193. [Google Scholar] [CrossRef]
- Zhao, C.; Liu, Y.; Wang, W.; Wang, Z.-M.; Lin, W. Tracking cell apoptosis based on mitochondria and cell membrane imaging. J. Photochem. Photobiol. A Chem. 2021, 412, 113245. [Google Scholar] [CrossRef]
- Drummen, G.P.C. Fluorescent Probes and Fluorescence (Microscopy) Techniques—Illuminating Biological and Biomedical Research. Molecules 2012, 17, 14067–14090. [Google Scholar] [CrossRef]
- Nienhaus, K.; Nienhaus, G.U. Fluorescent proteins for live-cell imaging with super-resolution. Chem. Soc. Rev. 2014, 43, 1088–1106. [Google Scholar] [CrossRef]
- Li, J.; Zhu, J.-J. Quantum dots for fluorescent biosensing and bio-imaging applications. Analyst 2013, 138, 2506–2515. [Google Scholar] [CrossRef]
- Kairdolf, B.A.; Smith, A.M.; Stokes, T.H.; Wang, M.D.; Young, A.N.; Nie, S. Semiconductor quantum dots for bioimaging and biodiagnostic applications. Annu. Rev. Anal. Chem. 2013, 6, 143–162. [Google Scholar] [CrossRef]
- Terai, T.; Nagano, T. Small-molecule fluorophores and fluorescent probes for bioimaging. Pflügers Arch.-Eur. J. Physiol. 2013, 465, 347–359. [Google Scholar] [CrossRef]
- Yang, L.; Chen, Q.; Wang, Z.; Zhang, H.; Sun, H. Small-molecule fluorescent probes for plasma membrane staining: Design, mechanisms and biological applications. Coord. Chem. Rev. 2023, 474, 214862. [Google Scholar] [CrossRef]
- Olzmann, J.A.; Carvalho, P. Dynamics and functions of lipid droplets. Nat. Rev. Mol. Cell Biol. 2019, 20, 137–155. [Google Scholar] [CrossRef]
- Umezawa, K.; Citterio, D.; Suzuki, K. New trends in near-infrared fluorophores for bioimaging. Anal. Sci. 2014, 30, 327–349. [Google Scholar] [CrossRef]
- Yuan, L.; Lin, W.; Zheng, K.; He, L.; Huang, W. Far-red to near infrared analyte-responsive fluorescent probes based on organic fluorophore platforms for fluorescence imaging. Chem. Soc. Rev. 2012, 42, 622–661. [Google Scholar] [CrossRef]
- Nadler, A.; Schultz, P.D.C. The Power of Fluorogenic Probes. Angew. Chem. Int. Ed. 2013, 52, 2408–2410. [Google Scholar] [CrossRef]
- Li, X.; Gao, X.; Shi, W.; Ma, H. Design Strategies for Water-Soluble Small Molecular Chromogenic and Fluorogenic Probes. Chem. Rev. 2014, 114, 590–659. [Google Scholar] [CrossRef]
- Laguerre, A.; Schultz, C. Novel lipid tools and probes for biological investigations. Curr. Opin. Cell Biol. 2018, 53, 97–104. [Google Scholar] [CrossRef]
- Carvalho, P.H.P.R.; Correa, J.R.; Paiva, K.L.R.; Machado, D.F.S.; Scholten, J.D.; Neto, B.A.D. Plasma membrane imaging with a fluorescent benzothiadiazole derivative. Beilstein J. Org. Chem. 2019, 15, 2644–2654. [Google Scholar] [CrossRef]
- Passos, S.T.A.; Souza, G.C.; Brandão, D.C.; Machado, D.F.S.; Grisolia, C.K.; Correa, J.R.; da Silva, W.A.; Neto, B.A.D. Plasma membrane staining with fluorescent hybrid benzothiadiazole and coumarin derivatives: Tuning the cellular selection by molecular design. Dye. Pigment. 2021, 186, 109005. [Google Scholar] [CrossRef]
- Zhang, Y.; Yan, Y.; Xia, S.; Wan, S.; Steenwinkel, T.E.; Medford, J.; Durocher, E.; Luck, R.L.; Werner, T.; Liu, H. Cell Membrane-Specific Fluorescent Probe Featuring Dual and Aggregation-Induced Emissions. ACS Appl. Mater. Interfaces 2020, 12, 20172–20179. [Google Scholar] [CrossRef]
- Collot, M.; Boutant, E.; Lehmann, M.; Klymchenko, A.S. BODIPY with tuned amphiphilicity as a fluorogenic plasma membrane probe. Bioconjugate Chem. 2019, 30, 192–199. [Google Scholar] [CrossRef]
- Zhang, X.; Wang, C.; Jin, L.; Han, Z.; Xiao, Y. Photostable Bipolar Fluorescent Probe for Video Tracking Plasma Membranes Related Cellular Processes. ACS Appl. Mater. Interfaces 2014, 6, 12372–12379. [Google Scholar] [CrossRef]
- López-Duarte, I.; Vu, T.T.; Izquierdo, M.A.; Bull, J.A.; Kuimova, M.K. A Molecular Rotor for Measuring Viscosity in Plasma Membranes of Live Cells. Chem. Commun. 2014, 50, 5282–5284. [Google Scholar] [CrossRef]
- Collot, M.; Kreder, R.; Tatarets, A.L.; Patsenker, L.D.; Mély, Y.; Klymchenko, A.S. Bright fluorogenic squaraines with tuned cell entry for selective imaging of plasma membrane vs. endoplasmic reticulum. Chem. Commun. 2015, 51, 17136–17139. [Google Scholar] [CrossRef]
- Kucherak, O.A.; Oncul, S.; Darwich, Z.; Yushchenko, D.A.; Arntz, Y.; Didier, P.; Mély, Y.; Klymchenko, A.S. Switchable Nile Red-Based Probe for Cholesterol and Lipid Order at the Outer Leaflet of Biomembranes. J. Am. Chem. Soc. 2010, 132, 4907–4916. [Google Scholar] [CrossRef]
- Kreder, R.; Oncul, S.; Kucherak, O.A.; Pyrshev, K.A.; Real, E.; Mély, Y.; Klymchenko, A.S. Blue fluorogenic probes for cell plasma membranes fill the gap in multicolour imaging. RSC Adv. 2015, 5, 22899–22905. [Google Scholar] [CrossRef]
- Heek, T.; Nikolaus, J.; Schwarzer, R.; Fasting, C.; Welker, P.; Licha, K.; Herrmann, A.; Haag, R. An Amphiphilic Perylene Imido Diester for Selective Cellular Imaging. Bioconjug. Chem. 2013, 24, 153–158. [Google Scholar] [CrossRef]
- Shaya, J.; Collot, M.; Benailly, F.; Mahmoud, N.; Mély, Y.; Michel, B.Y.; Klymchenko, A.S.; Burger, A. Turn-On Fluorene Push-Pull Probes with High Brightness and Photostability for Visualizing Lipid Order in Biomembranes. ACS Chem. Biol. 2017, 12, 3022–3030. [Google Scholar] [CrossRef]
- Guo, L.; Zhang, R.; Sun, Y.; Tian, M.; Zhang, G.; Feng, R.; Li, X.; Yu, X.; He, X. Styrylpyridine Salts-Based Red Emissive Two-Photon Turn-on Probe for Imaging the Plasma Membrane in Living Cells and Tissues. Analyst 2016, 141, 3228–3232. [Google Scholar] [CrossRef]
- Kwiatek, J.M.; Owen, D.M.; Abu-Siniyeh, A.; Yan, P.; Loew, L.M.; Gaus, K. Characterization of a New Series of Fluorescent Probes for Imaging Membrane Order. PLoS ONE 2013, 8, e52960. [Google Scholar] [CrossRef]
- Tian, M.; Liu, Y.; Sun, Y.; Zhang, R.; Feng, R.; Zhang, G.; Guo, L.; Li, X.; Yu, X.; Sun, J.Z.; et al. A Single Fluorescent Probe Enables Clearly Discriminating and Simultaneously Imaging Liquid-Ordered and Liquid-Disordered Microdomains in Plasma Membrane of Living Cells. Biomaterials 2017, 120, 46–56. [Google Scholar] [CrossRef]
- Hu, L.; Xu, B.; Chen, H.; Wang, H. A water-soluble AIEgen for ultrafast and wash-free imaging of plasma membranes in Biosystems. Sens. Actuators. B Chem. 2021, 340, 129950. [Google Scholar] [CrossRef]
- Concilio, S.; Ferrentino, I.; Sessa, L.; Massa, A.; Iannelli, P.; Diana, R.; Panunzi, B.; Rella, A.; Piotto, S. A Novel Fluorescent Solvatochromic Probe for Lipid Bilayers. Supramol. Chem. 2017, 29, 887–895. [Google Scholar] [CrossRef]
- Molin, M.D.; Verolet, Q.; Colom, A.; Letrun, R.; Derivery, E.; Gonzalez-Gaitan, M.; Vauthey, E.; Roux, A.; Sakai, N.; Matile, S. Fluorescent Flippers for Mechanosensitive Membrane Probes. J. Am. Chem. Soc. 2015, 137, 568–571. [Google Scholar] [CrossRef]
- Fin, A.; Jentzsch, A.V.; Sakai, N.; Matile, S. Oligothiophene Amphiphiles as Planarizable and Polarizable Fluorescent Membrane Probes. Angew. Chem. Int. Ed. 2012, 51, 12736–12739. [Google Scholar] [CrossRef]
- Yan, P.; Xie, A.; Wei, M.; Loew, L.M. Amino(Oligo)Thiophene-Based Environmentally Sensitive Biomembrane Chromophores. J. Org. Chem. 2008, 73, 6587–6594. [Google Scholar] [CrossRef]
- Collot, M.; Ashokkumar, P.; Anton, H.; Boutant, E.; Faklaris, O.; Galli, T.; Mély, Y.; Danglot, L.; Klymchenko, A.S. MemBright: A Family of Fluorescent Membrane Probes for Advanced Cellular Imaging and Neuroscience. Cell Chem. Biol. 2019, 26, 600–614.E7. [Google Scholar] [CrossRef]
- Wang, Y.-N.; Xu, B.; Qiu, L.-H.; Xu, Y.-J.; Sun, R.; Ge, J.-F. A series of novel cell membrane fluorescent probes based on oxazolopyridine unit. Dyes Pigm. 2021, 185, 108883. [Google Scholar] [CrossRef]
- Łukasik, B.; Milczarek, J.; Pawlowska, R.; Żurawiński, R.; Chworos, A. Facile synthesis of fluorescent distyrylnaphthalene derivatives for bioapplications. New J. Chem. 2017, 41, 6977–6980. [Google Scholar] [CrossRef]
- Gwozdzinska, P.; Pawlowska, R.; Milczarek, J.; Garner, L.E.; Thomas, A.W.; Bazan, G.C.; Chworos, A. Phenylenevinylene conjugated oligoelectrolytes as fluorescent dyes for mammalian cell imaging. Chem. Commun. 2014, 50, 14859–14861. [Google Scholar] [CrossRef]
- Heinrich, L.; Freyria, A.-M.; Melin, M.; Tourneur, Y.; Maksoud, R.; Bernengo, J.-C.; Hartmann, D.J. Confocal laser scanning microscopy using dialkylcarbocyanine dyes for cell tracing in hard and soft biomaterials. J. Biomed. Mater. Res. Part B Appl. Biomater. 2007, 81B, 153–161. [Google Scholar] [CrossRef]
- Ilina, K.; MacCuaig, W.M.; Laramie, M.; Jeouty, J.N.; McNally, L.R.; Henary, M. Squaraine Dyes: Molecular Design for Different Applications and Remaining Challenges. Bioconjugate Chem. 2020, 31, 194–213. [Google Scholar] [CrossRef]
- Frey, J.; Bond, A.D.; Holmes, A.B. Improved synthesis of dithieno[3,2-b:2′,3′-d]thiophene (DTT) and derivatives for cross coupling. Chem. Commun. 2002, 20, 2424–2425. [Google Scholar] [CrossRef]
- Morell, C.; Grand, A.; Toro-Labbé, A. New Dual Descriptor for Chemical Reactivity. J. Phys. Chem. A 2005, 109, 205–212. [Google Scholar] [CrossRef]
- von Ragué Schleyer, P.; Manoharan, M.; Wang, Z.-X.; Kiran, B.; Jiao, H.; Puchta, R.; van Eikema Hommes, N.J.R. Dissected Nucleus-Independent Chemical Shift Analysis of π-Aromaticity and Antiaromaticity. Org. Lett. 2001, 3, 2465–2468. [Google Scholar] [CrossRef]
- Krygowski, T.M. Crystallographic Studies of Inter- and Intramolecular Interactions Reflected in Aromatic Character of .pi.-Electron Systems. J. Chem. Inf. Comput. Sci. 1993, 33, 70–78. [Google Scholar] [CrossRef]
- Møller, C.; Plesset, M.S. Note on an approximation treatment for many-electron systems. Phys. Rev. 1934, 46, 618–622. [Google Scholar] [CrossRef]
- Dunning, T.H., Jr. Gaussian basis sets for use in correlated molecular calculations. I. The atoms boron through neon and hydrogen. J. Chem. Phys. 1989, 90, 1007–1023. [Google Scholar] [CrossRef]
- Frisch, M.J.; Trucks, G.W.; Schlegel, H.B.; Scuseria, G.E.; Robb, M.A.; Cheeseman, J.R.; Scalmani, G.; Barone, V.; Mennucci, B.; Petersson, G.A.; et al. Gaussian 09; Revision D.01; Gaussian, Inc.: Wallingford, CT, USA, 2009. [Google Scholar]
- Zhao, Y.; Truhlar, D.G. A new local density functional for main-group thermochemistry, transition metal bonding, thermochemical kinetics, and noncovalent interactions. J. Chem. Phys. 2006, 125, 194101. [Google Scholar] [CrossRef]
- Parr, R.G.; Yang, W. Density Functional Approach to the Frontier-Electron Theory of Chemical Reactivity. J. Am. Chem. Soc. 1984, 106, 4049–4050. [Google Scholar] [CrossRef]
- Adamo, C.; Barone, V. Toward reliable density functional methods without adjustable parameters: The PBE0 model. J. Chem. Phys. 1999, 110, 6158–6170. [Google Scholar] [CrossRef]
- Kendall, R.A.; Dunning, T.H., Jr. Electron affinities of the first-row atoms revisited. Systematic basis sets and wave functions. J. Chem. Phys. 1992, 96, 6796–6806. [Google Scholar] [CrossRef]
- Woon, D.E.; Dunning, T.H., Jr. Gaussian basis sets for use in correlated molecular calculations. III. The atoms aluminum through argon. J. Chem. Phys. 1993, 98, 1358–1371. [Google Scholar] [CrossRef]
- Lu, T.; Chen, F. Multiwfn: A Multifunctional Wavefunction Analyzer. J. Comput. Chem. 2012, 33, 580–592. [Google Scholar] [CrossRef]
- Łukasik, B.; Mikina, M.; Mikołajczyk, M.; Pawłowska, R.; Żurawiński, R. A novel route to a chiral building block for the preparation of cyclopentenyl carbocyclic nucleosides. Synthesis and anticancer activity of enantiomeric neplanocins A. RSC Adv. 2020, 10, 31838–31847. [Google Scholar] [CrossRef]
Disclaimer/Publisher’s Note: The statements, opinions and data contained in all publications are solely those of the individual author(s) and contributor(s) and not of MDPI and/or the editor(s). MDPI and/or the editor(s) disclaim responsibility for any injury to people or property resulting from any ideas, methods, instructions or products referred to in the content. |
© 2023 by the authors. Licensee MDPI, Basel, Switzerland. This article is an open access article distributed under the terms and conditions of the Creative Commons Attribution (CC BY) license (https://creativecommons.org/licenses/by/4.0/).