
Effect of Graphene Nanosheets on the Microstructure and Mechanical Properties of Sn-20Bi Solder

Abstract
:1. Introduction
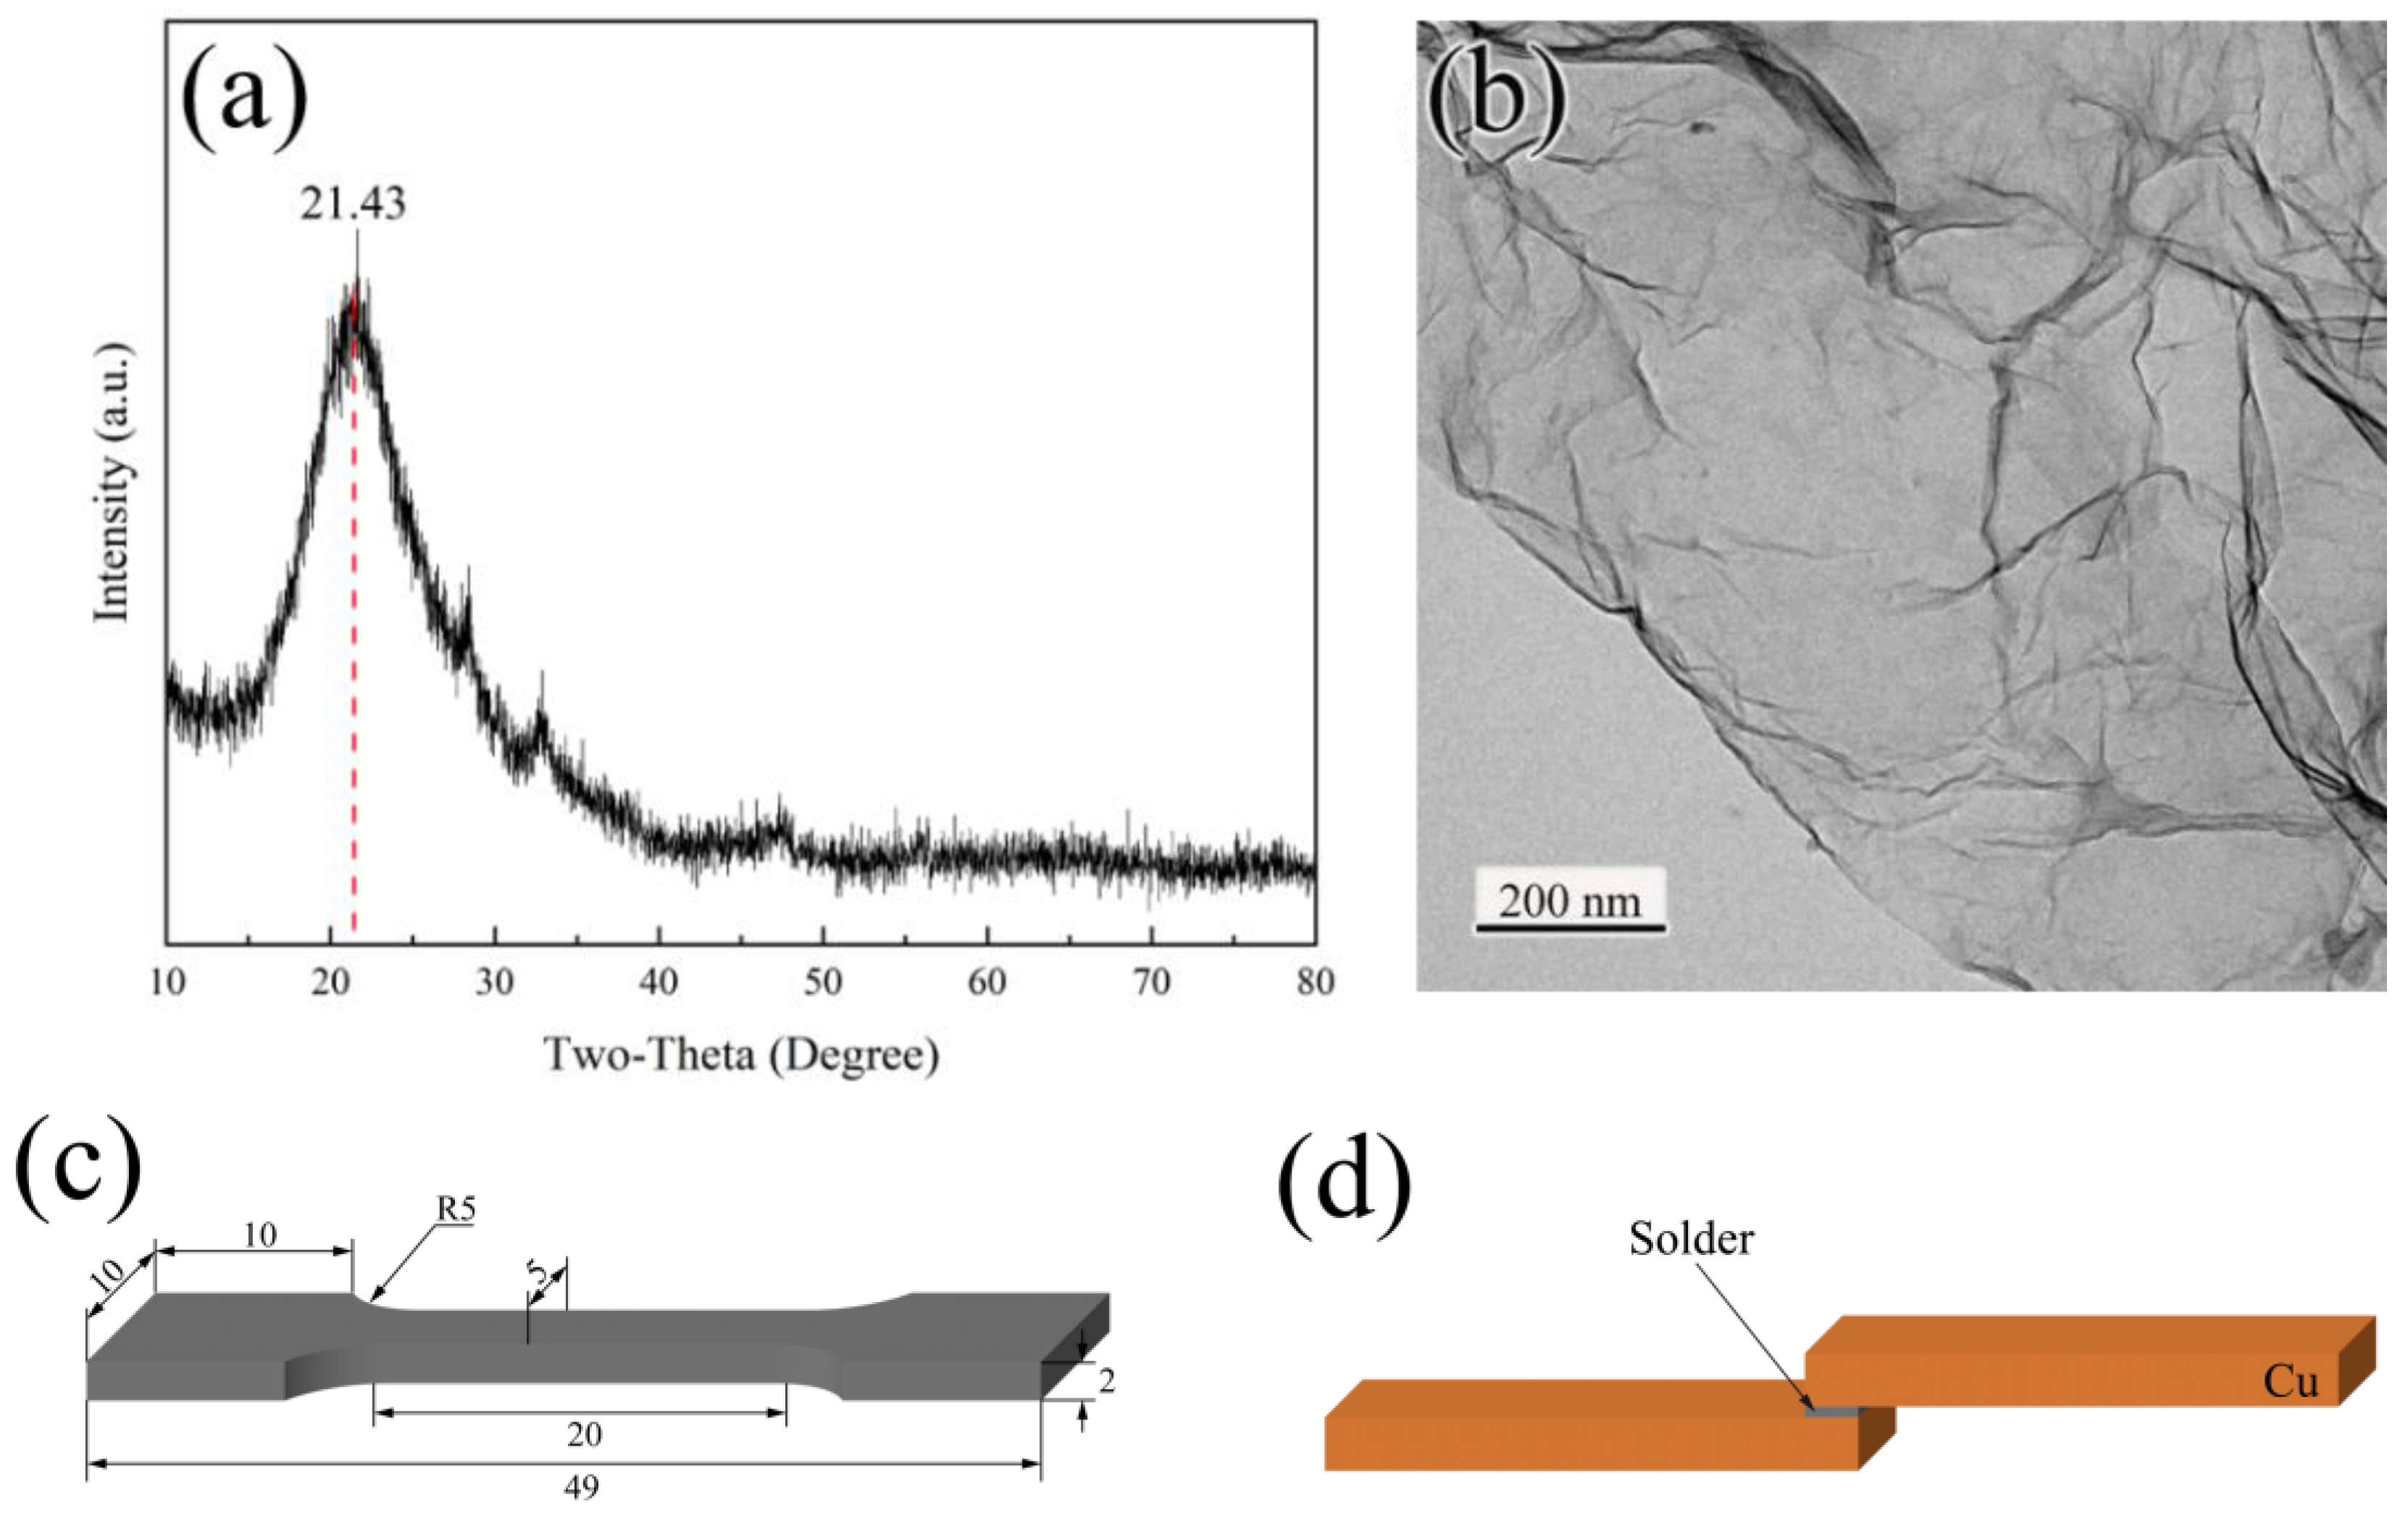
2. Experimental
3. Results and Discussion
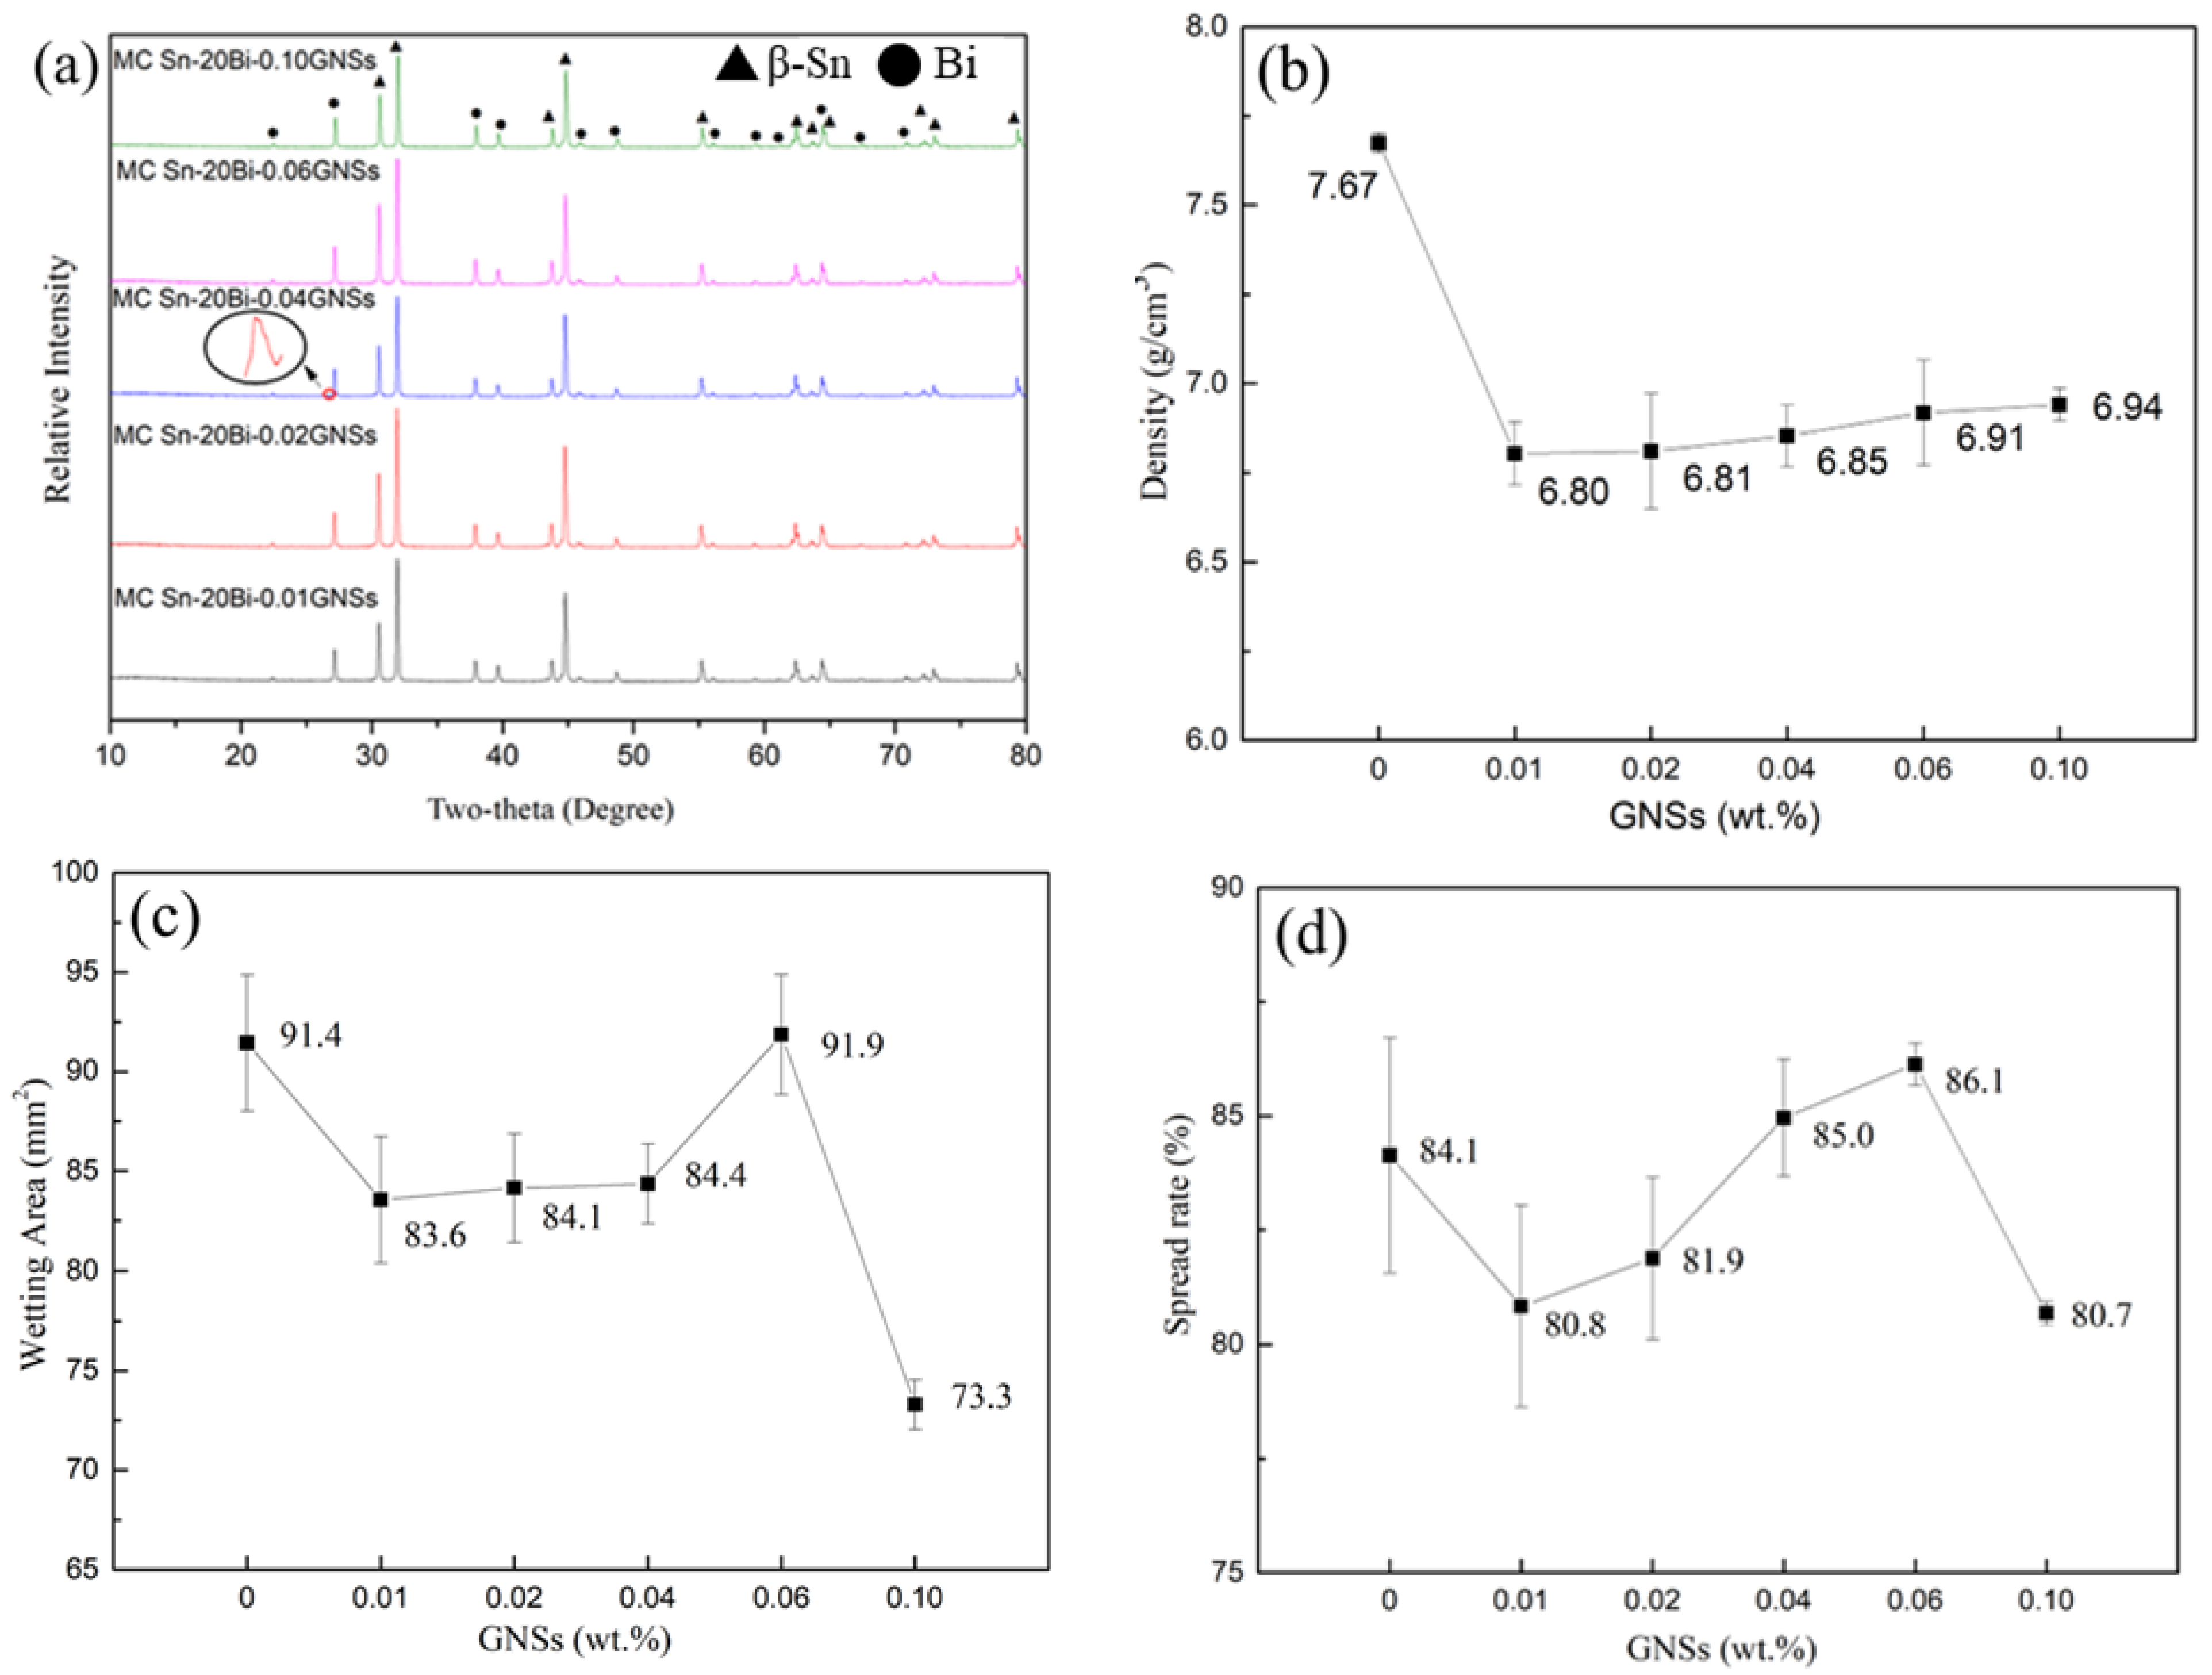
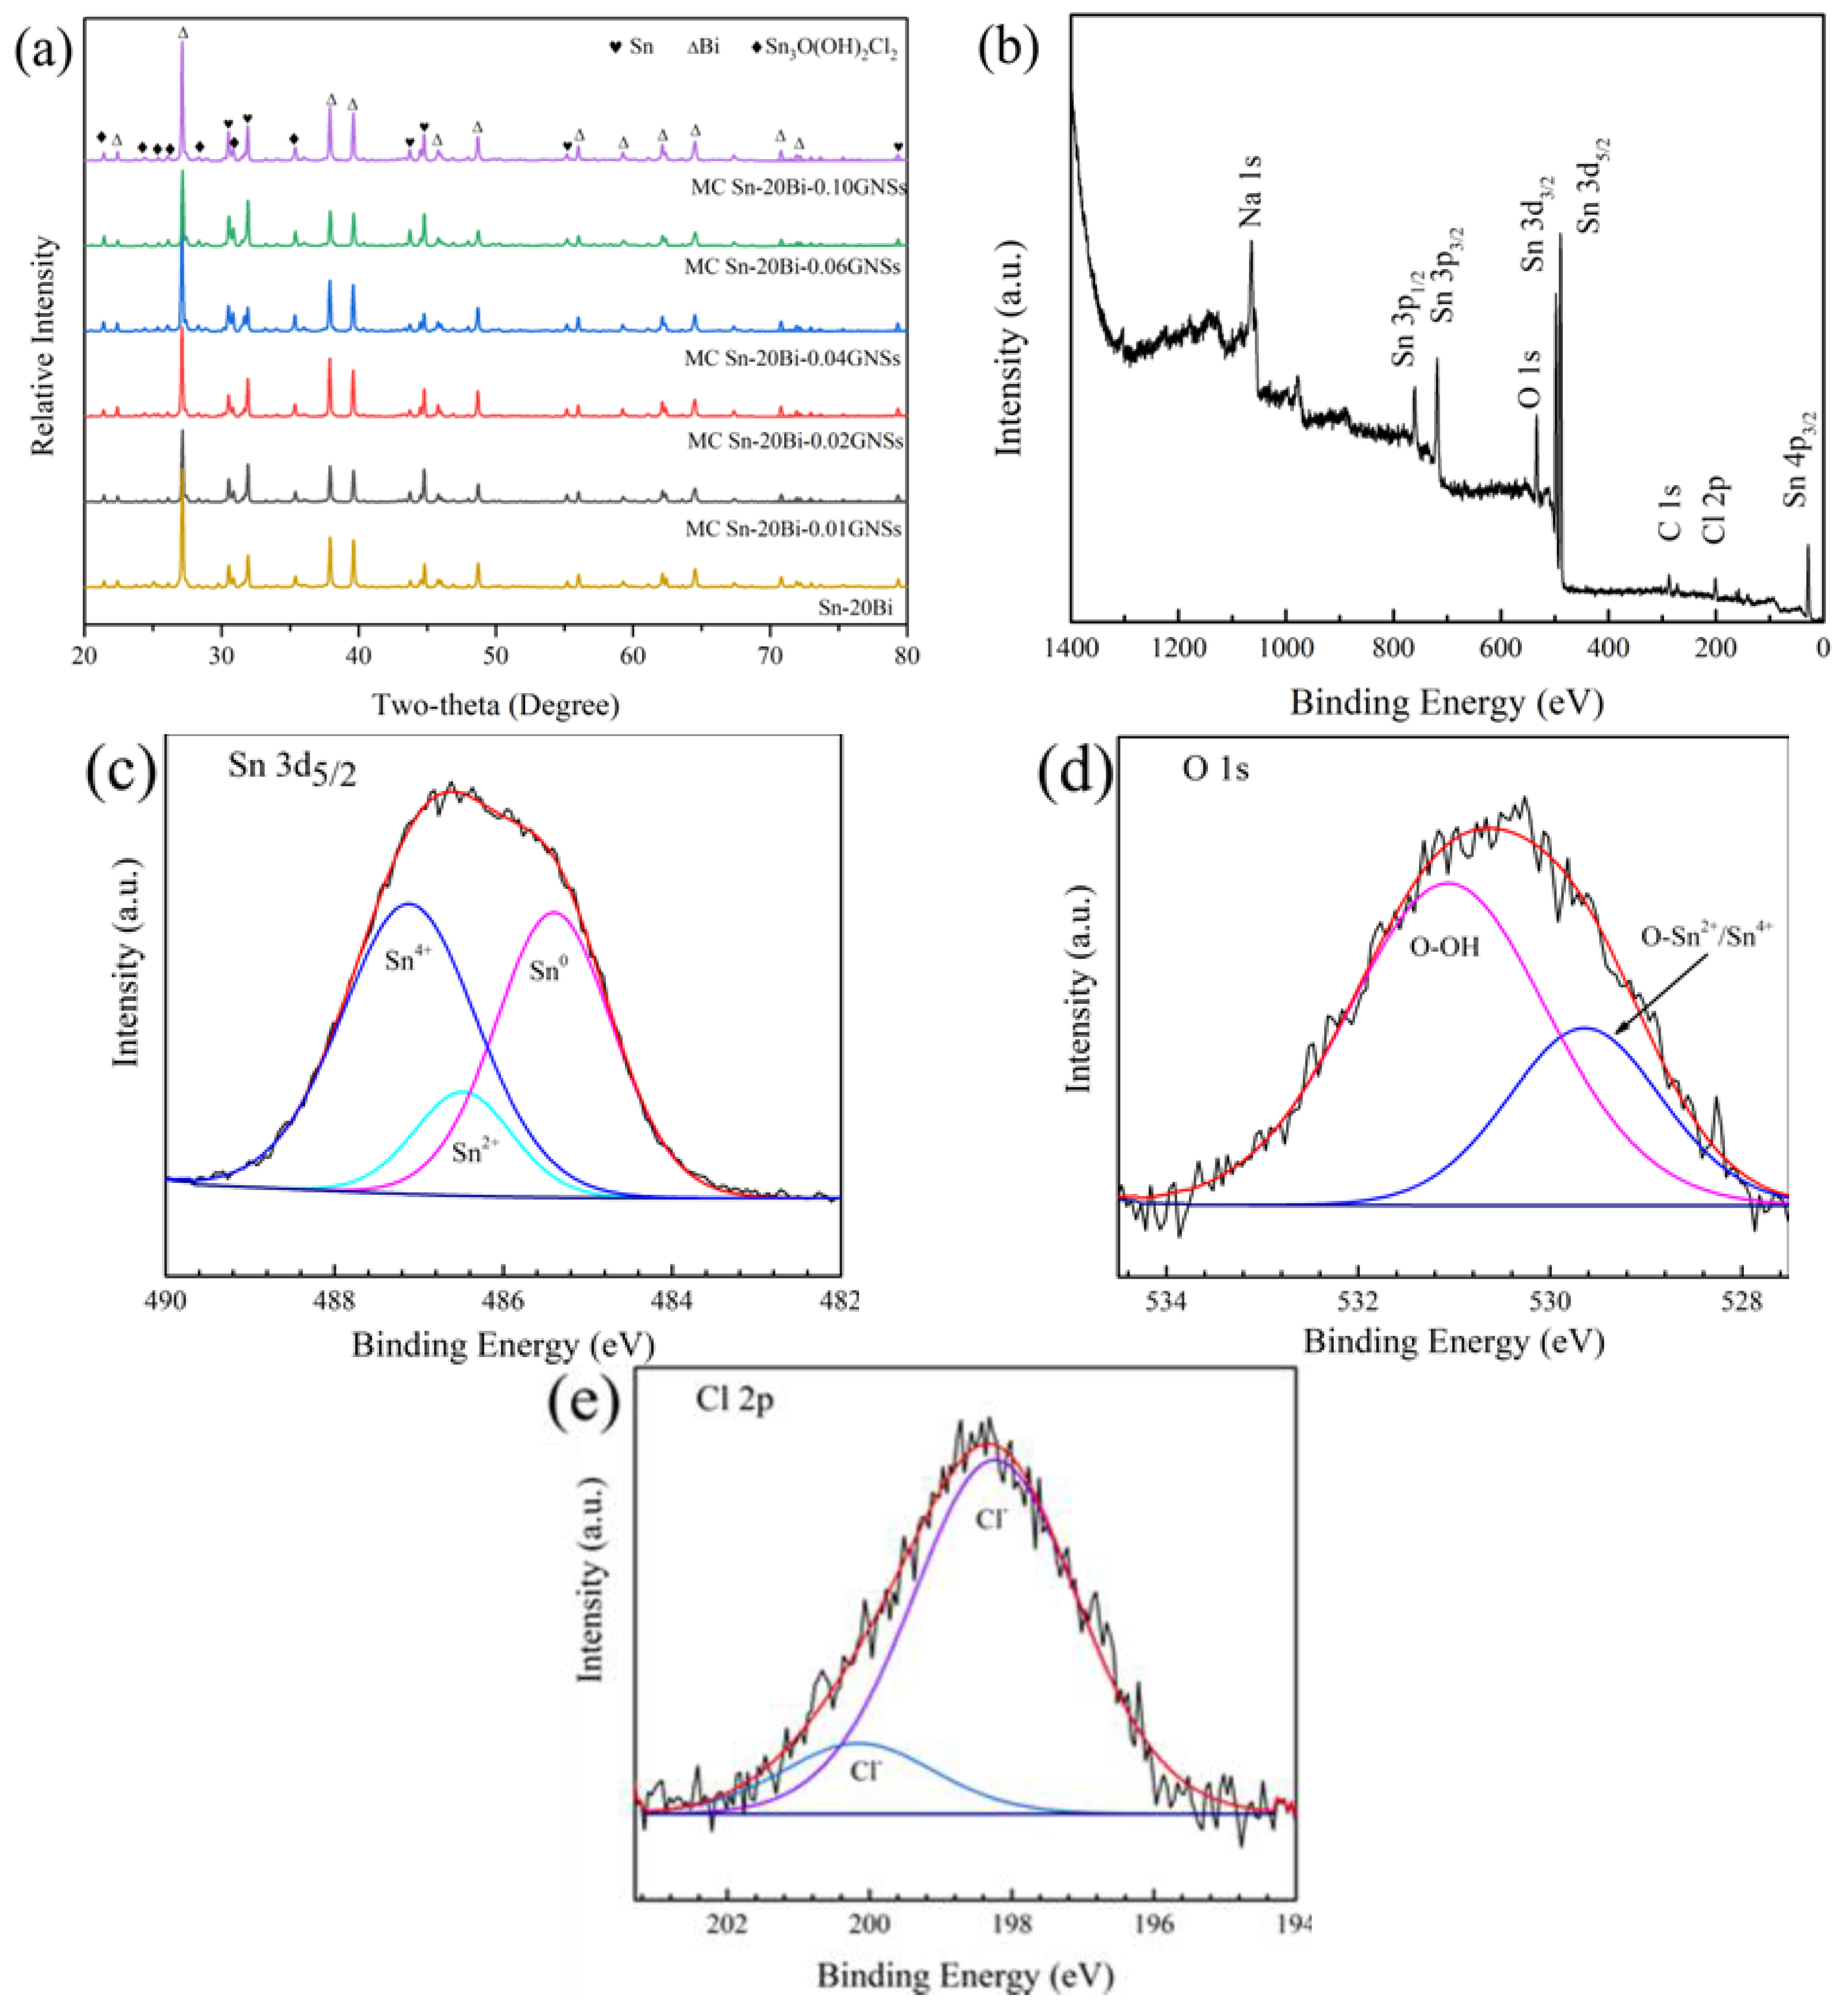
3.1. Phase Composition and Microstructure of Composite Solders
3.2. Physical Properties
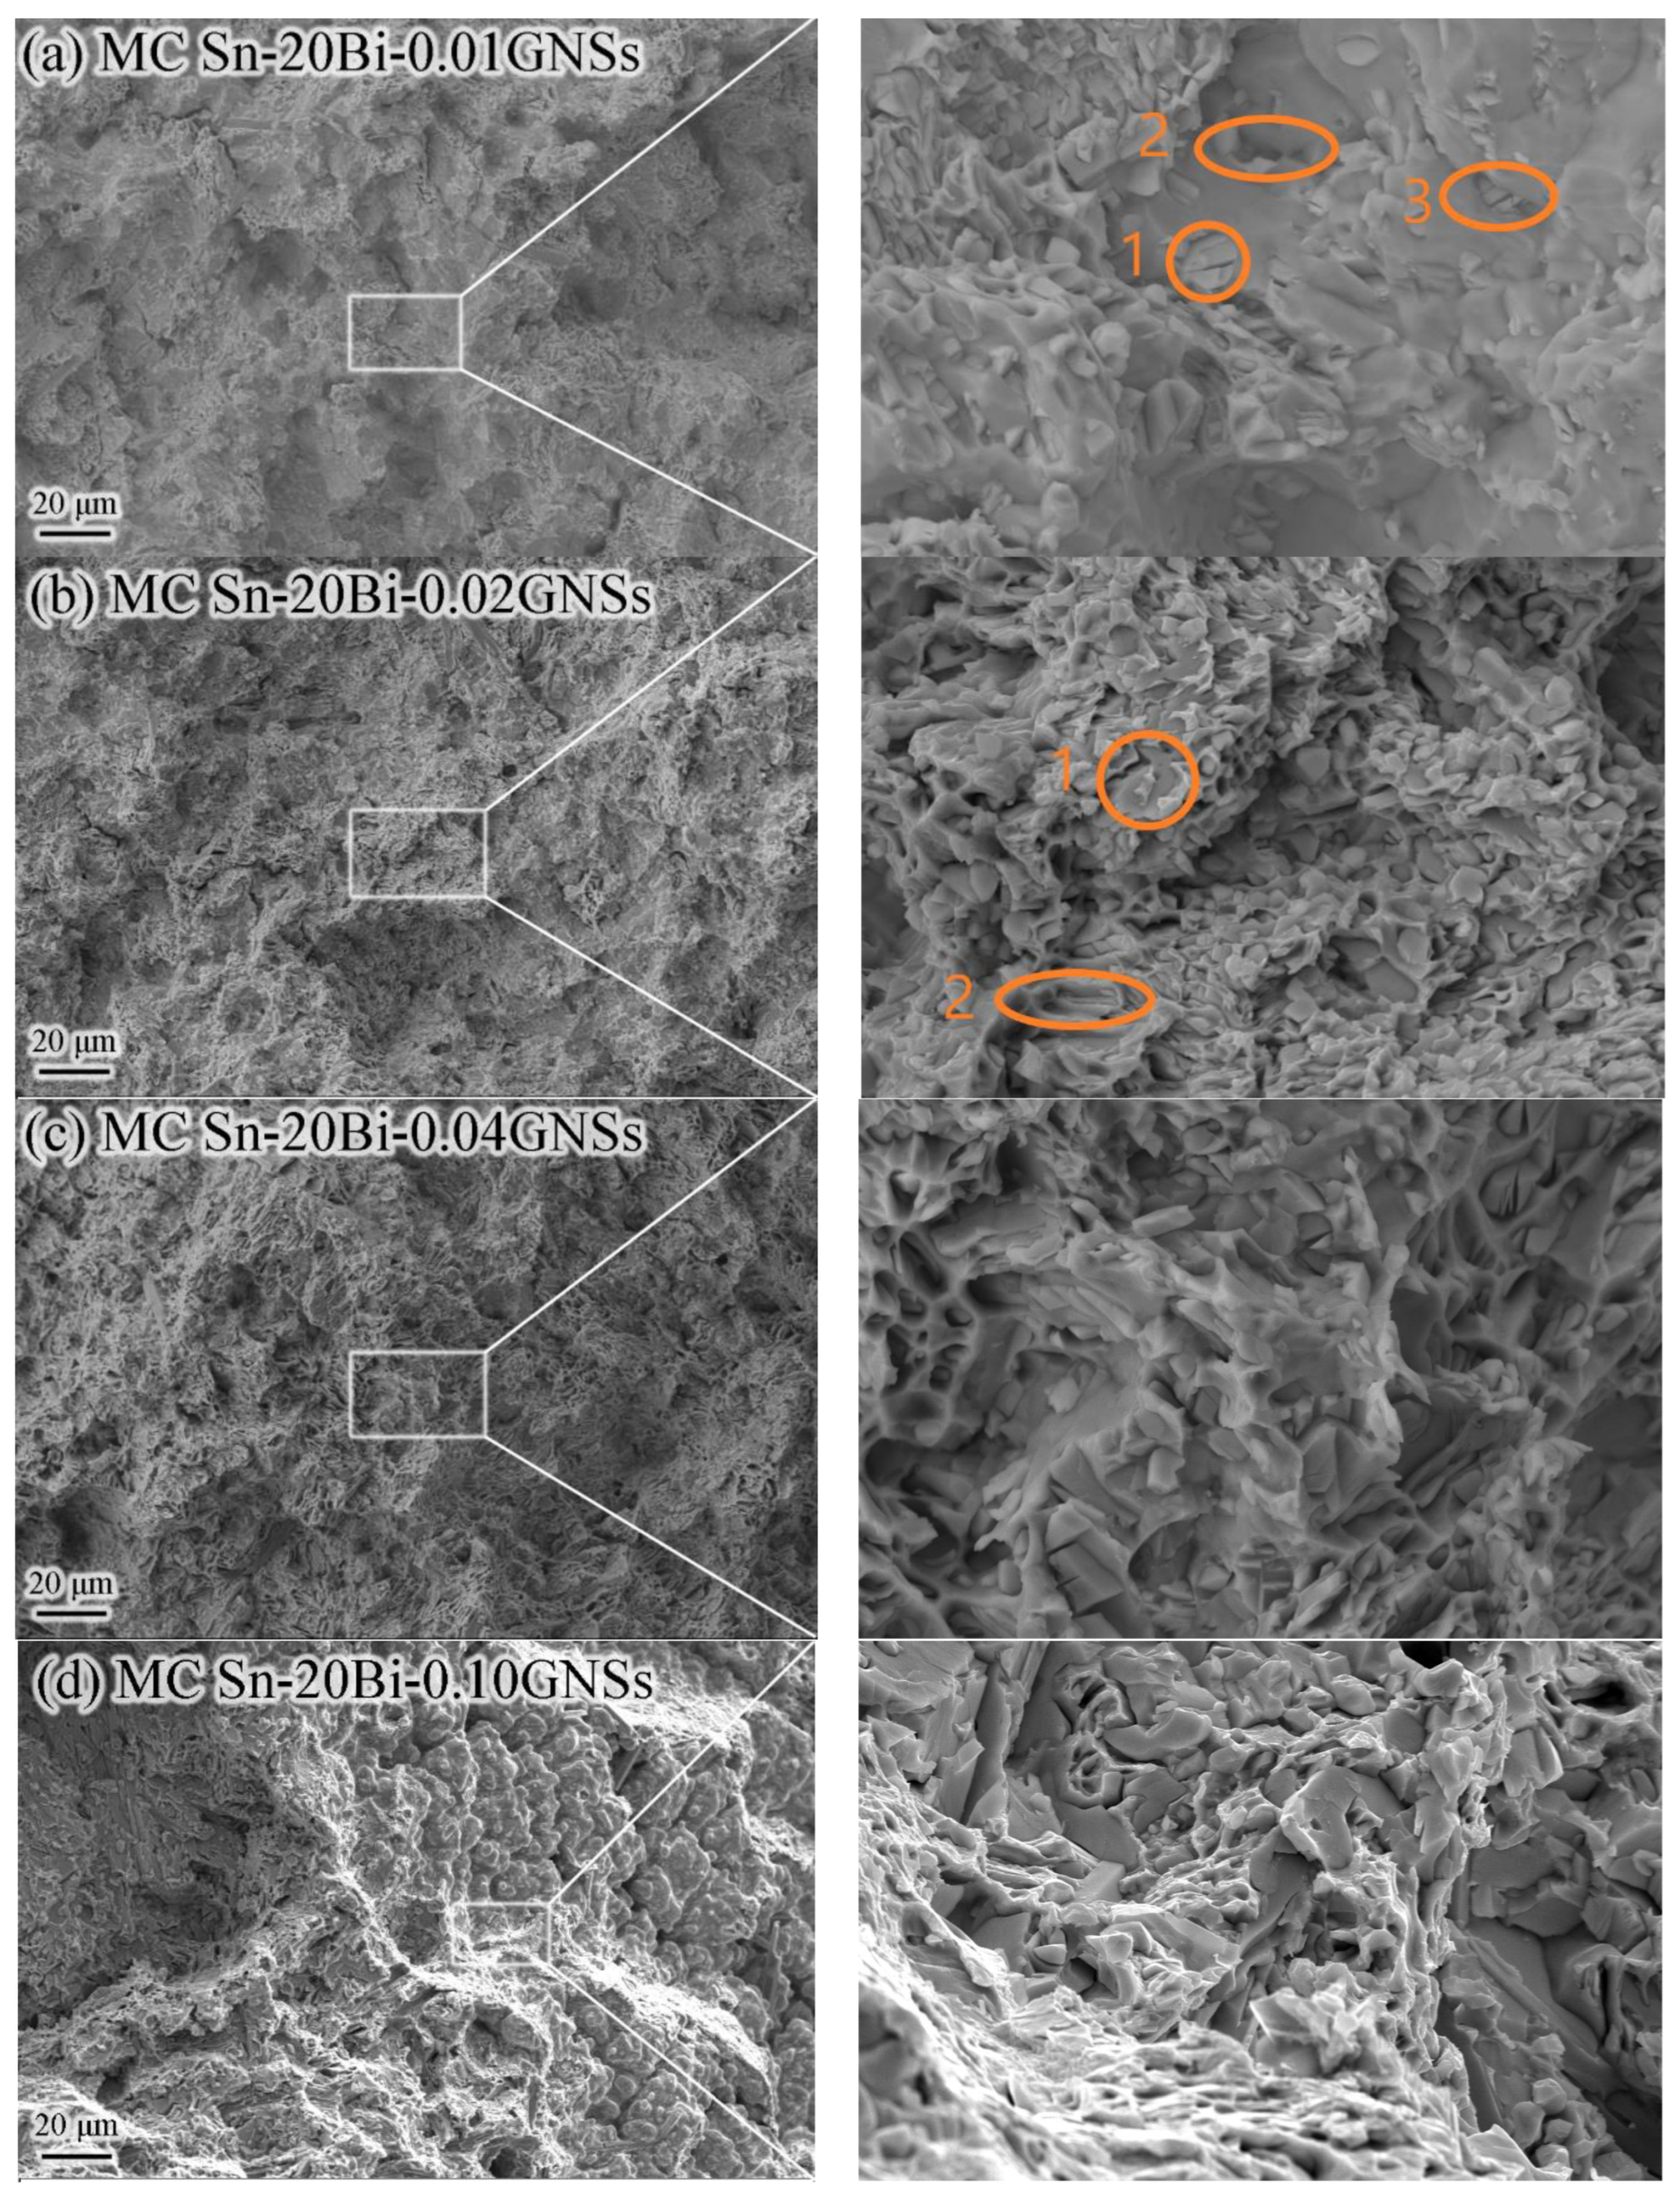
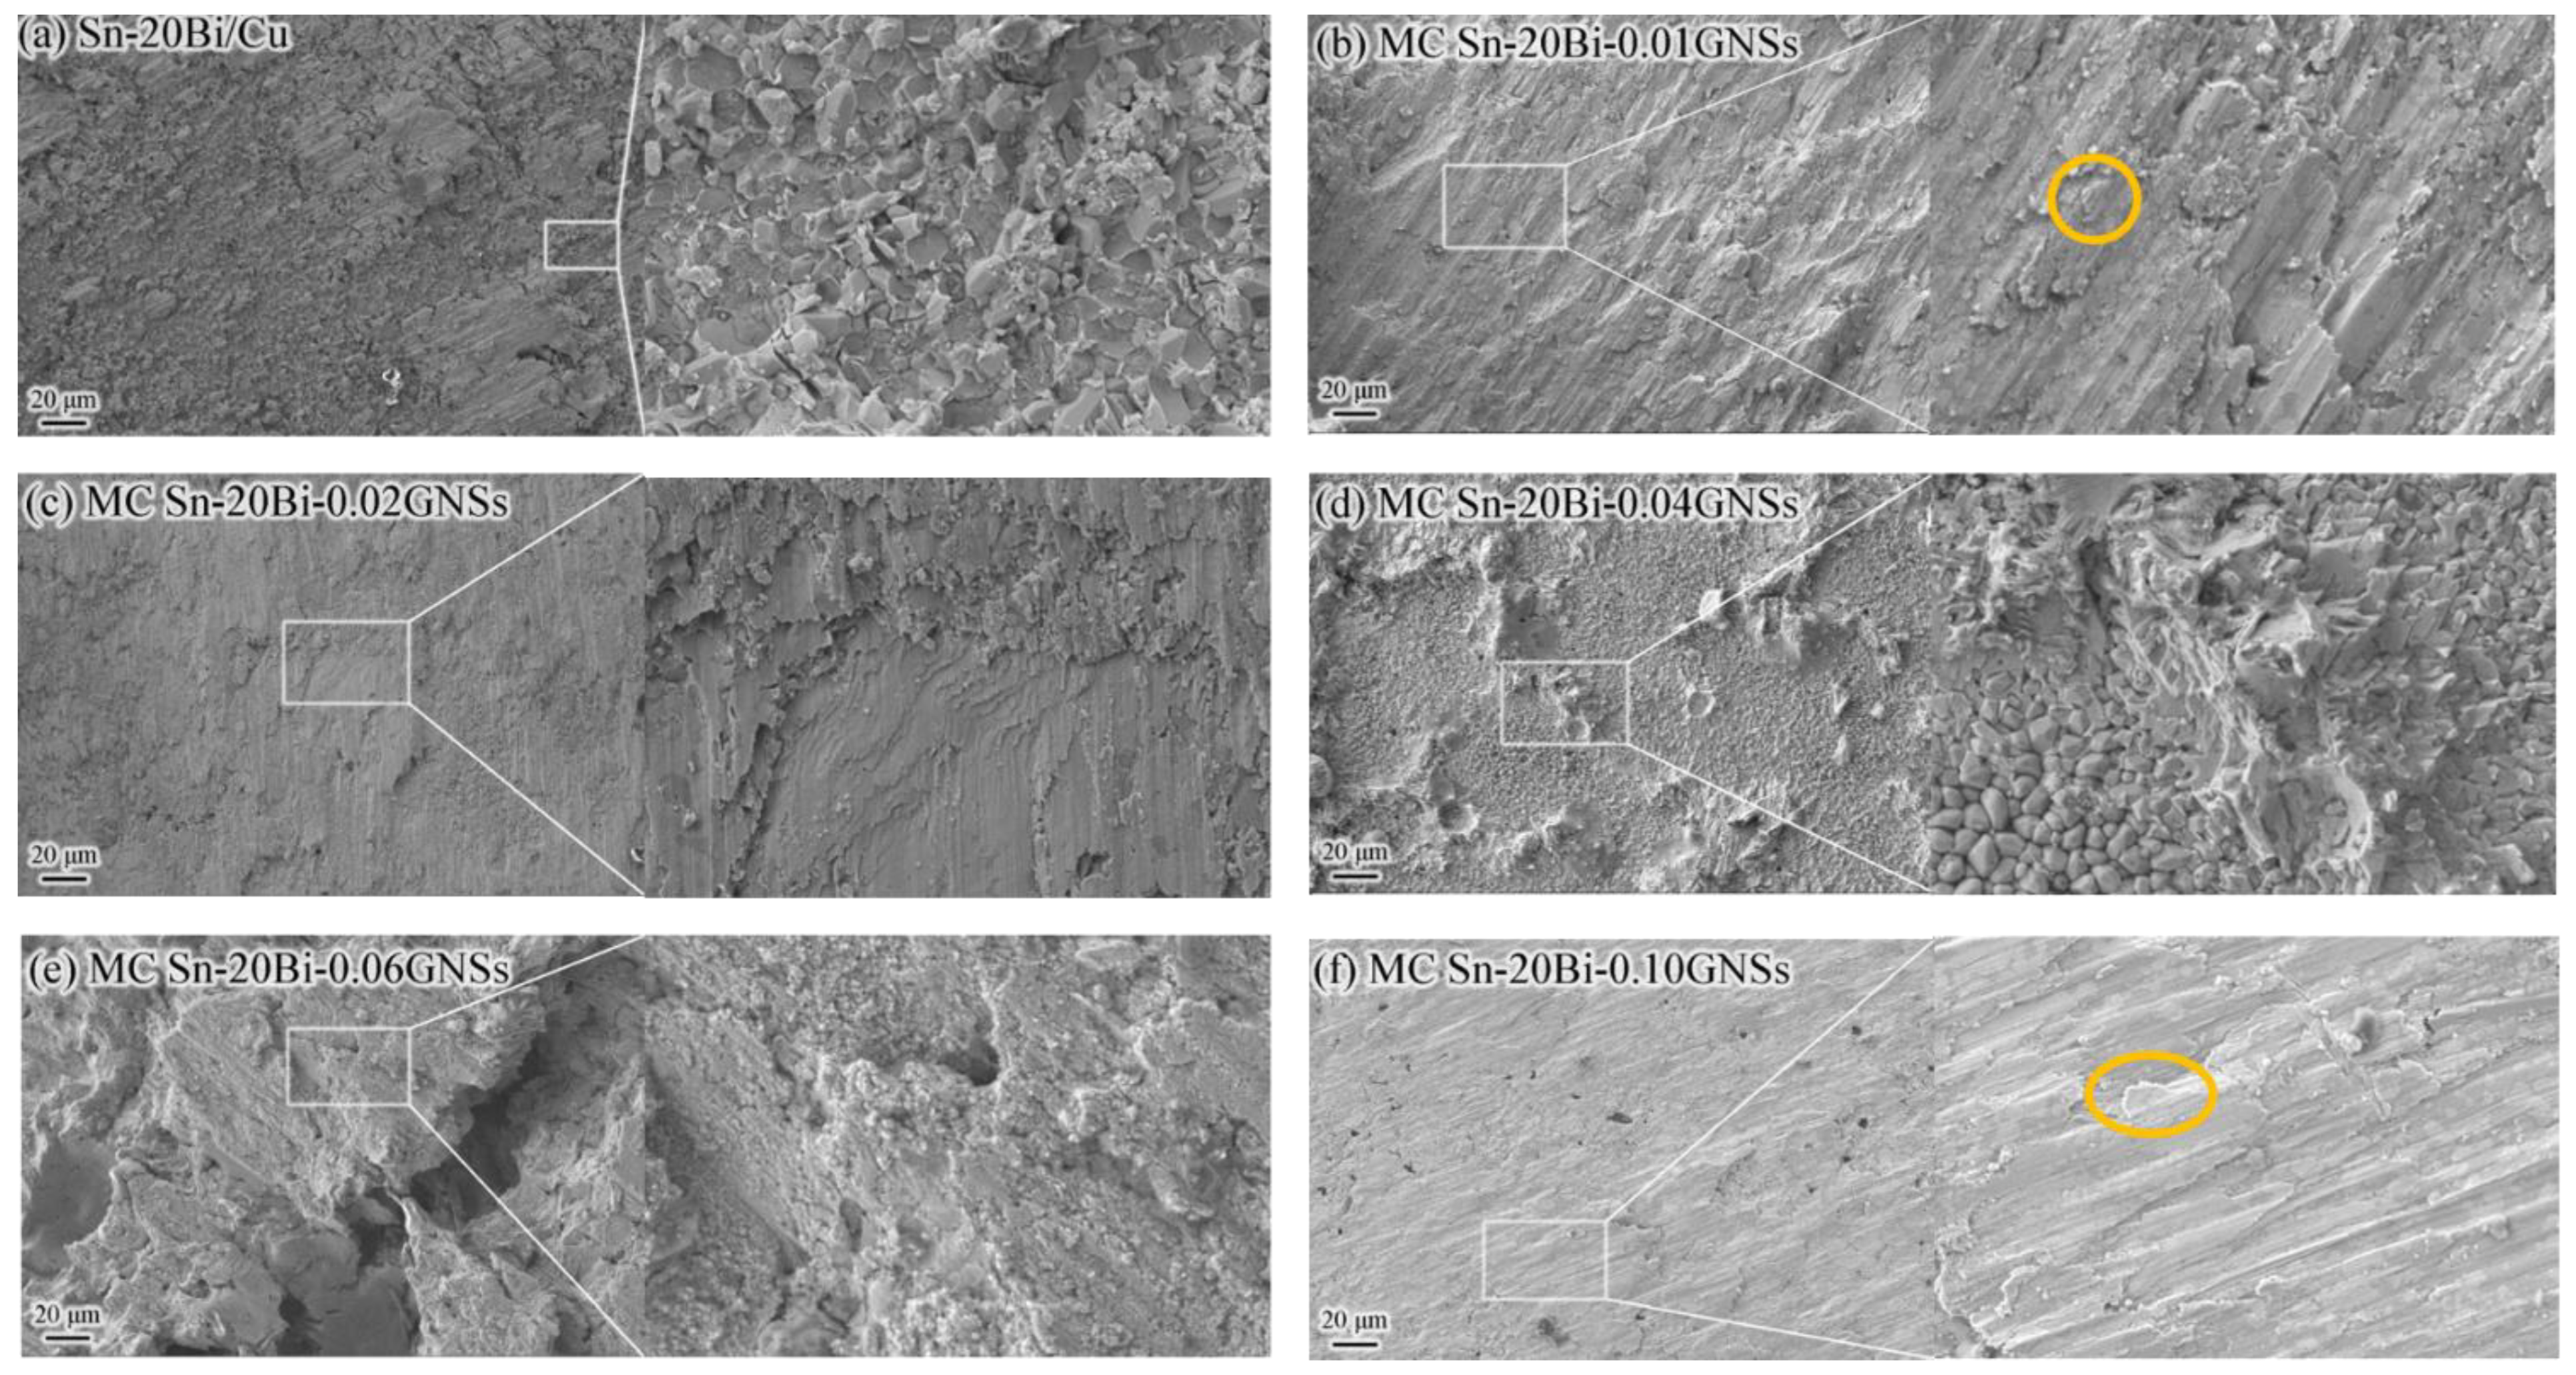
3.3. Mechanical Properties
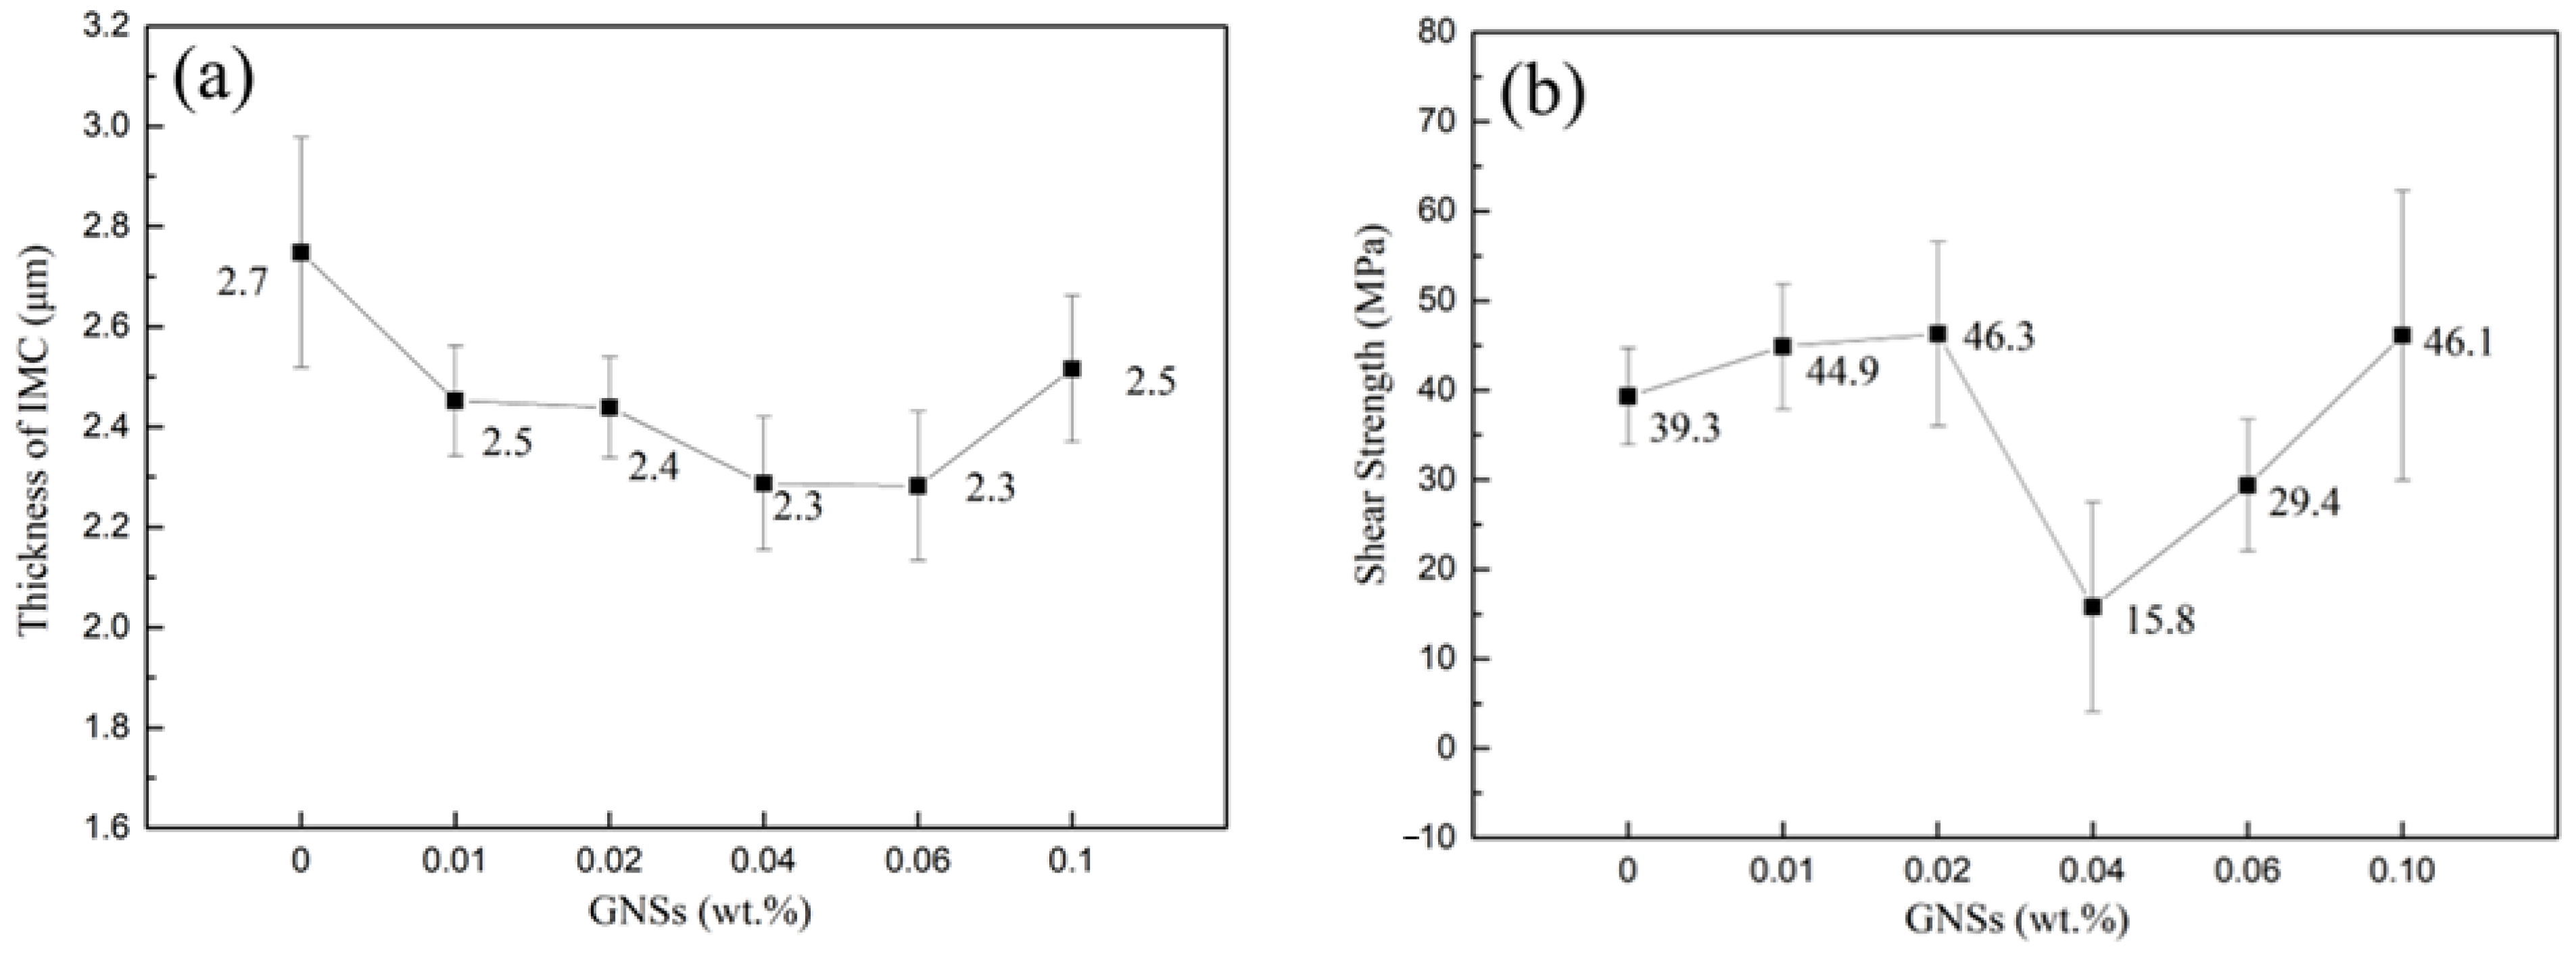
3.4. Solder Joint Interface Microstructure
3.5. Shear Strength of Solder Joint
3.6. Corrosion Rate Analysis
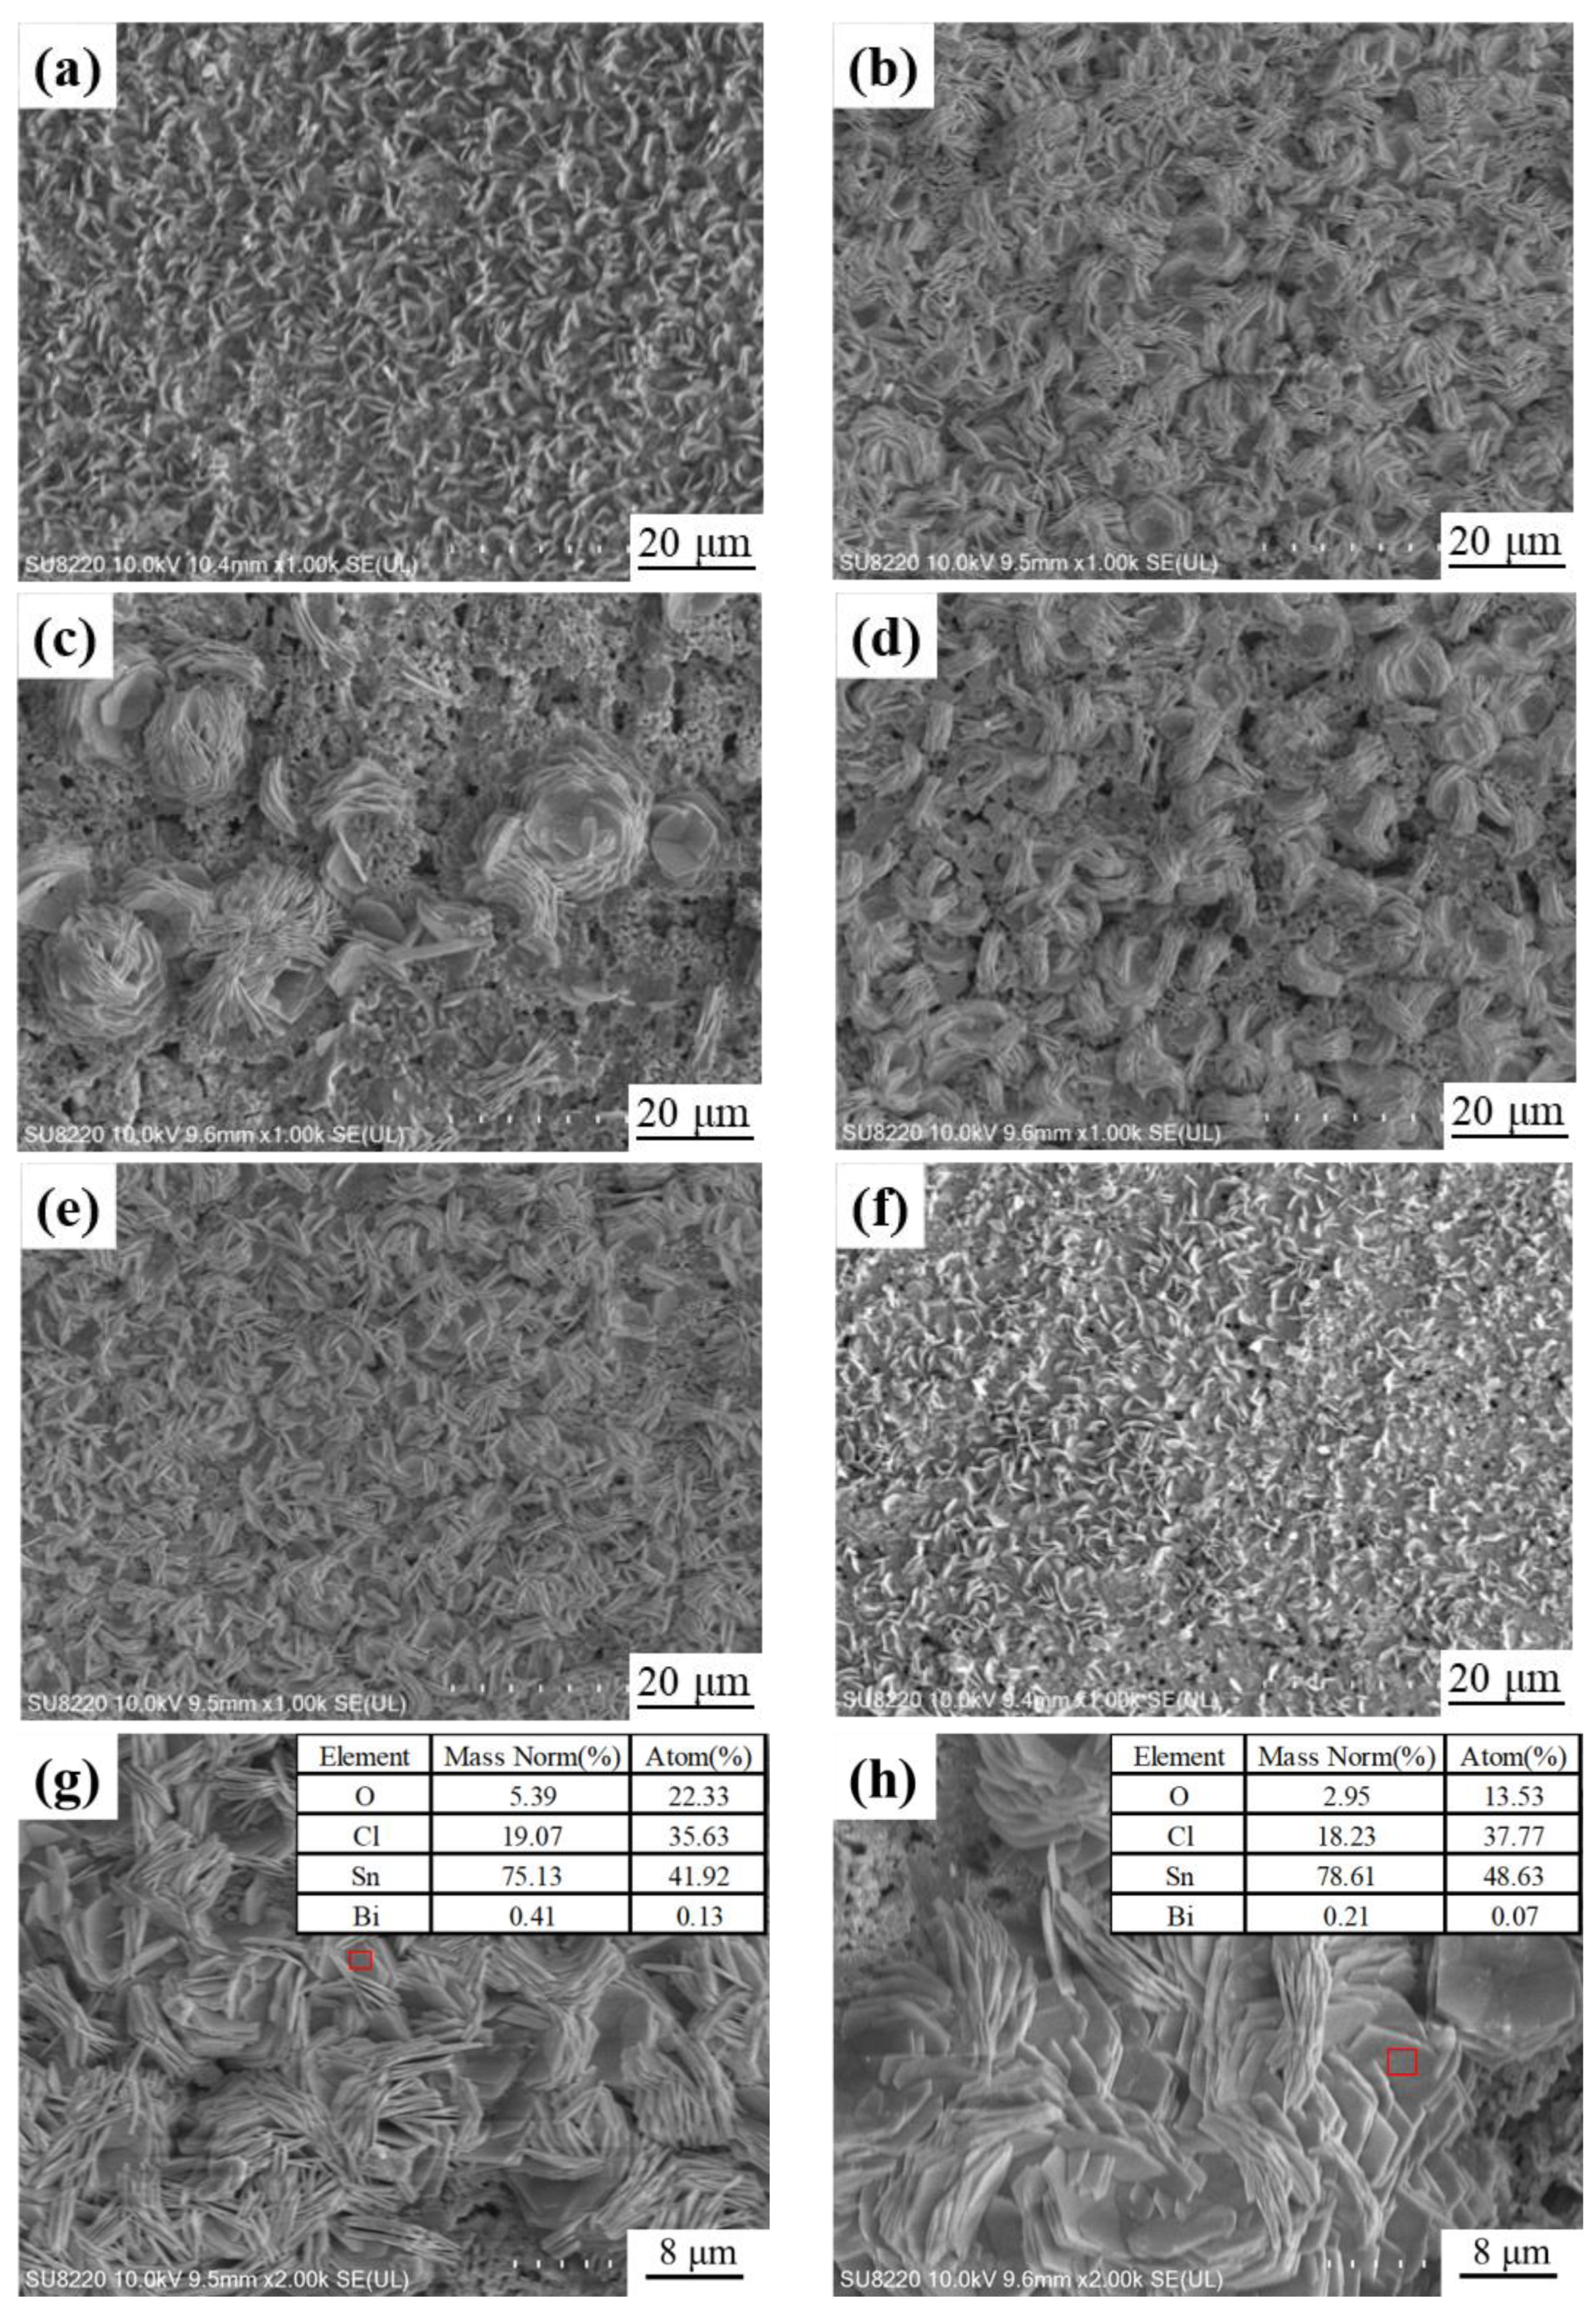
3.7. Analysis of Corrosion Products
4. Conclusions
- With the addition of GNSs, solder melting point tends to decrease. The generation of holes during the melt-casting process results in a decrease in the density and wettability of the composite solder.
- The addition of GNSs enhances the tensile strength of MC Sn-20Bi composite solder up to 99.6 MPa. However, with the addition of GNSs, the tensile strength and elongation show a decreasing trend. This may be related to the holes caused by the uplift of GNSs during the melting process and the enrichment of Bi particles at the grain boundaries.
- GNSs can act as a barrier to atomic diffusion and grain boundary movement to inhibit the growth of IMC at the MC Sn-20Bi-qGNSs/Cu interface. The addition of 0.02 wt.% GNSs was able to maximize the shear strength of MC Sn-20Bi solder joints up to 46.3 MPa.
- The corrosion product of MC Sn-20Bi-qGNSs in 3.5% NaCl was Sn3O(OH)2Cl2, and the composite solder had the best corrosion resistance when the GNSs content was 0.01 wt.%.
Author Contributions
Funding
Institutional Review Board Statement
Informed Consent Statement
Data Availability Statement
Conflicts of Interest
References
- Yi, P.; Dong, C.; Xiao, K.; Li, X. Study on corrosion behavior of β-Sn and intermetallic compounds phases in SAC305 alloy by in-situ EC-AFM and first-principles calculation. Corros. Sci. 2021, 181, 109244. [Google Scholar] [CrossRef]
- Yakymovych, A.; Plevachuk, Y.; Orovcik, L.; Švec, P. Nanocomposite SAC solders: The effect of heat treatment on the morphology of Sn–3.0Ag–0.5Cu/Cu solder joints reinforced with Ni and Ni–Sn nanoparticles. Appl. Nanosci. 2022, 12, 977–982. [Google Scholar] [CrossRef]
- Wei, Y.; Liu, Y.; Zhang, L.; Zhao, X. Effects of endogenous Al and Zn phases on mechanical properties of Sn58Bi eutectic alloy. Mater. Charact. 2021, 175, 111089. [Google Scholar] [CrossRef]
- Shen, Y.-A.; Chen, H.-Z.; Chen, S.-W.; Chiu, S.-K.; Guo, X.-Y.; Hsieh, Y.-P. Graphene as a diffusion barrier at the interface of Liquid–State low-melting Sn–58Bi alloy and copper foil. Appl. Surf. Sci. 2022, 578, 152108. [Google Scholar] [CrossRef]
- Peng, Y.; Li, C.; Yang, J.; Zhang, J.; Peng, J.; Zhou, G.; Pu, C.; Yi, J. Effects of Bismuth on the Microstructure, Properties, and Interfacial Reaction Layers of Sn-9Zn-xBi Solders. Metals 2021, 11, 538. [Google Scholar] [CrossRef]
- Sharma, V.P.; Datla, N.V. Effect of bond-line thickness and mode-mixity on the fracture behavior and traction separation law of Sn-0.7Cu solder joints. Eng. Fail. Anal. 2022, 131, 105855. [Google Scholar] [CrossRef]
- Chang, M.; Salleh, M.M.; Halin, D.; Ramli, M.; Yasuda, H.; Nogita, K. The effect of Ni on the growth morphology of primary β-phase in an In-35 wt%Sn alloy. J. Alloys Compd. 2022, 897, 163172. [Google Scholar] [CrossRef]
- Song, Q.; Yang, W.; Li, Y.; Mao, J.; Qin, W.; Zhan, Y. Interfacial reaction and mechanical properties of Sn58Bi-XCr solder joints under isothermal aging conditions. Vacuum 2021, 194, 110559. [Google Scholar] [CrossRef]
- Wei, Y.; Zhao, X.; Liu, Z.; Tan, C. Effects of various second phase ratios and contents on microstructure and mechanical properties of eutectic Sn58Bi alloy. Mater. Des. 2022, 218, 110698. [Google Scholar] [CrossRef]
- Griffiths, S.; Wedi, A.; Schmitz, G. Work of adhesion and reactive wetting in SnPb/Cu,Ni and SnBi/Cu,Ni soldering systems. Mater. Charact. 2021, 178, 111304. [Google Scholar] [CrossRef]
- Zhu, W.; Zhang, W.; Zhou, W.; Wu, P. Improved microstructure and mechanical properties for SnBi solder alloy by addition of Cr powders. J. Alloys Compd. 2019, 789, 805–813. [Google Scholar] [CrossRef]
- Lai, Z.; Ye, D. Microstructure and fracture behavior of non eutectic Sn–Bi solder alloys. J. Mater. Sci. Mater. Electron. 2016, 27, 3182–3192. [Google Scholar] [CrossRef]
- Ye, D.; Du, C.; Wu, M.; Lai, Z. Microstructure and mechanical properties of Sn–xBi solder alloy. J. Mater. Sci. Mater. Electron. 2015, 26, 3629–3637. [Google Scholar] [CrossRef]
- Yang, W.; Li, J.; Feng, J.; Wu, J.; Zhou, X.; Yu, A.; Wang, J.; Liang, S.; Wei, M.; Zhan, Y. Effect of Aluminum Addition on the Microstructure and Properties of Non-Eutectic Sn-20Bi Solder Alloys. Materials 2019, 12, 1194. [Google Scholar] [CrossRef] [PubMed]
- Qin, W.; Li, J.; Zhang, Q.; Jiang, S.; Feng, J.; Yang, W.; Zhan, Y. Effect of addition of Al and Cu on the properties of Sn–20Bi solder alloy. J. Mater. Sci. Mater. Electron. 2022, 33, 177–189. [Google Scholar] [CrossRef]
- Yang, W.; Yang, Z.; Fu, Y.; Yu, A.; Feng, J.; Zhan, Y. Effect of Graphene Nanosheet Addition on the Wettability and Mechanical Properties of Sn-20Bi-xGNS/Cu Solder Joints. Materials 2020, 13, 3968. [Google Scholar] [CrossRef] [PubMed]
- Soares, C.P.P.; Baptista, R.D.L.; Cesar, D.V. Solvothermal Reduction of Graphite Oxide Using Alcohols. Mater. Res. 2018, 21, e20170726. [Google Scholar] [CrossRef]
- Liu, X.; Han, Y.; Jing, H.; Wei, J.; Xu, L. Effect of graphene nanosheets reinforcement on the performance of Sn Ag Cu lead-free solder. Mater. Sci. Eng. A 2013, 562, 25–32. [Google Scholar] [CrossRef]
- Ma, Y.; Li, X.; Zhou, W.; Yang, L.; Wu, P. Reinforcement of graphene nanosheets on the microstructure and properties of Sn58Bi lead-free solder. Mater. Des. 2017, 113, 264–272. [Google Scholar] [CrossRef]
- Kaushik, R.K.; Batraa, U.; Sharma, J. Aging induced structural and electrochemical corrosion behaviour of Sn-1.0Ag-0.5Cu and Sn-3.8Ag-0.7Cu solder alloys. J. Alloys Compd. 2018, 745, 446–454. [Google Scholar] [CrossRef]
- Li, D.; Conway, P.; Liu, C. Corrosion characterization of tin–lead and lead free solders in 3.5wt.% NaCl solution. Corros. Sci. 2008, 50, 995–1004. [Google Scholar] [CrossRef]
- Jaffery, S.H.A.; Sabri, M.F.M.; Said, S.M.; Hasan, S.W.; Sajid, I.H.; Nordin, N.I.M.; Hasnan, M.M.I.M.; Shnawah, D.A.; Moorthy, C.V. Electrochemical corrosion behavior of Sn-0.7Cu solder alloy with the addition of bismuth and iron. J. Alloys Compd. 2019, 810, 151925. [Google Scholar] [CrossRef]
- Ming, H.; Wang, J.; Zhang, Z.; Wang, S.; Han, E.-H.; Ke, W. Multilayer Graphene: A Potential Anti-oxidation Barrier in Simulated Primary Water. J. Mater. Sci. Technol. 2014, 30, 1084–1087. [Google Scholar] [CrossRef]


| Alloy | Start 1 | Peak1 | End 1 | Start 2 | Peak2 | End 2 | Melting Range |
|---|---|---|---|---|---|---|---|
| Sn-20Bi | 137.7 | 139.4 | 140.9 | 187.0 | 201.7 | 210.0 | 23.0 |
| MC Sn-20Bi-0.01GNSs | 138.4 | 140.0 | 141.4 | 176.1 | 194.6 | 202.2 | 26.1 |
| MC Sn-20Bi-0.02GNSs | 138.2 | 139.6 | 140.8 | 179.8 | 195.9 | 202.3 | 22.5 |
| MC Sn-20Bi-0.04GNSs | 137.7 | 139.8 | 141.8 | 177.6 | 195.0 | 201.8 | 24.25 |
| MC Sn-20Bi-0.06GNSs | 138.2 | 139.5 | 141.4 | 176.6 | 193.2 | 199.6 | 23.1 |
| MC Sn-20Bi-0.10GNSs | 138.5 | 139.7 | 141.2 | 173.9 | 191.4 | 197.5 | 23.6 |
| Alloy | icorr (A/cm2) | Ecorr (V) | Corrosion Rate (mm/year) |
|---|---|---|---|
| MC Sn-20Bi | 7.97 × 10⁻⁶ | −0.475 | 0.211 |
| MC Sn-20Bi-0.01GNSs | 0.17 × 10⁻⁶ | −0.444 | 0.005 |
| MC Sn-20Bi-0.02GNSs | 2.11 × 10⁻⁶ | −0.414 | 0.056 |
| MC Sn-20Bi-0.04GNSs | 10.80 × 10⁻⁶ | −0.497 | 0.286 |
| MC Sn-20Bi-0.06GNSs | 11.60 × 10⁻⁶ | −0.859 | 0.308 |
| MC Sn-20Bi-0.1GNSs | 15.70 × 10⁻⁶ | −0.508 | 0.416 |
Disclaimer/Publisher’s Note: The statements, opinions and data contained in all publications are solely those of the individual author(s) and contributor(s) and not of MDPI and/or the editor(s). MDPI and/or the editor(s) disclaim responsibility for any injury to people or property resulting from any ideas, methods, instructions or products referred to in the content. |
© 2023 by the authors. Licensee MDPI, Basel, Switzerland. This article is an open access article distributed under the terms and conditions of the Creative Commons Attribution (CC BY) license (https://creativecommons.org/licenses/by/4.0/).
Share and Cite
Yang, W.; Qin, W.; Wu, J.; Feng, J.; Zhan, Y. Effect of Graphene Nanosheets on the Microstructure and Mechanical Properties of Sn-20Bi Solder. Materials 2023, 16, 1550. https://doi.org/10.3390/ma16041550
Yang W, Qin W, Wu J, Feng J, Zhan Y. Effect of Graphene Nanosheets on the Microstructure and Mechanical Properties of Sn-20Bi Solder. Materials. 2023; 16(4):1550. https://doi.org/10.3390/ma16041550
Chicago/Turabian StyleYang, Wenchao, Weiou Qin, Jingwu Wu, Junli Feng, and Yongzhong Zhan. 2023. "Effect of Graphene Nanosheets on the Microstructure and Mechanical Properties of Sn-20Bi Solder" Materials 16, no. 4: 1550. https://doi.org/10.3390/ma16041550
APA StyleYang, W., Qin, W., Wu, J., Feng, J., & Zhan, Y. (2023). Effect of Graphene Nanosheets on the Microstructure and Mechanical Properties of Sn-20Bi Solder. Materials, 16(4), 1550. https://doi.org/10.3390/ma16041550