Abstract
In this review paper, the hot compressive deformation mechanisms and processing maps of high-entropy alloys (HEAs) with different chemical compositions and crystal structures are analyzed. The stress exponent (n1) values measured from the series of compression tests for the HEAs performed at different temperatures and strain rates are distributed between 3 and 35, and they are most populated between 3 and 7. Power law breakdown (PLB) is found to typically occur at T/Tm ≤ 0.6 (where T is the testing temperature and Tm is the melting temperature). In AlxCrMnFeCoNi (x = 0–1) and AlxCrFeCoNi (x = 0–1) HEAs, n1 tends to decrease as the concentration of Al increases, suggesting that Al acts as a solute atom that exerts a drag force on dislocation slip motion at high temperatures. The values of activation energy for plastic flow (Qc) for the HEAs are most populated in the range between 300 and 400 kJ/mol. These values are close to the activation energy of the tracer diffusivity of elements in the HEAs ranging between 240 and 408 kJ/mol. The power dissipation efficiency of the HEAs is shown to follow a single equation, which is uniquely related to n1. Flow instability for the HEAs is shown to occur near n1 = 7, implying that the onset of flow instability occurs at the transition from power law creep to PLB. Processing maps for the HEAs are demonstrated to be represented by plotting as a function of the Zener–Hollomon parameter (Z = , where R is the gas constant). Flow stability prevails at Z ≤ 1012 s−1, while flow instability does at Z ≥ 3 × 10¹⁴ s−1.
1. Introduction
High-entropy alloys (HEAs) are a new family of solid-solution alloys made of four or more principal alloying elements alloyed in equiatomic or near-equiatomic concentrations (with each constituent element having a concentration from 5 to 35 atomic percent (at.%)) [1,2]. The first approach for designing an HEA was to obtain a single-phase solid solution by maximizing the mixing configurational entropy, but later, new design approaches involving multiple phases and/or intermetallics were explored [1,2,3].
Thermomechanical working at high temperatures is necessary not only to form and shape materials into components but also to produce the desired microstructures and properties of products [4,5]. For this reason, the high-temperature deformation mechanisms and hot workability of HEAs have been studied [6,7,8,9,10,11,12,13,14,15,16,17,18,19,20,21,22,23,24,25,26,27,28,29,30,31,32,33,34,35,36,37,38,39,40,41,42,43,44,45,46,47,48,49,50,51,52,53,54,55,56,57,58,59,60,61,62,63,64,65,66,67,68,69,70,71,72,73,74,75,76,77,78,79,80,81,82,83,84,85,86,87,88,89,90,91,92,93,94,95,96,97,98,99,100]. Finding the constitutive equations that mathematically depict the material response to the applied hot deformation conditions can be useful in predicting the flow stress or strain rates and identifying the rate-determining deformation mechanisms at different temperatures/strain rates and microstructural parameters. Characterization of hot workability using a processing map is important for the optimization of hot working conditions of materials and fabrication of defect-free components [101]. If a material is processed under unstable flow conditions, adiabatic shear banding or cracking can occur, and if a material is processed under optimal conditions, superior microstructure and mechanical properties can be obtained.
In this work, we have reviewed and analyzed the hot compression data of HEAs available in the literature to elucidate their deformation mechanisms and optimal hot working conditions.
2. History and Materials
The first paper reporting the hot compression behavior of HEAs was available in 2011, and the first studied HEAs were Nb25Mo25Ta25W25 and V20Nb20Mo20Ta20W20 alloys [6], where the microstructural change during hot compression at temperatures of 1073–1873 K and at a strain rate of 10−3 s−1 was examined. The papers published in the literature from 2011 to the present can be categorized into three groups (Figure 1a). The first group of papers reports the hot compressive deformation data of the HEAs in the limited temperature and strain rate range. The second group of papers reports the hot compression data of the HEAs in a wide range of temperature and strain rates, but processing maps are not constructed. The third group of papers reports the hot compression data as well as the processing maps of the HEAs. The number of publications increases almost exponentially with time, indicating that attention to this academic and engineering field has rapidly increased.
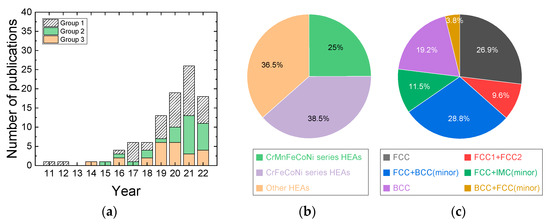
Figure 1.
(a) Papers published in the literature from 2011 are categorized into three groups. The first group of papers includes papers that report hot compressive deformation of the HEAs in the limited temperature and strain rate range, the second group of papers provides hot compression data of the HEAs over a wide range of temperature and strain rates, but processing maps are not constructed, and the third group of papers provides hot compression data (over a wide range of temperature and strain rates) as well as processing maps of the HEAs. (b) Three material groups of HEA materials studied for hot compression, which are classified by their chemical compositions. (c) HEA materials studied for hot compression, which are classified by phases (crystal structures).
The HEA materials studied by hot compression can be classified into three groups (Figure 1b). The first material group is the Cr-Mn-Fe-Co-Ni series HEAs containing Al, Sn, Zr, Sn, C, and N [9,20,23,27,34,37,38,42,45,60,62,63,64]; the second material group is the Cr-Fe-Co-Ni series HEAs containing Zr, Ta, Nb, Mo, Cu, C, and N [13,25,51,53,72,84,92,96,97,100]; and the third material group is the other composition HEAs, including the materials of TiVNbMoTa, Mn5Co25Fe25Ni25Ti20, MnFeCoNiCu, etc. [8,11,12,22,29,32,33,40,41,47,52,56,68,71,74,79,91,93,95,99]. Information regarding the chemical compositions of the HEAs, grain sizes, crystal structure, types of phases, temperature and strain rate ranges for hot compression tests are provided in Table 1. Most of the HEAs studied for hot compression are as-cast or heat-treated (homogenized) cast with coarse grain sizes. Among the Cr-Mn-Fe-Co-Ni series HEAs and Cr-Fe-Co-Ni series HEAs, AlxCoCrFeNi and AlxCoCrFeMnNi (x = 0–1) HEAs [9,13,23,25,27,34,42,45,51,53,62,63,71,84,92,96,97,100] have been the most studied, where the addition of Al can facilitate the formation of BCC phase from the FCC matrix. At low Al levels corresponding to x = 0–0.4 or 0.5, the alloys have a single FCC phase, but with a further increase in Al content in the range of x = 0.4 or 0.5–0.9, both FCC and BCC phases coexist, and at Al addition beyond x = 0.9–0.95, a BCC single phase is obtained [102,103].

Table 1.
Information regarding the chemical compositions of the HEAs, grain sizes, crystal structure, types of phases, temperature and strain rate ranges for hot compression tests.
HEAs with a single FCC phase or FCC (major) + BCC (minor) phases [9,13,18,22,23,25,27,29,32,34,37,41,45,47,52,53,56,60,61,62,63,72,84,91,92,96,97,100] have been most extensively studied for hot compression tests (Figure 1c). HEAs with a single BCC phase or BCC (major) + FCC (minor) phases have also been popularly studied [8,11,33,40,42,51,68,71,74,79,93,99]. HEAs with FCC1 and FCC2 or FCC+ intermetallic compound (IMC) precipitates have been recently studied [12,20,38,54,64,66,70,89,90,95].
3. Deformation Mechanisms
The raw data (true stress–true strain curves) in the second and third groups of papers, where a series of hot compression tests were systematically carried out over wide temperature and strain rate ranges, were digitally extracted from the published papers using a software. For example, the true stress–true strain curves for Al0.7CrMnFeCoNi HEA [62] at different temperatures and different strain rates are shown in Figure 2a–d.
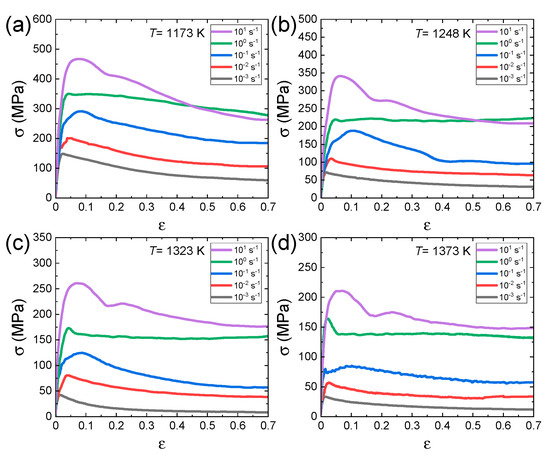
Figure 2.
True stress–strain curves for Al0.7CrMnFeCoNi HEA at various strain rates at temperatures of (a) 1173, (b) 1248, (c) 1323, and (d) 1373 K. Reproduced/modified with permission from [62], Elsevier.
The hyperbolic sine Garofalo equation has been widely used to describe the steady-state relationship between the flow stress, temperature, and strain rate () over a wide range of temperatures and strain rates where power law creep and power law breakdown (PLB) govern plastic flow [4,104], which is expressed as:
where A and α are the experimentally determined material constants, n is the stress exponent, and Qc is the activation energy for plastic flow. The hyperbolic sine function is mathematically reduced to the equation describing power law creep at low stresses (Equation (2)) and to the equation describing power law breakdown (PLB) at high stresses (Equation (3)):
where , , and β are the material constants and n1 is the stress exponent, which is ideally equal to n, but can be different). The constants α in Equation (1), n1 in Equation (2), and β in Equation (3) can be related by β = αn1 [4,104].
Figure 3a,b shows the plots of and at a given strain of 0.7 for the Al0.7CrMnFeCoNi HEA, where steady-state (SS) flow is attained at almost all temperatures and strain rates. The slopes of the regression lines of the and curves are used to determine the values of n1 and β at each temperature, respectively. Figure 3c shows the plot of , where is the average of the values measured at all temperatures. According to Equation (1), the slopes (= of the curves represent the n value at each temperature. Figure 3d shows the plot of , of which the slope (= represents the s value at each strain rate. The Qc value can be calculated by using the average (N) of the n values measured at different temperatures and the average (S) of the s values measured at different strain rates as follows:
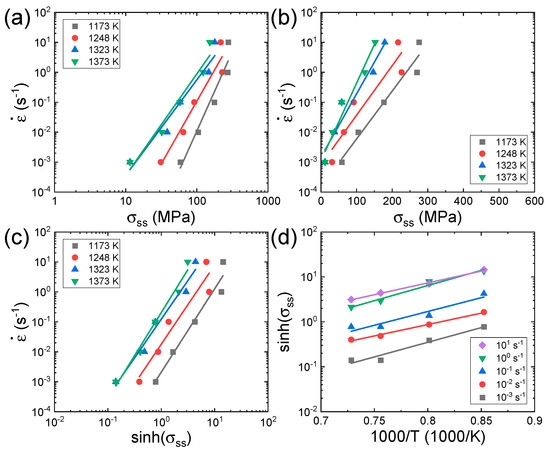
Figure 3.
Plots of (a) , (b) , (c) , and (d) for the Al0.7CrMnFeCoNi HEA [62] at a given strain of 0.7. The subscript ‘ss’ in σss represents the steady state. Reproduced/modified with permission from [62], Elsevier.
It is well-known that a value of n1 represents a specific deformation mechanism; Haper–Dorn creep and diffusional creep are associated with n1 = 1 [105,106,107,108], grain boundary sliding is associated with n1 = 2 [109,110], solute drag creep is associated with n1 = 3 [111], dislocation climb creep is associated with 5–7 [112,113], and power law breakdown occurs when n1 > 7 [4]. Jeong and Kim [62] analyzed the tensile, compressive, and creep data of CrMnFeCoNi and Al0.5CrMnFeCoNi HEAs with various grain sizes and proposed the constitutive equations that can quantitatively predict their flow stresses as a function of strain rate, temperature, and grain size (Table 2). Figure 4a,b shows the n1 values of HEAs with different crystal structures as a function of temperature (T) and a homologous temperature (T/Tm), respectively, where Tm is the melting temperature of the HEAs. As the Tm values of most of the HEAs are not available in the literature, we calculated the Tm values of the HEAs using the relation [114], where is the atomic percentage of the ith component and is the melting point of the ith component of the alloy. The plots in Figure 4a,b show that the hot compression tests for the HEAs have been conducted in the temperature range between 873 K and 1573 K, corresponding to the T/Tm range between 0.4 and 0.9. The n1 value is distributed between 3 and 35, and the n1 values are most populated between 3 and 7. As T and T/Tm decrease, n1 tends to increase, and at T/Tm ≤ 0.6, the number of the data associated with n1 ≥ 7 sharply increases. In the T/Tm range between 0.6 and 0.9, the fraction of the data associated with n1 ≥ 7 is 0.17, while in the T/Tm range between 0.4 and 0.6, the fraction of n1 ≥ 7 is 0.66. This result indicates that PLB dominates plastic flow below 0.6 T/Tm, while power law creep dominates plastic flow above 0.6 T/Tm. It should be noted that the HEAs that show the lowest n1 of ~3 are the AlxCoCrFeNi and AlxCoCrFeMnNi HEAs with BCC or BCC + FCC (minor) phases, containing an Al element. Figure 4c shows that the n values of the HEAs are slightly smaller than their n1 values. They mostly range between 2.5 and 5. The n tends to increase as T/Tm decreases, but it is not as sensitive as n1 to T/Tm variation.

Table 2.
The constitutive equations of deformation mechanisms in HEAs.

Figure 4.
n1 values of the HEAs with different crystal structures as a function of (a) temperature (T) and (b) homologous temperature (T/Tm). (c) n values of the HEAs as a function of T/Tm.
Figure 5a,b shows the curves for the AlxCrMnFeCoNi (x = 0–1) [9,27,34,42,63] and AlxCrFeCoNi (x = 0–1) HEAs [13,25,51,53,72,84,92,96] at a given temperature of 1173 K. The n1 value decreases from 5 to ~3 as x increases. This result indicates that as the amount of BCC phase (rich with Al) increases, the characteristics of viscous glide creep associated with n1~3 become more pronounced. Jeong and Kim [42] analyzed the deformation behavior of the AlCrMnFeCoNi HEA and found that aluminum, which is largest in size among the constituent elements [42], acts as a solute that causes solute drag creep and showed that the solute drag creep model proposed by Hong and Weertman [111] for conventional metals can quantitatively explain the deformation behavior of the AlCrMnFeCoNi HEA with reasonable assumptions on the diffusivity of Al in the HEA. From the plots in Figure 5a,b, it should also be noted that flow stress tends to decrease the added amount of Al increases especially at low strain rates, indicating that the BCC phase deforming under solute drag creep is weaker than the FCC phase deforming under dislocation climb creep.
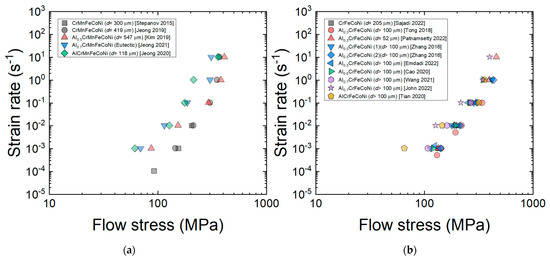
Figure 5.
Plots of the curves for the (a) AlxCrMnFeCoNi (x = 0–1) [9,27,34,42,63] and (b) AlxCrFeCoNi (x = 0–1) [13,25,51,53,72,84,92,96] HEAs at a given temperature of 1173 K (at a strain of 0.5).
Deformation mechanism maps represent the dominant deformation mechanism for a given metallic material under different conditions. Figure 6a,b shows the deformation mechanism maps as a function of strain rate (10−5 to 10 s−1) and temperature (873 and 1573 K) at a given (coarse) grain size of 100 μm for CoCrFeMnNi and Al0.5CoCrFeMnNi. On the maps, the data of the CoCrFeMnNi and Al0.5CoCrFeMnNi HEAs are loaded. For the CoCrFeMnNi HEA, at high temperatures, dislocation climb creep controlled by lattice diffusivity (DL) governs plastic flow, but when the temperature is low, the rate-controlling mechanism changes to dislocation climb creep controlled by Dp (or PLB). As the strain rate increases, the region associated with Dp-controlled dislocation climb creep (or PLB) expands to a higher temperature. For the Al0.5CoCrFeMnNi, solute drag creep appears in the bottom right corner of the map. Jeong and Kim [62] showed that when the grain size is sufficiently small, grain boundary sliding mechanism can play a more important role than solute drag creep in the Al0.5CoCrFeMnNi HEA.
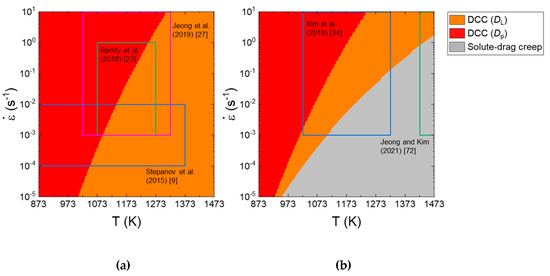
Figure 6.
Deformation mechanism maps as a function of strain rate and temperature at a given grain size of 100 μm for (a) CoCrFeMnNi and (b) Al0.5CoCrFeMnNi. Reproduced/modified with permission from [62], Elsevier.
Figure 7a shows the Qc values of HEAs calculated using Equation (4). The Qc value is in the range between 150 and 600 kJ/mol, and the data distribution is most populated in the range between 300 and 400 kJ/mol. The activation energy of the tracer diffusivity of elements in the HEAs ranges between 240 and 408 kJ/mol [115,116], implying that the activation energy of plastic flow for the HEA is related to the atomic diffusivity of elements constituting the HEAs. Figure 7b shows the relation between n1 and Qc for the HEAs. A smaller Qc is obtained at smaller n1, and this is more apparent near n1~3, where solute drag creep governs the deformation mechanism. It is worthwhile to note that the activation energy for the solute diffusion (Qsolute) of magnesium in aluminum (136 kJ mol−1) is lower than the activation energy for self-diffusion in pure aluminum (142 kJ/mol) [117].
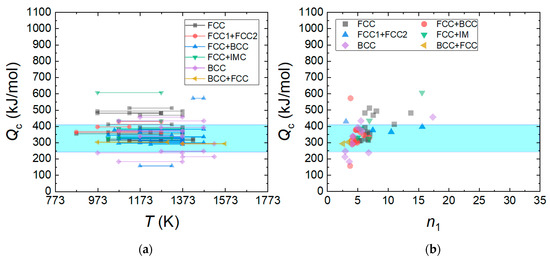
Figure 7.
(a) Qc values of HEAs calculated using Equation (4) and (b) the relation between n1 and Qc for the HEAs. The activation energy () of tracer diffusivity of elements in the AlxCoCrFeMnNi and AlxCoCrFeNi HEAs ranges between 240 and 408 kJ/mol (shaded area by blue color): = 323 ± 5 kJ/mol for Cr, = 303 ± 3 kJ/mol for Fe, = 240 ± 20 kJ/mol for Co, = 253 ± 8 kJ/mol for Ni in CrFeCoNi, = 313 ± 13 kJ/mol for Cr, = 272 ± 13 kJ/mol for Mn, = 309 ± 11 kJ/mol for Fe, = 270 ± 22 kJ/mol for Co, and = 304 ± 9 kJ/mol for Ni in CrMnFeCoNi [115]. = 263 kJ/mol for Al, = 288 kJ/mol for Cr, = 315 kJ/mol for Fe, = 258 kJ/mol for Co, = 260 kJ/mol for Ni in Al4.88Co29.53Cr18.58Fe19.62Ni27.39 [117], = 258 kJ/mol for Al, = 288 kJ/mol for Cr, = 408 kJ/mol for Fe, = 260 kJ/mol for Co, and = 261 kJ/mol for Ni Al6.64Co23.82Cr23.66Fe23.01Ni22.87 [116].
4. Processing Maps
A processing map, which is useful in finding the optimal condition for hot forging or extrusion, is composed of a power dissipation map and a flow instability map. According to Prasad et al. [101], the total power, P, absorbed in a material is divided into the power dissipation content (G), which represents the power dissipated by plastic deformation giving rise to a temperature increase in the workpiece and the power dissipation co-content (J), which represents the power dissipated by a change in its microstructure, such as dynamic recovery and dynamic recrystallization [101].
The efficiency of power dissipation, η, which represents the power dissipation efficiency due to a change in microstructure during plastic flow, is defined as [101]:
where Jmax is the maximum J value (=P/2).
The strain rate sensitivity, m, which is equal to 1/n1, can be calculated by:
When m is assumed to be constant over the investigated strain rate range (as assumed by Prasad et al. [101]), , but when m is not constant (as considered by Murty et al. [118]), η can be directly determined from Equation (6) by calculating through the numerical integration procedure, using Equation (8):
In drawing the flow instability map, Ziegler’s plastic flow theory is used, and according to Murty et al. [119] (when m is not a constant),
When ξ is negative, deformation in the material is predicted to be unstable, such that localized flow, adiabatic shear banding, or cracking can take place.
Kim and Jeong [120] suggested an empirical equation for by analyzing the behavior of values of many metals calculated by following the numerical method proposed by Murty (Equation (8)) as a function of :
By using this equation, the value can be easily obtained once n1 is known without numerically solving Equation (8). Kim and Jeong [121] also presented a simple form of the flow instability criterion based on the observation that unstable flow occurs in many metals when is larger than 7 (i.e. when PLB governs plastic flow):
Unlike in the procedure for determining for calculating (Figure 3a), where a linear fitting is applied to the data in the plot of , the value as a function of strain rate, temperature, and strain, which is necessary for constructing processing maps, has often been determined using a third- or fourth-order polynomial fitting to the data in the plot of . This polynomial fitting curve, however, sometimes has difficulty describing the power law creep. This example is shown in Figure 8. Thus, Kim and Jeong [121] proposed the exponential fitting method for the determination of the m from the plot of . According to the method,
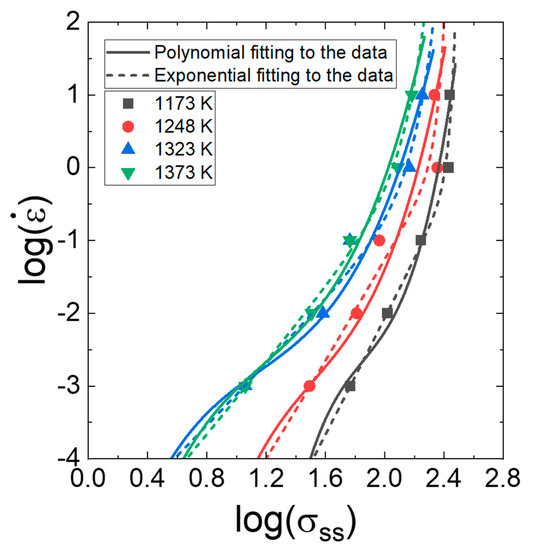
Figure 8.
Polynomial fitting and exponential fitting to the data points in the plot in Figure 3a. Reproduced/modified with permission from [63], Elsevier.
When Equation (12) is used, m can be calculated by Equation (13):
As observed in Figure 8, the exponential fitting, where m tends to decrease gradually with increasing strain rate, provides a better fit to the series of data compared with the polynomial fitting, which sometimes creates uncertain fluctuation between the data points.
Figure 9a–c shows the η values of the HEAs calculated by Murty’s method (Equations (6) and (8)) as a function of n1 for the three material groups of HEAs. It is obvious that the η values of all the three material groups of HEAs follow Equation (10) well in the entire range of n1, regardless of the differences in composition and crystal structure. Furthermore, it is observed that the flow instability condition determined by Equation (9) occurs at n1≈7, supporting that the onset of flow instability occurs at the transition from power law creep to PLB (Equation (11)).

Figure 9.
η values of the HEAs calculated by Murty’s method as a function of n1 for (a) AlxCrMnFeCoNi (x = 0–1) [9,23,27,34,42,45,63], (b) AlxCrFeCoNi (x = 0–1) [13,25,51,53,72,84,92,96,97,100], and (c) CrMnFeCoNiSn0.5, etc. [18,22,47,54,60,61,64,70,89], which can be fitted by Equation (10). The (blue) solid and (red) open symbols represent the data points belonging to the flow stability and flow instability regimes, respectively, which is determined by Equation (9).
Figure 10a–d shows the processing maps for Al0.5CrMnFeCoNi and Al0.3CrFeCoNi HEAs constructed based on Murty’s approach and Kim and Jeong’s approach. A good match is observed between the two methods in power dissipation maps as well as flow instability maps. However, some mismatch is observed for the Al0.3CrFeCoNi HEA in the flow instability at low strain rates and at low temperatures. This occurs because in Murty’s method, the material is assumed to follow the power law creep at low strain rates below (Equation (8)), but this assumption can be wrong at low temperatures if PLB governs plastic flow below .
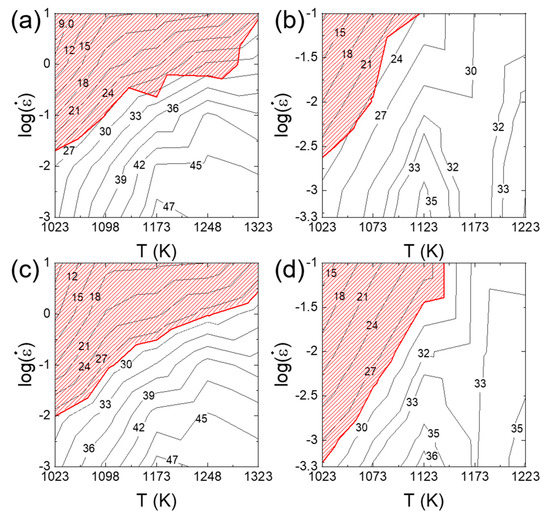
Figure 10.
2D processing maps for (a,c) Al0.5CrMnFeCoNi and (b,d) Al0.3CrFeCoNi constructed based on Murty’s approach and Kim and Jeong’s approach using the raw data from [62] (for Al0.5CrMnFeCoNi) and [92] (for Al0.3CrFeCoNi).
Figure 11a,b shows the plots of n1 as a function of the Zener–Hollomon parameter (Z = for Al0.5CrMnFeCoNi and Al0.3CrFeCoNi. There is a good correlation between n1 and Z, indicating that as strain rate increases and temperature decreases (i.e., as Z increases), n1 tends to increase. This occurs because according to the deformation mechanism maps (Figure 6a,b), as strain rate increases and temperature decreases, the deformation mechanism changes from solute drag creep (associated with n1 = 3) to dislocation climb creep (associated with n1 = 5) and then power law breakdown (associated with n1 > 3). is a function of n1 according to Equation (10). Hence, can also be expressed as a function of Z. Figure 11c,d shows the plot of as a function of Z for Al0.5CrMnFeCoNi and Al0.3CrFeCoNi, where a good correlation between and Z is observed. tends to decrease as Z increases. In addition, most of the data belonging to the flow instability condition (determined by Murty’s approach using Equation (9)) are positioned below , supporting the validity of Equation (11). Some mismatches are observed between Equation (9) and Equation (10) and this can be attributed to the aforementioned assumption of power law creep below in Murty’s method.
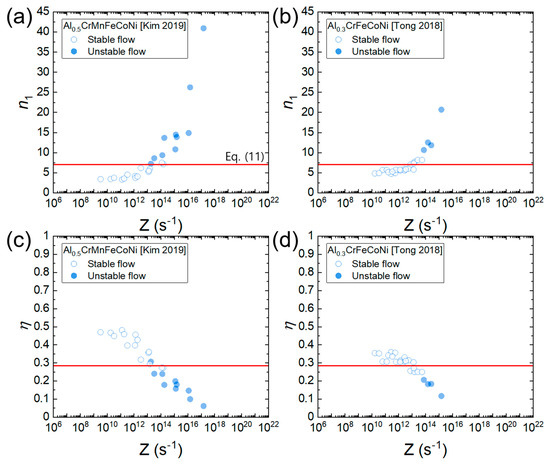
Figure 11.
Plot of n1 and as a function of Z for (a,c) Al0.5CrMnFeCoNi [34] and (b,d) Al0.3CrFeCoNi [25]. Open and solid symbols represent the flow stability and instability conditions (determined by Equation (9)), respectively. A red horizontal line represents (Equation (11)).
The plots in Figure 11c,d represent the “processing maps expressed as a function of Z” because if one knows the temperature and strain rate, the Z value can be calculated, and then the power dissipation efficiency and flow (in)stability can be readily determined from the plot.
Figure 12a–c shows the plots of processing maps for the three material groups of HEAs expressed as a function of Z using each Qc value of the HEAs (Table 1), and Figure 12d shows the plot where all the data in Figure 12a–c overlap. The η values of each material are well correlated as a function of Z, and the data for each group converge to a common curve. Also, it is observed that all the data of the three groups converge to a single common curve. According to the plot in Figure 12d, flow stability is nearly guaranteed at Z ≤ 1012 s−1, while flow instability is nearly inevitable at Z ≥ 2 × 10¹⁵ s−1. At 1012 s−1 ≤ Z ≤ 2 × 10¹⁵ s−1, flow stability and instability conditions coexist, and flow instability becomes more dominant as Z increases.
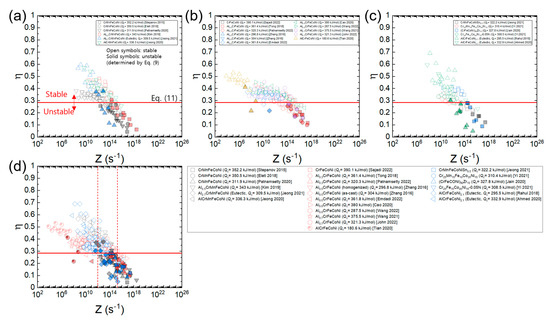
Figure 12.
Plots of processing maps for (a) AlxCrMnFeCoNi (x = 0–1) [9,23,34,42,45,63], (b) AlxCrFeCoNi (x = 0–1) [13,25,51,53,72,84,92,96,97,100], and (c) CrMnFeCoNiSn0.5, etc. [22,47,54,60,61,64], expressed as a function of Z using each Qc value of the HEAs (Table 1) and (d) the plot where all the data in (a–c) overlap. Open and solid symbols represent the flow stability and instability conditions (determined by Equation (9)), respectively. A red horizontal line represents (Equation (11)).
Figure 13a–c shows the plots of processing maps for the three material groups of HEAs constructed as a function of Z using the average Qc value of all the HEAs (317.2 kJ/mol), and Figure 12d shows the plot where all the data in Figure 13a–c overlap. Note that all the data lie close to a common curve. According to the plot in Figure 12d, flow stability prevails at Z ≤ 1012 s−1, while flow instability prevails at Z ≥ 3 × 10¹⁴ s−1. By plotting in this fashion, one can easily compare the η values of the different HEAs at a given temperature and strain rate as well as predict the optimum hot working conditions of the HEAs with unknown Qc values.
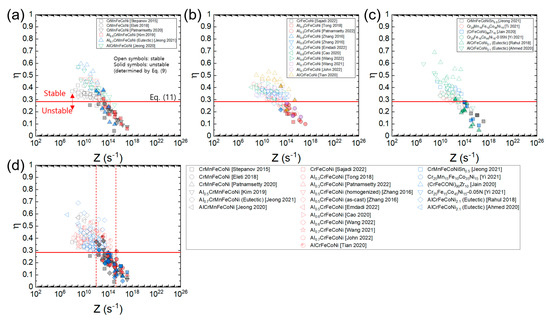
Figure 13.
Plots of processing maps for (a) AlxCrMnFeCoNi (x = 0–1) [9,23,34,42,45,63], (b) AlxCrFeCoNi (x = 0–1) [13,25,51,53,72,84,92,96,97,100], and (c) CrMnFeCoNiSn0.5, etc. [22,47,54,60,61,64], expressed as a function of Z using the average Qc value of all the HEAs (317.2 kJ/mol) and (d) the plot where all the data in (a–c) overlap. Open and solid symbols represent the flow stability and instability conditions (determined by Equation (9)), respectively. A red horizontal line represents (Equation (11)).
5. Conclusions
The hot compressive behaviors of the HEA materials with different chemical compositions and crystal structures and processing maps were analyzed, and the following observations were made.
- Hot compression tests on many HEAs have been conducted in the temperature range between 873 K and 1573 K, corresponding to the T/Tm range between 0.4 and 0.9. The n1 values are most populated between 3 and 7.
- As T/Tm decreases, n1 tends to increase, and power law breakdown typically occurs at T/Tm ≤ 0.6.
- In AlxCrMnFeCoNi (x = 0–1) and AlxCrFeCoNi (x = 0–1) HEAs, n1 tends to increase as the concentration of Al increases, implying that Al acts as a solute atom that exerts a drag force on dislocation slip motion.
- The activation energy for plastic flow (Qc) in the HEAs is calculated to be in the range between 150 and 600 kJ/mol, and the data distribution is populated in the Qc value range between 300 and 400 kJ/mol. The average Qc value for all the HEAs is 317 kJ/mol.
- The value of the HEAs can be expressed as a function of n1 only. Flow instability is shown to occur near n1 = 7, implying that the onset of flow instability occurs at the transition from power law creep to PLB.
- Processing maps for all the HEAs are demonstrated to be constructed using the Zener–Hollomon parameter (Z = . According to the analysis result, flow stability prevails at Z ≤ 1012 s−1 in all HEAs.
Author Contributions
Conceptualization, W.J.K.; formal analysis, H.T.J.; writing—original draft preparation, H.T.J.; writing—review and editing, W.J.K.; supervision, W.J.K. All authors have read and agreed to the published version of the manuscript.
Funding
This research was financially supported by the Mid-Career Researcher Program through the National Research Foundation of Korea funded by the Ministry of Education, Science and Technology (NRF-2020R1A2C1008105).
Data Availability Statement
The raw/processed data required to reproduce these findings cannot be shared at this time, as the data also form part of an ongoing study.
Conflicts of Interest
The authors declare no conflict of interest.
References
- George, E.P.; Raabe, D.; Ritchie, R.Q. High-entropy alloys. Nat. Rev. Mater. 2019, 4, 515–534. [Google Scholar] [CrossRef]
- Tsai, M.H.; Yeh, J.W. High-entropy alloys: A critical review. Mater. Res. Lett. 2014, 2, 107–123. [Google Scholar] [CrossRef]
- Li, W.; Xie, D.; Li, D.; Zhang, Y.; Gao, Y.; Liaw, P.K. Mechanical behavior of high-entropy alloys. Prog. Mater. Sci. 2021, 118, 100777. [Google Scholar] [CrossRef]
- Sherby, O.D.; Burke, P.M. Mechanical behavior of crystalline solids at elevated temperature. Prog. Mater. Sci. 1968, 13, 323–390. [Google Scholar] [CrossRef]
- Sherby, O.D.; Wadsworth, J. Superplasticity-Recent advances and future directions. Prog. Mater. Sci. 1989, 33, 169–221. [Google Scholar] [CrossRef]
- Senkov, O.D.; Wilks, G.B.; Scott, J.M.; Miracle, D.B. Mechanical properties of Nb25Mo25Ta25W25 and V20Nb20Mo20Ta20W20 refractory high entropy alloys. Intermetallics 2011, 19, 698–706. [Google Scholar] [CrossRef]
- Senkov, O.D.; Scott, J.M.; Senkova, S.V.; Meisenkothen, F.; Miracle, D.B.; Woodward, C.F. Microstructure and elevated temperature properties of a refractory TaNbHfZrTi alloy. J. Mater. Sci. 2012, 47, 4062–4074. [Google Scholar] [CrossRef]
- Nayan, N.; Singh, G.; Murty, S.V.S.N.; Jha, A.K.; Pant, B.; George, K.M.; Ramamurty, U. Hot deformation behaviour and microstructure control in AlCrCuNiFeCo high entropy alloy. Intermetallics 2014, 55, 145–153. [Google Scholar] [CrossRef]
- Stepanov, N.D.; Shaysultanov, D.G.; Yurchenko, N.; Zherebtsov, S.V.; Ladygin, A.N.; Salishchev, G.A.; Tikhonovsky, M.A. High temperature deformation behavior and dynamic recrystallization in CoCrFeNiMn high entropy alloy. Mater. Sci. Eng. A 2015, 636, 188–195. [Google Scholar] [CrossRef]
- Chen, H.; Kauffmann, A.; Gorr, B.; Schliephake, D.; Seemüller, C.; Wagner, J.; Christ, H.; Heilmaier, M. Microstructure and mechanical properties at elevated temperatures of a new Al-containing refractory high-entroy alloy Nb-Mo-Cr-Ti-Al. J. Alloys Compd. 2016, 661, 206–215. [Google Scholar] [CrossRef]
- Guo, N.; Wang, L.; Luo, L.; Li, X.; Chen, R.; Su, Y.; Guo, J.; Fu, H. Hot deformation characteristics and dynamic recrystallization of the MoNbHfZrTi refractory high-entropy alloy. Mater. Sci. Eng. A 2016, 651, 698–707. [Google Scholar] [CrossRef]
- Samal, S.; Rahul, M.; Kottada, R.; Phanikumar, G. Hot deformation behaviour and processing map of Co-Cu-Fe-Ni-Ti eutectic high entropy alloy. Mater. Sci. Eng. A 2016, 664, 227–235. [Google Scholar] [CrossRef]
- Zhang, Y.; Li, J.; Wang, J.; Niu, S.; Kou, H. Hot deformation behavior of as-cast and homogenized Al0.5CoCrFeNi high entropy alloys. Metals 2016, 6, 277. [Google Scholar] [CrossRef]
- Lee, K.; Bae, B.; Kang, J.; Kim, K.; Na, Y. Multi-phase refining of an AlCoCrFeNi high entropy alloy by hot compression. Mater. Lett. 2017, 198, 81–84. [Google Scholar] [CrossRef]
- Xian, X.; Zhong, Z.; Zhang, B.; Song, K.; Chen, C.; Wang, S.; Cheng, J.; Wu, Y. A high-entropy V35Ti35Fe15Cr10Zr5 alloy with excellent high-temperature strength. Mater. Des. 2017, 121, 229–236. [Google Scholar] [CrossRef]
- Lee, K.S.; Kang, J.-H.; Lim, K.R.; Na, Y.S. Influence of compressive strain on the microstructural evolution of an AlCoCrFeNi high entropy alloy. Mater. Charact. 2017, 132, 162–168. [Google Scholar] [CrossRef]
- Jiang, S.; Sun, D.; Zhang, Y.; Wang, S.; Zhao, C. Plastic deformation mechanisms of equiatomic Ni20Ti20Fe20Al20Cu20 high-entropy alloy at high temperatures. J. Mater. Sci. 2017, 52, 3199–3207. [Google Scholar] [CrossRef]
- Wang, J.; Liu, Y.; Liu, B.; Wang, Y.; Cao, Y.; Li, T.; Zhou, R. Flow behavior and microstructures of powder metallurgical CrFeCoNiMo0.2 high entropy alloy during high temperature deformation. Mater. Sci. Eng. A 2017, 689, 233–242. [Google Scholar] [CrossRef]
- Zou, Y.; Sheeler, J.; Ma, H.; Okle, P.; Spolenak, R. Nanocrystalline high-entropy alloys: A new paradigm in high-temperature strength and stability. Nano Lett. 2017, 17, 1569–1574. [Google Scholar] [CrossRef]
- Li, J.; Gao, B.; Tang, S.; Liu, B.; Liu, Y.; Wang, Y.; Wang, J. High temperature deformation behavior of carbon-containing FeCoCrNiMn high entropy alloy. J. Alloys Compd. 2018, 747, 571–579. [Google Scholar] [CrossRef]
- Zhang, M.; Zhou, X.; Zhu, W.; Li, J. Influence of annealing on microstructure and mechanical properties of refractory CoCrMoNbTi0.4 high-entropy alloy. Metall. Mater. Trans. A 2018, 49, 1313–1327. [Google Scholar] [CrossRef]
- Rahul, M.; Samal, S.; Venugopal, S.; Phanikumar, G. Experimental and finite element simulation studies on hot deformation behaviour of AlCoCrFeNi2.1 eutectic high entropy alloy. J. Alloys Compd. 2018, 749, 1115–1127. [Google Scholar] [CrossRef]
- Eleti, R.R.; Bhattacharjee, T.; Zhao, L.; Bhattacharjee, P.P.; Tsuji, N. Hot deformation behavior of CoCrFeMnNi FCC high entropy alloy. Mater. Chem. Phys. 2018, 210, 176–186. [Google Scholar] [CrossRef]
- Cao, Y.; Liu, Y.; Liu, B.; Zhang, W. Precipitation behavior during hot deformation of powder metallurgy Ti-Nb-Ta-Zr-Al high entropy alloys. Intermetallics 2018, 100, 95–103. [Google Scholar] [CrossRef]
- Tong, Y.; Qiao, J.; Yao, Y. The constitutive model and threshold stress for characterizing the deformation mechanism of Al0.3CoCrFeNi high entropy alloy. Mater. Sci. Eng. A 2018, 730, 137–146. [Google Scholar] [CrossRef]
- Yang, C.; Aoyagi, K.; Bian, H.; Chiba, A. Microstructure evolution and mechanical property of a precipitation-strengthened refractory high-entropy alloy HfNbTaTiZr. Mater. Lett. 2019, 254, 46–49. [Google Scholar] [CrossRef]
- Jeong, H.; Park, H.; Park, K.; Na, T.; Kim, W. High-temperature deformation mechanisms and processing maps of equiatomic CoCrFeMnNi high-entropy alloy. Mater. Sci. Eng. A 2019, 756, 528–537. [Google Scholar] [CrossRef]
- Málek, J.; Zýka, J.; Lukáč, F.; Čížek, J.; Kunčická, L.; Kocich, R. Microstructure and mechanical properties of sintered and heat-treated HfNbTaTiZr high entropy alloy. Metals 2019, 9, 1324. [Google Scholar] [CrossRef]
- Tang, K.; Chen, L.; Wang, S.; Wei, R.; Yang, Z.; Jiang, F.; Sun, J. Development of a large size FCC high-entropy alloy with excellent mechanical properties. Mater. Sci. Eng. A 2019, 761, 138039. [Google Scholar] [CrossRef]
- Annasamy, M.; Haghdadi, N.; Taylor, A.; Hodgson, P.; Fabijanic, D. Dynamic recrystallization behaviour of AlxCoCrFeNi high entropy alloys during high-temperature plane strain compression. Mater. Sci. Eng. A 2019, 745, 90–106. [Google Scholar] [CrossRef]
- Kahnooji, M.; Zarei-Hanzaki, A.; Abedi, H.; Hassanpour-Esfahani, M.; Jalali, M.; Gubicza, J.; Heczel, A. An investigation into the dynamic recrystallization behavior of a non- equiatomic high entropy alloy. Mater. Sci. Eng. A 2019, 768, 138423. [Google Scholar] [CrossRef]
- Prasad, N.; Bibhanshu, N.; Nayan, N.; Avadhani, G.; Suwas, S. Hot deformation behavior of the high-entropy alloy CoCuFeMnNi. J. Mater. Res. 2019, 34, 744–755. [Google Scholar] [CrossRef]
- Eleti, R.; Bhattacharjee, T.; Shibata, A.; Tsuji, N. Unique deformation behavior and microstructure evolution in high temperature processing of HfNbTaTiZr refractory high entropy alloy. Acta Mater. 2019, 171, 132–145. [Google Scholar] [CrossRef]
- Kim, W.; Jeong, H.; Park, H.; Park, K.; Na, T.; Choi, E. The effect of Al to high-temperature deformation mechanisms and processing maps of Al0.5CoCrFeMnNi high entropy alloy. J. Alloys Compd. 2019, 802, 152–165. [Google Scholar] [CrossRef]
- Guo, W.; Liu, B.; Liu, Y.; Li, T.; Fu, A.; Fang, Q.; Nie, Y. Microstructures and mechanical properties of ductile NbTaTiV refractory high entropy alloy prepared by powder metallurgy. J. Alloys Compd. 2019, 776, 428–436. [Google Scholar] [CrossRef]
- Xu, X.; Chen, S.; Ren, Y.; Hirata, A.; Fujita, T.; Liaw, P.; Chen, M. Temperature-dependent compression behavior of an Al0.5CoCrCuFeNi high-entropy alloy. Materialia 2019, 5, 100243. [Google Scholar] [CrossRef]
- Wang, Y.; Li, J.; Xin, Y.; Li, C.; Cheng, Y.; Chen, X.; Rashad, M.; Liu, B.; Liu, Y. Effect of Zener–Hollomon parameter on hot deformation behavior of CoCrFeMnNiC0.5 high entropy alloy. Mater. Sci. Eng. A 2019, 768, 138483. [Google Scholar] [CrossRef]
- Wang, Y.-T.; Li, J.-B.; Xin, Y.-C.; Chen, X.-H.; Rashad, M.; Liu, B.; Liu, Y. Hot deformation behavior and hardness of a CoCrFeMnNi high-entropy alloy with high content of carbon. Acta Metall. Sin. 2019, 32, 932–943. [Google Scholar] [CrossRef]
- Alijani, F.; Reihanian, M.; Gheisari, K.; Miyamoto, H. Microstructure and high-temperature deformation behavior of FeCoNiMnV high entropy alloy. Mater. Chem. Phys. 2020, 256, 123675. [Google Scholar] [CrossRef]
- Dong, F.; Yuan, Y.; Li, W.; Zhang, Y.; Liaw, P.; Yuan, X.; Huang, H. Hot deformation behavior and processing maps of an equiatomic MoNbHfZrTi refractory high entropy alloy. Intermetallics 2020, 126, 106921. [Google Scholar] [CrossRef]
- Aripov, G.R.; Bazlov, A.I.; Churyumov, A.Y.; Polkin, V.I.; Luzgin, D.V.; Prokoshkin, S.D. Study of the change in the structure and properties of high-entropic alloys during thermal and thermomechanical processing. Russ. J. Non-Ferr. Met. 2020, 61, 413–420. [Google Scholar] [CrossRef]
- Jeong, H.; Park, H.; Kang, H.; Kim, W. Operation of solute-drag creep in an AlCoCrFeMnNi high-entropy alloy and enhanced hot workability. J. Alloys Compd. 2020, 824, 153829. [Google Scholar] [CrossRef]
- Lin, L.; Xian, X.; Zhong, Z.; Chen, C.; Zhu, Z.; Wu, Y.; Liaw, P. A multi-phase CrMnFeCoNiAl0.75 high-entropy alloy with high strength at intermediate temperature. Intermetallics 2020, 120, 106744. [Google Scholar] [CrossRef]
- Hu, M.-L.; Song, W.-D.; Duan, D.-B.; Wu, Y. Dynamic behavior and microstructure characterization of TaNbHfZrTi high-entropy alloy at a wide range of strain rates and temperatures. Int. J. Mech. Sci. 2020, 182, 105738. [Google Scholar] [CrossRef]
- Patnamsetty, M.; Somani, M.C.; Ghosh, S.; Ahmed, S.; Peura, P. Processing map for controlling microstructure and unraveling various deformation mechanisms during hot working of CoCrFeMnNi high entropy alloy. Mater. Sci. Eng. A 2020, 793, 139840. [Google Scholar] [CrossRef]
- Patnamsetty, M.; Saastamoinen, A.; Somani, M.C.; Peura, P. Constitutive modelling of hot deformation behaviour of a CoCrFeMnNi high-entropy alloy. Sci. Technol. Adv. Mater. 2020, 21, 43–55. [Google Scholar] [CrossRef] [PubMed]
- Ahmed, M.Z.; Chadha, K.; Reddy, S.R.; Shahriari, D.; Bhattacharjee, P.P.; Jahazi, M. Influence of process parameters on microstructure evolution during hot deformation of a eutectic high-entropy alloy (EHEA). Metall. Mater. Trans. A 2020, 51, 6406–6420. [Google Scholar] [CrossRef]
- Haghdadi, N.; Primig, S.; Annasamy, M.; Cizek, P.; Hodgson, P.; Fabijanic, D. Dynamic recrystallization in AlXCoCrFeNi duplex high entropy alloys. J. Alloys Compd. 2020, 830, 154720. [Google Scholar] [CrossRef]
- Haghdadi, N.; Primig, S.; Annasamy, M.; Cizek, P.; Hodgson, P.D.; Fabijanic, D.M. On the hot-worked microstructure of a face-centered cubic Al0.3CoCrFeNi high entropy alloy. Scr. Mater. 2020, 178, 144–149. [Google Scholar] [CrossRef]
- Senkov, O.N.; Couzinie, J.P.; Rao, S.I.; Soni, V.; Banerjee, R. Temperature dependent deformation behavior and strengthening mechanisms in a low density refractory high entropy alloy Al10Nb15Ta5Ti30Zr40. Materialia 2020, 9, 100627. [Google Scholar] [CrossRef]
- Tian, Q.; Zhang, G.; Yin, K.; Wang, L.; Wang, W.; Cheng, W.; Wang, Y.; Huang, J.C. High temperature deformation mechanism and microstructural evolution of relatively lightweight AlCoCrFeNi high entropy alloy. Intermetallics 2020, 119, 106707. [Google Scholar] [CrossRef]
- Jain, R.; Rahul, M.; Samal, S.; Kumar, V.; Phanikumar, G. Hot workability of CoeFeeMneNieTi eutectic high entropy alloy. J. Alloys Compd. 2020, 822, 153609. [Google Scholar] [CrossRef]
- Cao, T.; Ma, L.; Wang, L.; Zhou, J.; Wang, Y.; Wang, B.; Xue, Y. High temperature deformation behavior of dual-phase Al0.6CoCrFeNi high-entropy alloys. J. Alloys Compd. 2020, 836, 155305. [Google Scholar] [CrossRef]
- Jain, R.; Jain, A.; Rahul, M.R.; Kumar, A.; Dubey, M.; Sabat, R.K.; Samal, S.; Phanikumar, G. Development of ultrahigh strength novel Co–Cr–Fe–Ni–Zr quasi-peritectic high entropy alloy by an integrated approach using experiment and simulation. Materialia 2020, 14, 100896. [Google Scholar] [CrossRef]
- Eleti, R.R.; Chokshi, A.H.; Shibata, A.; Tsuji, N. Unique high-temperature deformation dominated by grain boundary sliding in heterogeneous necklace structure formed by dynamic recrystallization in HfNbTaTiZr BCC refractory high entropy alloy. Acta Mater. 2020, 183, 64–77. [Google Scholar] [CrossRef]
- Wang, X.; Zhang, Y.; Ma, X. High temperature deformation and dynamic recrystallization behavior of AlCrCuFeNi high entropy alloy. Mater. Sci. Eng. A 2020, 778, 139077. [Google Scholar] [CrossRef]
- Kim, Y.K.; Yang, S.; Lee, K.A. Superior temperature-dependent mechanical properties and deformation behavior of equiatomic CoCrFeMnNi high-entropy alloy additively manufactured by selective laser melting. Sci. Rep. 2020, 10, 8045. [Google Scholar] [CrossRef]
- Brown, C.; McCarthy, T.; Chadha, K.; Rodrigues, S.; Aranas, C., Jr.; Saha, G. Constitutive modeling of the hot deformation behavior of CoCrFeMnNi high-entropy alloy. Mater. Sci. Eng. A 2021, 826, 141940. [Google Scholar] [CrossRef]
- Watanabe, H.; Murata, T.; Ikeo, N.; Mukai, T.; Han, K.; Tsuchiya, K. Effect of initial microstructure on grain refinement under hot compression in CrMnFeCoNi high-entropy alloy with Al addition. Materialia 2021, 18, 101172. [Google Scholar] [CrossRef]
- Yi, H.; Wei, D.; Xie, R.; Zhang, Y.; Kato, H. Microstructure refinement of a transformation-induced plasticity high-entroy alloy. Materials 2021, 14, 1196. [Google Scholar] [CrossRef]
- Yi, H.; Zhang, Y.; Xie, R.; Bi, M.; Wei, D. High-temperature deformation behaviors of the C-doped and N-doped high entropy alloys. Metals 2021, 11, 1517. [Google Scholar] [CrossRef]
- Jeong, H.T.; Kim, W.J. Calculation and construction of deformation mechanism maps and processing maps for CoCrFeMnNi and Al0.5CoCrFeMnNi high-entropy alloys. J. Alloys Compd. 2021, 869, 159256. [Google Scholar] [CrossRef]
- Jeong, H.T.; Park, H.K.; Kim, W.J. Dynamic recrystallization and hot deformation mechanisms of a eutectic Al0.7CoCrFeMnNi high-entropy alloy. J. Alloys Compd. 2021, 871, 159488. [Google Scholar] [CrossRef]
- Jeong, H.T.; Park, H.K.; Kim, W.J. Hot deformation behavior and processing map of a Sn0.5CoCrFeMnNi high entropy alloy with dual phases. Mater. Sci. Eng. A 2021, 801, 140394. [Google Scholar] [CrossRef]
- Yasuda, H.Y.; Yamada, Y.; Cho, K.; Nagase, T. Deformation behavior of HfNbTaTiZr high entropy alloy singe crystals and polycrystals. Mater. Sci. Eng. A 2021, 809, 140983. [Google Scholar] [CrossRef]
- Jiang, J.; Huang, M.; Wang, Y.; Xiao, G.; Liu, Y.; Zhang, Y. Unique hot deformation behavior and microstructure evolution of a dual FCC-phase CoCrCu1.2FeNi high entropy alloy. J. Alloys Compd. 2021, 876, 160102. [Google Scholar] [CrossRef]
- Xu, L.; Chen, Z.; Zheng, Y.; Wang, X.; Han, S.; Xiao, S.; Chen, Y. Deformation behavior and microstructure evolution of as-cast Ti2ZrMo0.5Nb0.5 high entropy alloy. J. Mater. Res. Technol. 2021, 13, 2469–2481. [Google Scholar] [CrossRef]
- Wang, M.; Ma, Z.; Xu, Z.Q.; Cheng, X.W. Effects of vanadium concentration on mechanical properties of VxNbMoTa refractory high-entropy alloys. Mater. Sci. Eng. A 2021, 808, 140848. [Google Scholar] [CrossRef]
- Wang, M.; Lu, Y.; Wang, T.; Zhang, C.; Cao, Z.; Li, T.; Liaw, P.K. A novel bulk eutectic high-entropy alloy with outstanding as-cast specific yield strengths at elevated temperatures. Scr. Mater. 2021, 204, 114132. [Google Scholar] [CrossRef]
- Shah, N.; Rahul, M.; Bysakh, S.; Phanikumar, G. Microstructure stability during high temperature deformation of CoCrFeNiTa eutectic high entropy alloy through nano-scale precipitation. Mater. Sci. Eng. A 2021, 824, 141793. [Google Scholar] [CrossRef]
- Liu, Q.; Wang, G.; Liu, Y.; Sui, X.; Chen, Y.; Luo, S. Hot deformation behaviors of an ultrafine-grained MoNbTaTiV refractory high-entropy alloy fabricated by powder metallurgy. Mater. Sci. Eng. A 2021, 809, 140922. [Google Scholar] [CrossRef]
- Wang, Q.; Gao, T.; Du, H.; Hu, Q.; Chen, Q.; Fan, Z.; Zeng, L.; Liu, X. Hot compression behaviors and microstructure evolutions of a cast dual-phase NiCoFeCrAl0.7 high-entropy alloy. Intermetallics 2021, 138, 107314. [Google Scholar] [CrossRef]
- Jain, R.; Rahul, M.R.; Chakraborty, P.; Sabat, R.K.; Samal, S.; Phanikumar, G.; Tewari, R. Design and deformation characteristics of single-phase Co-Cr-Fe-Ni-V high entropy alloy. J. Alloys Compd. 2021, 888, 161579. [Google Scholar] [CrossRef]
- Cao, T.; Guo, W.; Lu, W.; Xue, Y.; Lu, W.; Su, J.; Liebscher, C.H.; Li, C.; Dehm, G. Strain rate dependent deformation behavior of BCC-structured Ti29Zr24Nb23Hf24 high entropy alloy at elevated temperatures. J. Alloys Compd. 2021, 891, 161859. [Google Scholar] [CrossRef]
- Lee, U.; Straumal, B.; Park, N. Dynamic precipitation of σ-phase and element partitioning in equiatomic CoCrFeMnNi high-entropy alloy. Mater. Sci. Eng. A 2021, 804, 140739. [Google Scholar] [CrossRef]
- Nie, X.W.; Cai, M.D.; Cai, S. Microstructure and mechanical properties of a novel refractory high entropy alloy HfMoScTaZr. Int. J. Refract. Hard Met. 2021, 98, 105568. [Google Scholar] [CrossRef]
- Cao, Y.; Zhang, W.; Liu, B.; Liu, Y.; Du, M.; Fu, A. Phase decomposition behavior and its effects on mechanical properties of TiNbTa0.5ZrAl0.5 refractory high entropy alloy. J. Mater. Sci. Technol. 2021, 66, 10–20. [Google Scholar] [CrossRef]
- Guo, Y.; He, J.; Lu, W.; Jia, L.; Li, Z. The evolution of compositional and microstructural heterogeneities in a TaMo0.5ZrTi1.5Al0.1Si0.2 high entropy alloy. Mater. Charact. 2021, 172, 110836. [Google Scholar] [CrossRef]
- Bai, Z.C.; Ding, X.F.; Hu, Q.; Yang, M.; Fan, Z.T.; Liu, X.W. Unique deformation behavior and microstructure evolution in high-temperature processing of a low-density TiAlVNb2 refractory high-entropy alloy. J. Alloys Compd. 2021, 885, 160962. [Google Scholar] [CrossRef]
- Kaypour, H.; Nategh, S.; Gholamipour, R.; Khodabandeh, A. High-temperature compressive behavior and kinetics analysis of Al0.4MnCrCoFeNi high entropy alloy. Mater. Res. Express 2021, 8, 066505. [Google Scholar] [CrossRef]
- Wang, J.; Li, H.; Yang, H.; Zhang, Y.; Wang, W.Y.; Li, J. Hot deformation and subsequent annealing on the microstructure and hardness of an Al0.3CoCrFeNi high-entropy alloy. Acta Metall. Sin. 2021, 34, 1527–1536. [Google Scholar] [CrossRef]
- Lin, L.; Xian, X.; Zhong, Z.; Song, K.; Wang, C.; Wang, G.; Wu, Y.; Liaw, P.K. Microstructure and compression properties of a dual-phase FeCoCrMn high-entropy alloy. Adv. Compos. Hybrid Mater. 2022, 5, 1508–1515. [Google Scholar] [CrossRef]
- Chanda, B.; Pani, S.K.; Das, J. Mechanism of microstructure evolution and spheroidization in ultrafine lamellar CoCrFeNi(Nb0.5/Ta0.4) eutectic high entropy alloys upon hot deformation. Mater. Sci. Eng. A 2022, 835, 142669. [Google Scholar] [CrossRef]
- Emdadi, A.; Stryzhyboroda, O.; Hecht, U.; Bambach, M. Complex dynamic restoration processes leading to a high degree of deformability in a dual-phase Al0.5CoCrFeNi high entropy alloy. J. Alloys Compd. 2022, 918, 165583. [Google Scholar] [CrossRef]
- De Freitas, C.C.; Caram, R.; Campo, K.N. Semisolid deformation behavior and processing of CoCrCuxFeNi high-entropy alloys. Intermetallics 2022, 150, 107682. [Google Scholar] [CrossRef]
- Ge, S.; Lin, S.; Fu, H.; Zhang, L.; Geng, T.; Zhu, Z.; Li, Z.; Li, H.; Wang, A.; Zhang, H.; et al. High-temperature Mechanical Properties and Dynamic Recrystallization Mechanism of in situ Silicide-reinforced MoNbTaTiVSi Refractory High-entropy Alloy Composite. Acta Metall. Sin. 2022, 35, 1617–1630. [Google Scholar] [CrossRef]
- Jain, R.; Umre, P.; Sabat, R.K.; Kumar, V.; Samal, S. Constitutive and artificial neural network modeling to predict hot deformation behavior of CoFeMnNiTi eutectic high-entropy alloy. J. Mater. Eng. Perform. 2022, 31, 8124–8135. [Google Scholar] [CrossRef]
- Li, T.; Lu, Y.; Li, Z.; Wang, T.; Li, T. Hot deformation behavior and microstructure evolution of non-equimolar Ti2ZrHfV0.5Ta0.2 refractory high-entropy alloy. Intermetallics 2022, 146, 107586. [Google Scholar] [CrossRef]
- Liu, X.R.; He, F.; Li, J.J.; Dang, Y.Y.; Wang, Z.J.; Wang, J.C. Tailoring microstructures of CoCrFeNiNb0.25 hypoeutectic high-entropy alloy by hot deformation. Rare Met. 2022, 41, 2028–2037. [Google Scholar] [CrossRef]
- Marzbali, M.H.; Jafarian, H.R.; Bokaei, S.; Park, N.; Momeni, A.; Eivani, A.R. On the microstructure and mechanical properties of FeCoCrCuNi high entropy alloy during hot compression. J. Mater. Res. Technol. 2022, 16, 1747–1760. [Google Scholar] [CrossRef]
- Mei, J.; Wu, T.; Wei, N.; Xue, F.; Cai, Z.; Xue, X. Hot compression behavior of a novel high entropy alloy. Metals 2022, 12, 463. [Google Scholar] [CrossRef]
- Patnamsetty, M.; Ghosh, S.; Somani, M.C.; Peura, P. Characterization of hot deformation behavior of Al0.3CoCrFeNi high-entropy alloy and development of processing map. J. Alloys Compd. 2022, 914, 165341. [Google Scholar] [CrossRef]
- Qiao, L.; Zhu, J. Constitutive modeling of hot deformation behavior of AlCrFeNi multi-component alloy. Vacuum 2022, 201, 111059. [Google Scholar] [CrossRef]
- Qu, S.; Fang, Y.; Liang, J.; Zheng, J.H.; Zheng, K. A physical mechanism-based model of CoCrFeMnNi high entropy alloy considering adiabatic heat effect for hot bulk forming processes. Metals 2022, 12, 1011. [Google Scholar] [CrossRef]
- Sajadi, S.A.; Toroghinejad, M.R.; Rezaeian, A.; Ebrahimi, G.R. A study of hot compression behavior of an as-cast FeCrCuNi2Mn2 high-entropy alloy. J. Alloys Compd. 2022, 896, 162732. [Google Scholar] [CrossRef]
- Sajadi, S.A.; Toroghinejad, M.R.; Rezaeian, A.; Ebrahimi, G.R. Dynamic recrystallization behavior of the equiatomic FeCoCrNi high-entropy alloy during high temperature deformation. J. Mater. Res. Technol. 2022, 20, 1093–1109. [Google Scholar] [CrossRef]
- Wang, J.; Yang, P.; Wang, D. Constitutive equation and microstructure analysis of Al0.6CoCrFeNi high entropy alloy during hot deformation. Philos. Mag. 2022, 102, 1684–1707. [Google Scholar] [CrossRef]
- Wu, S.; Qiao, D.; Zhang, H.; Miao, J.; Zhao, H.; Wang, J.; Lu, Y.; Wang, T.; Li, T. Microstructure and mechanical properties of CxHf0.25NbTaW0.5 refractory high-entropy alloys at room and high temperatures. J. Mater. Sci. Technol. 2022, 97, 229–238. [Google Scholar] [CrossRef]
- Yu, Z.; Xie, B.; Zhu, Z.; Xu, B.; Sun, M. High-temperature deformation behavior and processing maps of a novel AlNbTi3VZr1.5 refractory high entropy alloy. J. Alloys Compd. 2022, 912, 165220. [Google Scholar] [CrossRef]
- John, R.; Dash, M.K.; Murty, B.S.; Fabijanic, D. Effect of temperature and strain rate on the deformation behaviour and microstructure of Al0.7CoCrFeNi high entropy alloy. Mater. Sci. Eng. A 2022, 856, 143933. [Google Scholar] [CrossRef]
- Prasad, Y.V.R.K.; Rao, K.P.; Sasidhara, S. Hot Working Guide: A Compendium of Processing Maps, 2nd ed.; ASM International: Materials Park, OH, USA, 2015. [Google Scholar]
- Wang, W.R.; Wang, W.L.; Wang, S.C.; Tsai, Y.C.; Lai, C.H.; Yeh, J.W. Effects of Al addition on the microstructure and mechanical property of AlxCoCrFeNi high-entropy alloys. Intermetallcs 2012, 26, 44–51. [Google Scholar] [CrossRef]
- He, J.Y.; Liu, W.H.; Wang, H.; Wu, Y.; Liu, X.J.; Nieh, T.G.; Lu, Z.P. Effects of Al addition on structural evolution and tensile properties of the FeCoNiCrMn high-entropy alloy system. Acta Mater. 2014, 62, 105–113. [Google Scholar] [CrossRef]
- Garofalo, F. An empirical relation defining the stress dependence of minimum creep rate in metals. Trans. AIME 1963, 227, 351–356. [Google Scholar]
- Nabarro, F.R.N. Report of the Conference on the Strength of Solids, London. Phys. Soc. 1948, 75–81. [Google Scholar]
- Herring, C. Diffusional viscosity of a polycrystalline solid. J. Appl. Phys. 1950, 21, 437–445. [Google Scholar] [CrossRef]
- Coble, R.L. A model for boundary diffusion controlled creep in polycrystalline materials. J. Appl. Phys. 1963, 34, 1679–1682. [Google Scholar] [CrossRef]
- Harper, J.; Dorn, J.E. Viscous creep of aluminum near its melting temperature. Acta Metall. 1957, 5, 654–665. [Google Scholar] [CrossRef]
- Lüthy, H.; White, R.; Sherby, O.D. Grain boundary sliding and deformation mechanism maps. Mater. Sci. Eng. 1979, 39, 211–216. [Google Scholar] [CrossRef]
- Ruano, O.A.; Miller, A.K.; Sherby, O.D. The influence of pipe diffusion on the creep of fine-grained materials. Mater. Sci. Eng. 1981, 51, 9–16. [Google Scholar] [CrossRef]
- Hong, S.H.; Weertman, J. High temperature creep of ordered and disordered beta brass—II. Internal stress. Acta Metall. 1986, 34, 743–751. [Google Scholar] [CrossRef]
- Robinson, S.H.; Sherby, O.D. Mechanical behavior of polycrystalline tungsten at elevated temperature. Acta Metall. 1969, 17, 109–125. [Google Scholar] [CrossRef]
- Ruano, O.A.; Wadsworth, J.; Sherby, O.D. Deformation mechanisms in an austenitic stainless steel (25Cr-20Ni) at elevated temperature. J. Mater. Sci. 1985, 20, 3735–3744. [Google Scholar] [CrossRef]
- Zhang, Y.; Yang, X.; Liaw, P.K. Alloy design and properties optimization of high-entropy alloys. JOM 2012, 64, 830–838. [Google Scholar]
- Vaidya, M.; Pradeep, K.G.; Murty, B.S.; Wilde, G.; Divinski, S.V. Bulk tracer diffusion in CoCrFeNi and CoCrFeMnNi high entropy alloys. Acta Mater. 2018, 146, 211–224. [Google Scholar] [CrossRef]
- Li, Q.; Chen, W.; Zhong, J.; Zhang, Q.; Liu, Z.K. On sluggish diffusion in fcc Al-Co-Cr-Fe-Ni high-entropy alloys: An expermental and numerical study. Metals 2018, 8, 16. [Google Scholar] [CrossRef]
- Frost, H.J.; Ashby, M.F. Deformation Mechanism Maps; Pergamon Press: Oxford, UK, 1983. [Google Scholar]
- Murty, S.V.S.N.; Sarma, M.S.; Rao, B.N. On the evaluation of efficiency parameters in processing maps. Metall. Mater. Trans. 1997, 28, 1581–1582. [Google Scholar] [CrossRef]
- Murty, S.V.S.N.; Rao, B.N. On the development of instability criteria during hot working with reference to IN 718. Mater. Sci. Eng. A 1998, 254, 76–82. [Google Scholar] [CrossRef]
- Kim, W.J.; Jeong, H.T. Easy construction of processing maps for metallic alloys using a flow instability criterion based on power-law breakdown. J. Mater. Res. Technol. 2020, 9, 5134–5143. [Google Scholar] [CrossRef]
- Jeong, H.T.; Han, S.H.; Kim, W.J. Effects of large amounts of Mg (5–13 wt%) on hot compressive deformation behavior and processing maps of Al-Mg alloys. J. Alloys Compd. 2019, 788, 1282–1299. [Google Scholar] [CrossRef]
Disclaimer/Publisher’s Note: The statements, opinions and data contained in all publications are solely those of the individual author(s) and contributor(s) and not of MDPI and/or the editor(s). MDPI and/or the editor(s) disclaim responsibility for any injury to people or property resulting from any ideas, methods, instructions or products referred to in the content. |
© 2023 by the authors. Licensee MDPI, Basel, Switzerland. This article is an open access article distributed under the terms and conditions of the Creative Commons Attribution (CC BY) license (https://creativecommons.org/licenses/by/4.0/).