

Experimental Research on Fatigue Performance of Reinforced Concrete T-Shaped Beams under Corrosion–Fatigue Coupling Action

Abstract
:1. Introduction
2. Corrosion–Fatigue Coupling Loading Devices for Reinforcement Concrete Beams
2.1. Test Method for Corrosion–Fatigue Interaction
- (1)
- Accelerated corrosion test of steel bars
- a.
- Impressed current method
- b.
- Artificial climate environment method
- (2)
- Alternating tests of fatigue and corrosion
- (3)
- Fatigue–corrosion coupling tests in artificial climate environment
- (4)
- Fatigue–corrosion coupling tests accelerated by impressed current
2.2. Coupling Test Device of Corrosion Environment and Cyclic Loads
2.2.1. Test Device Design
2.2.2. Construction Process of the Coupling Test Device
- (1)
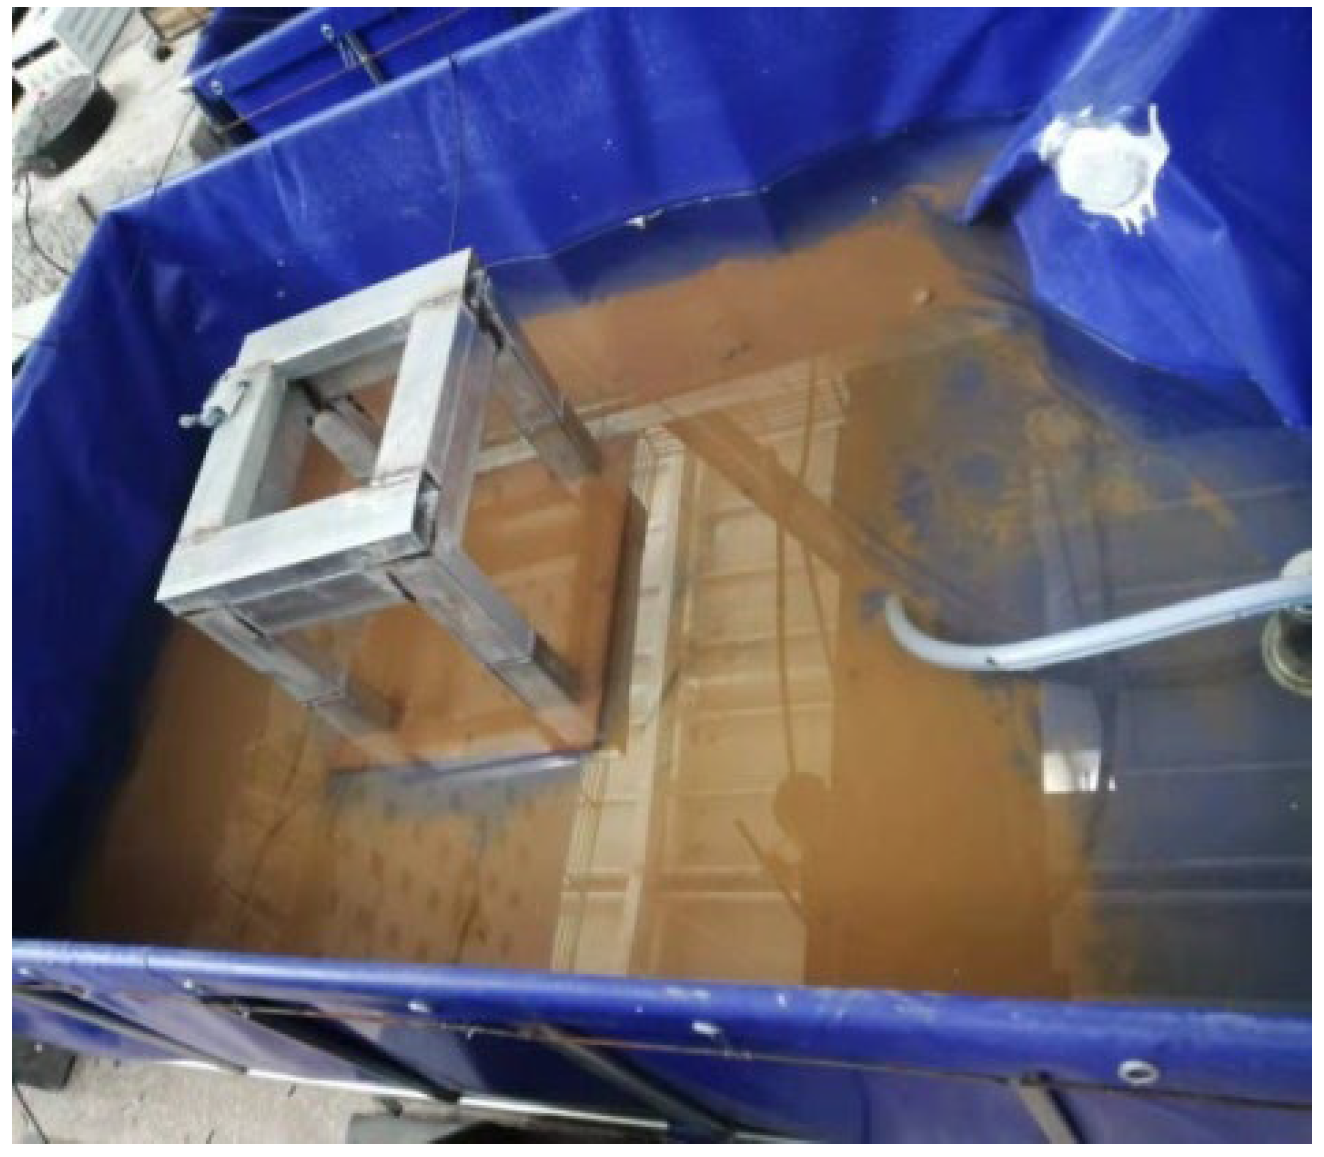
- A water tank, as shown in Figure 2, is built at the bottom of the test beam to store the NaCl solution for the test.
- (2)
- (3)
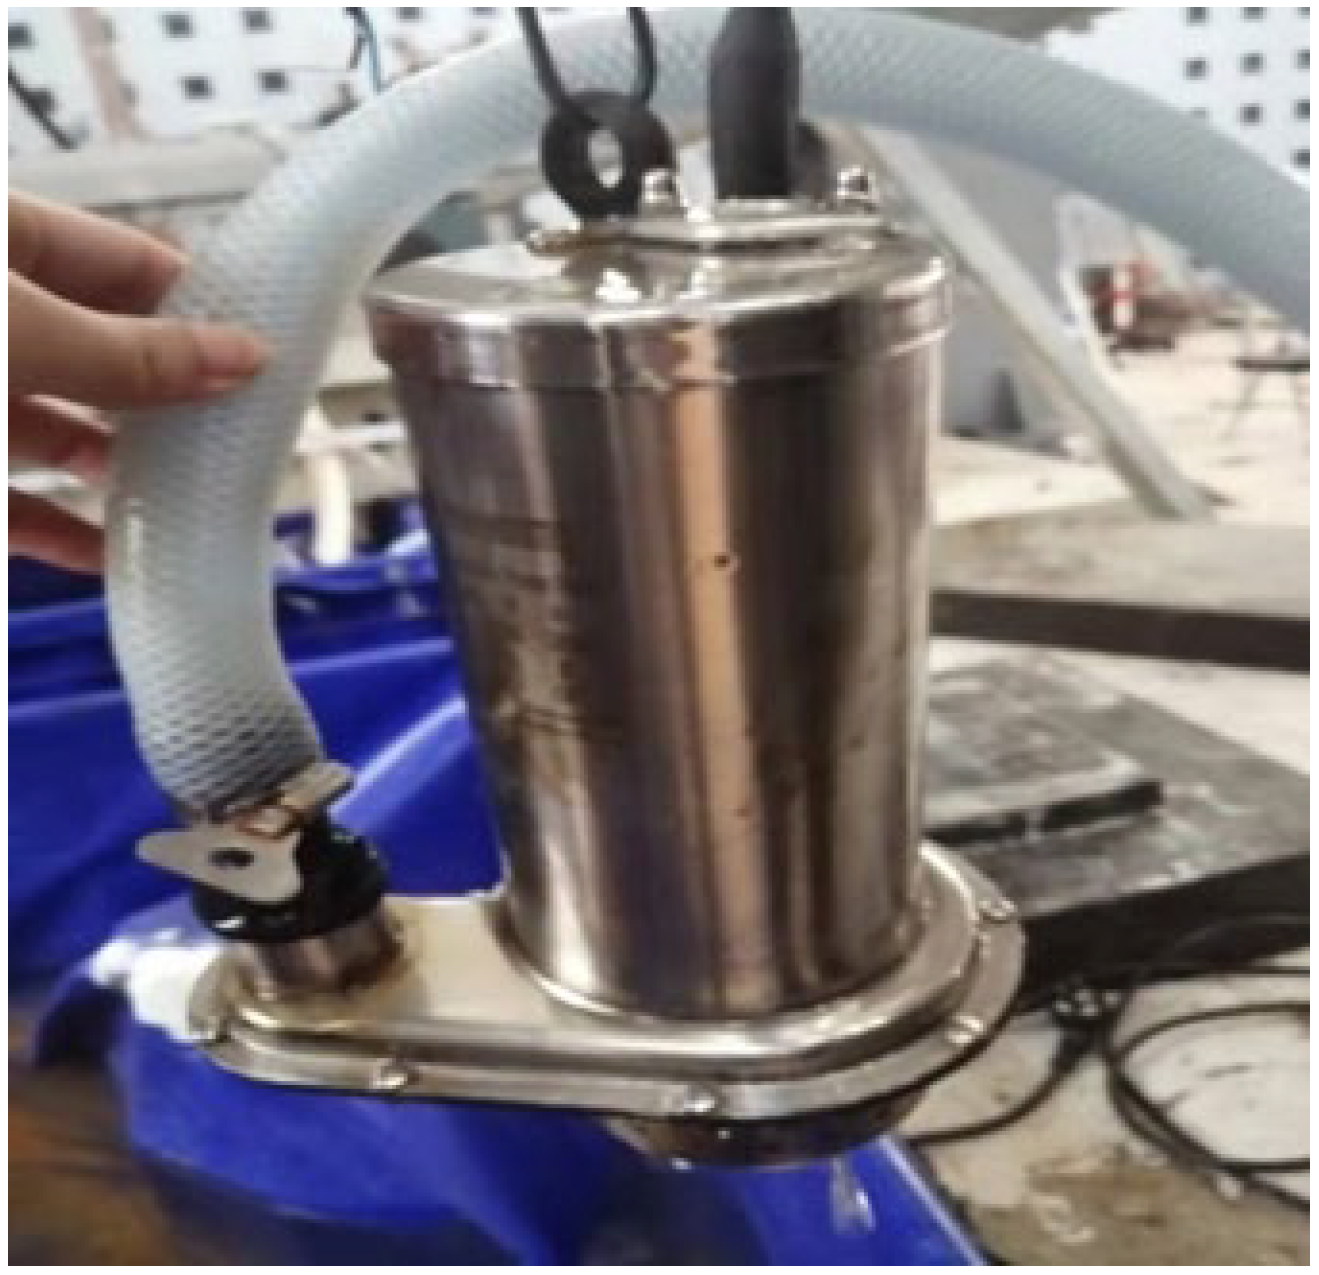
- Considering the corrosion of the water pump itself, the test device uses a stainless-steel submersible pump, as shown in Figure 5. The submersible pump is placed in the water tank, and the water level just exceeds the height of the water pump. By connecting the water pump to the water pipe, the nozzles can stably spray NaCl solution in the water tank on the side of the test beam, and the excess NaCl solution flows back to the water tank for recycling.
- (4)
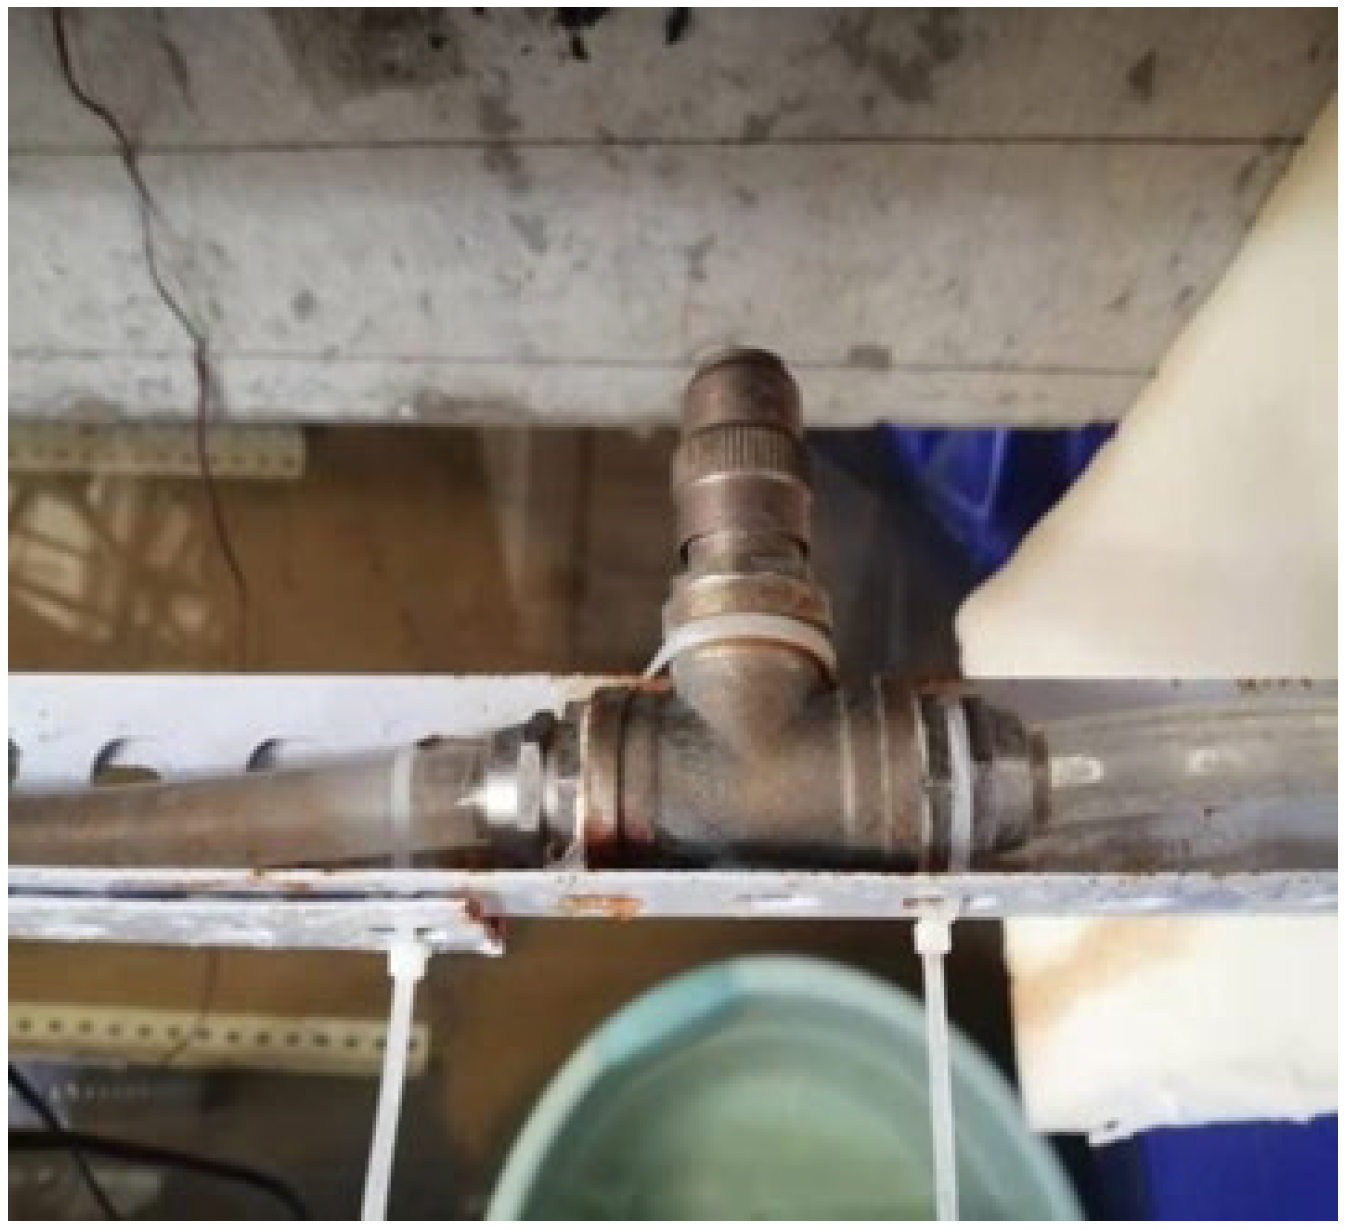
- The top surface of the test beam is watered with a drip irrigation pipe, as shown in Figure 6. The drip irrigation pipe is placed on the top surface of the test beam. Through its connection with the water pump, the NaCl solution in the drip irrigation pipe is stable and continuous, then the top surface and flange side of the test beam are wetted.
- (5)
- In order to prevent the nozzles on both sides of the test beam from splashing NaCl solution out of the water tank, sponges are installed and fixed on both ends of the test beam, as shown in Figure 7, which can effectively absorb the splashed NaCl solution, and the flexibility of the sponges can minimize the impact on the fatigue of the test beam.
- (6)
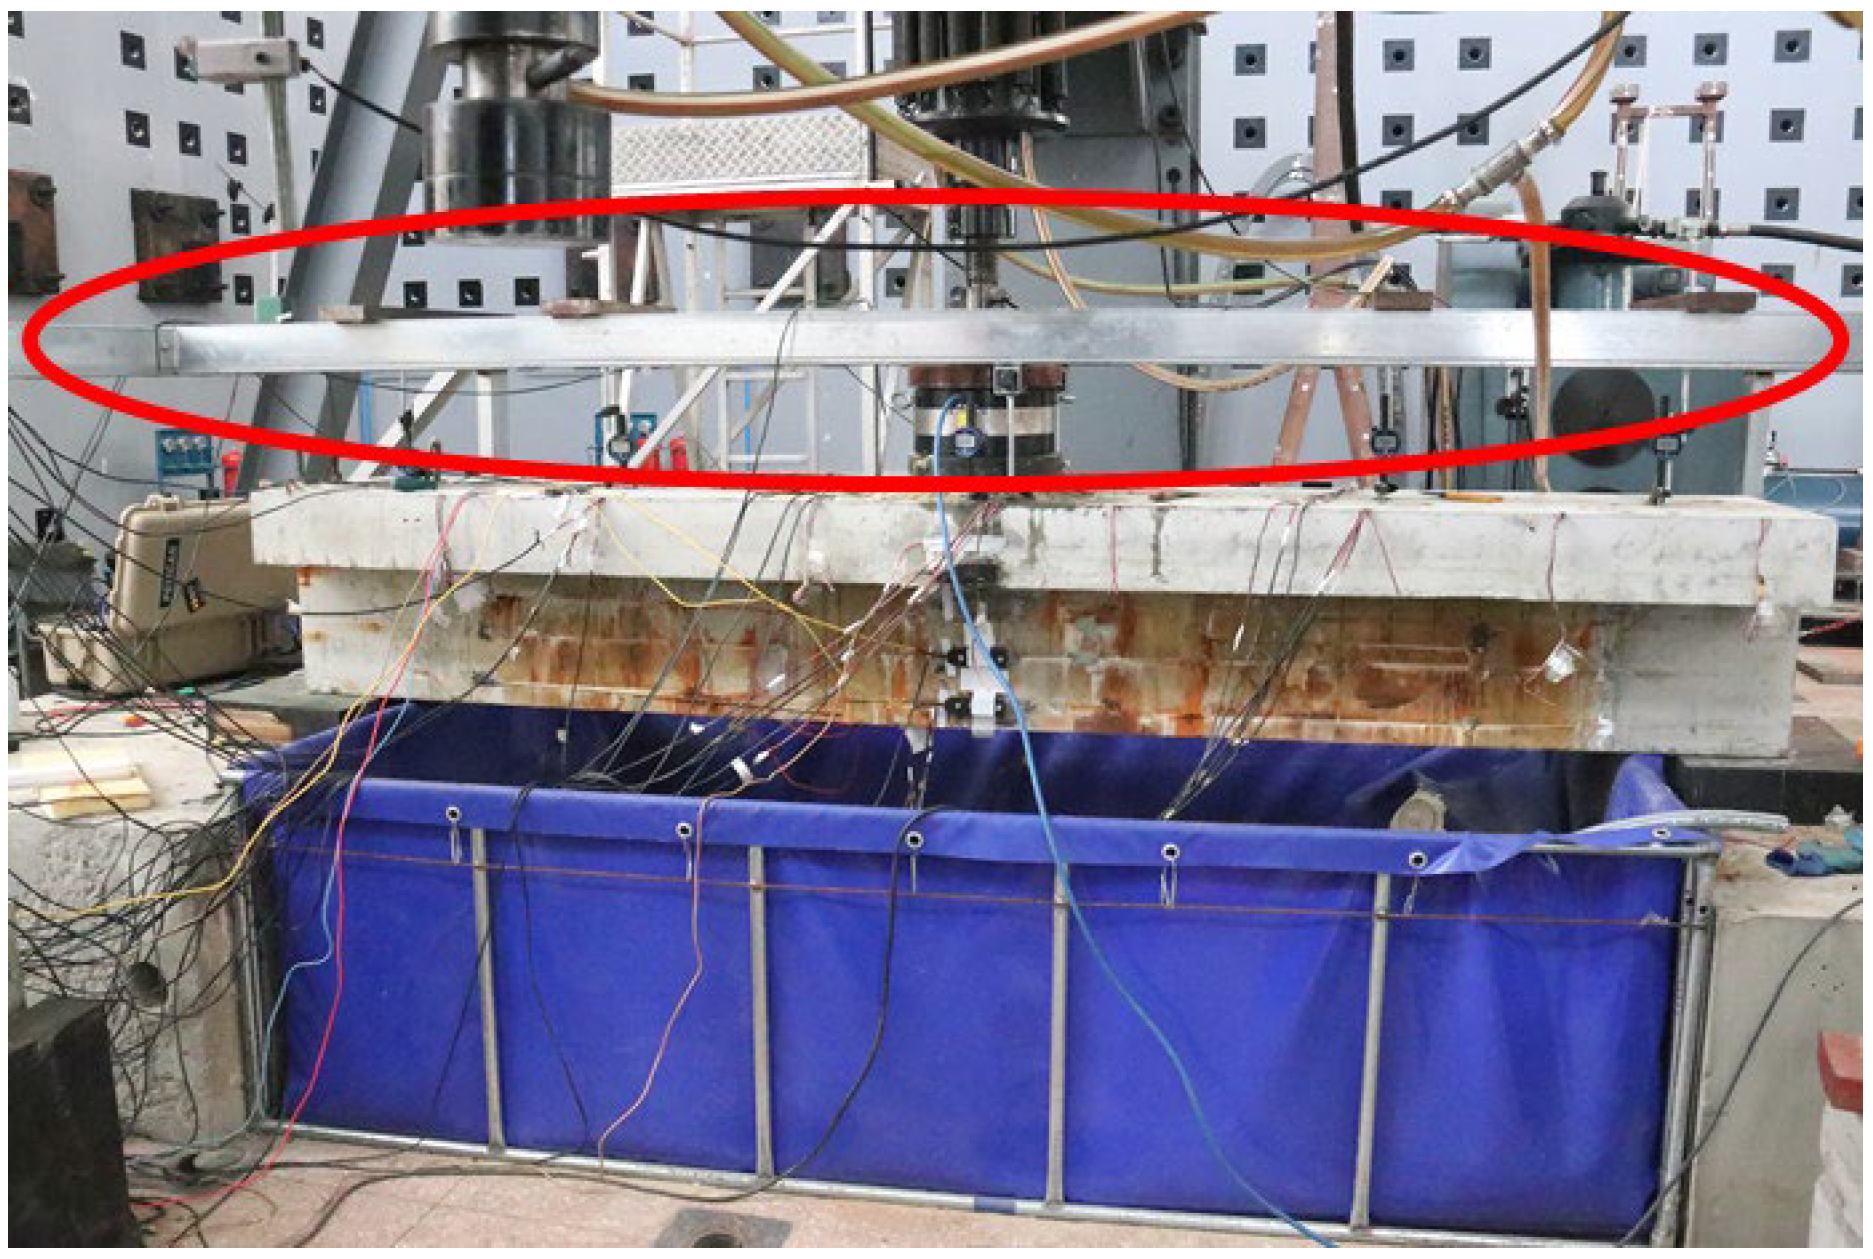
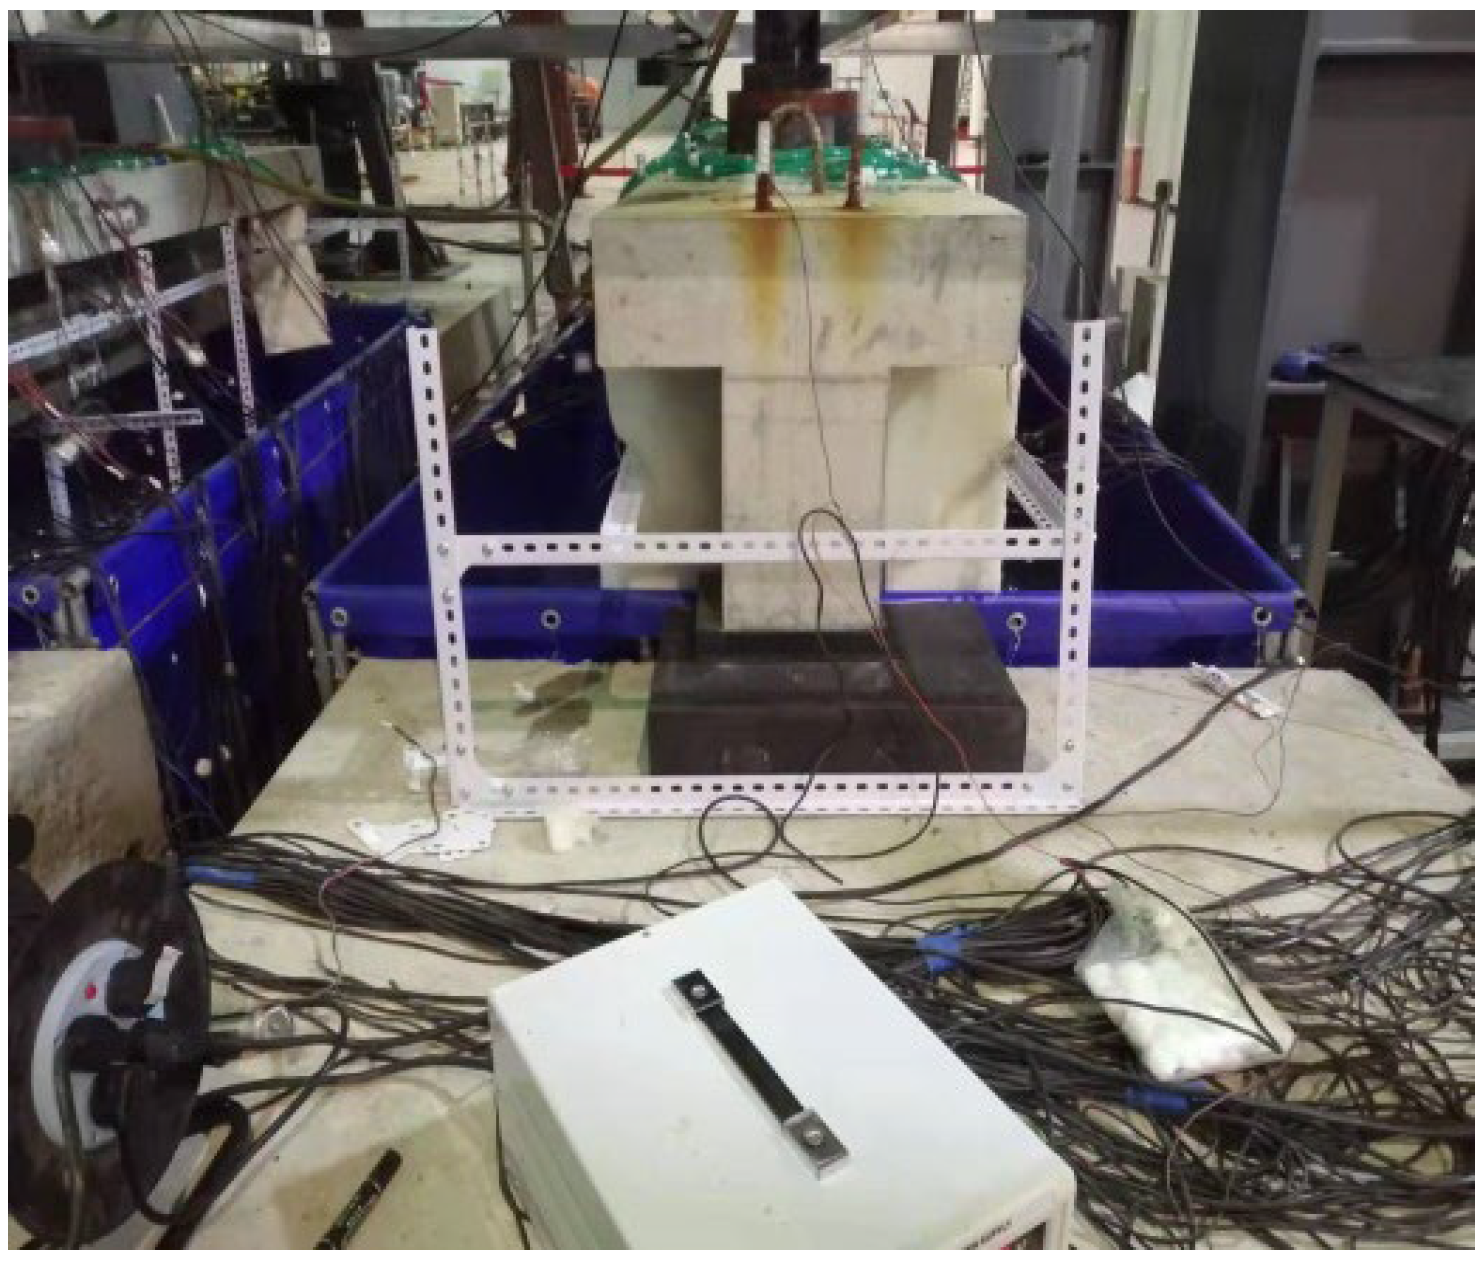
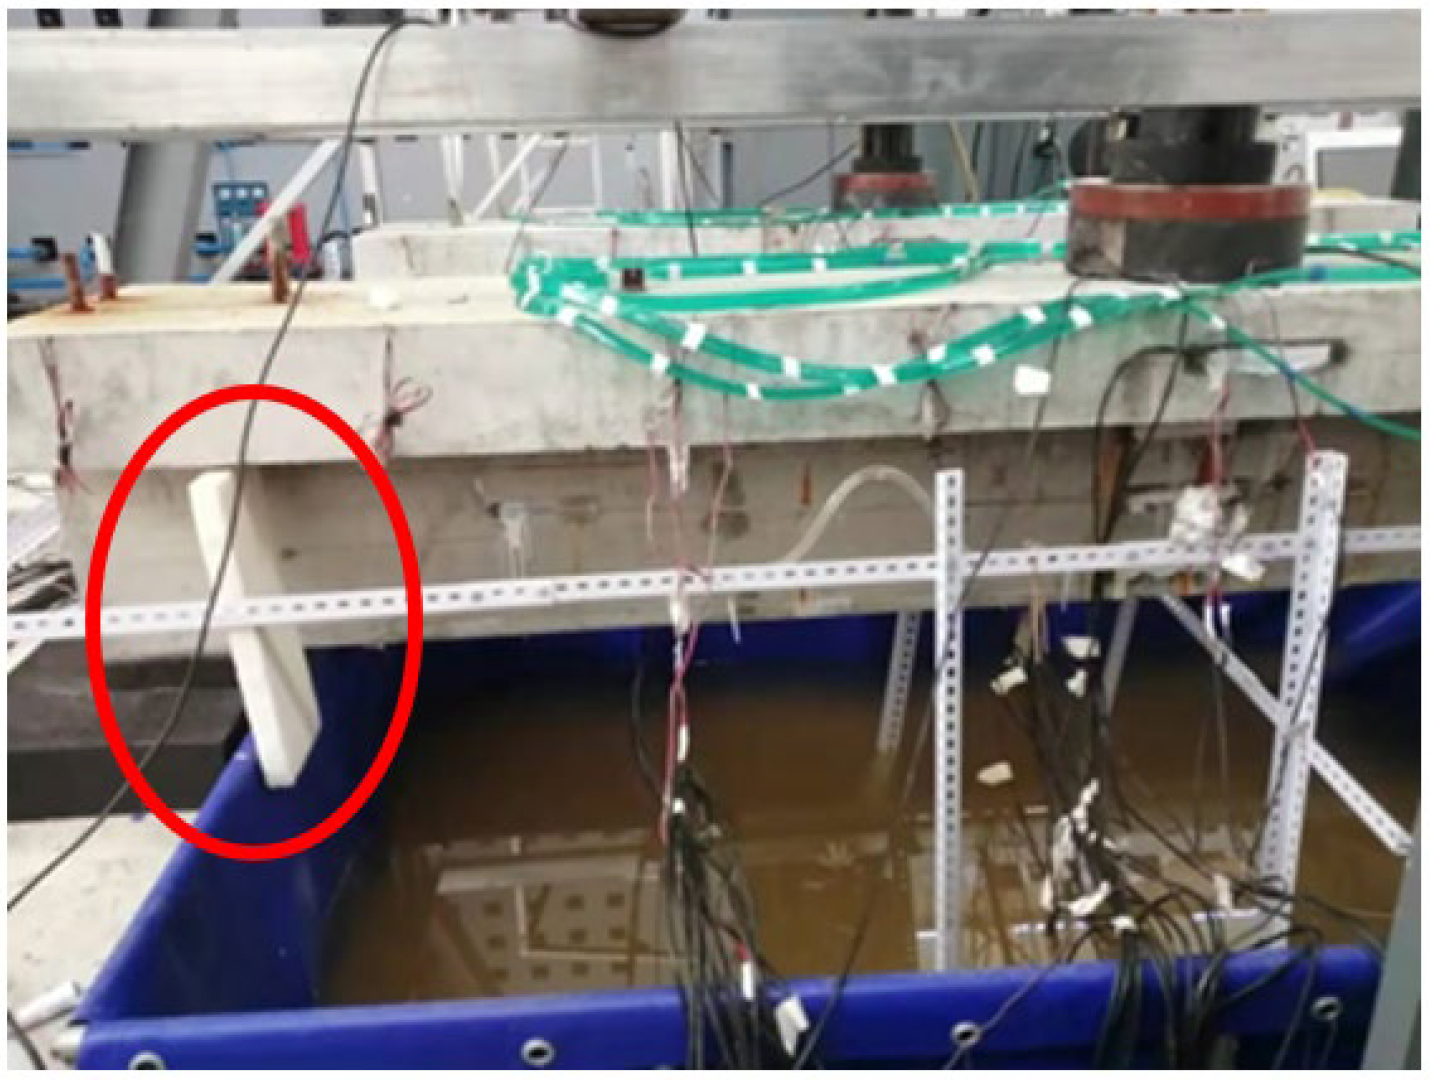
- Since the water tank is placed under the test beam, it is impossible to measure the deflection of the test beam by the pull wire displacement sensor under the test beam. Therefore, a square steel frame is arranged on the top of the test beam, as shown in Figure 8, and a pull wire displacement sensor is fixed on the frame to avoid damage to the pull wire sensor by water.
3. Corrosion–Fatigue Coupling Tests of Reinforced Concrete Beams
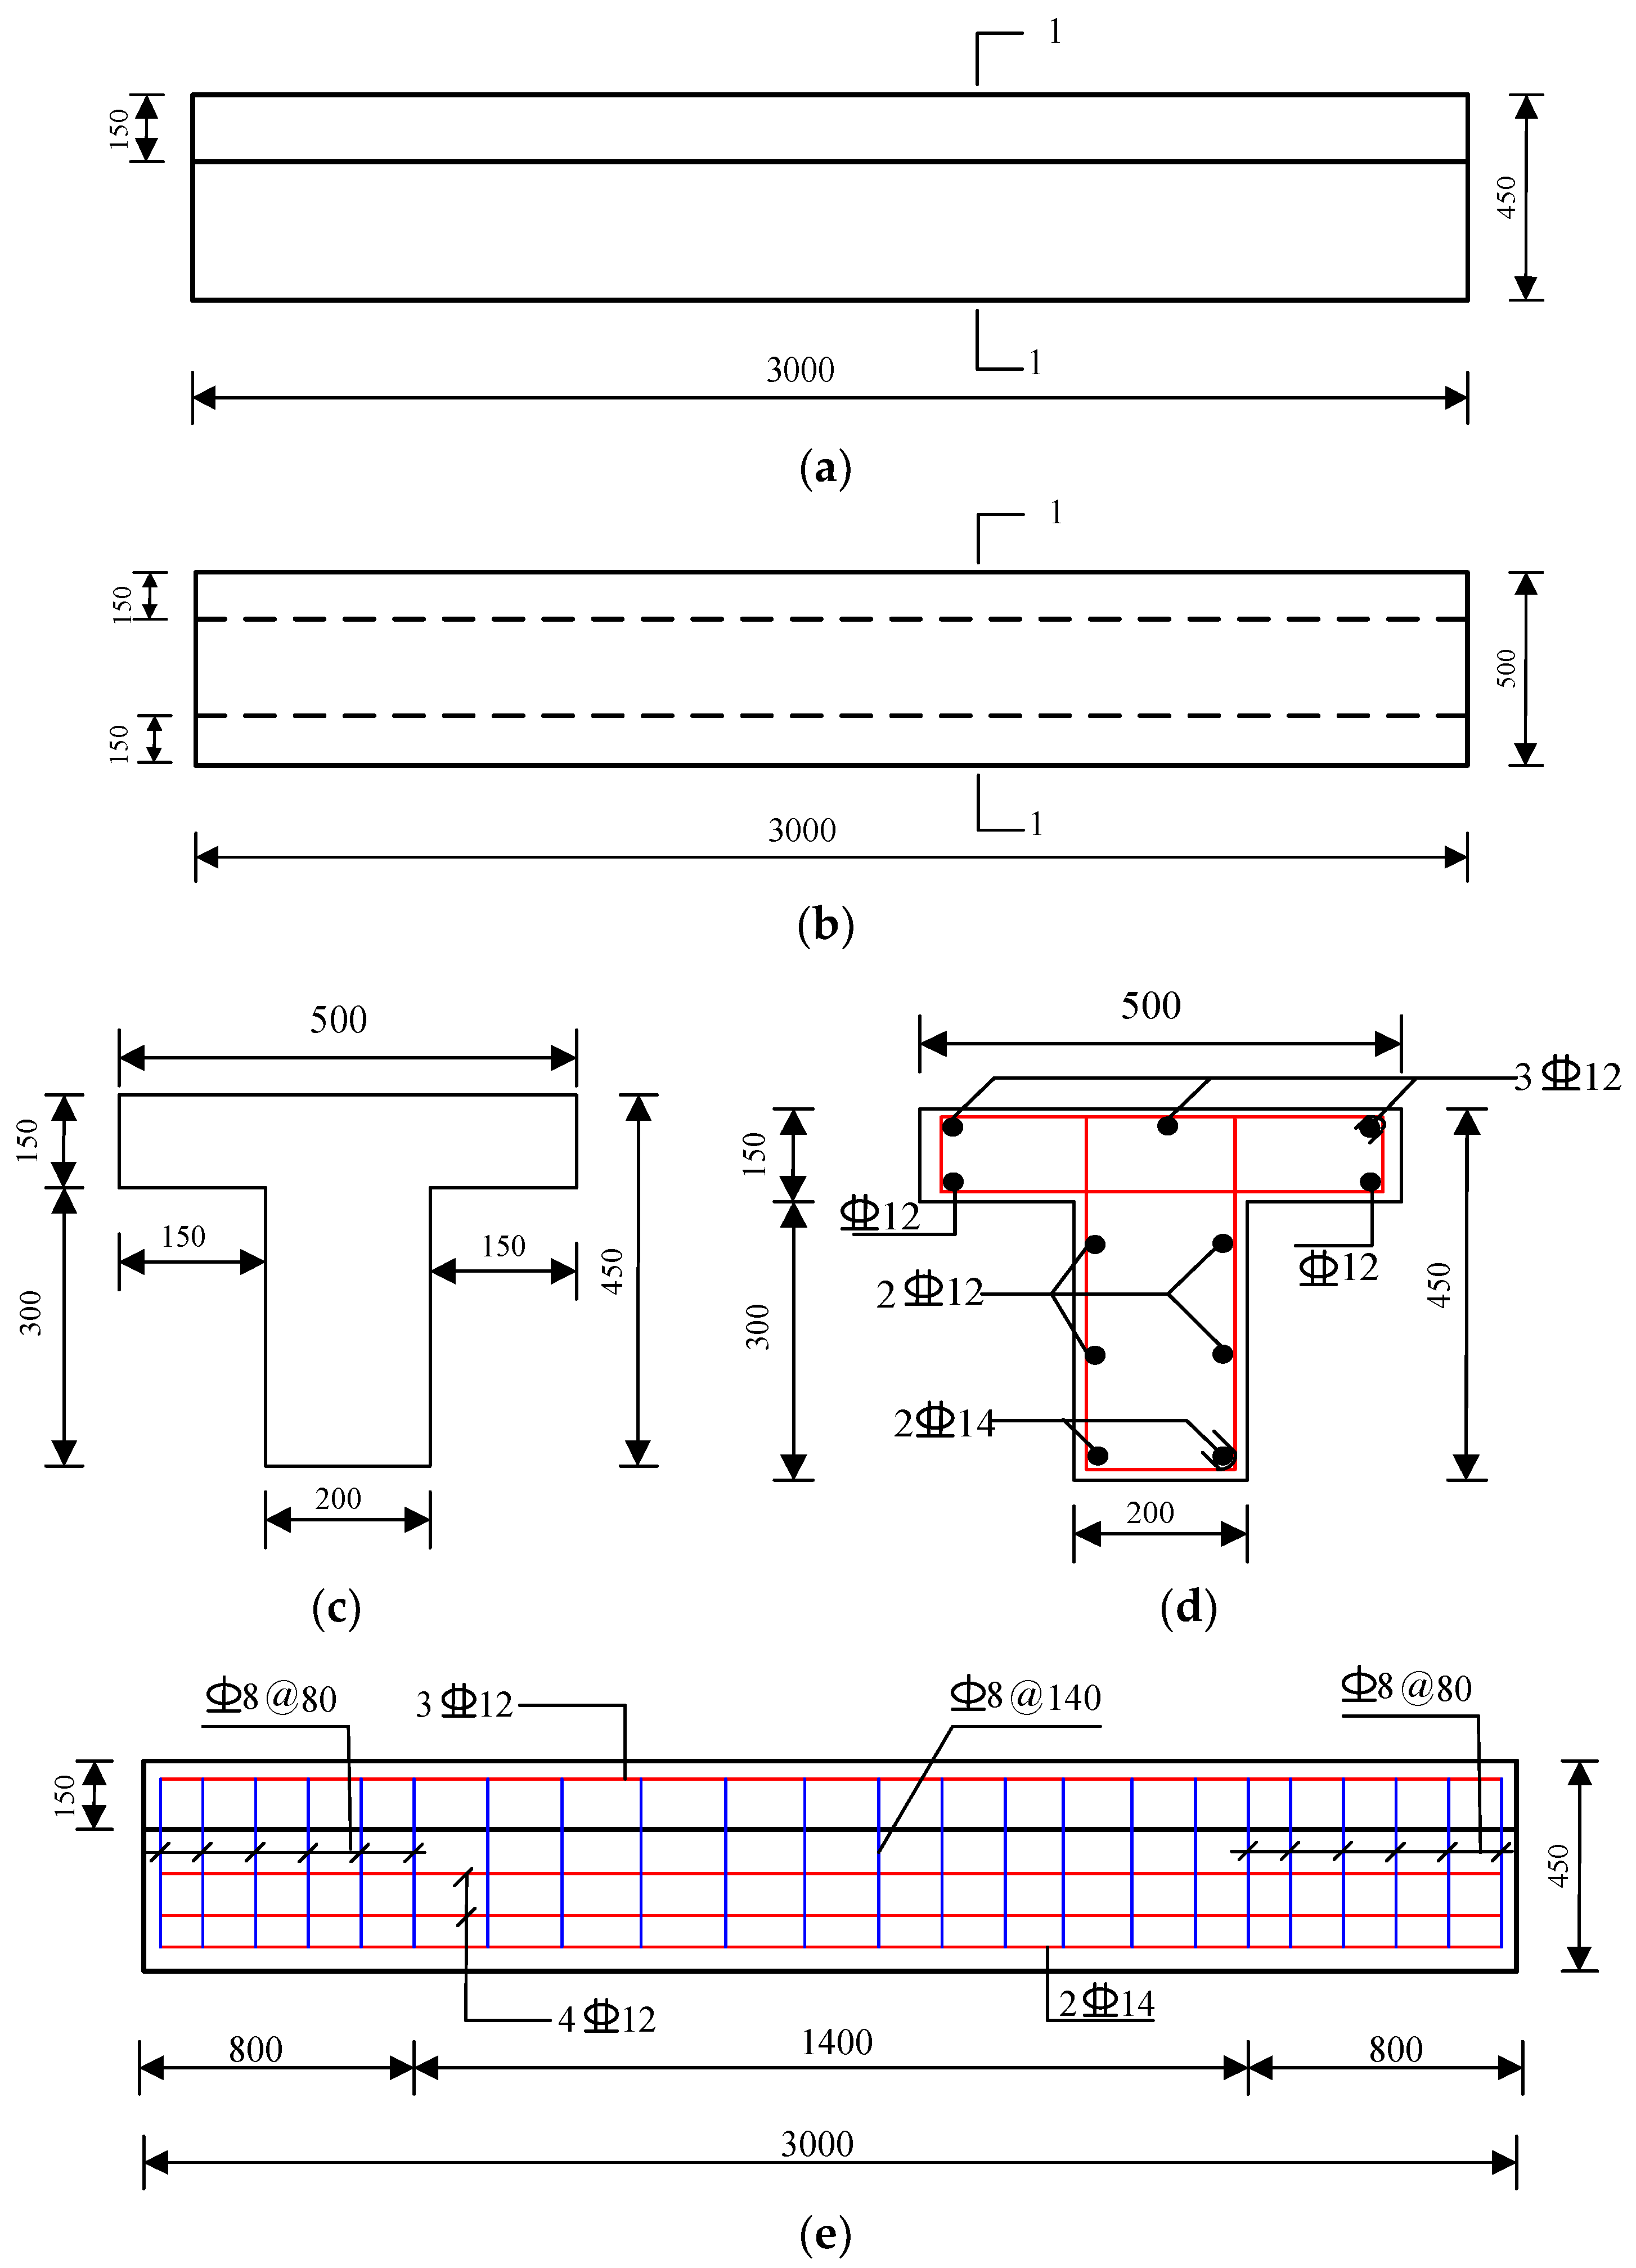
3.1. Design of Reinforced Concrete T-Shape Test Beam
3.2. Corrosion–Fatigue Coupling Test Scheme
- (1)
- Fatigue-loading amplitude
- (2)
- Fatigue loading method
- (3)
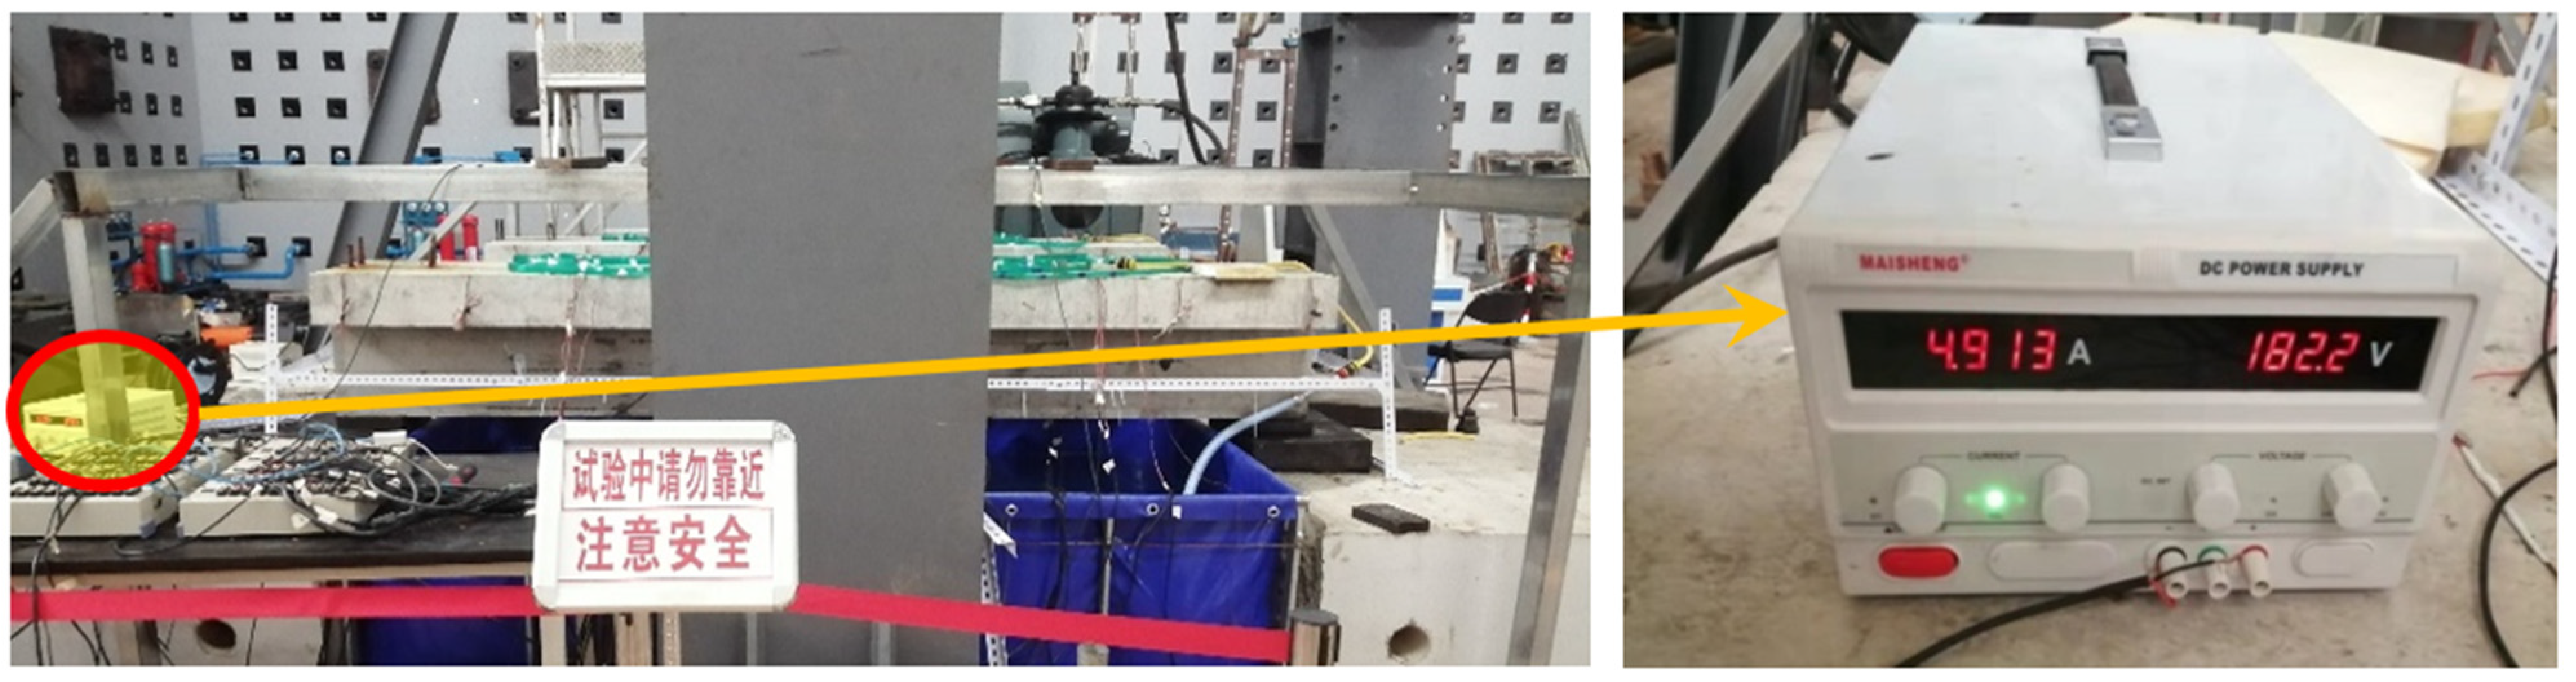
- Current density during accelerated corrosion
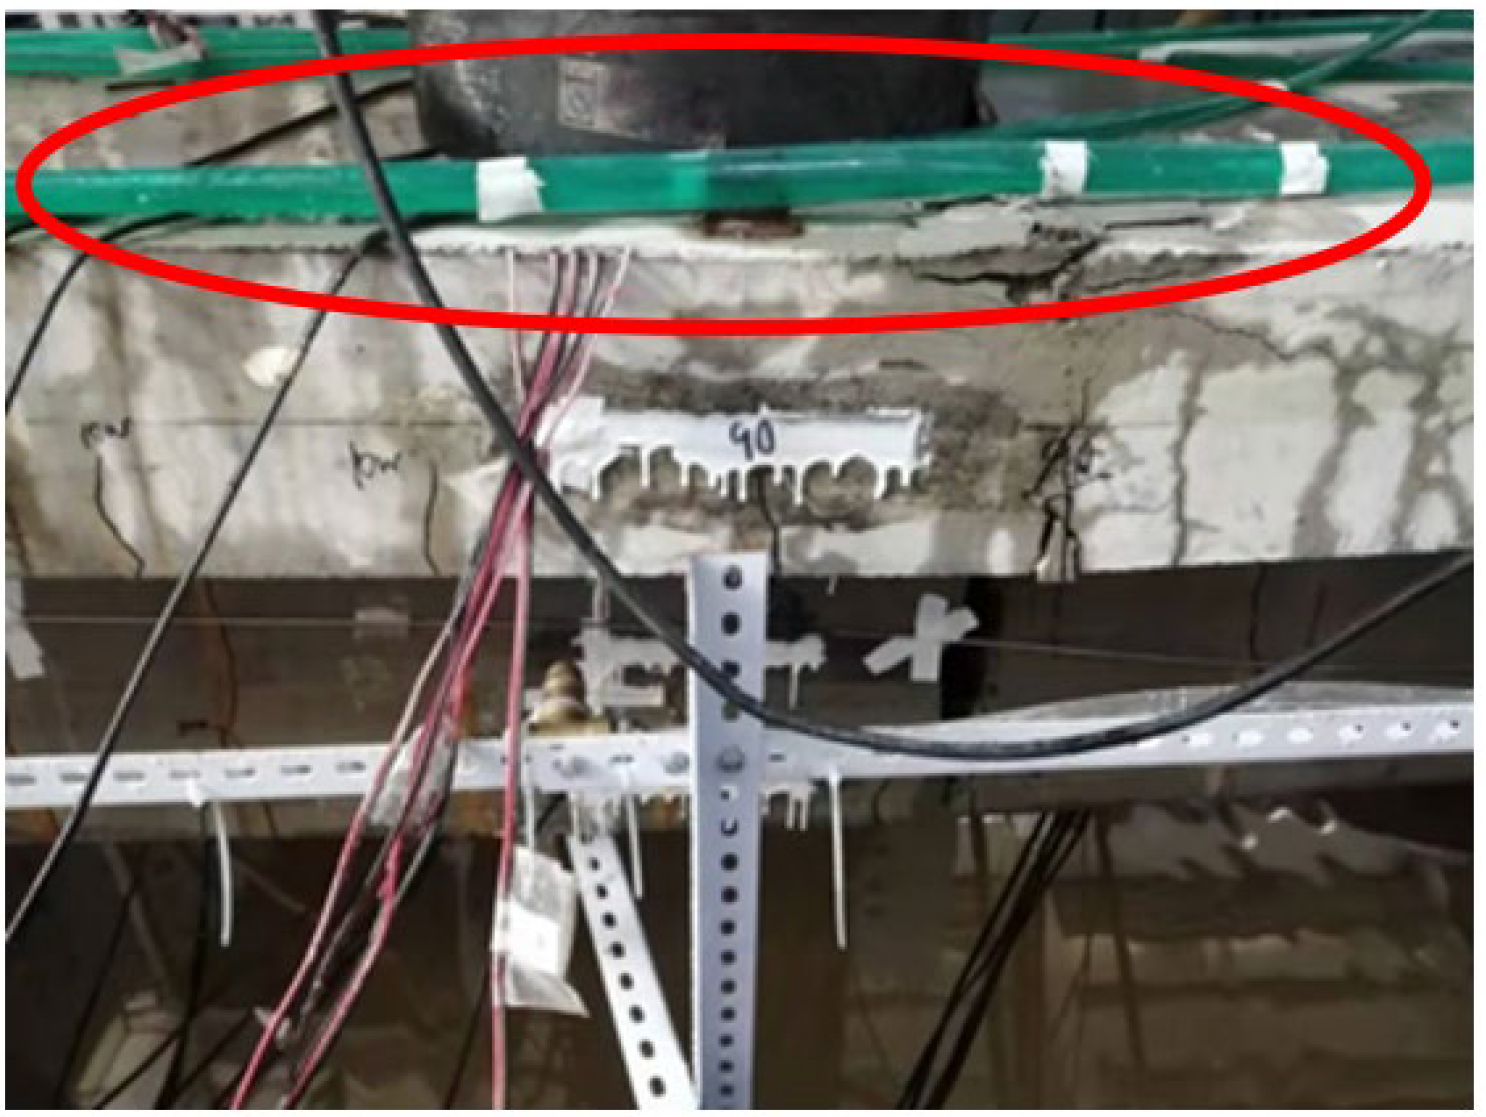
3.3. Description of Test Phenomenon and Test Result Analysis
3.3.1. Description of the Test Phenomenon
3.3.2. Analysis of Fracture Development for Test Beams
- (1)
- Corrosion–fatigue coupling test beams
- a.
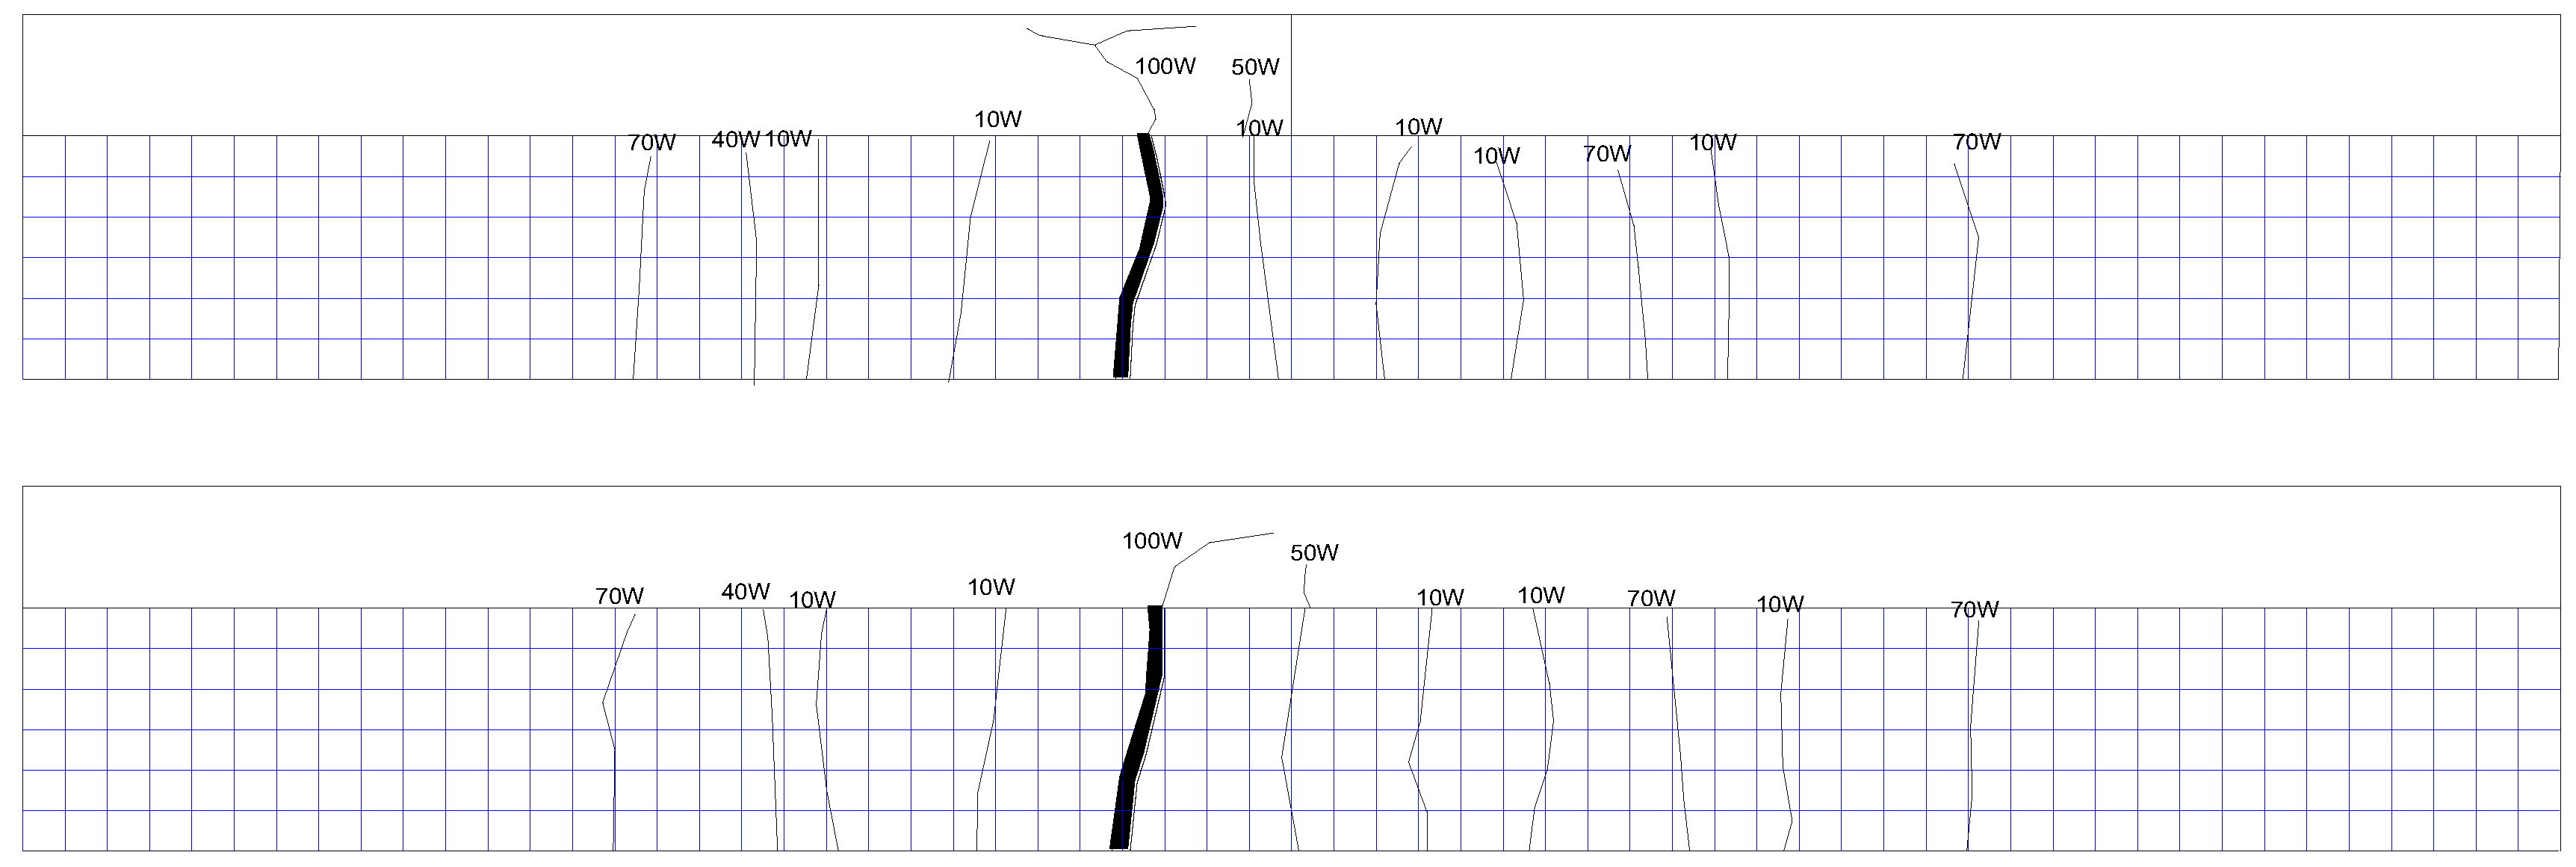
- XP-1 test beam
- b.
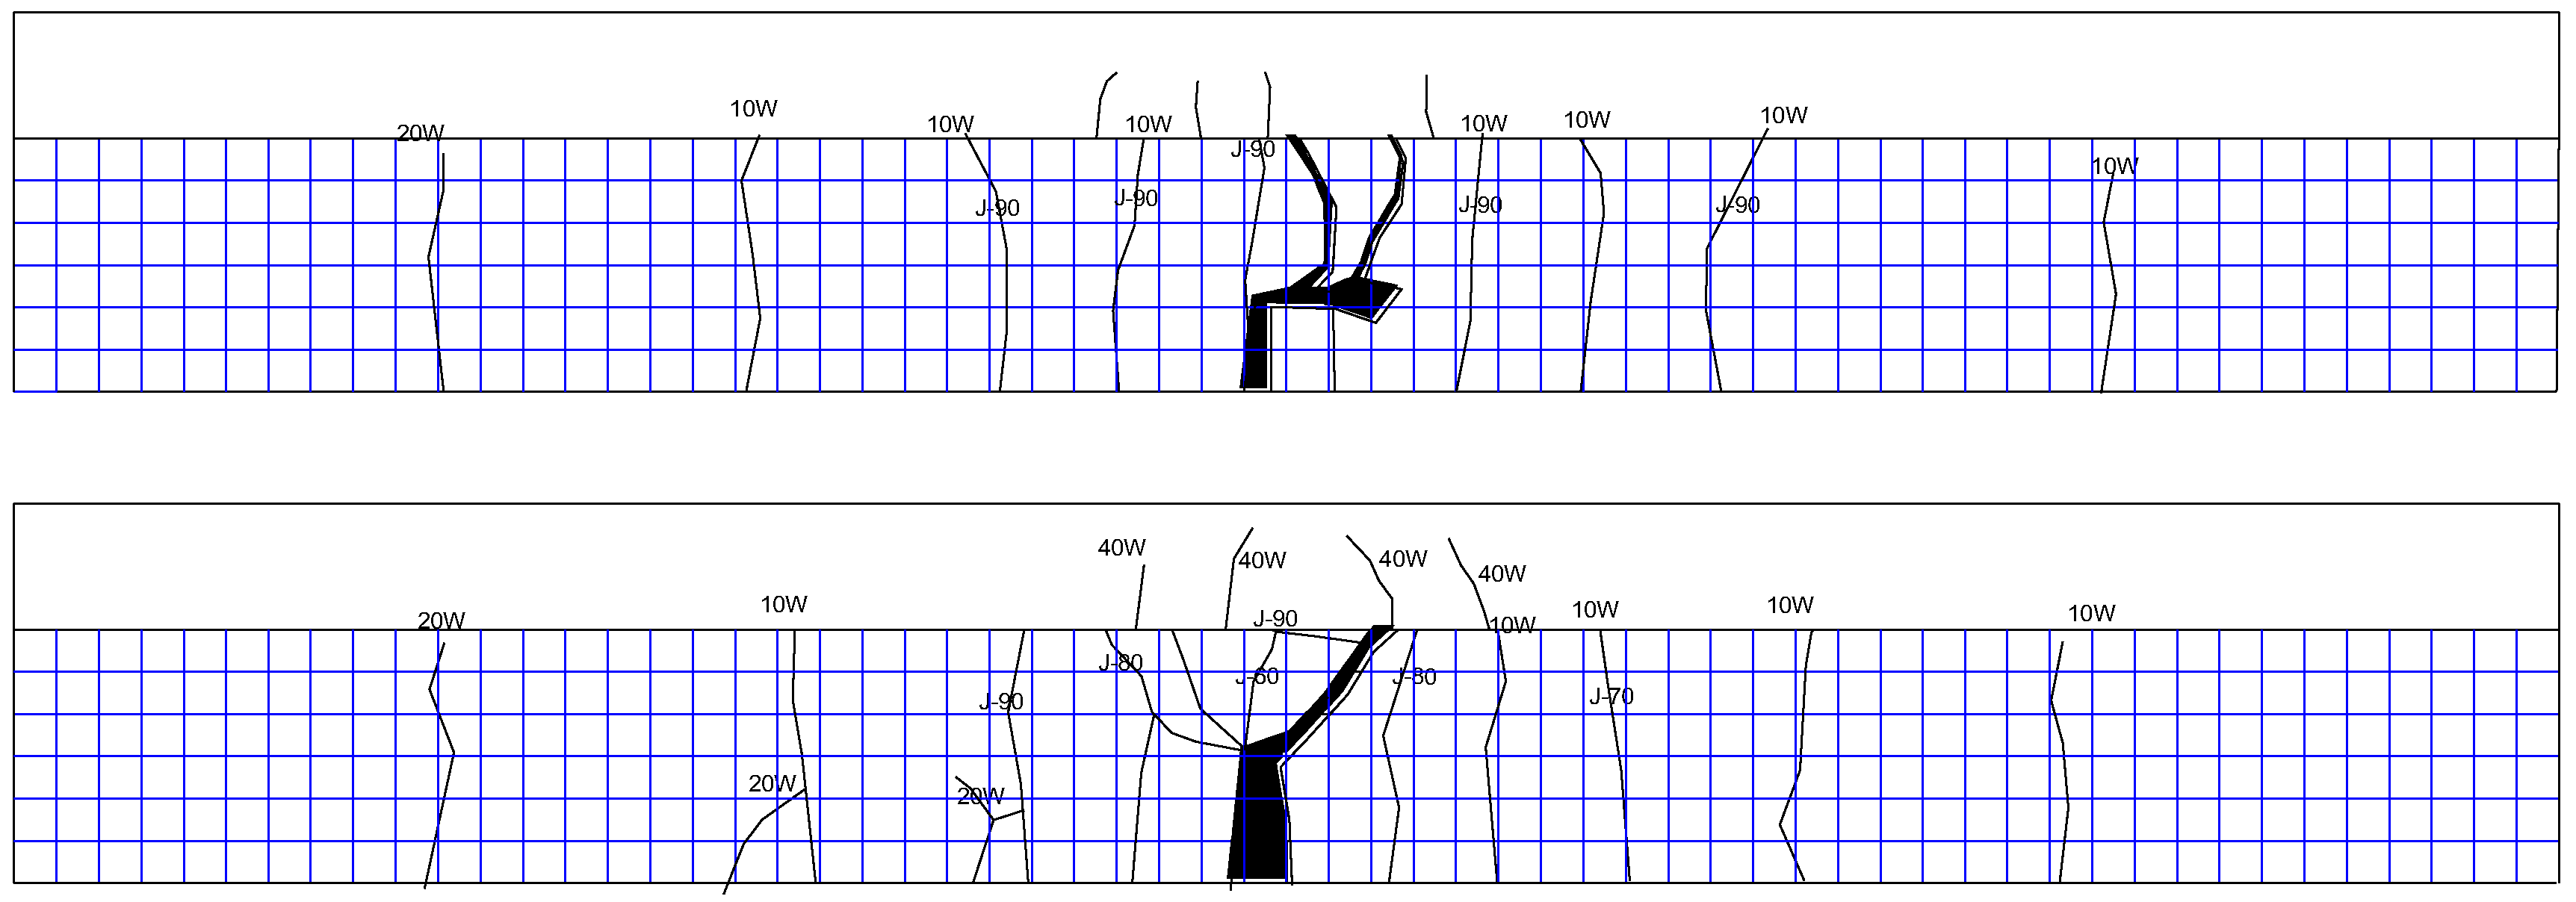
- XP-2 test beam
- c.
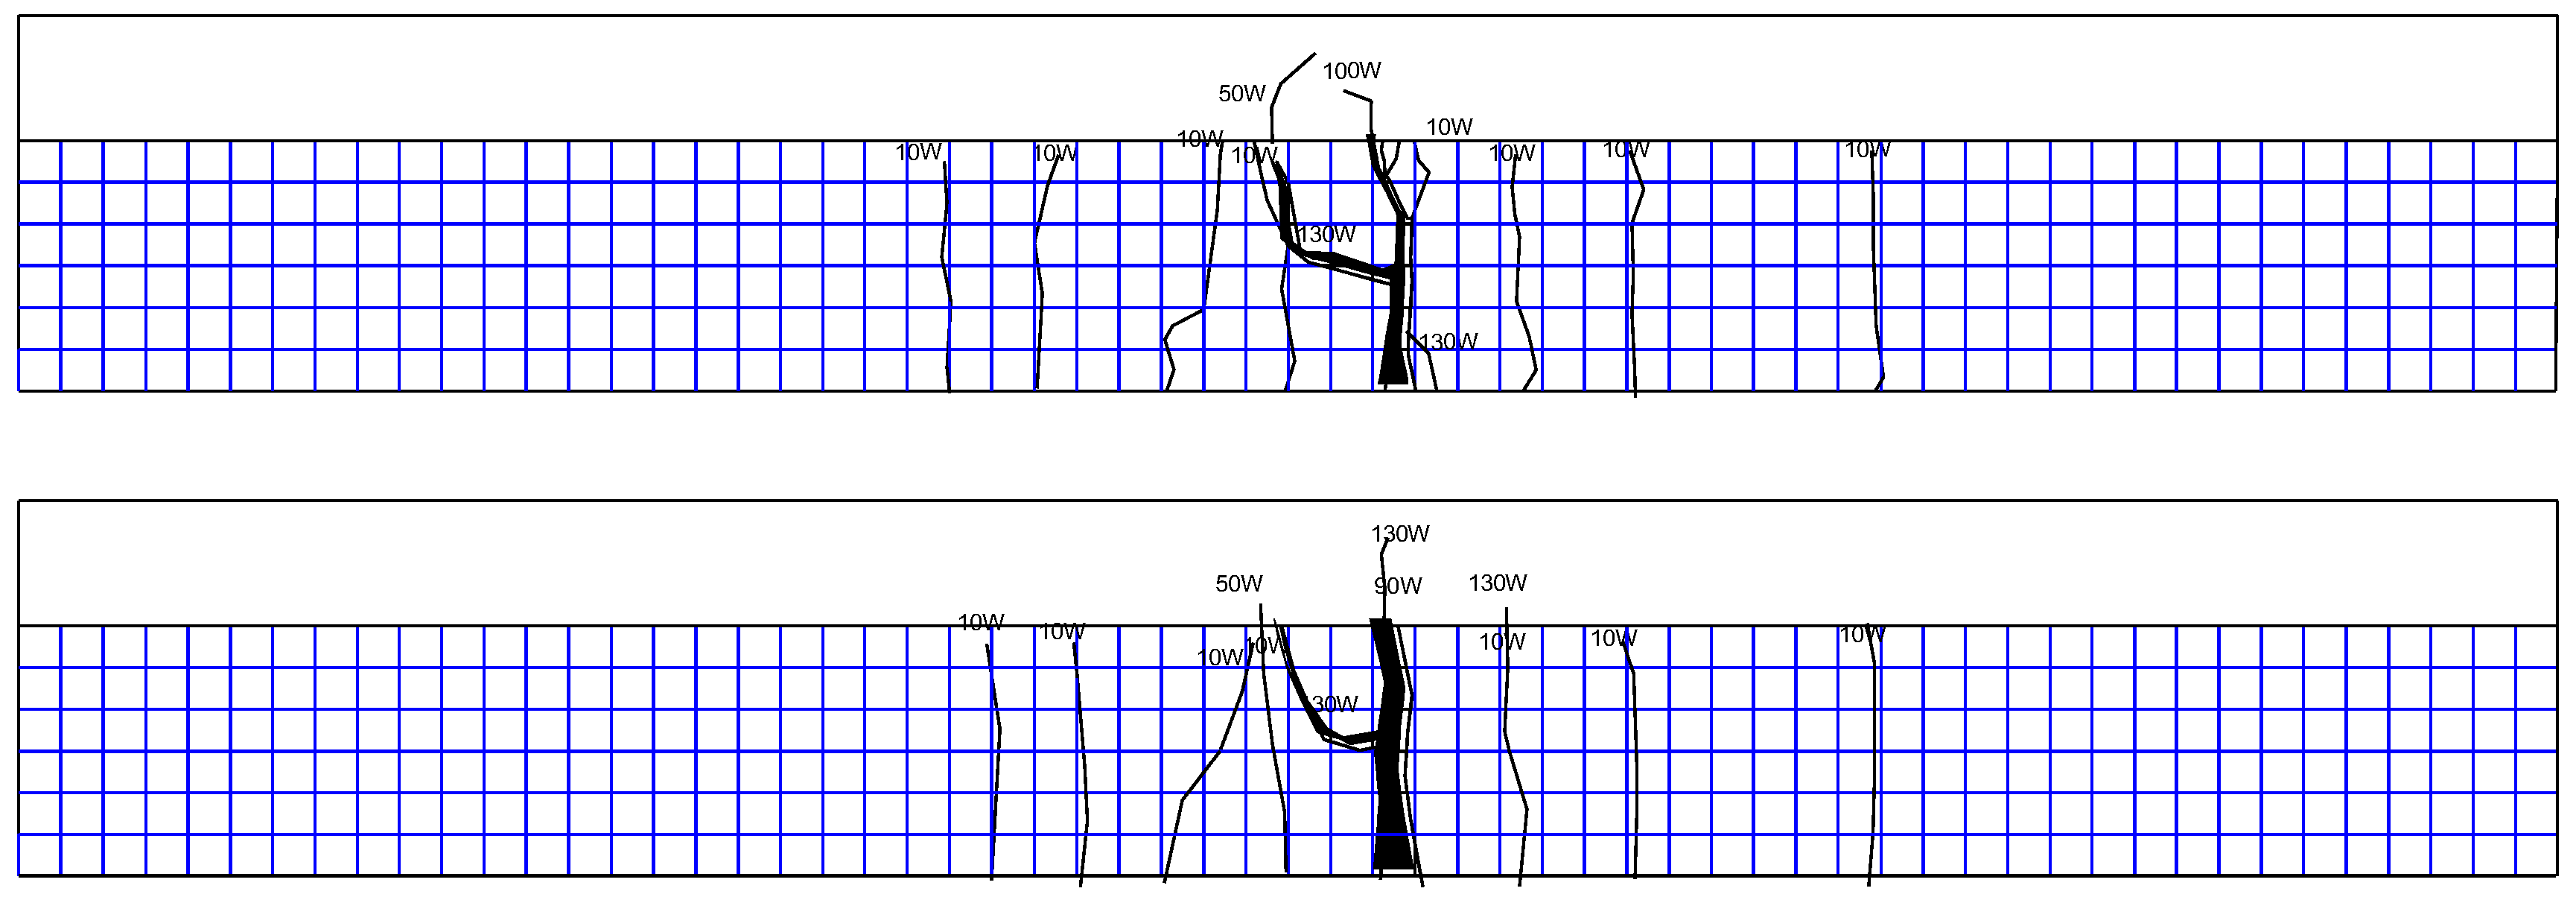
- XP-3 test beam
- (2)
- Simple fatigue test beams
- a.
- P-1 test beam
- b.
- P-2 test beam
- c.
- P-3 test beam
- (3)
- Mechanism analysis of the crack development
3.3.3. Failure Mode Analysis of Test Beams
- (1)
- Failure mode
- (2)
- Mechanism analysis of the interaction between corrosion and fatigue
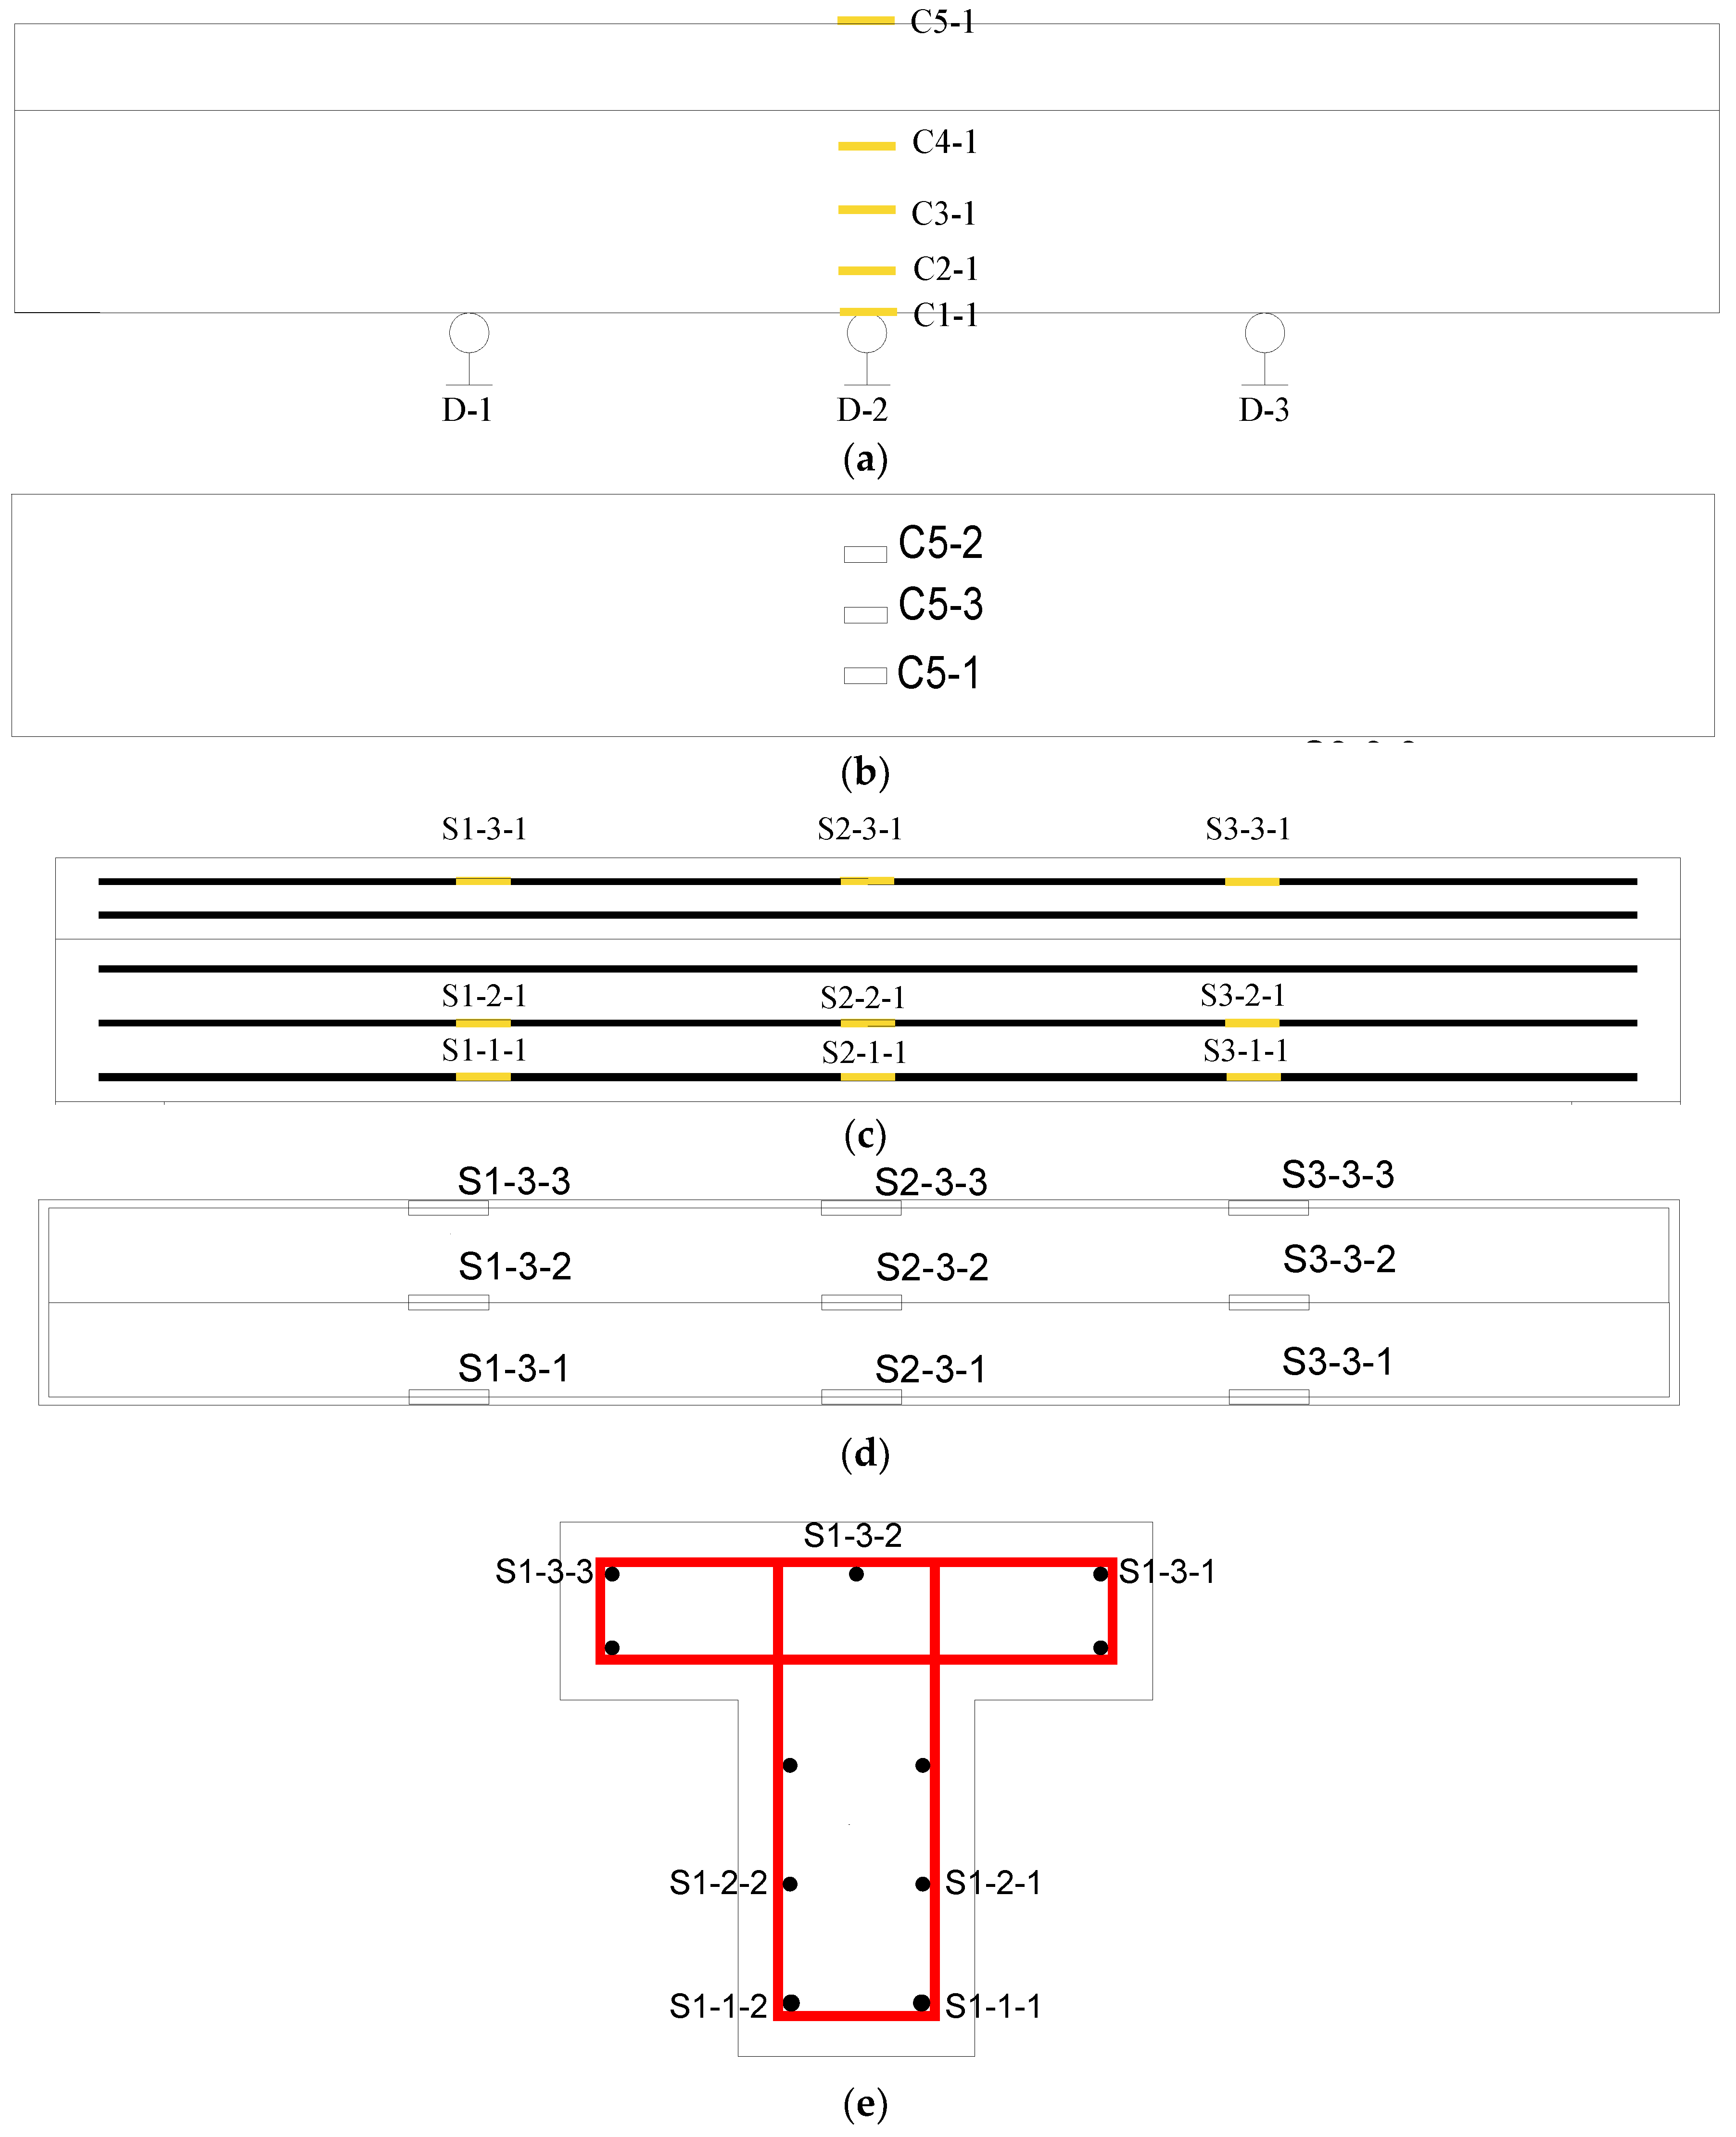
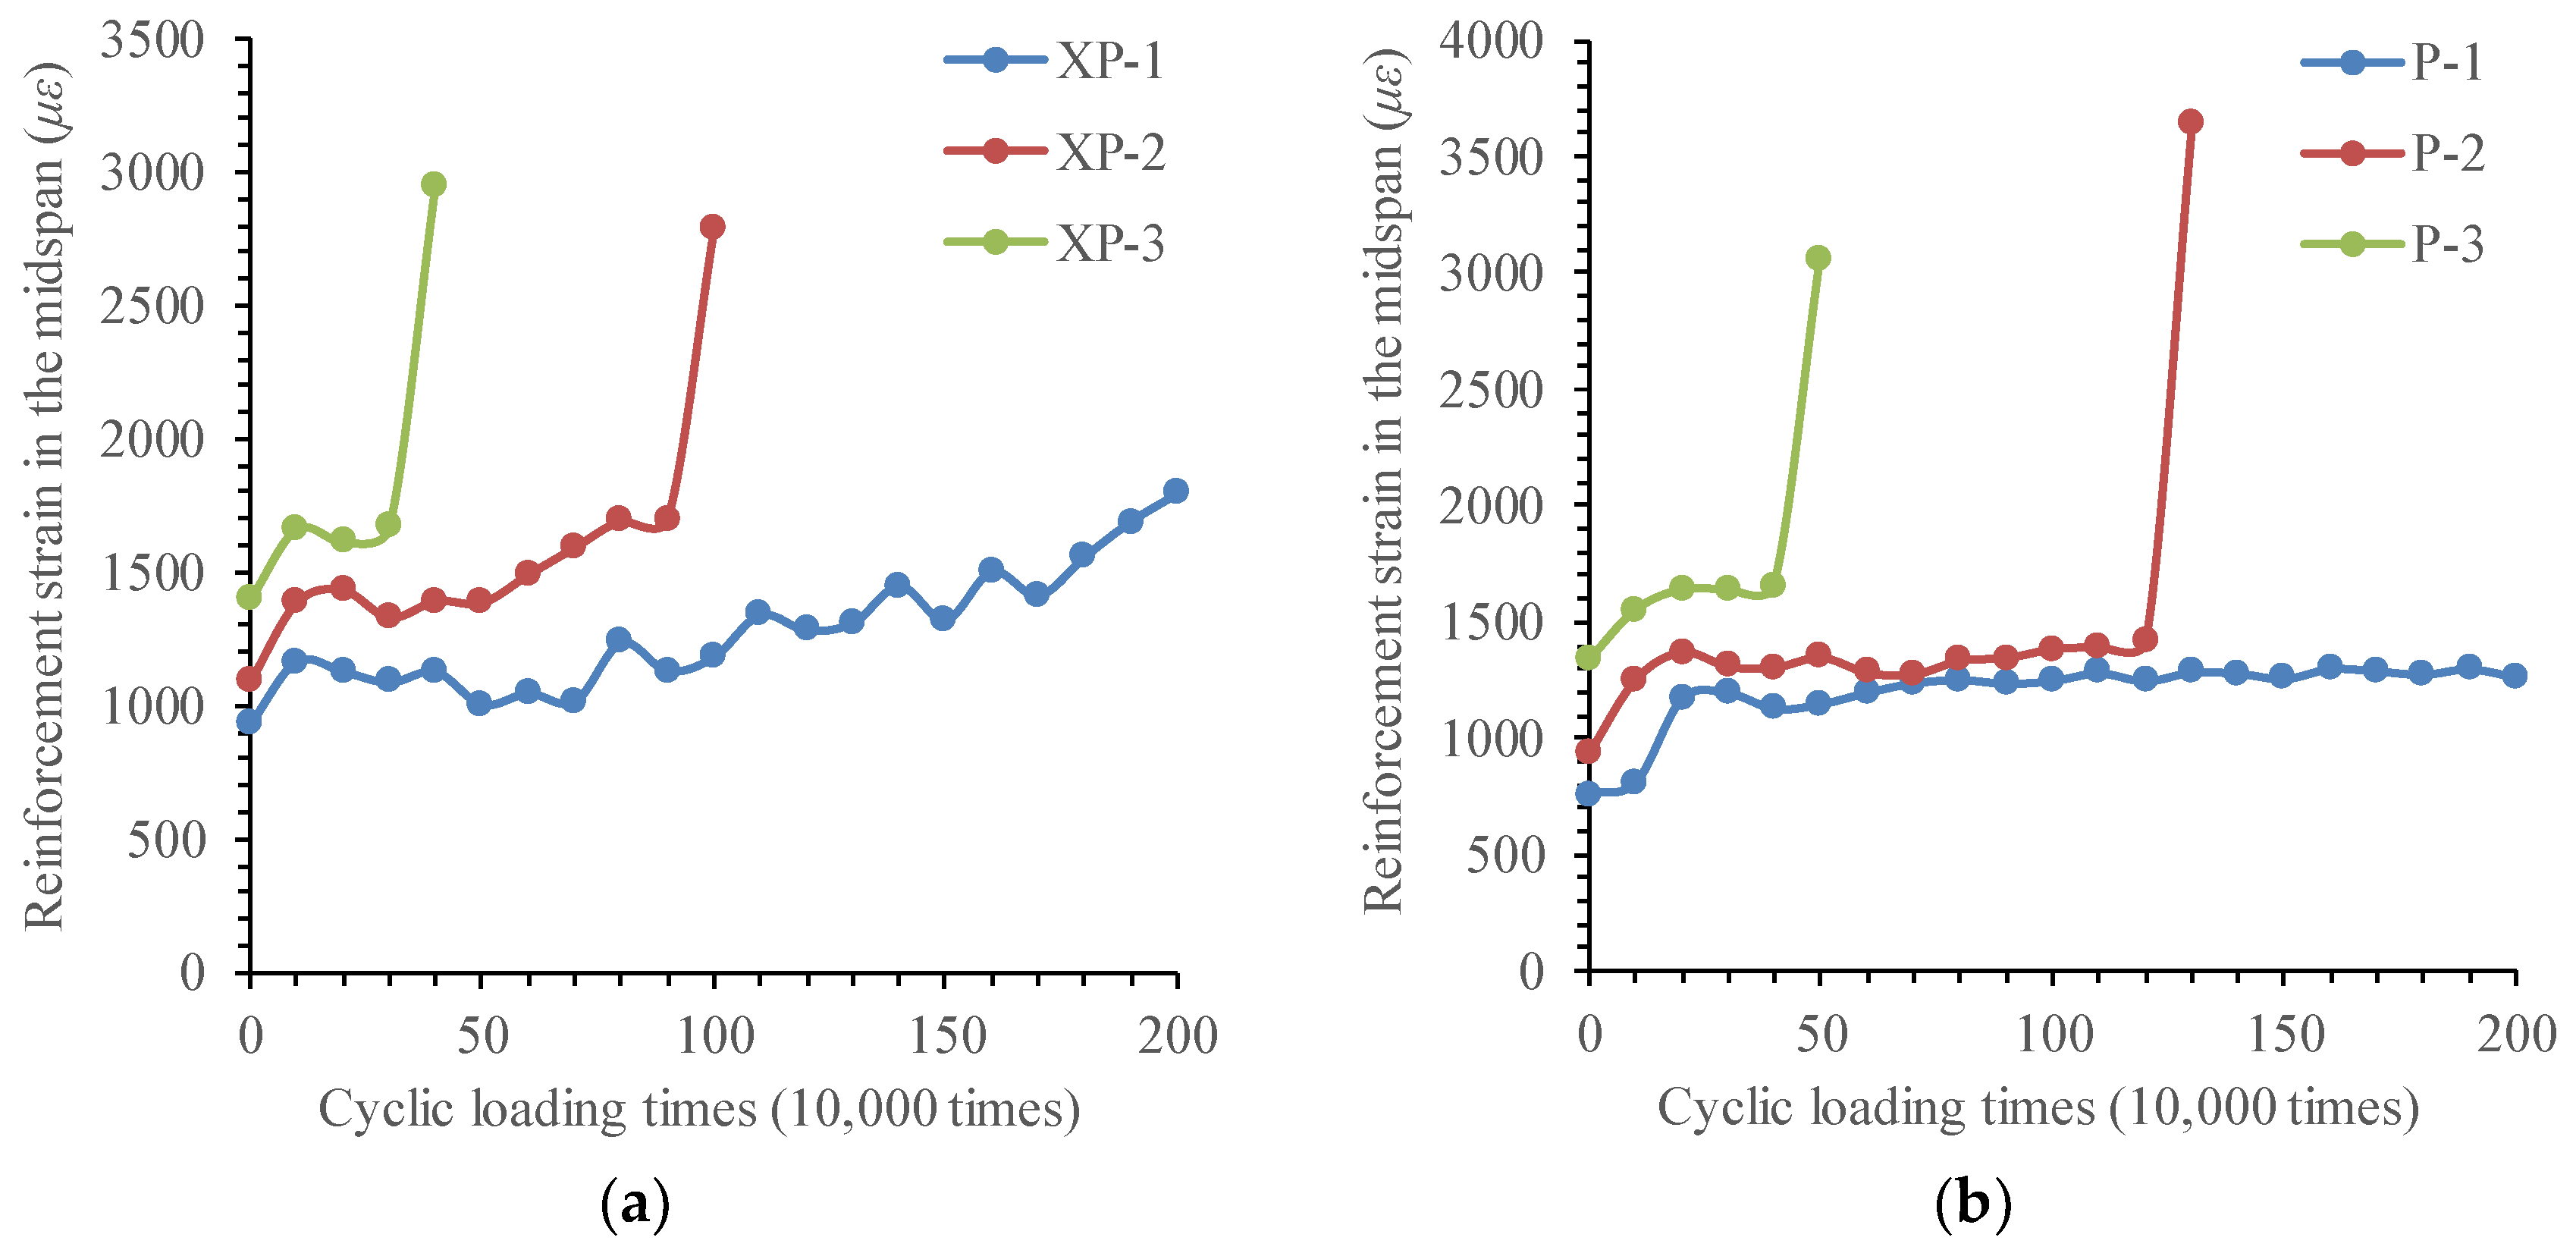
3.3.4. Strain Analysis of Longitudinal Reinforcements
- (1)
- Changing law of longitudinal reinforcement strain in test beams
- (2)
- Mechanism analysis of the reinforcement strain development
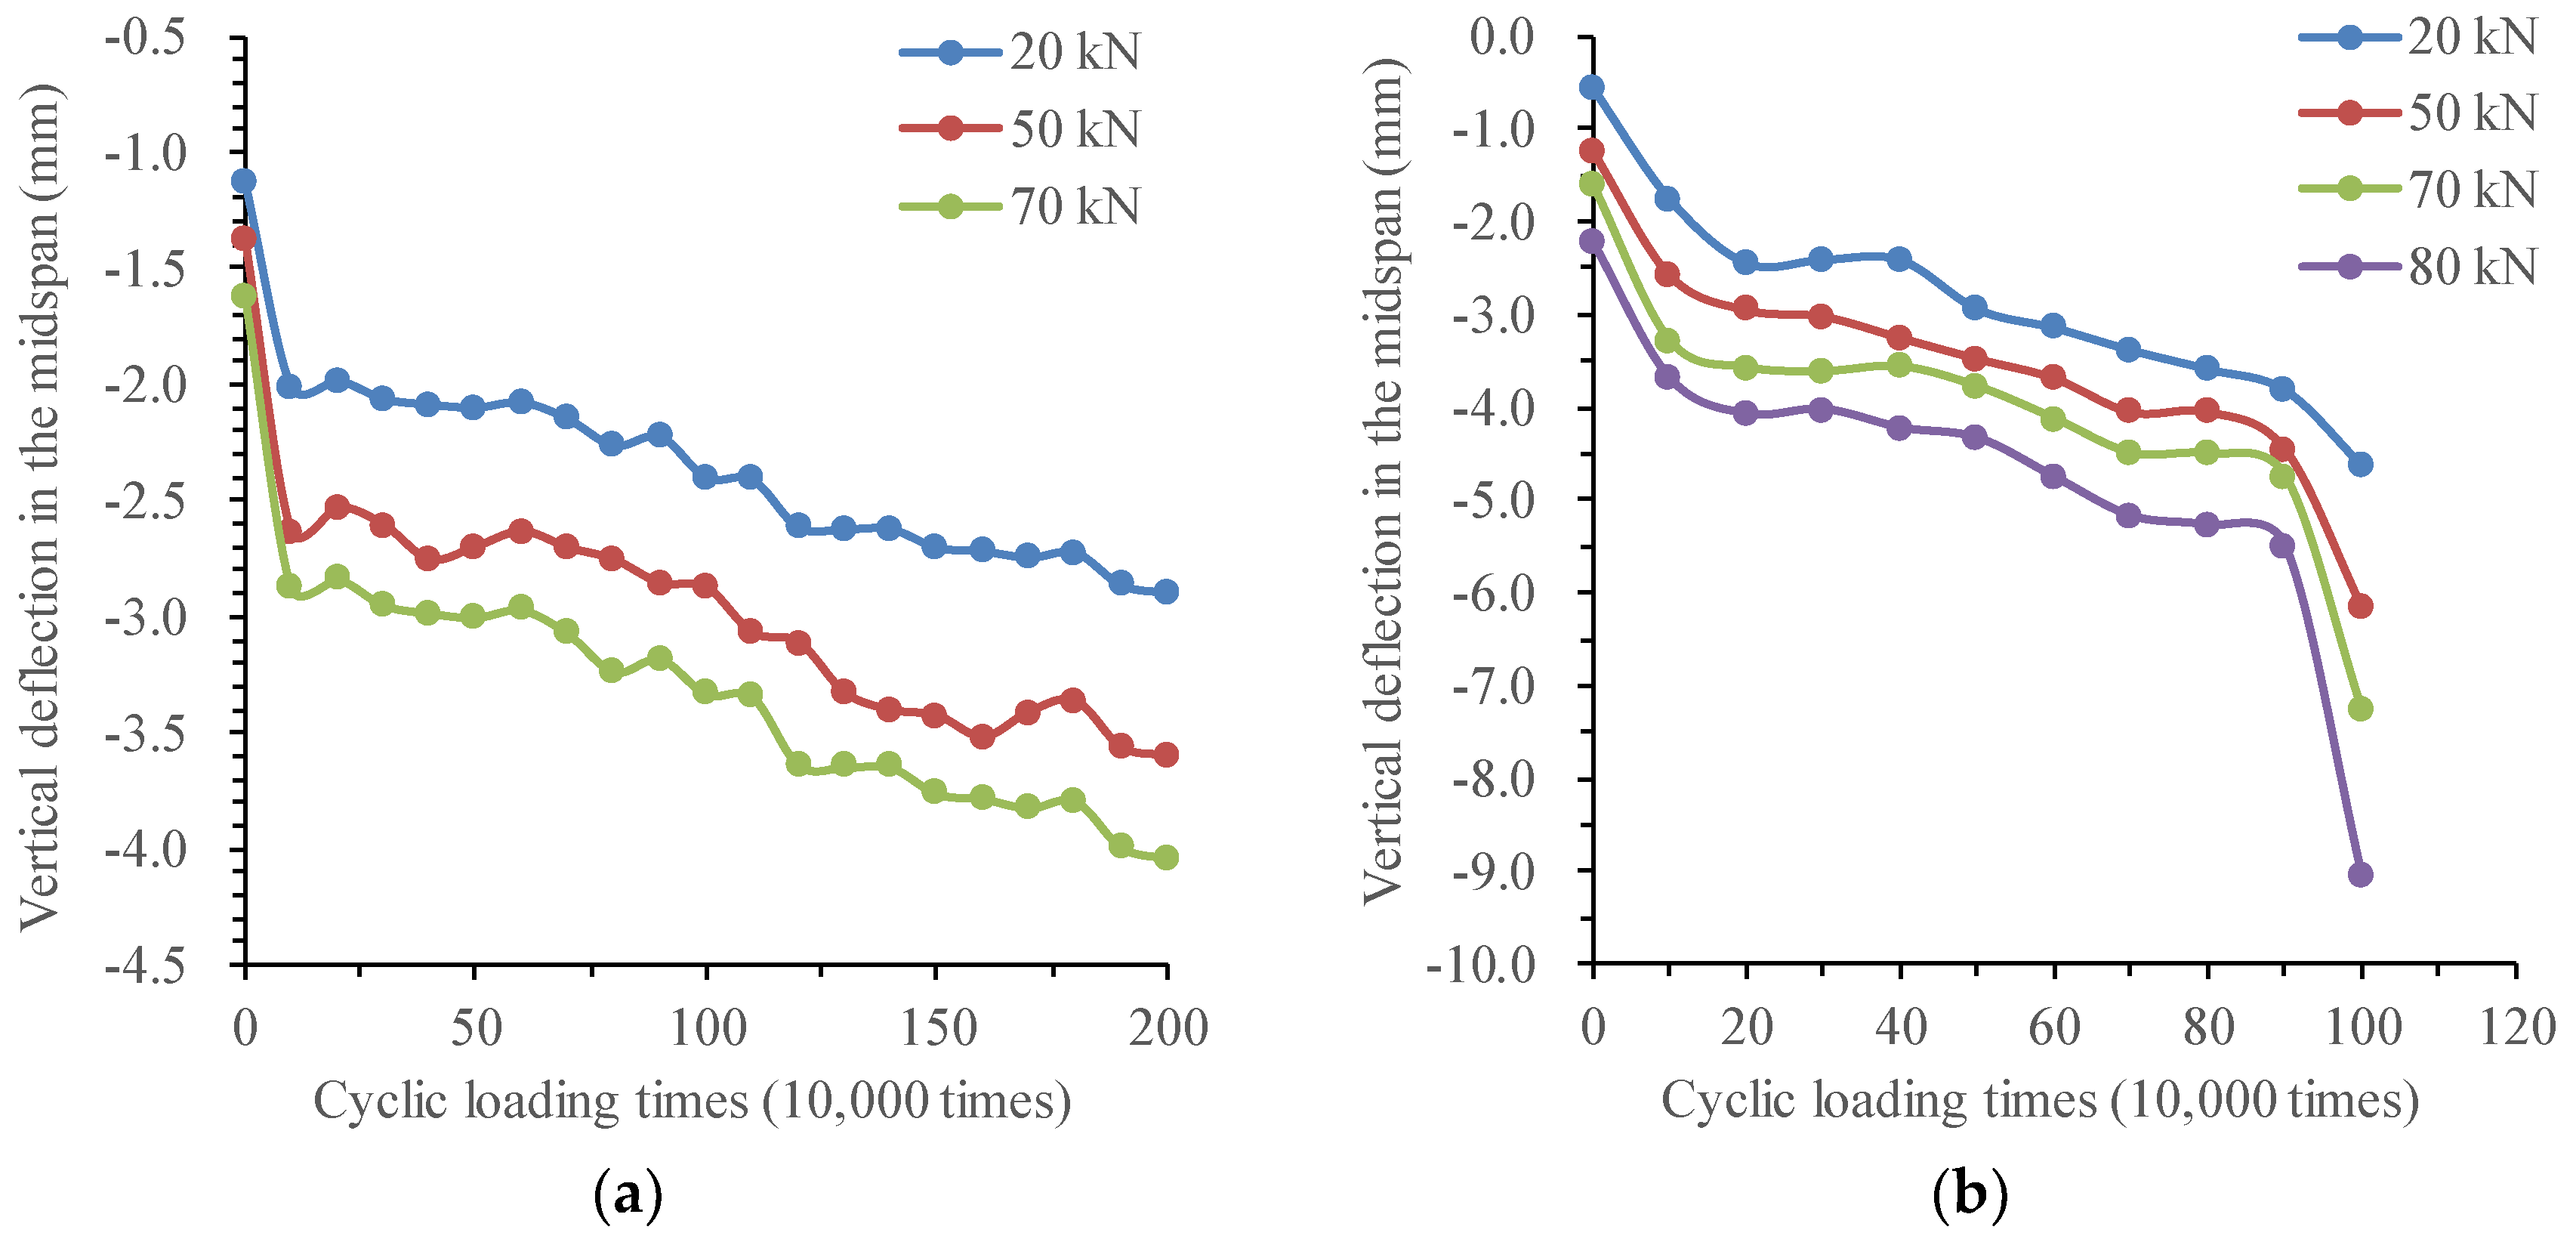
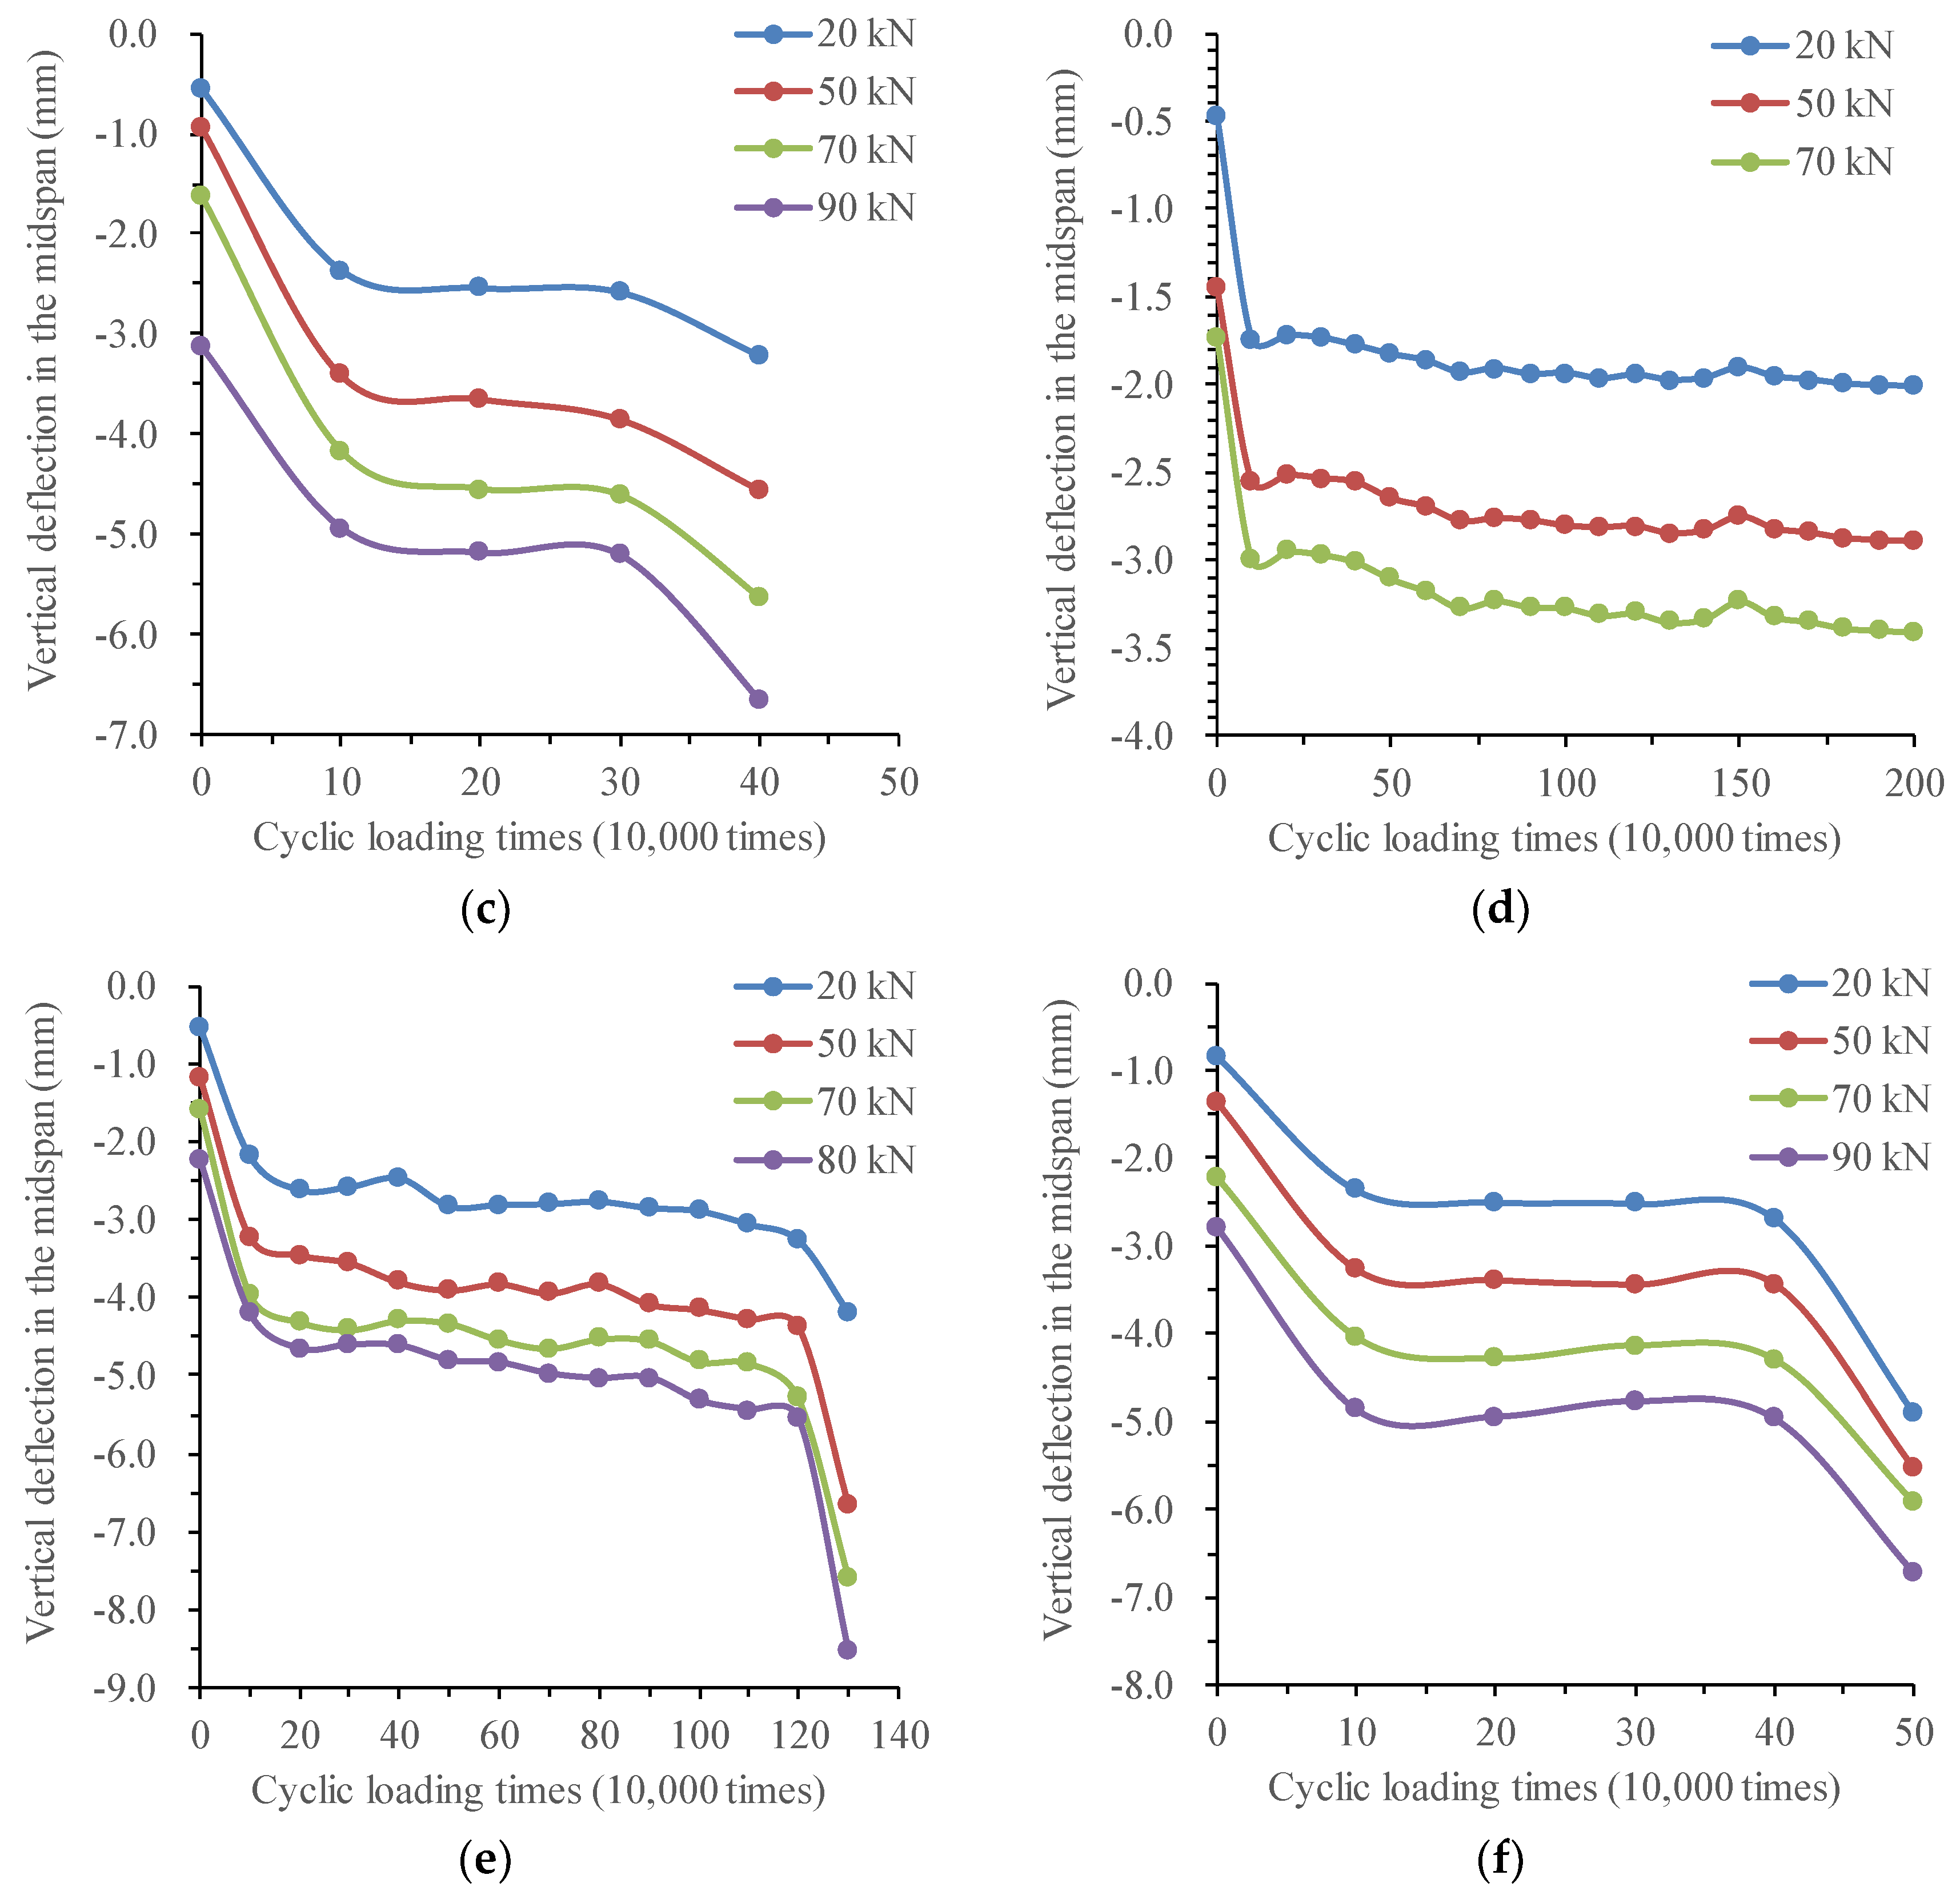
3.3.5. Analysis of Deflection Change and Stiffness Degradation of Test Beams
- (1)
- Changing the law of deflection of test beams
- (2)
- Mechanism analysis of the load-deflection behavior
3.3.6. Fatigue Life Analysis of Test Beams
4. Conclusions
- (1)
- The designed corrosion–fatigue coupled loading device can well realize the joint action of reinforcement corrosion and fatigue loading, which can simulate the corrosion environment and the cyclic loading simultaneously with the cooperation of the spray facilities, the reinforcement accelerated corrosion device, and the loading equipment. Moreover, by observing the corrosion state of the reinforcement of the test beam, the corrosion distribution of the reinforcement presents a “point rust” shape, and the corrosion parts are concentrated in the cracks. The reinforcement at the non-cracks has no obvious corrosion traces, which is close to the corrosion situation of the reinforcement in the natural environment.
- (2)
- For the corrosion–fatigue coupling test beams XP-1, XP-2, and XP-3, the P-1 test beam does not undergo fatigue damage when the loading times reach two million times, while the P-2 and P-3 test beams undergo fatigue damage. The number of cracks in the test beams with fatigue failure is relatively consistent. The number of cracks in the test beams without fatigue failure is significantly higher than that in the test beams with fatigue failure, the cracks are more densely distributed, and the damaged area is larger.
- (3)
- Under the coupling action of corrosion and fatigue, the fatigue failure mode of XP-2 and XP-3 test beams is the fatigue fracture of the main reinforcement during fatigue loading. The reinforcement fracture presents a tear-inclined section shape with an uneven surface and strong grain sense, and the corrosion traces on the surface and the fracture section are serious. However, in the simple fatigue test beams P-2 and P-3, when the fatigue failure occurs, the tensile longitudinal steel bars at the bottom are broken with lamellar tearing. Although the failure mode of the corrosion–fatigue coupled test beam and the simple fatigue test beam are both fatigue failures, the fracture forms and characteristics of the reinforcement are different.
- (4)
- Under the coupling action of corrosion and fatigue, the changes in reinforcement strain and deflection of XP-2 and XP-3 test beams show a three-stage development law similar to those of simple fatigue test beams. However, in the second stage, the reinforcement strain and deflection of simple fatigue test beams are in a stable and small growth stage, and the growth rate is lower than that of the corrosion–fatigue coupling test beam.
- (5)
- Considering the coupling action of corrosion and fatigue, these two factors play a mutual role in promoting the fatigue crack expansion of reinforcements. In short, fatigue loading produces micro-cracks, which form permeation channels for chloride ions, oxygen, and water; accelerate the corrosion of steel bars; reduce the fatigue strength of steel bars; and the corrosion products expand the width of cracks. The whole process forms a vicious circle. At the same load amplitude, the fatigue life of the corrosion–fatigue coupling test beam is significantly reduced compared with that of the simple fatigue test beam.
Author Contributions
Funding
Institutional Review Board Statement
Informed Consent Statement
Data Availability Statement
Conflicts of Interest
References
- Lifeng, X. Study on the Model of Reinforced Concrete Crack under Coupled Interaction between Environment Factors and Loading and Multi-Scale Analysis; Chongqing Jiaotong University: Chongqing, China, 2017. [Google Scholar]
- Yi, W.J.; Kunnath, S.K.; Sun, X.D.; Shi, C.J.; Tang, F.J. Fatigue behavior of reinforced concrete beams with corroded steel reinforcement. ACI Struct. J. 2010, 107, 526–533. [Google Scholar]
- Li, S.; Zhiwei, F.; Jian, H. Experimental and analytical investigation of the fatigue flexural behavior of corroded reinforced concrete beams. Int. J. Concr. Struct. Mater. 2019, 13, 1–14. [Google Scholar]
- Coca, O.C.; Javier, F. Corrosion fatigue of road bridges: A review. Int. J. Electrochem. Sci. 2011, 6, 3438–3451. [Google Scholar]
- Stewart Mark, G. Mechanical behaviour of pitting corrosion of flexural and shear reinforcement and its effect on structural reliability of corroding RC beams. Struct. Saf. 2009, 31, 19–30. [Google Scholar] [CrossRef]
- Wenjun, Z.; François, R. Corrosion of the reinforcement and its influence on the residual structural performance of a 26-year-old corroded RC beam. Constr. Build. Mater. 2014, 51, 461–472. [Google Scholar]
- Lei, W.; Chu, L.; Jin, Y. An experiment study on behavior of corrosion RC beams with different concrete strength. J. Coast. Res. 2015, 73, 259–264. [Google Scholar]
- Zijian, L.; Bo, D.; Xiaoning, Z. Effects of seawater corrosion and freeze-thaw cycles on mechanical properties of fatigue damaged reinforced concrete beams. Adv. Mater. Sci. Eng. 2015, 2015, 536487. [Google Scholar]
- Tondolo, F. Bond behaviour with reinforcement corrosion. Constr. Build. Mater. 2015, 93, 926–932. [Google Scholar] [CrossRef]
- Yaser, M.; Sohrabi, M.R.; Mousavi, S.R. Corrosion effect of the main rebar and stirrups on the bond strength of RC beams. Structures 2021, 32, 1444–1454. [Google Scholar]
- Fumin, L.; Yaxu, Q.; Jianghao, W. Bond life degradation of steel strand and concrete under combined corrosion and fatigue. Eng. Fail. Anal. 2017, 80, 186–196. [Google Scholar]
- Lin, H.; Zhao, Y.; Ožbolt, J.; Hans-Wolf, R. The bond behavior between concrete and corroded steel bar under repeated loading. Eng. Struct. 2017, 140, 390–405. [Google Scholar] [CrossRef]
- Huaishuai, S.; Xin, C. Bond behavior between corroded steel bar and concrete under reciprocating loading history of beam type specimens. Eng. Struct. 2021, 247, 113112. [Google Scholar]
- Yang, L.; Nan, J.; Yang, D. Flexural experiment and stiffness investigation of reinforced concrete beam under chloride penetration and sustained loading. Constr. Build. Mater. 2016, 117, 302–310. [Google Scholar] [CrossRef]
- Hedong, L.; Bo, L.; Ruoyu, J. Effects of sustained loading and corrosion on the performance of reinforced concrete beams. Constr. Build. Mater. 2018, 169, 179–187. [Google Scholar]
- Dawei, Z.; Yu, Z.; Mingshan, F.; Jin, W. Service life prediction of precast concrete structures exposed to chloride environment. Adv. Civ. Eng. 2019, 2019, 3216328. [Google Scholar] [CrossRef]
- Zhu, J.S.; Huang, F.M.; Guo, T.; Song, Y.H. Residual life evaluation of prestressed reinforced concrete highway bridges under coupled corrosion-fatigue actions. Adv. Steel Constr. 2015, 11, 372–382. [Google Scholar]
- Su, X.; Ma, Y.; Wang, L.; Guo, Z.; Zhang, J. Fatigue life prediction for prestressed concrete beams under corrosion deterioration process. Structures 2022, 43, 1704–1715. [Google Scholar] [CrossRef]
- Zhou, H.; Chen, S.; Du, Y.; Lin, Z.; Liang, X.; Liu, J.; Xing, F. Field test of a reinforced concrete bridge under marine environmental corrosion. Eng. Fail. Anal. 2020, 115, 104669. [Google Scholar] [CrossRef]
- Bastidas-Arteaga, E.; Bressolette, P.; Chateauneuf, A.; Sánchez-Silva, M. Probabilistic lifetime assessment of RC structures under coupled corrosion-fatigue deterioration processes. Struct. Saf. 2009, 31, 84–96. [Google Scholar] [CrossRef]
- Luca, G.; Mancini, G.; Tondolo, F. Reinforced concrete members subjected to cyclic tension and corrosion. J. Adv. Concr. Technol. 2011, 9, 277–285. [Google Scholar]
- Ma, Y.; Xiang, Y.; Wang, L.; Zhang, J.; Liu, Y. Fatigue life prediction for aging RC beams considering corrosive environments. Eng. Struct. 2014, 79, 211–221. [Google Scholar] [CrossRef]
- Canbin, Y.; Fang, Y. Study on fatigue performance of concrete highway bridge under corrosive environment. Chem. Eng. Trans. 2016, 55, 373–378. [Google Scholar]
- Zhang, W.; Ye, Z.; Gu, X.; Liu, X.; Li, S. Assessment of fatigue life for corroded reinforced concrete beams under uniaxial bending. J. Struct. Eng. 2017, 143, 04017048. [Google Scholar] [CrossRef]
- Lu, Y.; Tang, W.; Li, S.; Tang, M. Effects of simultaneous fatigue loading and corrosion on the behavior of reinforced beams. Constr. Build. Mater. 2018, 181, 85–93. [Google Scholar] [CrossRef]
- Verma, M.; Mishra, S.S. Coupled fatigue-corrosion life estimation of reinforced concrete beam: Numerical versus experimental approach. Struct. Concr. 2019, 20, 2194–2205. [Google Scholar] [CrossRef]
- Wang, H.; He, S.; Yin, X.; Cao, Z. Experimental study on fatigue performance of reinforced concrete beams in corrosive environment with cyclic loads. Struct. Durab. Health Monit. 2020, 14, 95–108. [Google Scholar] [CrossRef]
- Yafei, M.; Honghe, Q.; Xiaochao, S. Experimental study on performance degradation of reinforced concrete beams under coupled effect of corrosion and fatigue. Exp. Mech. 2020, 35, 472–478. [Google Scholar]
- Song, L.; Cui, C.; Liu, J.; Yu, Z.; Jiang, L. Corrosion-fatigue life assessment of RC plate girder in heavy-haul railway under combined carbonation and train loads. Int. J. Fatigue 2021, 151, 106368. [Google Scholar] [CrossRef]
- Wu, J.; Xu, J.; Diao, B.; Jin, L.; Du, X. Fatigue life prediction for the reinforced concrete (RC) beams under the actions of chloride attack and fatigue. Eng. Struct. 2021, 242, 112543. [Google Scholar] [CrossRef]
- Weipeng, F.; Anel, T.; Shazim, A.M. Methods of accelerating chloride-induced corrosion in steel-reinforced concrete: A comparative review. Constr. Mater. 2021, 289, 123165. [Google Scholar] [CrossRef]
- Yingshu, Y.; Yongsheng, J.; Shah, S.P. Comparison of two accelerated corrosion techniques for concrete structures. ACI Struct. J. 2007, 104, 344–347. [Google Scholar] [CrossRef]
- Chunqing, L. Initiation of chloride-induced reinforcement corrosion in concrete structural members-experimentation. ACI Struct. J. 2001, 98, 502–510. [Google Scholar]
- JTG D60-2015; General Specifications for Design of Highway Bridges and Culverts. China Communications Press: Beijing, China, 2015.
- Junqiang, W. Experiment study and analysis on the mechanical properties of corroded reinforcements in the atmospheric environment. J. Xuzhou Inst. Archit. Technol. 2003, 3, 25–27. [Google Scholar]
- Peng, Z.; Pei, L.; Zhonglu, C. Corrosion rate calculation of steel bar applied by anodic current in concrete. China Harb. Eng. 2018, 38, 22–25. [Google Scholar]
- Zhang, W.P.; Wang, X.G.; Gu, X.L.; Shang, D.F. Comparative study on structural performance of reinforced concrete beams subjected to natural corrosion and accelerated corrosion. J. Southeast Univ. 2006, S2, 139–144. [Google Scholar]
- Weiliang, J.; Qianxi, W.; Jianghong, M. Experiential study on the effect of hydrogen-induced plasticity decrease and control in the process of electrochemical repair of reinforced concrete. Ocean. Eng. 2017, 35, 88–94. [Google Scholar]
- Qiang, L.; Changyu, Z.; Wenlong, H. Mathematic model of corrosion-fatigue crack growth rate under consideration of frequency altering. J. Nanjing Univ. Chem. Technol. 2000, 22, 32–36. [Google Scholar]


| Number of Test Beams | Lower Limit of Fatigue Load/kN | Upper Limit of Fatigue Load/kN | Stress Amplitude/MPa |
|---|---|---|---|
| XP-1 | 20 | 70 | 163 |
| XP-2 | 80 | 211 | |
| XP-3 | 90 | 235 | |
| P-1 | 20 | 70 | 163 |
| P-2 | 80 | 211 | |
| P-3 | 90 | 235 |
| Item | Loading Times | Test Phenomenon |
|---|---|---|
| Corrosion–fatigue coupling tests | From 1 to 100,000 times | The existing cracks slowly expand, and a small number of new cracks still appear on the beam body, and a small amount of rust liquid seeps out on the surface. |
| 100,000 times | Most of the cracks in the test beam body have been generated. The cracks open and close repeatedly with the load, and the height of most cracks reaches the lower end of the flange. | |
| Fatigue failure | Its wet area is basically covered by rust when the XP-2 and XP-3 test beams have fatigue failure, but the XP-1 test beam did not have fatigue failure when it was loaded to 2 million cycles. | |
| Simple fatigue tests | From 1 to 100,000 times | The development of the cracks is similar to the coupling test beams. They are typical bending cracks, and there are basically no inclined cracks. |
| 100,000 times | The development of the cracks is similar to the coupling test beams, but the width of the new cracks is relatively small, and most of them are closed when unloaded to the lower limit of the load. | |
| After 100,000 times | The P-1 test beam did not undergo fatigue failure when it was loaded to 2 million cycles, then the test beam was statically loaded to failure, with yield load of 160 kN and ultimate load of 252 kN. | |
| Fatigue failure | Both P-2 and P-3 test beams have fatigue failure before two million cycles, which is mainly manifested as brittle failure of bottom reinforcements. |
| No. of Test Beams | Loading Stage | Fracture Development Law | No. of Test Beams | Loading Stage | Fracture Development Law |
|---|---|---|---|---|---|
| XP-1 | Loaded to about 60 kN | The beam body gives a cracking “creaking” sound, and cracks appear in the midspan. | P-1 | Loaded to about 68 kN | The beam body is cracked, and cracks appear on both sides of the mid-span of the test beam. There are two cracks in total. |
| Loading 100,000 times | The number of cracks increases from 3 under static load to 5 under fatigue load. After the load is removed, the cracks in the mid-span are visible to the naked eye. | Loading 100,000 times | The cracks of the test beam are almost all generated, with a total of 6 cracks. The cracks that appear during static load further develop and eventually extend below the flange. | ||
| Loading 1.2 million times | New cracks appear at both sides near the midspan at both ends of the test beam. | Loading 400,000 times | All the cracks have extended below the flange. Up to 2 million times of fatigue loading, no new cracks are generated in P-1 test beam. | ||
| Loading 1.5 million times | The inclined crack appeared at one end of the test beam, and the average width of the inclined crack was 0.4 mm. | Loading 2 million times | The width of cracks in the midspan is 0.05 mm, and the average width of previous cracks on both sides of the midspan is 0.1 mm. The test beam has no fatigue failure. | ||
| Loading 2 million times | The test beam has no fatigue failure. | ||||
| XP-2 | Loaded to about 60 kN | It is the same as XP-1 test beam. When the load is up to the upper limit of fatigue load 80 kN, there are 4 cracks in total, most of which extend vertically along the beam height. | P-2 | Loaded to about 55 kN | The beam body is cracked, and cracks appear on both sides of the midspan of the test beam. There are five cracks in total when the static load is up to the upper limit of fatigue. |
| Loading 400,000 times | The crack continues to develop, and new cracks appear at both ends of the test beam. | Loading 100,000 times | The cracks are basically all generated, with a total of 8 cracks. The cracks that appear during static load further develop and finally extend below the flange. | ||
| Loading 500,000 times | Cracks begin to appear at the flange. | Loading 500,000 times | The crack height on both sides of the midspan increases. | ||
| Loading 1 million times | The main cracks have been extended and widened, and a small part of the concrete has fallen off. | Loading 900,000 times | The flange began to crack. | ||
| Loading 1.01 million times | The fatigue failure occurs. | Loading 1.3 million times | Many secondary cracks have been generated around the midspan cracks. | ||
| Loading 1.38 million times | The fatigue failure finally occurs. | ||||
| XP-3 | Loaded to about 60 kN | It is the same as XP-1 and XP-2 test beams. When the load is up to the upper limit of fatigue load 90 kN, there are 5 cracks in total, and they are typical bending cracks. | P-3 | Loaded to about 65 kN | The beam body is cracked, and the cracks appear first in the middle span of the test beam, then cracks appear successively on both sides of the midspan. There are seven cracks in total. |
| Loading 200,000 times | The crack continues to develop, and two auxiliary cracks appear near the two sides of the main crack, and new cracks appear at 0.5 m from the beam end. | Loading 100,000 times | The cracks are basically all generated, with a total of 9 cracks. | ||
| Loading 300,000 times | Cracks appear on the flange, and some rust is found. | Loading 300,000 times | The flange of P-3 test beam is cracked. | ||
| Loading 400,000 times | The crack on the flange develops into a branch shape, and the width of the main crack in the midspan increases. | Loading 500,000 times | The crack at the flange develops into branch-like shape, and the width of the main crack in the mid-span increase. | ||
| Loading 430,000 times | The fatigue failure occurs. | Loading 530,000 times | The fatigue failure occurs. |
| Item | Failure Mode |
|---|---|
| Corrosion–fatigue coupling test beams |
|
| Simple fatigue test beams |
|
| No. of Test Beams | Longitudinal Reinforcement Strain |
|---|---|
| XP-1 |
|
| XP-2 and XP-3 |
|
| P-1 |
|
| P-2 and P-3 |
|
| No. of Test Beams | Changing Law of Midspan Deflection |
|---|---|
| XP-1 |
|
| XP-2 and XP-3 |
|
| P-1 |
|
| P-2 and P-3 |
|
| No. of Test Beams | XP-1 | XP-2 | XP-3 |
|---|---|---|---|
| Deflection difference in/mm | 1.16 | 1.80 | 0.27 |
| Increase percentage of deflection | 39.8% | 48.64% | 6.6% |
| No. of Test Beams | Upper Limit of Fatigue Load/kN | Fatigue Life/Ten Thousand Times |
|---|---|---|
| P-1 | 70 kN | >200 |
| XP-1 | >200 | |
| P-2 | 80 kN | 138.2 |
| XP-2 | 101 | |
| P-3 | 90 kN | 53.1 |
| XP-3 | 43.5 |
Disclaimer/Publisher’s Note: The statements, opinions and data contained in all publications are solely those of the individual author(s) and contributor(s) and not of MDPI and/or the editor(s). MDPI and/or the editor(s) disclaim responsibility for any injury to people or property resulting from any ideas, methods, instructions or products referred to in the content. |
© 2023 by the authors. Licensee MDPI, Basel, Switzerland. This article is an open access article distributed under the terms and conditions of the Creative Commons Attribution (CC BY) license (https://creativecommons.org/licenses/by/4.0/).
Share and Cite
Zhang, T.; Zhang, X.; Li, P.; Li, H.; Li, X.; Zou, Y. Experimental Research on Fatigue Performance of Reinforced Concrete T-Shaped Beams under Corrosion–Fatigue Coupling Action. Materials 2023, 16, 1257. https://doi.org/10.3390/ma16031257
Zhang T, Zhang X, Li P, Li H, Li X, Zou Y. Experimental Research on Fatigue Performance of Reinforced Concrete T-Shaped Beams under Corrosion–Fatigue Coupling Action. Materials. 2023; 16(3):1257. https://doi.org/10.3390/ma16031257
Chicago/Turabian StyleZhang, Tian, Xuefan Zhang, Pengfei Li, Haijiang Li, Xiaofei Li, and Yunfeng Zou. 2023. "Experimental Research on Fatigue Performance of Reinforced Concrete T-Shaped Beams under Corrosion–Fatigue Coupling Action" Materials 16, no. 3: 1257. https://doi.org/10.3390/ma16031257
APA StyleZhang, T., Zhang, X., Li, P., Li, H., Li, X., & Zou, Y. (2023). Experimental Research on Fatigue Performance of Reinforced Concrete T-Shaped Beams under Corrosion–Fatigue Coupling Action. Materials, 16(3), 1257. https://doi.org/10.3390/ma16031257