
An Anisotropic Peridynamic Model for Simulating Crack Propagation in Isotropic and Anisotropic Rocks


Abstract
:1. Introduction
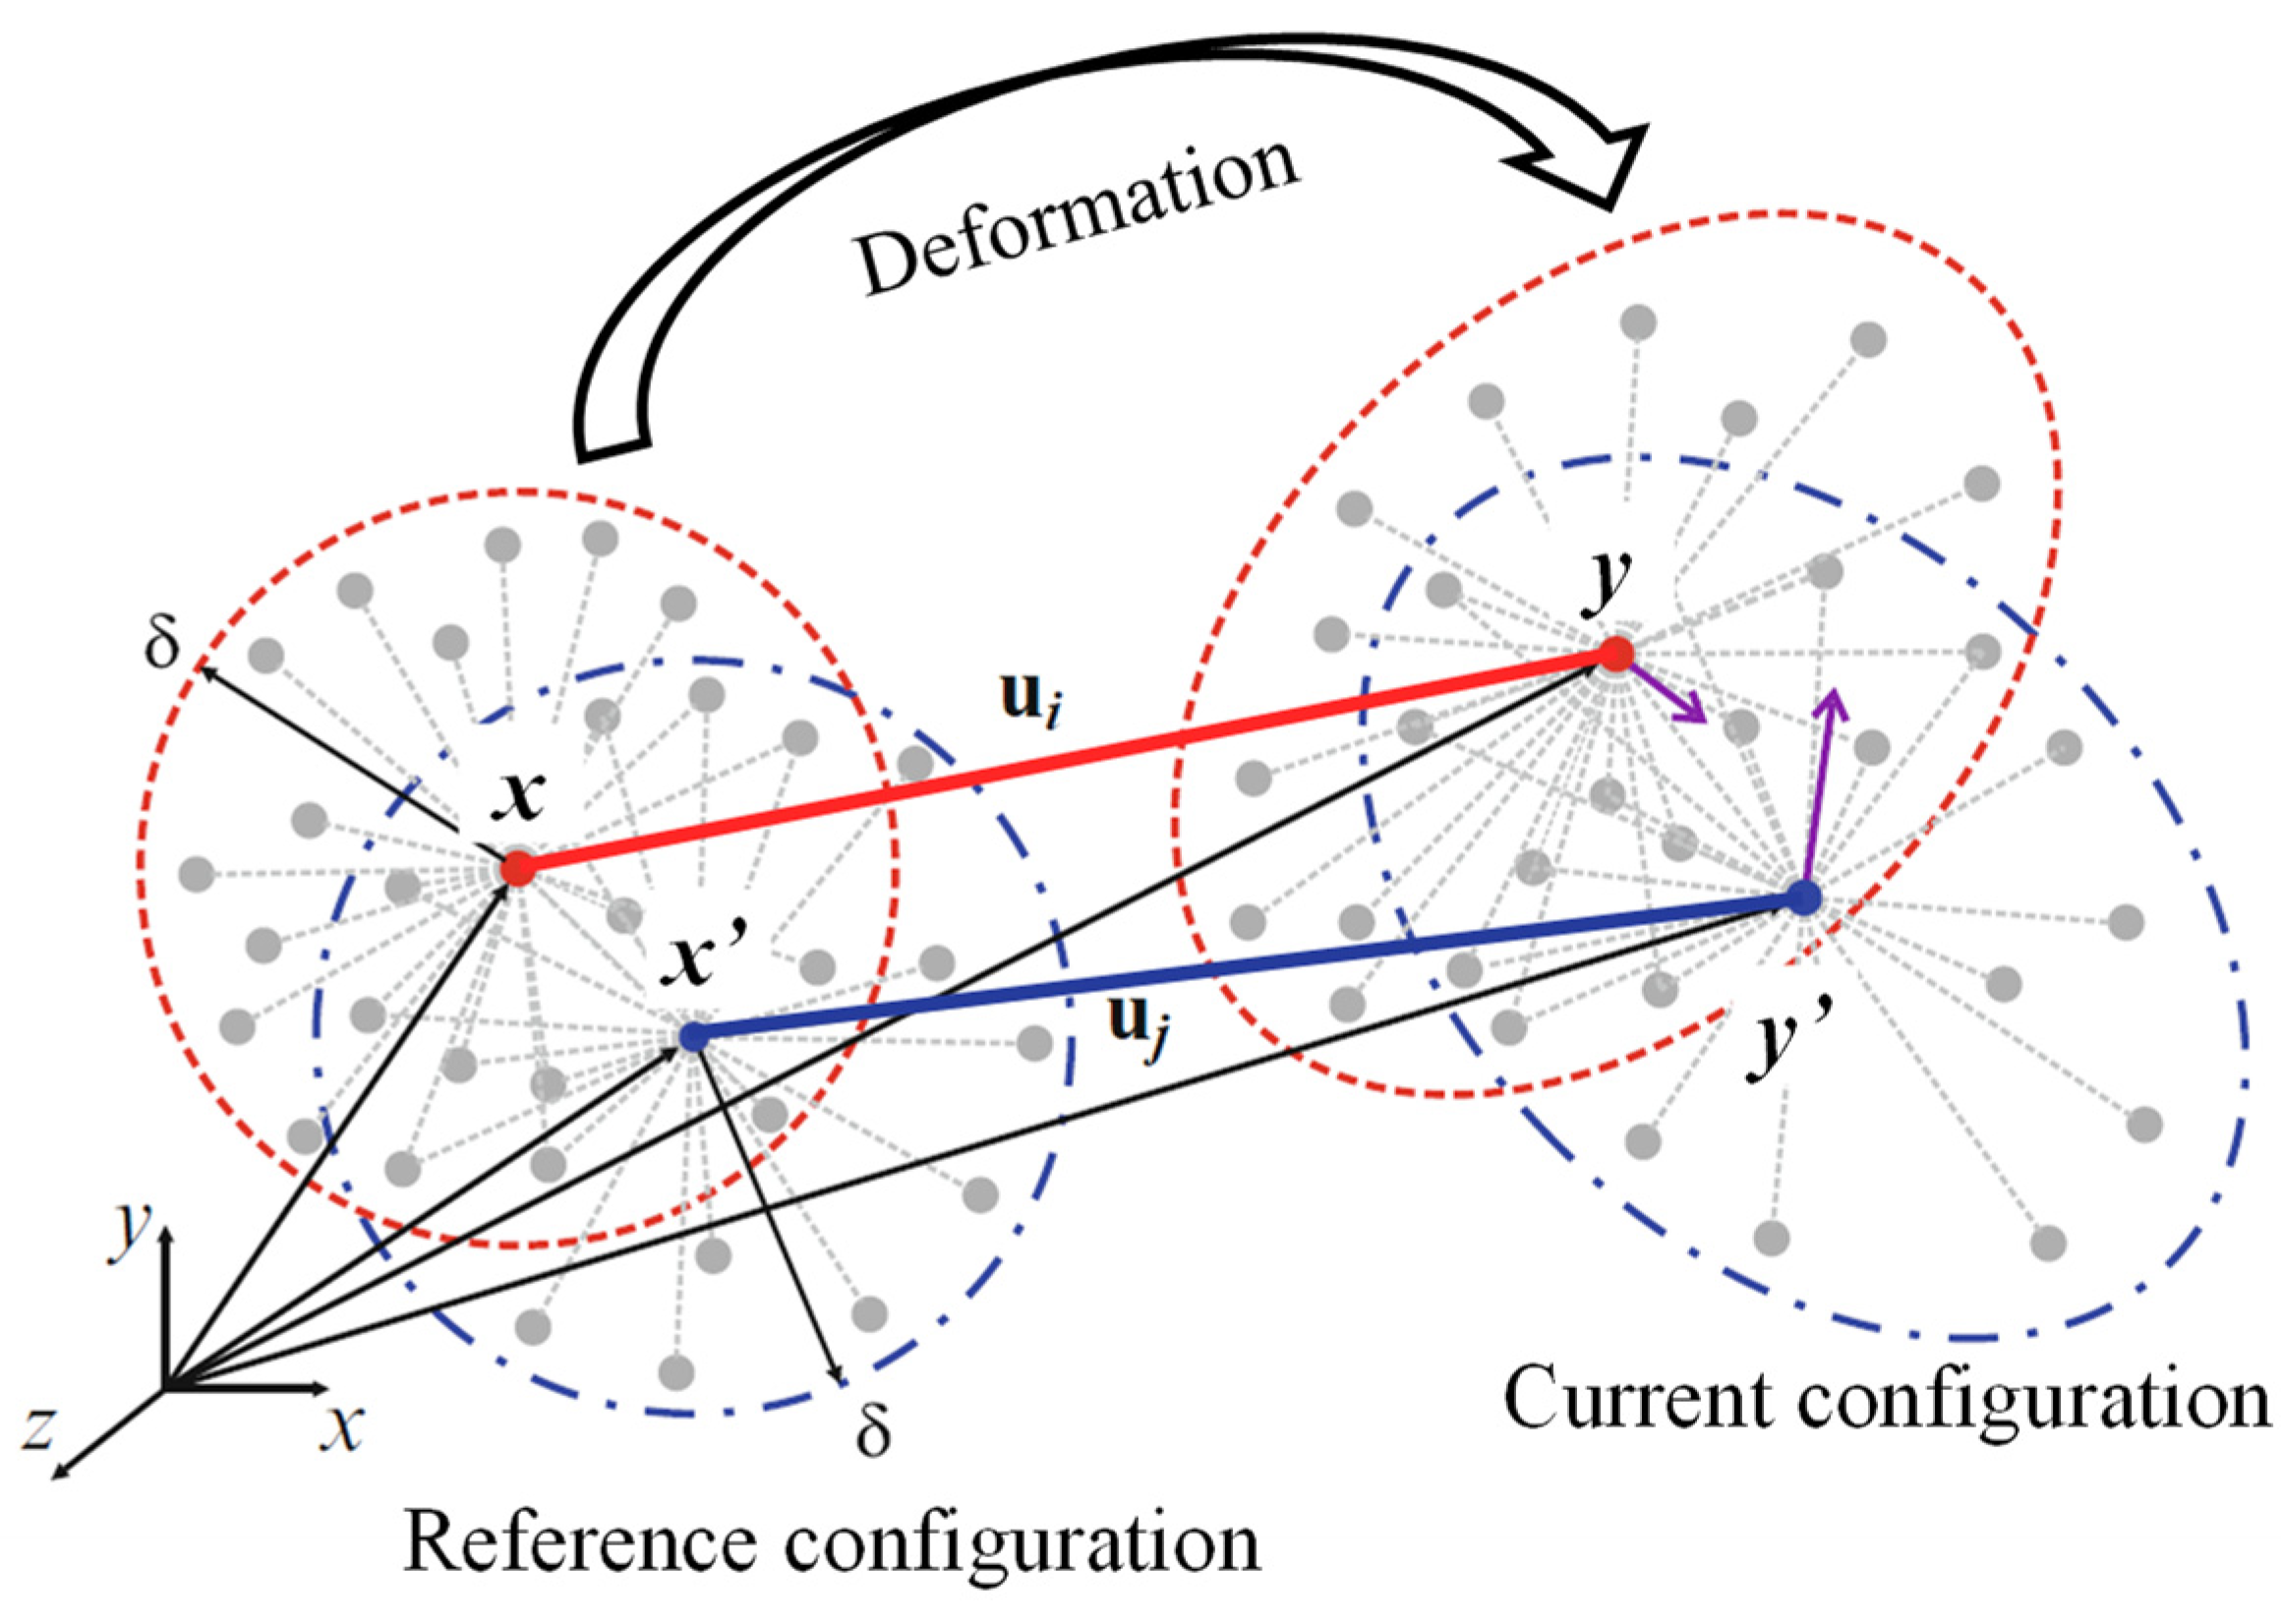
2. A Brief Introduction to Peridynamic Least Square Minimization (PDLSM)
3. AN-PDLSM Model for Analyzing Fracture in Anisotropic Rock
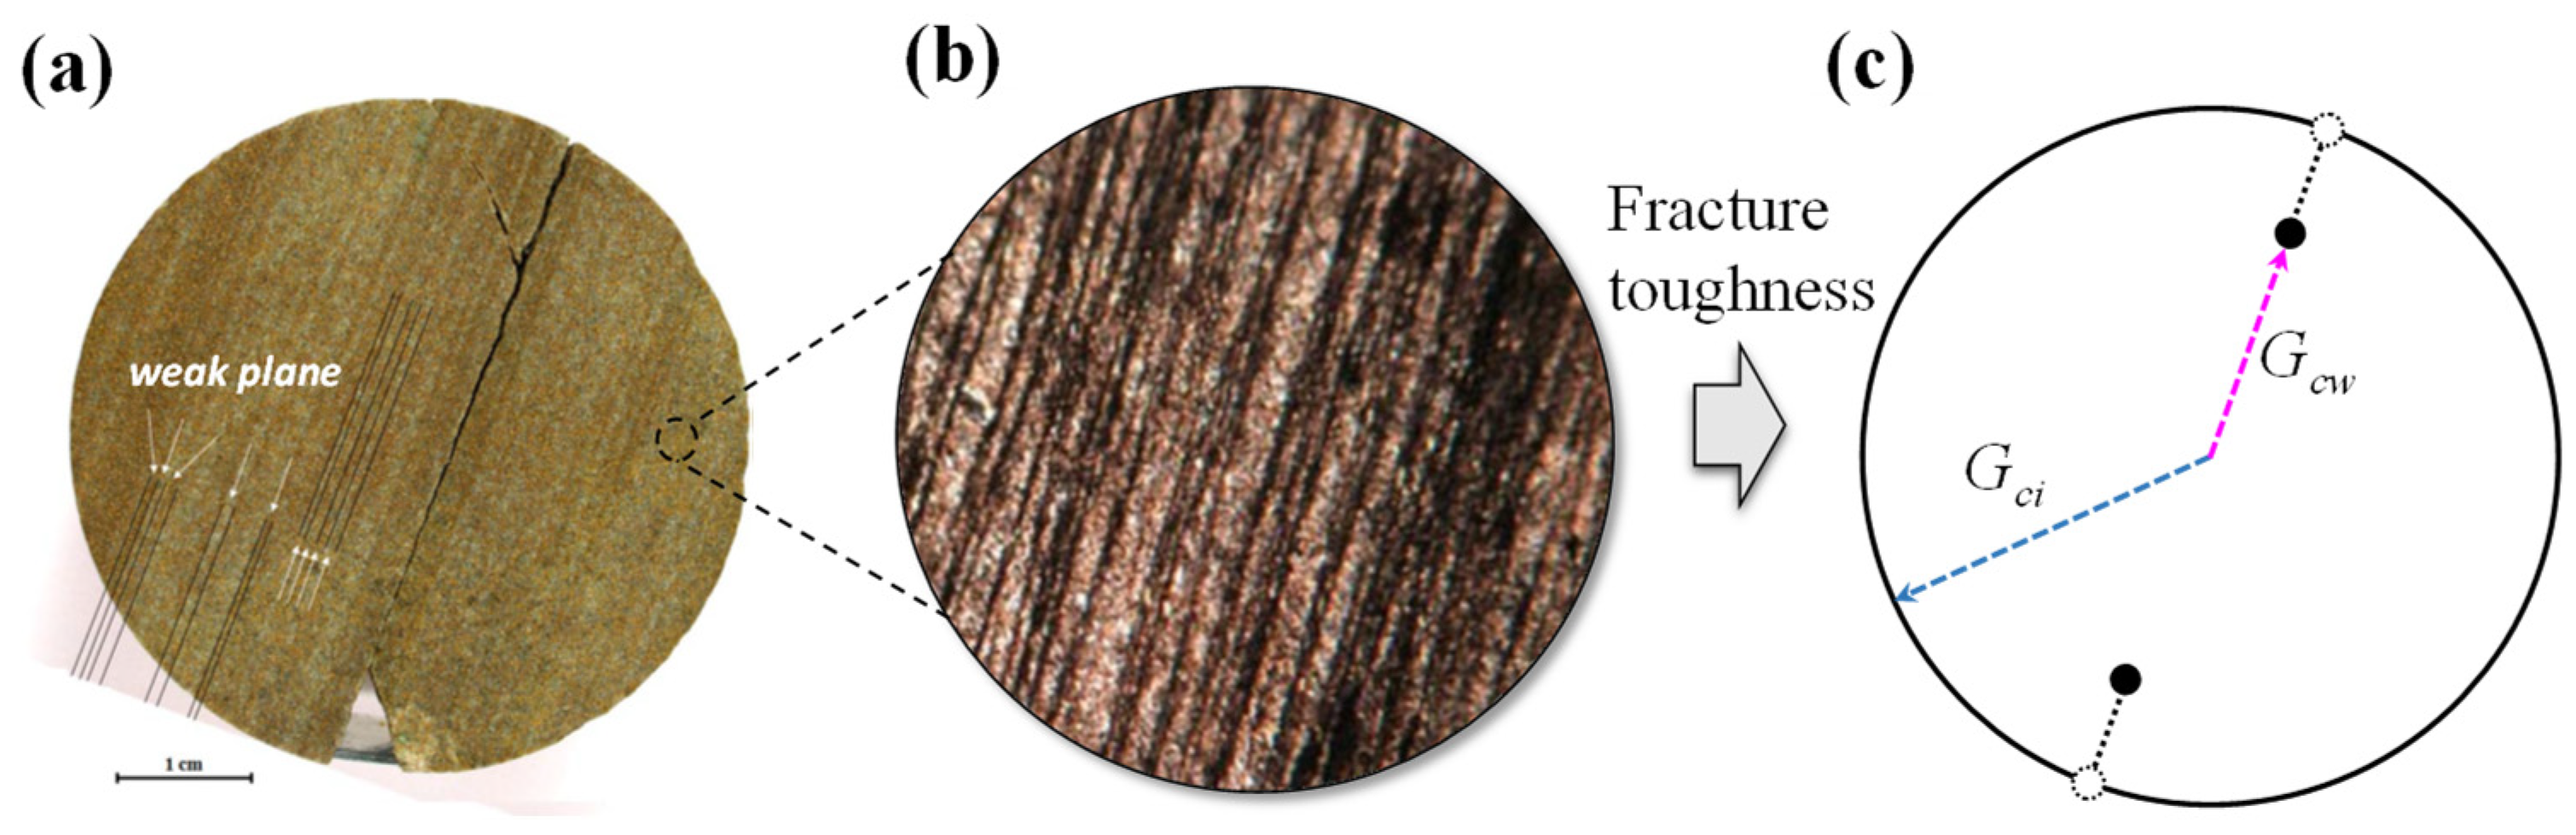
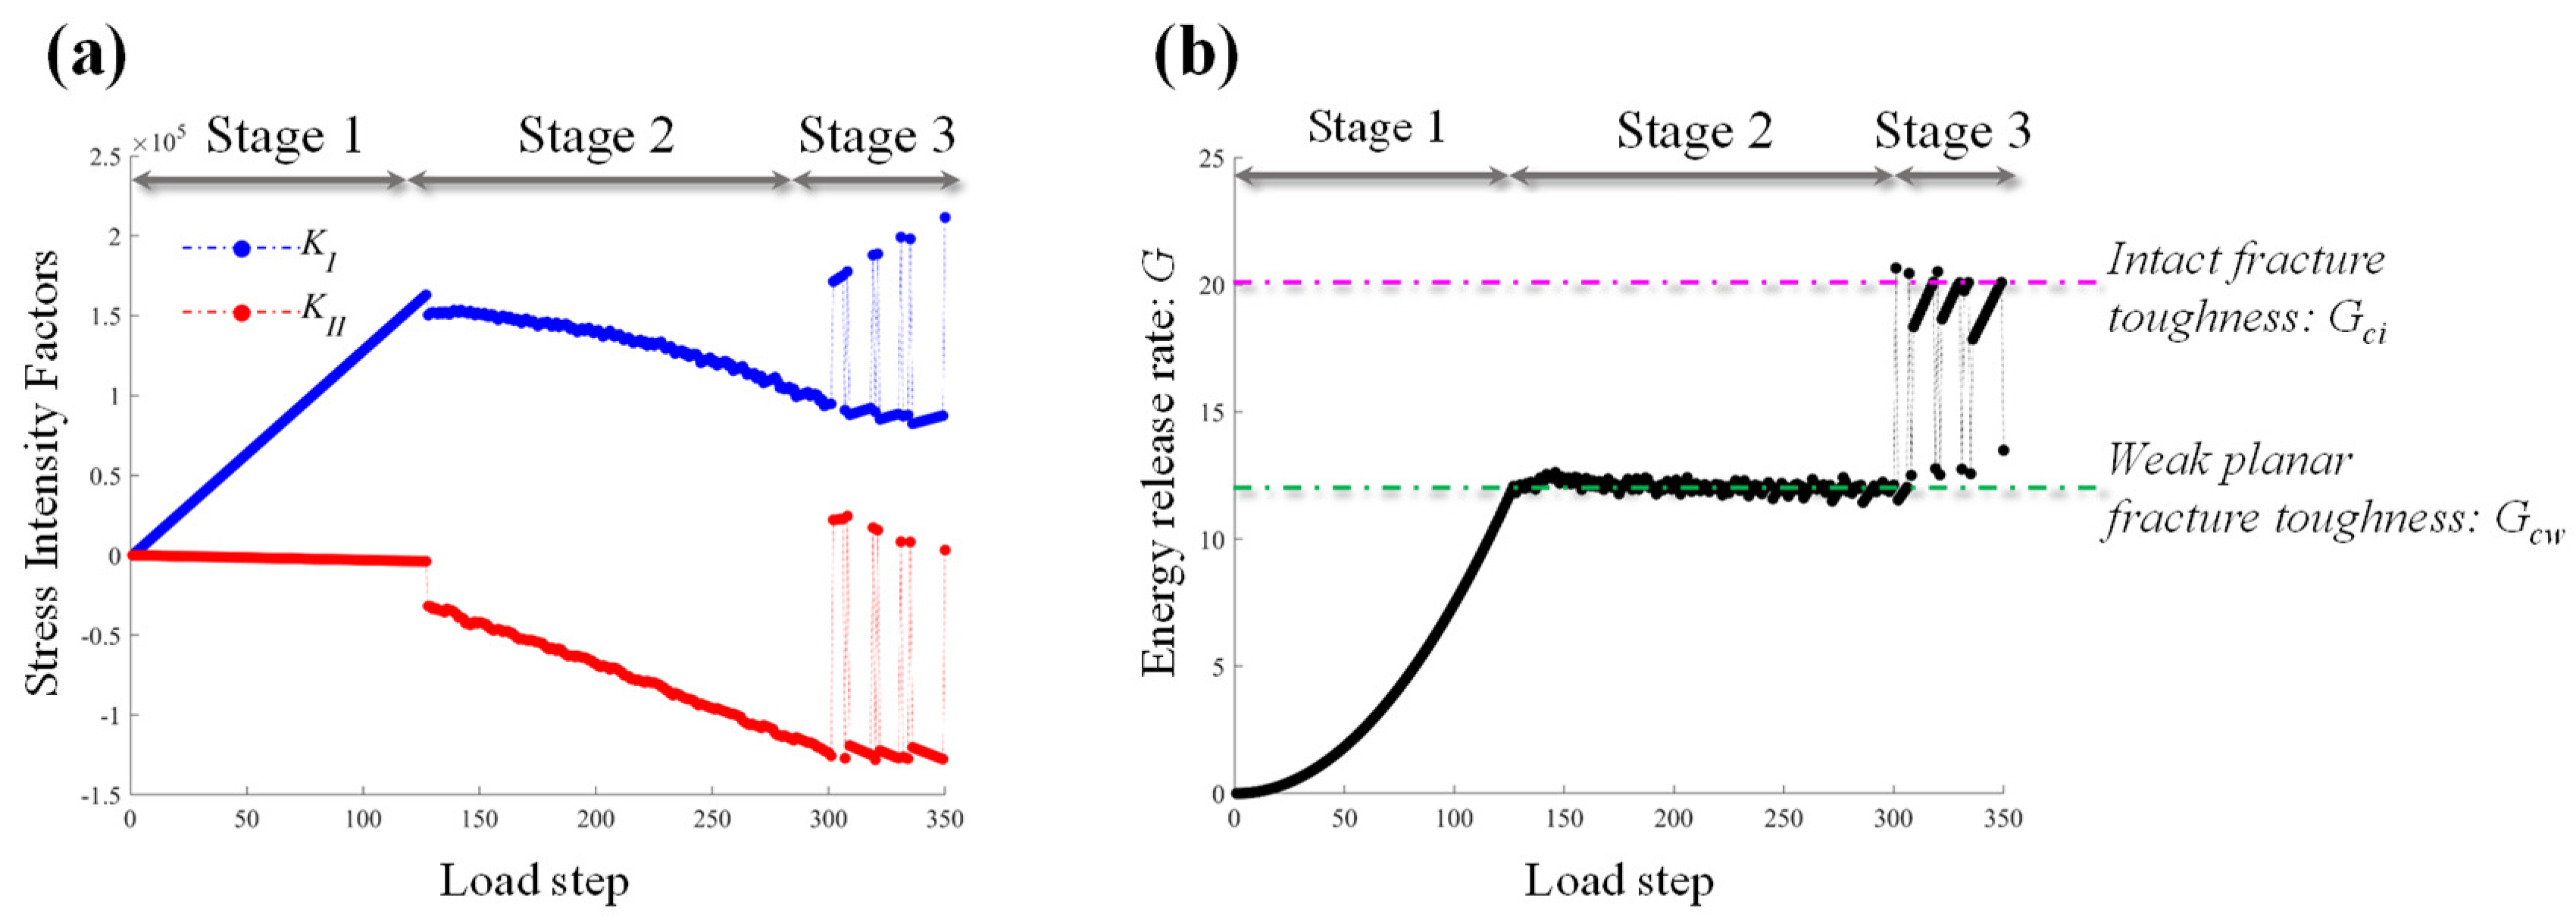
3.1. The Crack Propagation Criterion for Anisotropic Rock
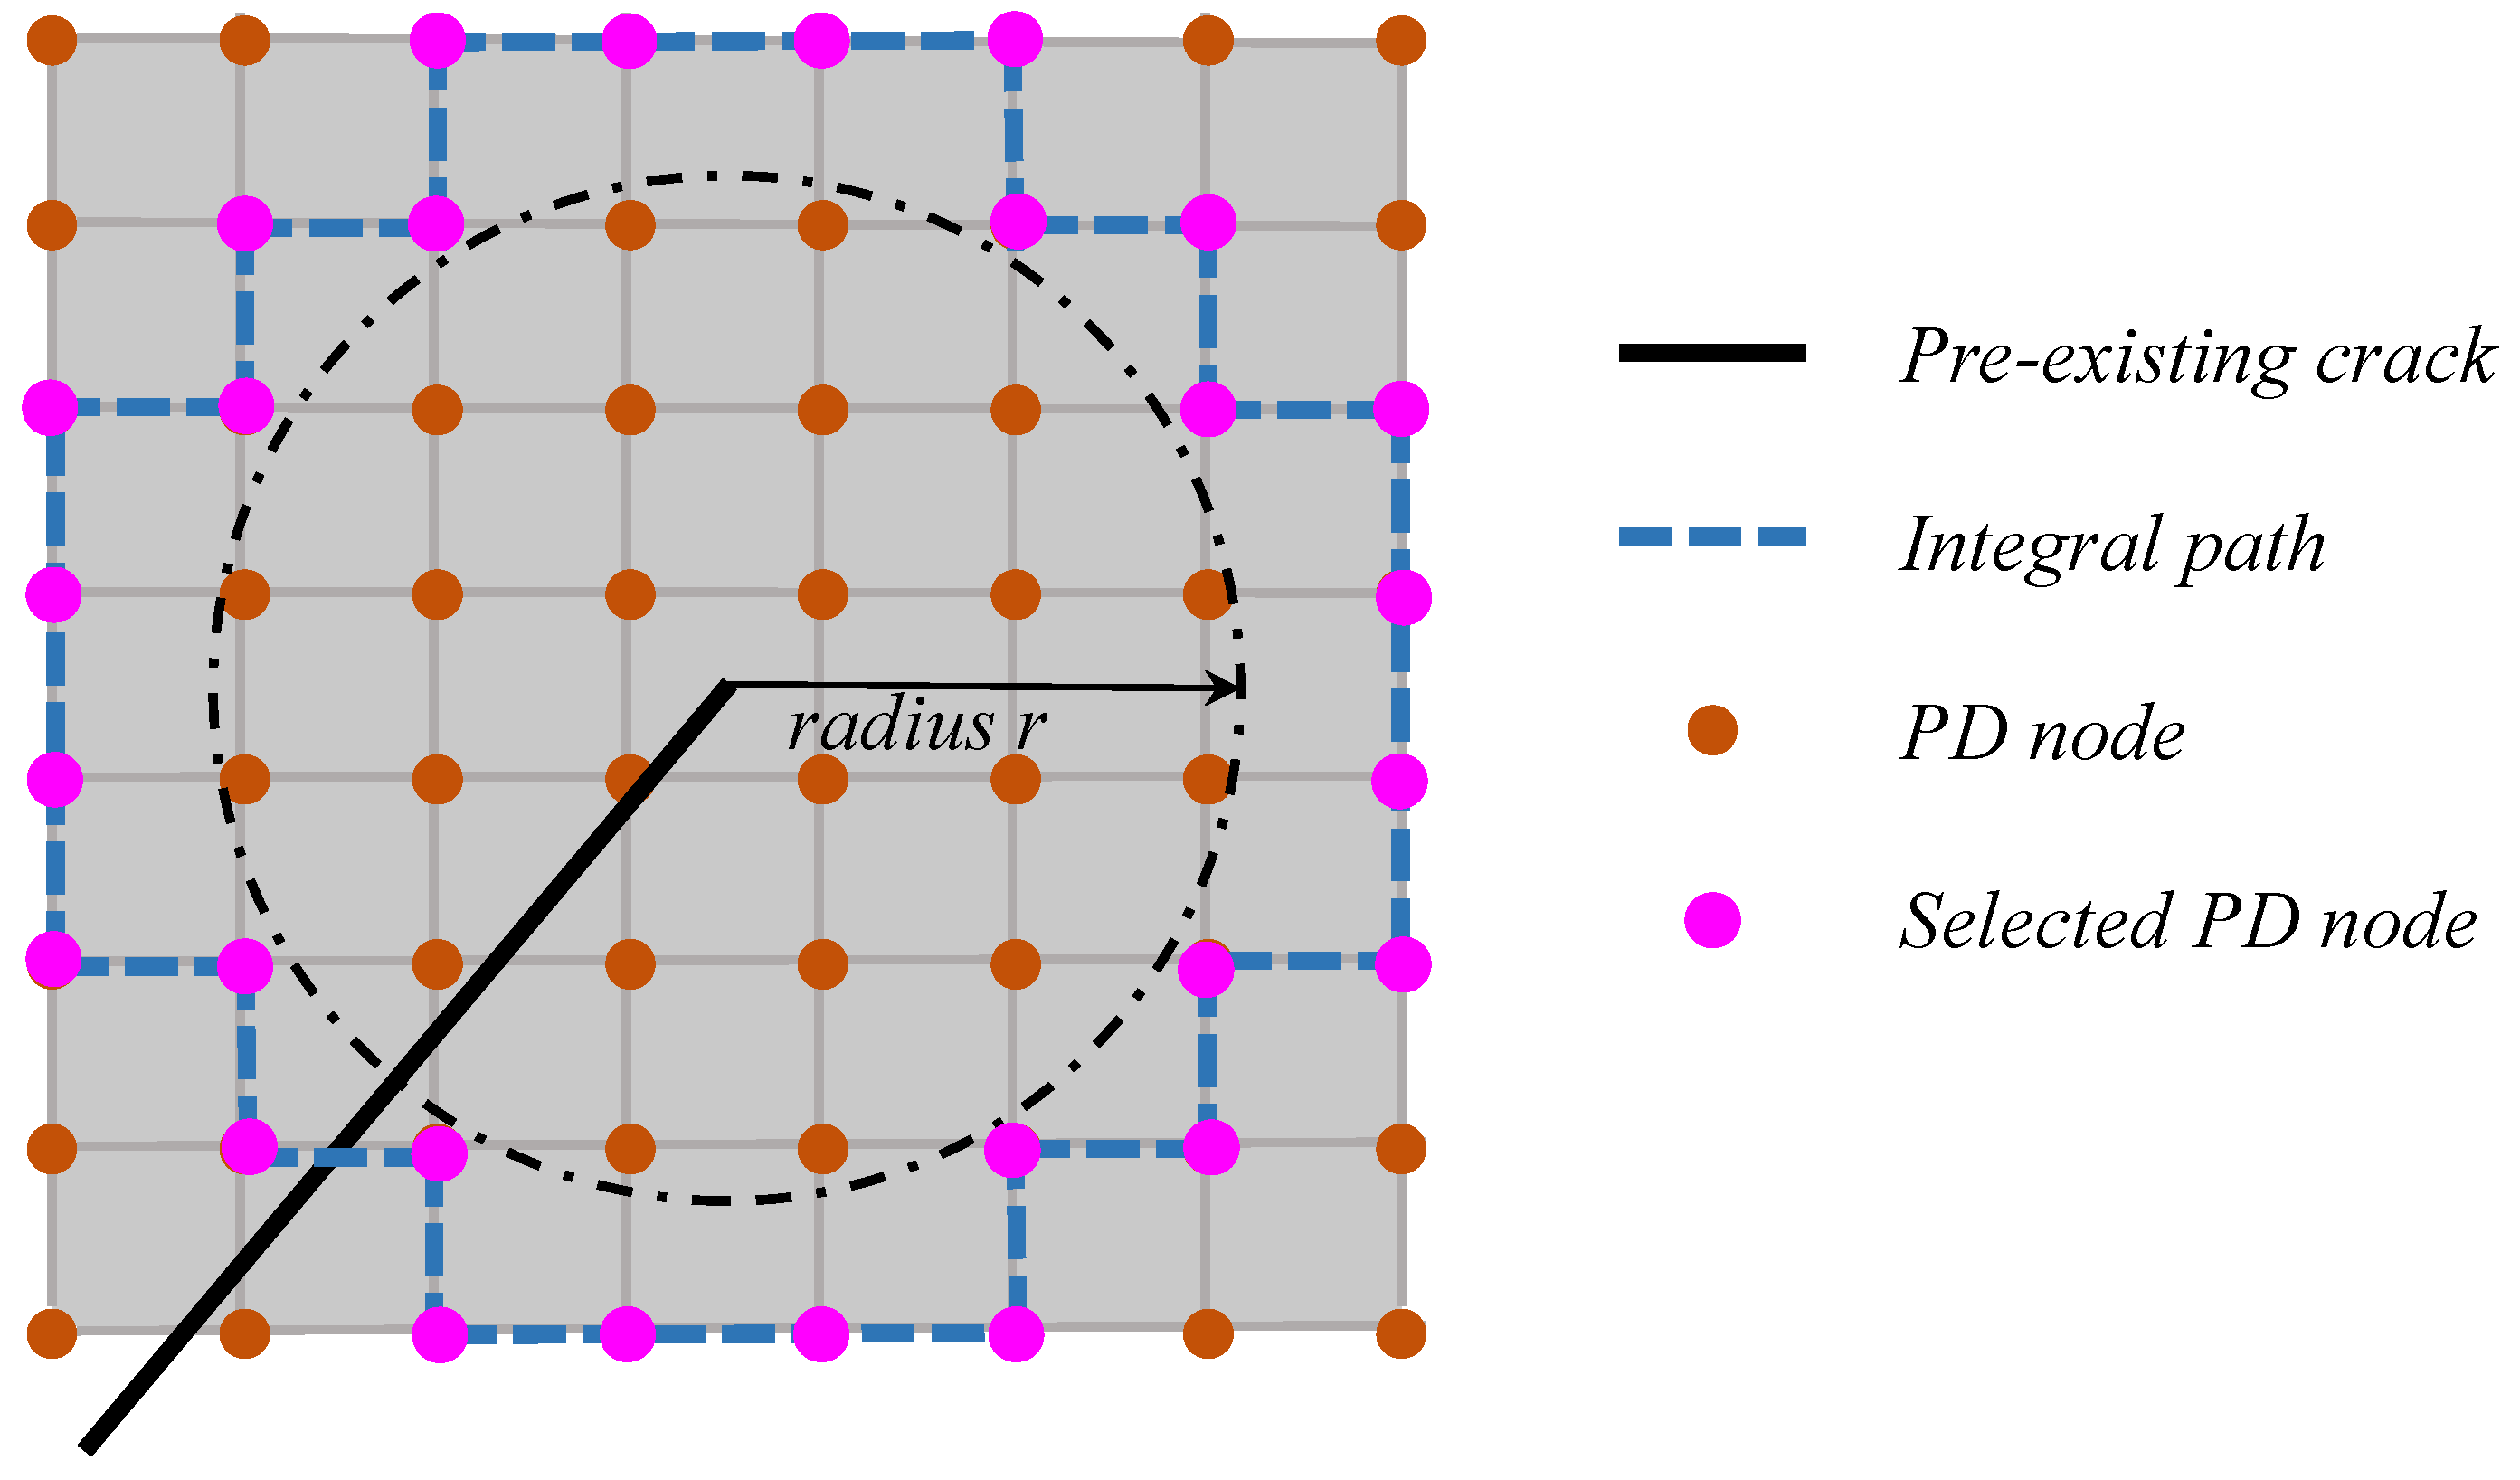
3.2. Fracture Energy and the J-Integral
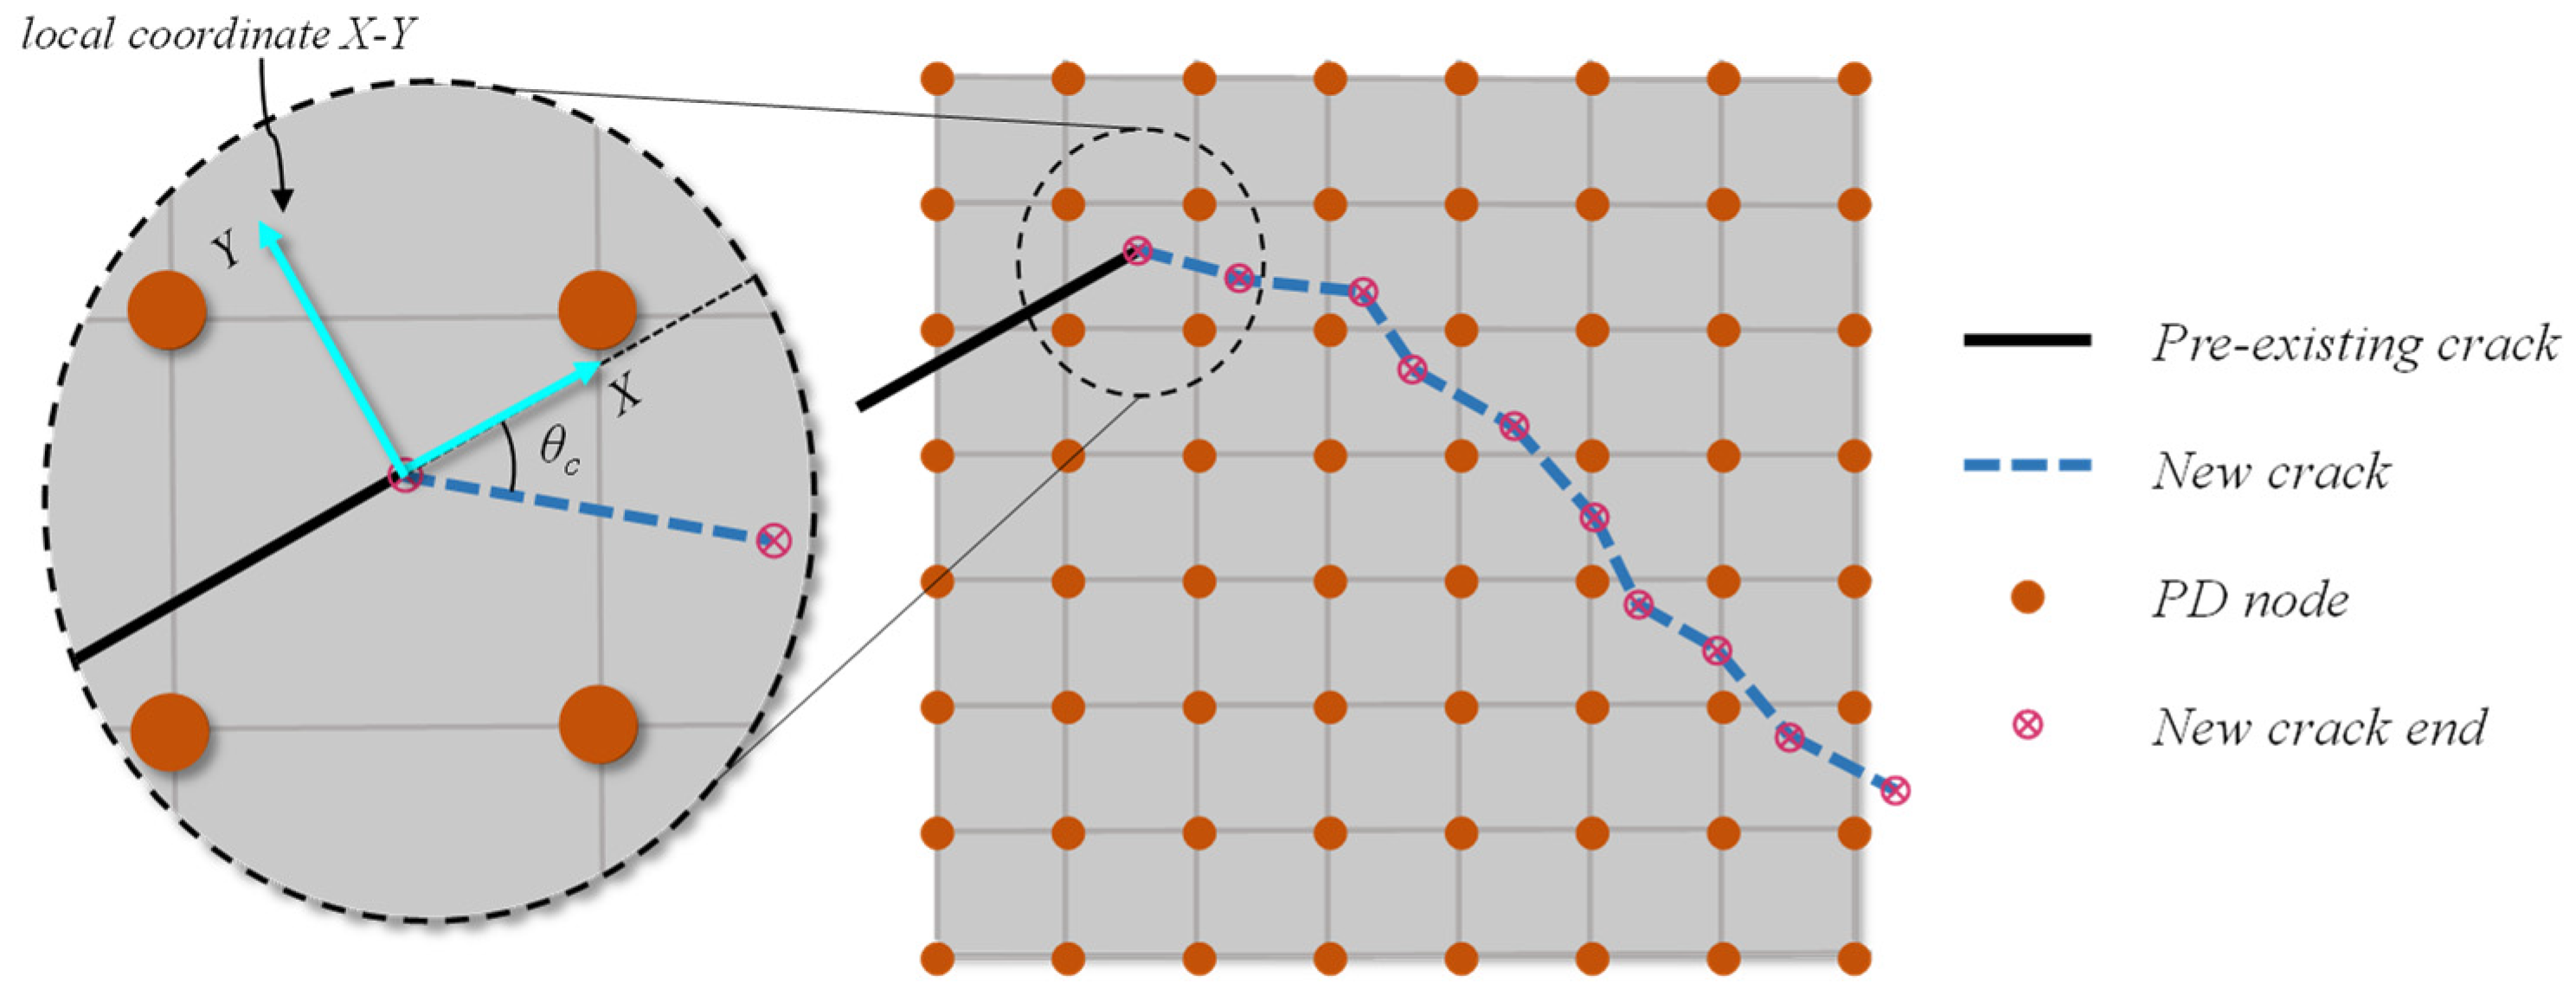
3.3. A Mesh-Independent Piecewise Linear Model for Bond Breakage
3.4. Implicit Solver of AN-PDLSM
4. Numerical Verification and Simulation
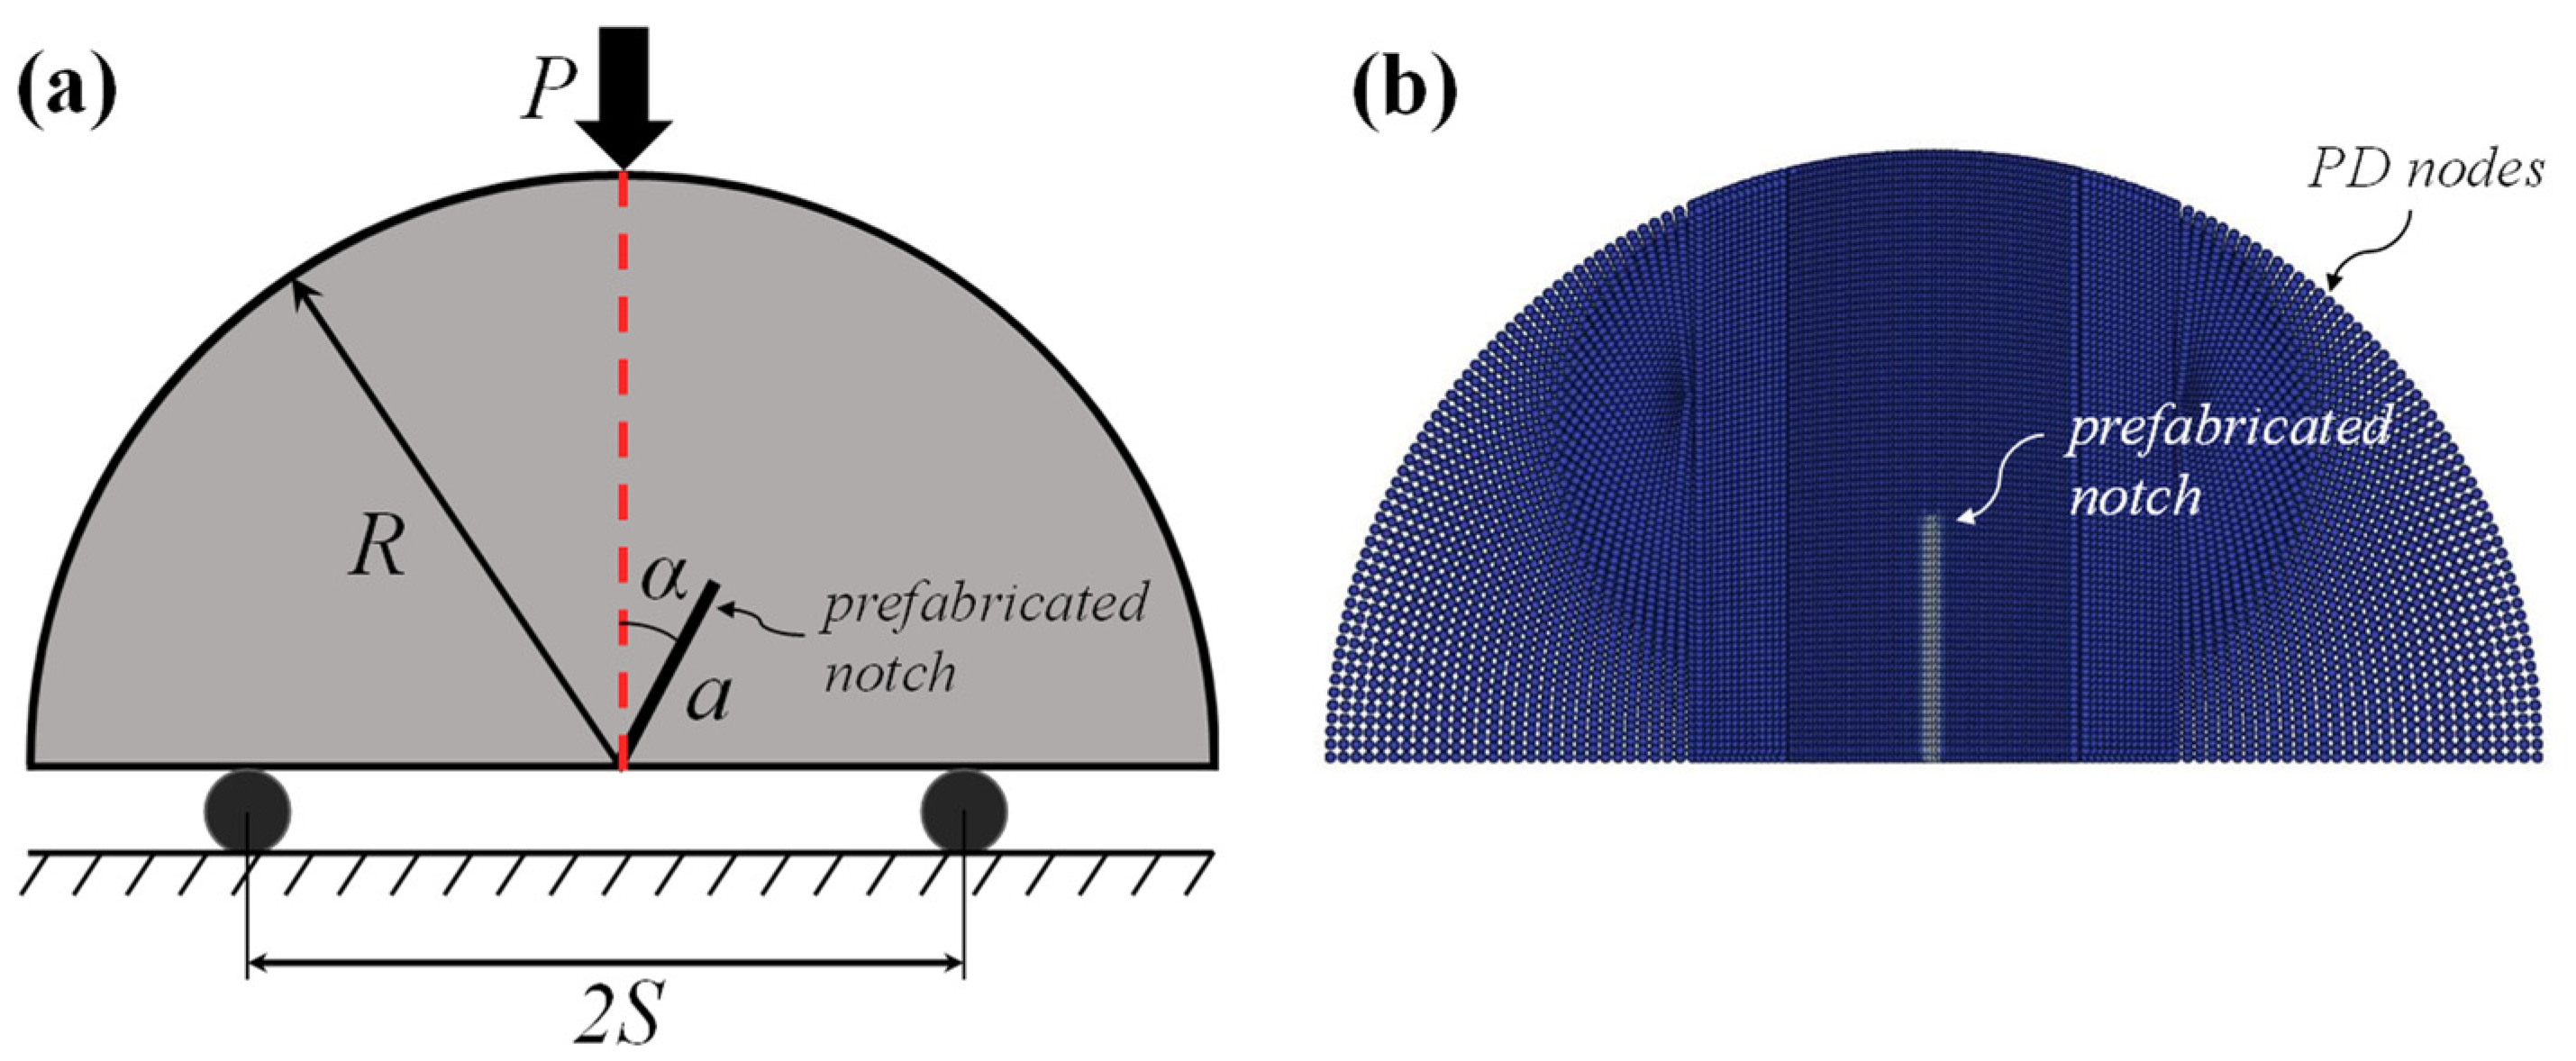
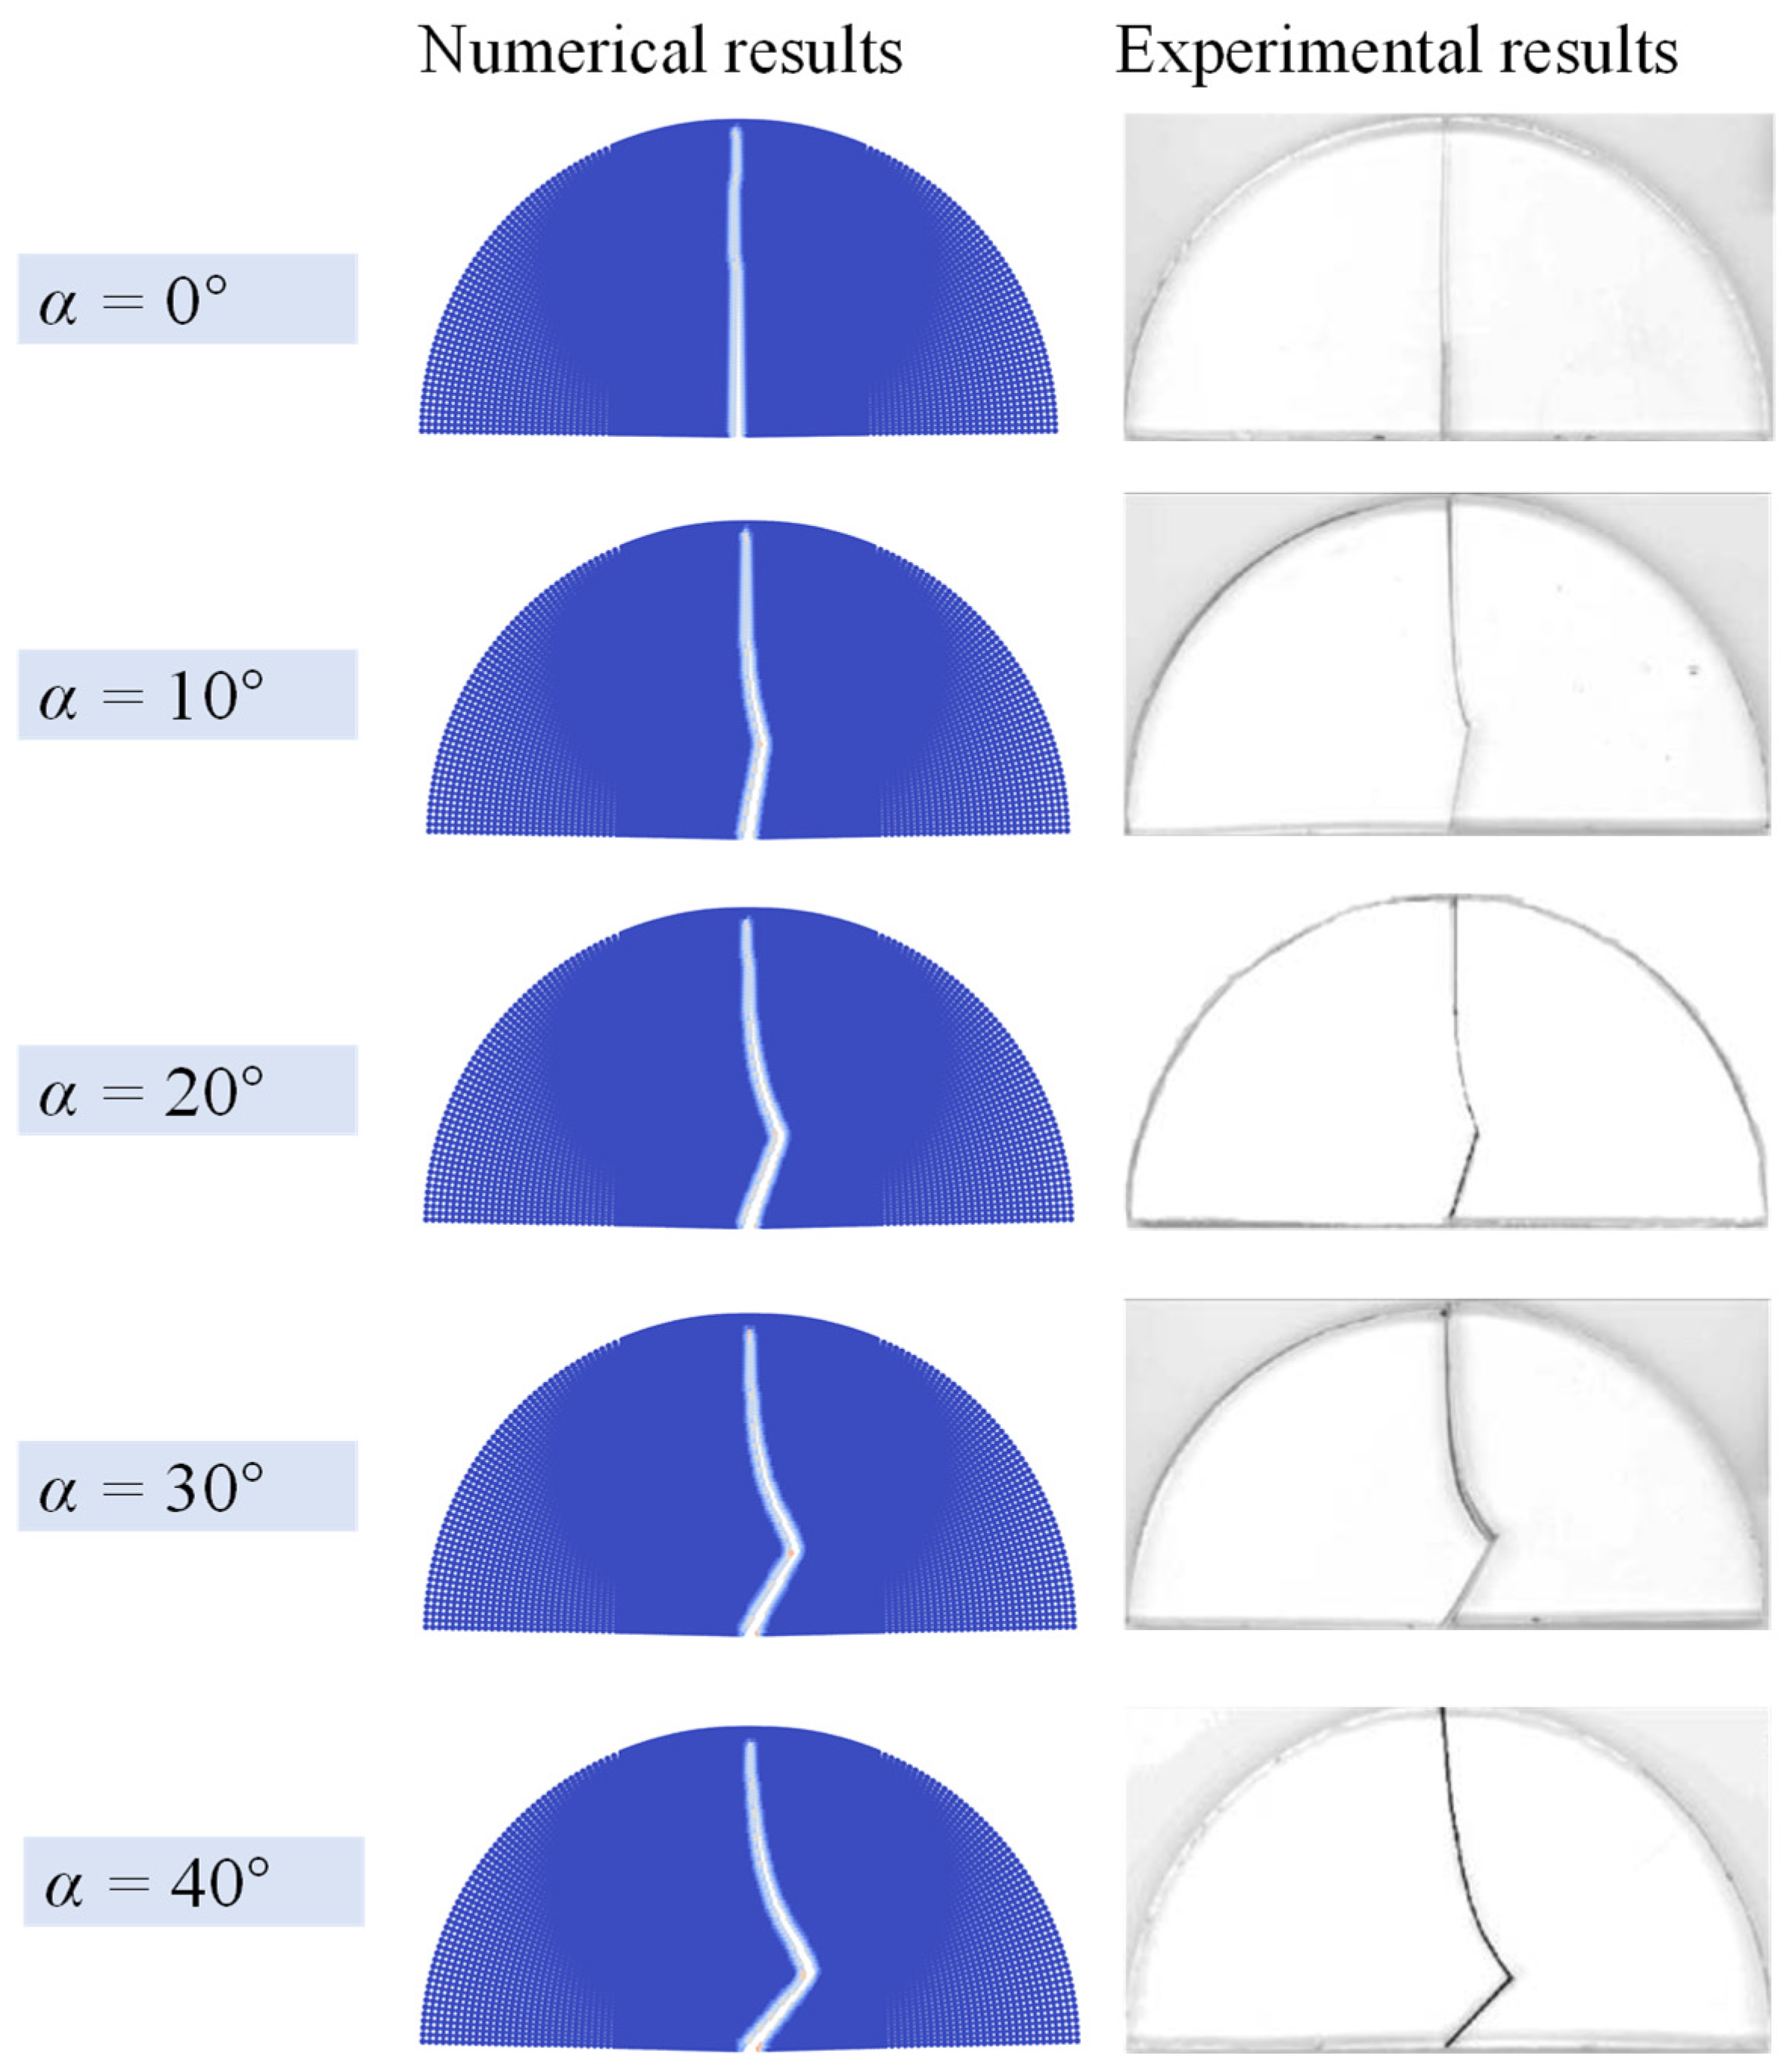
4.1. Fracture Analysis of Isotropic Semi-Circular Bending Tests
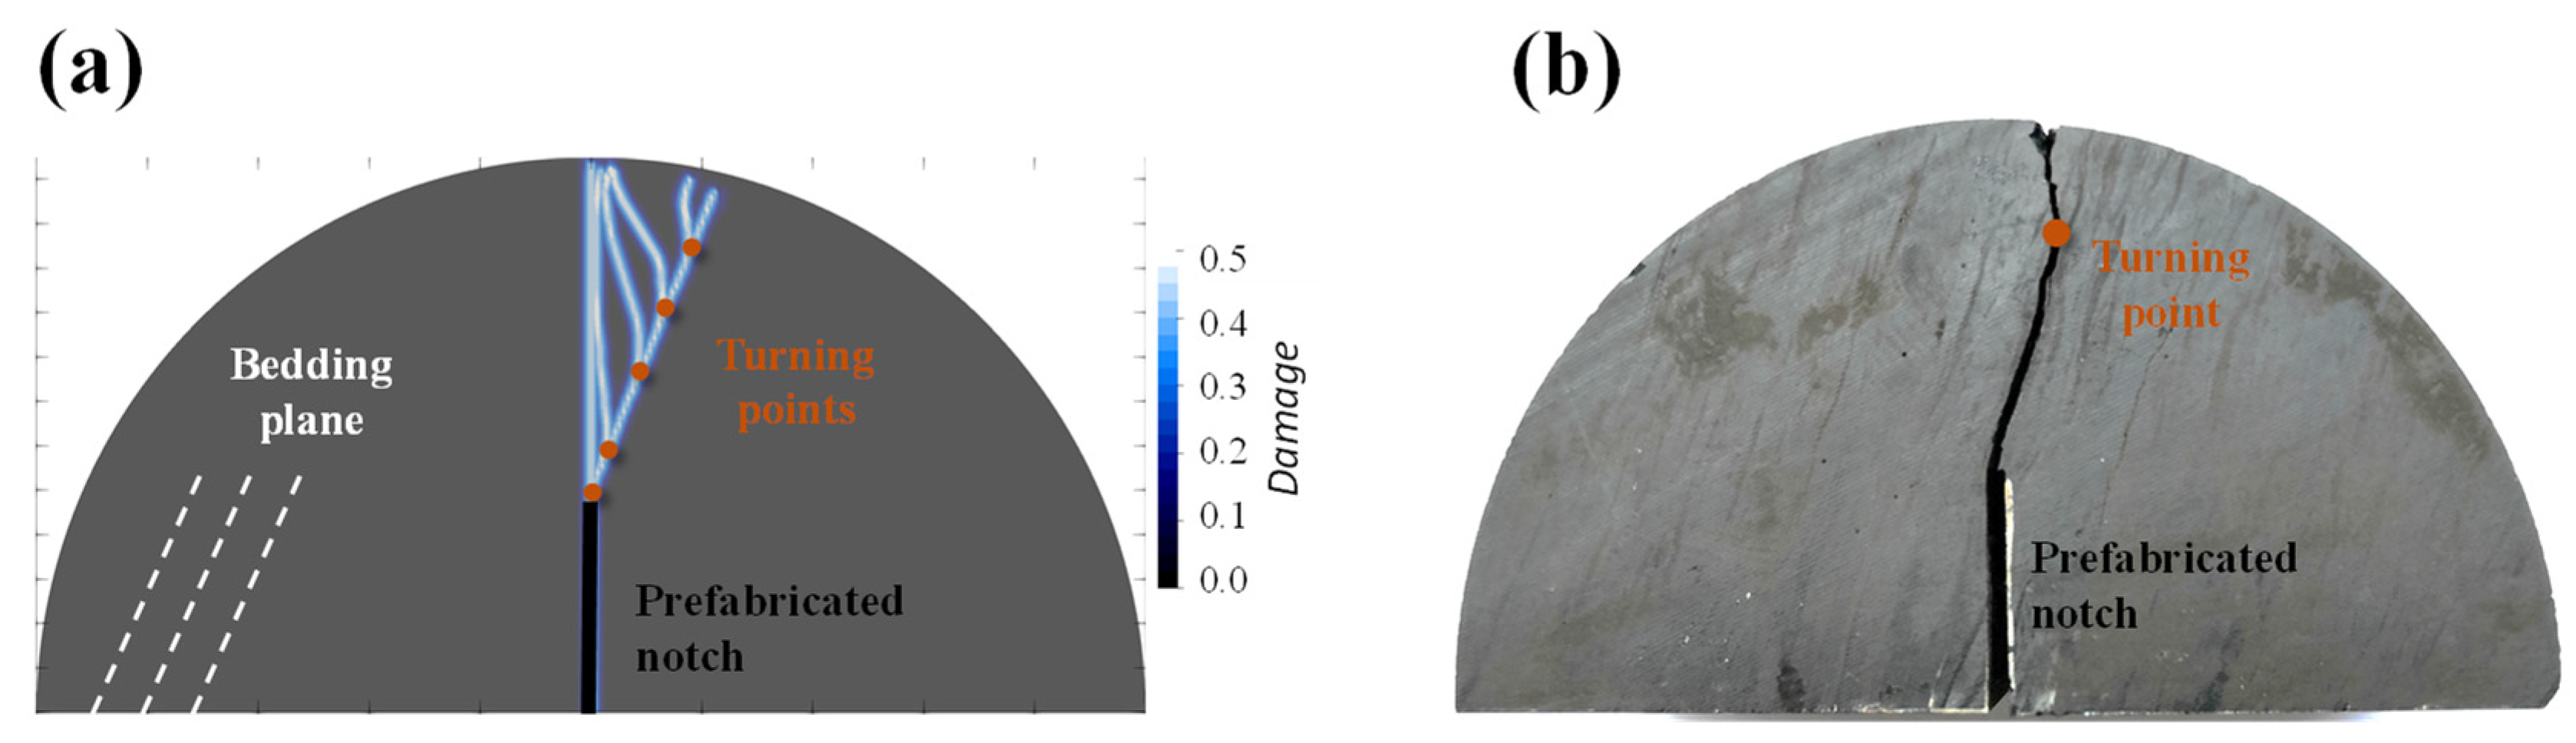
4.2. Fracture Analysis of Anisotropic Semi-Circular Bending Tests
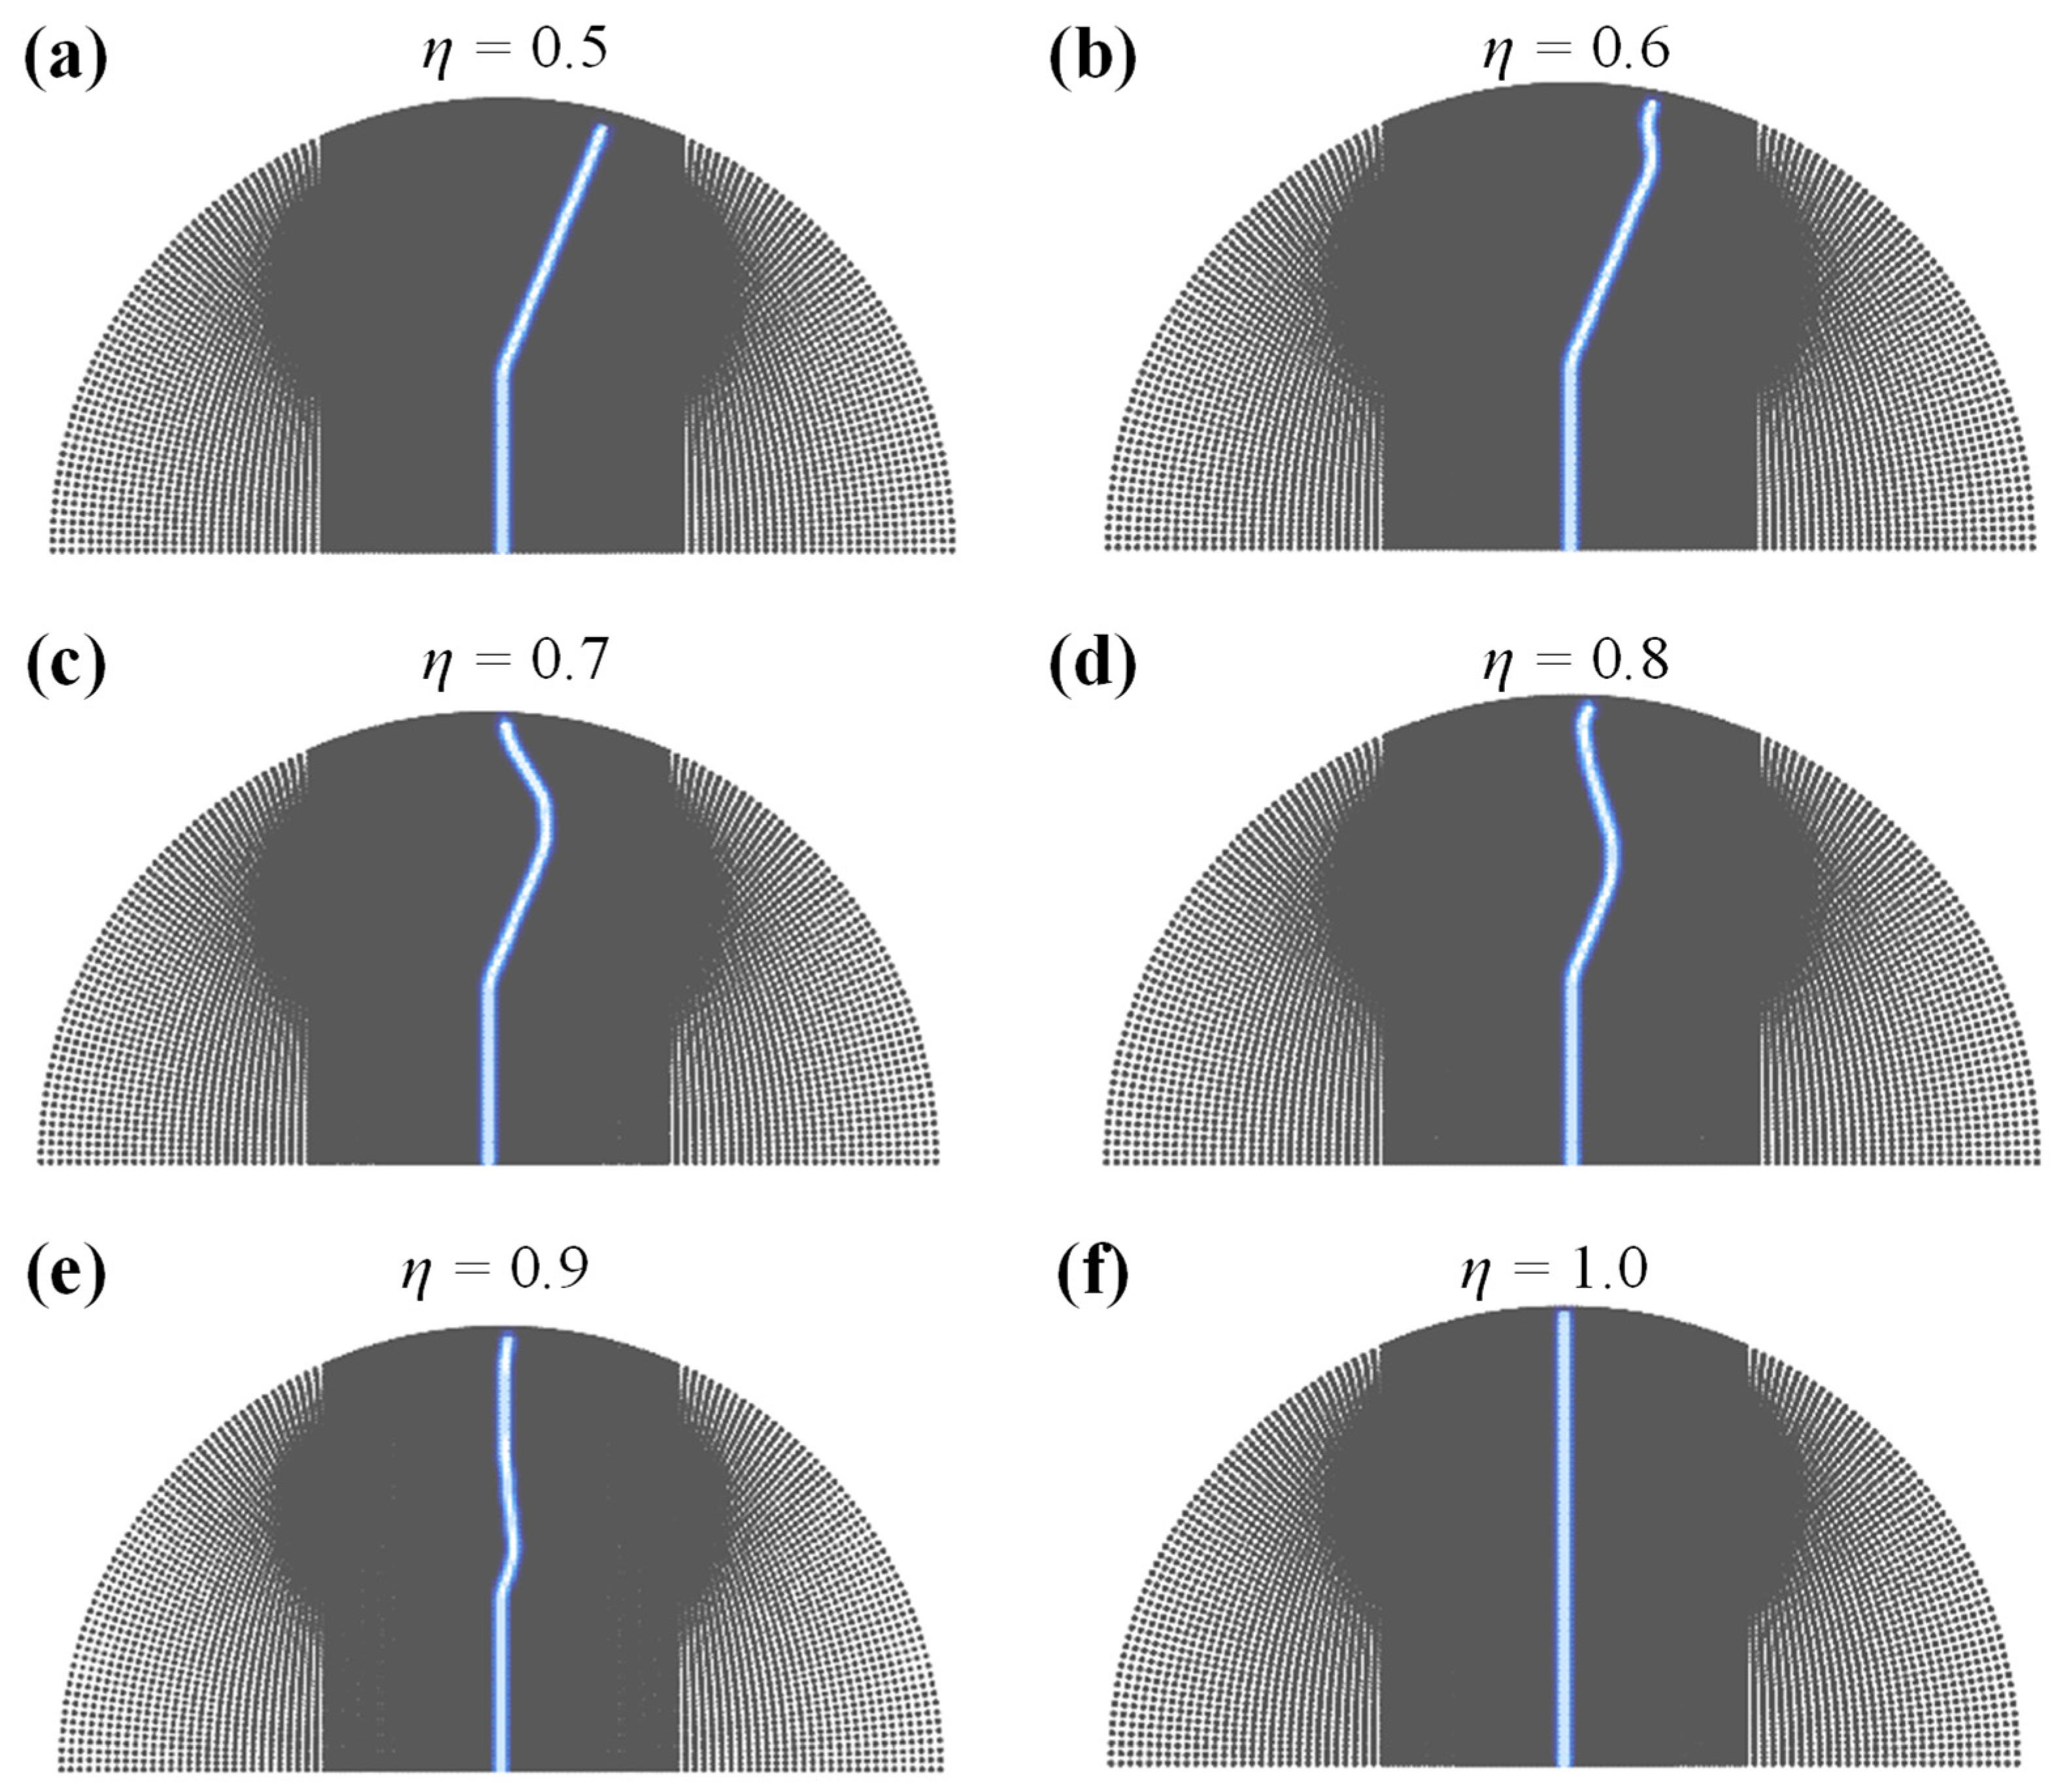
4.2.1. Influence of a Bedding Weak Coefficient
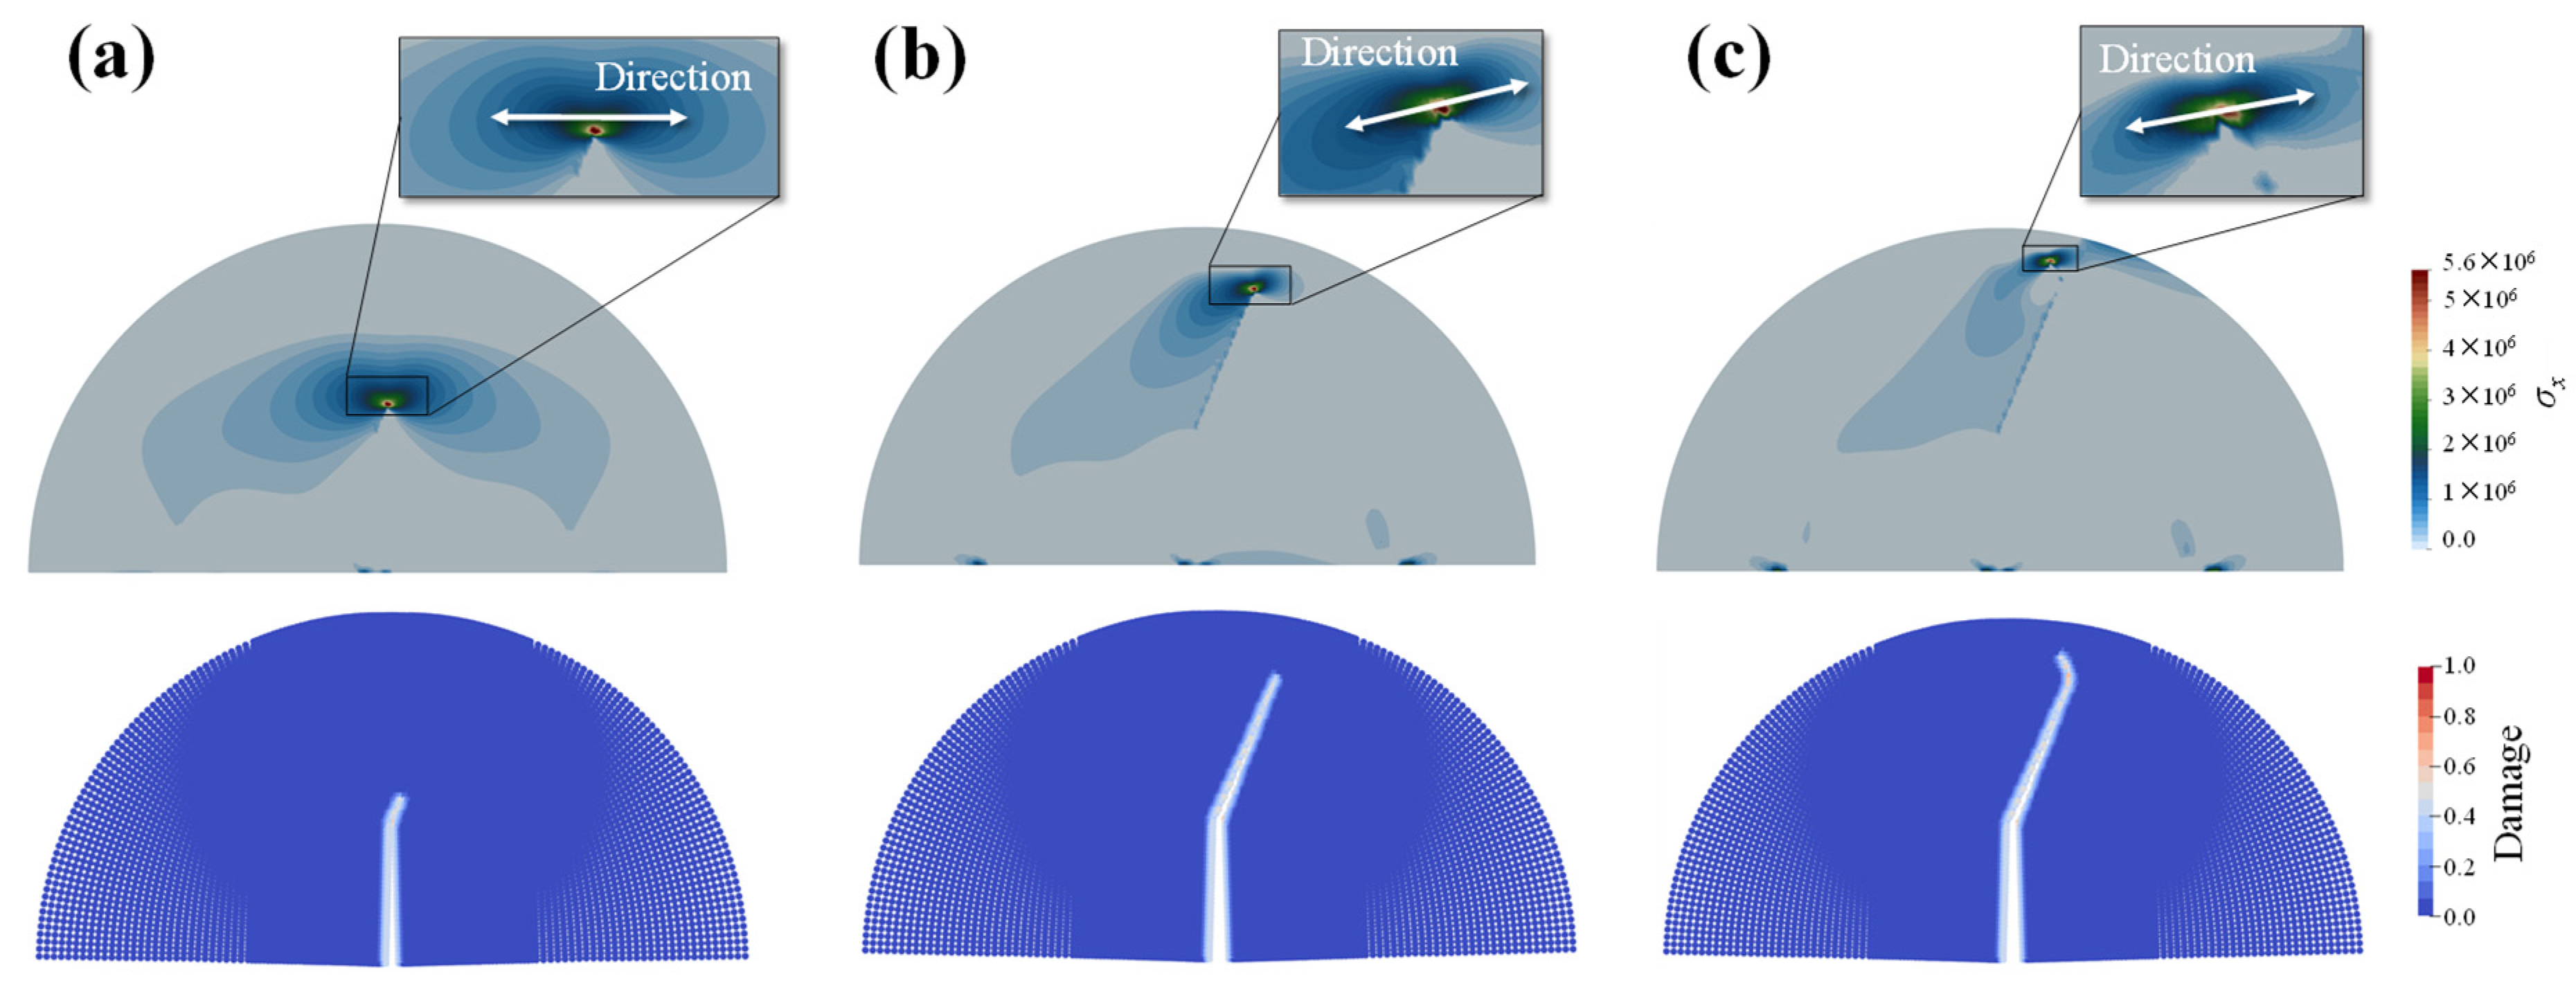
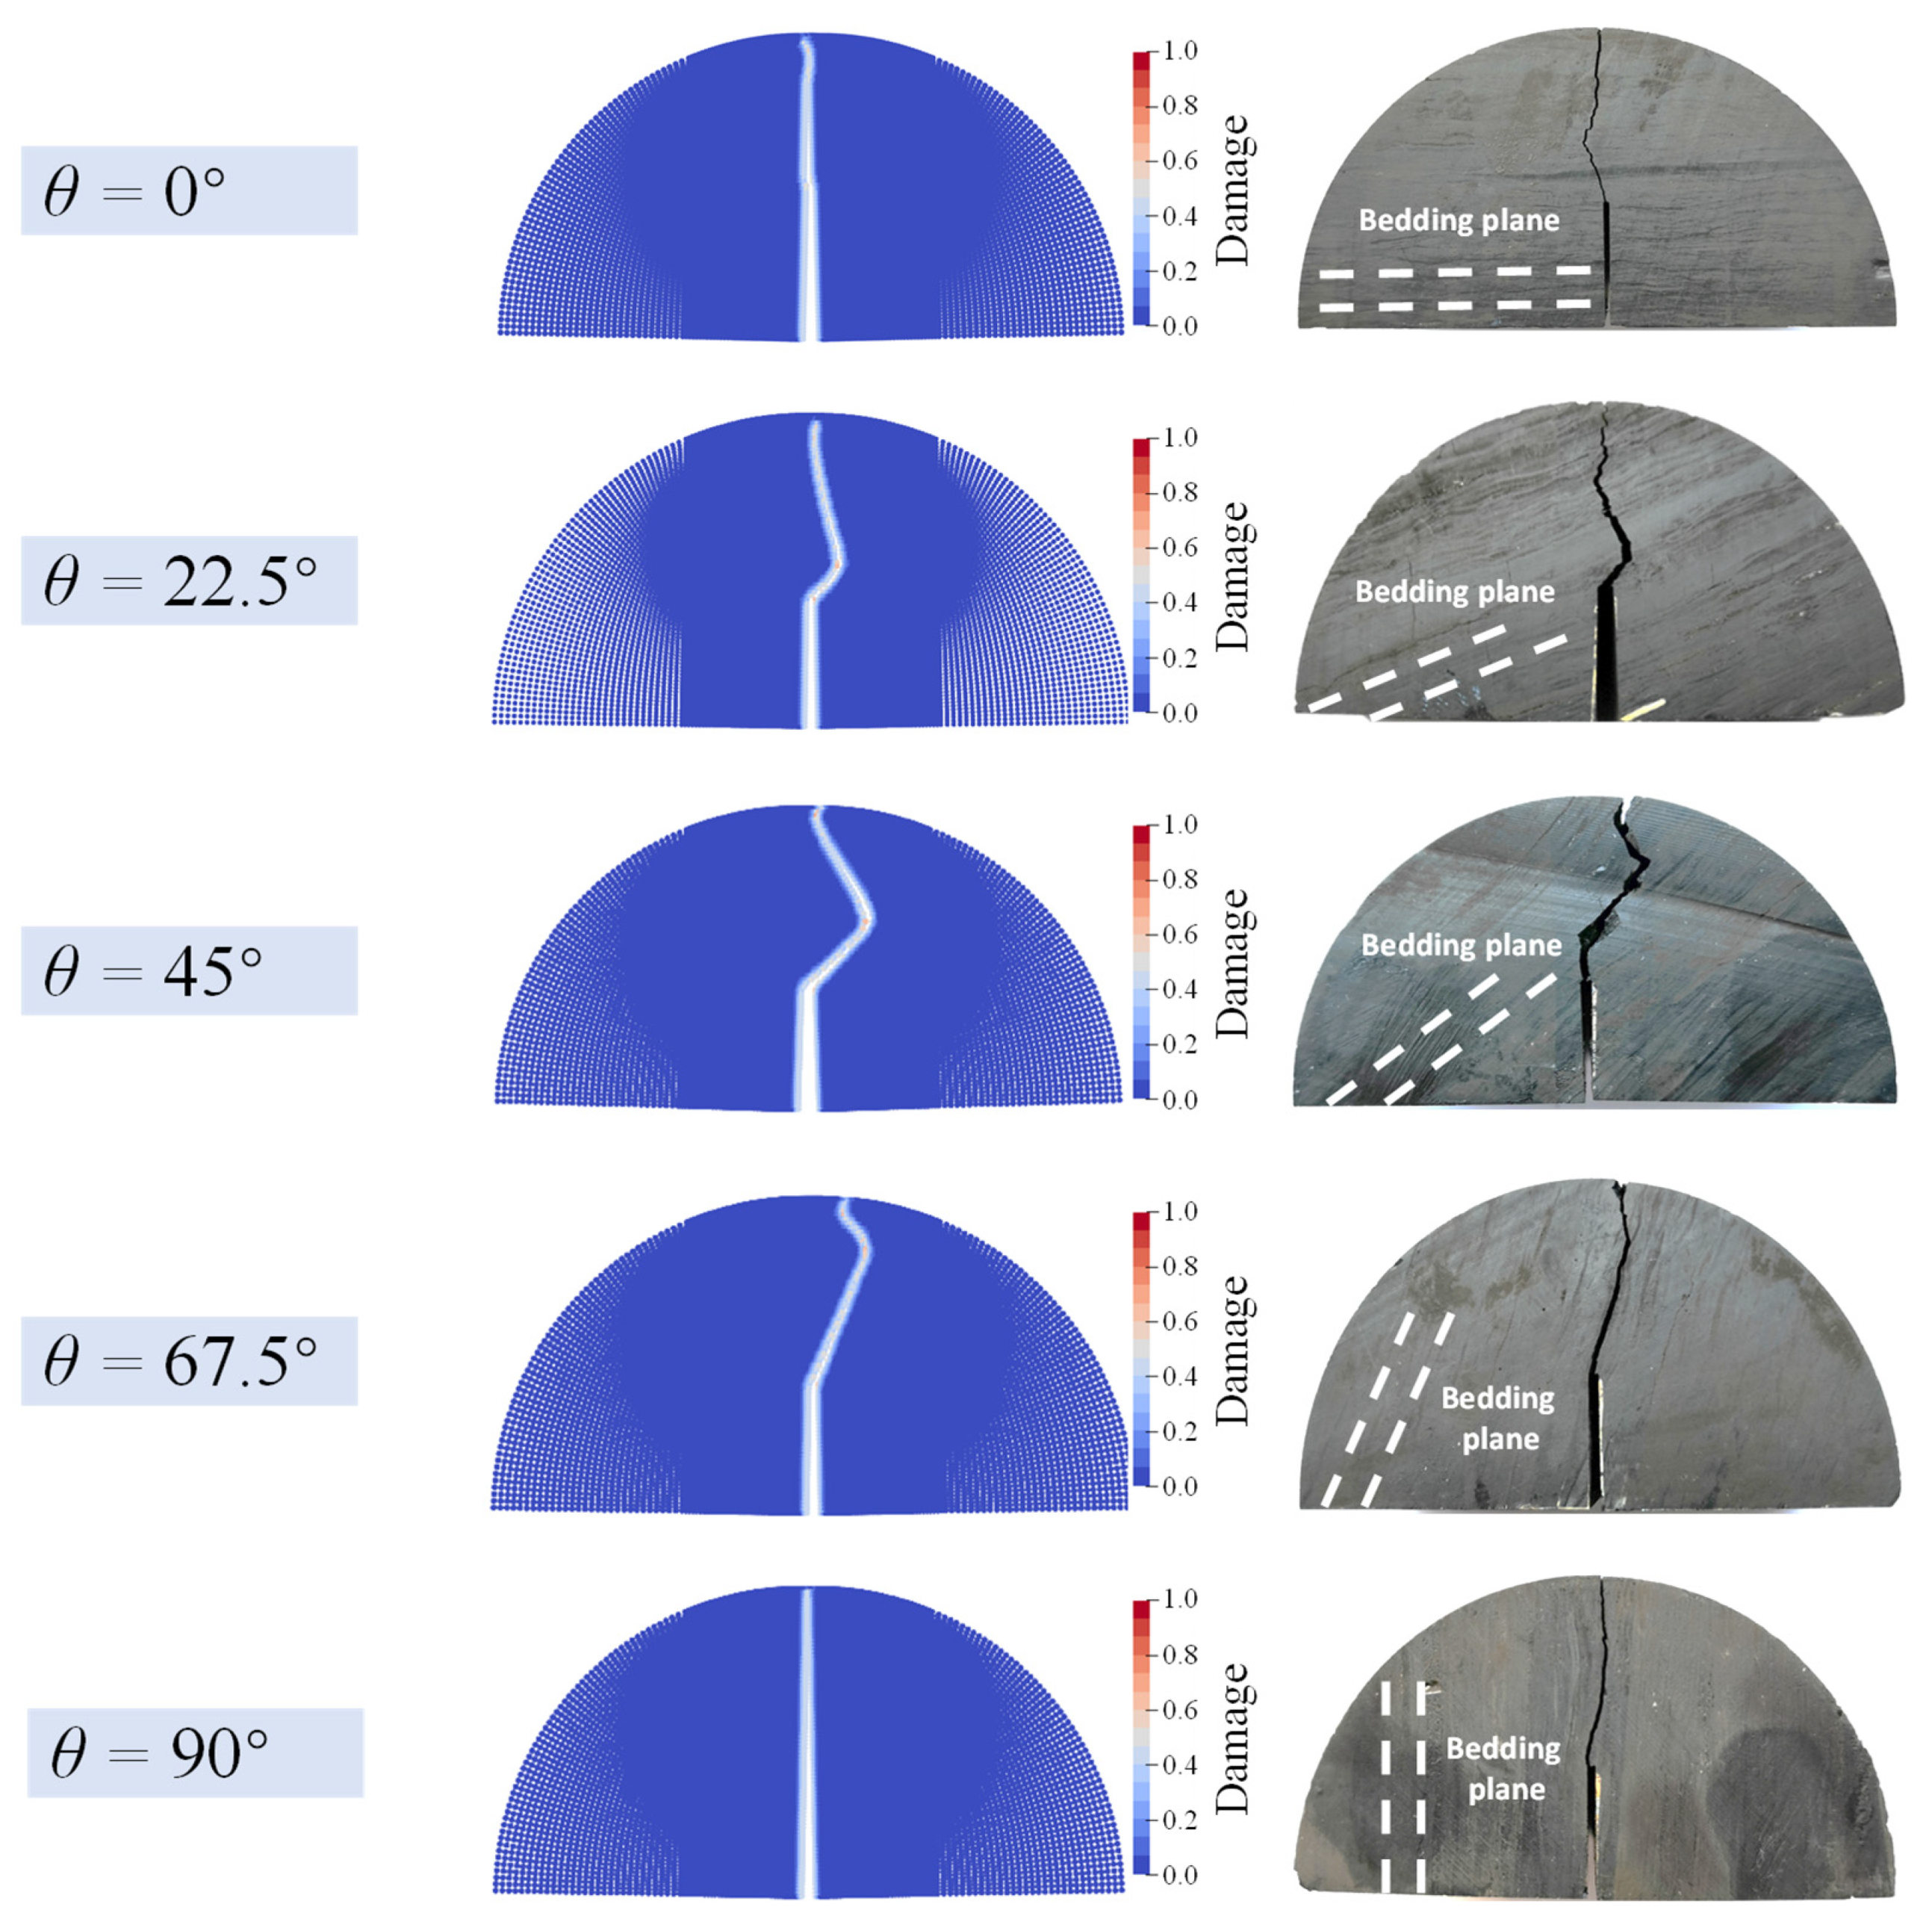
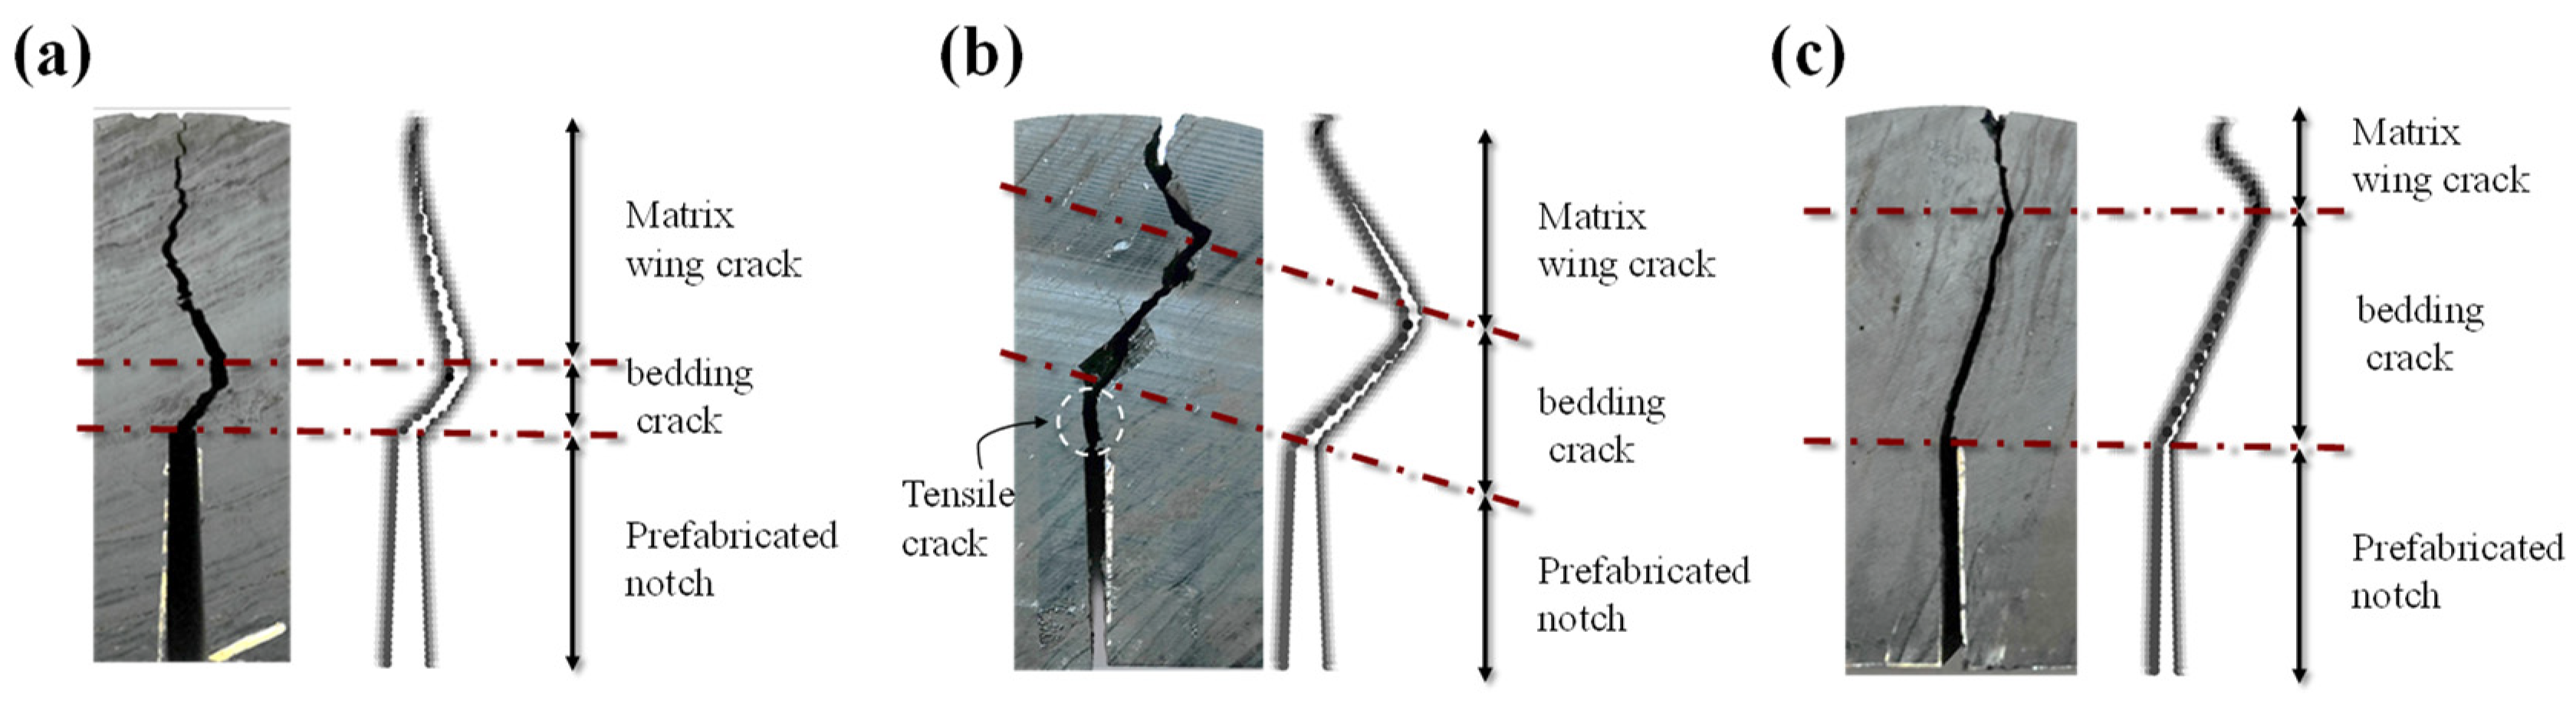
4.2.2. Influence of Bedding Plane Angle
5. Conclusions
Author Contributions
Funding
Data Availability Statement
Conflicts of Interest
References
- Xie, Y.; Cao, P.; Jin, J.; Wang, M. Mixed mode fracture analysis of semi-circular bend (scb) specimen: A numerical study based on extended finite element method. Comput. Geotech. 2017, 82, 157–172. [Google Scholar] [CrossRef]
- Boone, T.J.; Wawrzynek, P.A.; Ingraffea, A.R. Finite element modelling of fracture propagation in orthotropic materials. Eng. Fract. Mech. 1987, 26, 185–201. [Google Scholar] [CrossRef]
- Aliabadi, M.; Sollero, P. Crack growth analysis in homogeneous orthotropic laminates. Compos. Sci. Technol. 1998, 58, 1697–1703. [Google Scholar] [CrossRef]
- Motamedi, D.; Mohammadi, S. Dynamic crack propagation analysis of orthotropic media by the extended finite element method. Int. J. Fract. 2010, 161, 21–39. [Google Scholar] [CrossRef]
- Nikolic, M.; Ibrahimbegovic, A. Rock mechanics model capable of representing initial heterogeneities and full set of 3D failure mechanisms. Comput. Methods Appl. Mech. Eng. 2015, 290, 209–227. [Google Scholar] [CrossRef]
- Nikolić, M.; Karavelić, E.; Ibrahimbegovic, A.; Miščević, P. Lattice Element Models and Their Peculiarities. Arch. Comput. Methods Eng. State Art Rev. 2018, 25, 753–784. [Google Scholar] [CrossRef]
- Wang, L.; Zhou, X. Phase field model for simulating the fracture behaviors of some disc-type specimens. Eng. Fract. Mech. 2020, 226, 106870. [Google Scholar] [CrossRef]
- Lisjak, A.; Tatone, B.S.A.; Grasselli, G.; Vietor, T. Numerical modelling of the anisotropic mechanical behaviour of opalinus clay at the laboratory-scale using FEM/DEM. Rock Mech. Rock Eng. 2012, 47, 187–206. [Google Scholar] [CrossRef]
- Silling, S. Reformulation of elasticity theory for discontinuities and long-range forces. J. Mech. Phys. Solids 2000, 48, 175–209. [Google Scholar] [CrossRef]
- Silling, S.; Epton, M.; Weckner, O.; Xu, J.; Askari, E. Peridynamic states and constitutive modeling. J. Elast. 2007, 88, 151–184. [Google Scholar] [CrossRef]
- Warren, T.; Silling, S.; Askari, A.; Weckner, O.; Epton, M.; Xu, J. A non-ordinary state-based peridynamic method to model solid material deformation and fracture. Int. J. Solids Struct. 2009, 46, 1186–1195. [Google Scholar] [CrossRef]
- Madenci, E.; Dorduncu, M.; Gu, X. Peridynamic least squares minimization. Comput. Methods Appl. Mech. Eng. 2019, 348, 846–874. [Google Scholar] [CrossRef]
- Liu, Q.; Xin, X. Revised non-ordinary state-based peridynamics and a new framework for coupling with finite element method. Eng. Fract. Mech. 2021, 242, 107483. [Google Scholar] [CrossRef]
- Madenci, E.; Barut, A.; Futch, M. Peridynamic differential operator and its applications. Comput. Methods Appl. Mech. Eng. 2016, 304, 408–451. [Google Scholar] [CrossRef]
- Zhu, F.; Zhao, J. Peridynamic modelling of blasting induced rock fractures. J. Mech. Phys. Solids 2021, 153, 104469. [Google Scholar] [CrossRef]
- Zhu, F.; Zhao, J. A Peridynamic Investigation on Crushing of Sand Particles. Géotechnique 2018, 6, 526–540. [Google Scholar] [CrossRef]
- Xu, J.; Askari, A.; Weckner, O.; Silling, S. Peridynamic analysis of impact damage in composite laminates. J. Aerosp. Eng. 2008, 21, 187–194. [Google Scholar] [CrossRef]
- Ghajari, M.; Iannucci, L.; Curtis, P. A peridynamic material model for the analysis of dynamic crack propagation in orthotropic media. Comput. Methods Appl. Mech. Eng. 2014, 276, 431–452. [Google Scholar] [CrossRef]
- Zhang, H.; Qiao, P. A state-based peridynamic model for quantitative elastic and fracture analysis of orthotropic materials. Eng. Fract. Mech. 2019, 206, 147–171. [Google Scholar] [CrossRef]
- Hattori, G.; Trevelyan, J.; Coombs, W. A non-ordinary state-based peridynamics framework for anisotropic materials. Comput. Methods Appl. Mech. Eng. 2018, 339, 416–442. [Google Scholar] [CrossRef]
- Tian, D.; Zhou, X. A continuum-kinematics-inspired peridynamic model of anisotropic continua: Elasticity, damage, and fracture. Int. J. Mech. Sci. 2021, 199, 106413. [Google Scholar] [CrossRef]
- Zeng, X.; Wei, Y. Crack deflection in brittle media with heterogeneous interfaces and its application in shale fracking. J. Mech. Phys. Solids 2017, 101, 235–249. [Google Scholar] [CrossRef]
- Gao, Y.; Liu, Z.; Zeng, Q.; Wang, T.; Zhuang, Z.; Hwang, K.-C. Theoretical and numerical prediction of crack path in the material with anisotropic fracture toughness. Eng. Fract. Mech. 2017, 180, 330–347. [Google Scholar] [CrossRef]
- Hoek, E. Fracture of anisotropic rock. J. S. Afr. Inst. Min. Metall. 1964, 64, 501–518. [Google Scholar]
- Hussain, M.A.; Pu, S.L.; Underwood, J. Strain-Energy-Release Rate for a Crack under Combined Mode I and Mode II; ASTM: West Conshohocken, PA, USA, 1974; Volume 560, pp. 2–28. [Google Scholar]
- Liu, Q.; Xin, X.J.; Ma, J.; Wang, Y. Simulating quasi-static crack propagation by coupled peridynamics least square minimization with finite element method. Eng. Fract. Mech. 2021, 252, 107862. [Google Scholar] [CrossRef]
- Rice, J.R. A path independent integral and the approximate analysis of strain concentration by notches and cracks. J. Appl. Mech. 1968, 35, 379–386. [Google Scholar] [CrossRef]
- Hakim, V.; Karma, A. Crack path prediction in anisotropic brittle materials. Phys. Rev. Lett. 2005, 95, 235501. [Google Scholar] [CrossRef] [PubMed]
- Nuismer, R.J. An energy release rate criterion for mixed mode fracture. Int. J. Fract. 1975, 11, 245–250. [Google Scholar] [CrossRef]
- Amestoy, M.; Leblond, J. Crack paths in plane situations—II. Detailed form of the expansion of the stress intensity factors. Int. J. Solids Struct. 1992, 29, 465–501. [Google Scholar] [CrossRef]
- Saouma, V.E.; Ayari, M.L.; Leavell, D.A. Mixed mode crack propagation in homogeneous anisotropic solids. Eng. Fract. Mech. 1987, 27, 171–184. [Google Scholar] [CrossRef]
- Ayari, M.L.; Ye, Z. Maximum strain theory for mixed mode crack propagation in anisotropic solids. Eng. Fract. Mech. 1995, 52, 389–400. [Google Scholar] [CrossRef]
- Yau, J.; Wang, S.; Corten, H. A Mixed-Mode Crack Analysis of Isotropic Solids Using Conservation Laws of Elasticity. J. Appl. Mech. Trans. ASME 1980, 47, 335–341. [Google Scholar] [CrossRef]
- Dipasquale, D.; Sarego, G.; Zaccariotto, M.; Galvanetto, U. Dependence of crack paths on the orientation of regular 2D peridynamic grids. Eng. Fract. Mech. 2016, 160, 248–263. [Google Scholar] [CrossRef]
- Bažant, Z.P.; Nguyen, H.T.; Donmez, A.A. Critical Comparison of Phase-Field, Peridynamics, and Crack Band Model M7 in Light of Gap Test and Classical Fracture Tests. J. Appl. Mech. 2022, 89, 061008. [Google Scholar] [CrossRef]
- Ni, T.; Zaccariotto, M.; Zhu, Q.-Z.; Galvanetto, U. Static solution of crack propagation problems in Peridynamics. Comput. Methods Appl. Mech. Eng. 2019, 346, 126–151. [Google Scholar] [CrossRef]
- Huang, D.; Lu, G.; Wang, C.; Qiao, P. An extended peridynamic approach for deformation and fracture analysis. Eng. Fract. Mech. 2015, 141, 196–211. [Google Scholar] [CrossRef]
- Kilic, B.; Madenci, E. An adaptive dynamic relaxation method for quasi-static simulations using the peridynamic theory. Theor. Appl. Fract. Mech. 2010, 53, 194–204. [Google Scholar] [CrossRef]
- Ayatollahi, M.R.; Aliha MR, M.; Hasani, M.M. Mixed mode brittle fracture in PMMA—An experimental study using SCB specimens. Mater. Sci. Eng. A 2006, 417, 348–356. [Google Scholar] [CrossRef]
- Wang, W.; Teng, T. Experimental study on anisotropic fracture characteristics of coal using notched semi-circular bend specimen. Theor. Appl. Fract. Mech. 2022, 122, 103559. [Google Scholar] [CrossRef]
- Ju, M.; Li, J.; Li, J.; Zhao, J. Loading rate effects on anisotropy and crack propagation of weak bedding plane-rich rocks. Eng. Fract. Mech. 2020, 230, 106983. [Google Scholar] [CrossRef]

| Case 1 | Case 2 | Case 3 | Case 4 | |
|---|---|---|---|---|
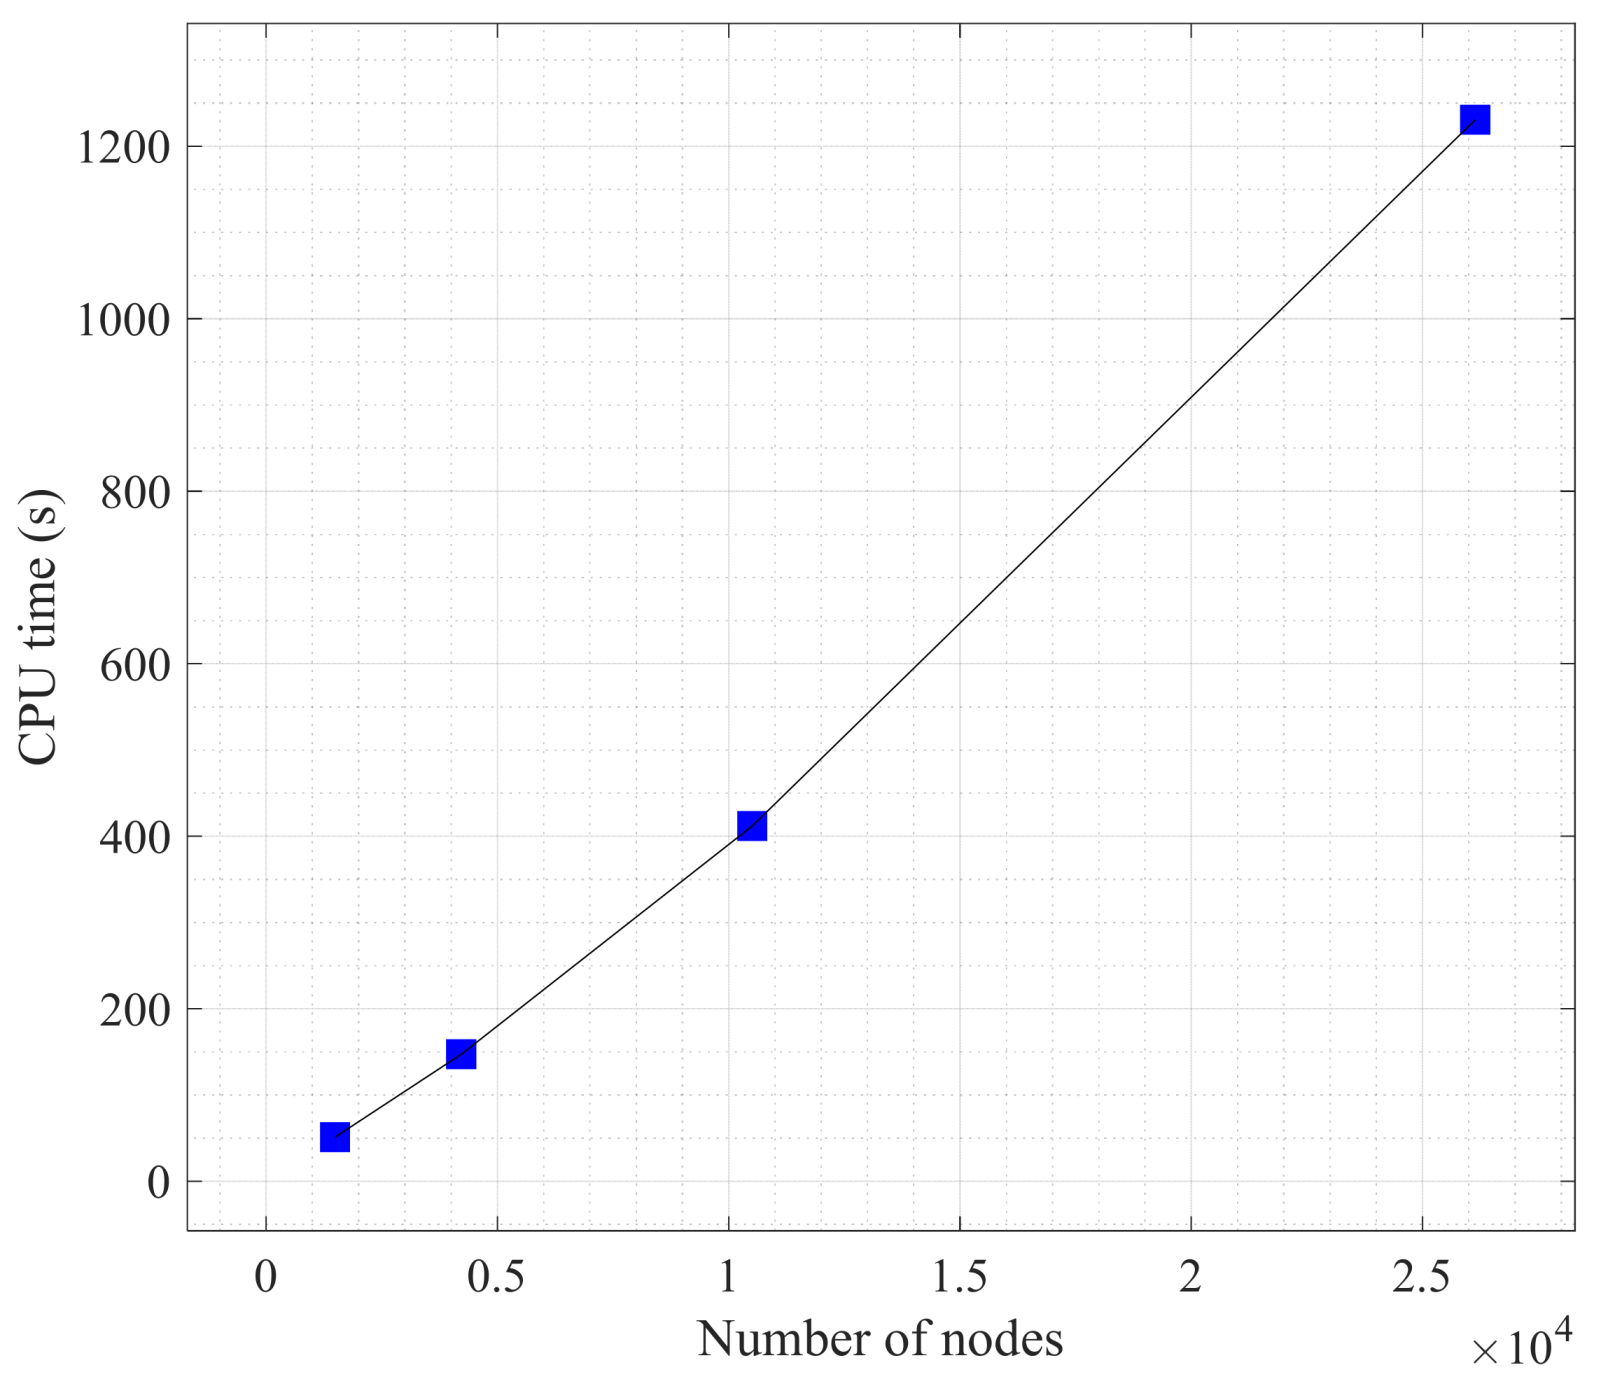
| Number of nodes | 26,138 | 10,512 | 4218 | 1490 |
| CPU time (s) | 1230.91 | 411.93 | 147.14 | 50.95 |
Disclaimer/Publisher’s Note: The statements, opinions and data contained in all publications are solely those of the individual author(s) and contributor(s) and not of MDPI and/or the editor(s). MDPI and/or the editor(s) disclaim responsibility for any injury to people or property resulting from any ideas, methods, instructions or products referred to in the content. |
© 2023 by the authors. Licensee MDPI, Basel, Switzerland. This article is an open access article distributed under the terms and conditions of the Creative Commons Attribution (CC BY) license (https://creativecommons.org/licenses/by/4.0/).
Share and Cite
Tian, K.; Zhu, Z.; Sheng, Q.; Tian, N. An Anisotropic Peridynamic Model for Simulating Crack Propagation in Isotropic and Anisotropic Rocks. Materials 2023, 16, 7604. https://doi.org/10.3390/ma16247604
Tian K, Zhu Z, Sheng Q, Tian N. An Anisotropic Peridynamic Model for Simulating Crack Propagation in Isotropic and Anisotropic Rocks. Materials. 2023; 16(24):7604. https://doi.org/10.3390/ma16247604
Chicago/Turabian StyleTian, Kaiwei, Zeqi Zhu, Qian Sheng, and Ning Tian. 2023. "An Anisotropic Peridynamic Model for Simulating Crack Propagation in Isotropic and Anisotropic Rocks" Materials 16, no. 24: 7604. https://doi.org/10.3390/ma16247604
APA StyleTian, K., Zhu, Z., Sheng, Q., & Tian, N. (2023). An Anisotropic Peridynamic Model for Simulating Crack Propagation in Isotropic and Anisotropic Rocks. Materials, 16(24), 7604. https://doi.org/10.3390/ma16247604