


Non-Destructive Testing Methods for In Situ Crack Measurements and Morphology Analysis with a Focus on a Novel Approach to the Use of the Acoustic Emission Method


Abstract
:1. Introduction
2. Selected Methods for the Measurement of Cracks
2.1. Devices Based on Manual Readings without Data Registration
2.1.1. Manual Crack Width Measurement Methods
2.1.2. Manual Methods of Monitoring Crack Width Growth
2.2. Digital Devices with Data Recording
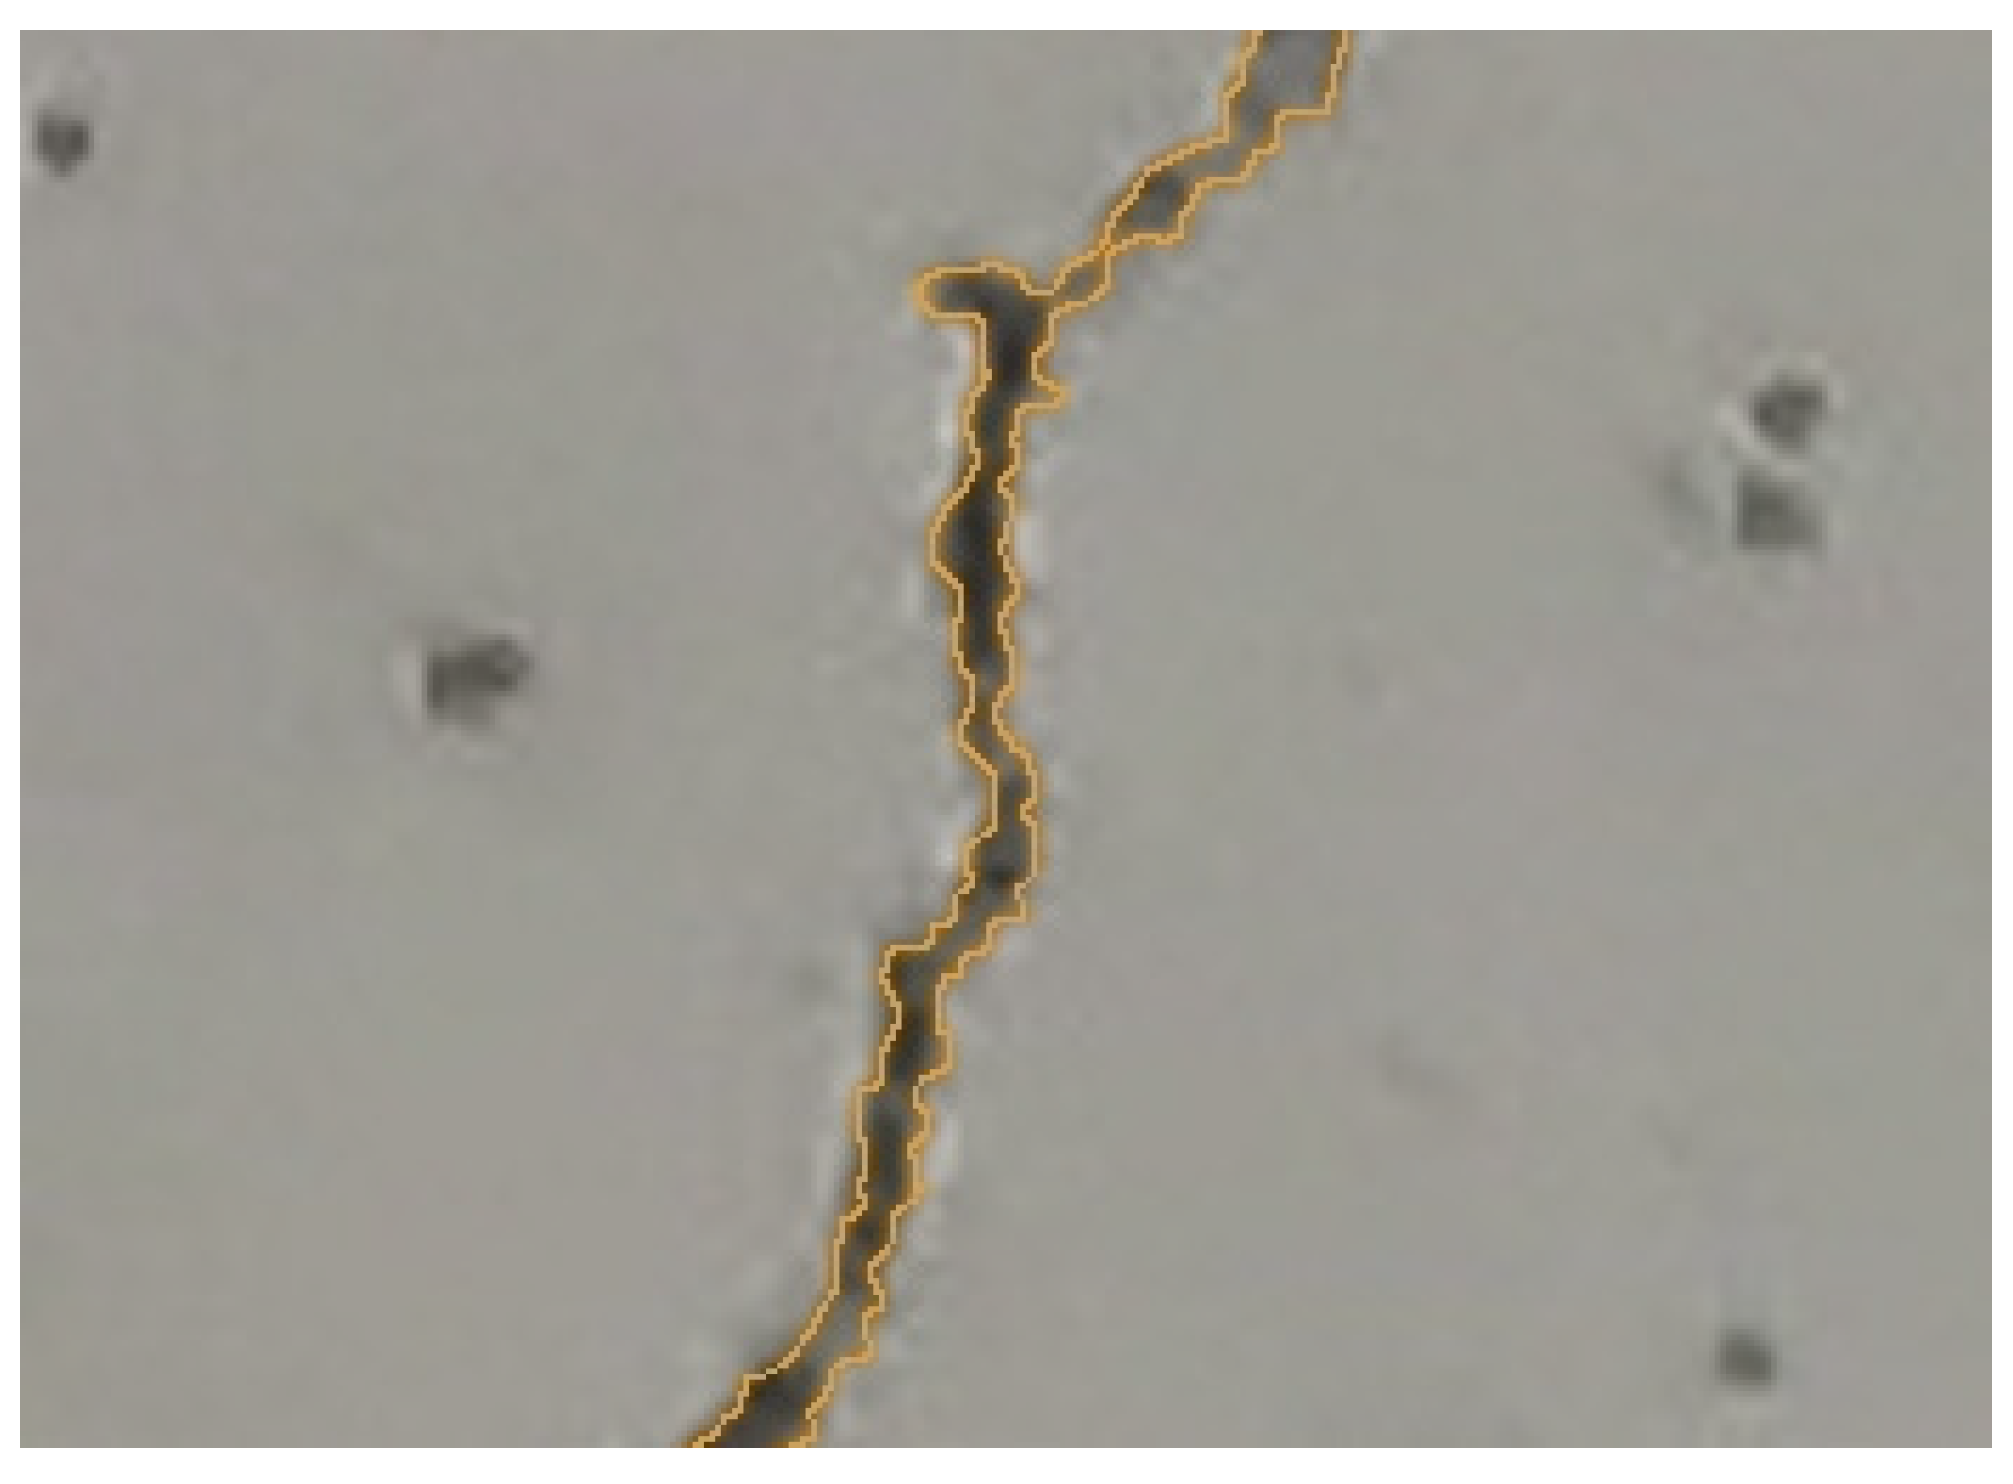
2.2.1. Digital Crack Width Measurement Methods
2.2.2. Digital Methods of Monitoring Crack Width Growth
3. Selected Methods for Locating Cracks in a Structure
3.1. Digital Radiography (X-ray)
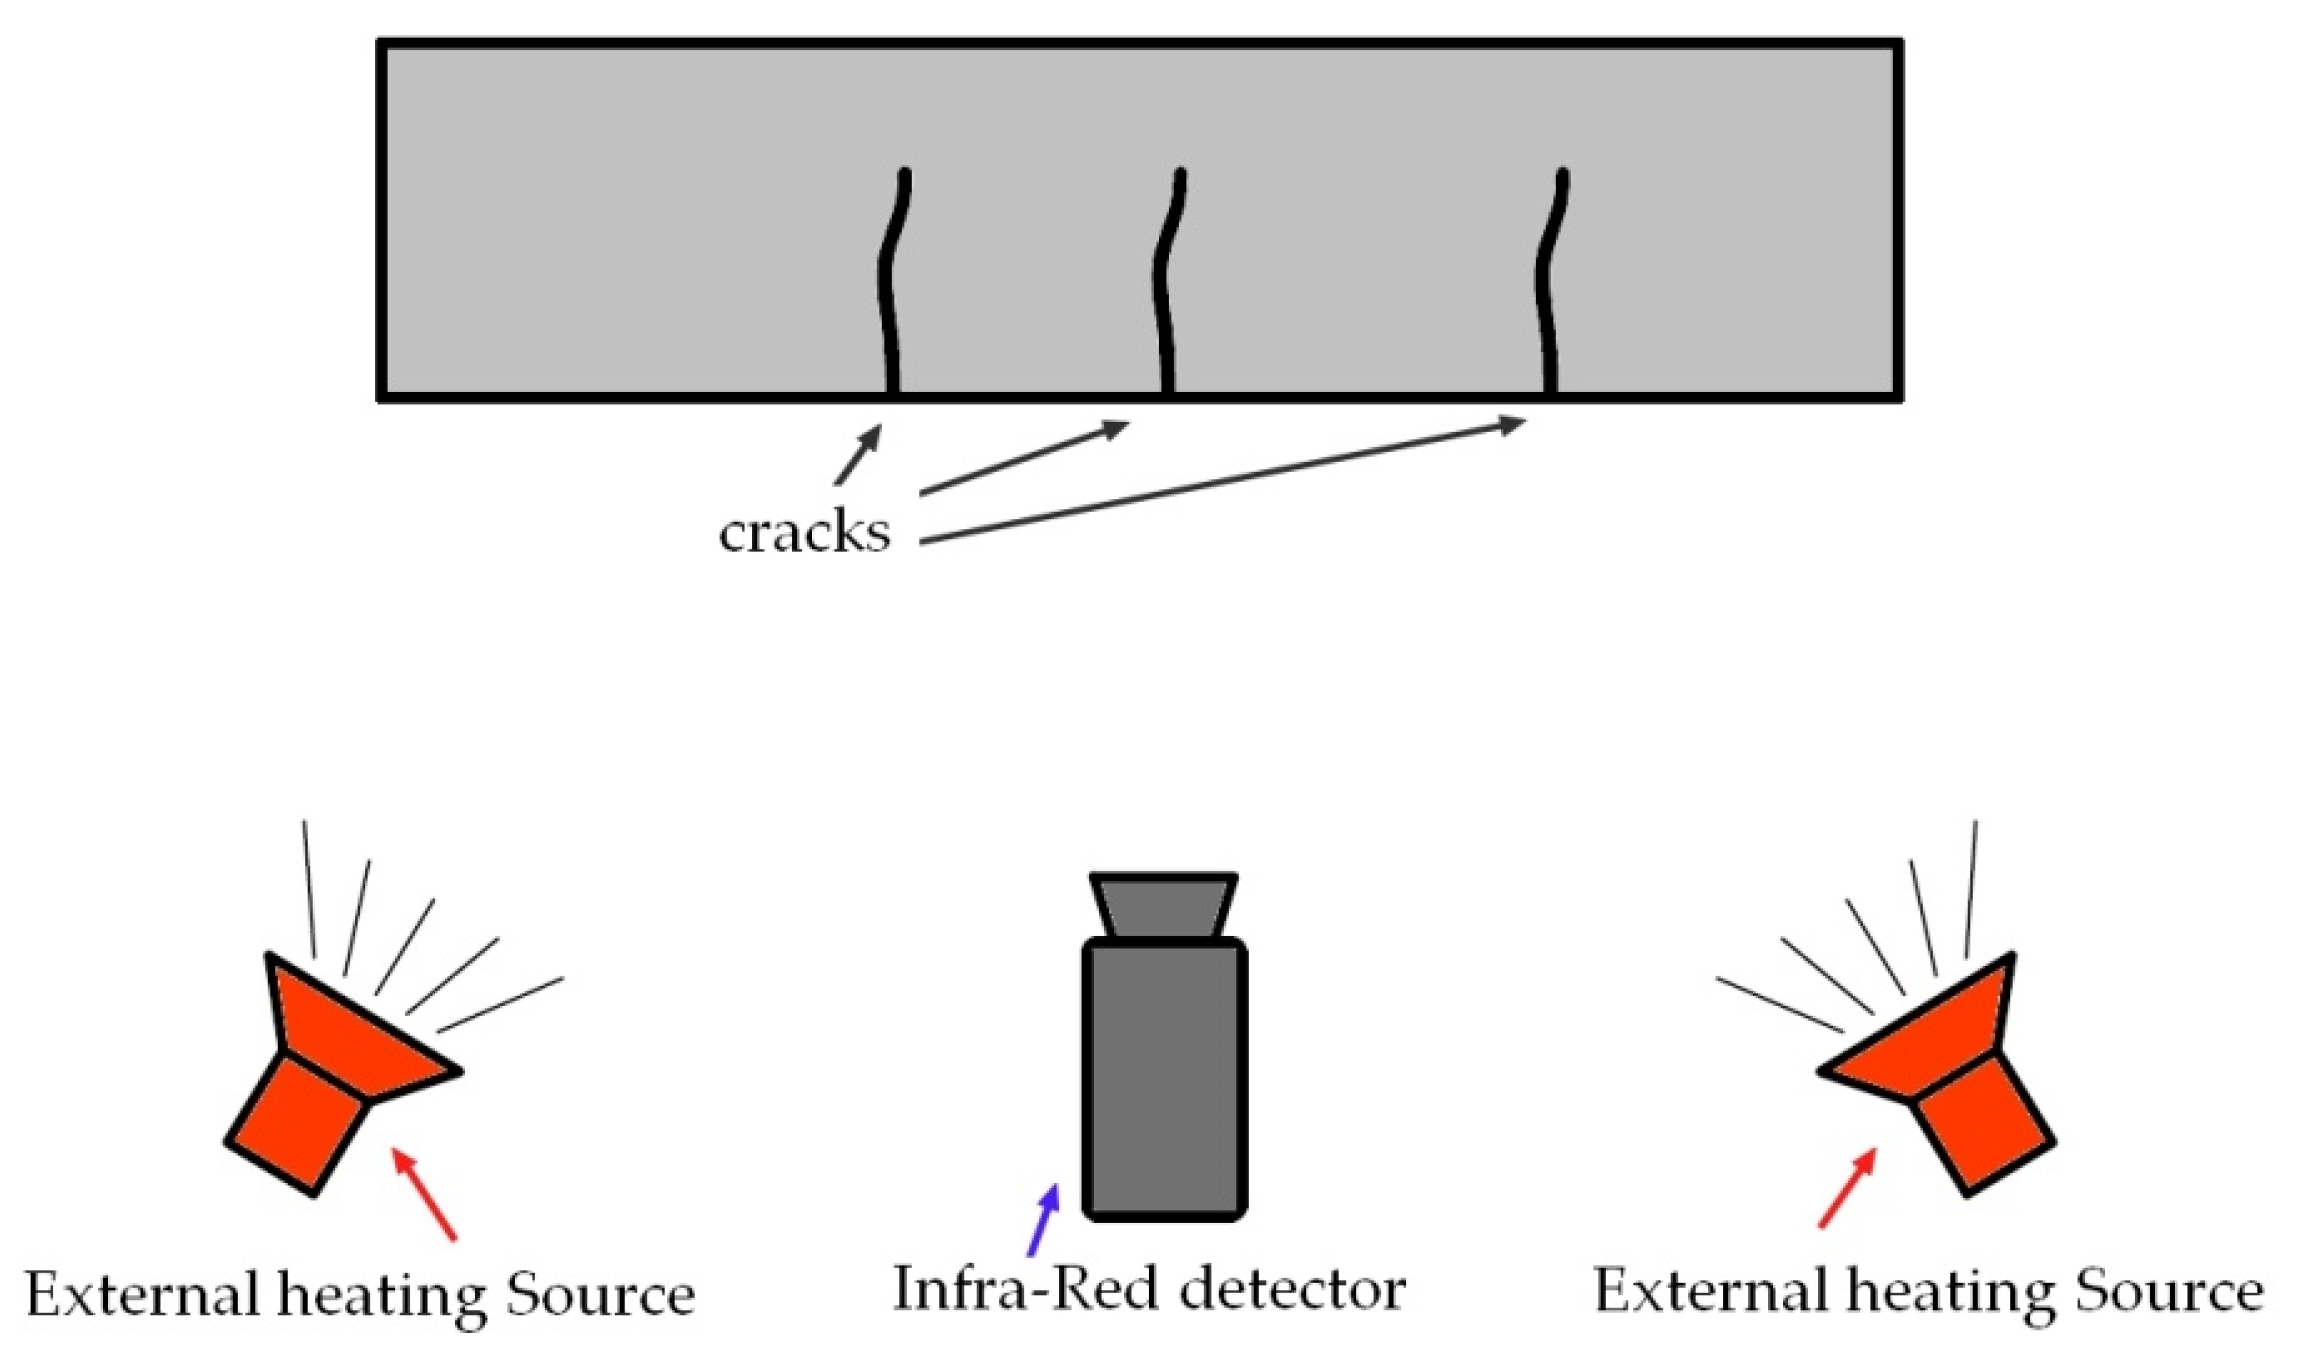
3.2. Thermography
3.3. Acoustic Methods
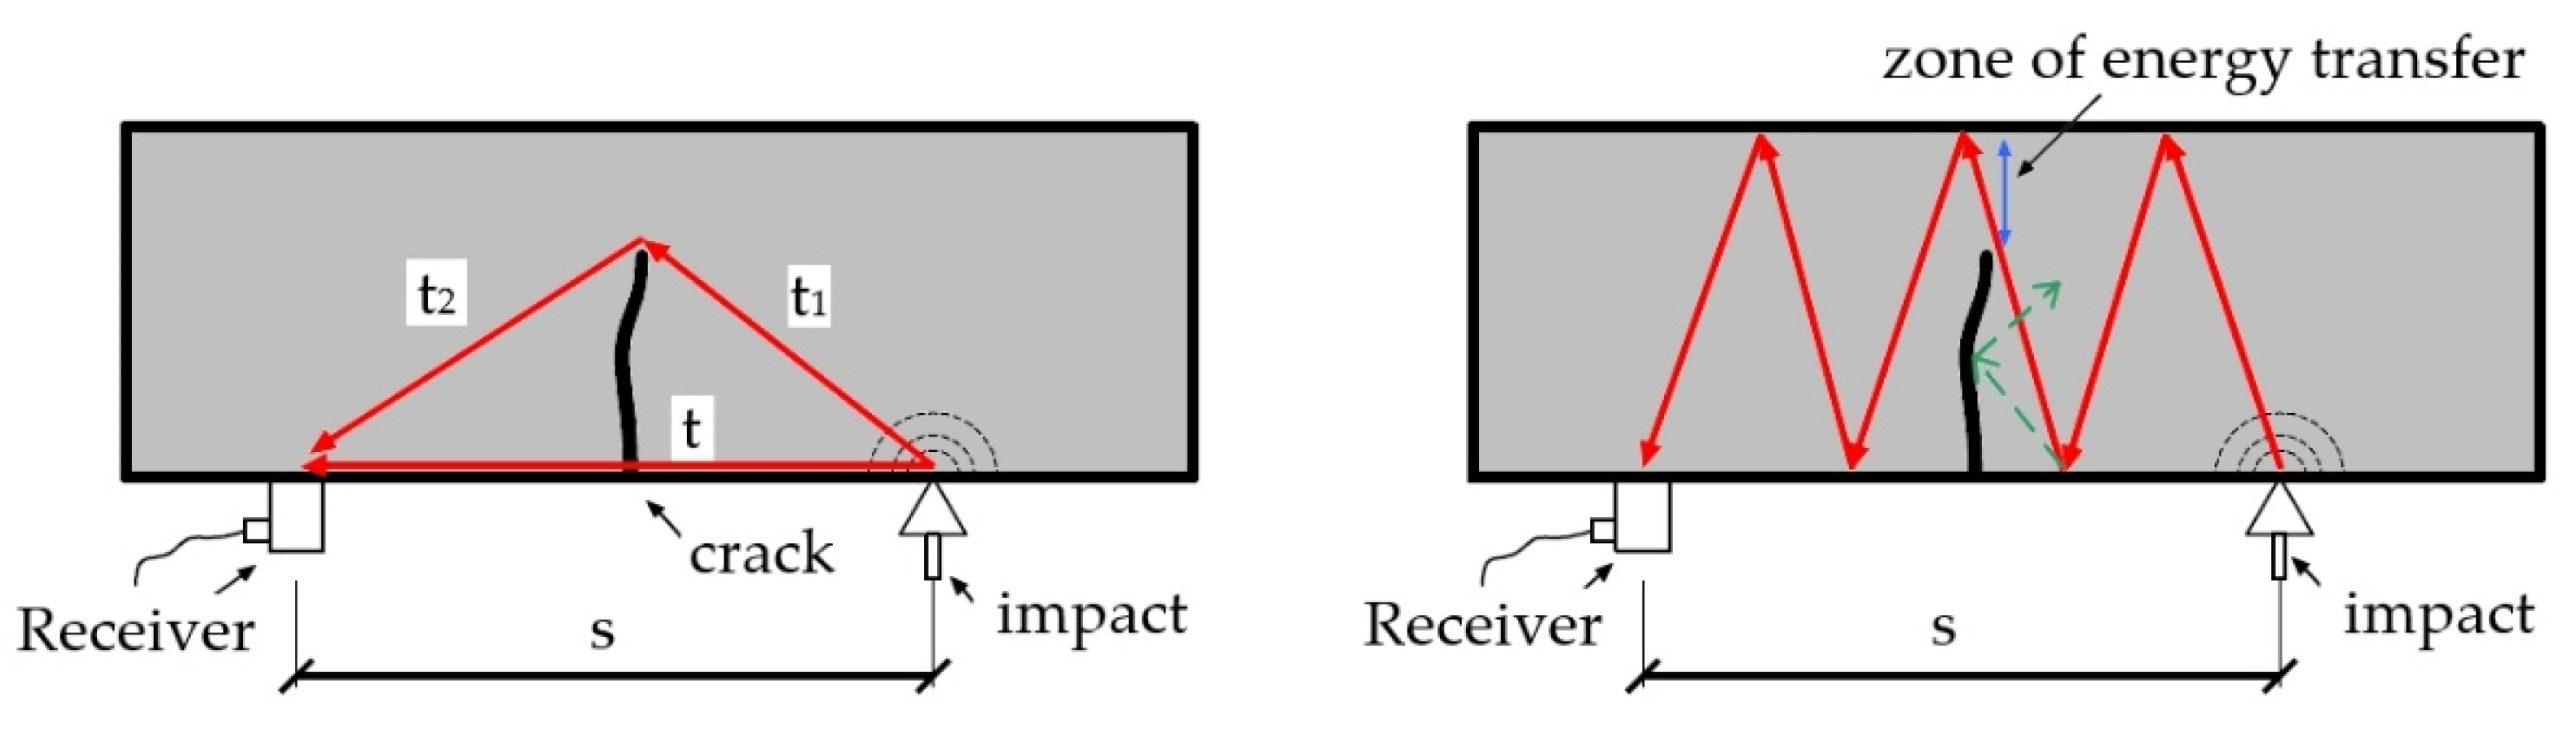
3.3.1. Impact Echo Method
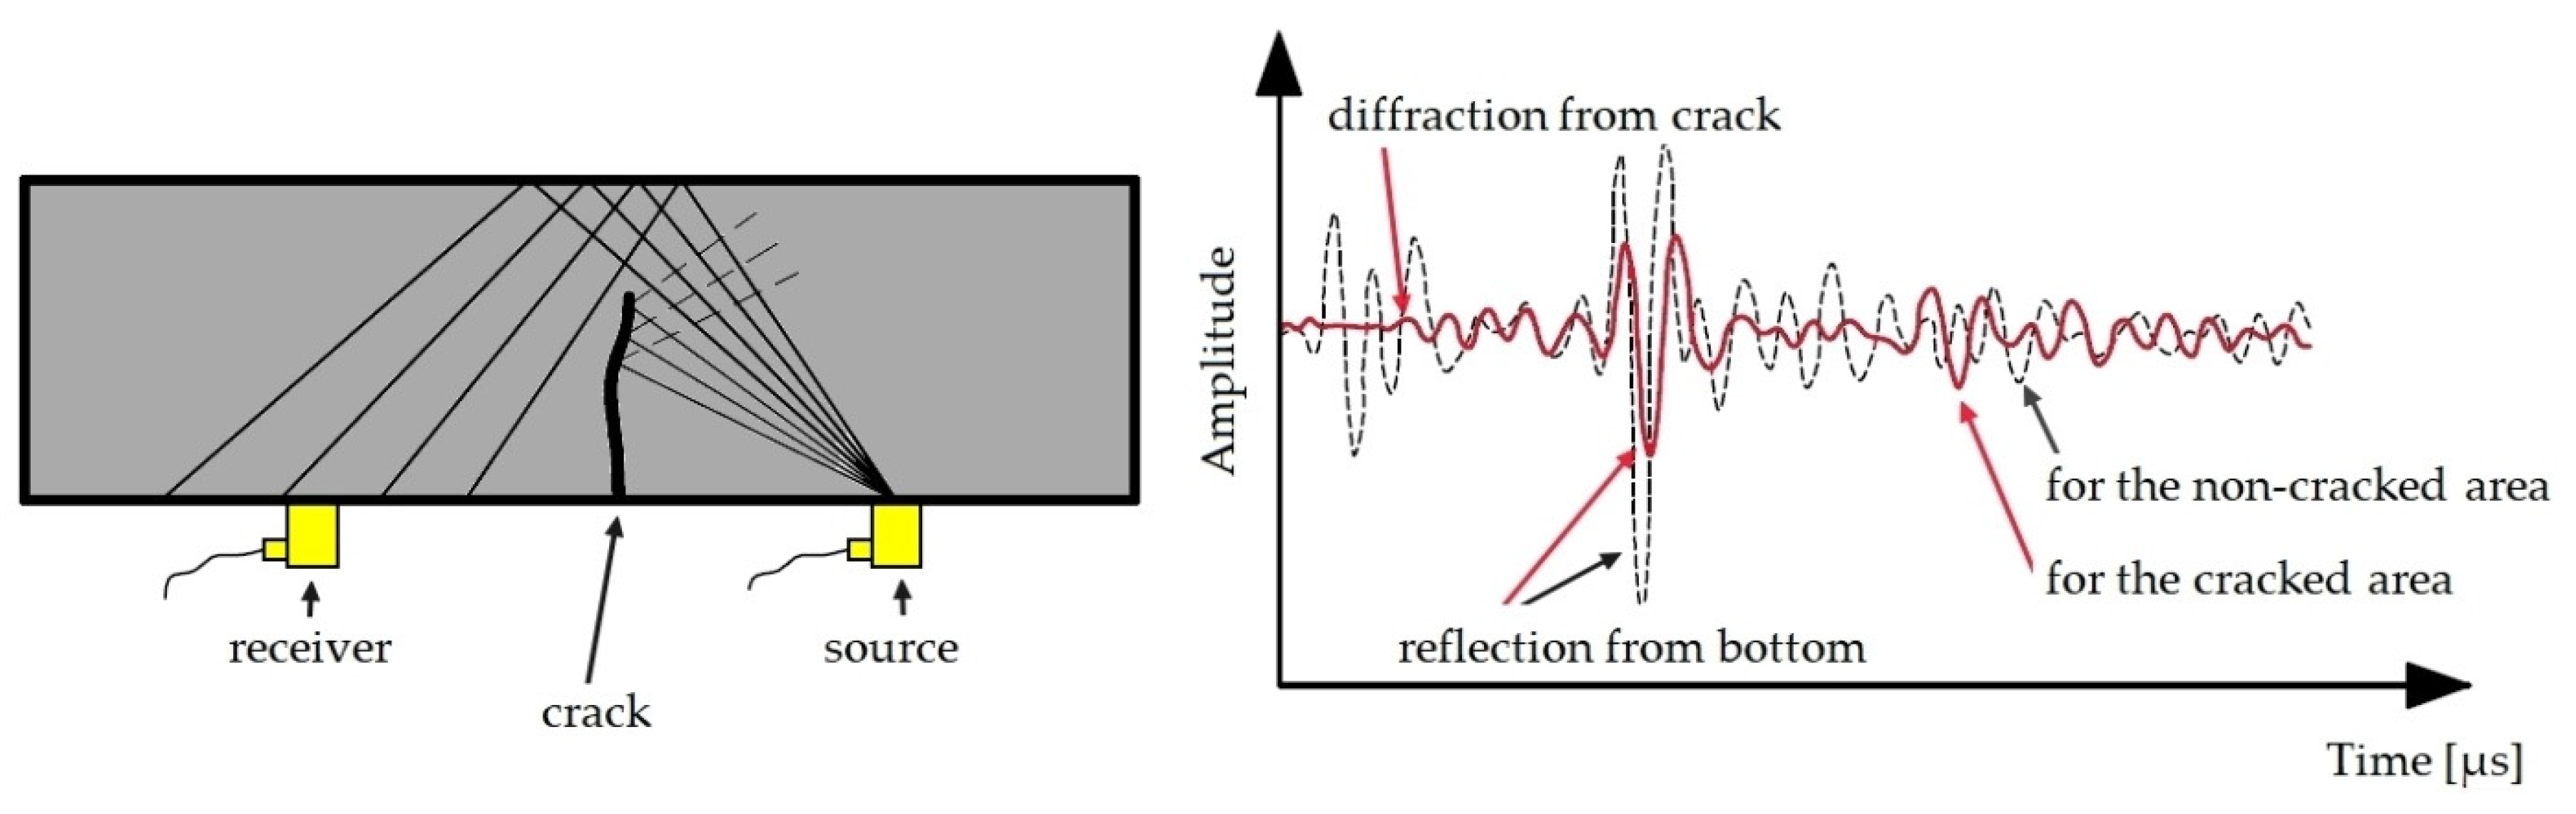
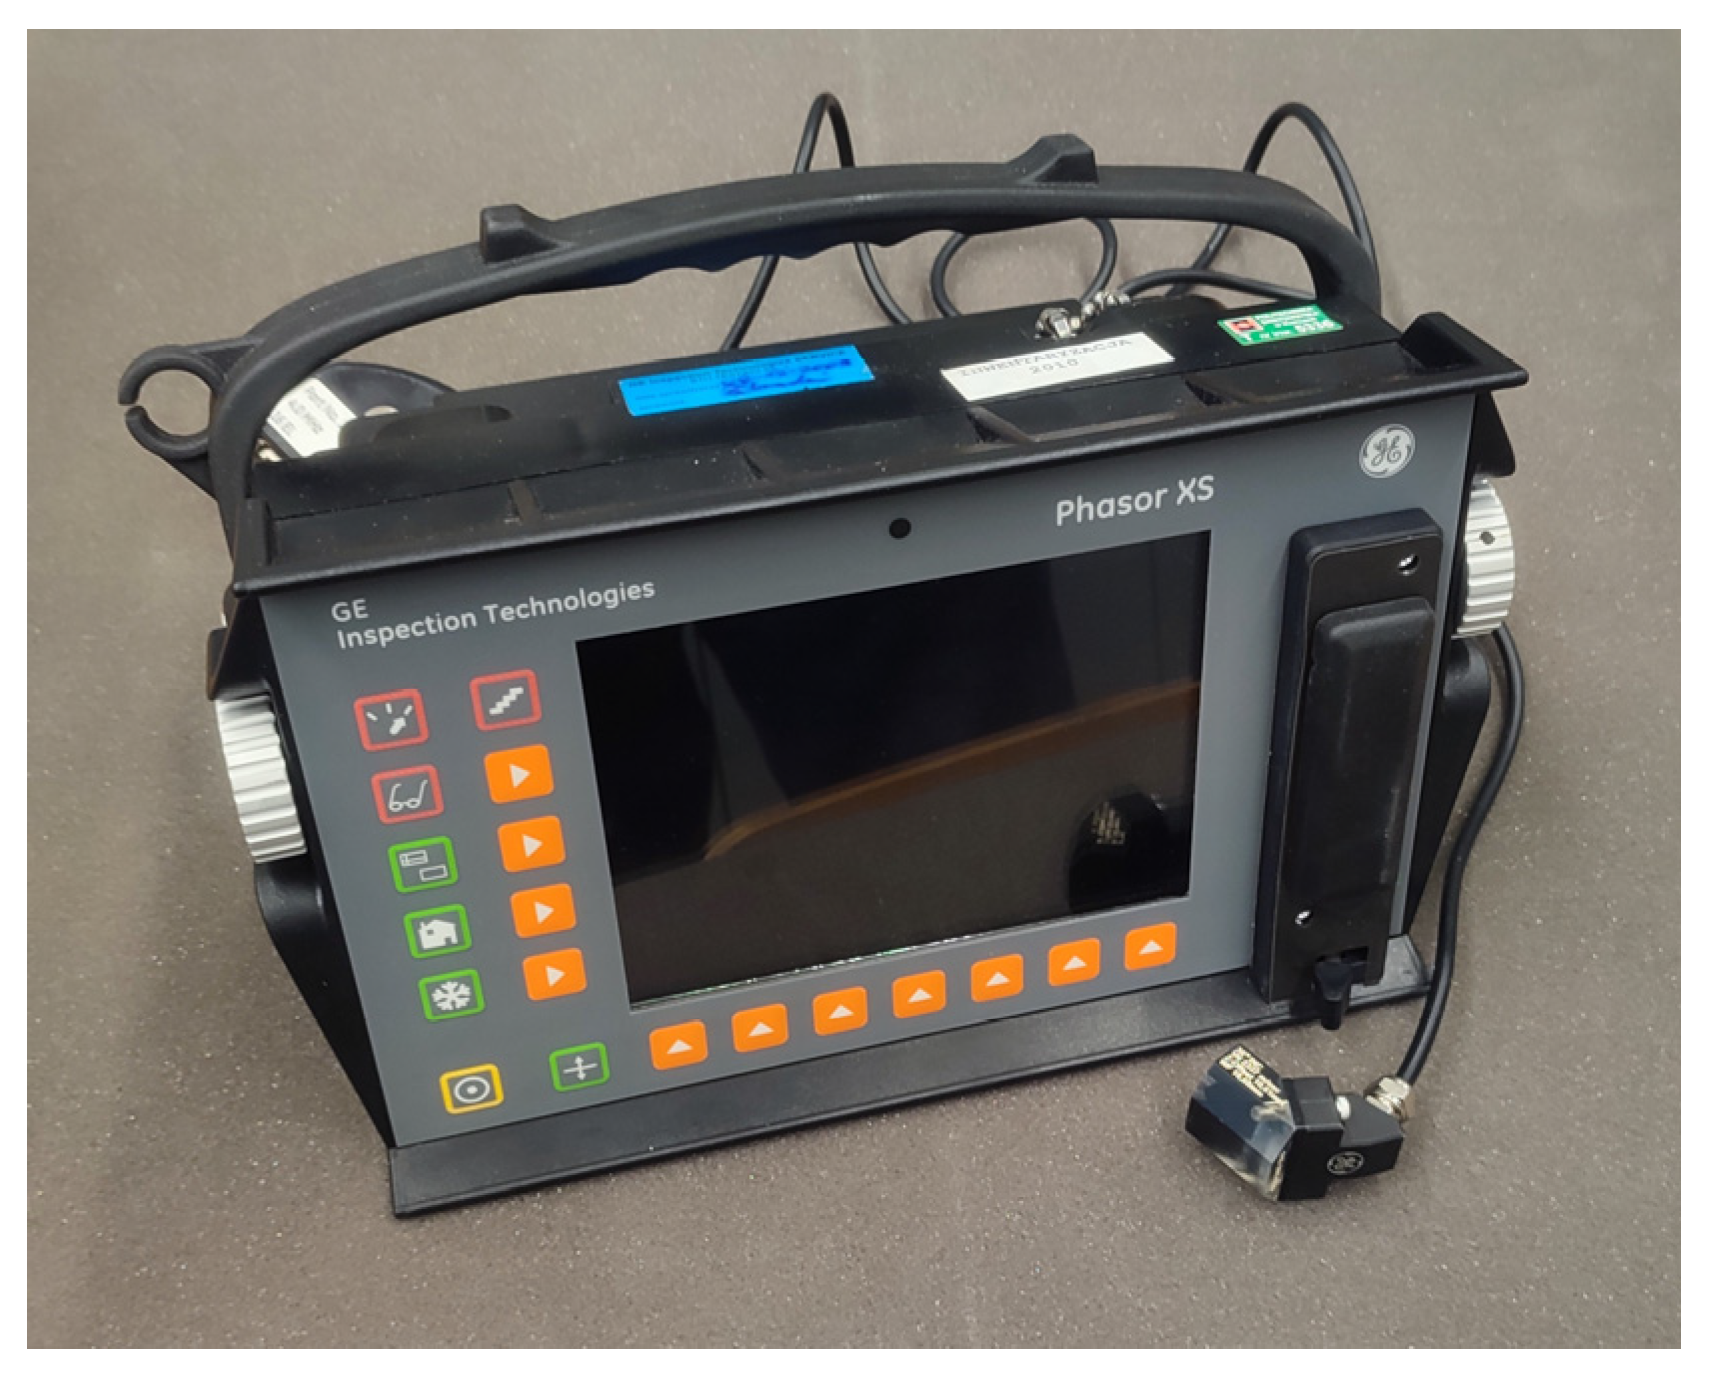
3.3.2. Ultrasonic Flaw Detectors
3.3.3. The Acoustic Emission Method (EA or AT)
4. Conclusions
Author Contributions
Funding
Institutional Review Board Statement
Informed Consent Statement
Conflicts of Interest
References
- Knauf, M. Obliczanie Konstrukcji Żelbetowych Według EUROKODU 2; PWN: Warsaw, Poland, 2015. [Google Scholar]
- Marsh, B.K.; Nixon, P.J. Assuring performance of concrete structures through a durability audit. In Proceedings of the International Conference Concrete in the Service of Mankind, Appropriate Concrete Technology, Dundee, UK, 24–26 June 1996; pp. 49–59. [Google Scholar]
- Brandt, A.M. Trwałość obiektów inżynierskich a zrównoważony rozwój. In Proceedings of the Konferencja Problemy Naukowo-Badawcze Budownictwa Białystok-Krynica, Krynica, Poland, 21–26 September 2008. [Google Scholar]
- Dane Statystyczne. Available online: https://www.gov.pl/web/gddkia/dane-statystyczne (accessed on 28 August 2023).
- Krampikowska, A. The Assessment of the Effect of the Number of Descriptors on the Accuracy of Acoustic Emission-Based Identification of Destructive Processes in Concrete Structures [Ocena Wpływu Liczby Deskryptorów na Dokładność Identyfikacji Procesów Destrukcyjnych w Konstrukcjach Betonowych Przy Zastosowaniu Metody Emisji Akustycznej]; Series of Monographs no. M159; Publishing Kielce University of Technology: Kielce, Poland, 2023; pp. 1–223. ISBN 978-83-66678-40-8. [Google Scholar]
- International Federation for Structural Concrete (fib). Model Code 2010 (First Complete Draft); International Federation for Structural Concrete (fib): Lausanne, Switzerland, 2010; pp. 288–292. [Google Scholar]
- Ajdukiewicz, A. Aspekty trwałości i wpływu na środowisko w projektowaniu konstrukcji betonowych. Przegląd Bud. 2011, 8, 20–29. [Google Scholar]
- PN-EN 13670:2011; Execution of Concrete Structures. Polish Committee for Standardization: Warszawa, Poland, 2011.
- Raczkiewicz, W.; Bacharz, M.; Bacharz, K.; Teodorczyk, M. Reinforcement Corrosion Testing in Concrete and Fiber Reinforced Concrete Specimens Exposed to Aggressive External Factors. Materials 2023, 16, 1174. [Google Scholar] [CrossRef] [PubMed]
- Moore, D.G.; Klodt, D.T.; Hansen, J. Protection of Steel in Prestressed Concrete Bridges; NCHRP Report 90; Transportation Research Board: Washington, DC, USA, 1970. [Google Scholar]
- Swamy, R.N. Durability of Rebars in Concrete, Durability of Concrete, G.M. Idorn International Symposium, ACI SP-131. In Proceedings of the 1990 Annual ACI Convention, Toronto, ON, Canada; American Concrete Institute: Detroit, MI, USA, 1990; pp. 67–98. [Google Scholar]
- Drobiec, Ł.; Jasiński, R.; Piekarczyk, A. Diagnostyka Konstrukcji Żelbetowych: Metodologia, Badania Polowe, Badania Laboratoryjne Betonu i Stali; Publisher PWN: Warsaw, Poland, 2010; pp. 61–115. [Google Scholar]
- NeoStrain. Available online: http://www.neostrain.pl/en/index.php (accessed on 28 August 2023).
- PTC Instruments. Available online: https://www.ptc1.com/brinell-scope (accessed on 28 August 2023).
- Gilson. Available online: https://www.globalgilson.com/blog/concrete-cracking (accessed on 28 August 2023).
- SHM System. Available online: https://www.shmsystem.pl/product/shm-x-crackmeter/?lang=en (accessed on 22 October 2023).
- Zhao, S.; Kang, F.; Li, J. Non-Contact Crack Visual Measurement System Combining Improved U-Net Algorithm and Canny Edge Detection Method with Laser Rangefinder and Camera. Appl. Sci. 2022, 12, 10651. [Google Scholar] [CrossRef]
- Nyathi, M.A.; Bai, J.; Wilson, I.D. Concrete Crack Width Measurement Using a Laser Beam and Image Processing Algorithms. Appl. Sci. 2023, 13, 4981. [Google Scholar] [CrossRef]
- Niemeier, W.; Riedel, B.; Fraser, C.S.; Neuss, H.; Stratmann, R.; Ziem, E.A. New Digital Crack Monitoring System for Measuring and Documentation of Width of Cracks in Concrete Structures. In Proceedings of the 13th FIG International Symposium on Deformation Measurements and Analysis, Lisbon, Portugal, 12–15 May 2008. [Google Scholar]
- Barkavi, T.; Natarajan, C. Processing Digital Image for Measurement of Crack Dimensions in Concrete. Civ. Eng. Infrastruct. J. 2019, 52, 11–22. [Google Scholar] [CrossRef]
- Parente, L.; Falvo, E.; Castagnetti, C.; Grassi, F.; Mancini, F.; Rossi, P.; Capra, A. Image-Based Monitoring of Cracks: Effectiveness Analysis of an Open-Source Machine Learning-Assisted Procedure. J. Imaging 2022, 8, 22. [Google Scholar] [CrossRef]
- Albareda-Valls, A.; Bustos Herrera, A.; Zamora Mestre, J.L.; Zaribaf, S.S. Image Post-Processing Method for Quantification of Cracking in RC Precast Beams under Bending. Buildings 2018, 8, 158. [Google Scholar] [CrossRef]
- Rivera, J.P.; Josipovic, G.; Lejeune, E.; Luna, B.N.; Whittaker, A.S. Automated Detection and Measurement of Cracks in Reinforced Concrete Components. ACI Struct. J. 2015, 112, 397–405. [Google Scholar] [CrossRef]
- Sarker, M.M.; Ali, T.A.; Abdelfatah, A.; Yehia, S.; Elaksher, A. A cost-effective method for crack detection and measurement on concrete surface. In Proceedings of the 5th International Workshop LowCost 3D–Sensors, Algorithms, Applications, International Archives of the Photogrammetry, Remote Sensing and Spatial Information Sciences, Hamburg, Germany, 28–29 November 2017; pp. 237–241. [Google Scholar]
- Wang, G.; Tse, P.W.; Yuan, M. Automatic internal crack detection from a sequence of infrared images with triple-threshold Canny edge detector. Meas. Sci. Technol. 2017, 29, 025403. [Google Scholar] [CrossRef]
- Wang, R.; Qi, T.; Lei, B.; Li, Y.; Zhu, X. Study on the characteristic extraction of tunnel lining cracks. Chin. J. Rock Mech. Eng. 2015, 34, 1211–1217. [Google Scholar]
- Rao, A.S.; Nguyen, T.; Palaniswami, M.; Ngo, T. Vision-based automated crack detection using convolutional neural networks for condition assessment of infrastructure. Structural Health Monit. 2021, 20, 2124–2142. [Google Scholar] [CrossRef]
- Jahanshahi, M.R.; Masri, S.F. Adaptive vision-based crack detection using 3D scene reconstruction for condition assessment of structures. Autom. Constr. 2012, 22, 567–576. [Google Scholar] [CrossRef]
- Wang, B.; Zhao, W.; Gao, P.; Zhang, Y.; Wang, Z. Crack Damage Detection Method via Multiple Visual Features and Efficient Multi-Task Learning Model. Sensors 2018, 18, 1796. [Google Scholar] [CrossRef] [PubMed]
- Chun, P.J.; Izumi, S.; Yamane, T. Automatic detection method of cracks from concrete surface imagery using two-step light gradient boosting machine. Comput. Aided Civ. Infrastruct. Eng. 2021, 36, 61–72. [Google Scholar] [CrossRef]
- Gain Express. Available online: www.gainexpress.com/products/ck-102 (accessed on 28 August 2023).
- Sutton, M.A.; Wolters, W.J.; Peters, W.H.; Ranson, W.F.; McNeill, S.R. Determination of displacements using an improved digital correlation method. Image Vis. Comput. 1983, 1, 133–139. [Google Scholar] [CrossRef]
- Blikharskyy, Y.; Kopiika, N.; Khmil, R.; Selejdak, J.; Blikharskyy, Z. Review of Development and Application of Digital Image Correlation Method for Study of Stress–Strain State of RC Structures. Appl. Sci. 2022, 12, 10157. [Google Scholar] [CrossRef]
- Tworzewski, P.; Goszczyńska, B. An Application of an Optical Measuring System to Reinforced Concrete Beams Analysis. In Proceedings of the 2016 Prognostics and System Health Management Conference (PHM-Chengdu), Chengdu, China, 19–21 October 2016. [Google Scholar] [CrossRef]
- Burger, M.; Neitzel, F.; Lichtenberger, R. Einsatzpotential der digitalen Bildkor-relation zur Bauwerksüberwachung. In Proceedings of the Ingenieurvermessung 17, Graz, Austria, 27–28 April 2017; pp. 185–200. [Google Scholar]
- Koltsida, I.; Tomor, A.; Booth, C. The use of digital image correlation technique for monitoring masonry arch bridges. In Proceedings of the 7th International Conference on Arch Bridges, Split, Croatia, 2–4 October 2013. [Google Scholar]
- Mousa, M.A.; Yussof, M.M.; Udi, U.J.; Nazri, F.M.; Kamarudin, M.K.; Parke, G.A.R.; Assi, L.N.; Ghahari, S.A. Application of Digital Image Correlation in Structural Health Monitoring of Bridge Infrastructures: A Review. Infrastructures 2021, 6, 176. [Google Scholar] [CrossRef]
- Ngeljaratan, L.; Moustafa, M.A. System Identification of Large-Scale Bridges Using Target-Tracking Digital Image Correlation. Front. Built Environ. 2019, 5, 85. [Google Scholar] [CrossRef]
- Bakalarz, M.M.; Tworzewski, P.P. Application of Digital Image Correlation to Evaluate Strain, Stiffness and Ductility of Full-Scale LVL Beams Strengthened by CFRP. Materials 2023, 16, 1309. [Google Scholar] [CrossRef]
- Salmanpour, A.; Mojsilovi, N. Application of digital image correlation for strain measurements of large masonry walls. In Proceedings of the Asia Pacific Congress on Computational Mechanics & International Symposium on Computational Mechanics Apcom & Iscm, Singapore, 11–14 December 2013; pp. 1–7. [Google Scholar]
- Sousa, P.J.; Barros, F.; Lobo, P.; Tavares, P.J.; Moreira, P.M.G.P. Experimental measurement of bridge deflection using Digital Image Correlation. Procedia Struct. Integr. 2019, 17, 806–811. [Google Scholar] [CrossRef]
- Tian, L.; Zhao, J.; Pan, B.; Wang, Z. Full-Field Bridge Deflection Monitoring with Off-Axis Digital Image Correlation. Sensors 2021, 21, 5058. [Google Scholar] [CrossRef] [PubMed]
- Sieńko, R.; Zych, M.; Bednarski, Ł.; Howiacki, T. Strain and crack analysis within concrete members using distributed fibre optic sensors. Struct. Health Monit. 2019, 18, 1510–1526. [Google Scholar] [CrossRef]
- Lopez-Higuera, J.M.; Rodriguez, L.; Quintela, A.; Cobo, A. Currents and trends on fiber sensing technologies for structural health monitoring. In Proceedings of the 2nd Mediterranean Photonics Conference, Eilat, Israel, 29 November–2 December 2010. [Google Scholar]
- DFOS: Nerve-Sensors. Available online: https://www.shmsystem.pl/product/nerve-sensors/?lang=en (accessed on 28 August 2023).
- Li, H.-N.; Li, D.-S.; Song, G.-B. Recent applications of fiber optic sensors to health monitoring in civil engineering. Eng. Struct. 2004, 26, 1647–1657. [Google Scholar] [CrossRef]
- Rodrigues, C.; Félix, C.; Lage, A.; Figueiras, J. Development of a long-term monitoring system based on FBG sensors applied to concrete bridges. Eng. Struct. 2010, 32, 1993–2002. [Google Scholar] [CrossRef]
- Costa, B.J.A.; Figueiras, J.A. Fiber optic based monitoring system applied to a centenary metallic arch bridge: Design and installation. Eng. Struct. 2012, 44, 271–280. [Google Scholar] [CrossRef]
- Bednarski, Ł.; Sieńko, R.; Howiacki, T.; Zuziak, K. The Smart Nervous System for Cracked Concrete Structures: Theory, Design, Research, and Field Proof of Monolithic DFOS-Based Sensors. Sensors 2022, 22, 8713. [Google Scholar] [CrossRef]
- Howiacki, T.; Sieńko, R.; Bednarski, Ł.; Zuziak, K. Crack Shape Coefficient: Comparison between Different DFOS Tools Embedded for Crack Monitoring in Concrete. Sensors 2023, 23, 566. [Google Scholar] [CrossRef]
- Piątek, B.; Howiack, T.; Kulpa, M.; Siwowski, T.; Sieńko, R.; Bednarski, Ł. Strain, crack, stress and shape diagnostics of new and existing post-tensioned structures through distributed fibre optic sensors. Measurement 2023, 221, 113480. [Google Scholar] [CrossRef]
- Zhou, J.; Xu, Y.; Zhang, T. A Wireless Monitoring System for Cracks on the Surface of Reactor Containment Buildings. Sensors 2016, 16, 883. [Google Scholar] [CrossRef]
- Rajkumar, P.; Mahabir, D. Concrete Structure Crack Measuring Devices—A Case Study of Concrete Dam. Int. J. Eng. Appl. Sci. 2022, 9, 22–27. [Google Scholar]
- Montec Systems. Available online: https://www.montecsystems.com/ (accessed on 22 October 2023).
- Optical Measuring System TRITOP Used for Offshore Wind Turbine Setup. Available online: https://www.gom.com/en/solutions/success-stories/tritop-for-offshore-wind-turbine-setup (accessed on 28 August 2023).
- Esmer, M.; Kudumović, L.; Kasmo, R. A case study of terrestrial laser scanning for urban conservation studio at Çarşamba Neighbourhood in istanbul. Polytech. Des. 2019, 7, 211–218. [Google Scholar]
- Ramondino, F. Heritage Recording and 3D Modeling with Photogrammetry and 3D Scanning. Remote Sens. 2011, 3, 1104–1138. [Google Scholar] [CrossRef]
- Lipiecki, T.; Jaśkowski, W.; Matwij, W.; Skobliński, W. Zastosowanie skanera Faro Focus X330 w ocenie pionowości komina o wysokości 220 m. Przegląd Górniczy 2017, 6, 44–53. [Google Scholar]
- Sztubecki, J.; Bujarkiewicz, A.; Derejczyk, K.; Przytuła, M. A Hybrid Method of Determining Deformations Of Engineering Structures With A Laser Station And A 3d Scanner. Civ. Environ. Eng. Rep. 2018, 28, 177–185. [Google Scholar] [CrossRef]
- Xray Nova. Available online: https://www.xraynova.com/ (accessed on 22 October 2023).
- Oesch, T.; Weise, F.; Bruno, G. Detection and Quantification of Cracking in Concrete Aggregate through Virtual Data Fusion of X-Ray Computed Tomography Images. Materials 2020, 13, 3921. [Google Scholar] [CrossRef]
- du Plessis, A.; Boshoff, W.P. A review of X-ray computed tomography of concrete and asphalt construction materials. Constr. Build. Mater. 2019, 199, 637–651. [Google Scholar] [CrossRef]
- Otsuka, K.; Takeda, M. Detection of fine cracks by X-ray technique using contrast medium in concrete. In Translation from Proceedings of JSCE; No. 725/V-58; Proceedings of JSCE: Tokyo, Japan, 2003. [Google Scholar]
- Sham, F.C.; Chen, N.; Long, L. Surface crack detection by flash thermography on concrete surface. Insight 2008, 50, 240–243. [Google Scholar] [CrossRef]
- Tashan, J.; Al-Mahaidi, R. Detection of cracks in concrete strengthened with CFRP systems using infra-red thermography. Compos. B Eng. 2014, 64, 116–125. [Google Scholar] [CrossRef]
- Tang, L. Maintenance and Inspection of Fiber-Reinforced Polymer (FRP) Bridges: A Review of Methods. Materials 2021, 14, 7826. [Google Scholar] [CrossRef]
- Zhang, J.-K.; Yan, W.; Cui, D.-M. Concrete Condition Assessment Using Impact-Echo Method and Extreme Learning Machines. Sensors 2016, 16, 447. [Google Scholar] [CrossRef]
- Sansalone, M.; Streett, W.B. Impact-Echo: Nondestructive Evaluation of Concrete and Masonry; Bullbrier Press: Ithaca, NY, USA, 1997. [Google Scholar]
- Azari, H.; Nazarian, S.; Yuan, D. Assessing sensitivity of impact echo and ultrasonic surface waves methods for nondestructive evaluation of concrete structures. Construct. Build. Mater. 2014, 71, 384–391. [Google Scholar] [CrossRef]
- Shiotani, T.; Aggelis, D.G.; Makishima, O. Global monitoring of large concrete structures using acoustic emission and ultrasonic techniques: Case study. J. Bridge Eng. 2009, 14, 188–192. [Google Scholar] [CrossRef]
- Grosse, C.U.; Reinhardt, H.W.; Krüger, M.; Beutel, R. Application of Impact-Echo techniques for crack detection and crack parameter estimation in concrete. In Proceedings of the 11th International Conference on Fracture (ICF11), Turin, Italy, 20–25 March 2005; pp. 4884–4889. [Google Scholar]
- Yoon, Y.-G.; Kim, C.-M.; Oh, T.-K. A Study on the Applicability of the Impact-Echo Test Using Semi-Supervised Learning Based on Dynamic Preconditions. Sensors 2022, 22, 5484. [Google Scholar] [CrossRef] [PubMed]
- Shah, J.; El-Hawwat, S.; Wang, H. Guided Wave Ultrasonic Testing for Crack Detection in Polyethylene Pipes: Laboratory Experiments and Numerical Modeling. Sensors 2023, 23, 5131. [Google Scholar] [CrossRef] [PubMed]
- MeraziMeksen, T.; Boudraa, B.; Drai, R.; Boudraa, M. Automatic Crack Detection and Characterization During Ultrasonic Inspection. J. Nondestruct. Eval. 2010, 29, 169–174. [Google Scholar] [CrossRef]
- Goszczyńska, B. Analysis of the process of crack initiation and evolution in concrete with acoustic emission testing. Arch. Civ. Mech. Eng. 2014, 14, 134–143. [Google Scholar] [CrossRef]
- Świt, G. Analiza Procesów Destrukcyjnych w Obiektach Mostowych z Belek Strunobetonowych z Wykorzystaniem Zjawiska Emisji Akustycznej; Monografie, Studia, Rozprawy, M21/2011; Wydawnictwo Politechniki Świętokrzyskiej: Kielce, Poland, 2011. [Google Scholar]
- Goszczyńska, B.; Świt, G.; Trąmpczyński, W.; Krampikowska, A. Application of the acoustic emission (AE) method to bridge testing and diagnostics comparison of procedures. In Proceedings of the IEEE 2012 Prognostics and System Health Management Conference (PHM-2012 Beijing), Beijing, China, 23–25 May 2012; pp. 1–10. [Google Scholar] [CrossRef]
- Goszczyńska, B.; Świt, G.; Trąmpczyński, W.; Krampikowska, A.; Tworzewska, J.; Tworzewski, P. Experimental validation of concrete crack identification and location with acoustic emission method. Arch. Civ. Mech. Eng. 2012, 12, 23–28. [Google Scholar] [CrossRef]
- Goszczyńska, B.; Świt, G.; Trąmpczyński, W. Analysis of the microcracking process with the Acoustic Emission method with respect to the service life of reinforced concrete structures with the example of the RC beams. Bull. Pol. Acad. Sci. Tech. Sci. 2015, 63, 55–65. [Google Scholar] [CrossRef]
- Goszczyńska, B.; Świt, G.; Trąmpczyński, W. Monitoring of Active Destructive Processes as a Diagnostic Tool for the Structure Technical State Evaluation. Bull. Pol. Acad. Sci. Tech. Sci. 2013, 61, 97–109. [Google Scholar] [CrossRef]
- Świt, G.; Goszczyńska, B.; Krampikowska, A.; Chmura, P.; Kwaśniewska, A. Zastosowanie metody emisji akustycznej do oceny wykonawstwa przyczółka wiaduktu. Mosty 2011, 4, 60–66. [Google Scholar]
- Świt, G. Diagnostic of presterssed concrete structures by means of acoustic emission. In Proceedings of the 8th International Conference on Reliability, Maintainability and Safety, Chengdu, China, 20–24 July 2009; pp. 958–962. [Google Scholar] [CrossRef]
- Stawska, S.; Chmielewski, J.; Bacharz, M.; Bacharz, K.; Nowak, A. Comparative Accuracy Analysis of Truck Weight Measurement Techniques. Appl. Sci. 2021, 11, 745. [Google Scholar] [CrossRef]


| No. | Researcher | Crack Width | Conclusions |
|---|---|---|---|
| Short- and long-term tests of non-prestressed concrete structures | |||
| 1. | Houston, Atimtay, and Ferguson [8] | 0.13 mm | Critical crack value with 25 mm lagging |
| 2. | Okada and Miyagawa [9] | 0.10–0.20 mm | Critical crack value |
| 3. | Swamy, R.N. [10] | 0.10–0.15 mm | Critical crack value |
| 4. | Vennesland and Gjorv [11] | 0.40–0.50 mm | Critical crack value |
| 5. | O’Neil, E.F. [12] | 0.40 mm | Critical crack value |
| Short-term tests of prestressed concrete structures | |||
| 6. | Poston, R.W. [13] | 0.05 mm 0.38 mm | No corrosion of the reinforcement Same corrosion course in both types of reinforcement |
| 7. | Moore, Klodt, and Hansen [14] | 0.10 mm | Minimum width of cracks where corrosion was observed |
| 8. | Perenchio, Fraczek, and Pfiefer [15] | 0.25 mm | Lagging thickness of 25 mm is not sufficient protection against the corrosion of beams with and without cracks |
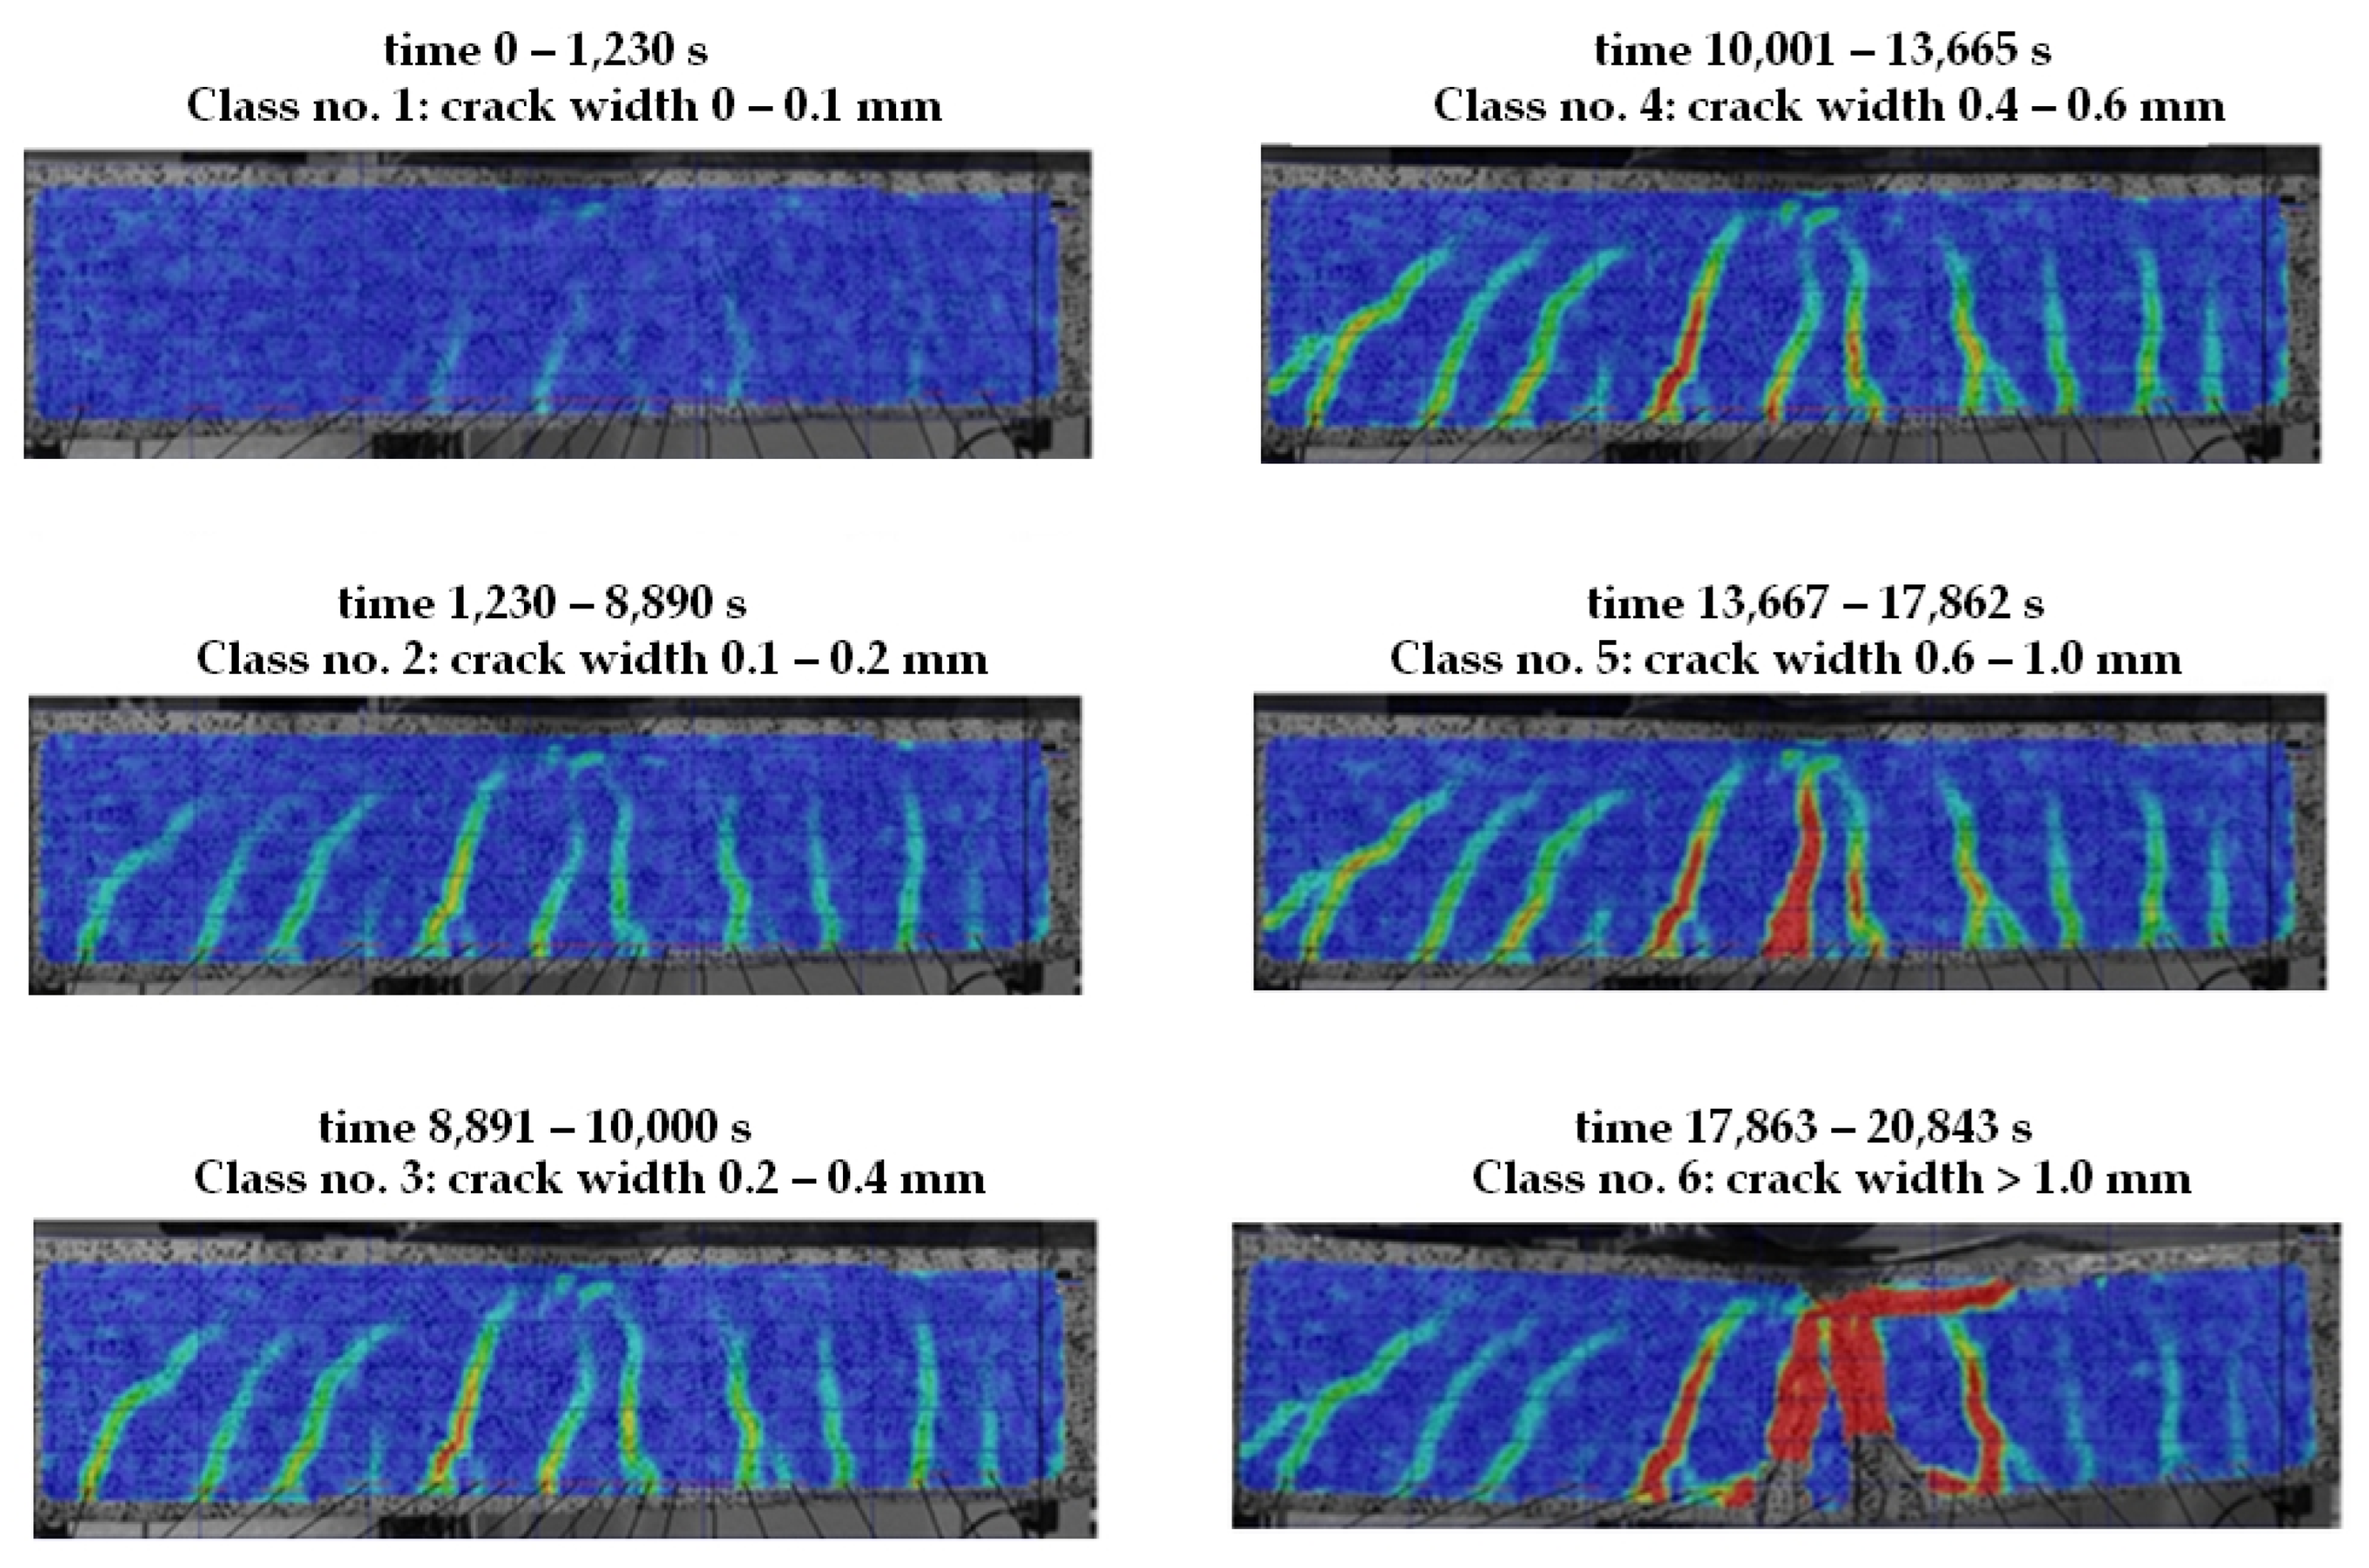
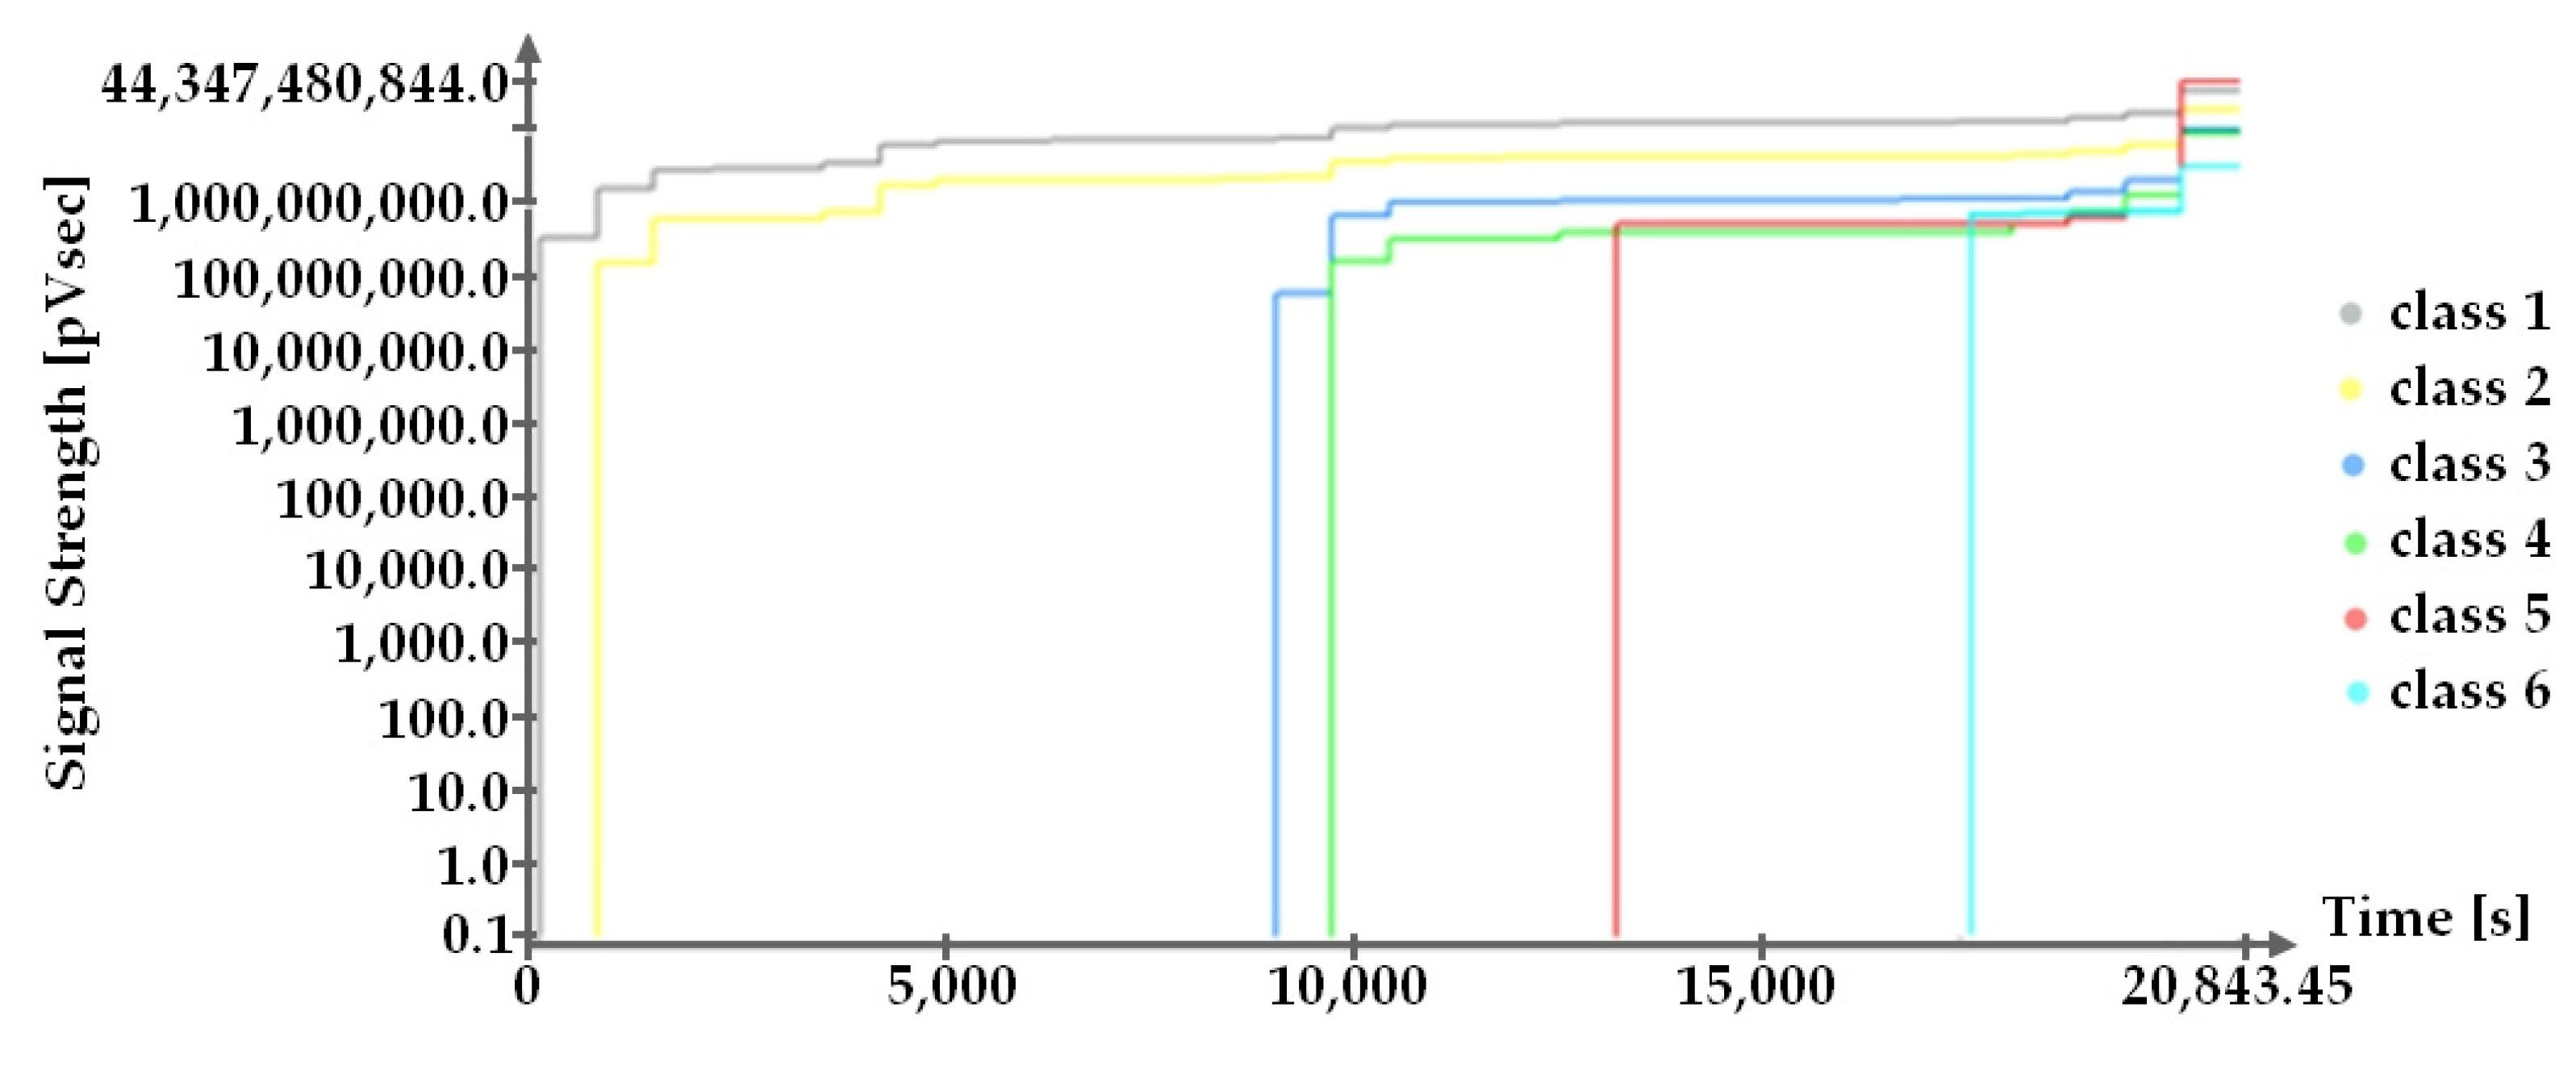
| Class No. | No. 1 | No. 2 | No. 3 | No. 4 | No. 5 | No. 6 |
|---|---|---|---|---|---|---|
| Color/symbol |  |  |  |  |  |  |
| Hazard code | 5 | 4 | 3 | 2 | 1 | 0 |
| Code | Description | Class No. | Crack Width [mm] |
|---|---|---|---|
| 0 | Element not fulfilling its utility function or damaged | No. 6 | >1.0 |
| 1 | Serious defect/damage and/or element is close to failure/destruction | No. 5 | 0.6–1.0 |
| 2 | Moderate defect/damage that may affect load bearing capacity | No. 4 | 0.4–0.6 |
| 3 | First signs of structural deterioration; small defects/damage appear which do not affect the load-bearing capacity of the element | No. 3 | 0.2–0.4 |
| 4 | New element or element with a defect that does not impair load-bearing capacity | No. 2 | 0.1–0.2 |
| 5 | New element without defects—SLS-compliant | No. 1 | 0–0.1 |
| Method | Measurement Accuracy | Advantages | Disadvantages |
|---|---|---|---|
| Manual crack width measurement methods | |||
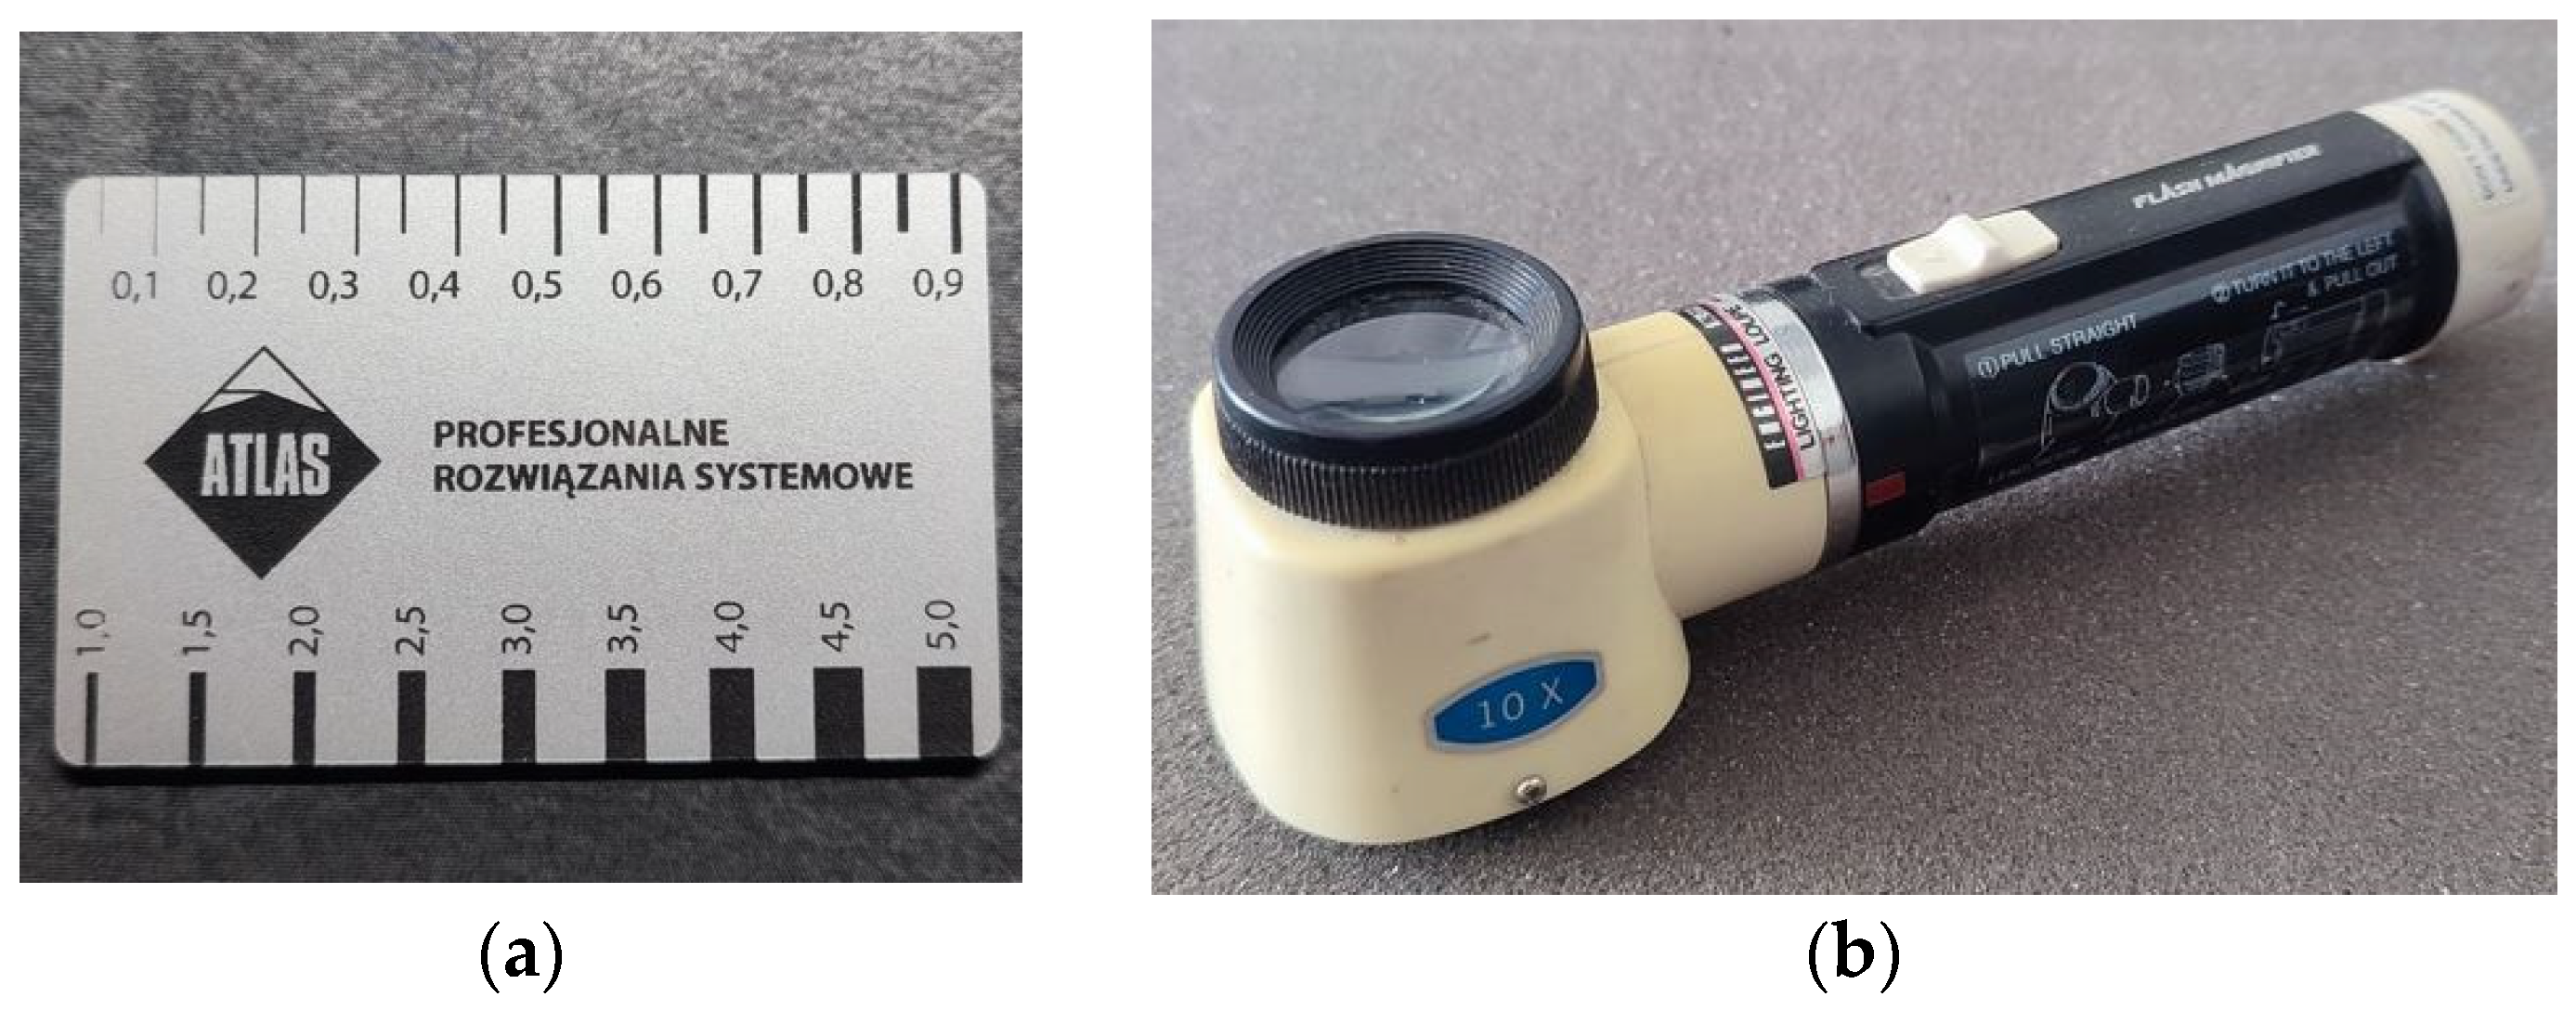
| Card sizer/feeler gauge | 0.05 to 0.5 mm | Easy to use; | Low accuracy; |
| Cheap. | in the case of many cracks, measurements are time-consuming. | ||
| Brinell magnifier and Brinell microscopes | Depending on the magnification of the instrument, 0.1 mm to 0.001 mm | Easy to use; | In the case of many cracks, measurements are time-consuming and tiring for the researcher (may result in erroneous readings); |
| Cheap; | In the case of repeated measurements, the instrument should be placed perfectly in the same place; | ||
| High accuracy for Brinell microscopes with higher magnification. | Uneven edges may affect the crack width reading. | ||
| Manual methods of monitoring crack width growth | |||
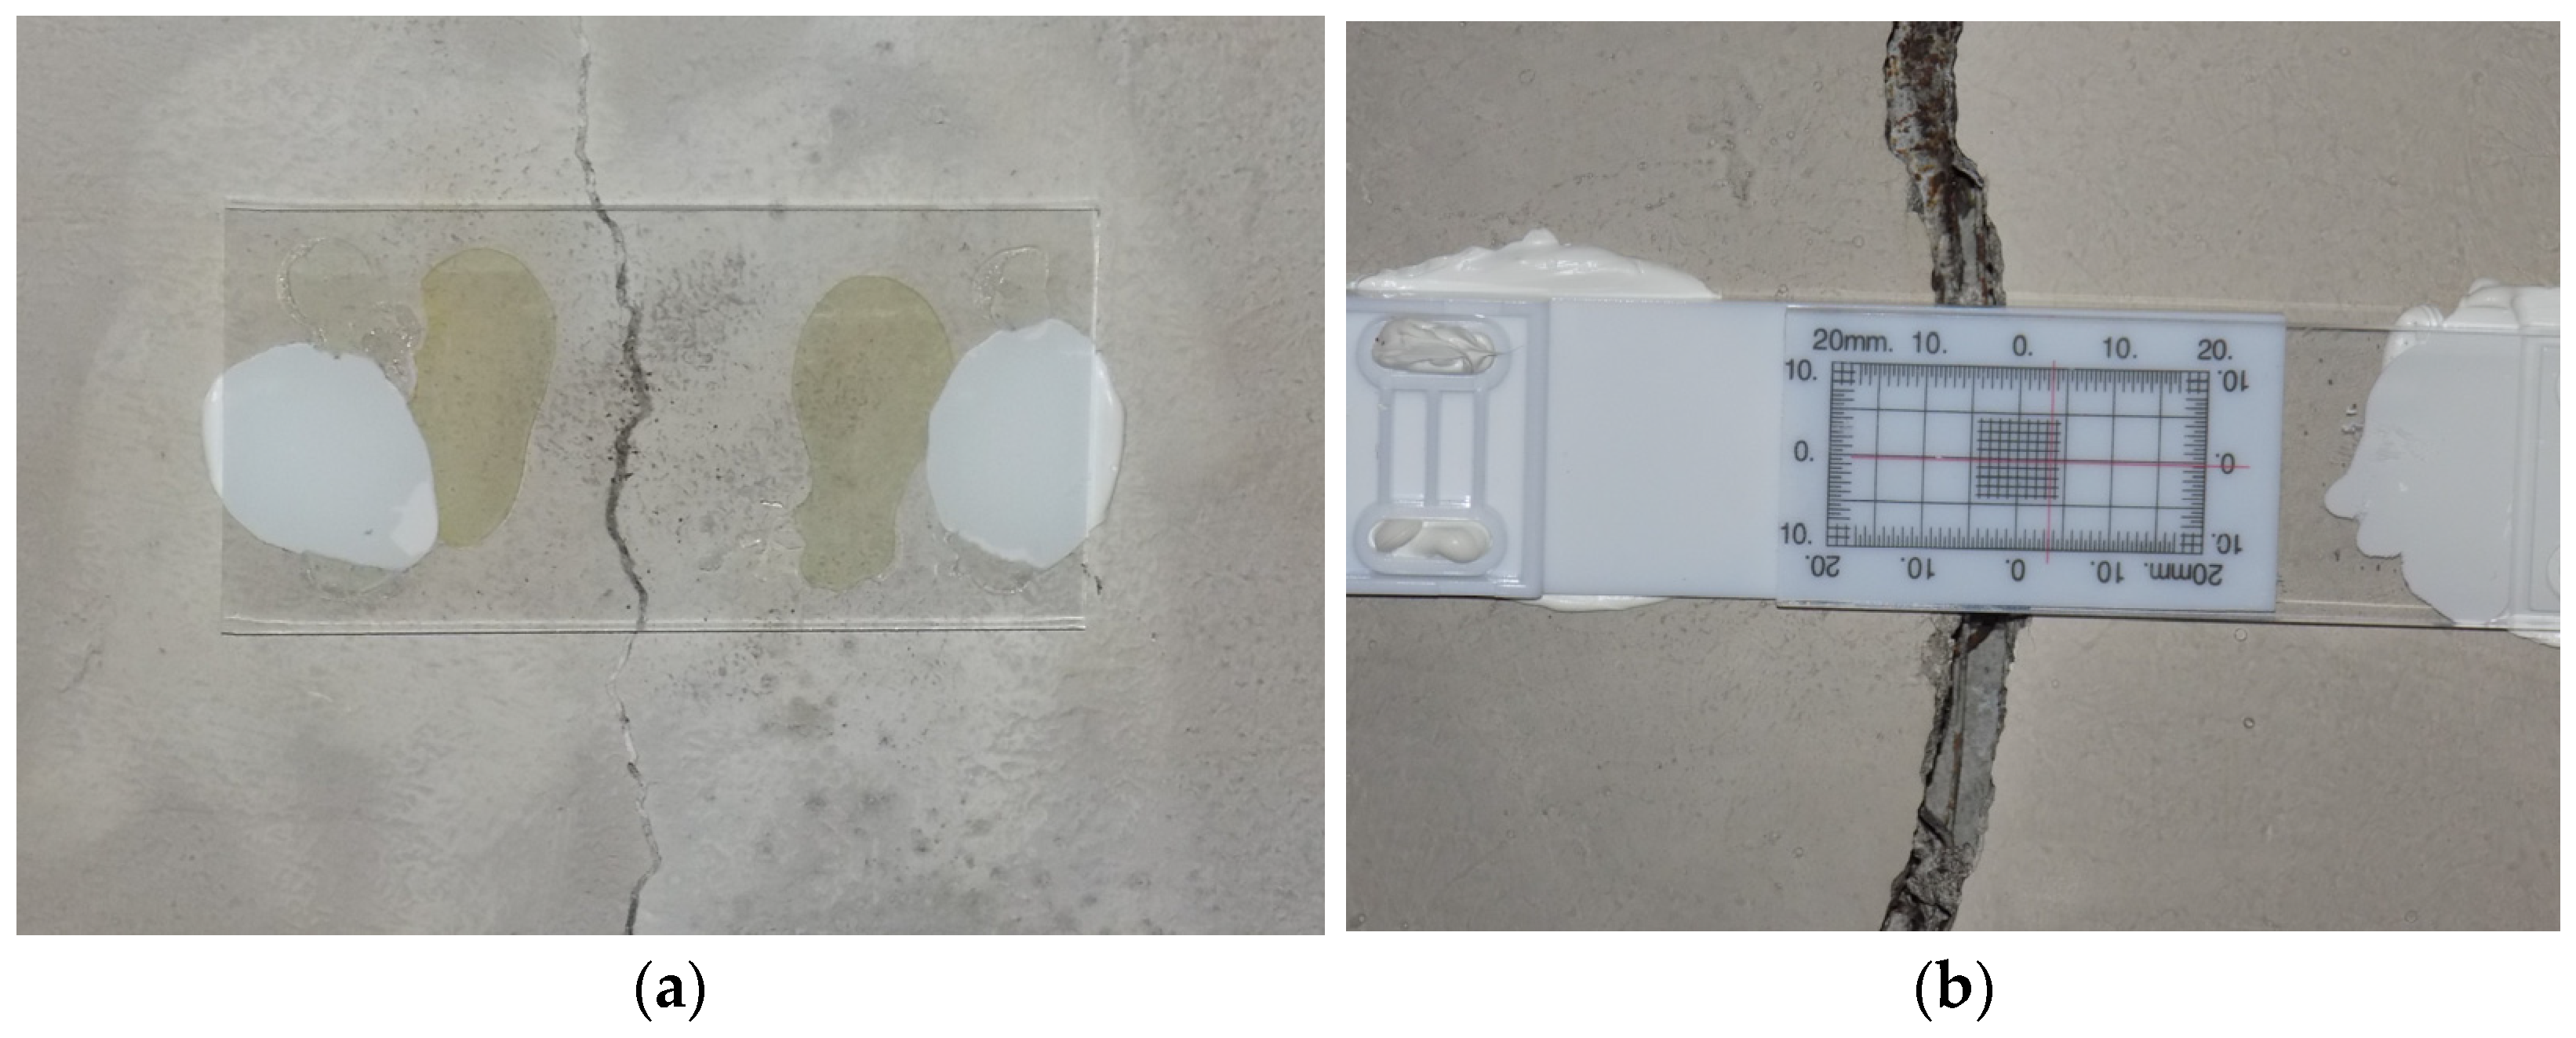
| Glass or gypsum seals | - | Easy to use; | It only informs about changes in crack width; it does not measure this value; |
| Cheap. | The shrinkage of glue or gypsum during setting may lead to the cracking of the seal. | ||
| Crack gauge/feeler gauge | 0.05 mm | Easy to use; | Point measurements in predefined locations. |
| Cheap; | |||
| Allows measurements of changes in crack width, displacement along the crack, and the angle of crack rotation. | |||
| Caliper | 0.01 mm | Easy to use; | Point measurements in predefined locations. |
| Cheap; | |||
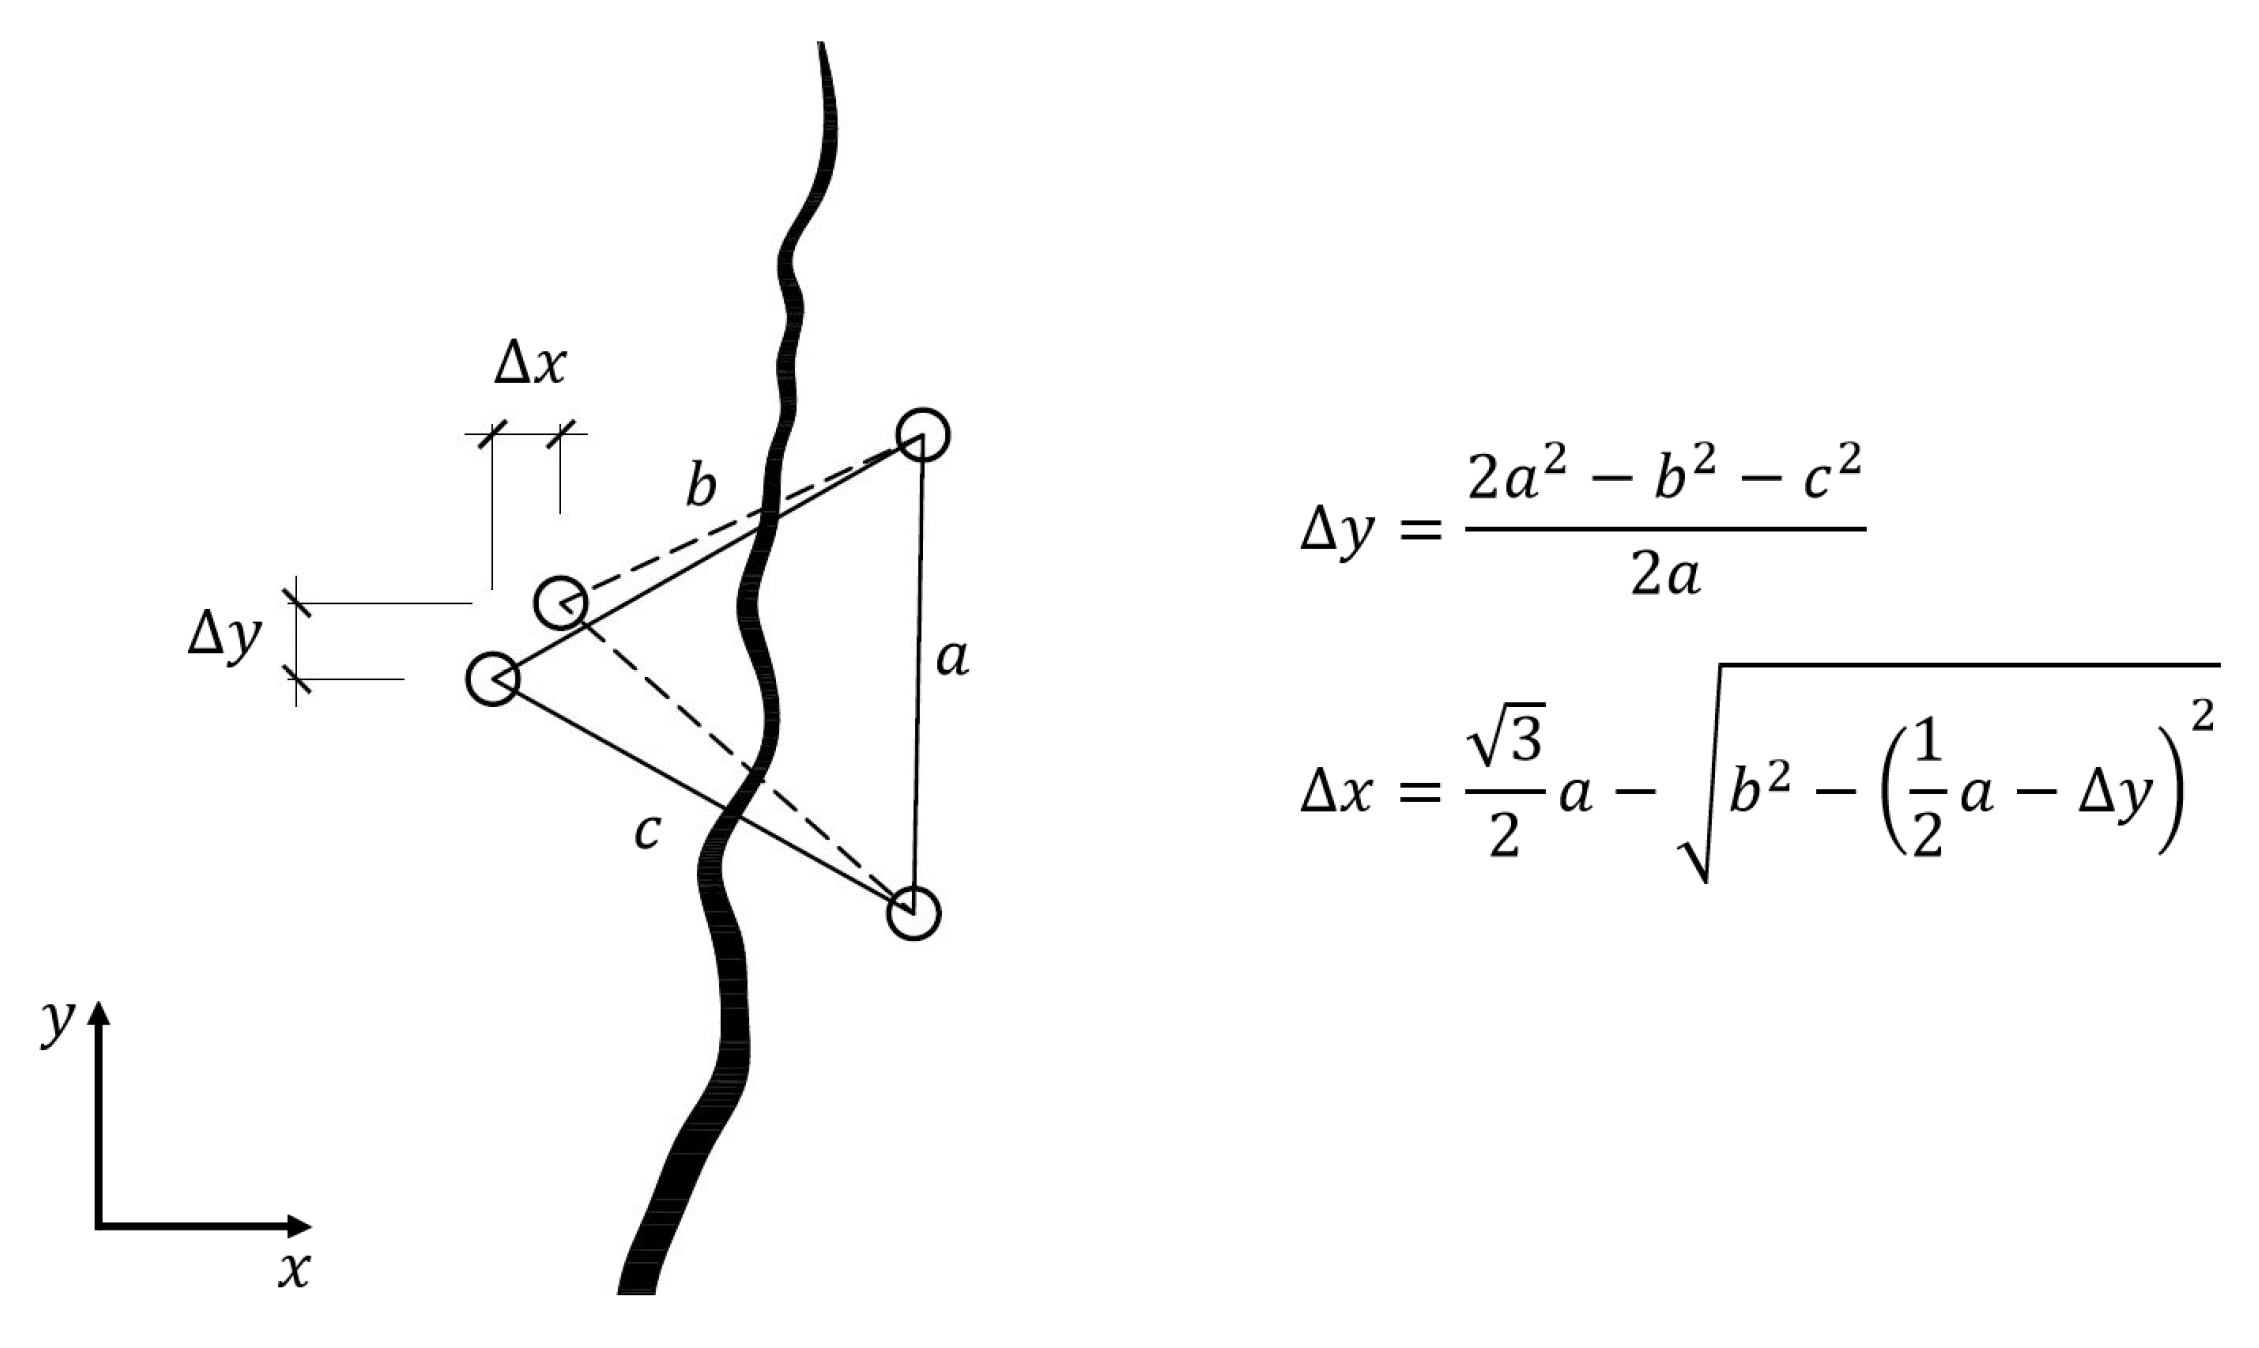
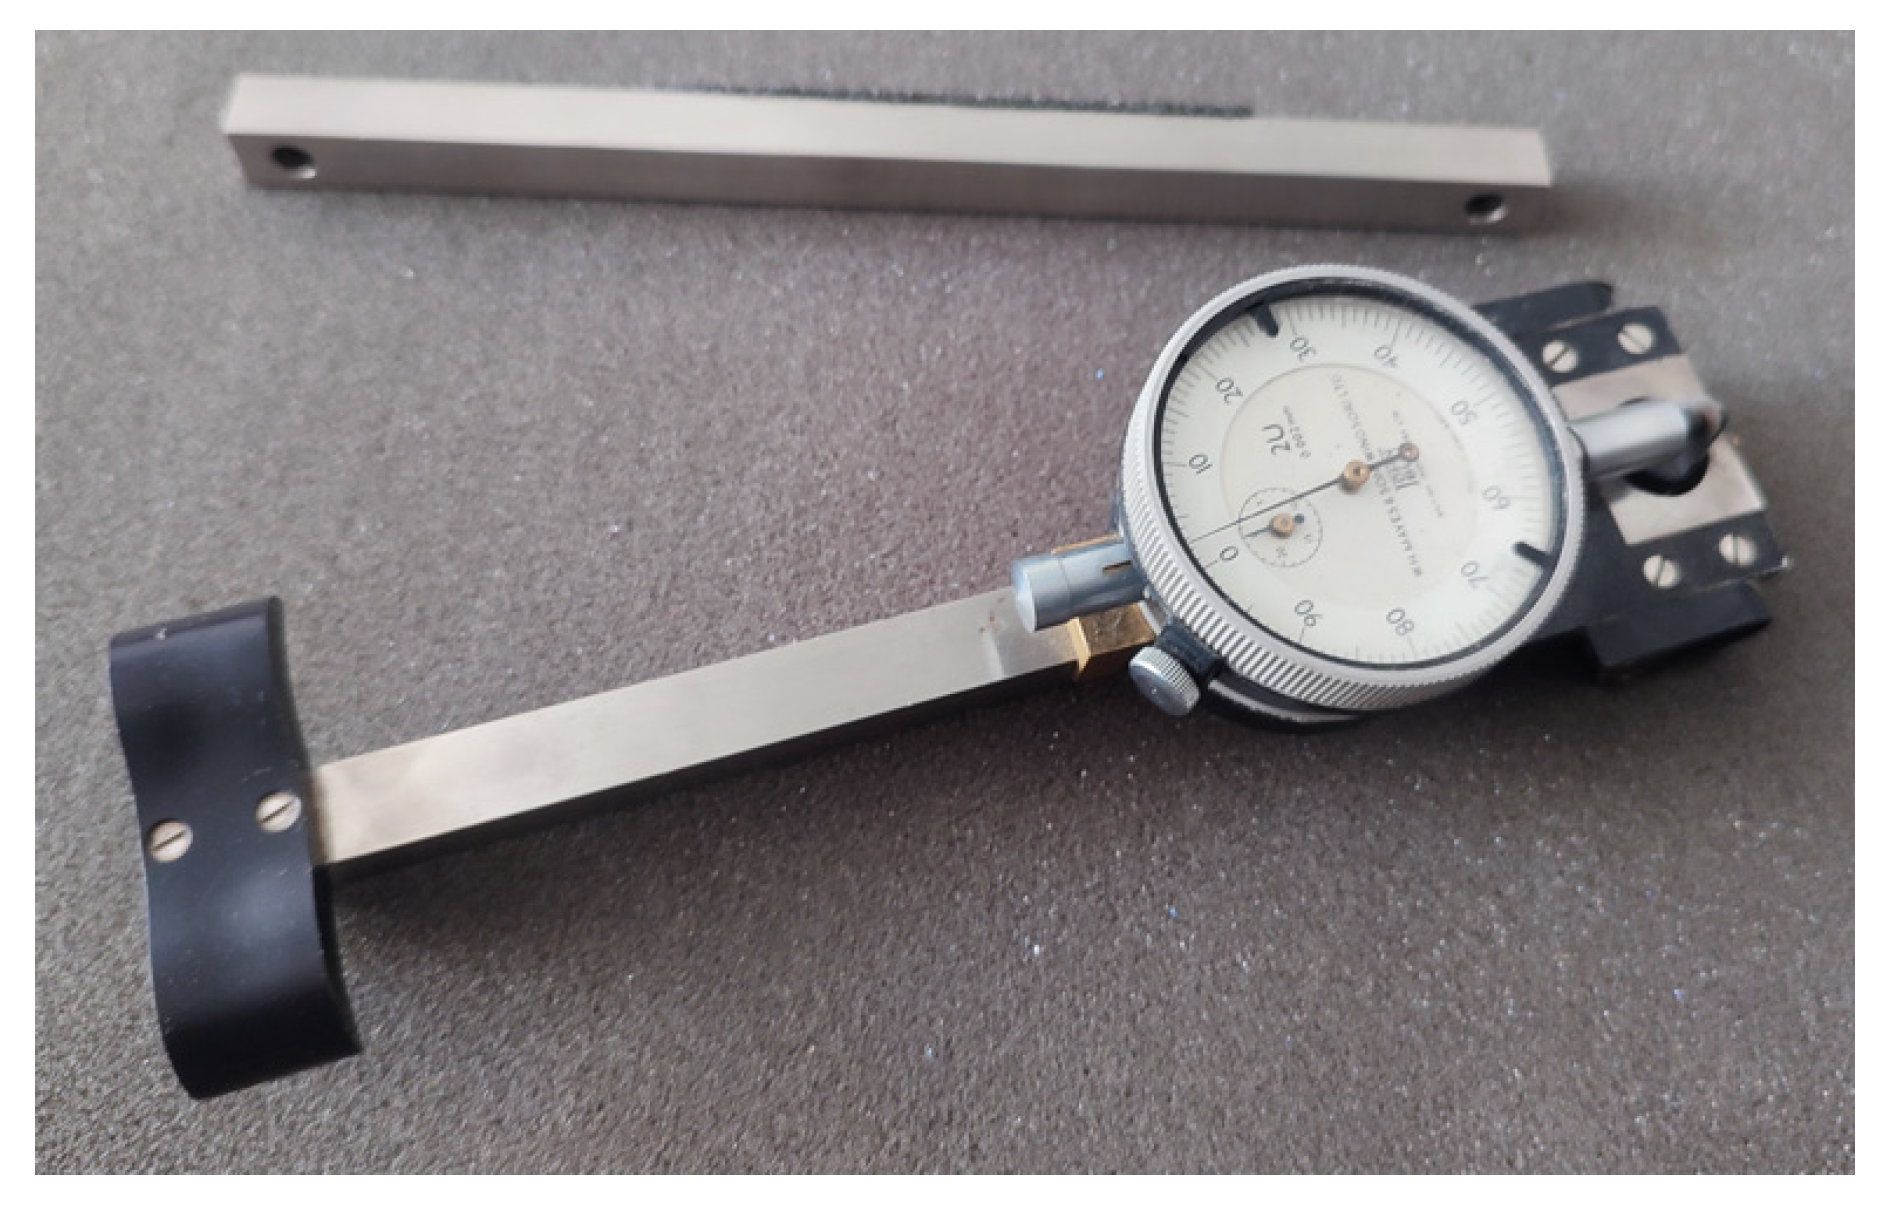
| Mechanical strain gauge | 0.001 mm | Depending on the number of disks or pins used, it allows measurement of not only changes in crack width but also displacement along the crack and the angle of crack rotation; | |
| Does not require leaving equipment in the monitored facility. | |||
| Digital crack width measurement methods | |||
| Automatic crack detection methods | Depends on the resolution of the cameras and the distance from the recorded object | Measurements possible in any location on the surface observed via a camera; | Requires good-quality photos, preferably in high resolution; |
| Can be used both under laboratory conditions and in situ; | Cracks should be clearly visible in the photo; | ||
| Automatic detection; | The surface must be well lit; | ||
| The possibility of recording large surfaces; | Dark areas on the surface can be recognized as cracks; | ||
| Uses ordinary digital cameras; | The method is still under development. | ||
| Crack patterns and propagation are documented as photographs. | |||
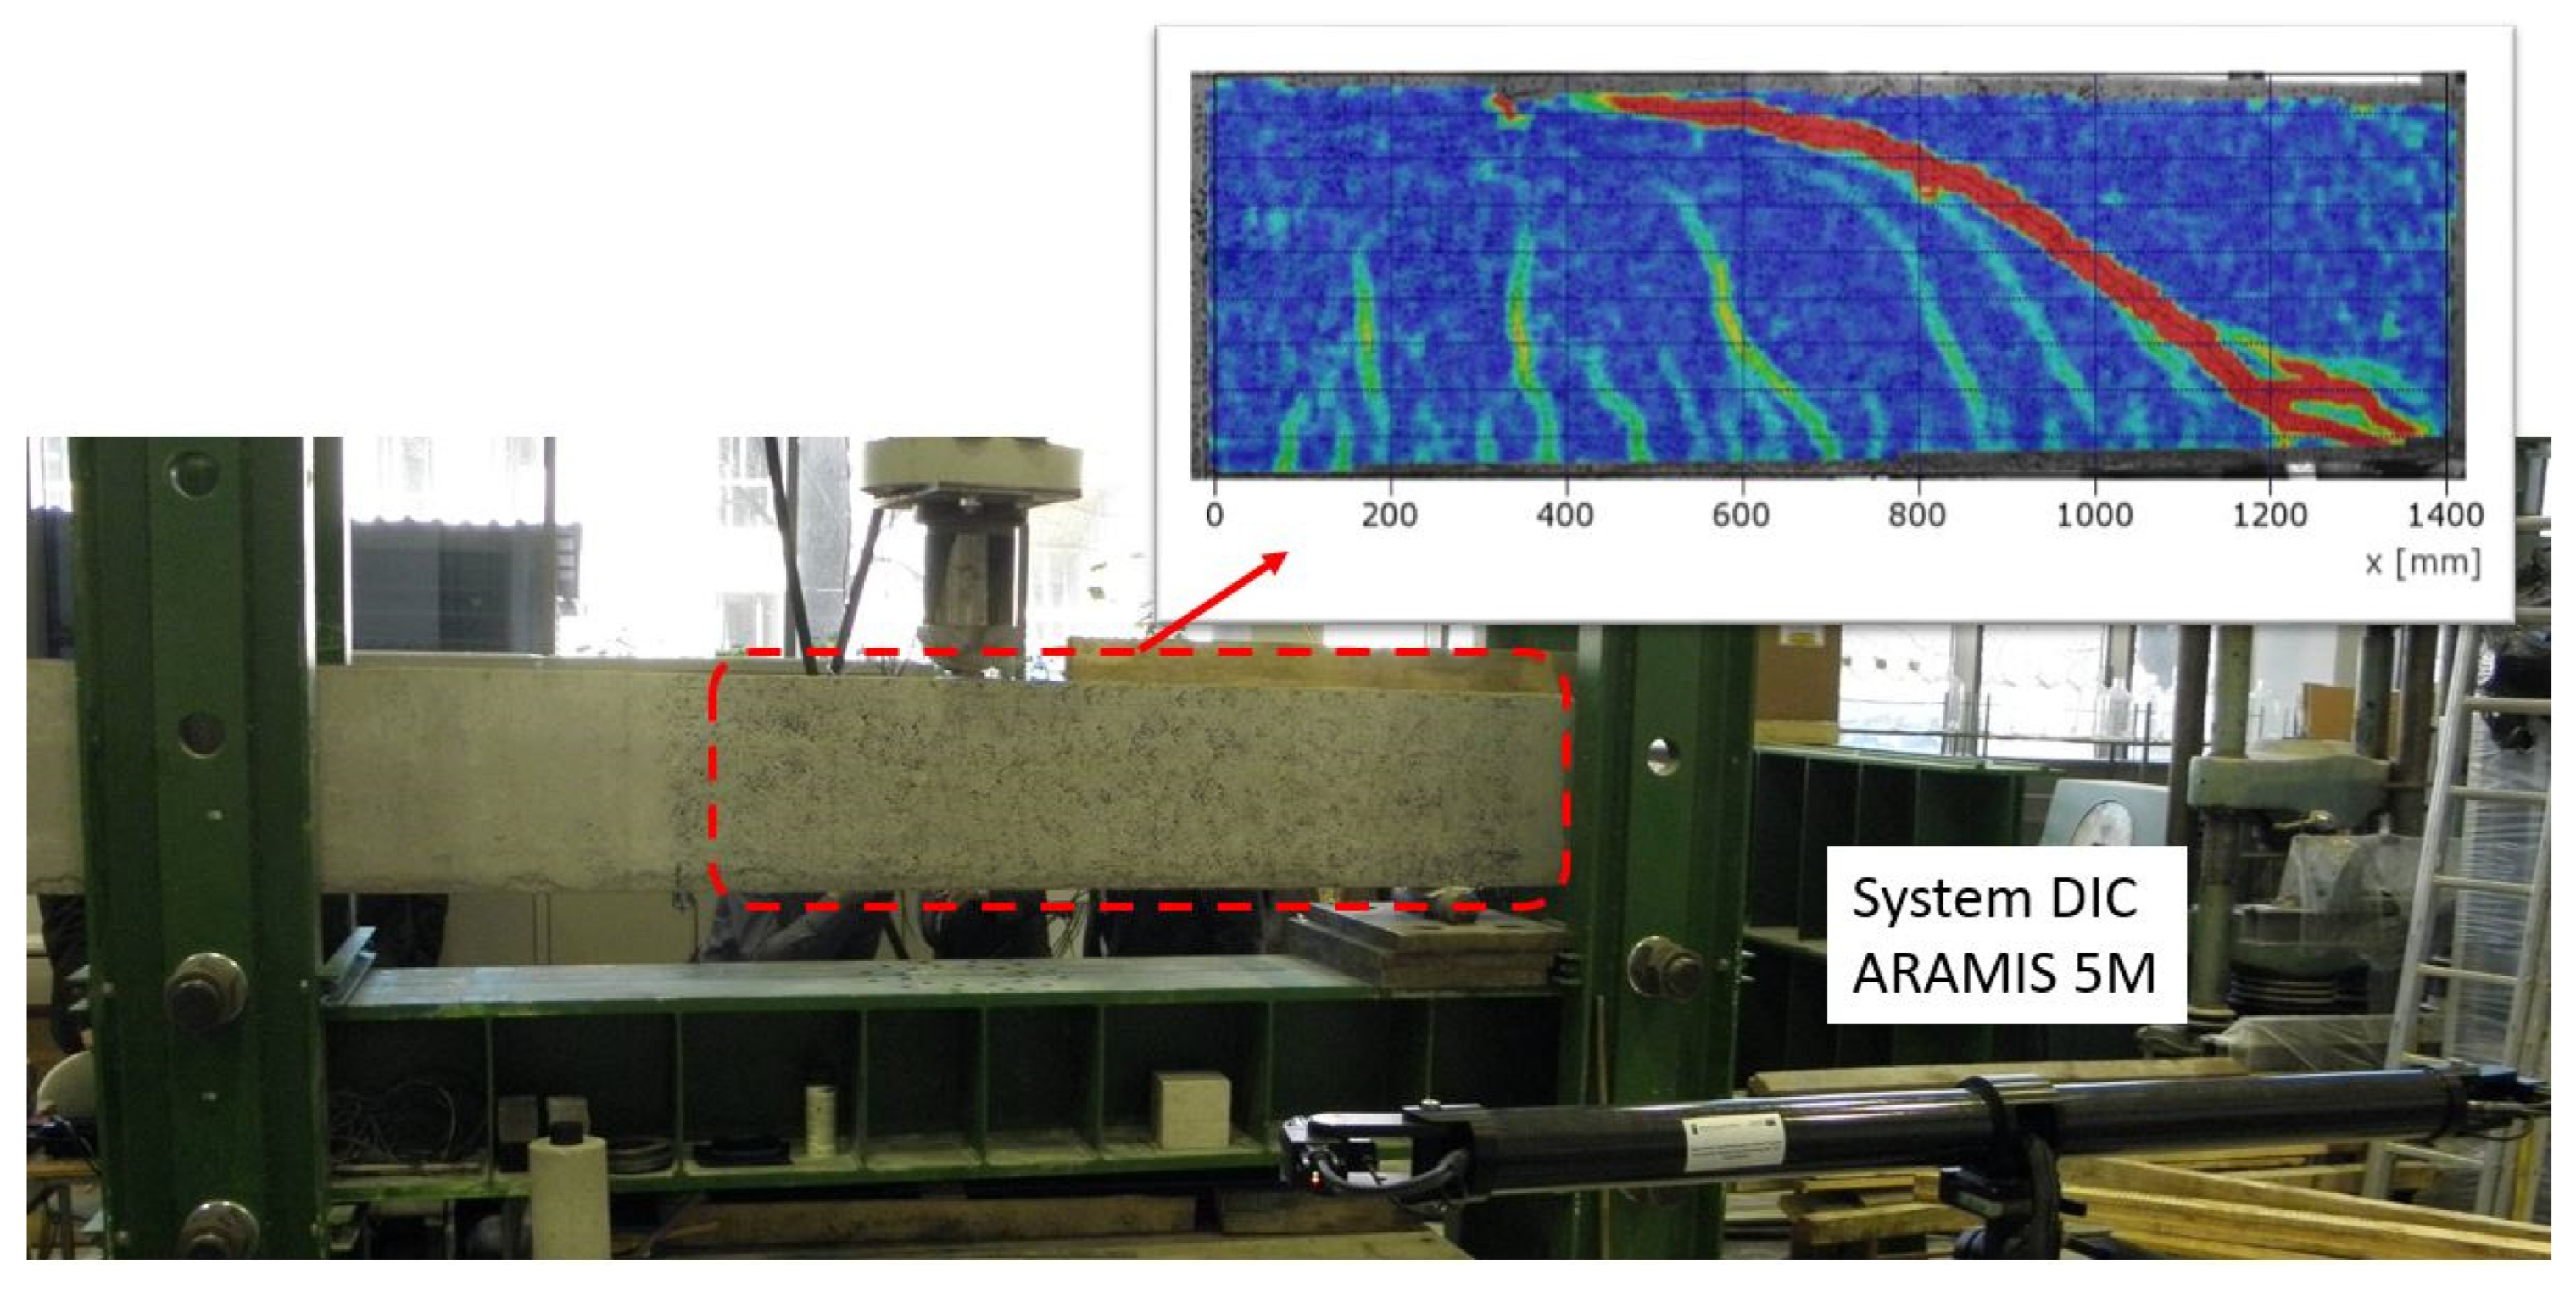
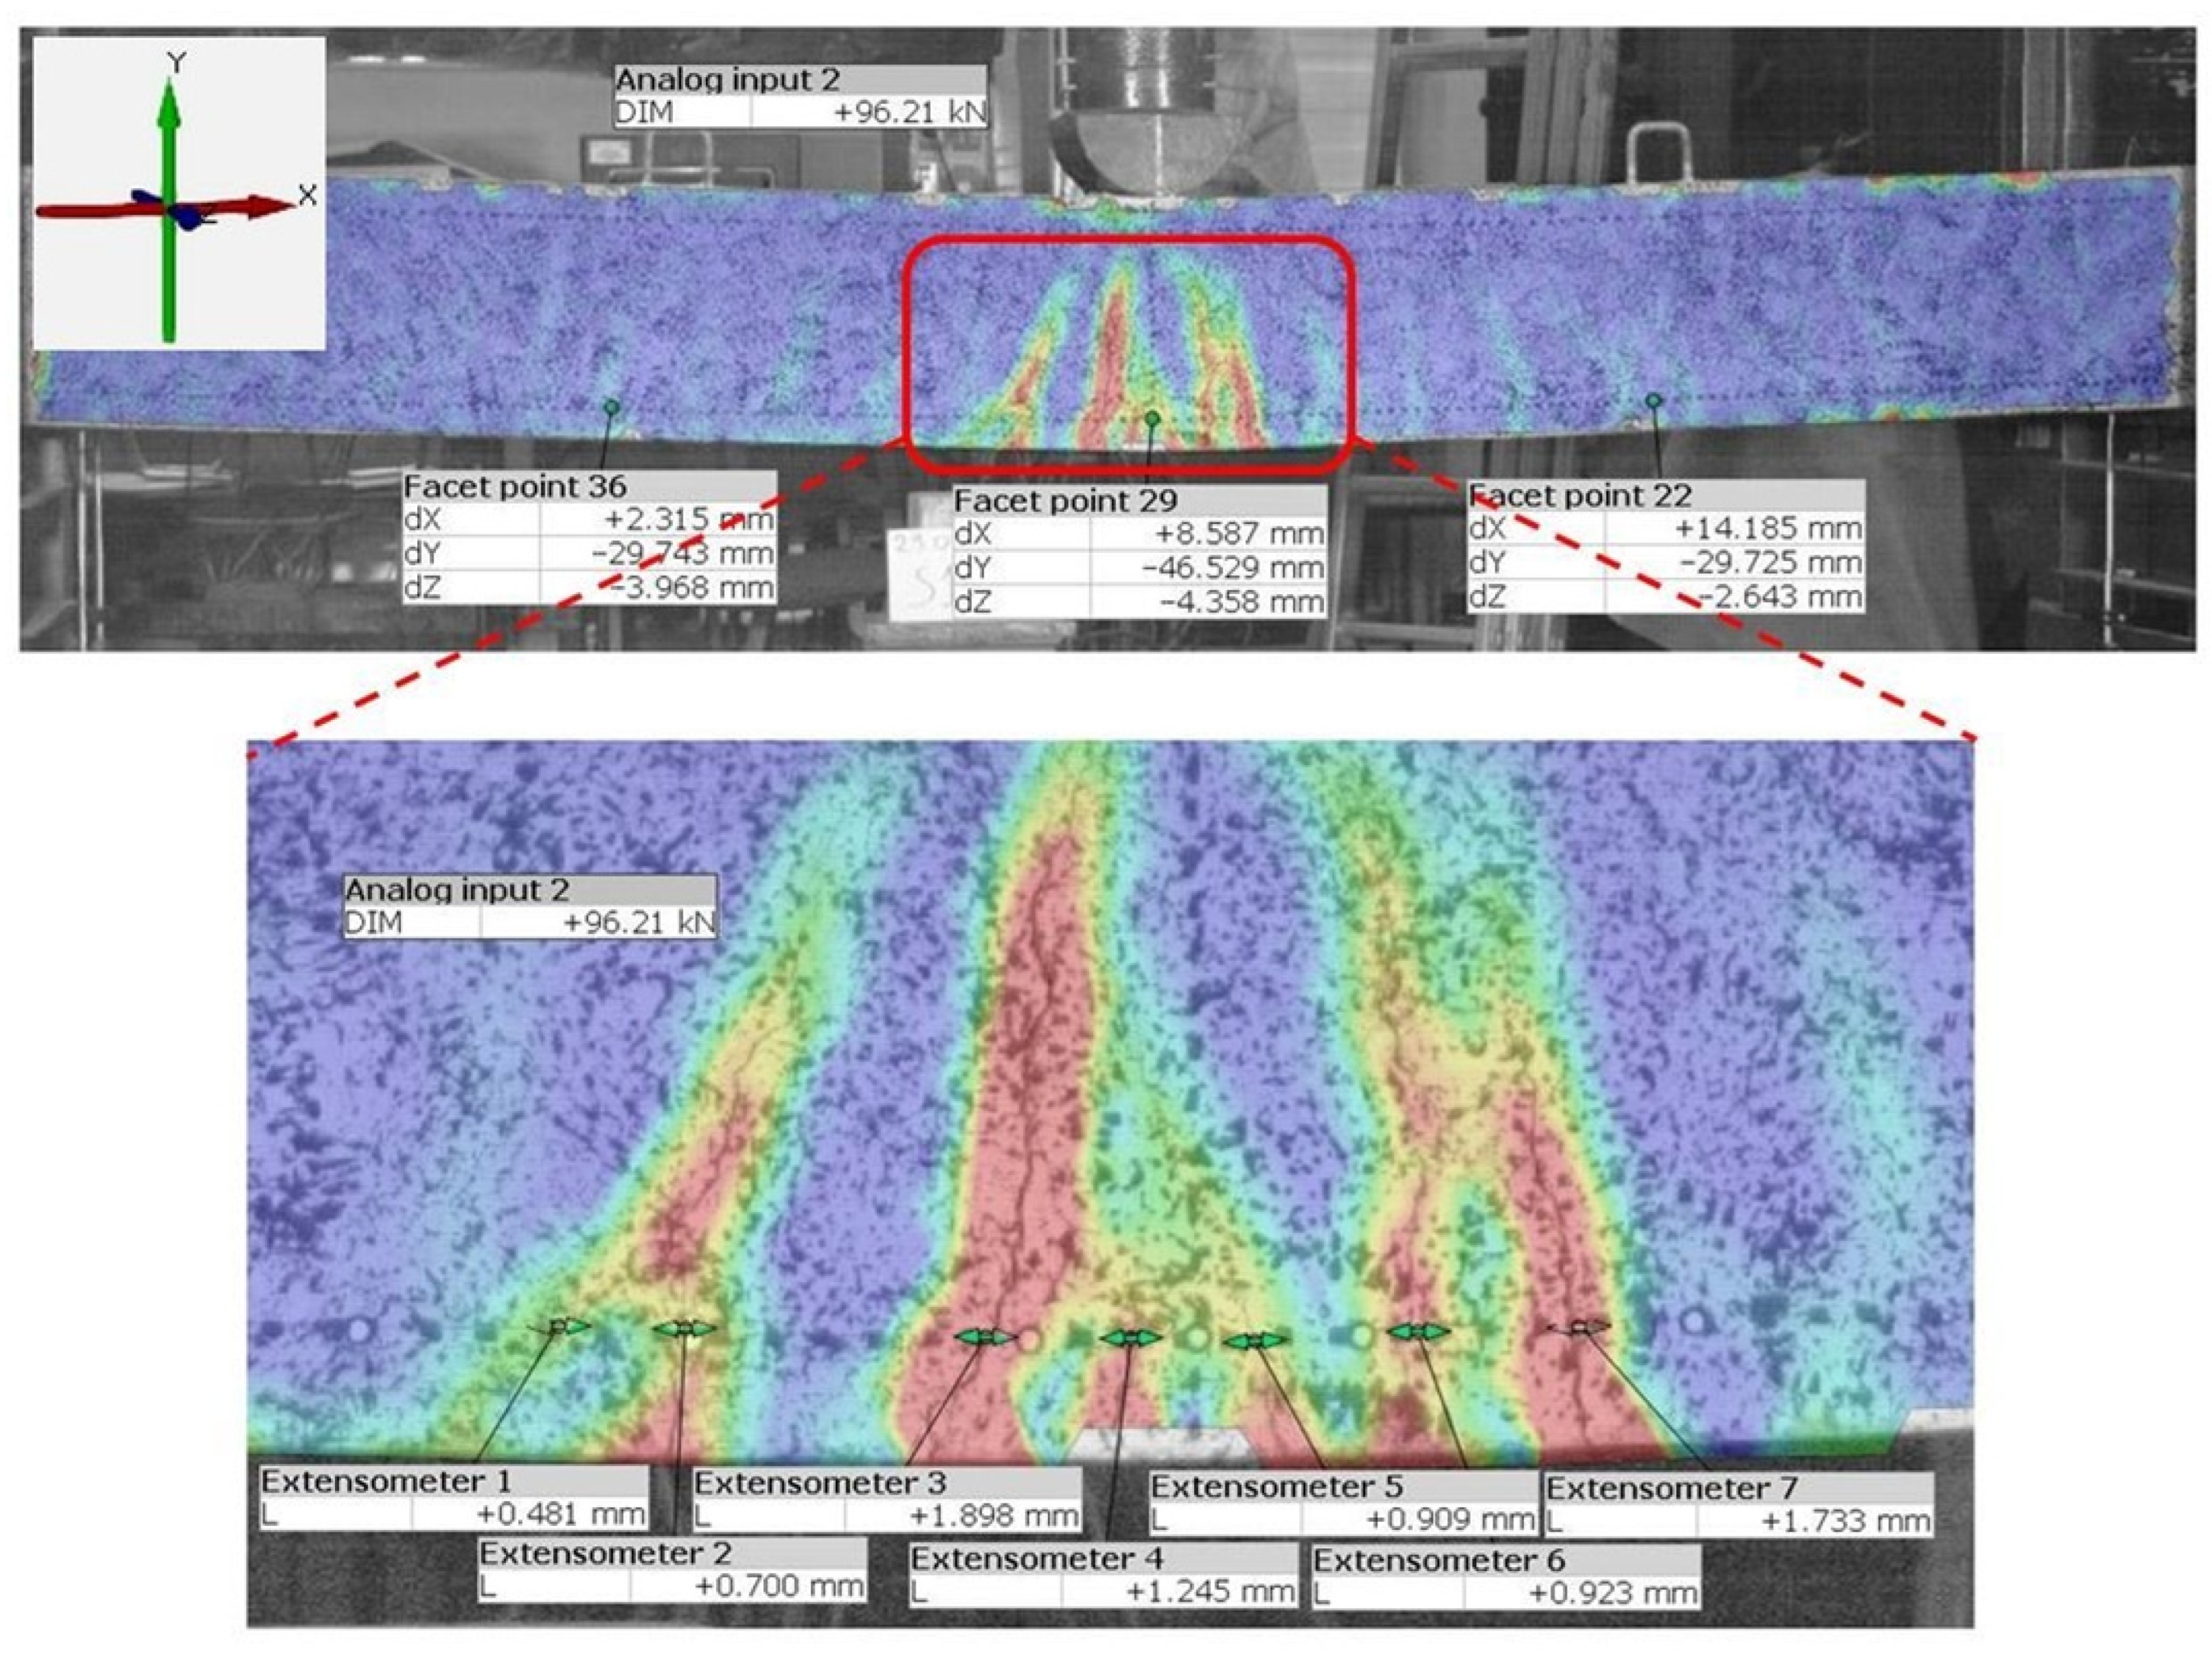
| Digital image correlation (DIC) | Measurements possible in any location on the surface observed via cameras; | Appropriate surface preparation is required; | |
| Can be used both under laboratory conditions and in situ; | Measurements can be carried out with any type of load acting on the structure, either static or dynamic; | ||
| In addition to crack width measurements, it allows measurements of any displacements anywhere in the analyzed area; | In order to measure the crack width, it is necessary to take photos/stage 0 before the damage occurs; | ||
| Crack patterns and propagation are documented. | Expensive equipment. | ||
| Fiber optic composite sensors | Higher than 0.05 mm | Enables the detection and localization of cracks occurring along the length of the installed optical fiber; | Expensive equipment; |
| Enables measurements of deformations, temperatures, displacements, and crack widths; | Because optical fiber slippage may occur, the strain peak is not always large enough to be identified as a crack; | ||
| An ideal method for monitoring large objects, such as bridges; | The type of fibers and protective coating must be selected correctly in order to obtain the best adhesion when embedded in concrete; | ||
| Can be used both under laboratory conditions and in situ; | The measurement is limited to the place where the optical fiber is located; | ||
| Allows for the detection of cracks inside the structure. | The need to leave the equipment at the monitored facility and have a constant power supply. | ||
| Digital methods of monitoring crack width growth | |||
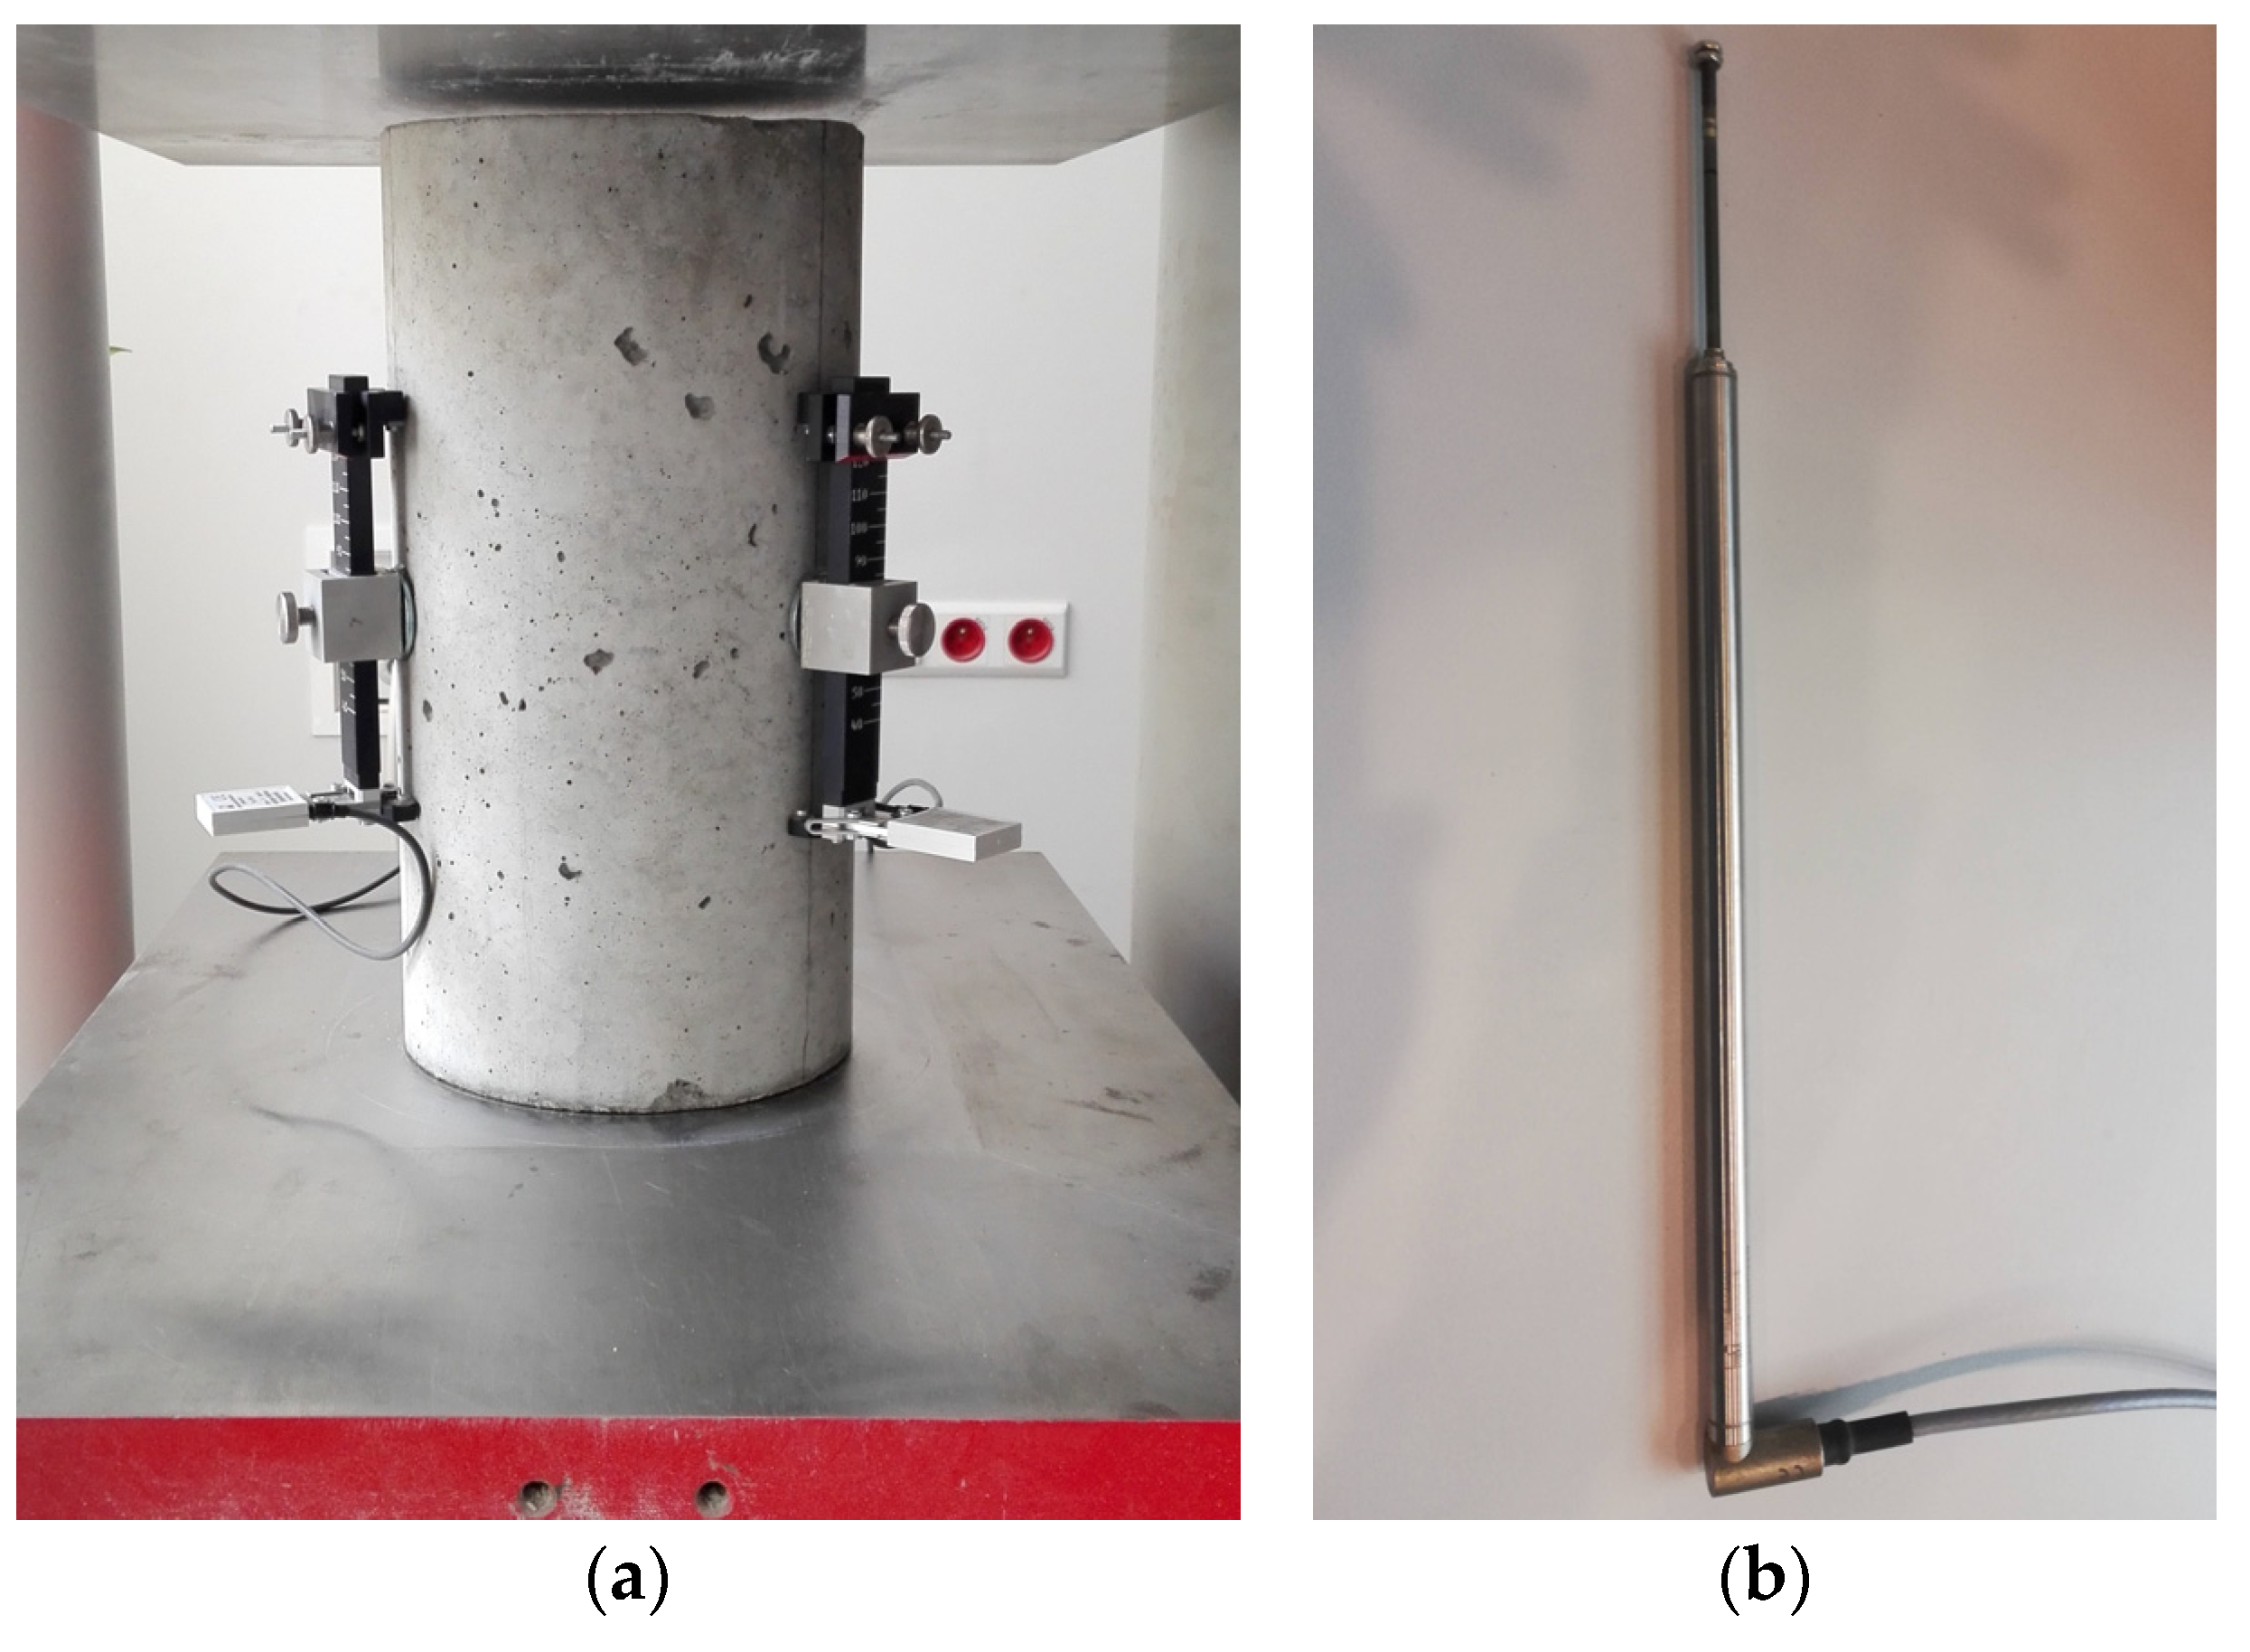
| Displacement transducers | Usually, 0.5% relative to the maximum measuring range of the sensor | High accuracy; | Point measurements in predefined locations; |
| Enables measurements of displacements; | The need to leave the equipment at the monitored facility and have a constant power supply. | ||
| Extended configurations allow measurements of changes in crack width and displacement along the crack and the angle of crack rotation; | |||
| Automatic measurements and data transmission via the internet; | |||
| The possibility of using multiple sensors. | |||
| Magnetic sensor | 0.025 mm in the X direction (crack width) and 0.05 mm in the Y direction (displacement along the crack) | Allows measurements of changes in crack width and displacement along the crack; | Point measurements in predefined locations; |
| Battery power supply; | The need to leave the equipment at the monitored facility. | ||
| Automatic measurements and data transmission via the internet; | |||
| The possibility of using multiple sensors. | |||
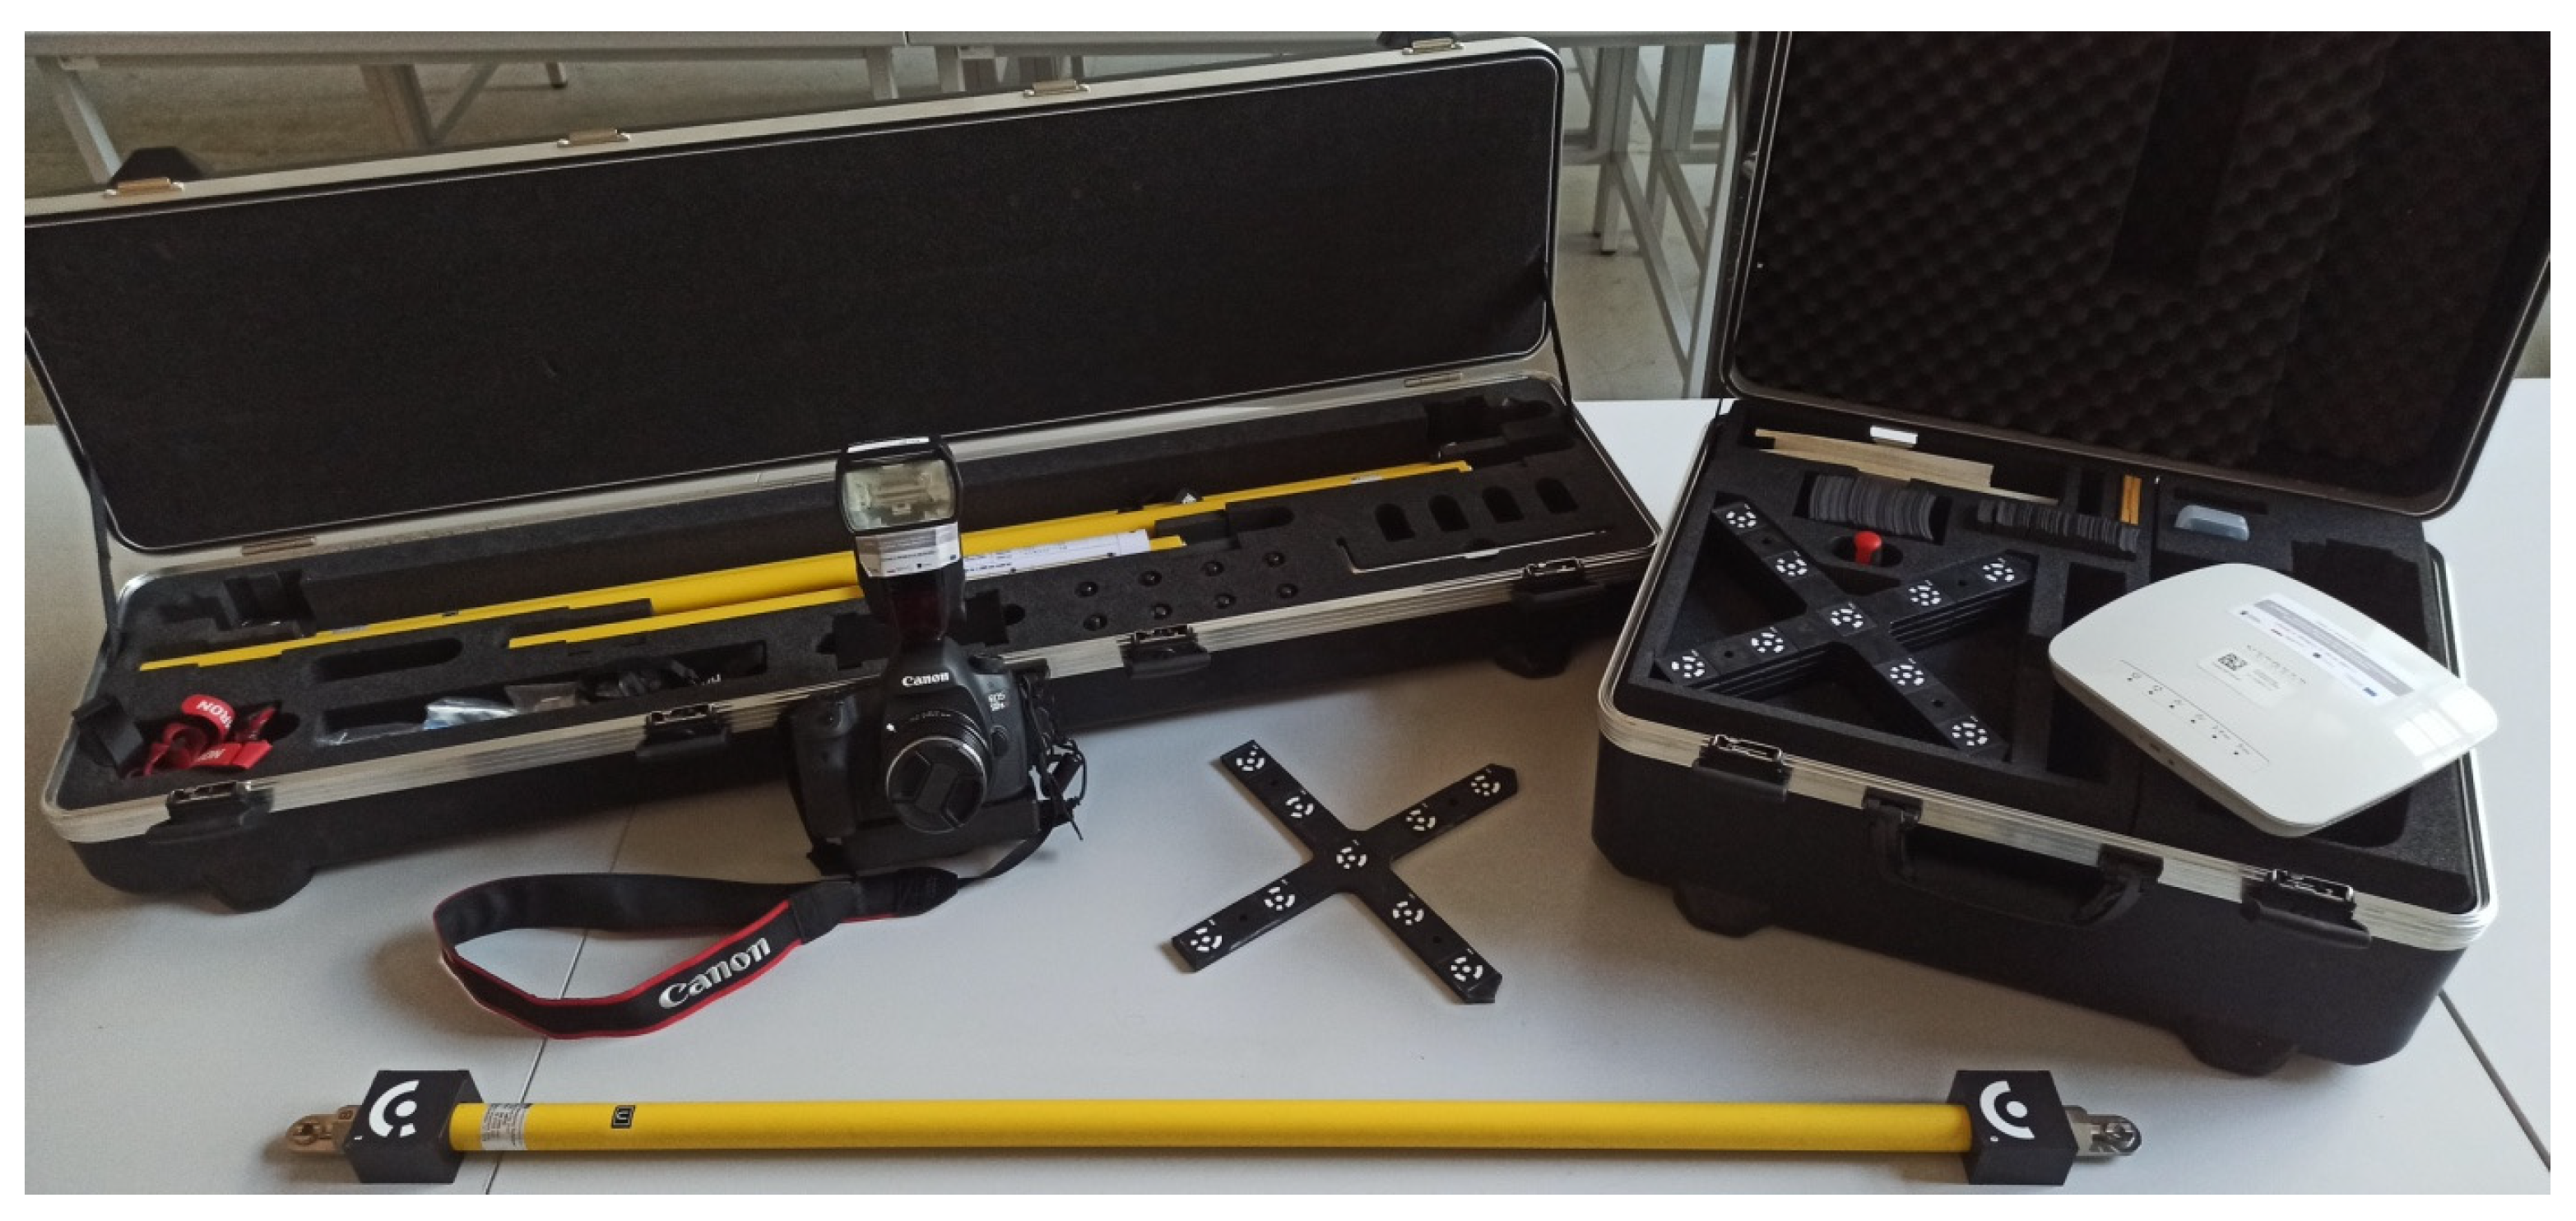
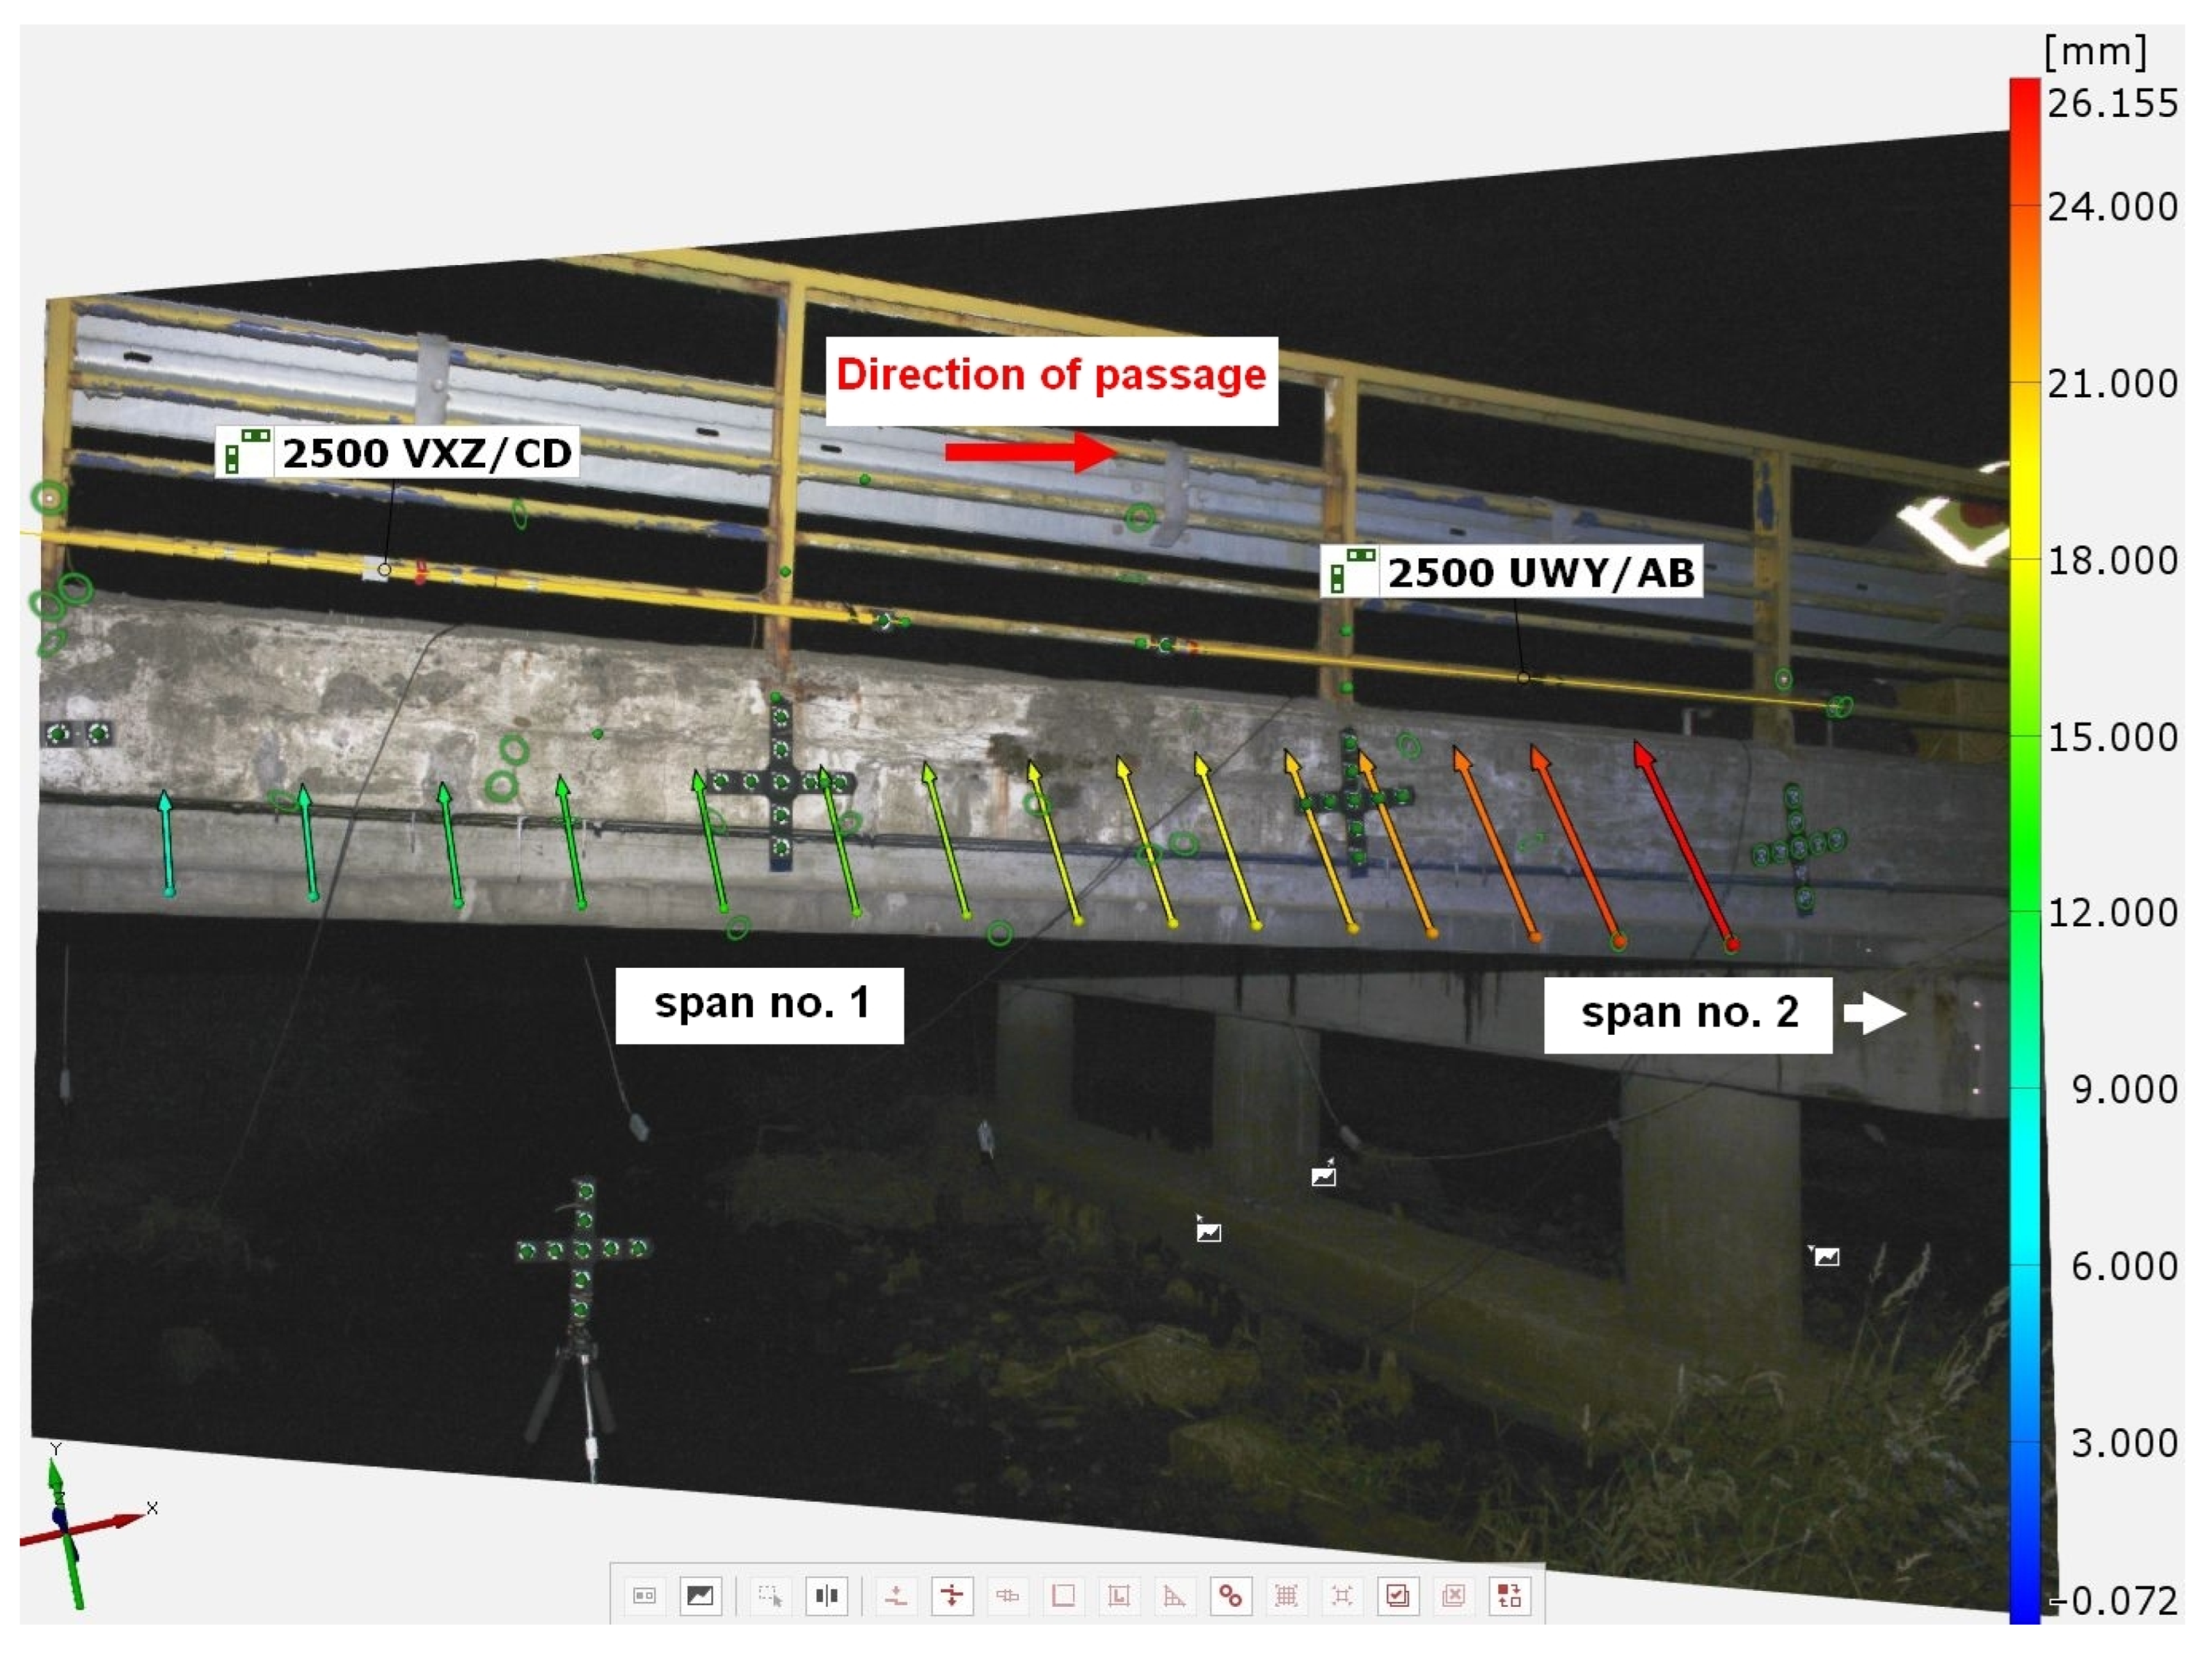
| Photogrammetric measurements | Depends on the resolution of the cameras and the distance from the recorded object | Allow measurements of changes in crack width and displacement along the crack and the angle of crack rotation; | Requires attaching/sticking markers to the object; |
| The possibility of taking measurements at many points at one time; | Point measurements in predefined locations. | ||
| Do not require leaving equipment on the monitored facility; | |||
| No remote measurements are possible. | |||
| Method | Advantages | Disadvantages |
|---|---|---|
| Impact echo and ultrasonic method (UT, UT-PA, and TOFD) | The detection of internal defects in concrete; | Measurements should not be taken directly in cracked, cancerous, or corroded places, in the immediate vicinity of reinforcing bars, or in areas of the highest stress concentration; |
| Determines the wave velocity and its changes in the cross section of the element; | Small detection area; | |
| Allows the determination of crack depth; | The method is sensitive to, among other things, differences in the moisture content of the concrete surface and the presence of reinforcing bars. | |
| Acoustic emission method (AT) | Can measure the entire structure; | AE signal attenuation; |
| Temporary and continuous monitoring; | Sensitivity to equipment setting errors; | |
| Location of cracks; | Sensitivity to the incorrect selection of sensor frequencies. | |
| Identification of the destructive process; | ||
| Crack development; | ||
| Identification of discontinuities in the material structure; | ||
| Monitoring the reinforcement corrosion process; | ||
| Estimation of crack widths; | ||
| Assessment of the intensity of the development of destructive processes; | ||
| Detection of damage in inaccessible places. | ||
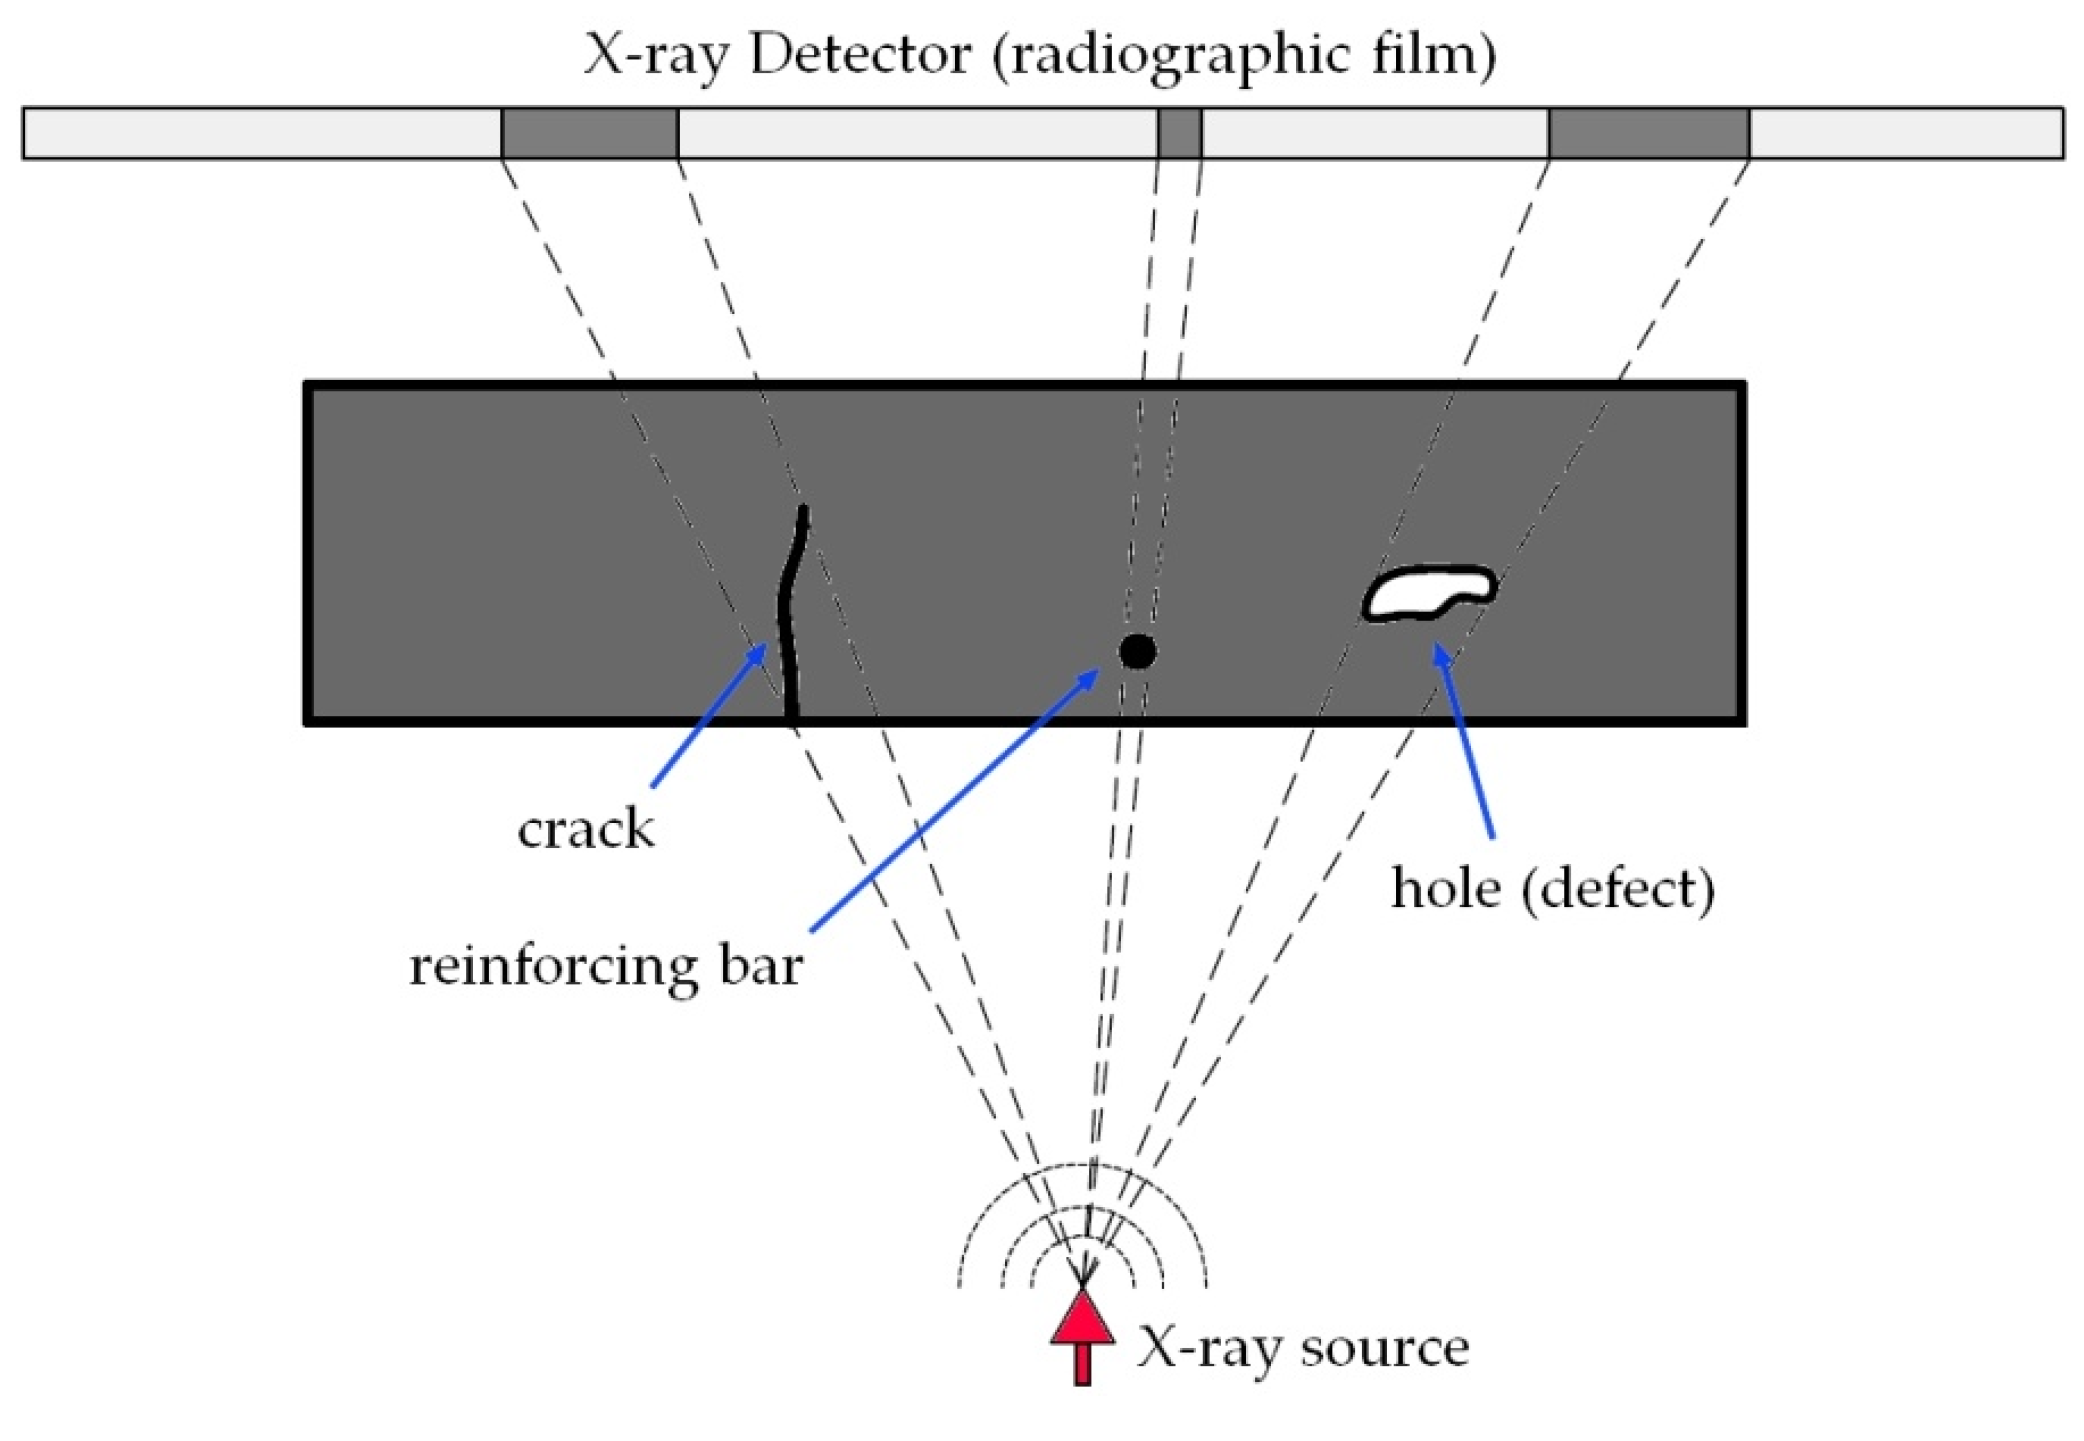
| Digital radiography (X-ray) | Systems of this type are mainly used to map the location of conduit, reinforcing steel, and post-tension cables within concrete elements; | The deterioration of construction (causes changes in the density of concrete) impairs the readability of the X-ray film image. |
| Can be used to detect cracks in concrete (mainly applicable to small elements); | ||
| X-ray radiography can be used with a contrast medium to locate internal cracks. | ||
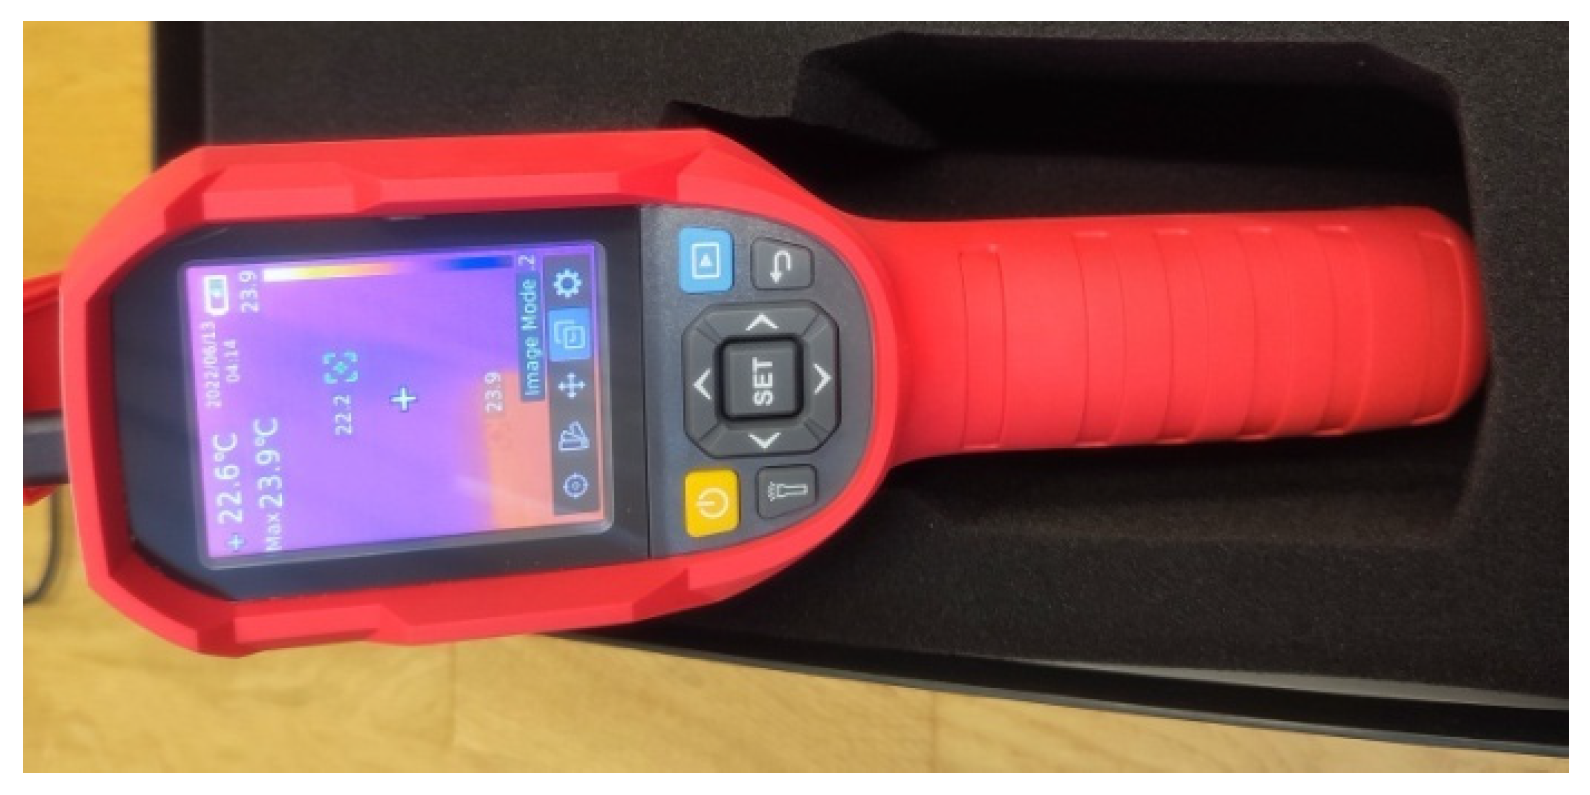
| Thermography | Can be used to detect cracks in reinforced concrete structures. | This method is sensitive to the influence of external conditions such as wind, rain, sunlight, etc.; |
| Only a small area can be observed; | ||
| The method allows the detection of internal cracks, but only at a shallow depth; | ||
| Thinner cracks with widths smaller than 0.5 mm can only be observed with an additional stimulus. |
Disclaimer/Publisher’s Note: The statements, opinions and data contained in all publications are solely those of the individual author(s) and contributor(s) and not of MDPI and/or the editor(s). MDPI and/or the editor(s) disclaim responsibility for any injury to people or property resulting from any ideas, methods, instructions or products referred to in the content. |
© 2023 by the authors. Licensee MDPI, Basel, Switzerland. This article is an open access article distributed under the terms and conditions of the Creative Commons Attribution (CC BY) license (https://creativecommons.org/licenses/by/4.0/).
Share and Cite
Świt, G.; Krampikowska, A.; Tworzewski, P. Non-Destructive Testing Methods for In Situ Crack Measurements and Morphology Analysis with a Focus on a Novel Approach to the Use of the Acoustic Emission Method. Materials 2023, 16, 7440. https://doi.org/10.3390/ma16237440
Świt G, Krampikowska A, Tworzewski P. Non-Destructive Testing Methods for In Situ Crack Measurements and Morphology Analysis with a Focus on a Novel Approach to the Use of the Acoustic Emission Method. Materials. 2023; 16(23):7440. https://doi.org/10.3390/ma16237440
Chicago/Turabian StyleŚwit, Grzegorz, Aleksandra Krampikowska, and Paweł Tworzewski. 2023. "Non-Destructive Testing Methods for In Situ Crack Measurements and Morphology Analysis with a Focus on a Novel Approach to the Use of the Acoustic Emission Method" Materials 16, no. 23: 7440. https://doi.org/10.3390/ma16237440
APA StyleŚwit, G., Krampikowska, A., & Tworzewski, P. (2023). Non-Destructive Testing Methods for In Situ Crack Measurements and Morphology Analysis with a Focus on a Novel Approach to the Use of the Acoustic Emission Method. Materials, 16(23), 7440. https://doi.org/10.3390/ma16237440