
Improved Analytical Model for Thermal Softening in Aluminum Alloys Form Room Temperature to Solidus

 , and
, and
Abstract
:1. Introduction
2. Materials and Methods
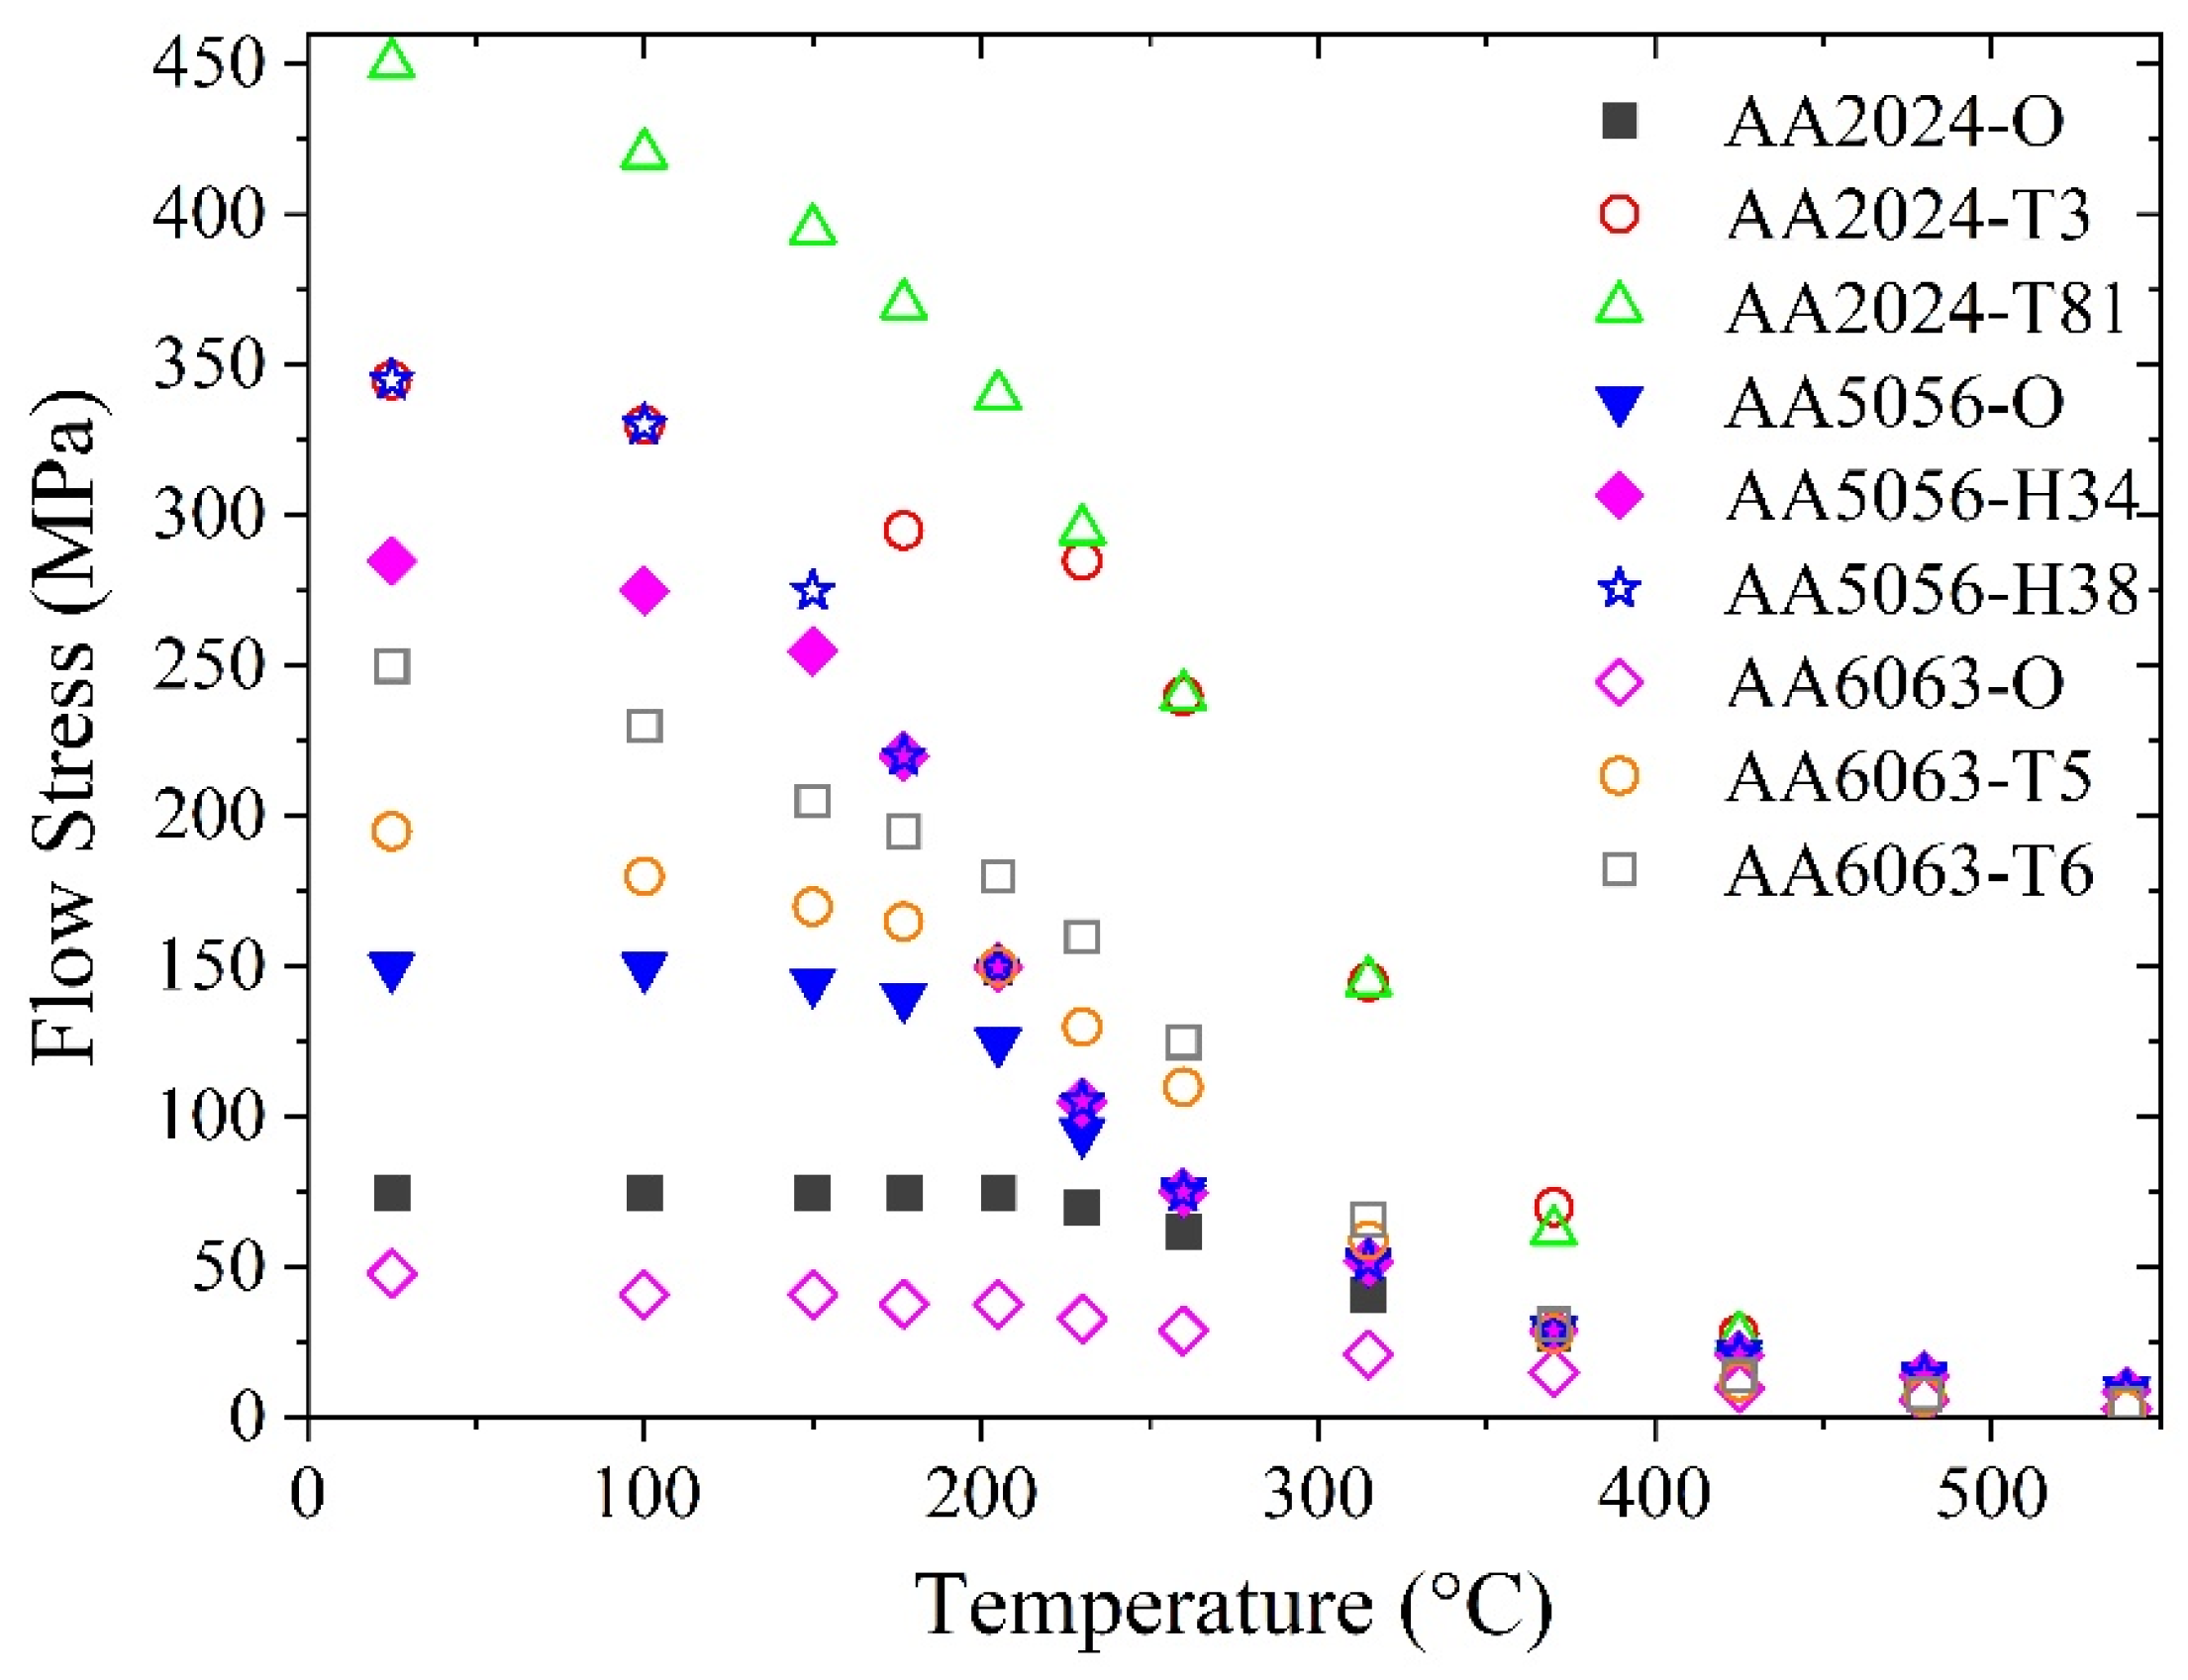
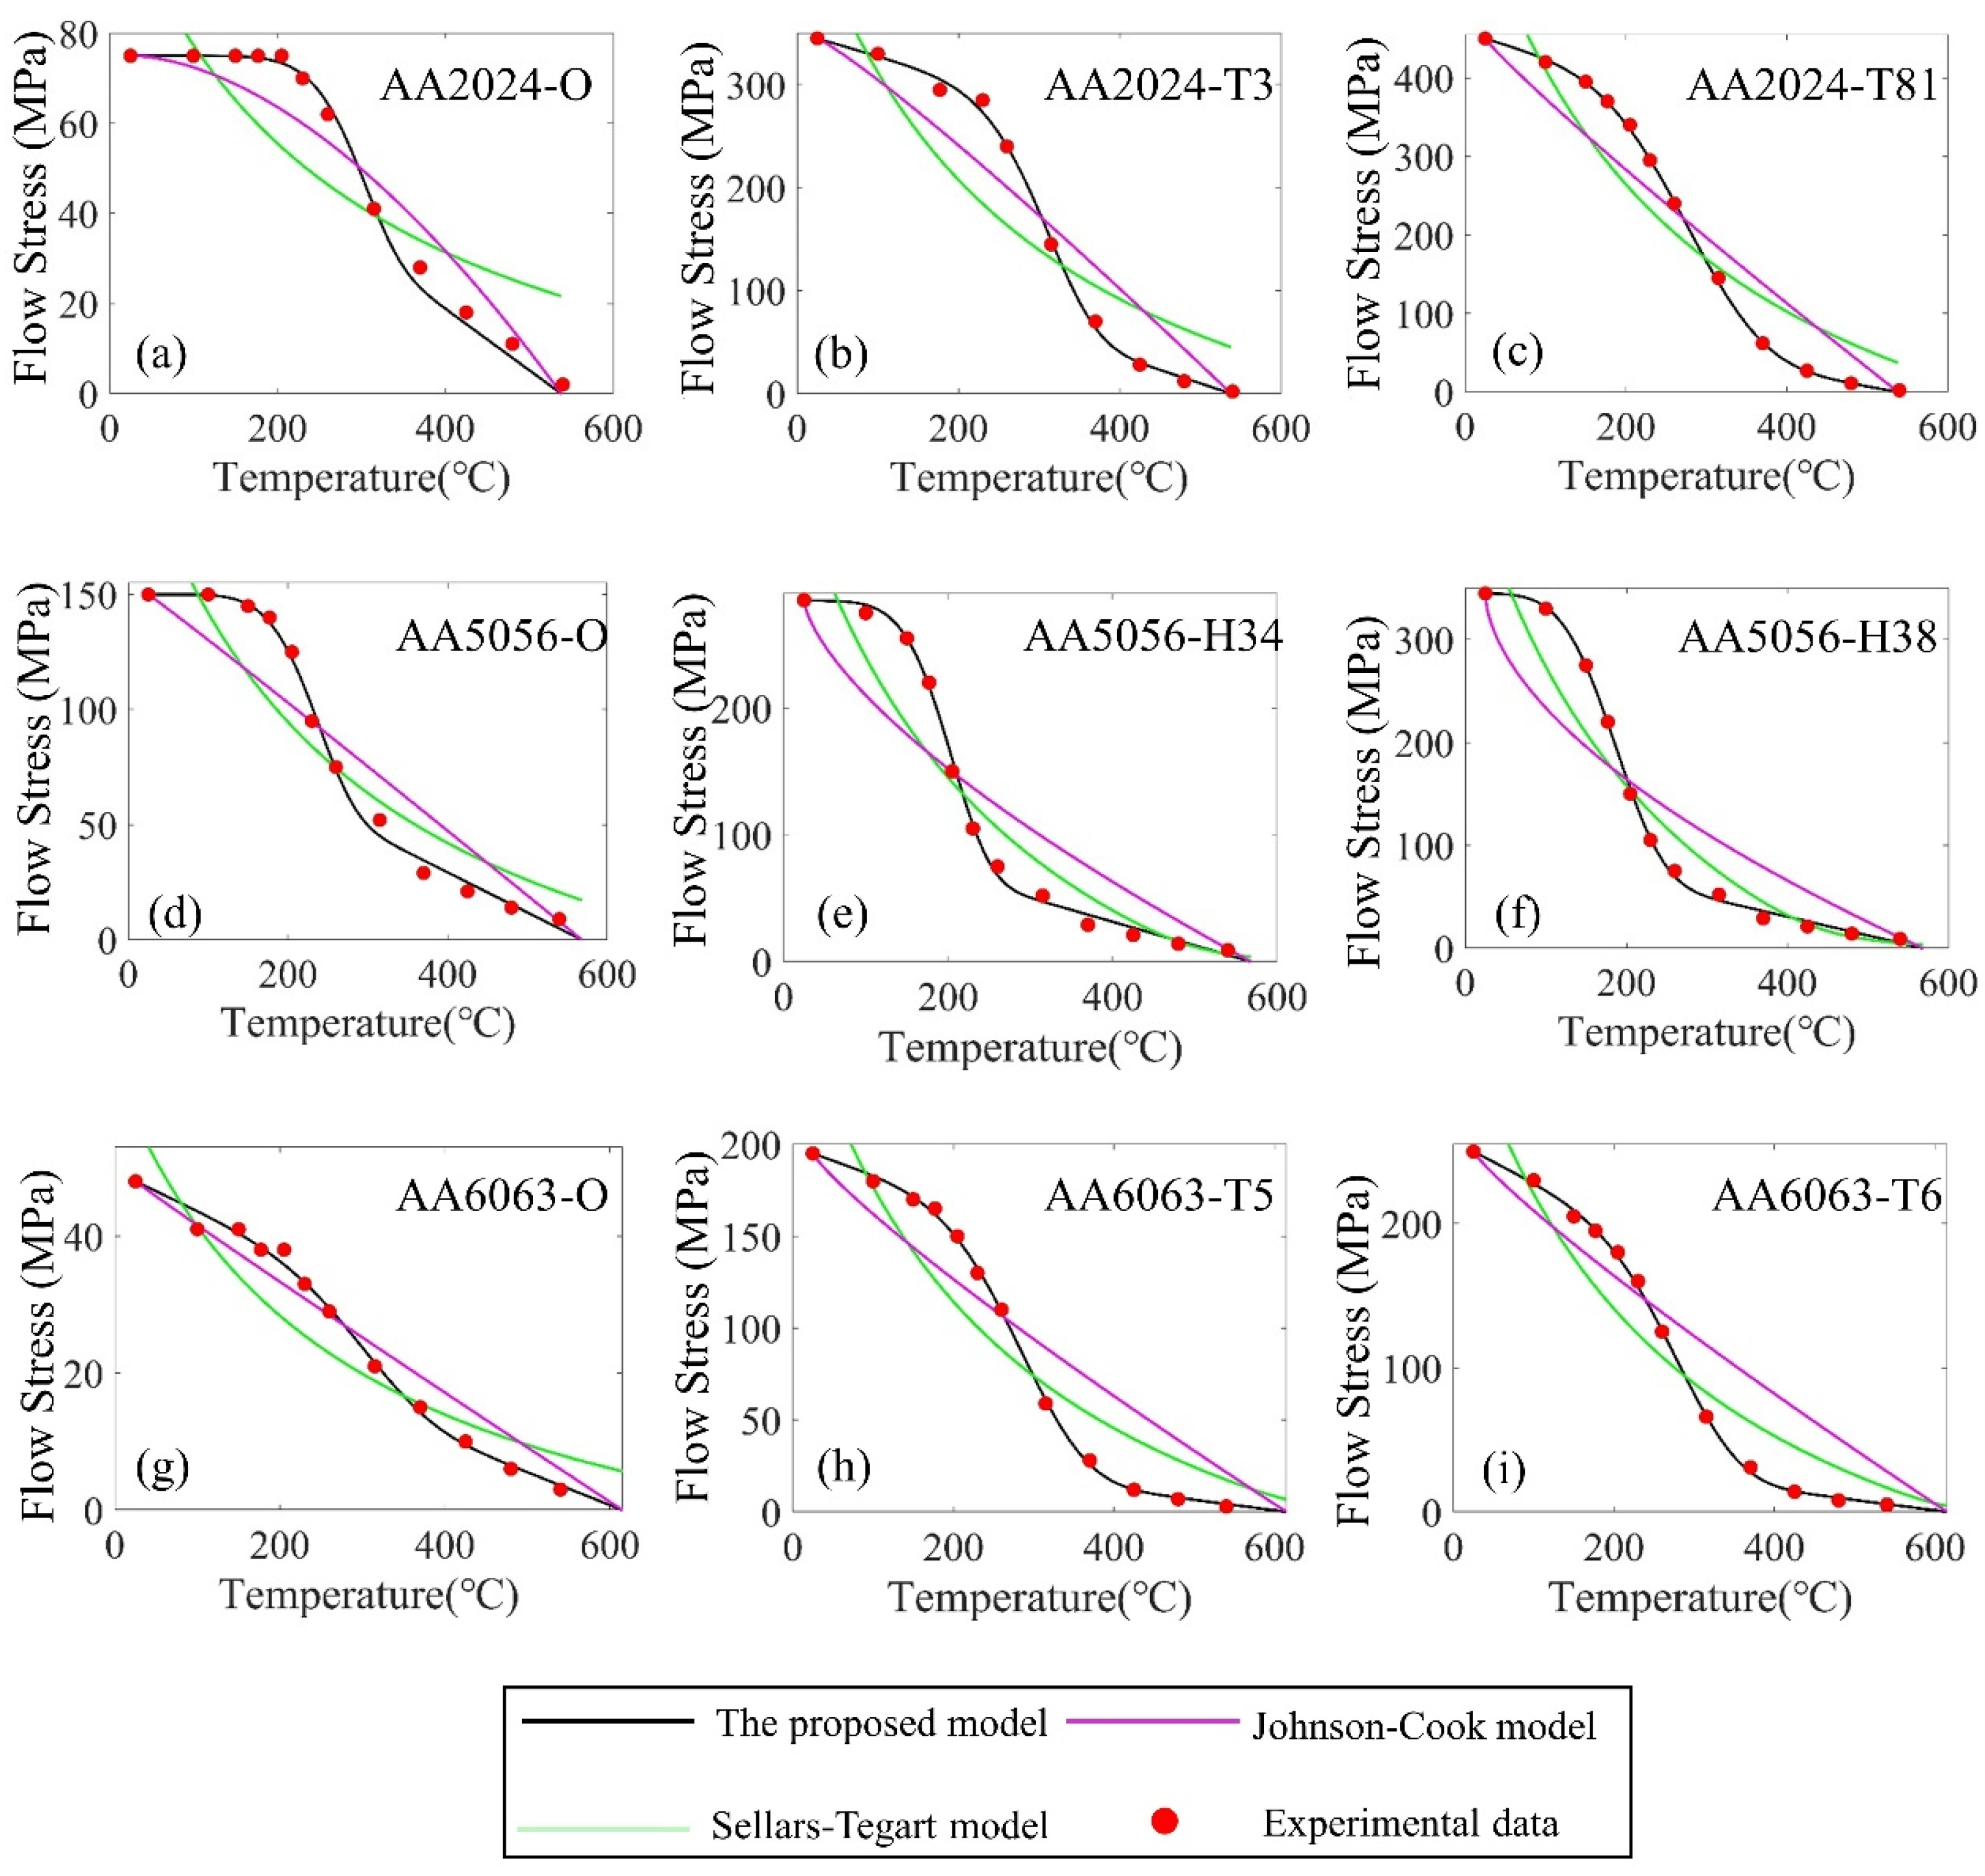
3. Results
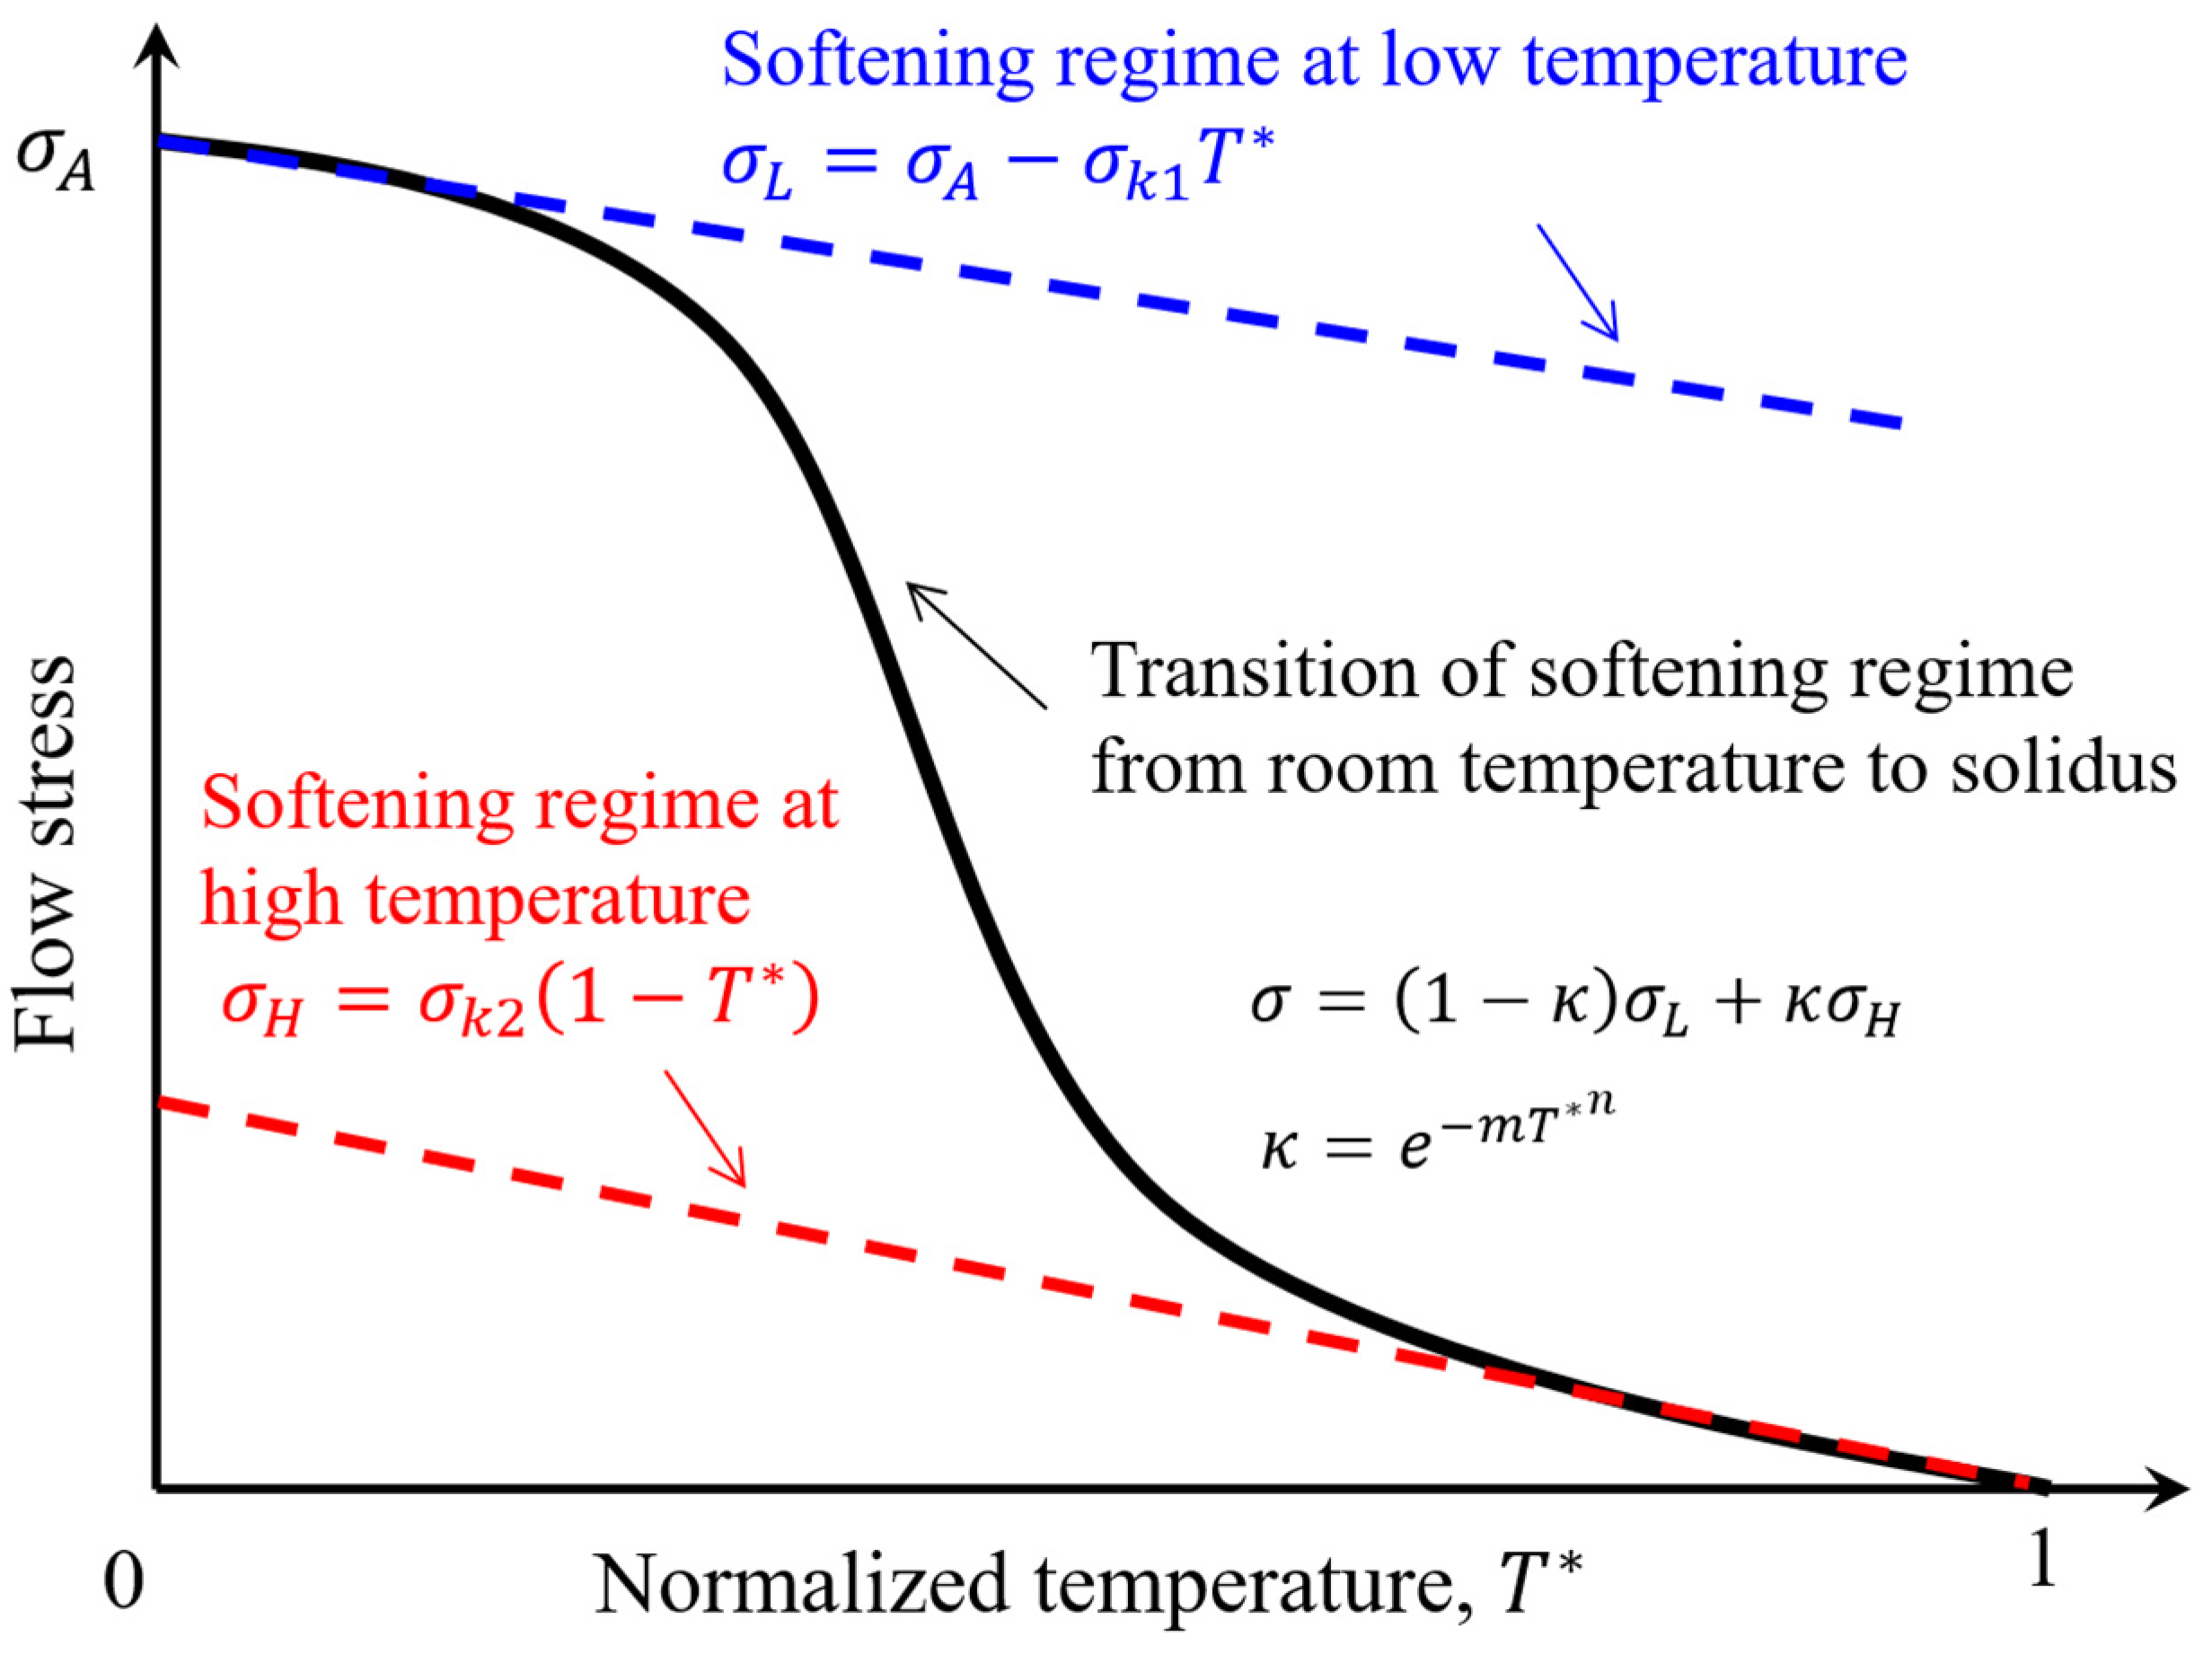
4. Discussion
5. Conclusions
Author Contributions
Funding
Institutional Review Board Statement
Informed Consent Statement
Data Availability Statement
Conflicts of Interest
References
- Geng, P.; Qin, G.; Zhou, J.; Zou, Z. Hot deformation behavior and constitutive model of GH4169 superalloy for linear friction welding process. J. Manuf. Process. 2018, 32, 469–481. [Google Scholar] [CrossRef]
- Jin, F.; Li, J.; Du, Y.; Nan, X.; Shi, J.; Xiong, J.; Zhang, F. Numerical simulation based upon friction coefficient model on thermo-mechanical coupling in rotary friction welding corresponding with corona-bond evolution. J. Manuf. Process. 2019, 45, 595–602. [Google Scholar] [CrossRef]
- Sonne, M.R.; Hattel, J.H. Thermomechanical Modelling of Direct-Drive Friction Welding Applying a Thermal Pseudo Mechanical Model for the Generation of Heat. Key Eng. Mater. 2018, 767, 343–350. [Google Scholar] [CrossRef]
- Yang, X.; Li, W.; Ma, J.; Hu, S.; He, Y.; Li, L.; Xiao, B. Thermo-physical simulation of the compression testing for constitutive modeling of GH4169 superalloy during linear friction welding. J. Alloys Compd. 2016, 656, 395–407. [Google Scholar] [CrossRef]
- Wu, H.Y.; Yang, J.C.; Zhu, F.J.; Wu, C.T. Hot compressive flow stress modeling of homogenized AZ61 Mg alloy using strain-dependent constitutive equations. Mater. Sci. Eng. A 2013, 574, 17–24. [Google Scholar] [CrossRef]
- Lin, Y.C.; Chen, X.M.; Wen, D.X.; Chen, M.S. A physically-based constitutive model for a typical nickel-based superalloy. Comput. Mater. Sci. 2014, 83, 282–289. [Google Scholar] [CrossRef]
- Han, Y.; Qiao, G.J.; Sun, J.P.; Zou, D.N. A comparative study on constitutive relationship of as-cast 904L austenitic stainless steel during hot deformation based on Arrhenius-type and artificial neural network models. Comput. Mater. Sci. 2013, 67, 93–103. [Google Scholar] [CrossRef]
- Wang, X.; Jiang, T.; Ji, C.; Zhao, C.X.; Wang, Y.T.; Gao, Z.R. Mechanical properties and constitutive modeling of 6063-T5 aluminum alloy over a wide range of stain rates and temperature. Int. J. Thermophys. 2023, 44, 9. [Google Scholar] [CrossRef]
- Shen, W.J.; Xue, F.M.; Li, C.Z.; Liu, Y.; Mo, X.Y.; Gao, Q.R. Study on constitutive relationship of 6061 aluminum alloy based on Johnson-Cook model. Mater. Today Commun. 2023, 37, 106982. [Google Scholar] [CrossRef]
- Lin, Y.C.; Chen, X.M. A critical review of experimental results and constitutive descriptions for metals and alloys in hot working. Mater. Des. 2011, 32, 1733–1759. [Google Scholar] [CrossRef]
- Jia, Z.; Guan, B.; Zang, Y.; Wang, Y.; Mu, L. Modified Johnson-Cook model of aluminum alloy 6016-T6 sheets at low dynamic strain rates. Mater. Sci. Eng. A 2021, 820, 141565. [Google Scholar] [CrossRef]
- Colegrove, P.A.; Shercliff, H.R. CFD modelling of friction stir welding of thick plate 7449 aluminum alloy. Sci. Technol. Weld. Join. 2006, 11, 429–441. [Google Scholar] [CrossRef]
- Chen, G.Q.; Shi, Q.Y.; Li, Y.J.; Sun, Y.J.; Dai, Q.L.; Jia, J.Y.; Zhu, Y.C.; Wu, J.J. Computational fluid dynamics studies on heat generation during friction stir welding of aluminum alloy. Comput. Mater. Sci. 2013, 79, 540–546. [Google Scholar] [CrossRef]
- Su, H.; Wu, C.S.; Pittner, A.; Rethmeier, M. Thermal energy generation and distribution in friction stir welding of aluminum alloys. Energy 2014, 77, 720–731. [Google Scholar] [CrossRef]
- Gupta, A.K.; Anirudh, V.K.; Singh, S.K. Constitutive models to predict flow stress in Austenitic Stainless Steel 316 at elevated temperatures. Mater. Des. 2013, 43, 410–418. [Google Scholar] [CrossRef]
- Shi, L.; Chen, J.; Yang, C.L.; Chen, G.Q.; Wu, C.S. Thermal-fluid-structure coupling analysis of void defect in friction stir welding. Int. J. Mech. Sci. 2023, 241, 107969. [Google Scholar] [CrossRef]
- Geng, P.H.; Ma, Y.W.; Ma, N.S.; Ma, H.; Aoki, Y.; Liu, H.H.; Fujii, H.; Chen, C.T. Effects of rotation tool-induced heat and material flow behaviour on friction stir lapped Al/steel joint formation and resultant microstructure. Int. J. Mach. Tools Manuf. 2022, 174, 103858. [Google Scholar] [CrossRef]
- Kaufman, J.G. Properties of Aluminum Alloys: Tensile, Creep, and Fatigue Data at High and Low Temperatures; ASM International: Detroit, MI, USA, 1999. [Google Scholar]
- Sellars, C.; McTegart, W. On the mechanism of hot deformation. Acta Metall. 1966, 14, 1136–1138. [Google Scholar] [CrossRef]
- Johnson, G.R.; Cook, W.K. A Constitutive Model and Data for Metals Subjected to Large Strains, High Strain Rates and High Temperature. In Proceedings of the 7th International Symposium on Ballistics, Hague, The Netherlands, 19–21 April 1983. [Google Scholar]
- Davis, J.R. Aluminum and Aluminum Alloys; ASM International: Detroit, MI, USA, 1993. [Google Scholar]

| Parameter | m | n | /MPa | /MPa | |||
|---|---|---|---|---|---|---|---|
| AA2024-O | 63.4 | 6.7 | 0.0 | 70.0 | 25 | 538 | 75 |
| AA2024-T3 | 24.0 | 5.8 | 119.5 | 133.4 | 25 | 538 | 345 |
| AA2024-T81 | 10.1 | 3.8 | 167.8 | 92.6 | 25 | 538 | 450 |
| AA5056-O | 121.2 | 5.2 | 0.00047 | 94.6 | 25 | 568 | 150 |
| AA5056-H34 | 169.1 | 4.8 | 9.7 | 101.5 | 25 | 568 | 285 |
| AA5056-H38 | 66.7 | 3.7 | 18.2 | 98.7 | 25 | 568 | 345 |
| AA6063-O | 20.9 | 4.5 | 34.3 | 28.3 | 25 | 615 | 48 |
| AA6063-T5 | 25.2 | 4.4 | 93.1 | 33.8 | 25 | 615 | 195 |
| AA6063-T6 | 30.5 | 4.6 | 172.3 | 42.4 | 25 | 615 | 250 |
| Model | Sellars–Tegart Model | Johnson–Cook Model | |||||
|---|---|---|---|---|---|---|---|
| Parameter | A() | r | Q() | ||||
| AA2024-O | 1.13 | 0.001 | 3.79 | 4.31 | 3.64 | 1.751 | 75 |
| AA2024-T3 | 1.13 | 0.001 | 9.16 | 1.57 | 2.63 | 1.116 | 345 |
| AA2024-T81 | 5.61 | 0.001 | 6.81 | 0.81 | 2.55 | 0.921 | 450 |
| AA5056-O | 5.35 | 0.001 | 5.94 | 2.33 | 2.73 | 1.024 | 150 |
| AA5056-H34 | 5.33 | 0.001 | 14.66 | 2.28 | 2.16 | 0.674 | 285 |
| AA5056-H38 | 4.23 | 0.001 | 24.70 | 2.87 | 1.97 | 0.571 | 345 |
| AA6063-O | 5.33 | 0.001 | 5 | 2.28 | 2.16 | 1.433 | 48 |
| AA6063-T5 | 1.87 | 0.001 | 9.84 | 2.00 | 2.59 | 0.972 | 195 |
| AA6063-T6 | 1.90 | 0.001 | 6.65 | 1.36 | 2.39 | 0.876 | 250 |
| Model | The Proposed Model | Sellars–Tegart Model | Johnson–Cook Model |
|---|---|---|---|
| AA2024-O | 2.041% | 112.21% | 130.8% |
| AA2024-T3 | 6.035% | 292.9% | 139.6% |
| AA2024-T81 | 1.187% | 218.7% | 214.9% |
| AA5056-O | 9.953% | 42.82% | 42.87% |
| AA5056-H34 | 11.20% | 30.89% | 75.61% |
| AA5056-H38 | 10.77% | 26.98% | 82.38% |
| AA6063-O | 4.789% | 40.43% | 26.02% |
| AA6063-T5 | 6.242% | 106.1% | 143.6% |
| AA6063-T6 | 4.416% | 81.43% | 90.24% |
Disclaimer/Publisher’s Note: The statements, opinions and data contained in all publications are solely those of the individual author(s) and contributor(s) and not of MDPI and/or the editor(s). MDPI and/or the editor(s) disclaim responsibility for any injury to people or property resulting from any ideas, methods, instructions or products referred to in the content. |
© 2023 by the authors. Licensee MDPI, Basel, Switzerland. This article is an open access article distributed under the terms and conditions of the Creative Commons Attribution (CC BY) license (https://creativecommons.org/licenses/by/4.0/).
Share and Cite
Chen, G.; Liu, X.; Qiao, J.; Tang, T.; Zhang, H.; Xing, S.; Zhang, G.; Shi, Q. Improved Analytical Model for Thermal Softening in Aluminum Alloys Form Room Temperature to Solidus. Materials 2023, 16, 7358. https://doi.org/10.3390/ma16237358
Chen G, Liu X, Qiao J, Tang T, Zhang H, Xing S, Zhang G, Shi Q. Improved Analytical Model for Thermal Softening in Aluminum Alloys Form Room Temperature to Solidus. Materials. 2023; 16(23):7358. https://doi.org/10.3390/ma16237358
Chicago/Turabian StyleChen, Gaoqiang, Xin Liu, Junnan Qiao, Tianxiang Tang, Hua Zhang, Songling Xing, Gong Zhang, and Qingyu Shi. 2023. "Improved Analytical Model for Thermal Softening in Aluminum Alloys Form Room Temperature to Solidus" Materials 16, no. 23: 7358. https://doi.org/10.3390/ma16237358
APA StyleChen, G., Liu, X., Qiao, J., Tang, T., Zhang, H., Xing, S., Zhang, G., & Shi, Q. (2023). Improved Analytical Model for Thermal Softening in Aluminum Alloys Form Room Temperature to Solidus. Materials, 16(23), 7358. https://doi.org/10.3390/ma16237358