1. Introduction
The submerged entry nozzle (SEN) is a functional refractory material that plays a crucial role in the final stage of continuous casting, situated between the tundish and the mold [
1]. It prevents contact between the molten metal and air while ensuring a steady flow of molten metal into the mold and stabilizing the flow of the molten metal [
2]. The SEN must possess excellent thermal shock resistance to withstand rapid temperature changes and sufficient strength to bear the pressure of the molten metal. Additionally, it requires high corrosion resistance and wear resistance against molten metal and slag for prolonged usage [
3,
4]. The body of the SEN primarily utilizes Al
2O
3-C-based refractories, but in the areas that contact slag, ZrO
2-C-based refractories are used due to their superior corrosion resistance and abrasion resistance [
5]. In ZrO
2-C-based refractories, ZrO
2 is chemically stable, resistant to forming low-melting-point compounds, and has excellent thermal spalling resistance. Graphite minimizes thermal shock by providing excellent thermal conductivity and reduces contact and reactions between slag and the refractory material due to its low wettability with slag [
6]. However, ZrO
2-C-based refractories are known to be eroded by slag [
7]. It is commonly understood that erosion occurs due to the flow at the interface between slag and molten metal [
8,
9]. The interface between slag and molten metal fluctuates, causing the ZrO
2-C refractory to alternately come into contact with the molten metal and slag. When the molten metal rises, graphite dissolves into the molten metal, exposing the surface of ZrO
2. When the molten metal descends, ZrO
2 is exposed to the slag without graphite, and it is known that ZrO
2 dissolves into the slag, leading to erosion. The dissolution of ZrO
2 by the slag is known to be the rate-determining step, given the rapid dissolution of graphite into the molten metal in this erosion mechanism [
10]. However, this mechanism explains erosion at the interface between slag and molten metal, but it does not explain erosion that occurs further up from the interface. Therefore, Hauck and Potschke proposed a localized corrosion mechanism due to interfacial tension gradients [
11]. This mechanism suggests that slag covers ZrO
2 due to surface tension, forming a slag film and eroding ZrO
2. In this manner, the submerged entry nozzle is explained by complex erosion mechanisms, and ultimately, since the erosion rate of ZrO
2 determines the life of the submerged entry nozzle, research is being conducted to reduce the erosion rate of ZrO
2 and to decrease the graphite content [
12]. However, the reduction in graphite content causes a lower thermal conductivity in ZrO
2-C refractories, which can lead to a decrease in thermal shock resistance. Therefore, there is a need to secure thermal shock resistance through the improvement of the mechanical properties of zirconia.
Partially stabilized zirconia (PSZ), which exhibits excellent thermal shock resistance due to transformation toughening as cubic or tetragonal phases transform to the monoclinic phase, is used for submerged entry nozzles [
13,
14]. PSZ is obtained by stabilizing high-temperature phases at room temperature by adding stabilizers such as MgO, CaO, and Y
2O
3. Primarily, CaO-stabilized zirconia (CSZ) is used for submerged entry nozzles [
15]. However, CSZ has issues with corrosion caused by slag, and the destabilization of zirconia due to reactions with slag is known to be the main cause. SiO
2 present in the slag reacts with CaO to form a low-melting-point glass, and it is known to transform cubic or tetragonal phases of zirconia into the monoclinic phase, breaking up the zirconia grains [
16,
17]. To improve the durability of submerged entry nozzles, it is necessary to address the destabilization of zirconia caused by slag, and progress is being made in enhancing corrosion resistance through co-doping.
Corrosion of refractories by slag is related to the basicity and viscosity of the slag, and Hirata et al. have presented an experimental equation to predict the corrosion rate of ceramic materials by slag [
18].
where
is the depth of corrosion (μm),
is the basicity gap between slag and ceramics,
is the viscosity of the slag, and
C is a constant that varies depending on the corrosion conditions. The basicity gap can be calculated through the
B parameter proposed by Morinaga et al., estimated as follows [
19]:
where
represents the fraction of cation
for all cations, and
and
represent the ionic radius and charge of cation
, respectively. This parameter can represent the basicity of completely molten oxides, assuming that the bond between cations and anions in the slag is ionic. From this equation, we can deduce that the basicity increases as the ionic radius increases and the charge decreases, and to reduce reactivity with SiO
2, it is necessary to dope with acidic elements.
In this study, we aimed to enhance the corrosion resistance of CaO-stabilized zirconia (CSZ) by doping it with acidic CeO2 and MnO2 and analyzing the resultant mechanical properties. XRD analysis was performed to investigate the changes in crystal structure due to doping, including variations in monoclinic phase fraction and peak shifts/corrosion tests were conducted to assess the corrosion resistance of CeO2 and MnO2-doped CSZ and analyze the associated destabilization behavior.
2. Experimental Procedures
CaO-stabilized zirconia (CSZ) is a commercial refractory powder, and its chemical composition is listed in
Table 1. MnO
2 (Junsei Chemical Co., Ltd., Kanto, Japan, 90%) powder and CeO
2 (Kanto Chemical Co., Inc., Tokyo, Japan, 99.99%) were used as dopants. The particle size distribution characteristics and SEM images of the powders are shown in
Figure 1 and
Figure 2. MnO
2-doped CSZ and CeO
2-doped CSZ were prepared as shown in
Table 2. MnO
2 and CeO
2 were introduced into CSZ powders by the mechanical mixing method. The mixed powders were ball milled in ethanol for 24 h. Mixed solutions were then dried at 100 °C using a dry oven, calcinated for 24 h using a dry oven, and then calcined at 1200 °C for 2 h in a box-type electric furnace. Powder was uniaxially pressed at 3 ton/m
2 to produce a 20 mm disk specimen, and the green body was sintered at 5 °C/min to various temperatures (1300–1600 °C) for 4 h. The bar-type specimens (3.5 mm × 4.5 mm × 36 mm) were uniaxially pressed at 3.2 ton/m
2 in a steel die and heated up to 1600 °C with a heating rate of 5 °C/min for 4 h.
A corrosion test was performed using slag powder, and the composition of the slag powder is indicated in
Table 3. 0.7 g of the slag powder was formed into pellets using a cylindrical 15 mm mold with a pressure of 1 ton/m
2. The slag pellets were then placed on sintered zirconia specimens and heat-treated in a box furnace at 1550 °C for 10 h in an air atmosphere.
The densities of sintered pellets were determined using the Archimedes’ method, which involved immersing the samples in distilled water. X-ray diffraction (XRD) patterns of the specimens were collected at room temperature using a step scan procedure (2θ = 10–90°, with a step interval of 0.02°) and Cu-Kα radiation on a Rigaku Ultima-IV XRD instrument (Rigaku Corporation, Tokyo, Japan) at the Converging Materials Core Facility. The XRD data obtained for phase analysis was analyzed using Rigaku SmartLab Studio II software version 4.3.101.0.
Monoclinic phase was determined from the integrated intensity of the X-ray diffraction scan based on ISO 5803 [
20].
Formular (4) is for a two-phase system (monoclinic and tetragonal phases), and Formular (5) is for multi-phase system (a mixture of monoclinic, tetragonal, and cubic).
is an integrated intensity ratio. Where
and
refer to the integral intensity of the X-ray diffraction pattern of monoclinic. The
refers to the integral intensity from the (101) plane of tetragonal and
is total integrated intensity of tetragonal phase (101) and cubic phase (111) reflection. Calculate the volume fraction of the monoclinic phase using Formular (6):
is the volume fraction of the monoclinic phase and the P is the intensity factor. In the monoclinic-tetragonal ZrO2 system, is used, while in the multiphase system, is used.
A nano indenter (FISCHERSCOPE, HM2000, Sindelfingen, Germany) was used to measure the Vickers hardness. Flexural strength was measured with the three-point bending method using test specimens measuring 3.5 mm × 4.5 mm × 36 mm. The SEM images of the samples were obtained by using a scanning electron microscope (JEOL Ltd., JSM-IT800, Tokyo, Japan).
3. Results and Discussion
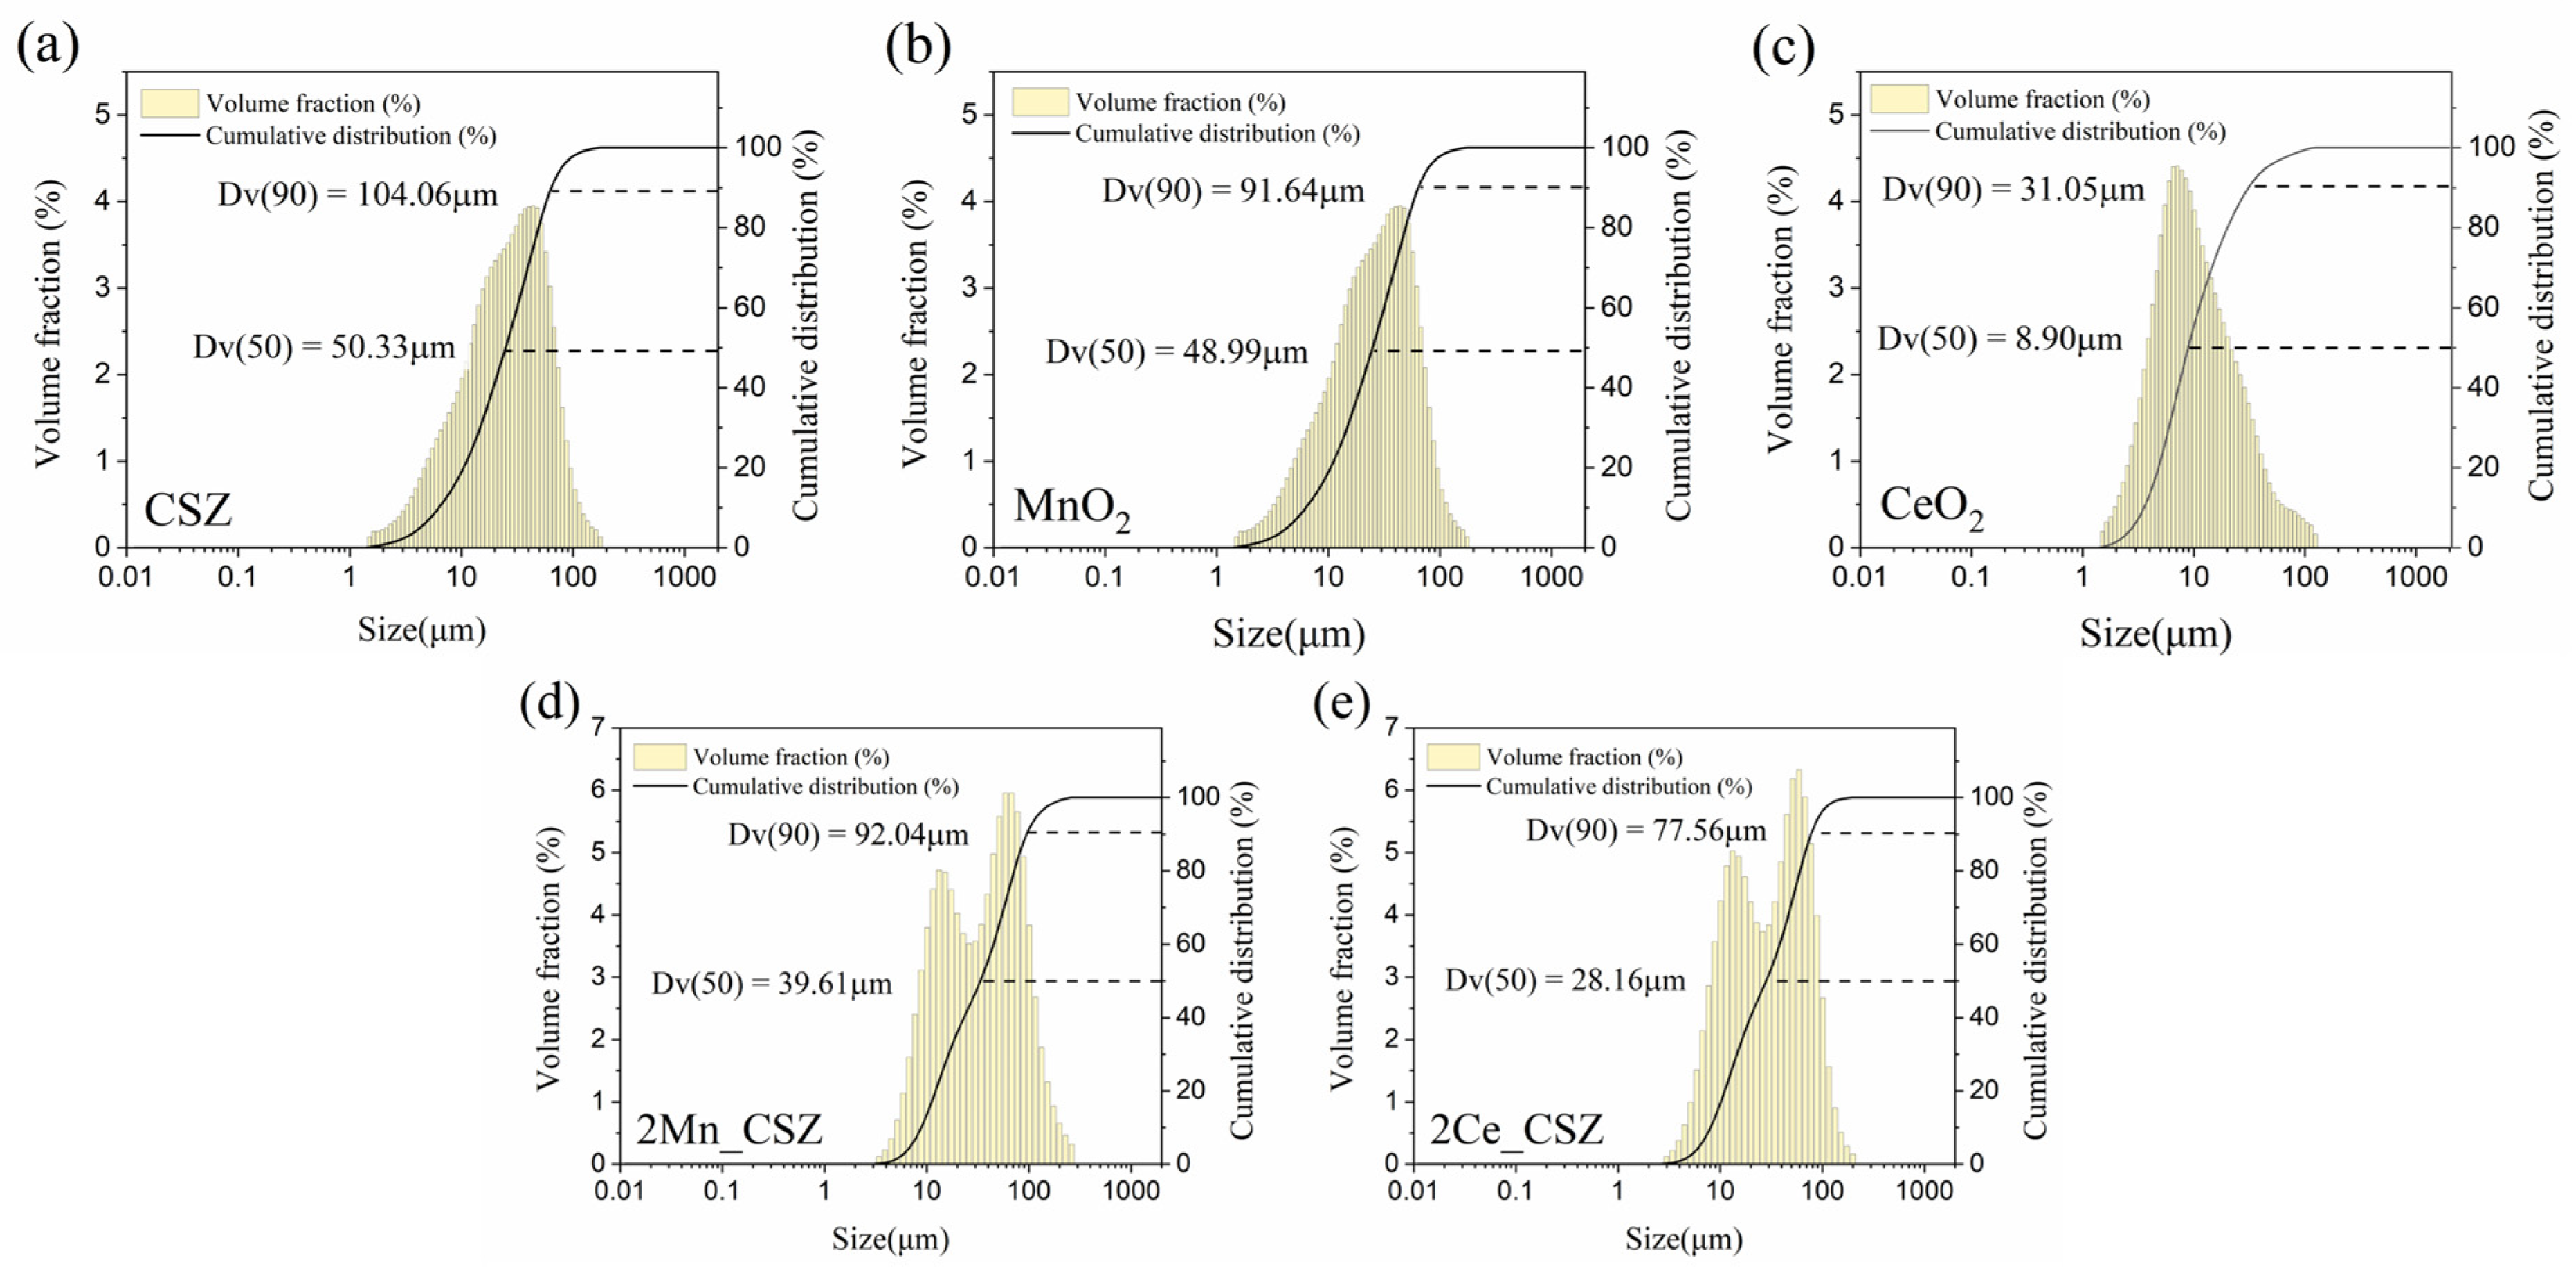
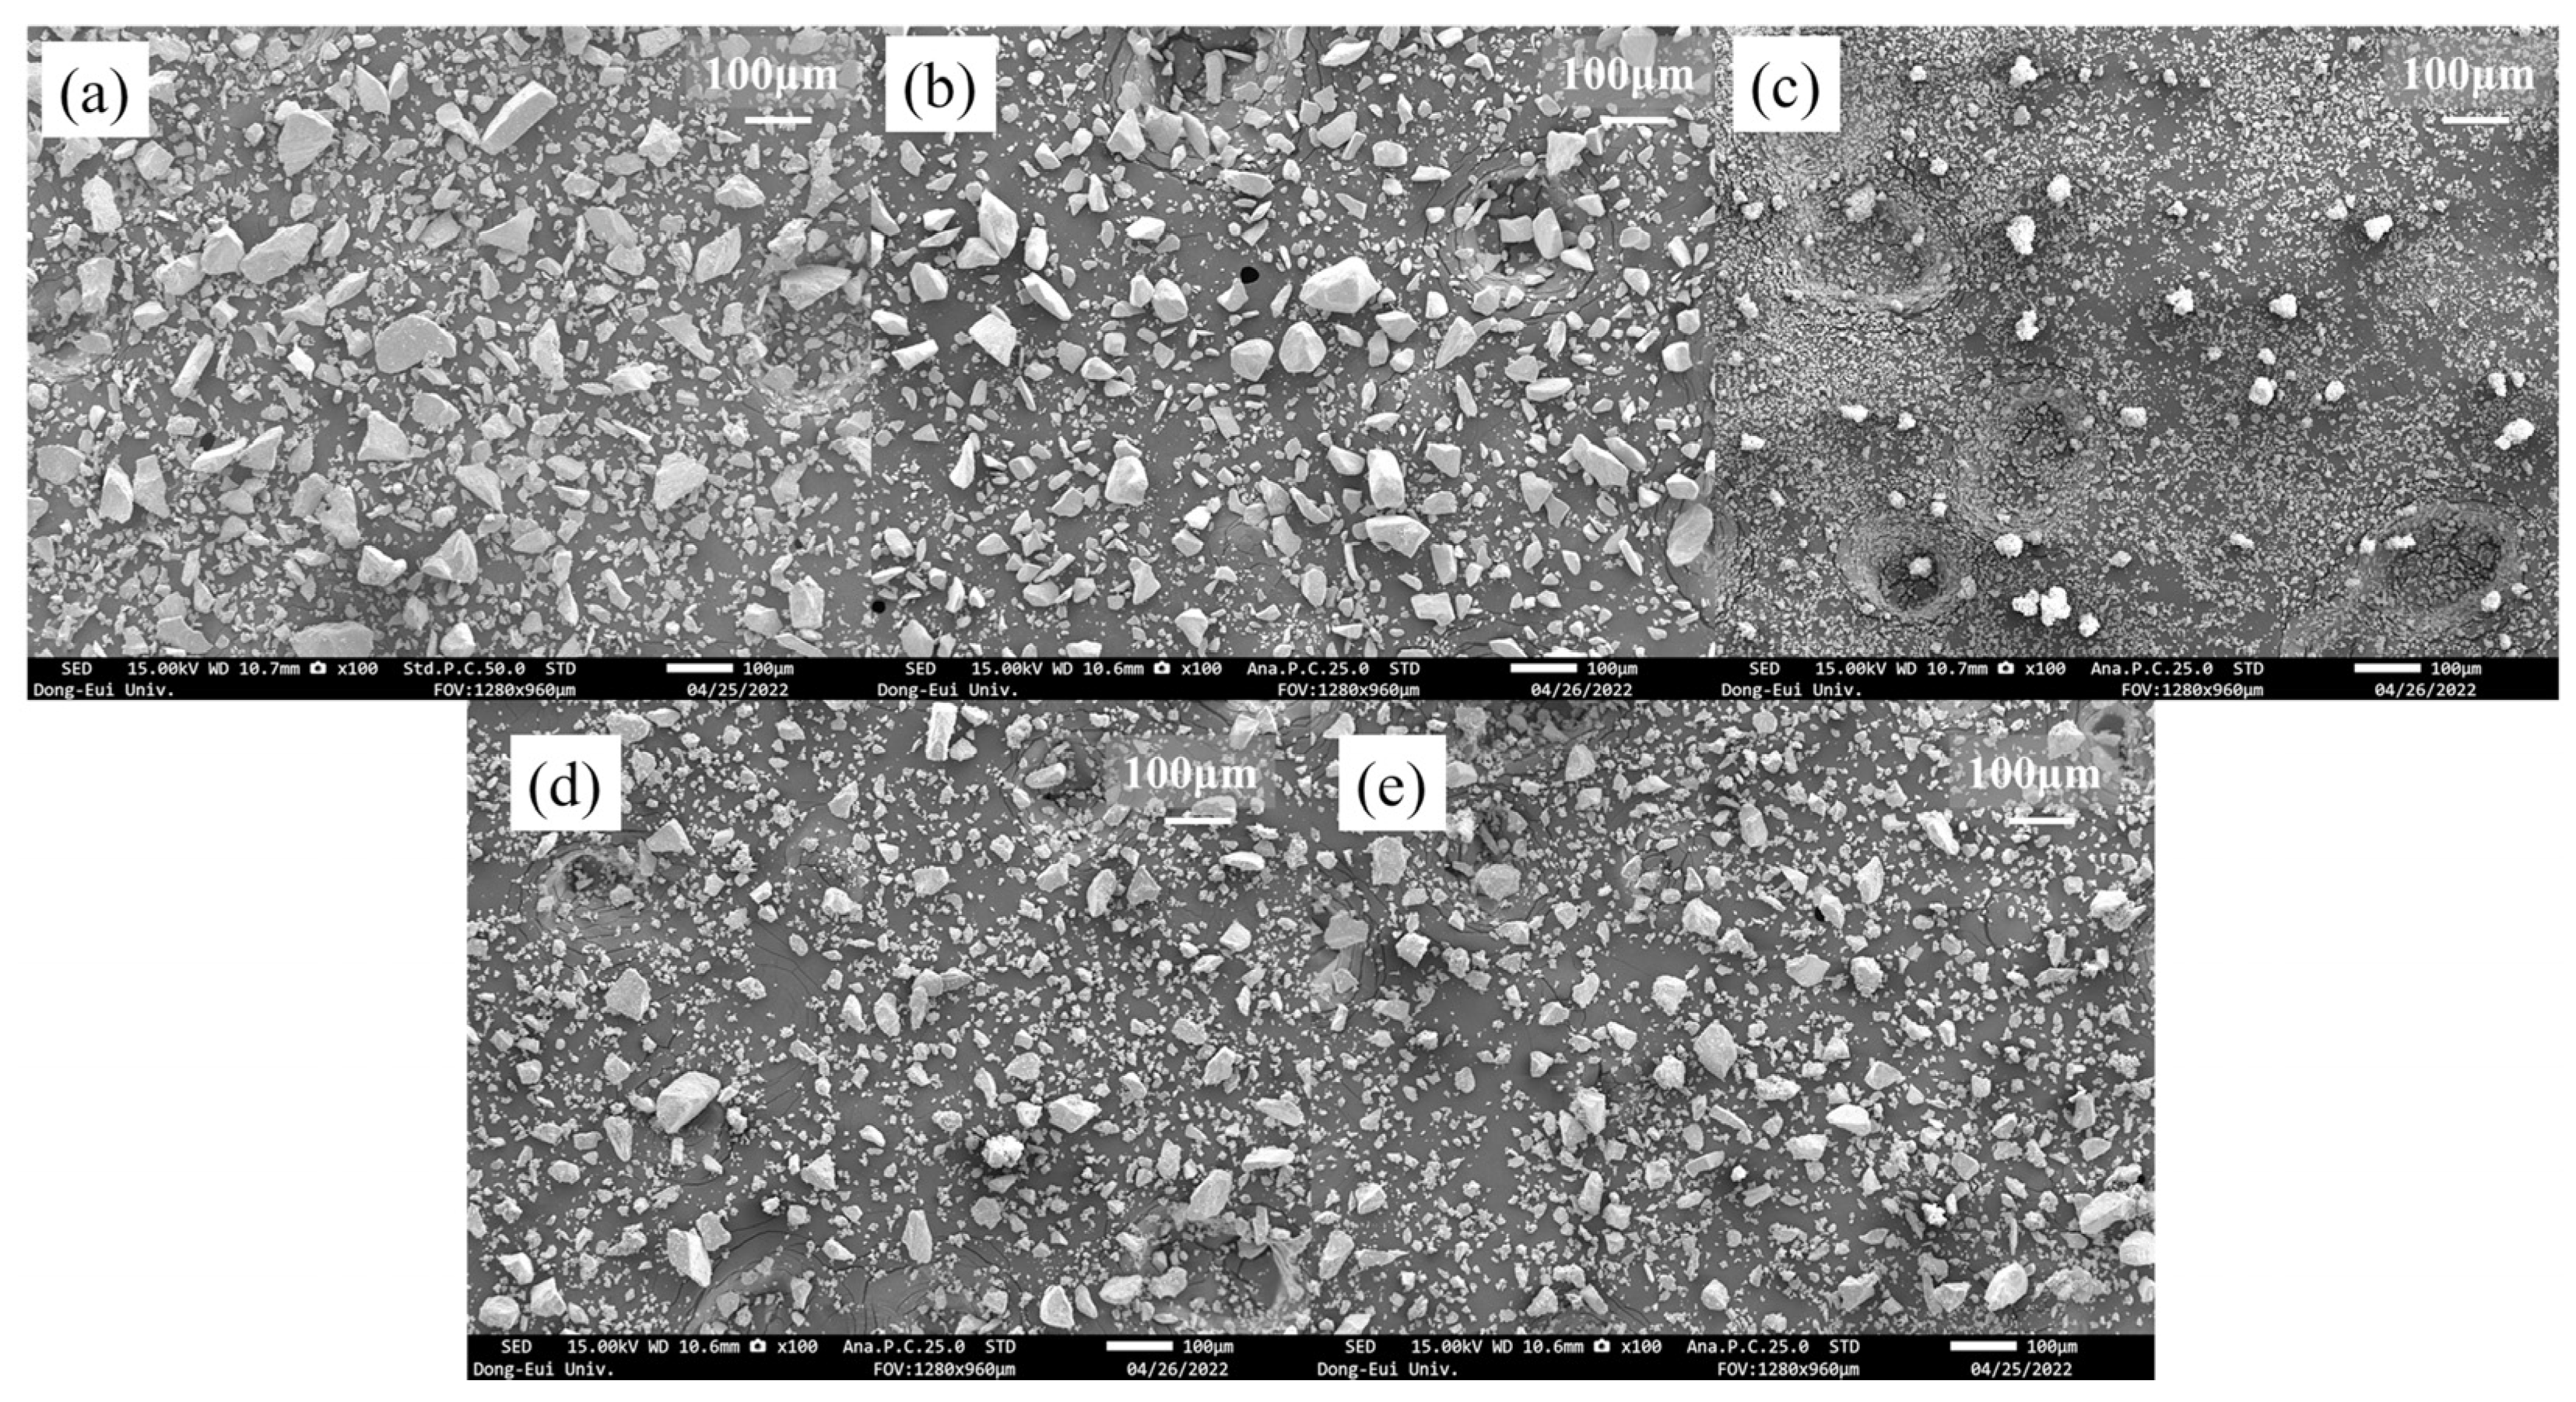
Figure 1 presents the particle size analysis (PSA) data of the powders. CSZ and MnO
2 consisted of coarser particles with average diameters of 50.33 μm and 48.99 μm, respectively, while CeO
2 comprised finer particles with an average diameter of 8.90 μm. This trend is well illustrated in
Figure 2, where CSZ and MnO
2 exhibit non-uniform, coarse single particles.
Figure 1d,e presents the PSA data of 2Mn_CSZ and 2Ce_CSZ powders, which were wet ball milled and calcined at 1200 °C, demonstrating a reduction in average diameter compared to the original CSZ.
Figure 2d,e displays smaller particle sizes compared to the original CSZ. Additionally, the average particle diameter of 2Ce_CSZ, which is doped with the relatively finer CeO
2, was 28.16 μm, smaller than that of 2Mn_CSZ at 39.61 μm.
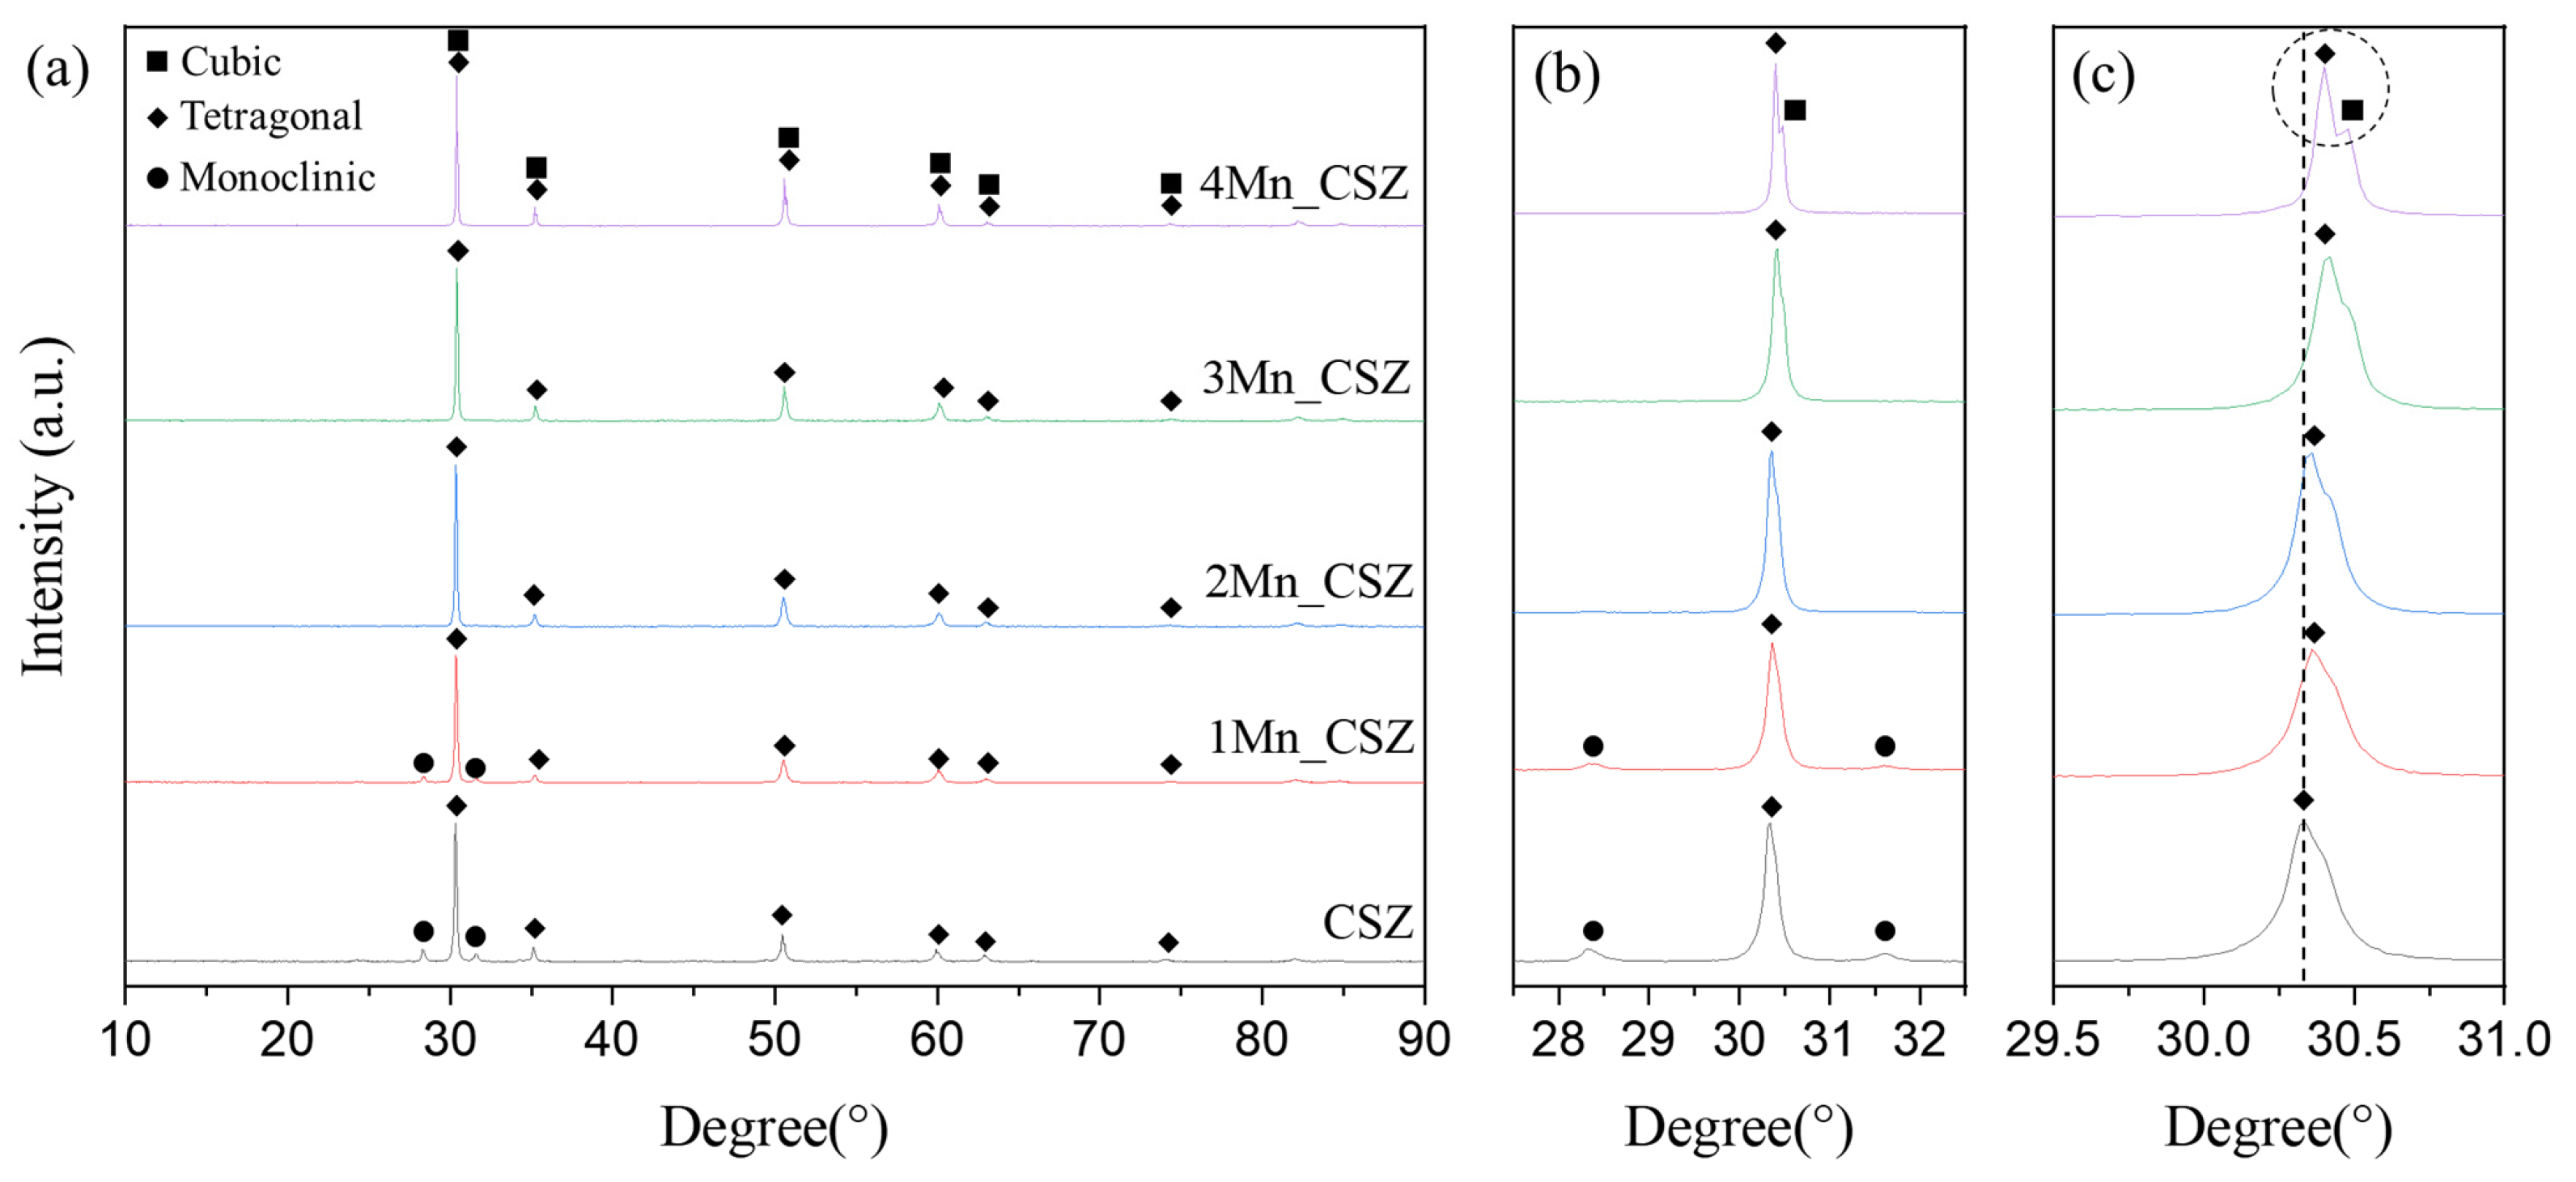
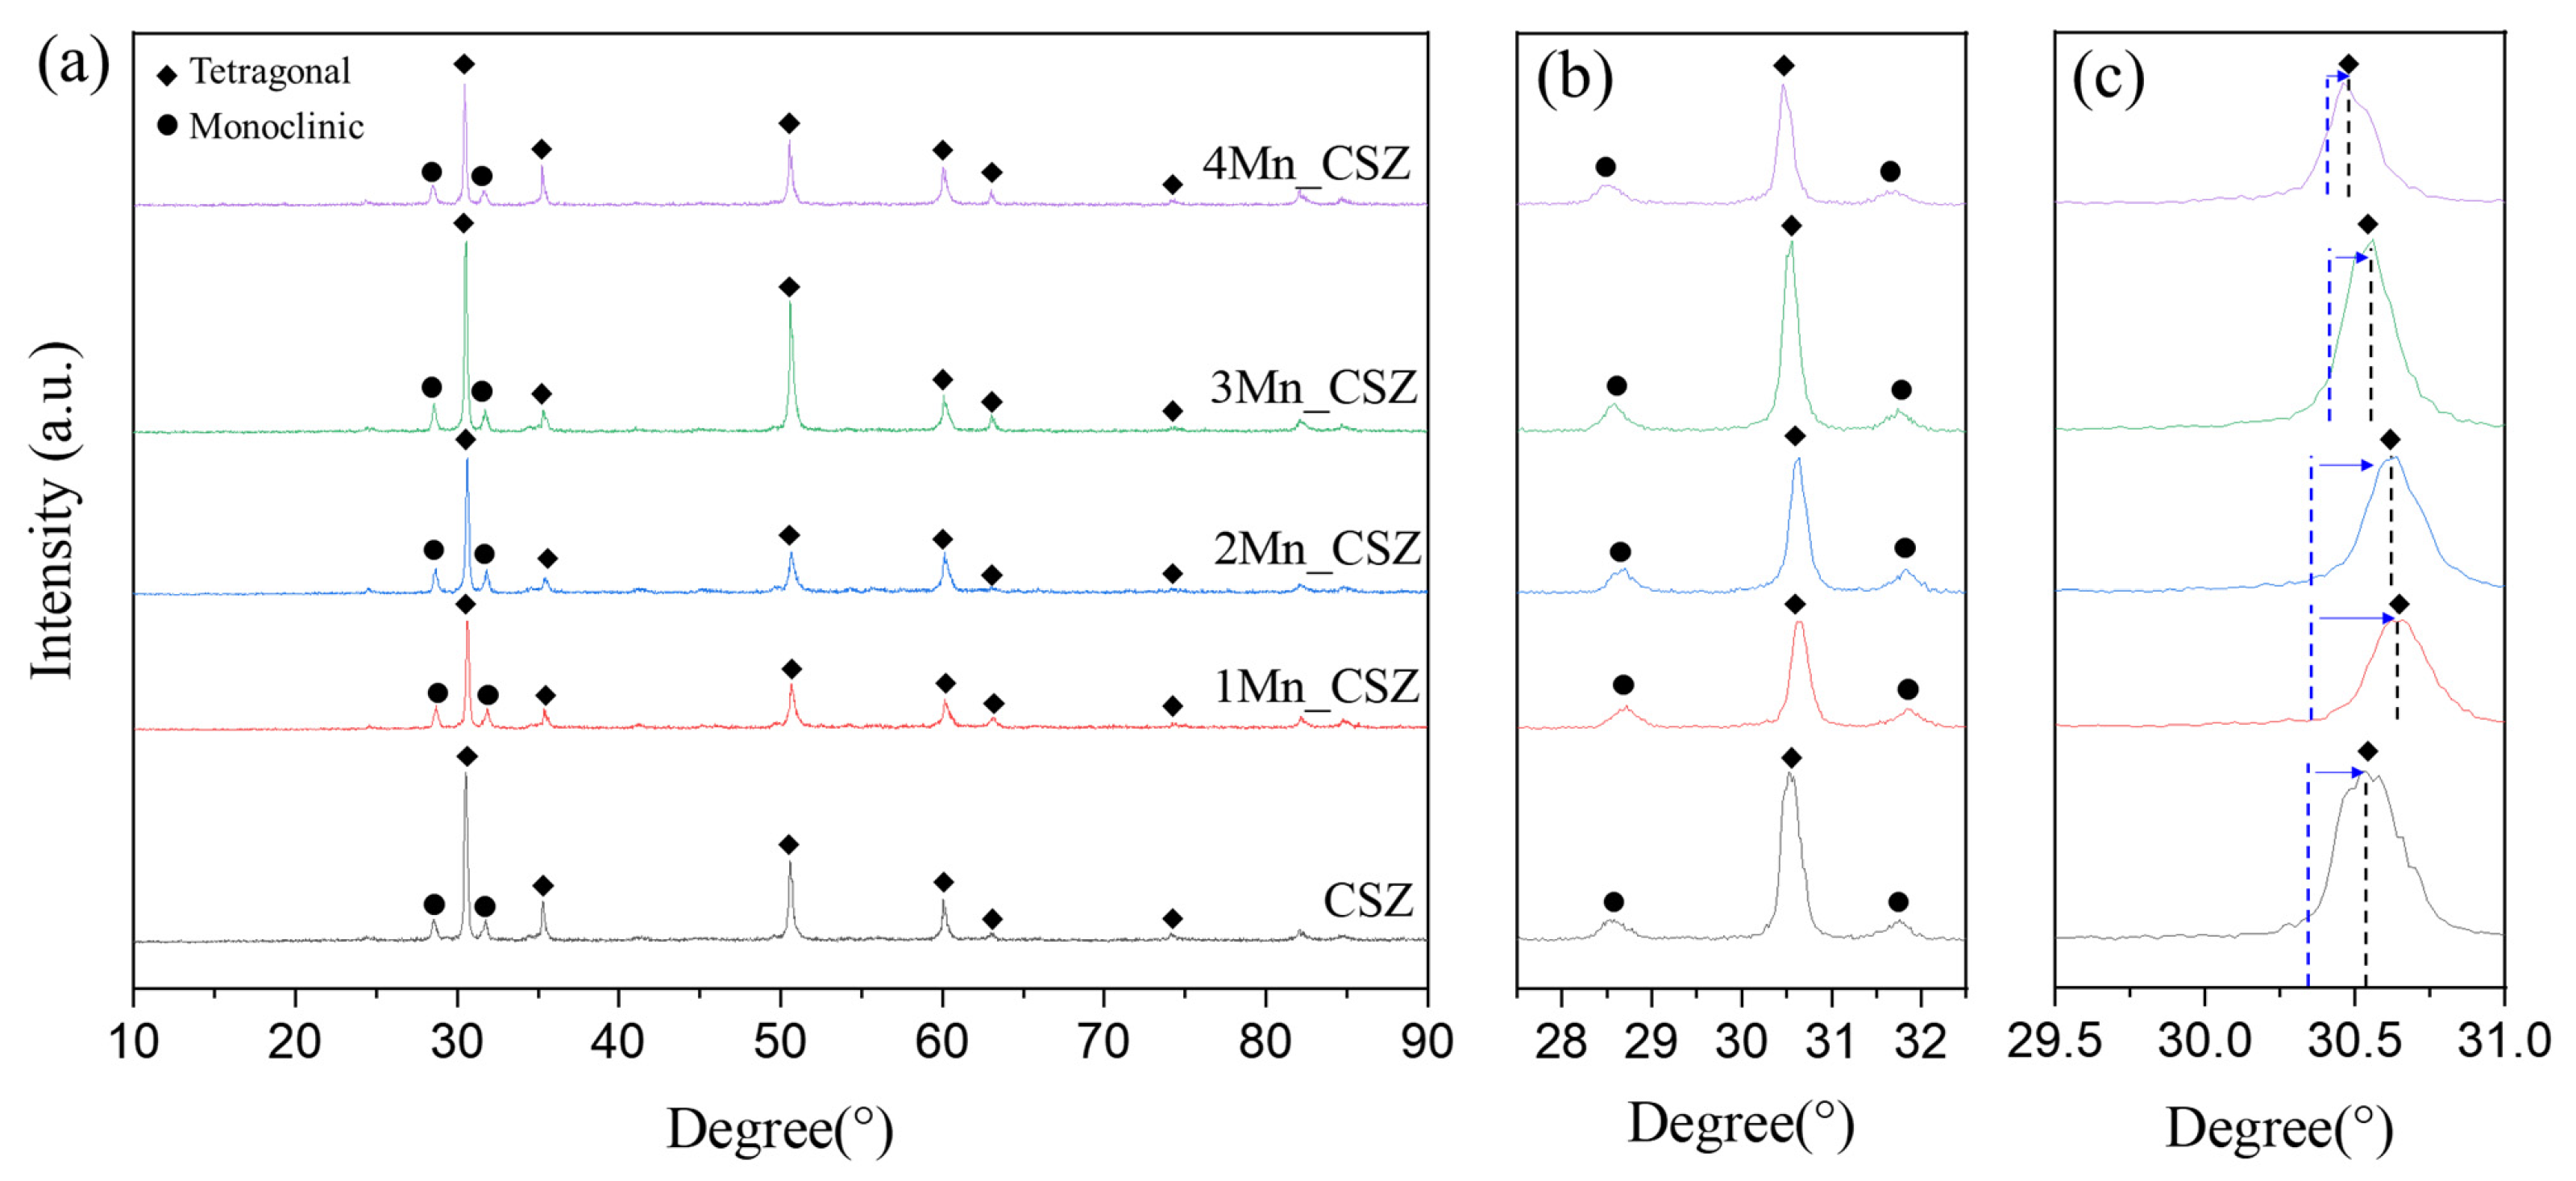
Figure 3 shows the XRD patterns of MnO
2-doped CSZ sintered at 1600 °C for 4 h. In CSZ, both the monoclinic phase (ICSD 98-006-0900, space group of
P1 21/c 1) and the tetragonal phase (ICSD 98-007-0014, space group of
P 42/nmc) were observed, with the monoclinic volume fraction reaching 33.7%. As shown in
Figure 3b, the monoclinic peak gradually decreased with the increase in MnO
2 doping amount. The monoclinic volume fraction was 19.7% in 1Mn_CSZ, while the monoclinic phase was not observed in 3Mn_CSZ and 4Mn_CSZ. In 2Mn_CSZ, the phenomenon of peak splitting at the t(101) peak was observed, and as the doping amount increased, the peak splitting became more distinct. In 4Mn_CSZ, complete splitting was confirmed, and the formation of a cubic phase (ICSD 98-010-5553, space group
Fm-3m) was verified through
Figure 2c, with the cubic phase fractions in 3Mn_CSZ and 4Mn_CSZ being determined to be 4.6% and 9.1%, respectively (
Table 4). In addition, a higher angle shift was observed with the increase in doping amount, suggesting a change in the valence state of Mn during doping. Clavel et al. reported that when the content of Mn is less than 1.4%, Mn exists mainly in the form of Mn
2+ (96 Å) in zirconia, which is larger than Zr
4+ (84 Å). However, as the Mn content increases, Mn mainly exists as Mn
3+ (64.5 Å), which has a smaller ionic radius than Zr
4+, inducing lattice distortion [
21]. Thus, the doped Mn mainly forms a substitutional solid solution as Mn
3+, creating oxygen vacancies and stabilizing the monoclinic phase into tetragonal and cubic phases [
22].
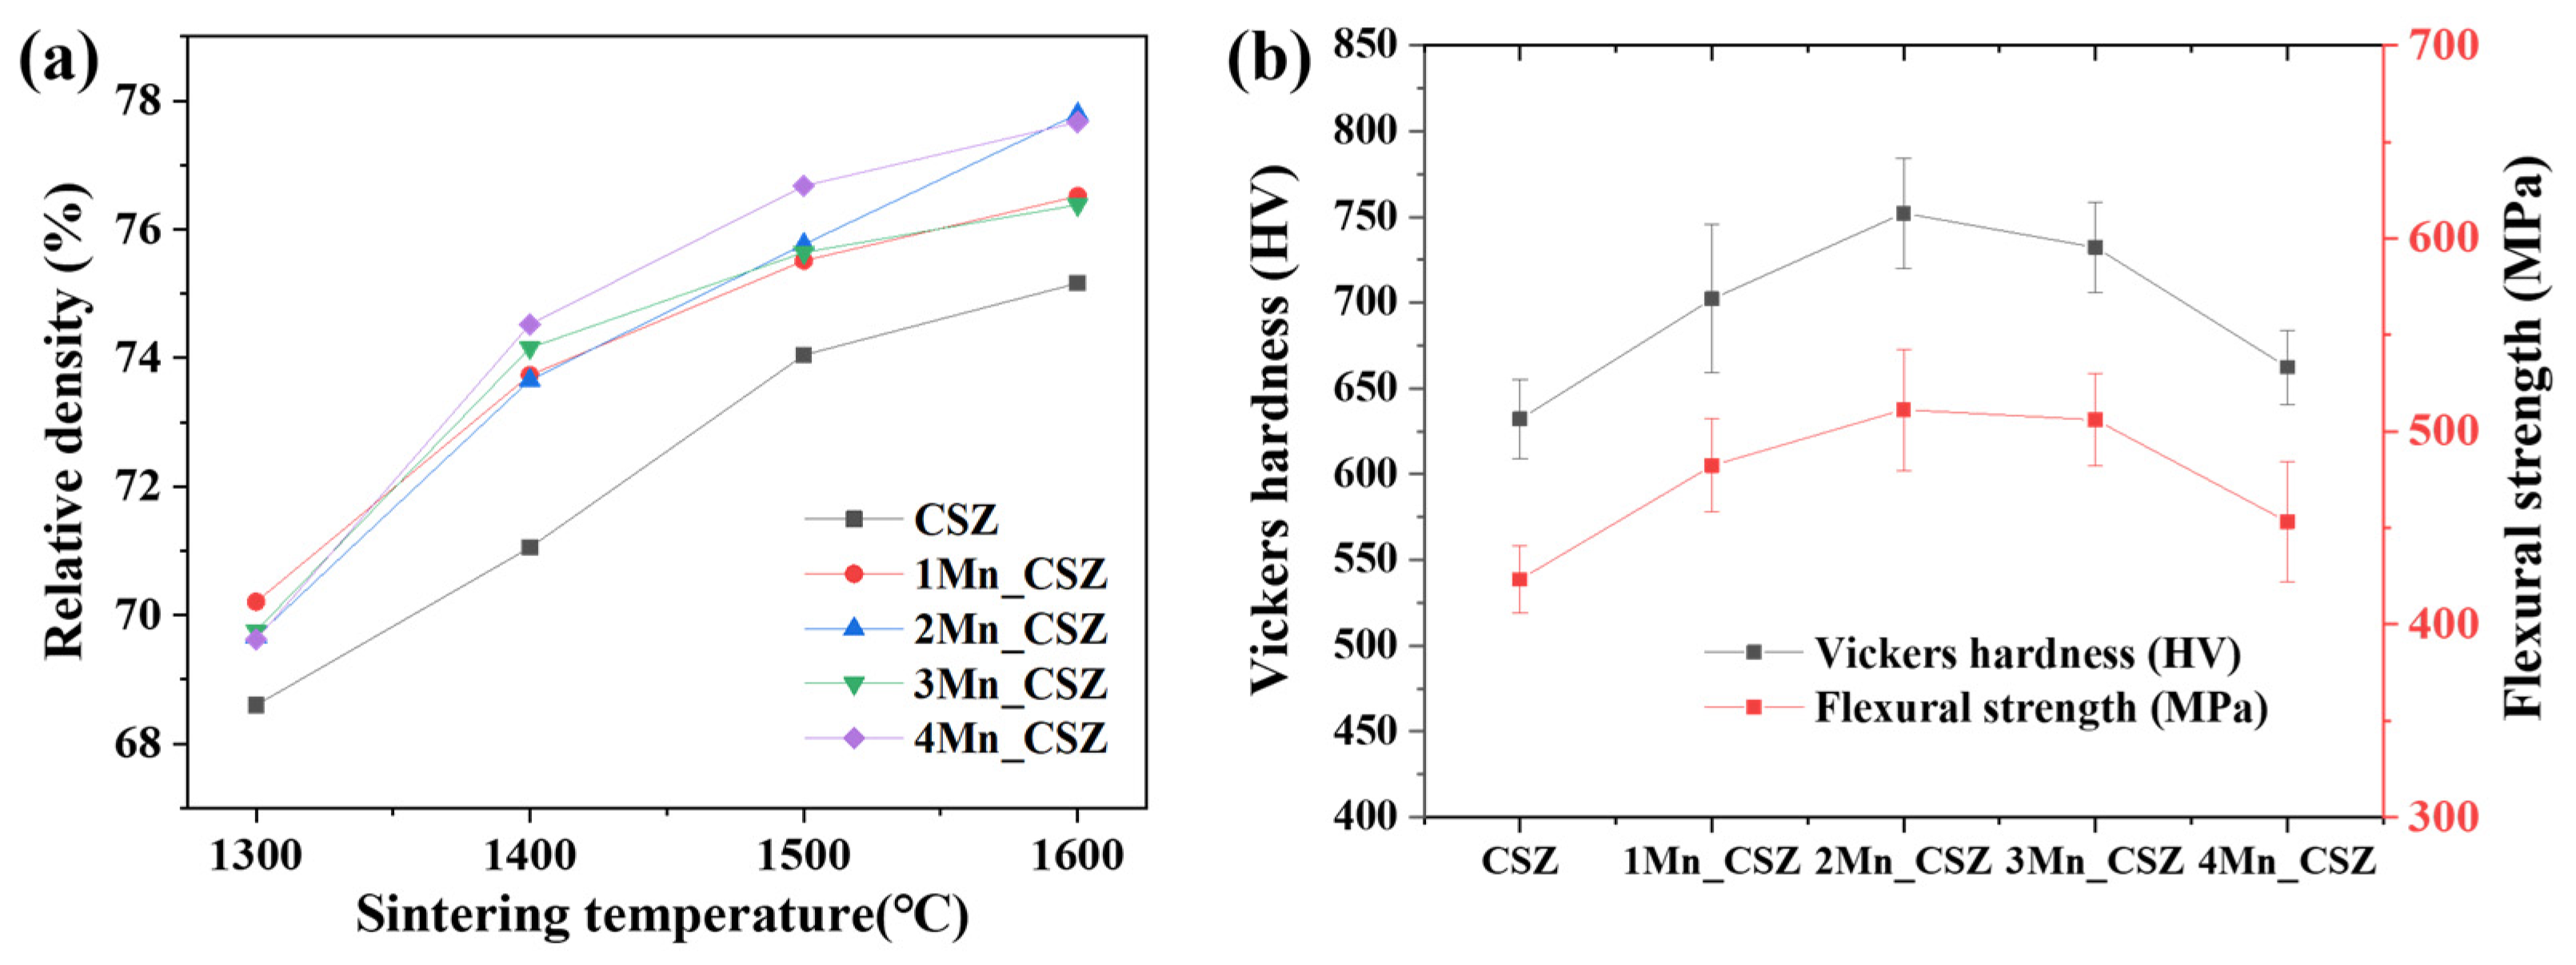
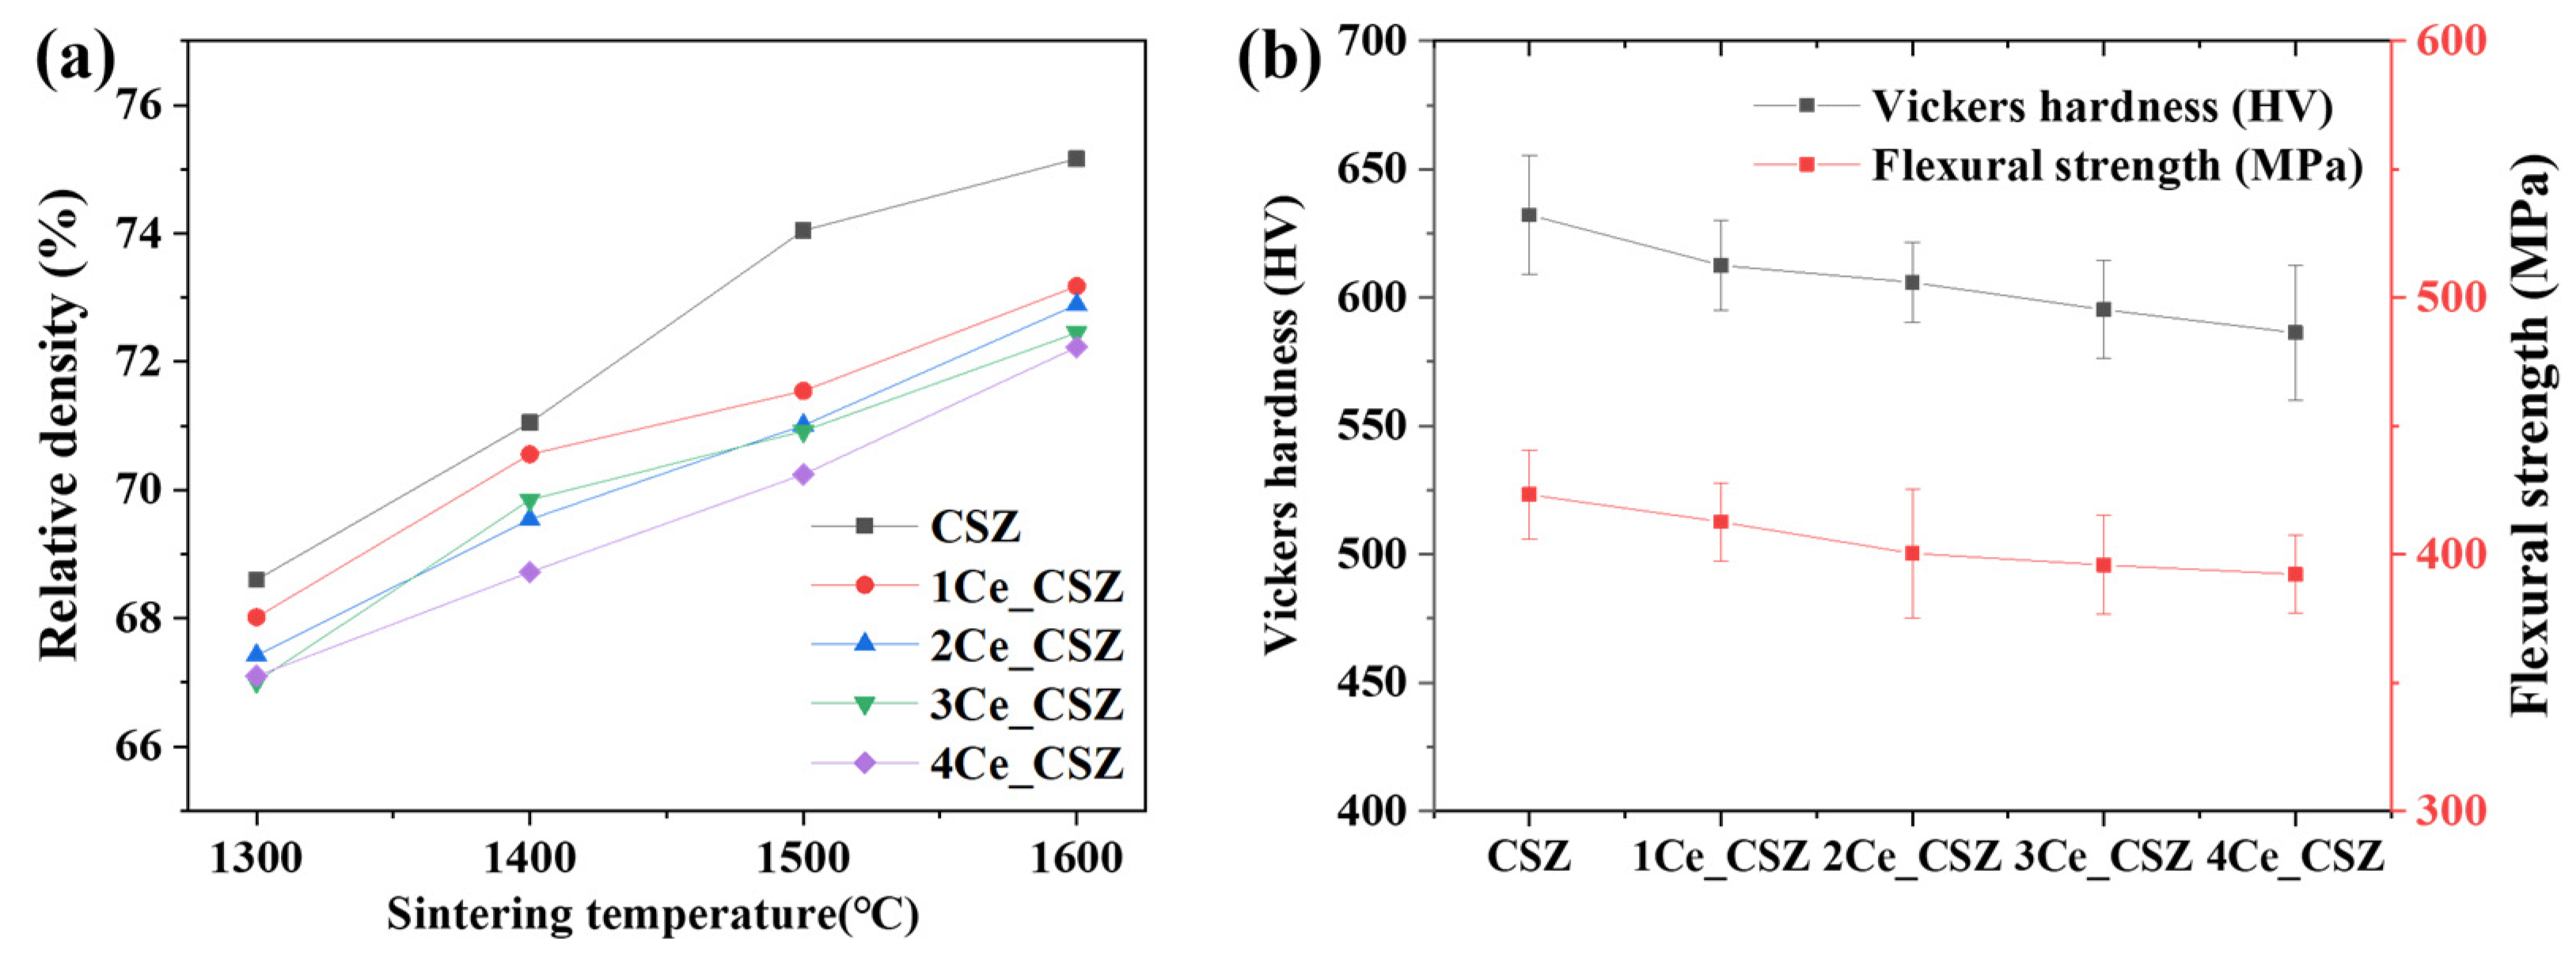
Figure 4a shows the graph of the relative density changes of MnO
2-doped CSZ with temperature. The relative density appearing in the 70% range is believed to be attributed to the larger particle size of the zirconia refractory powder, as shown in
Figure 1a, resulting in incomplete densification. In the SEM images of the specimen sintered at 1600 °C (
Supplementary Figure S1), it was difficult to observe microstructural changes due to density changes because the overall density was low. It was observed that the relative density increased with the doping of MnO
2, while CSZ displayed a relative density of 75.16% at 1600 °C, 4Mn-doped CSZ exhibited a higher relative density of 77.68%. MnO
2, having a low melting point of 535 °C, acted as an additive, enhancing the relative density [
23].
Figure 4b presents the Vickers hardness and flexural strength of MnO
2-doped CSZ. As MnO
2 was doped, the Vickers hardness steadily increased from 632.12 Hv (CSZ) to 752.12 Hv (2Mn_CSZ), and the flexural strength increased from 423.25 MPa (CSZ) to 511.23 MPa (2Mn_CSZ). These results are attributed to the increase in relative density and the decrease in monoclinic phase fraction due to MnO
2 doping [
24]. However, as the doping amount of MnO
2 increased further, the mechanical properties decreased. The Vickers hardness dropped to 732.26 Hv (3Mn_CSZ) and 662.35 Hv (4Mn_CSZ), and the flexural strength decreased to 505.89 MPa (3Mn_CSZ) and 453.25 MPa (4Mn_CSZ). Despite the increase in relative density, the decrease in mechanical properties is considered to be related to the formation of the cubic phase. The formation of the cubic phase reduces the tetragonal phase, diminishing the transformation toughening effect arising from the martensitic phase transformation from tetragonal to monoclinic phases [
25].
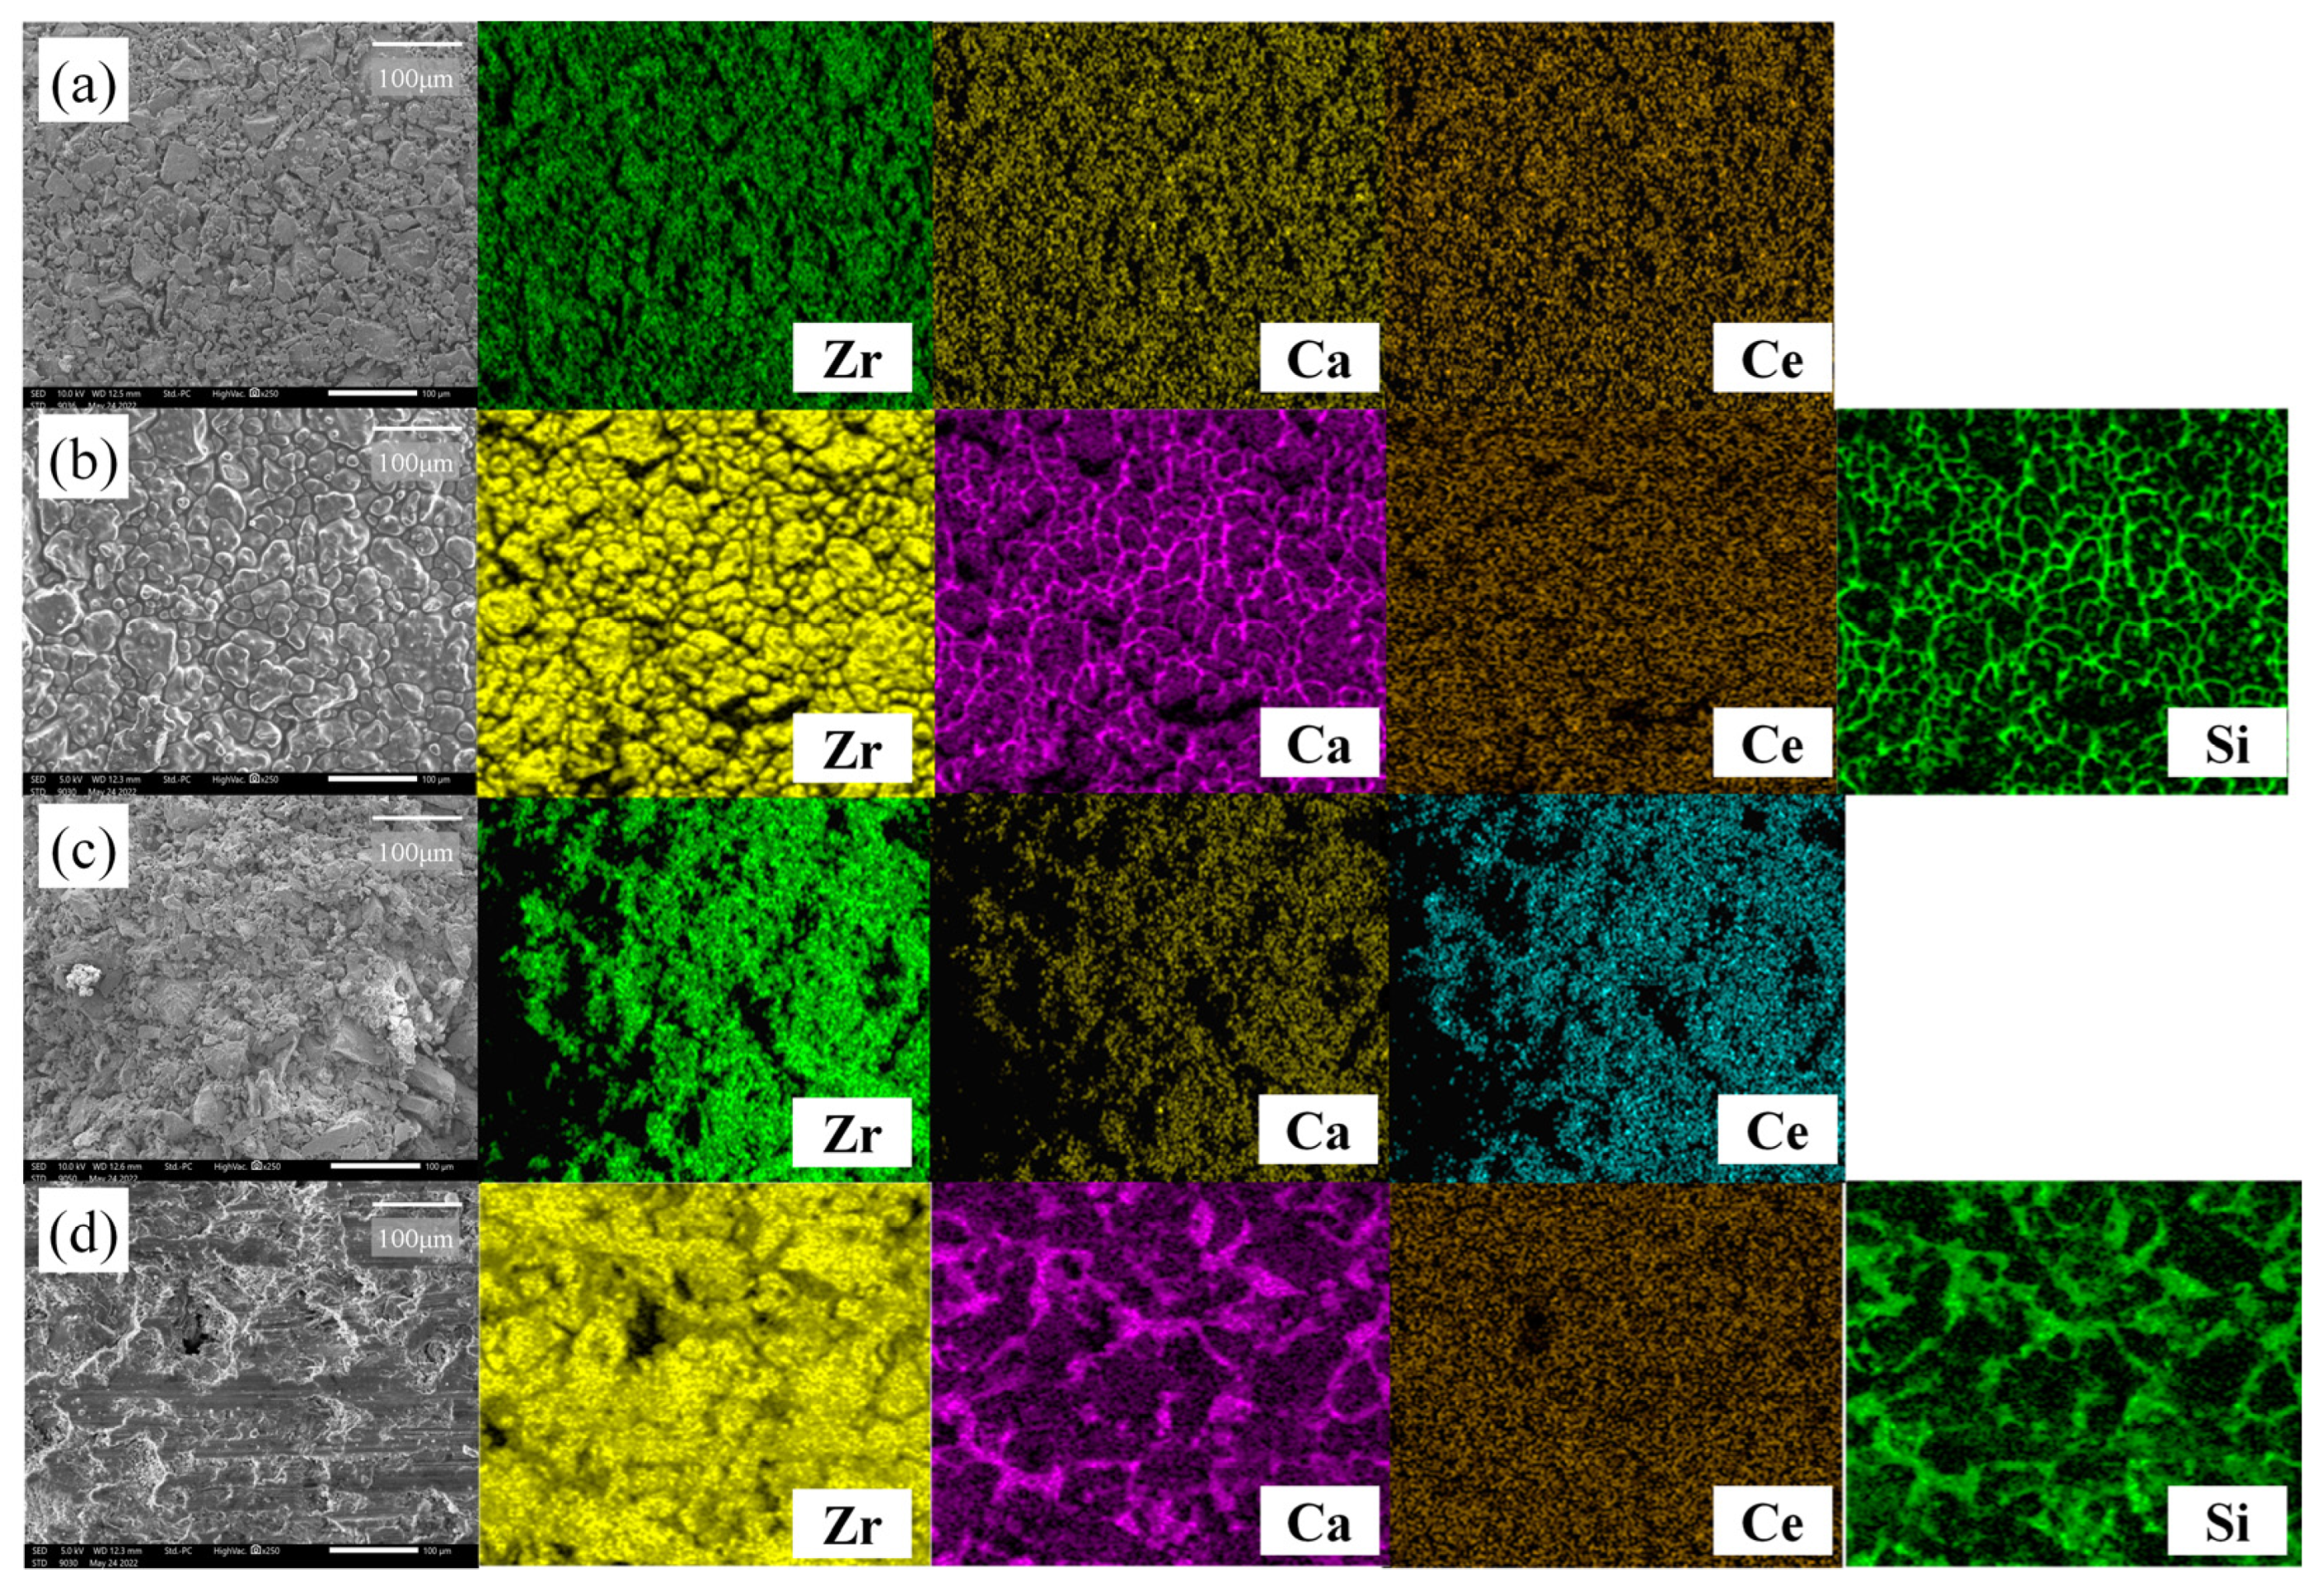
Figure 5 shows SEM-EDS images of 2Mn_CSZ magnified 250 times before and after corrosion, where the specimen sintered at 1600 °C was subjected to corrosion in slag at 1550 °C for 10 h. In the pre-corrosion surface image of 2Mn_CSZ (
Figure 5a), it is apparent that full densification has not occurred due to the coarse particle size, and EDS scanning revealed that Ca and Mn were uniformly dispersed without agglomeration.
Figure 5b shows the surface of 2Mn_CSZ after corrosion, and the EDS scans of Ca and Si indicate that residues of slag remain on the surface. The presence of slag residues made it difficult to observe the destabilization behavior due to the leaching of Mn and Ca from 2Mn_CSZ caused by the slag. The post-corrosion cross-sectional SEM-EDS images of 2Mn_CSZ (
Figure 5d) reveal that the slag has penetrated the interior due to the high porosity of the specimen, making it impossible to evaluate the internal corrosion resistance through the assessment of the penetration depth of the slag.
Figure 6 shows the XRD data of the MnO
2-doped CSZ specimens’ surface after corrosion. After the corrosion, only the tetragonal and monoclinic peaks were observed in MnO
2-doped CSZ, while no slag peaks were detected. This is due to the formation of a glass phase during the rapid cooling process following the corrosion test [
26]. In 4Mn_CSZ, although a cubic peak was initially observed, no cubic phase was detected after corrosion. As indicated in
Table 5, the cubic volume fraction decreased from 9.1% before corrosion to 0% after corrosion, which is considered to be a phase transition caused by destabilization. In
Figure 6c, it can be seen that the CSZ has shifted to a higher angle after corrosion (from 30.34° to 30.52°), indicating that Ca
2+ ions, which are larger than Zr
4+ ions, have leached out from the lattice due to reactions with the slag. Before the corrosion test, the MnO
2-doped CSZ showed a low-angle shift due to the doping of smaller Mn
3+ and Mn
4+ ions, positioning the t(101) at a lower angle compared to CSZ. In particular, the 1Mn_CSZ exhibited the largest shift from 30.36° before corrosion to 30.66° after corrosion. However, after the corrosion test, the t(101) position was at a higher angle than that in the undoped case. These results corresponded with the monoclinic phase fraction results, with 1Mn_CSZ showing the highest monoclinic phase fraction of 42.7% after corrosion. As the amount of MnO
2 doping increased, the angle shift to a higher angle after corrosion decreased, with the 4Mn_CSZ shifting from 30.40° before corrosion to 30.46° after corrosion. These results suggest that Mn, being smaller than the zirconia ions, has also leached out from the zirconia lattice due to destabilization, resulting in a combined effect of a lower angle shift due to Mn leaching and a higher angle shift due to Ca leaching. All specimens with Mn doping showed a higher fraction of the monoclinic phase compared to the original CSZ, indicating a decrease in corrosion resistance. As mentioned earlier, the corrosion of stabilized zirconia by slag is primarily due to the leaching of stabilizers by SiO
2 [
16,
17]. The
values of SiO
2 and CaO calculated using Equation (3) are 0.470 and 1.613, respectively. Since SiO
2 and CaO not only form a glass phase but also have a large difference in basicity, a significant reaction can be expected. The
values for MnO
2, Mn
2O
3, and MnO are 0.536, 0.796, and 1.563, respectively. Although the
of MnO
2 does not differ significantly from that of SiO
2, it is expected that the reaction will be minimal. However, since Mn in the zirconia lattice mainly exists in the form of Mn
3+, there is a difference in basicity, leading to potential instability. Additionally, the melting points of MnO
2 and Mn
2O
3 are 535 °C and 940 °C, respectively, which are significantly lower than the 2572 °C of CaO, suggesting that leaching into the slag would be easier.
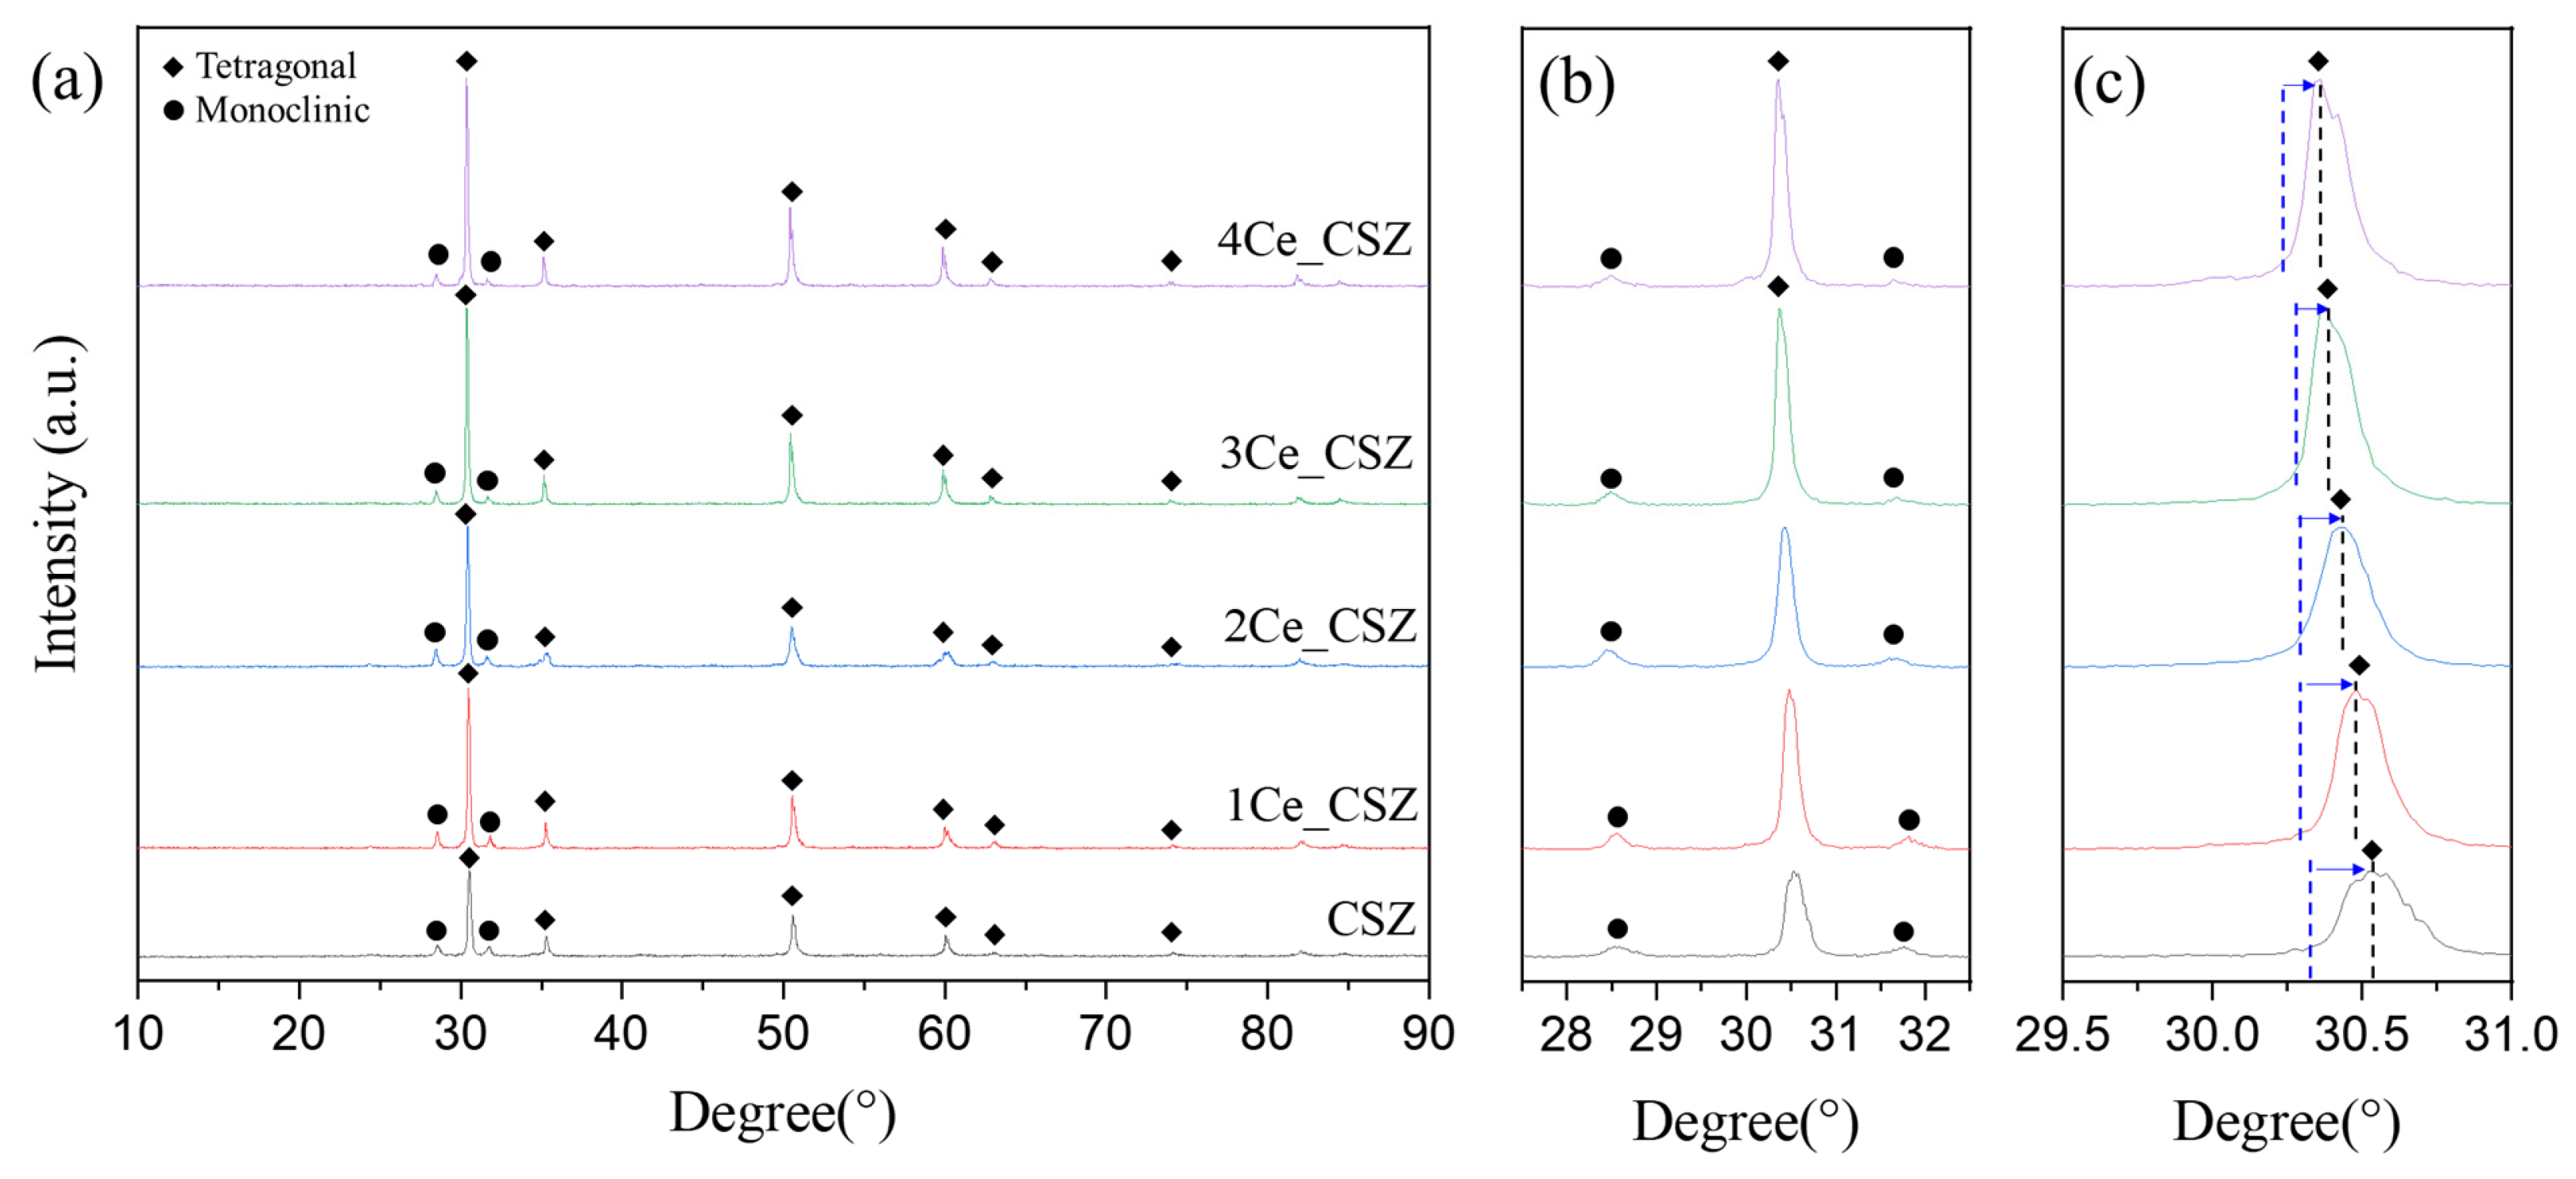
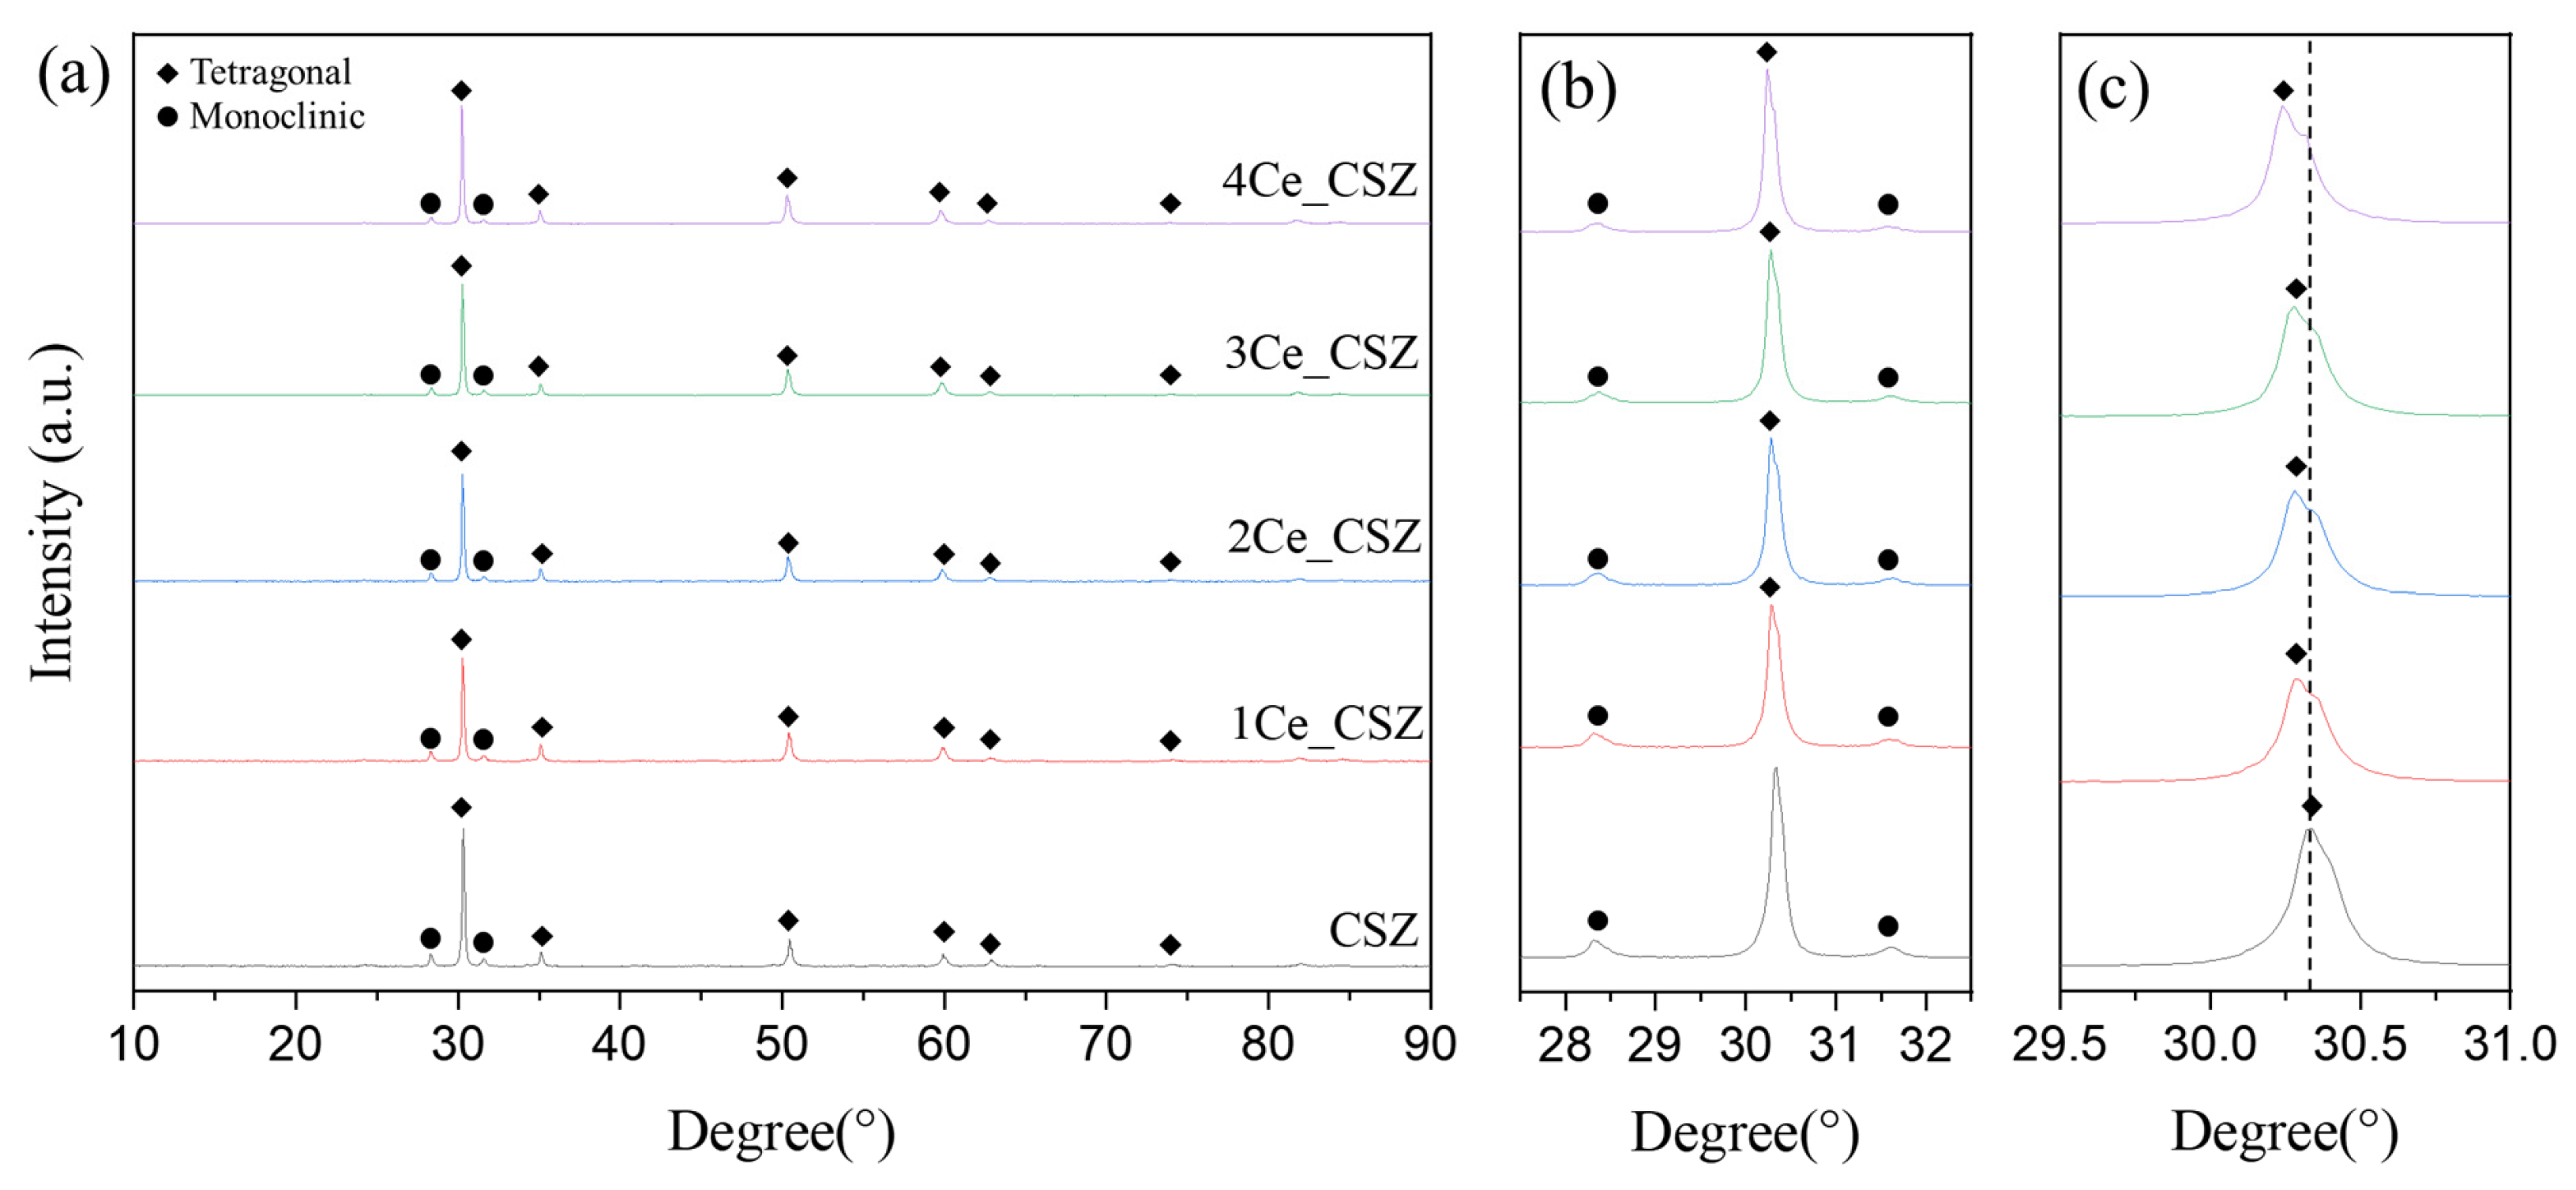
Figure 7 presents the XRD patterns of CeO
2-doped CSZ, which was sintered at 1600 °C for 4 h. Both monoclinic and tetragonal phases were observed in the CeO
2-doped CSZ. As seen in
Figure 7b, the monoclinic peak gradually decreased with the increase of CeO
2 doping, resulting in a decrease in the monoclinic volume fraction from 29.5% in 1Ce_CSZ to 21.8% in 4Ce_CSZ (
Table 6). In
Figure 7c, a lower angle shift occurred with the increase in doping amount, indicating that the lattice expanded due to the doping of Ce
4+ (97 Å), which is larger than Zr
4+ (84 Å) [
27]. When compared to MnO
2-doped CSZ, the rate of decrease in the monoclinic phase was lower. This is because when MnO
2 is doped, it mainly forms a substitutional solid solution in the form of Mn
3+ (64.5 Å), creating oxygen vacancies to maintain charge neutrality, leading to a significant stabilization effect due to the formation of these vacancies [
28]. On the other hand, when CeO
2 is doped, both Ce
4+ and Ce
3+ exist, predominantly in the form of Ce
4+. Thus, stabilization primarily occurs due to lattice stress caused by the ionic radius difference between Zr
4+ and Ce
4+, resulting in a weaker effect on stabilizing the tetragonal phase compared to MnO
2 [
29].
Figure 8a illustrates the graph of relative density changes in CeO
2-doped CSZ, indicating a trend of decreasing relative density with increasing amounts of CeO
2 doping. The SEM images of the specimen sintered at 1600 °C (
Supplementary Figure S2) show that, due to the overall low density, it was challenging to observe microstructural changes associated with density changes. The relative density gradually decreased from 75.1% (CSZ) to 72.23% (4Ce_CSZ) at 1600 °C, and this result is attributed to the fact that CeO
2 generates a low sinterability system [
30].
Figure 8b illustrates the Vickers hardness and flexural strength of CeO
2-doped CSZ. The Vickers hardness decreased from 612.57 Hv (1Ce_CSZ) to 586.35 Hv (4Ce_CSZ), and the flexural strength also reduced from 412.63 MPa (1Ce_CSZ) to 392.22 MPa. Even though an increase in tetragonal phase was observed with an increase in CeO
2 doping, the sinterability deteriorated, leading to a decrease in mechanical properties.
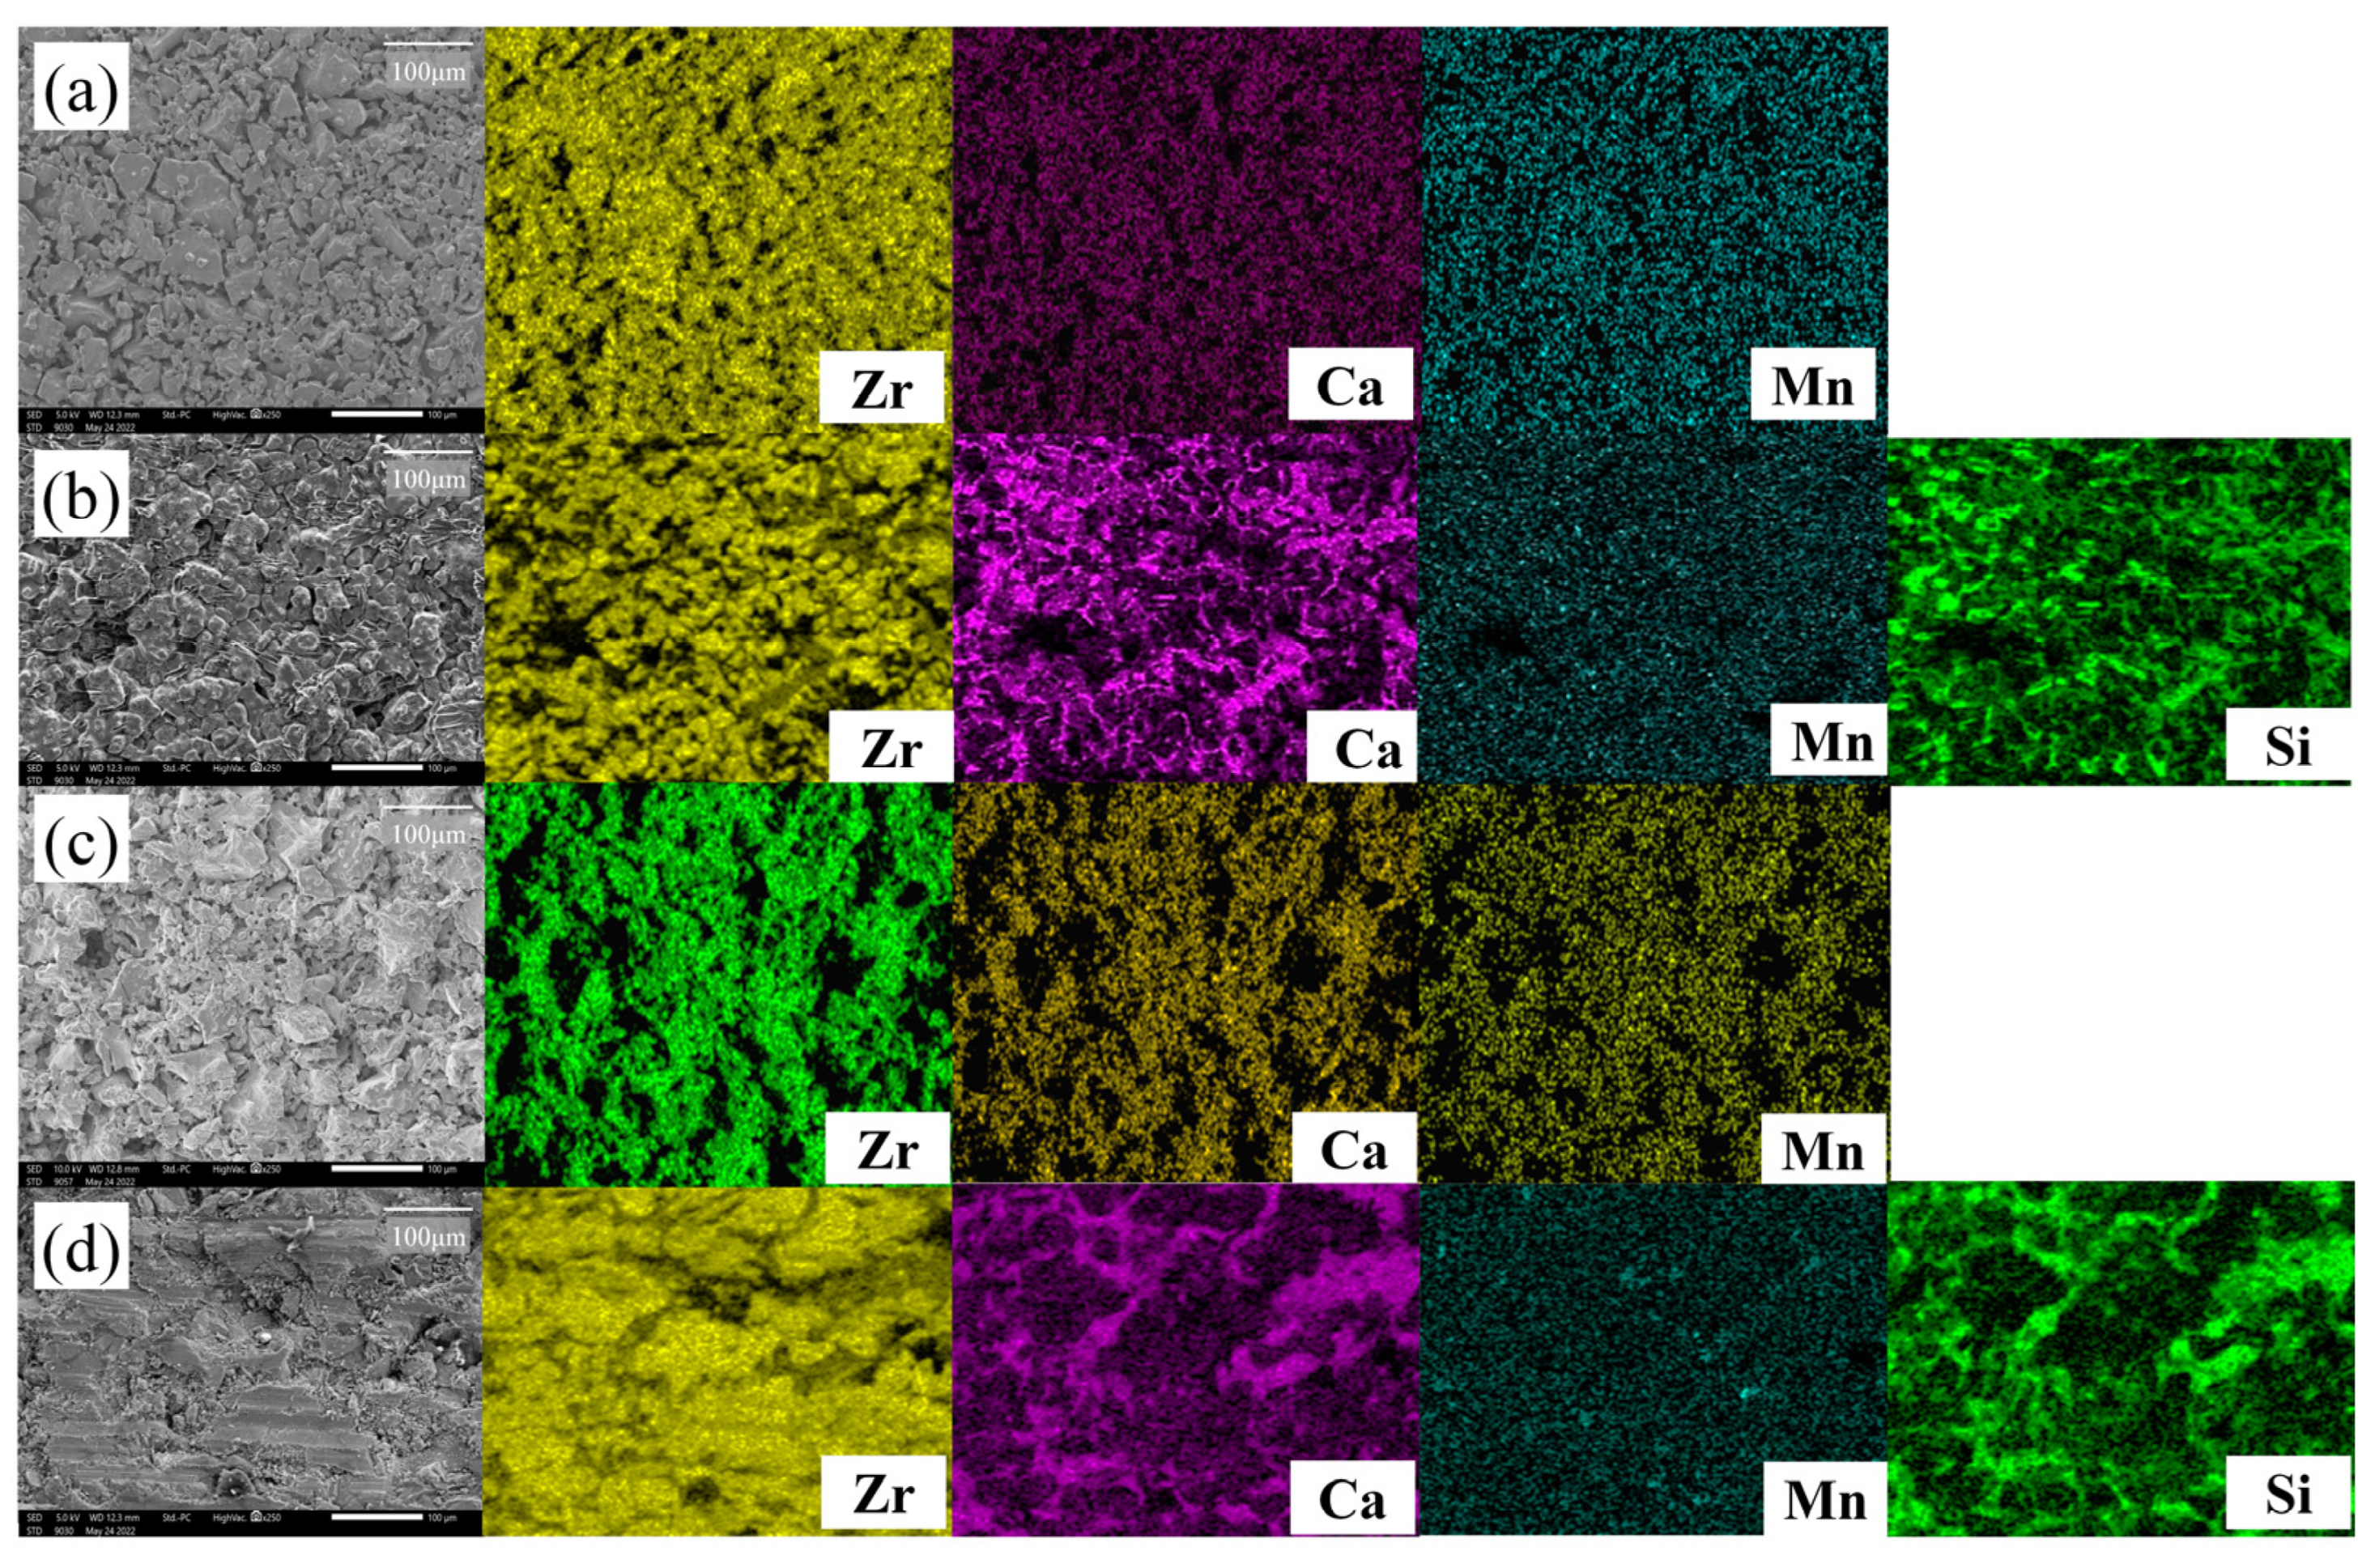
Figure 9 shows the SEM-EDS images of 2Ce_CSZ magnified 250 times before and after corrosion. In the pre-corrosion surface image of 2Ce_CSZ,
Figure 9a, it is observable that complete densification has not occurred due to the coarse particle size, and the EDS scan confirmed that Ca and Ce were evenly dispersed without agglomeration. After corrosion, the surface of 2Ce_CSZ shows signs of deterioration due to the slag. The EDS scans of Ca and Si reveal remnants of slag left on the surface, particularly concentrated near the grain boundaries that formed post-corrosion. Discerning the destabilization behavior of Ca was challenging due to the presence of Ca in the slag, and no destabilization behavior of Ce due to slag post-corrosion was observed.
Figure 9d presents the cross-sectional SEM-EDS images of 2Ce_CSZ after corrosion, where the infiltration of slag into the interior due to high porosity can be seen.
Figure 10 shows the surface XRD data of CeO
2-doped CSZ after corrosion. Similar to MnO
2-doped CSZ, no slag peaks were observed in CeO
2-doped CSZ post-corrosion; instead, tetragonal and monoclinic peaks were present. After corrosion, the monoclinic phase fraction calculated through the integrated intensity of X-ray diffraction increased due to destabilization, though it remained lower than that of CSZ (
Table 7). Additionally, as the doping amount of CeO
2 increased, the monoclinic phase fraction further decreased. In
Figure 10c, the t(101) peak exhibited a high angle shift due to destabilization, with less shift occurring as the Ce doping amount increased. The calculated
value for CeO
2 using Equation (3) is 0.702, not significantly different from the
value of SiO
2 (0.470), indicating a small basicity gap. Consequently, it is inferred that CeO
2-doped CSZ demonstrates superior corrosion resistance compared to CaO, and unlike MnO
2-doped CSZ, Ce is not easily leached by the slag, allowing the tetragonal phase to be maintained.


 ,
, 


