
Exploring RF Magnetron Sputtering Growth Composite Thin Film BiFeO3-Bi2Fe4O9 on C-Plane Al2O3 Substrate


 ,
,
Abstract
:1. Introduction
2. Materials and Methods
3. Results
4. Conclusions
Author Contributions
Funding
Institutional Review Board Statement
Informed Consent Statement
Data Availability Statement
Acknowledgments
Conflicts of Interest
References
- Catalan, G.; Scott, J.F. Physics and Applications of Bismuth Ferrite. Adv. Mater. 2009, 21, 2463–2485. [Google Scholar] [CrossRef]
- Ramazanov, S.; Sobola, D.; Gajiev, G.; Orudzhev, F.; Kaspar, P.; Gummetov, A. Multiferroic/Polymer Flexible Structures Obtained by Atomic Layer Deposition. Nanomaterials 2022, 13, 139. [Google Scholar] [CrossRef] [PubMed]
- Sando, D.; Agbelele, A.; Rahmedov, D.; Liu, J.; Rovillain, P.; Toulouse, C.; Infante, I.C.; Pyatakov, A.P.; Fusil, S.; Jacquet, E.; et al. Crafting the Magnonic and Spintronic Response of BiFeO3 Films by Epitaxial Strain. Nat. Mater. 2013, 12, 641–646. [Google Scholar] [CrossRef] [PubMed]
- Lee, J.H.; Fina, I.; Marti, X.; Kim, Y.H.; Hesse, D.; Alexe, M.; Lee, J.H.; Fina, I.; Kim, Y.H.; Hesse, D.; et al. Spintronic Functionality of BiFeO3 Domain Walls. Adv. Mater. 2014, 26, 7078–7082. [Google Scholar] [CrossRef]
- Smolenskii, G.A.; Yudin, V.M.; Sher, E. Weak ferromagnetism of some BiFeO3-Pb(Fe0.5Nb0.5)O3 perovskites. Sov. Phys. Solid State 1965, 6, 2936. [Google Scholar]
- Sosnowska, I.; Peterlin-Neumaier, T.; Steichele, E. Spiral Magnetic Ordering in Bismuth Ferrite. J. Phys. C Solid State Phys. 1982, 15, 4835–4846. [Google Scholar] [CrossRef]
- Maity, T.; Goswami, S.; Bhattacharya, D.; Roy, S. Superspin Glass Mediated Giant Spontaneous Exchange Bias in a Nanocomposite of BiFeO3-Bi2Fe4O9. Phys. Rev. Lett. 2013, 110, 107201. [Google Scholar] [CrossRef]
- Maity, T.; Roy, S. Asymmetric Ascending and Descending Loop Shift Exchange Bias in Bi2Fe4O9-BiFeO3 Nanocomposites. J. Magn. Magn. Mater. 2020, 494, 165783. [Google Scholar] [CrossRef]
- Pleshakov, I.V.; Volkov, M.P.; Lomanova, N.A.; Kuz’min, Y.I.; Gusarov, V.V. Magnetic Characteristics of a Nanocomposite Based on Bismuth Ferrites. Tech. Phys. Lett. 2020, 46, 1072–1075. [Google Scholar] [CrossRef]
- Park, Y.A.; Song, K.M.; Lee, K.D.; Won, C.J.; Hur, N. Effect of Antiferromagnetic Order on the Dielectric Properties of Bi2Fe4O9. Appl. Phys. Lett. 2010, 96, 338992. [Google Scholar] [CrossRef]
- Dutta, D.P.; Sudakar, C.; Mocherla, P.S.V.; Mandal, B.P.; Jayakumar, O.D.; Tyagi, A.K. Enhanced Magnetic and Ferroelectric Properties in Scandium Doped Nano Bi2Fe4O9. Mater. Chem. Phys. 2012, 135, 998–1004. [Google Scholar] [CrossRef]
- Kirsch, A.; Murshed, M.M.; Litterst, F.J.; Gesing, T.M. Structural, Spectroscopic, and Thermoanalytic Studies on Bi2Fe4O9: Tunable Properties Driven by Nano- and Poly-Crystalline States. J. Phys. Chem. C 2019, 123, 3161–3171. [Google Scholar] [CrossRef]
- Zhao, J.; Liu, T.; Xu, Y.; He, Y.; Chen, W. Synthesis and Characterization of Bi2Fe4O9 Powders. Mater. Chem. Phys. 2011, 128, 388–391. [Google Scholar] [CrossRef]
- Alvarez, G.; Contreras, J.; Conde-Gallardo, A.; Montiel, H.; Zamorano, R. Detection of Para–Antiferromagnetic Transition in Bi2Fe4O9 Powders by Means of Microwave Absorption Measurements. J. Magn. Magn. Mater. 2013, 348, 17–21. [Google Scholar] [CrossRef]
- Papaefthymiou, G.C.; Viescas, A.J.; Le Breton, J.M.; Chiron, H.; Juraszek, J.; Park, T.J.; Wong, S.S. Magnetic and Mössbauer Characterization of the Magnetic Properties of Single-Crystalline Sub-Micron Sized Bi2Fe4O9 Cubes. Curr. Appl. Phys. 2015, 15, 417–422. [Google Scholar] [CrossRef]
- Tian, Z.M.; Yuan, S.L.; Wang, X.L.; Zheng, X.F.; Yin, S.Y.; Wang, C.H.; Liu, L. Size Effect on Magnetic and Ferroelectric Properties in Bi2Fe4O9 Multiferroic Ceramics. J. Appl. Phys. 2009, 106, 343219. [Google Scholar] [CrossRef]
- Zvezdin, A.K.; Pyatakov, A.P. Phase transitions and the giant magnetoelectric effect in multiferroics. Phys.-Uspekhi 2004, 47, 416. [Google Scholar] [CrossRef]
- Yuan, G.L.; Or, S.W.; Chan, H.L.W.; Liu, Z.G. Reduced Ferroelectric Coercivity in Multiferroic Bi0.825Nd0.175FeO3 Thin Film. J. Appl. Phys. 2007, 101, 818138. [Google Scholar] [CrossRef]
- Zhang, T.; Shen, Y.; Qiu, Y.; Liu, Y.; Xiong, R.; Shi, J.; Wei, J. Facial Synthesis and Photoreaction Mechanism of BiFeO3/Bi2Fe4O9 Heterojunction Nanofibers. ACS Sustain. Chem. Eng. 2017, 5, 4630–4636. [Google Scholar] [CrossRef]
- Wang, L.; Steven, L.; Jacques, P.D. Monte Carlo Modeling of Light Transport in Multi-Layered Tissues in Standard C; University of Texas M. D. Anderson Cancer Center: Houston, TX, USA, 1992. [Google Scholar]
- Giraev, K.M.; Ashurbekov, N.A.; Magomedov, M.A.; Murtazaeva, A.A.; Medzhidov, R.T. The Effect of Pathological Processes on Absorption and Scattering Spectra of Samples of Bile and Pancreatic Juice. Opt. Spectrosc. Engl. Transl. Opt. I Spektrosk. 2015, 119, 162–170. [Google Scholar] [CrossRef]
- Orudzhev, F.; Alikhanov, N.; Amirov, A.; Rabadanova, A.; Selimov, D.; Shuaibov, A.; Gulakhmedov, R.; Abdurakhmanov, M.; Magomedova, A.; Ramazanov, S.; et al. Porous Hybrid PVDF/BiFeO3 Smart Composite with Magnetic, Piezophotocatalytic, and Light-Emission Properties. Catalysts 2023, 13, 874. [Google Scholar] [CrossRef]
- Huo, Y.; Jin, Y.; Zhang, Y. Citric Acid Assisted Solvothermal Synthesis of BiFeO3 Microspheres with High Visible-Light Photocatalytic Activity. J. Mol. Catal. A Chem. 2010, 331, 15–20. [Google Scholar] [CrossRef]
- Selbach, S.M.; Tybell, T.; Einarsrud, M.A.; Grande, T. Size-Dependent Properties of Multiferroic BiFeO3 Nanoparticles. Chem. Mater. 2007, 19, 6478–6484. [Google Scholar] [CrossRef]
- Li, S.; Lin, Y.H.; Zhang, B.P.; Wang, Y.; Nan, C.W. Controlled Fabrication of BiFeO3 Uniform Microcrystals and Their Magnetic and Photocatalytic Behaviors. J. Phys. Chem. C 2010, 114, 2903–2908. [Google Scholar] [CrossRef]
- Dai, Z.; Akishige, Y. Electrical Properties of Multiferroic BiFeO3 Ceramics Synthesized by Spark Plasma Sintering. J. Phys. D Appl. Phys. 2010, 43, 445403. [Google Scholar] [CrossRef]
- Fukumura, H.; Harima, H.; Kisoda, K.; Tamada, M.; Noguchi, Y.; Miyayama, M. Raman Scattering Study of Multiferroic BiFeO3 Single Crystal. J. Magn. Magn. Mater. 2007, 310, e367–e369. [Google Scholar] [CrossRef]
- Bielecki, J.; Svedlindh, P.; Tibebu, D.T.; Cai, S.; Eriksson, S.G.; Börjesson, L.; Knee, C.S. Structural and Magnetic Properties of Isovalently Substituted Multiferroic BiFeO3: Insights from Raman Spectroscopy. Phys. Rev. B Condens. Matter. Mater. Phys. 2012, 86, 184422. [Google Scholar] [CrossRef]
- Iliev, M.N.; Litvinchuk, A.P.; Hadjiev, V.G.; Gospodinov, M.M.; Skumryev, V.; Ressouche, E. Phonon and Magnon Scattering of Antiferromagnetic Bi2Fe4O9. Phys. Rev. B Condens. Matter. Mater. Phys. 2010, 81, 024302. [Google Scholar] [CrossRef]
- Mohapatra, S.R.; Swain, A.; Yadav, C.S.; Kaushik, S.D.; Singh, A.K. Unequivocal Evidence of Enhanced Magnetodielectric Coupling in Gd3+ Substituted Multiferroic Bi2Fe4O9. RSC Adv. 2016, 6, 112282–112291. [Google Scholar] [CrossRef]
- Alikhanov, N.M.R.; Rabadanov, M.K.; Orudzhev, F.F.; Gadzhimagomedov, S.K.; Emirov, R.M.; Sadykov, S.A.; Kallaev, S.N.; Ramazanov, S.M.; Abdulvakhidov, K.G.; Sobola, D. Size-Dependent Structural Parameters, Optical, and Magnetic Properties of Facile Synthesized Pure-Phase BiFeO3. J. Mater. Sci. Mater. Electron. 2021, 32, 13323–13335. [Google Scholar] [CrossRef]
- Friedrich, A.; Biehler, J.; Morgenroth, W.; Wiehl, L.; Winkler, B.; Hanfland, M.; Tolkiehn, M.; Burianek, M.; Mühlberg, M. High-Pressure Phase Transition of Bi2Fe4O9. J. Phys. Condens. Matter 2012, 24, 145401. [Google Scholar] [CrossRef]
- Zeljković, S.; Ivas, T.; Maruyama, H.; Nino, J.C. Structural, Magnetic and Optical Properties of BiFeO3 Synthesized by the Solvent-Deficient Method. Ceram. Int. 2019, 45, 19793–19798. [Google Scholar] [CrossRef]
- Tu, C.S.; Chen, P.Y.; Jou, Y.S.; Chen, C.S.; Chien, R.R.; Schmidt, V.H.; Haw, S.C. Polarization-Modulated Photovoltaic Conversion in Polycrystalline Bismuth Ferrite. Acta Mater. 2019, 176, 1–10. [Google Scholar] [CrossRef]
- Wang, Y.; Daboczi, M.; Zhang, M.; Briscoe, J.; Kim, J.S.; Yan, H.; Dunn, S. Origin of the switchable photocurrent direction in BiFeO3 thin films. Mater. Horiz. 2023. [Google Scholar] [CrossRef] [PubMed]
- Zeng, T.; Liu, Z.; Huang, G.; Hou, J.; Zhang, G. Visible-light photovoltaic effect in multiferroic Bi2Fe4O9 thin film. Mater. Lett. 2022, 309, 131411. [Google Scholar] [CrossRef]
- Ameer, S.; Jindal, K.; Tomar, M.; Jha, P.K.; Gupta, V. Growth of highly oriented orthorhombic phase of Bi2Fe4O9 thin films by pulsed laser deposition. Mater. Today Proc. 2021, 47, 1646–1650. [Google Scholar] [CrossRef]
- Liu, Y.; Zuo, R. Morphology and optical absorption of Bi2Fe4O9 crystals via mineralizer-assisted hydrothermal synthesis. Particuology 2013, 11, 581–587. [Google Scholar] [CrossRef]
- Psathas, P.; Georgiou, Y.; Moularas, C.; Armatas, G.S.; Deligiannakis, Y. Controlled-Phase Synthesis of Bi2Fe4O9 & BiFeO3 by Flame Spray Pyrolysis and their evaluation as non-noble metal catalysts for efficient reduction of 4-nitrophenol. Powder Technol. 2020, 368, 268–277. [Google Scholar] [CrossRef]
- Zhong, Y.; Ma, Y.; Guo, Q.; Liu, J.; Wang, Y.; Yang, M.; Xia, H. Controllable synthesis of TiO2@Fe2O3 core-shell nanotube arrays with double-wall coating as superb lithium-ion battery anodes. Sci. Rep. 2017, 7, 40927. [Google Scholar] [CrossRef]
- Gomez-Iriarte, G.A.; Pentón-Madrigal, A.; de Oliveira, L.A.S.; Sinnecker, J.P. XPS study in BiFeO3 surface modified by argon etching. Materials 2022, 15, 4285. [Google Scholar] [CrossRef]
- Zhang, C.; Wang, S.Y.; Liu, W.F.; Xu, X.L.; Li, X.; Zhang, H.; Gao, J.; Li, D.J. Room temperature exchange bias in multiferroic BiFeO3 nano-and microcrystals with antiferromagnetic core and two-dimensional diluted antiferromagnetic shell. J. Nanopart. Res. 2017, 19, 182. [Google Scholar] [CrossRef]
- Bharathkumar, S.; Sakar, M.; Balakumar, S. Versatility of electrospinning in the fabrication of fibrous mat and mesh nanostructures of bismuth ferrite (BiFeO3) and their magnetic and photocatalytic activities. Phys. Chem. Chem. Phys. 2015, 17, 17745–17754. [Google Scholar] [CrossRef] [PubMed]
- Xue, X.; Tan, G.; Liu, W.; Ren, H. Structural, electrical and magnetic properties of (Bi0.9RE0.1)(Fe0.97Co0.03)O3 (RE = Nd and Gd) thin films. Mater. Res. Bull. 2014, 52, 143–150. [Google Scholar] [CrossRef]
- Quan, Z.; Hu, H.; Xu, S.; Liu, W.; Fang, G.; Li, M.; Zhao, X. Surface chemical bonding states and ferroelectricity of Ce-doped BiFeO3 thin films prepared by sol–gel process. J. Sol-Gel Sci. Technol. 2008, 48, 261–266. [Google Scholar] [CrossRef]
- Wang, J.B.N.J.; Neaton, J.B.; Zheng, H.; Nagarajan, V.; Ogale, S.B.; Liu, B.; Viehland, D.; Vaithyanathan, V.; Schlom, D.G.; Waghmare, U.V.; et al. Epitaxial BiFeO3 multiferroic thin film heterostructures. Science 2003, 299, 1719–1722. [Google Scholar] [CrossRef]
- Tamilselvan, A.; Balakumar, S.; Sakar, M.; Nayek, C.; Murugavel, P.; Kumar, K.S. Role of oxygen vacancy and Fe–O–Fe bond angle in compositional, magnetic, and dielectric relaxation on Eu-substituted BiFeO3 nanoparticles. Dalton Trans. 2014, 43, 5731–5738. [Google Scholar] [CrossRef] [PubMed]
- Paswan, S.K.; Kumari, S.; Kar, M.; Singh, A.; Pathak, H.; Borah, J.P.; Kumar, L. Optimization of Structure-Property Relationships in Nickel Ferrite Nanoparticles Annealed at Different Temperature. J. Phys. Chem. Solids 2021, 151, 109928. [Google Scholar] [CrossRef]
- Bennett, L.H.; Della Torre, E. Analysis of Wasp-Waist Hysteresis Loops. J. Appl. Phys. 2005, 97, 984370. [Google Scholar] [CrossRef]
- Gupta, S.; Tomar, M.; Gupta, V. Magnetic Hysteresis of Cerium Doped Bismuth Ferrite Thin Films. J. Magn. Magn. Mater. 2015, 378, 333–339. [Google Scholar] [CrossRef]
- Roberts, A.P.; Cui, Y.; Verosub, K.L. Wasp-Waisted Hysteresis Loops: Mineral Magnetic Characteristics and Discrimination of Components in Mixed Magnetic Systems. J. Geophys. Res. Solid Earth 1995, 100, 17909–17924. [Google Scholar] [CrossRef]
- Tauxe, L.; Mullender, T.A.T.; Pick, T. Potbellies, Wasp-Waists, and Superparamagnetism in Magnetic Hysteresis. J. Geophys. Res. Solid Earth 1996, 101, 571–583. [Google Scholar] [CrossRef]


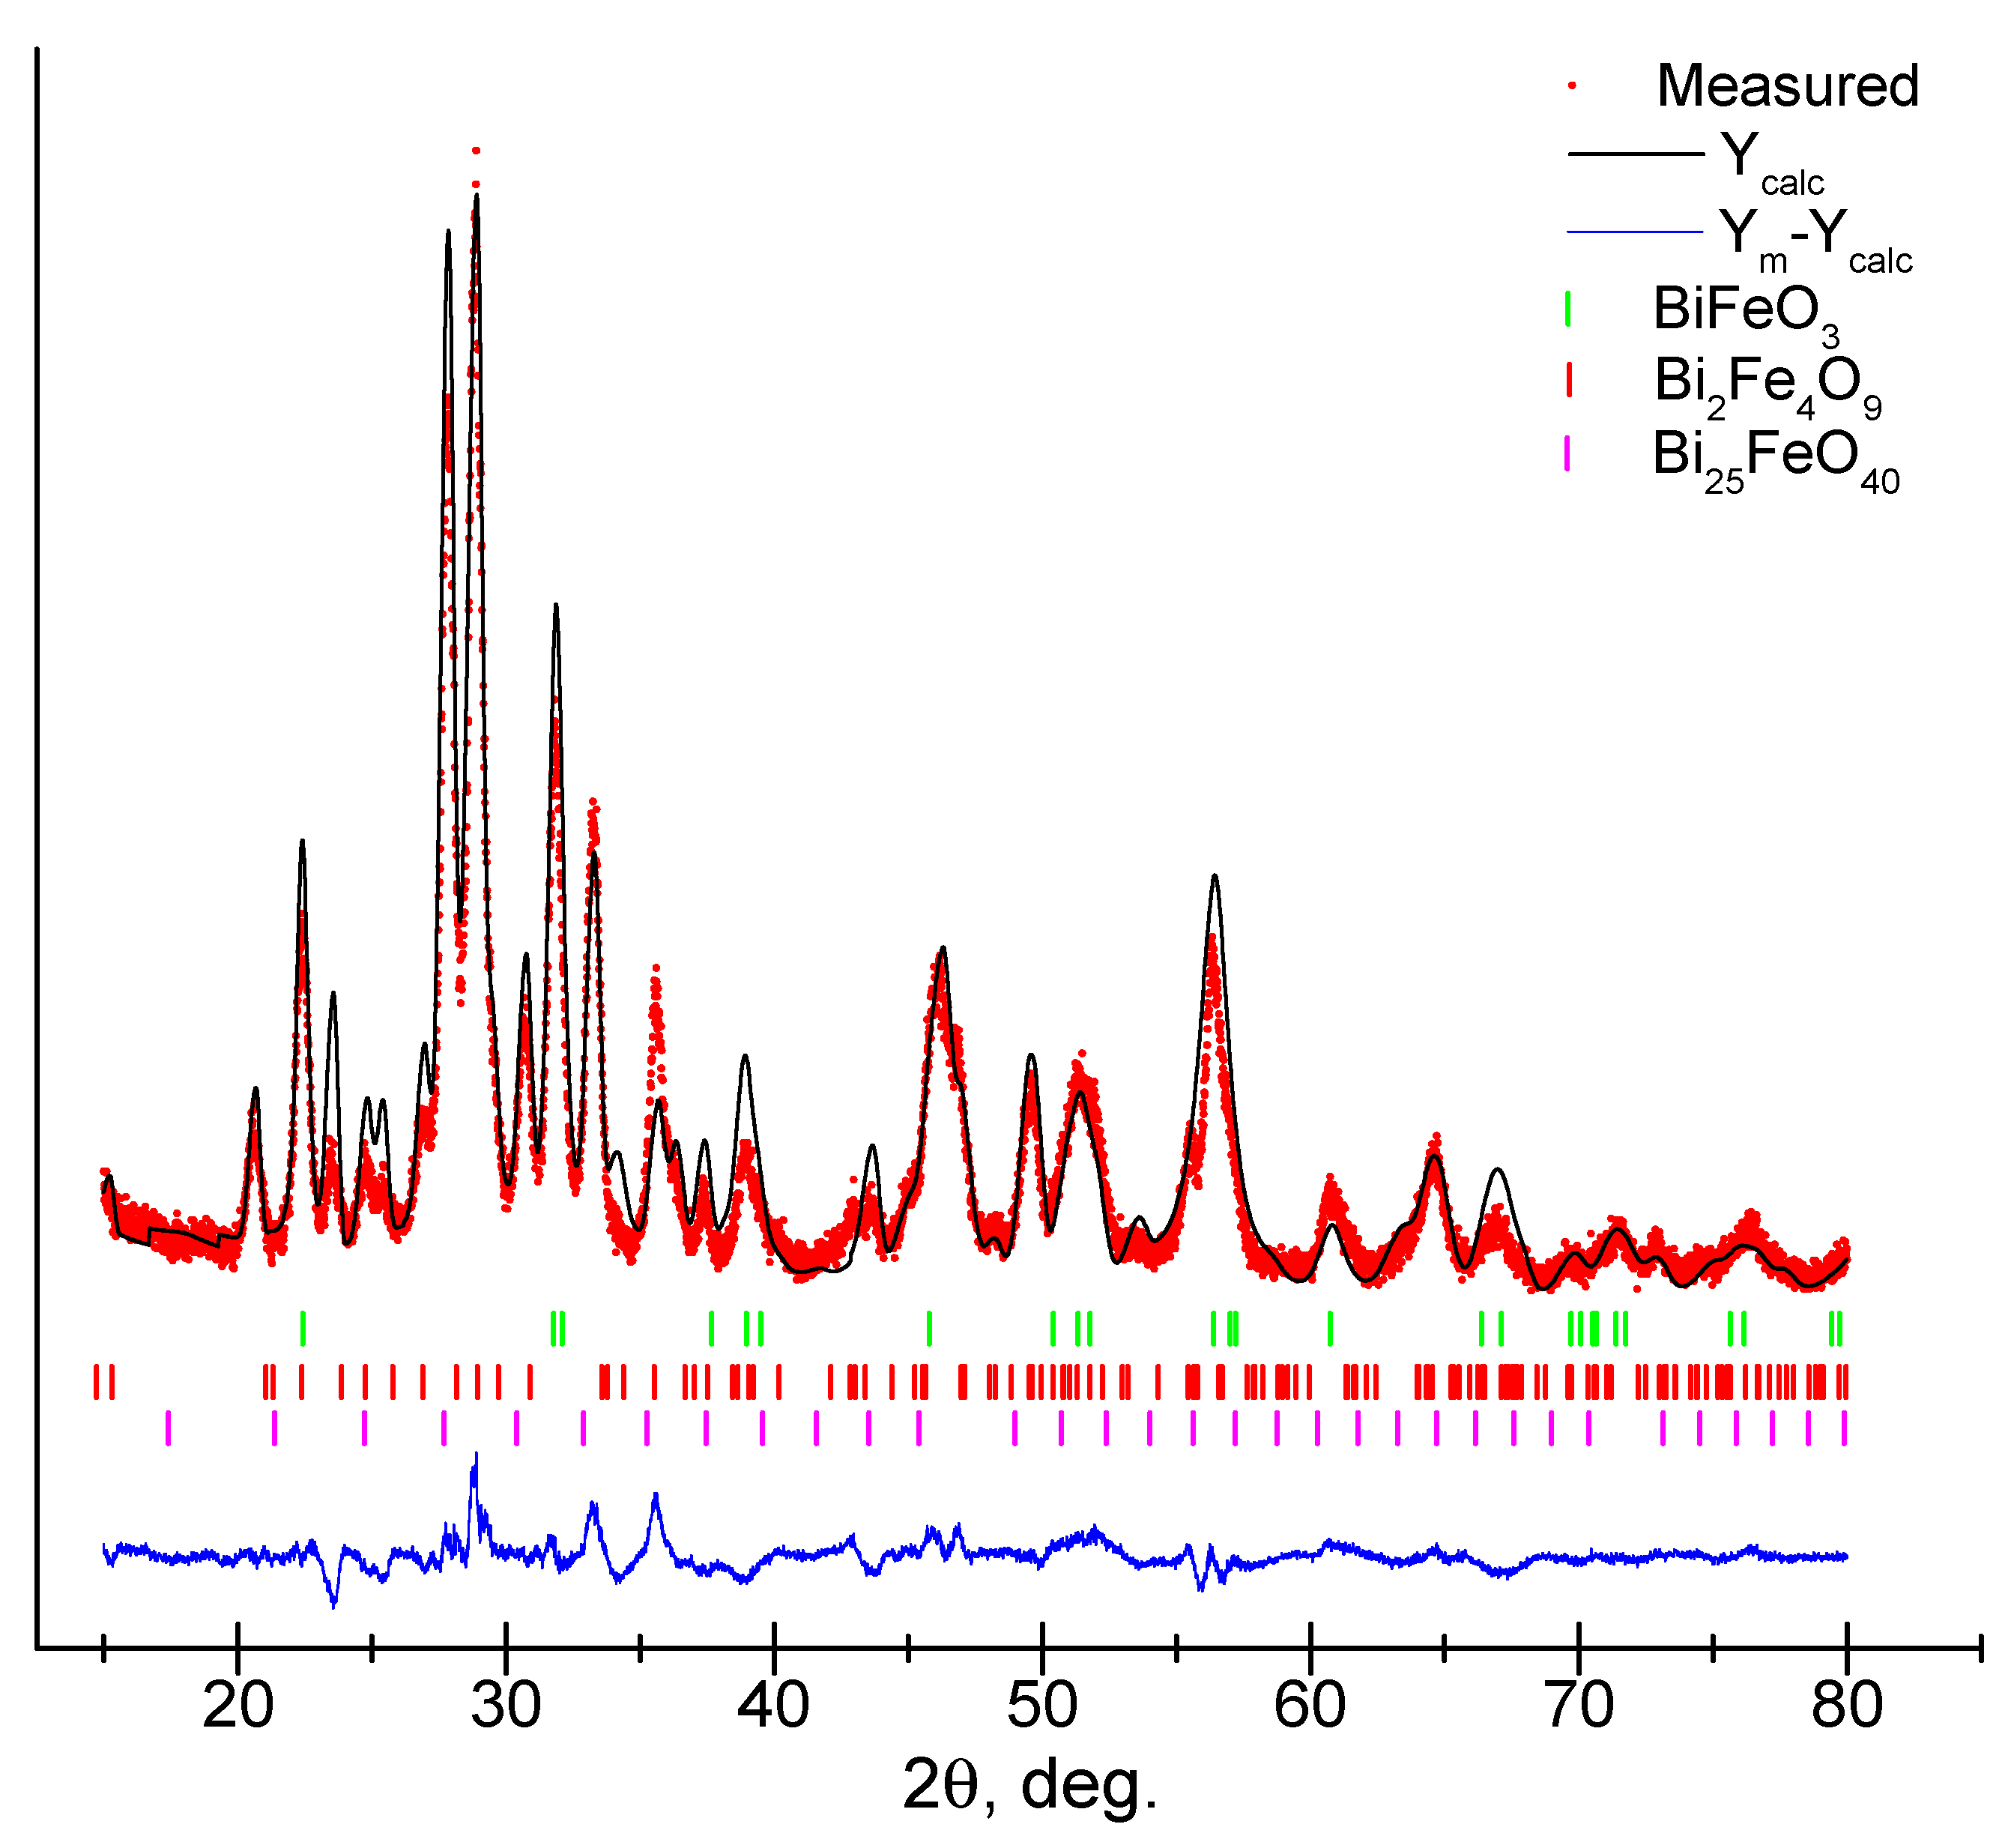
| Phase | Lattice Parameters | Crystallite Size (nm) | Phase Fraction (%) | R-Factors and χ2 | ||
|---|---|---|---|---|---|---|
| a | b | c | ||||
| BiFeO3 | 5.6010 | 5.6010 | 13.8125 | 14.9 | 33.4% | R profile—14.05 R expected—6.68 χ2—7.2 |
| Bi2Fe4O9 | 7.8954 | 8.5891 | 6.0582 | 17.3 | 63.4% | |
| Bi25FeO40 | 9.8677 | 9.8677 | 9.8677 | 16.5 | 3.2% | |
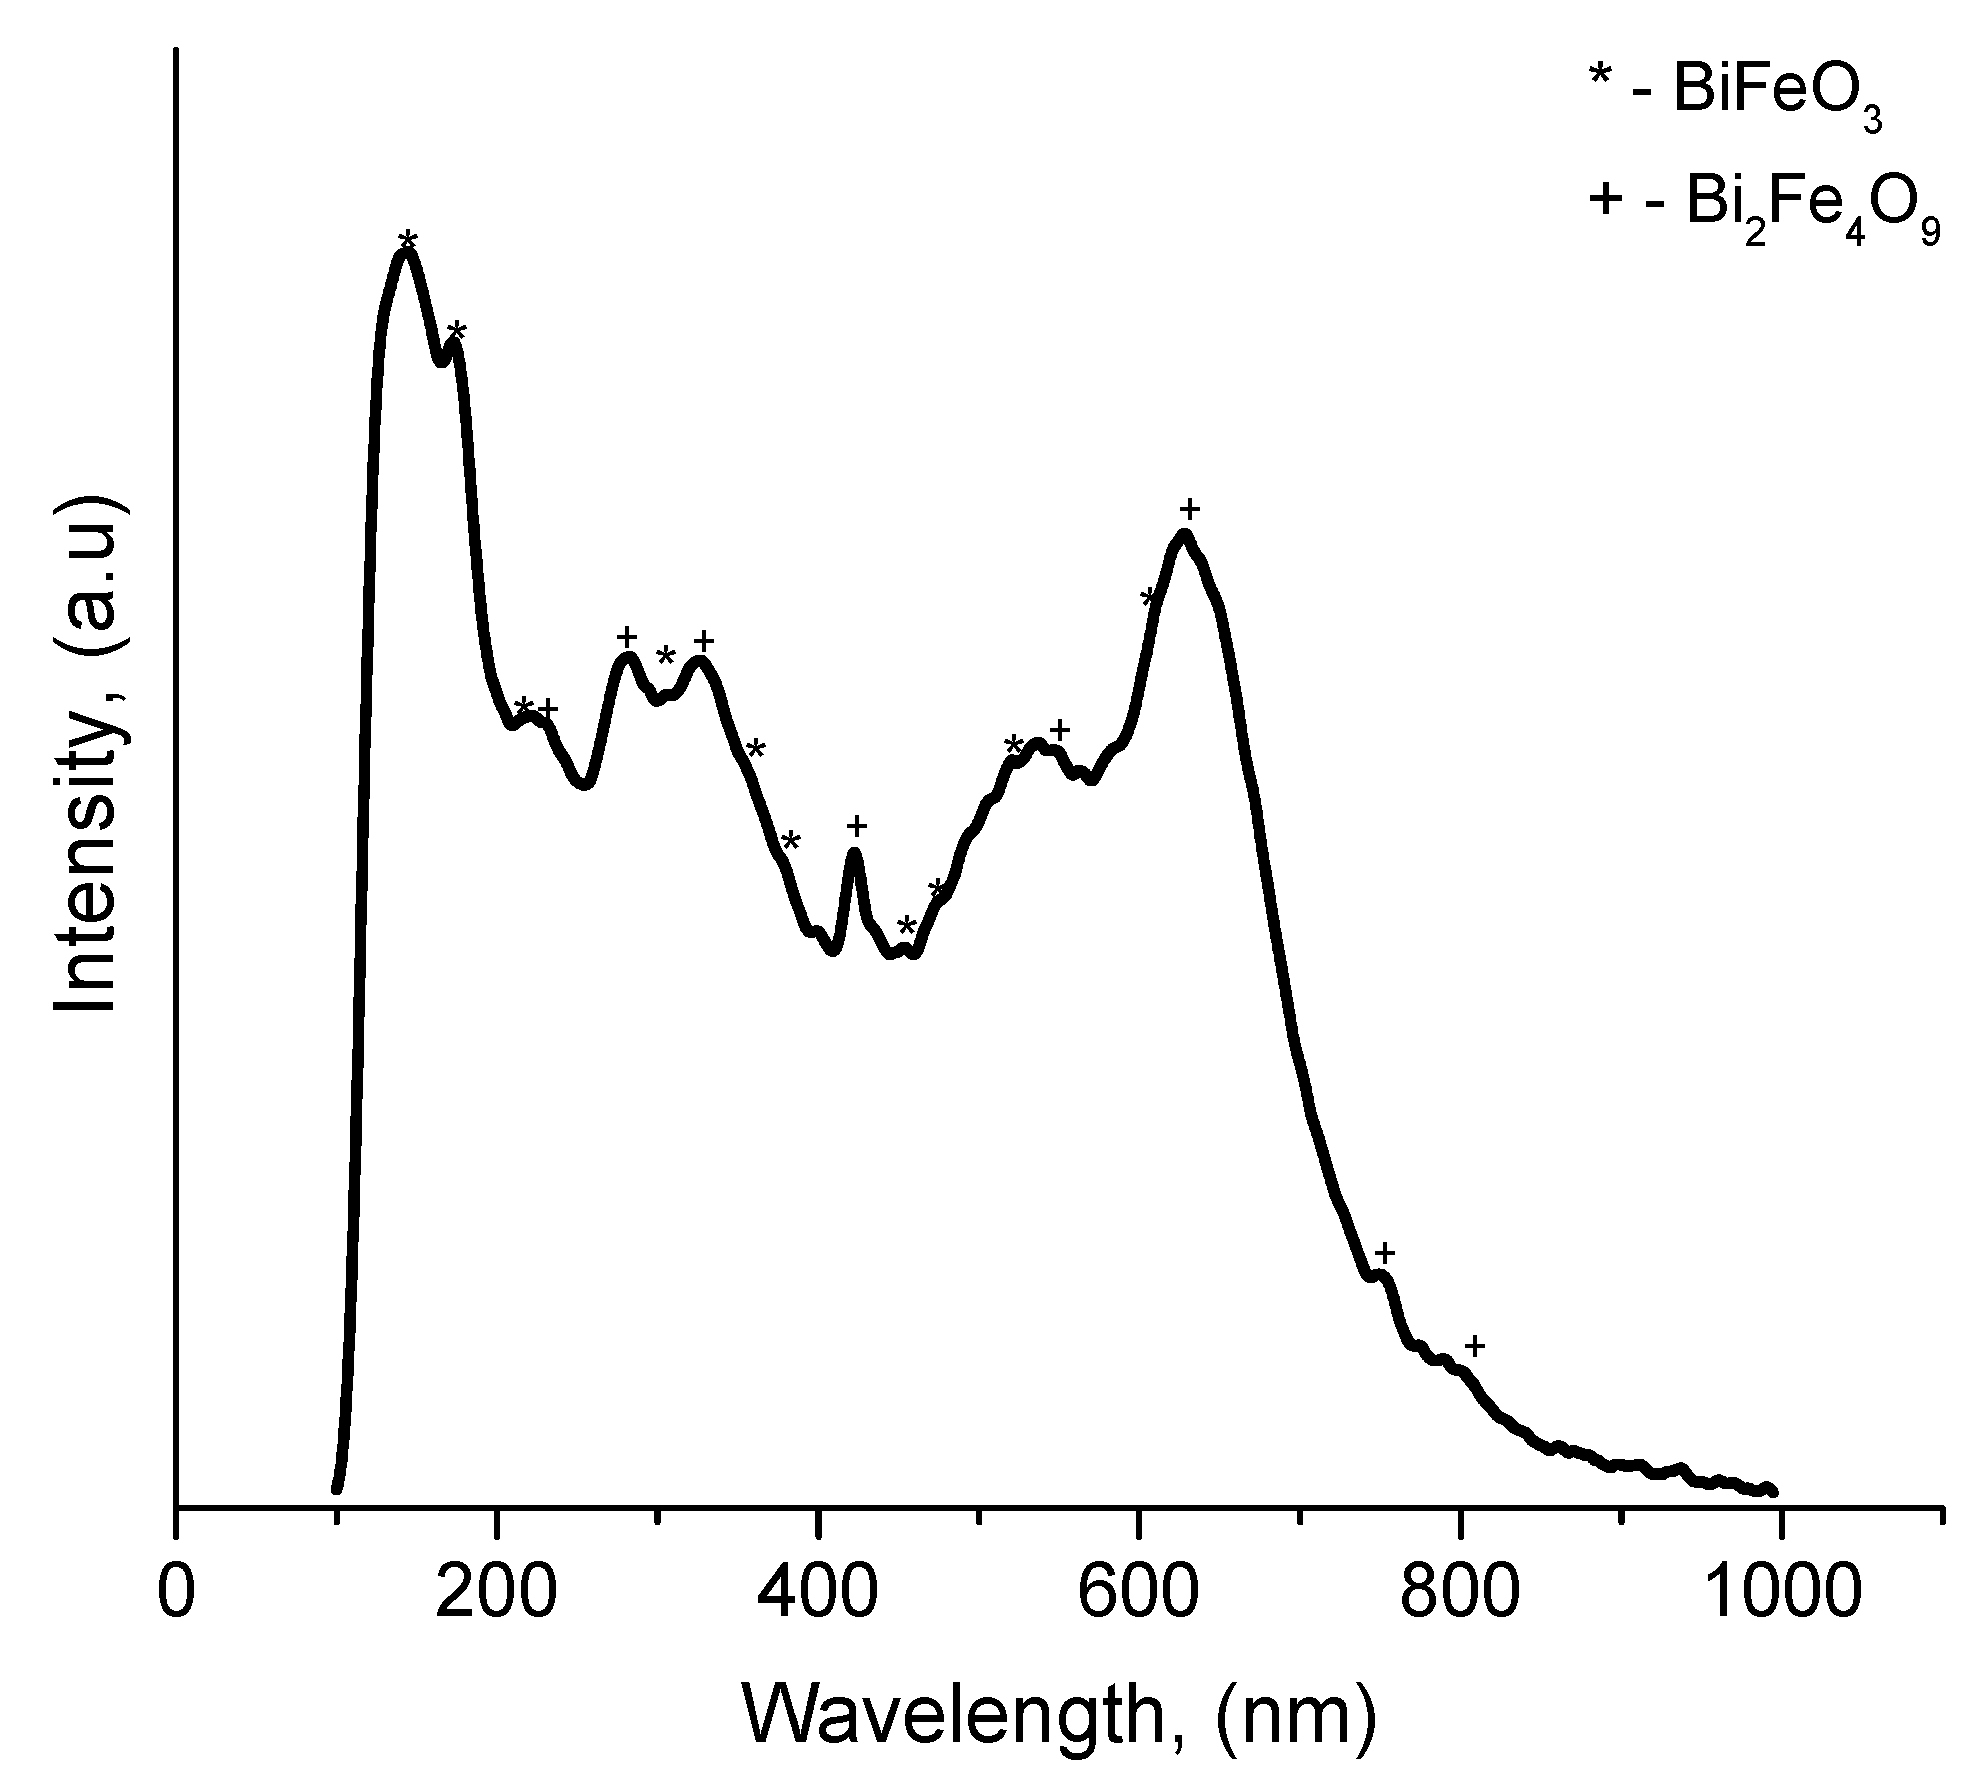
| BiFeO3 | 143 | 175 | 218 | 305 | 358 | 380 | 455 | 473 | 517 | 609 |
| Bi2Fe4O9 | 232 | 280 | 328 | 423 | 546 | 630 | 752 | 807 | - | - |
Disclaimer/Publisher’s Note: The statements, opinions and data contained in all publications are solely those of the individual author(s) and contributor(s) and not of MDPI and/or the editor(s). MDPI and/or the editor(s) disclaim responsibility for any injury to people or property resulting from any ideas, methods, instructions or products referred to in the content. |
© 2023 by the authors. Licensee MDPI, Basel, Switzerland. This article is an open access article distributed under the terms and conditions of the Creative Commons Attribution (CC BY) license (https://creativecommons.org/licenses/by/4.0/).
Share and Cite
Kallaev, S.; Sadykov, S.; Pavlenko, A.; Ataev, M.; Majzner, J.; Orudzhev, F.; Giraev, K.; Alikhanov, N. Exploring RF Magnetron Sputtering Growth Composite Thin Film BiFeO3-Bi2Fe4O9 on C-Plane Al2O3 Substrate. Materials 2023, 16, 6987. https://doi.org/10.3390/ma16216987
Kallaev S, Sadykov S, Pavlenko A, Ataev M, Majzner J, Orudzhev F, Giraev K, Alikhanov N. Exploring RF Magnetron Sputtering Growth Composite Thin Film BiFeO3-Bi2Fe4O9 on C-Plane Al2O3 Substrate. Materials. 2023; 16(21):6987. https://doi.org/10.3390/ma16216987
Chicago/Turabian StyleKallaev, Suleiman, Sadyk Sadykov, Anatoly Pavlenko, Mansur Ataev, Jiří Majzner, Farid Orudzhev, Kamal Giraev, and Nariman Alikhanov. 2023. "Exploring RF Magnetron Sputtering Growth Composite Thin Film BiFeO3-Bi2Fe4O9 on C-Plane Al2O3 Substrate" Materials 16, no. 21: 6987. https://doi.org/10.3390/ma16216987
APA StyleKallaev, S., Sadykov, S., Pavlenko, A., Ataev, M., Majzner, J., Orudzhev, F., Giraev, K., & Alikhanov, N. (2023). Exploring RF Magnetron Sputtering Growth Composite Thin Film BiFeO3-Bi2Fe4O9 on C-Plane Al2O3 Substrate. Materials, 16(21), 6987. https://doi.org/10.3390/ma16216987