Abstract
The goal of this paper is to investigate the impact of nano-materials on the mechanical and electrochemical properties of self-cleaning concrete. Nano-titanium dioxide and nano-zinc oxide were used as additives for this purpose. Additionally, a comparative study on the effect of using these materials on the self-cleaning concrete’s characteristics was conducted. The dosages of nano-titanium dioxide (nps-TiO2) and nano-zinc oxide (nps-ZnO) used were 0, 0.5, 1, 1.5, 2, and 2.5% and 0, 1, 2, and 3% of the weight of the cement, respectively. The results showed that the optimum compressive strength and the lowest corrosion rate were fulfilled at 2.5% of nps-TiO2 and 1% of nps-ZnO, and using 2.5% of nps-TiO2 achieved the highest improvement in the corrosion rate. However, 1% for nps-TiO2 mixtures and 1% for nps-ZnO mixtures were the best ratios for flexural strength. On the other hand, for the corrosion rate, the samples were tested at 2 and 6 months. When nps-TiO2 and nps-ZnO samples were compared to the control sample, 2.5% and 1% of nps-TiO2 and nps-ZnO, respectively, showed the largest improvement in resistance to corrosion. Also, the self-cleaning property of the samples containing nano-materials (nps-TiO2 and nps-ZnO) was tested. As the results illustrated, the self-cleaning property of the samples was increased over time due to photocatalytic degradation. Furthermore, the results of the photocatalytic tests showed that nps-TiO2 samples outperformed nps-ZnO samples overall.
1. Introduction
Global population growth has brought new challenges for humanity, such as the high number of pollutants released as a result of the burning of fossil fuels. These toxic substances not only pose a threat to the environment and human health but they also reduce a concrete structure’s lifetime through acidification and deterioration, raising the expense of upkeep and restoration. One innovative strategy for improving air quality is the use of photocatalytic materials in urban construction elements [1]. The use of photocatalytic materials is a technique that has the potential to help decrease air pollution by using these materials in concrete (called “self-cleaning concrete”) [2]. The photocatalytic technique is not unique; it has been used since the 1960s [3]. Although the main focus has been concentrated on water treatment technologies, the use of photocatalytic oxidation in building materials has gained the attention of researchers since the 1990s [4]. Self-cleaning concrete automatically cleans its own surface [5]. Nature is the source of this self-cleaning technology [5]. Lotus leaf nanoparticles—which possess a superhydrophobic function and whose remains are carried away by rain, thus removing dirt and debris—are the inspiration for the surface of self-cleaning surfaces. This is a result of the photocatalytic activities [5]. Photocatalytic materials (such as TiO2 and ZnO) use energy from sunlight (or any other ultraviolet light sources) to oxidize organic compounds (such as nitrogen oxides (NOx), sulfur oxides (SOx), tobacco smoke, bacteria, etc.) and convert them to less harmful substances [2,5].
As a result of solar UV radiation absorption, photo-catalytic materials produce hydroxyl radicals and superoxide anions, which interact with pollutants like NOx to transform them into less hazardous molecules (this might be helpful in regions with significant levels of air pollution) [5]. Following this process, water is largely employed as a cleaning agent. Following a rainstorm, the building becomes clean and pollutant-free. Water droplets sweep away NOx dust [2,5]. The overall mechanism of photocatalysis can be represented generically as photochemical processes, as shown in Equations (2)–(7) [6,7].
Photocatalytic systems offer two key advantages: they keep the surface clean and ensure a cleaner environment. Photocatalytic materials are not only unique in that they have a wide range of uses, but they also provide numerous benefits, such as reduced maintenance costs and time (cleaning process); they also provide energy savings by lowering the temperature of, and thus cooling, the buildings [5]. Nano-materials have become one of the most widely used methods in recent years for creating innovative cement composites. In addition to improving the material’s mechanical performance, adding nanoparticles to cements gives them additional qualities, like self-cleaning, electrical conductivity, self-healing ability, porosity, and greater durability [8,9,10]. Nano-TiO2 is currently the most extensively utilized photocatalytic material because of its ability to block UV rays, remove impurities, and photolyze organic contaminants, as well as its benefits of high oxidation and reduction, safe, high durability, and renewable recycling [11,12,13,14]. Building materials may be able to perform photocatalysis and self-cleaning to a greater extent when combined with nano-TiO2 and cement-based materials [15,16,17,18].
Because of its nucleation impact, nano-TiO2 is also applied to cement-based materials in order to enhance their mechanical and hydration characteristics [19,20,21]. The addition of nano-TiO2 particles to the cement decreases the overall porosity of the hardened concrete mixture while improving the pore structure [22]. Also, the addition of nano-TiO2 can increase the development of C-S-H, which improves the performance of the flexural concrete [23]. In comparison to normal concrete, self-cleaning concrete has six times more surface area exposed to sunlight due to its high porosity and specific surface area, which increases the amount of light that nano-TiO2 can absorb [24].
According to the majority of the published research, ZnO nanoparticles are mainly used for self-cleaning purposes in cement mortars because of their photocatalytic capabilities that are similar to those of TiO2 [25,26,27]; ZnO is usually thought of as a TiO2 replacement since it can absorb a larger portion of the solar spectrum’s energy and lighter quanta [28]. Additionally, it has been demonstrated that adding ZnO to reinforced concrete can help lower the corrosion rate of implanted steel bars [29].
The mechanical and structural properties are susceptible to direct corrosion effects. The overall reaction of the building may also be impacted. According to scientific terminology, concrete corrosion is the progressive deterioration of metal via chemical, electrochemical, and electrolytic interactions within its environment. It usually develops as the concrete ages. It becomes a major issue when materials are lost to corrosion. The most typical instance of corrosion is the rusting of iron when it is subjected to environmental factors. Hydrated ferric oxide builds up on the surface and causes rusting.
To face this problem, recently, many researchers have used ZnO to reduce the corrosion. According to reports, the use of nps-ZnO in cement mortars and concrete has minimized environmental problems linked to the caliber of building materials, waste reduction, greenhouse gas emissions, and decreased expenses associated with manufacturing and maintenance [30]. It has been reported that the use of ZnO increases the reactivity of the extra cementitious components by speeding up cement hydration and releasing more heat [31]. Additionally, the use of ZnO reduced the rate of the corrosion of steel bars used in concrete [29].
Furthermore, earlier studies have indicated that the existence of voids in concrete causes a reduction in compressive strength [5]. Thus, the strength and durability, as well as the thermal, mechanical, and electrical characteristics, of cementitious materials would all be improved because the nanoparticle photocatalyst would fill the spaces between cement particles [5].
It should be emphasized that there are very few studies on the use of ZnO in conjunction with Portland cement for structural composite applications, particularly those examining the impacts and characterizations of this nanomaterial as a cement-based construction material. Additionally, there was a dearth of data on the electrochemical characteristics (resistance to corrosion rate) and characterization of utilizing TiO2 and ZnO nanoparticles in the mixing of concrete. Thus, the present study emphasizes the significance of including these nanoparticles in concrete mixing in order to have a significant influence on concrete sustainability.
In light of the previously mentioned characteristics of nps-ZnO and nps-TiO2, the primary aim of this study was to examine the impact of TiO2 and ZnO nanoparticles on mechanical properties (compressive and flexural strength) and durability properties (self-cleaning efficiency). In addition, we wanted to examine the corrosion-resistant performance of the cementitious composite in different conditions, such as in tap water and saline water. To this end, the Tafel potentiodynamic polarization technique was employed in order to evaluate the corrosion state of steel embedded in cementitious composites. Also, the phase characterizations and microstructure of the behavior of mixes containing TiO2 and ZnO nanoparticles were investigated using Energy Dispersive X-ray spectroscopy (EDX) and a scanning electron microscope (SEM).
2. Materials and Methods
2.1. Materials
2.1.1. Cement
The cement used for this study, ordinary Portland cement (OPC) of grade 42.5, was provided by Wadi El-Nile Cement Company, Beni-Suef, Egypt, and met the specifications of ASTM C150 [32]. The initial and final setting times are 65 and 200 min, respectively. The expansion is 1 mm, and the fineness is 4200 cm2/gm. Table 1 shows its chemical composition.

Table 1.
Chemical composition of cement.
2.1.2. Aggregate
Table 2 lists the physical characteristics of the sand and crushed dolomite utilized in this study. The tests were carried out in accordance with BS 882’s guidelines (1983). Table 3 summarizes the chemical composition of aggregates.
Table 2.
Mechanical properties of aggregates.
Table 3.
Chemical composition of aggregates.
2.1.3. Nano-Materials
Nano-materials were prepared using a chemical method at the Faculty of Postgraduate Studies for Advanced Sciences (PSAS) at Beni-Suef University, Beni Suef, Egypt. These agree well with earlier research [8,33]. Using the Scherrer equation (Equation (8)), the average particle size of the used nano-materials was determined.
where D represents average particle size, K represents the Scherrer constant (0.9), λ represents X-ray wavelength, β represents the full width at half maximum of the sharp peaks (FWHM), and θ represents the diffraction angle (radians).
TiO2 (Titanium Dioxide)
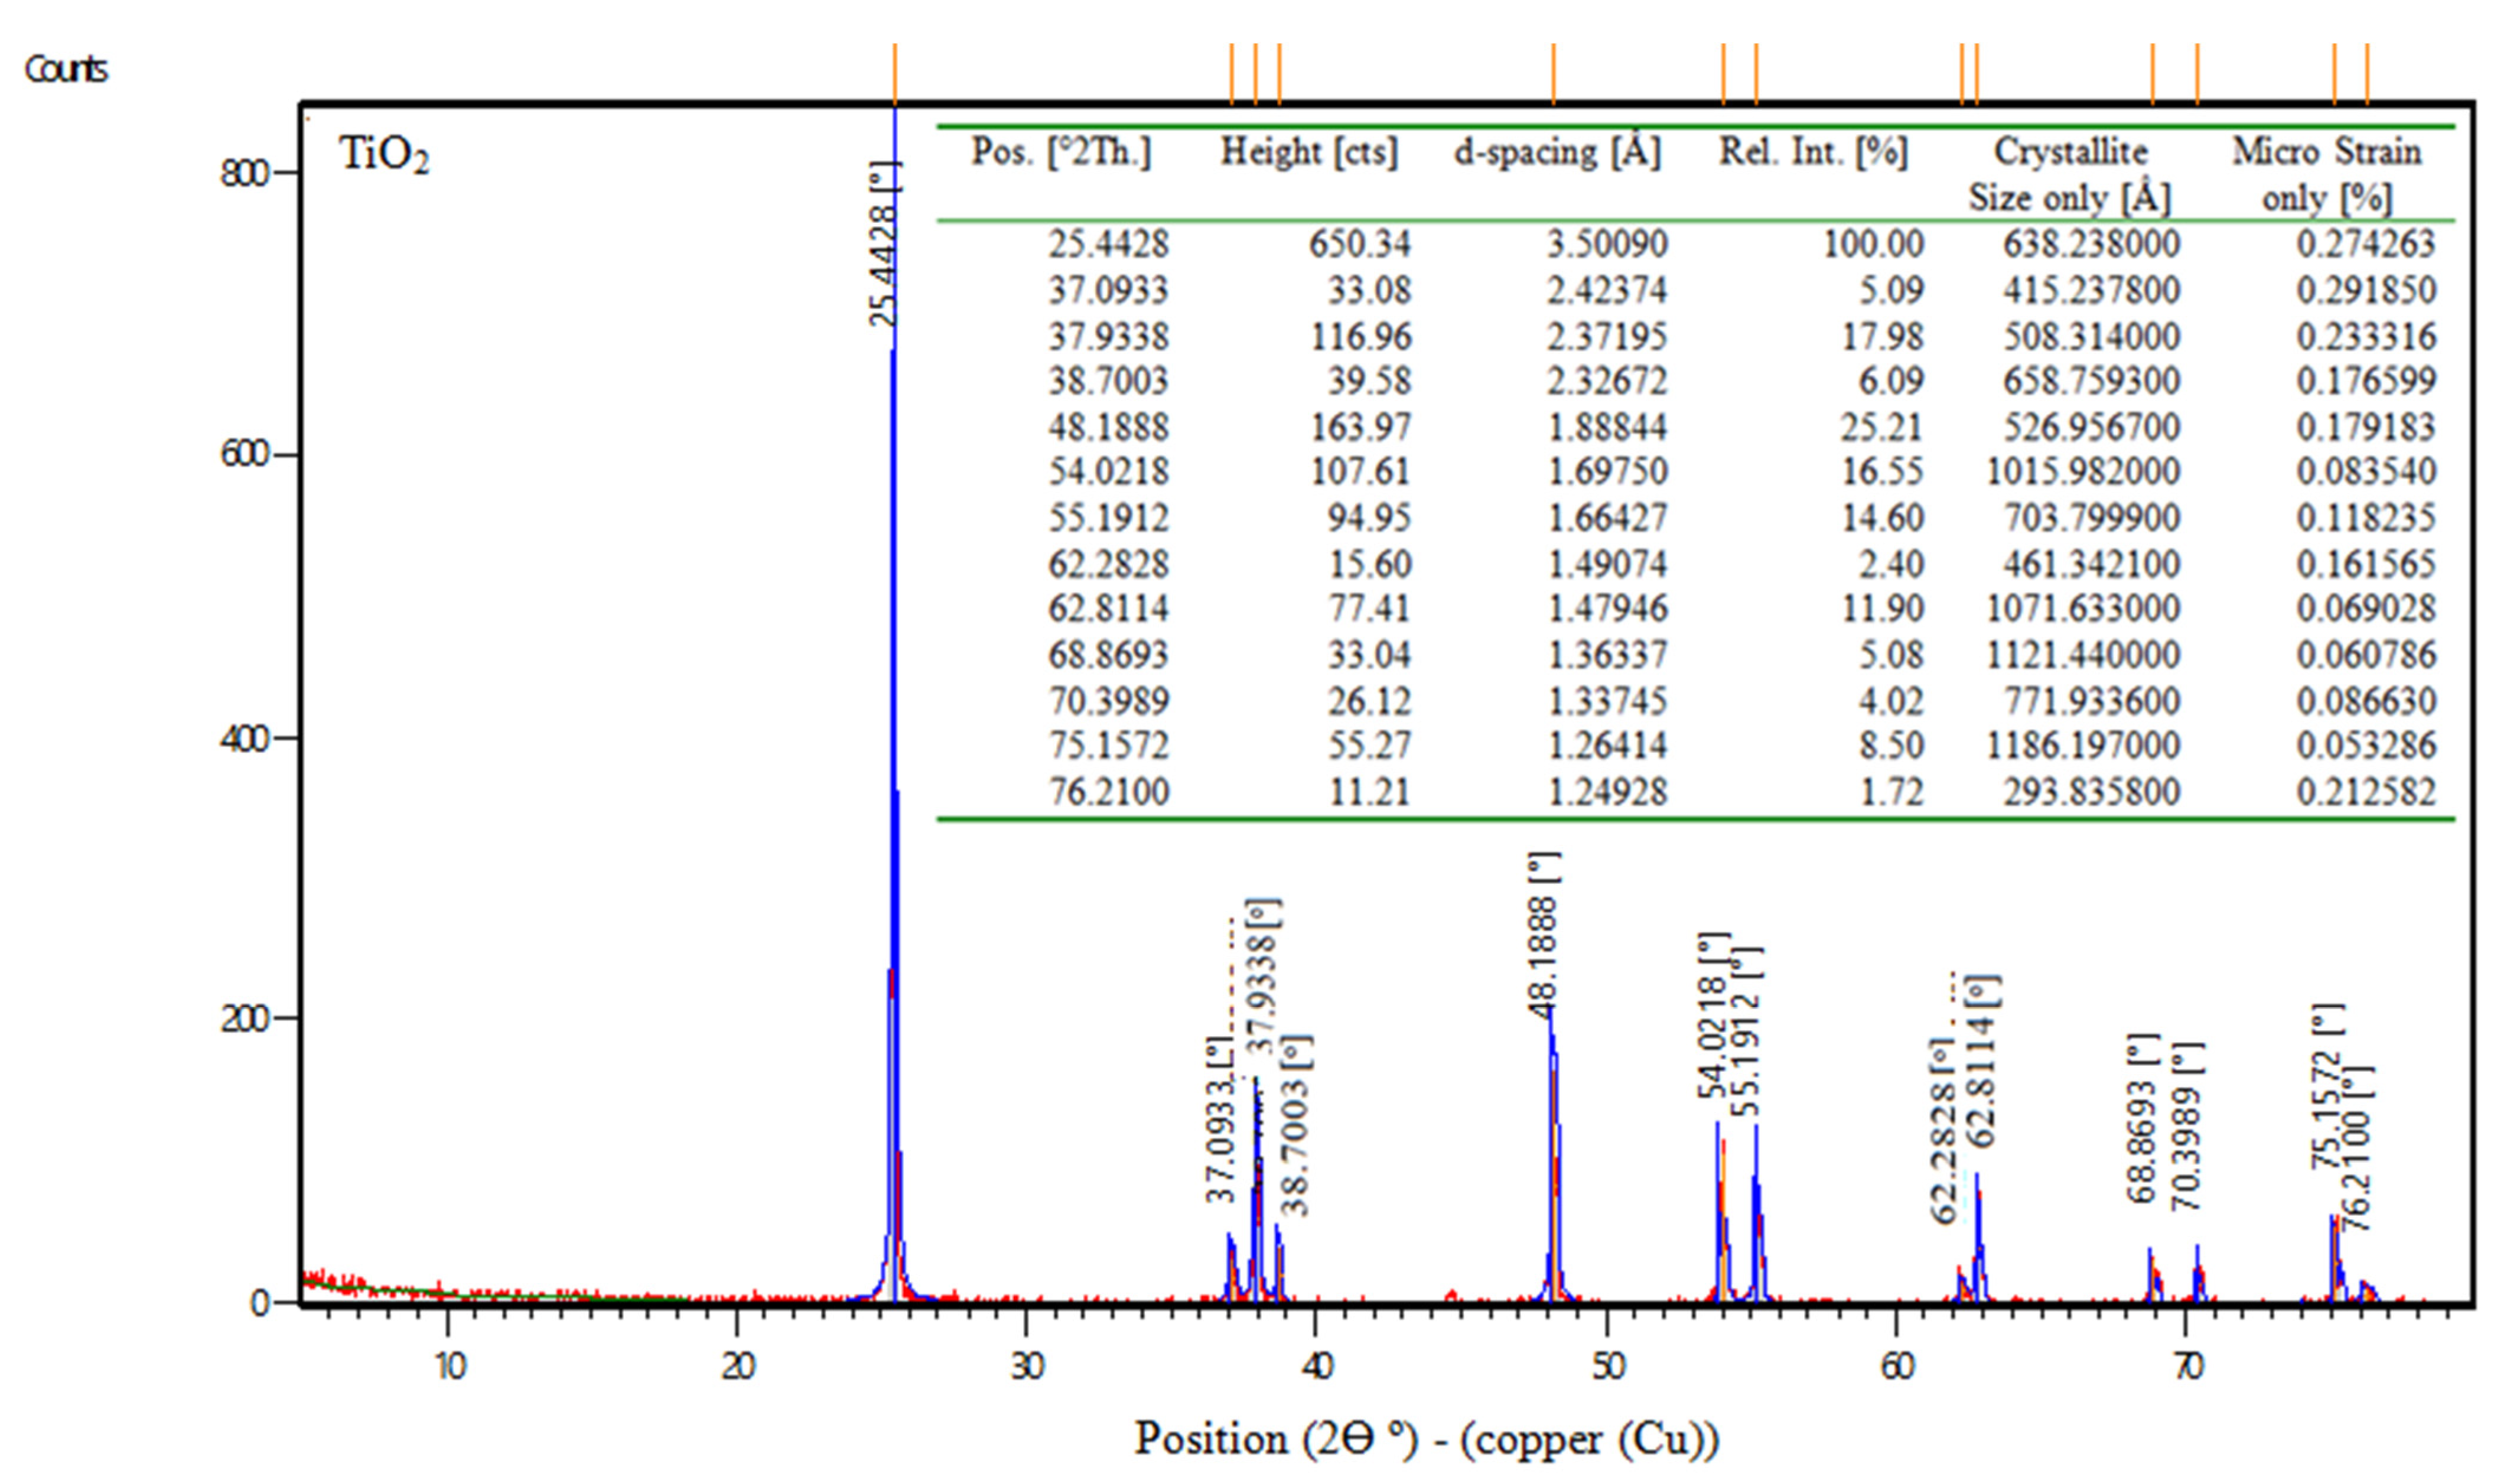
TiO2 is the chemical formula for titanium dioxide, often known as titania, which is a naturally occurring form of titanium oxide. According to the manufacturer, the physical characteristics of titanium dioxide are displayed in Table 4. Also, Figure 1 shows the XRD of nps-TiO2.
Table 4.
Properties of TiO2.
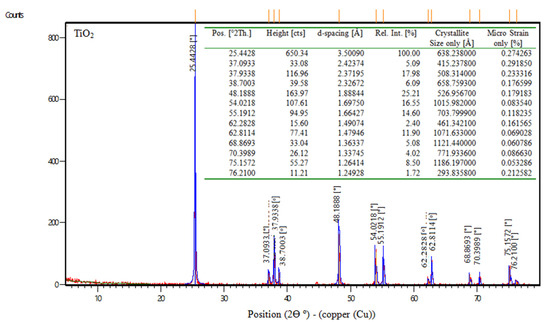
Figure 1.
XRD data of nps-TiO2.
ZnO (Zinc Oxide)
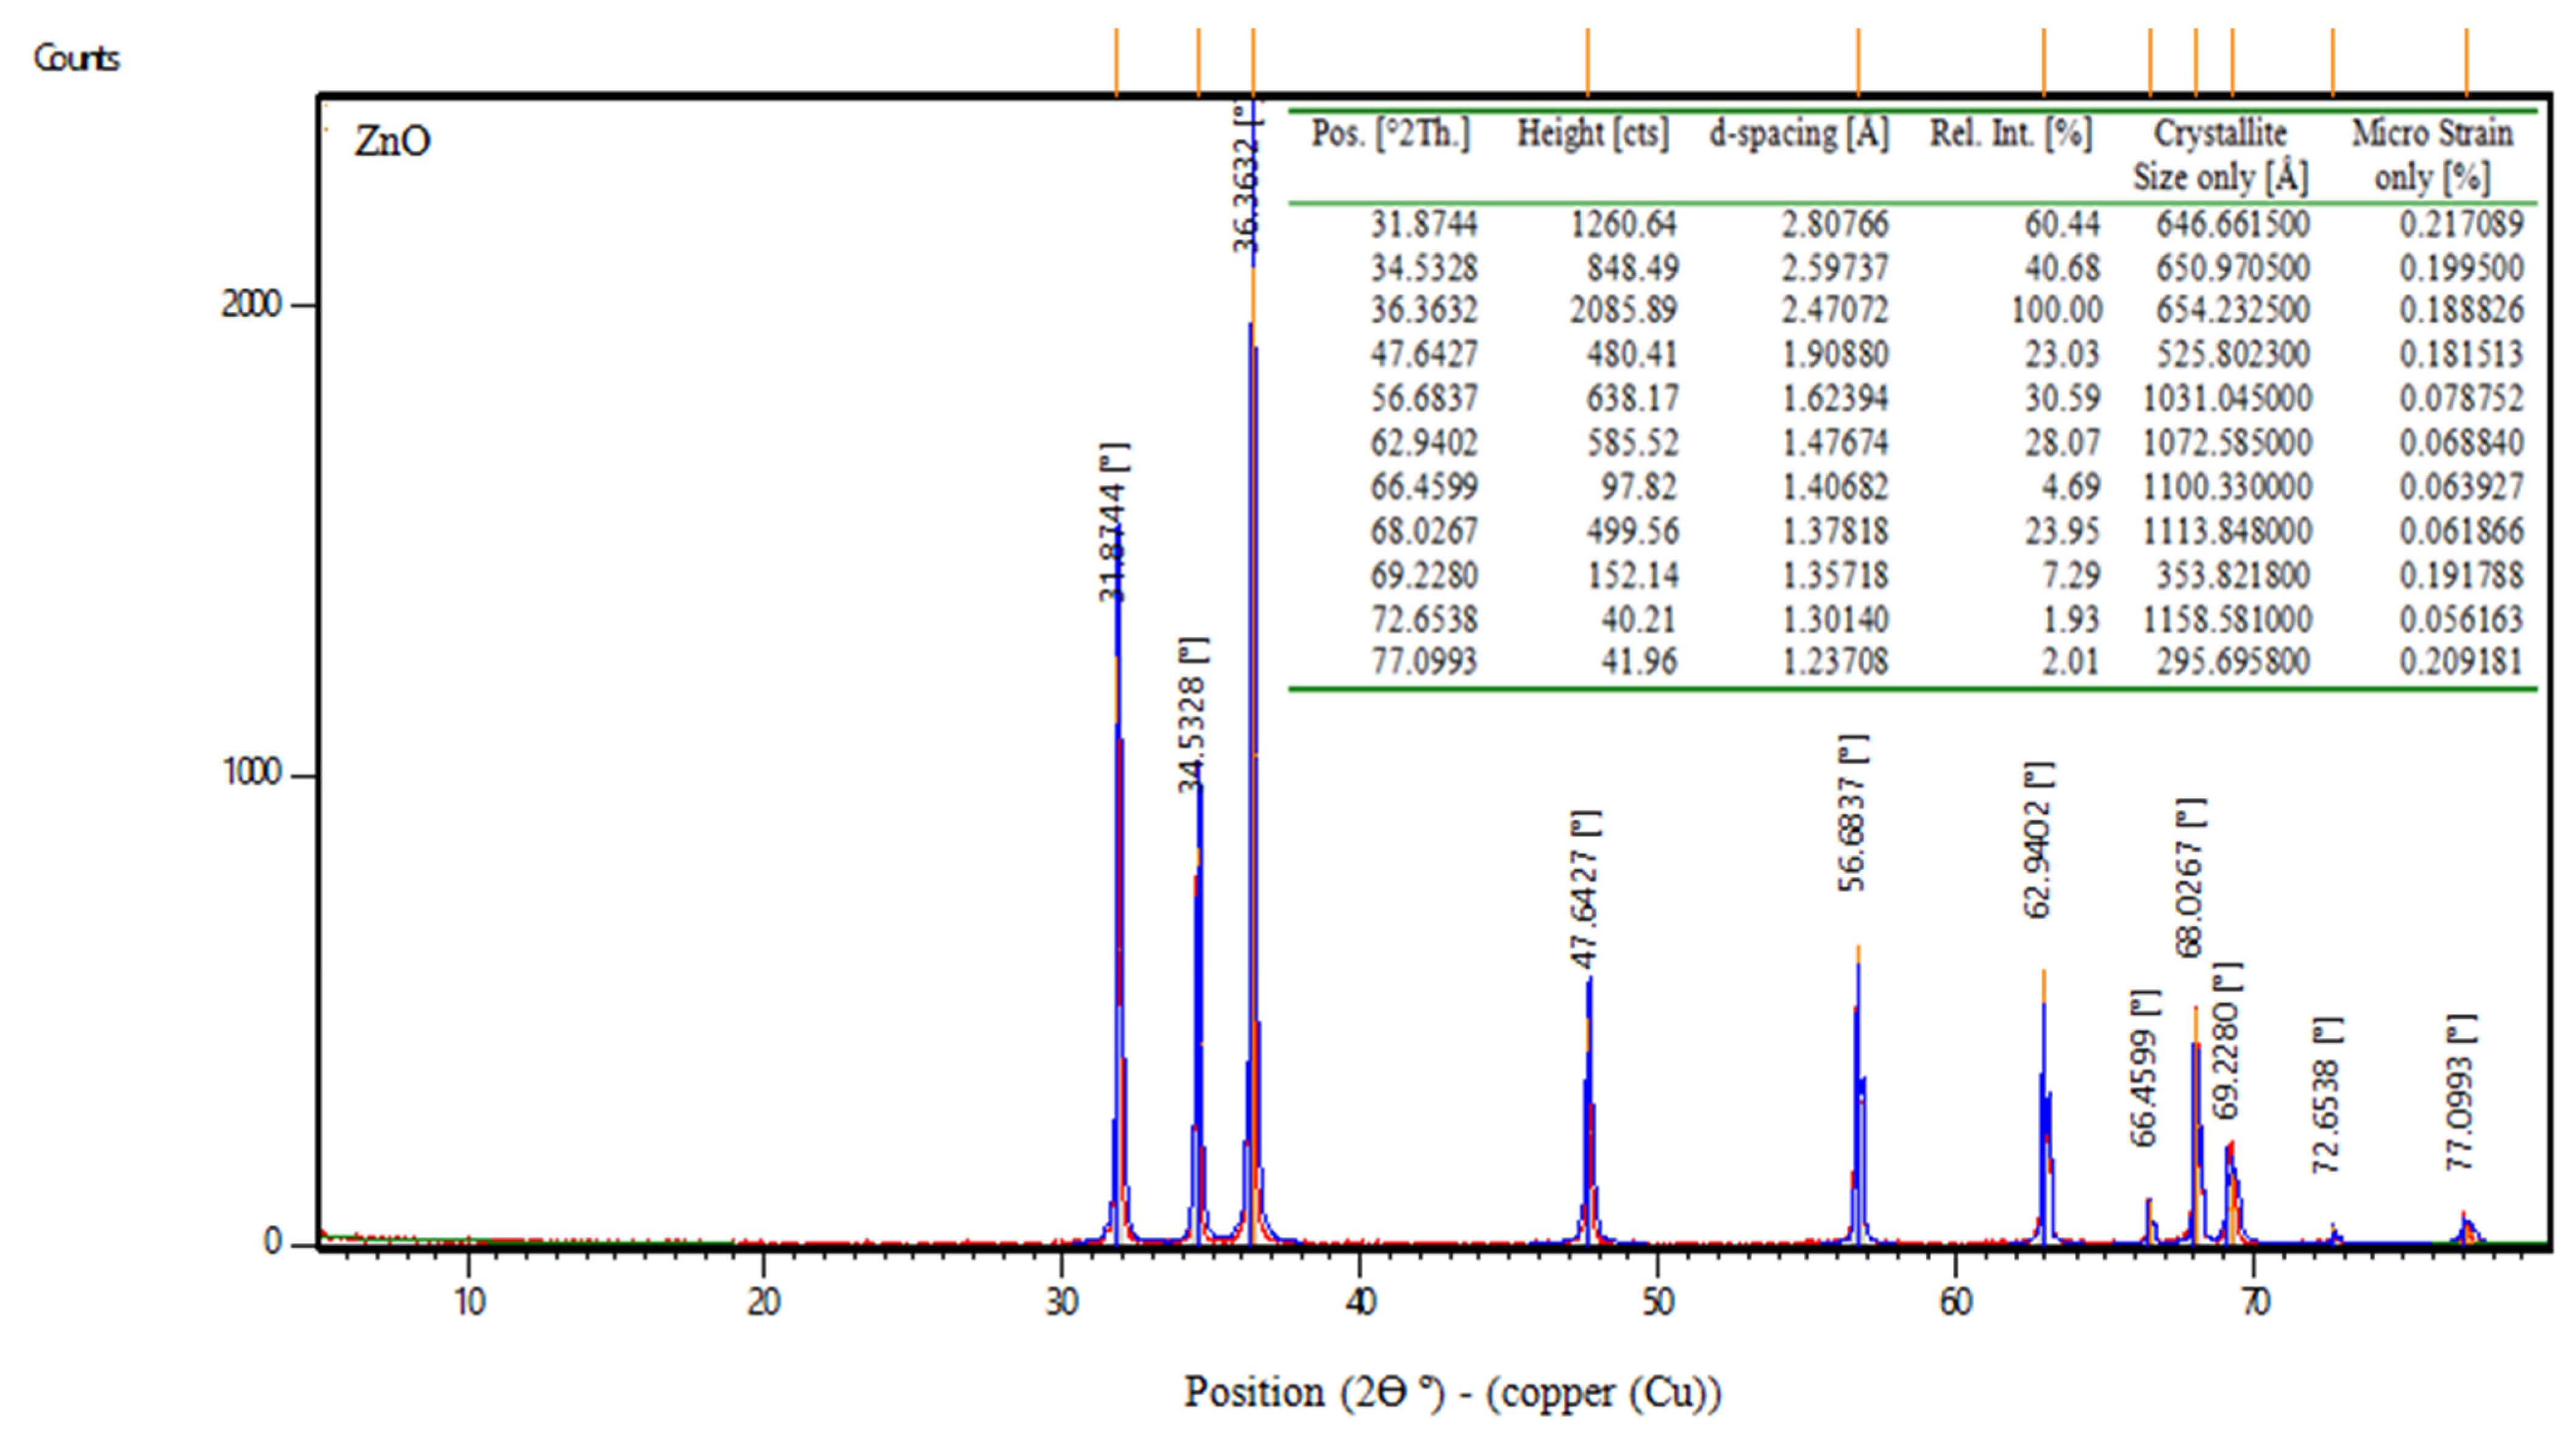
Zinc oxide, abbreviated ZnO, is an inorganic compound. ZnO is a white powder that is water insoluble. According to the manufacturer, the properties of zinc oxide are shown in Table 5. Moreover, Figure 2 displays the XRD of nps-ZnO.
Table 5.
Properties of ZnO.
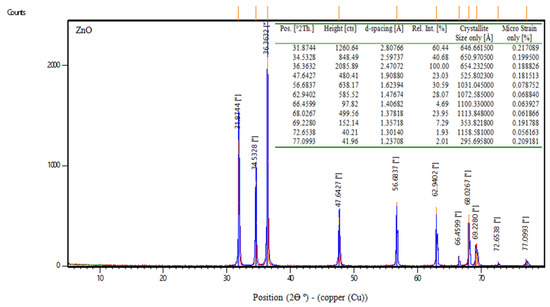
Figure 2.
XRD data of nps-ZnO.
2.1.4. Water
In this study, fresh tap water and salt water were used.
- For fresh tap water: the samples were cast in clean, impurity-free (lacking impurities, such as salts, organic compounds, acids, oils, etc.) fresh tap water, which was also employed in the fresh tap-water-curing series. In accordance with ASTM D 1193 [34], it was also devoid of silt, clay, and other elements that could have harmed the steel-reinforced concrete or other materials. The water used for mixing, nevertheless, had a pH of 7.
- For salt water: water for the series of seawater cures came from Qaroun Lake in Al-Fayoum, Egypt. Table 6 contains a list of this water’s chemical elements.
Table 6. The chemical properties of the water in Qaroun Lake.
2.1.5. Super-Plasticizers
In this study, the super-plasticizer Sikament®-NN, which has a density of 1.2 at 20 °C (its properties are shown in Table 7), is added to the fresh concrete to improve its workability. It complies with ASTM C494 [35] specifications (Type F). The ideal ratio for the super-plasticizer to improve the workability of the mixture without lowering its mechanical strength is 1% of the weight of the cement.
Table 7.
Technical Data for Super plasticizer Sikament®—NN.
2.1.6. Phenolphthalein Solution (Phph Dye)
Phenolphthalein Solution (Phph Dye) is both a chemical substance and a dye. It is used for the determination of photocatalytic activity. In this study, the phenolphthalein detector and manual (Phph) were used. In order to obtain a 1000 ppm concentration, 0.125 g of phenolphthalein were added to 75 mL of sodium hydroxide and supplemented with 50 mL of distilled water. A total of 0.5 g of phenolphthalein was added to 75 mL of sodium hydroxide, which was then diluted with 50 mL of distilled water to achieve 4000 ppm.
2.2. Concrete Mix Design
2.2.1. Features of Concrete Mixtures
In this study, three series were used. The first one was the concrete cubes (100 mm) used for the compressive strength test, the second was the prismatic specimens (40 mm × 40 mm × 160 mm) used for the cement mortar to evaluate self-cleaning tests, and the third was the cylindrical specimens with a diameter of 70 mm and a length of 100 mm used for the corrosion test. The control mix in this research was created to provide 30 N/mm2 of compressive strength after 28 days of curing, with a water-to-binder/cement ratio (w/c) of 0.45 for the used mixes. The mix’s proportions are listed in Table 8 for reference. This mixture produced compressive strengths of 28.9 and 44.5 N/mm2 for 7 and 28 days, respectively.
Table 8.
Mix design.
2.2.2. Preparing Mixes
- First, all the components were weighed: the cement, the dolomite, the sand, and finally the water, including the superplasticizer and nano-materials for the TiO2 and ZnO specimens.
- For the concrete mixes of cubes and cylinders, mixing was performed in the mixer. Firstly, the dry components—dolomite, cement, and sand—were mixed for one minute before adding another ingredient. Then, water was added, including the superplasticizer (with or without nano-materials), and was mixed using a stirrer. The mixing process should take at least two minutes after adding the dry components, and one minute after adding the water.
- For the mortar mixes of prismatic specimens, mixing was performed by hand. Firstly, water and nps-TiO2 or nps-ZnO were mixed together by using a stirrer for a further 5–8 min to provide a uniform distribution. Then, the superplasticizer was added to them during the mixing. Thereafter, cement and sand were introduced. Then, the previous mixture was added to the cement and sand, and they were mixed for a further 5 min to obtain a homogeneous mix.
3. Experimental Plan
3.1. Compressive and Flexural Strengths
In this study, the compressive strengths were measured using 100 mm cubes. Prisms of (40 mm × 40 mm × 160 mm) were used to evaluate the compressive and flexural strengths. The vibrating table and vibrating machine were used to compact the slides after filling them with the mortar mixture. All of the control and nps-TiO2 samples were demolded after 24 h and then cured for 7, 28, and 90 days in the required water; however, the nps-ZnO samples were demolded after (7–14) days, depending on the weather, and then cured for 7, 28, and 90 days in the required water in accordance with ASTM C 192 [36]. The samples were removed from the curing water a day before the test. First, by using the testing machine, the samples were loaded gradually until they fractured, and only for specimens whose breakage took place in the middle of the slide was the load of the crack recorded. The flexural strength of the concrete in N/mm2 was calculated from the Equation (1). Following that, the specimens were consistently loaded using the compressive machine, and the load was registered when failure occurred in half of the slide. The compressive strength (N/mm2) is obtained by dividing the rupture load (N) by the cross-sectional area (mm2).
where (σf) expresses the flexural strength of the concrete in N/mm2 and P is the fracture load in Newton. In addition to A, B, and L are the width, depth, and length of the beam, respectively, and they are all measured in mm.
3.2. Corrosion Rate
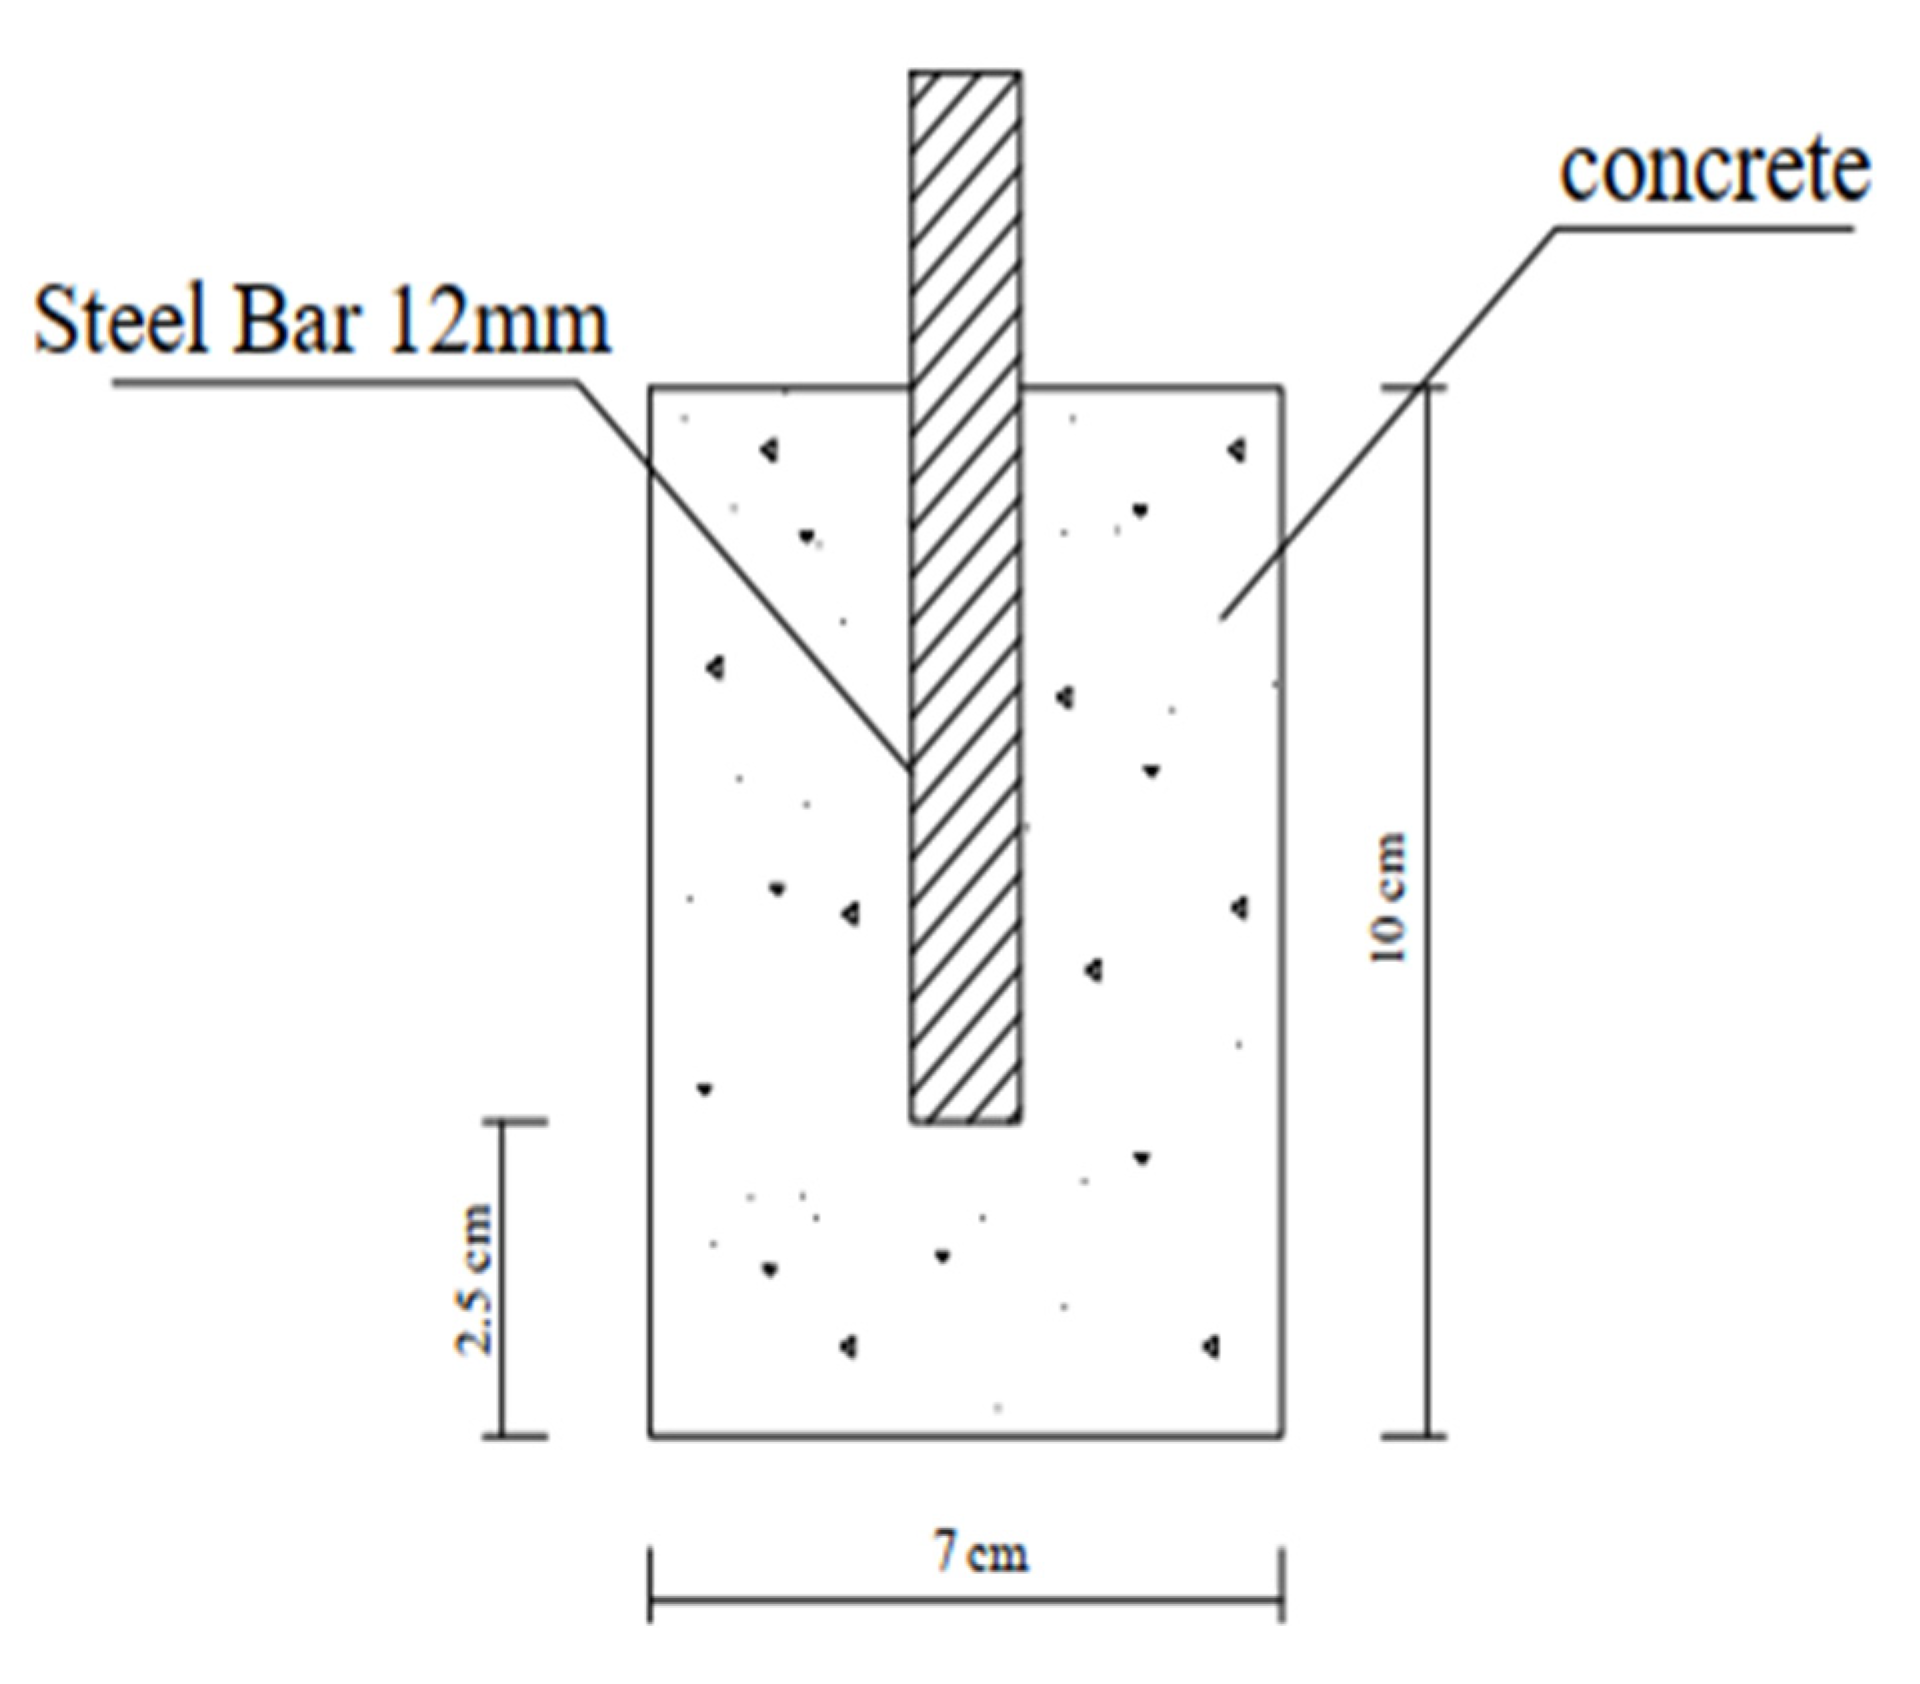
The corrosion rate was determined using cylindrical specimens, as shown Figure 3 (diameter of 70 mm and length of 100 mm) with a 12 mm diameter and a 100 mm long rebar in their middle. The cylinders were cast using the mix, with the rebar positioned vertically, in the center, and parallel to the long side of the mold, where Figure 3 shows the position of the rebar in the middle and parallel to the length of the cylinder. Layers of the mix were filled in the mold, and after being equally distributed, the mold was compacted in the vibrating table. After 24 h, the control and nps-TiO2 samples were demolded and allowed to cure for six months in the determined water (fresh or salt water), but nps-ZnO samples were demolded after (10–14) days and also cured in the determined water (fresh or sea water) for six months. Potentiostat was used to measure corrosion parameters (electronic hardware to control the 3-electrode-cell that runs the electro-analytical experiments). To obtain the corrosion rate, a linear polarization resistance (LPR) (5.1.0) test was used.
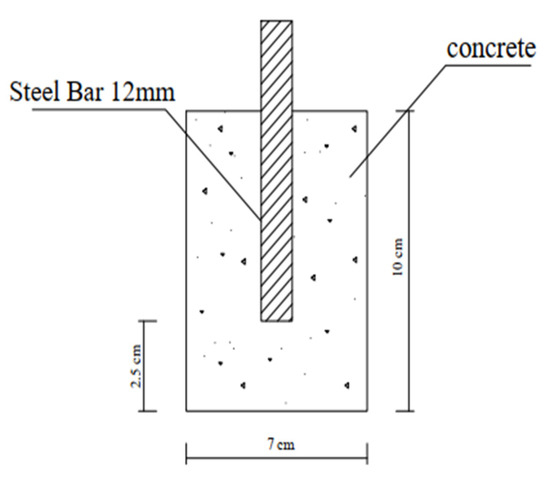
Figure 3.
Schematic diagram of the cylindrical sample.
Linear Polarization Resistance (LPR)
The LPR test is one of the non-destructive tests used to determine corrosion rate because it is a simple and easily applicable test. It is obtained through a potentiostat connected to a computer running the software VOLTAMASTER 4, and a corrosion container with a three-part electrode (the reference electrode, the working electrode, and the counter electrode). Before the test, the tested cylinders must spend 10–15 min submerged in the water to make sure the specimens are fully saturated, which is necessary to determine the corrosion rate accurately. The potentiodynamic polarization set-up is shown in Figure 4.
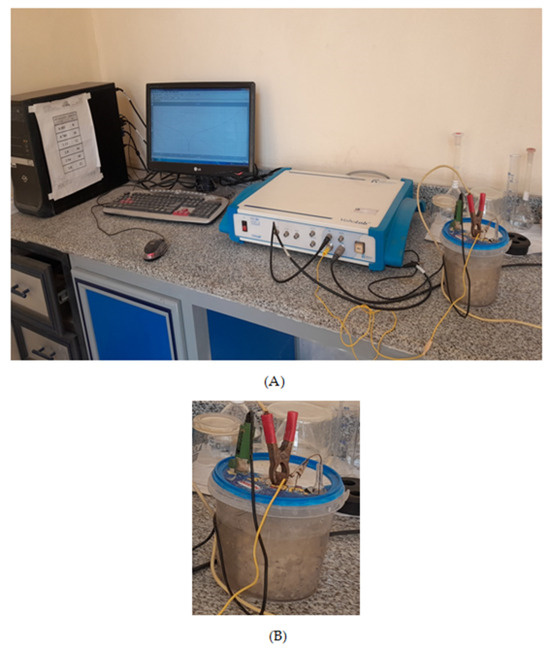
Figure 4.
Corrosion potential testing set-up: (A) corrosion potential testing setup during test; (B) the tested sample submersed in fresh tap water.
3.3. Phenolphthalein Discoloration Test
In this test, the concrete’s ability to self-clean is determined by the exposure of samples to sunlight or UV light. The Phenolphthalein solution (Phph) is applied on surfaces subjected to irradiation under sunlight or UV light. On the surface of the casted concrete cubes, 10 mL of Phph dye is dropped on each sample and placed under direct sunlight or UV light. The discoloration of Phph under natural sunlight takes up to 3 h after irradiation has been conducted. After 1 h and 3 h, the samples were observed visually to find the degradation of (Phph) on the concrete surfaces. To test the samples under UV light, a simple apparatus was prepared, as shown in Figure 5.
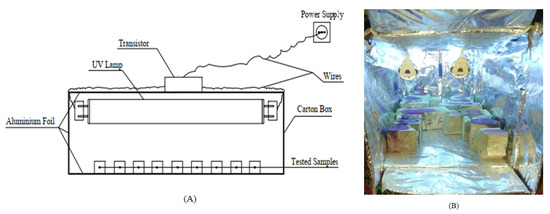
Figure 5.
Schematic diagram for UV light set-up: (A) the apparatus and (B) the apparatus during the test.
3.4. Instrumentation
3.4.1. Scanning Electron Microscope (SEM)
The microstructure of self-cleaning concrete samples is identified through SEM analysis. The shape, content, and crystallography of the specimen microstructure are clarified and described using SEM technology. The crushed chips from the studied samples in this study were gathered for microscopic characterization. Since concrete is regarded as a conductive material, the concrete chips were coated with gold to stop the concrete molecules from charging with electrons. The use of flat and thin chips allowed for the collection of images with great quality, contrast, and brightness while avoiding charging any surface flaws.
3.4.2. Energy Dispersive X-ray Spectroscopy (EDX)
EDX is one analytical method for chemical or analytical characterizing materials. The EDX is utilized as a supplement to the semi quantitative analysis. EDX analysis yields the element proportion or atomic proportion of each element as a result. A spectrum produced by EDX analysis shows the peaks associated with the sample under the investigation’s elemental makeup. This characterization technique can also be used to construct a sample’s elemental mapping. The EDX study used the identical chips that were chosen for the SEM investigation.
4. Results and Discussion
4.1. Compressive Strength Test
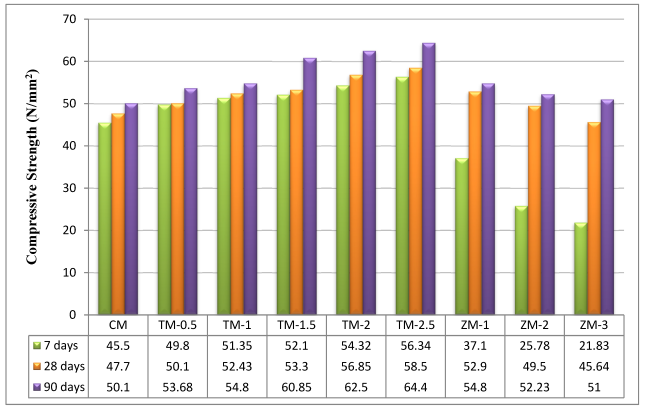
The values of the control and the nano-material specimens’ compressive strengths after 7, 28, and 90 days of curing in fresh tap water are listed in Figure 6. Figure 6 compares the compressive behaviors of fresh tap-water-cured nps-TiO2 mixes (TM-0.5, TM-1, TM-1.5, TM-2, and TM-2.5), and nps-ZnO mixes (ZM-1, ZM-2, and ZM-3) to the control mix (CM). The strengths of the fresh tap-water-cured control mix were used as a guide for the corresponding curing intervals. According to the results, the compressive strength for nps-TiO2 mixes improved with increasing nps-TiO2 concentrations (as shown in Figure 6), and the optimum values were recorded with 2.5% of nps-TiO2. The increment ratios of the sample containing 2.5% of nps-TiO2 are 23.82%, 22.64%, and 28.54% at 7, 28, and 90 days, respectively. The increase in compressive strength with 2.5% of nps-TiO2 is attributed to nps-TiO2’s non-reactive fine filler properties, which reduced porosity, lacked pozzolanic activity, and played a significant role in ensuring cement matrix homogeneity [22,37,38,39,40,41]. Nps-TiO2 can also speed the formation of C-S-H, lower CH crystallization, and raise the hydration degree in the early stages [42]. Nevertheless, the optimal nps-ZnO percentage for samples was 1%, as increasing nps-ZnO percentages decreased compressive strength compared with ZM-1. These results are consistent with those reported by Nayak et al. [43], Liu et al. [42], and Thangapandi et al. [44]. ZM-1 increased the corresponding strengths by 10.90% and 9.38% at 28 and 90 days, respectively. But the percentage was −18.46% at 7 days. In light of this analysis, it is important to note that the compressive strength results for nps-ZnO specimens at 7 days were lower than those for the control mix. This is because nps-ZnO has an impact on the strength and setting time of concrete, particularly at early stages because it decreases the cement’s degree of hydration. These findings support what was noted by Liu et al. [42], Nayak et al. [43], Kumar et al. [45], and Garg et al. [46], which may be linked to the reaction between nps-ZnO and CH, per Equations (9)–(12) [43]. Consequently, at 7 days, the cement mortar containing nps-ZnO particles had a lower degree of hydration than the control. This fact may be connected to the following interaction between Ca(OH)2 and nps-ZnO [47], as shown in Equation (12). This reaction creates a layer on the surface, which restricts the transport of water to C3S and slows the setting time. Moreover, due to the filler action of nps-ZnO [42,47,48] at 28 days, the improvement of compressive strength was significant.

Figure 6.
The specimens’ compressive strengths after 7, 28, and 90 days of curing in fresh tap water.
4.2. Flexural Strength
The values of the control and nano-specimens’ flexural strengths after 7, 28, and 90 days of curing in fresh tap water are listed in Figure 7. According to the current results, the optimal value for nps-TiO2 is TM-1 (1%). The increasing percentages for this sample were about 33.46%, 33.33%, and 20% for 7, 28, and 90 days, respectively. The improved flexural strength may be due to the enhanced C-S-H gel formation that occurs in the presence of TiO2 nanoparticles. This is the same as what was researched by Nazari et al. [49]. Furthermore, because nps-TiO2 is a stable, non-reactive fine filler [22], it does not form a network capable of withstanding tensile pressures produced by the flexural load. For nps-ZnO, the results of this research show that the higher the nps-ZnO ratio the lower the flexural strength, and this is the same information that was investigated by Kumar et al. [45]. The increasing percentages for a sample containing 1% of nps-ZnO (the optimum ratio for samples of nps-ZnO) are 50.29%, 33.33%, and 16% at 7, 28, and 90 days, respectively.
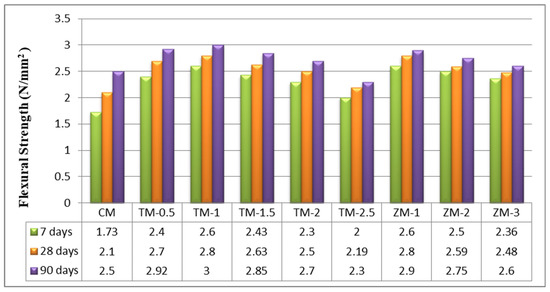
Figure 7.
The specimens’ flexural strengths after 7, 28, and 90 days of curing in fresh tap water.
4.3. Corrosion Rate
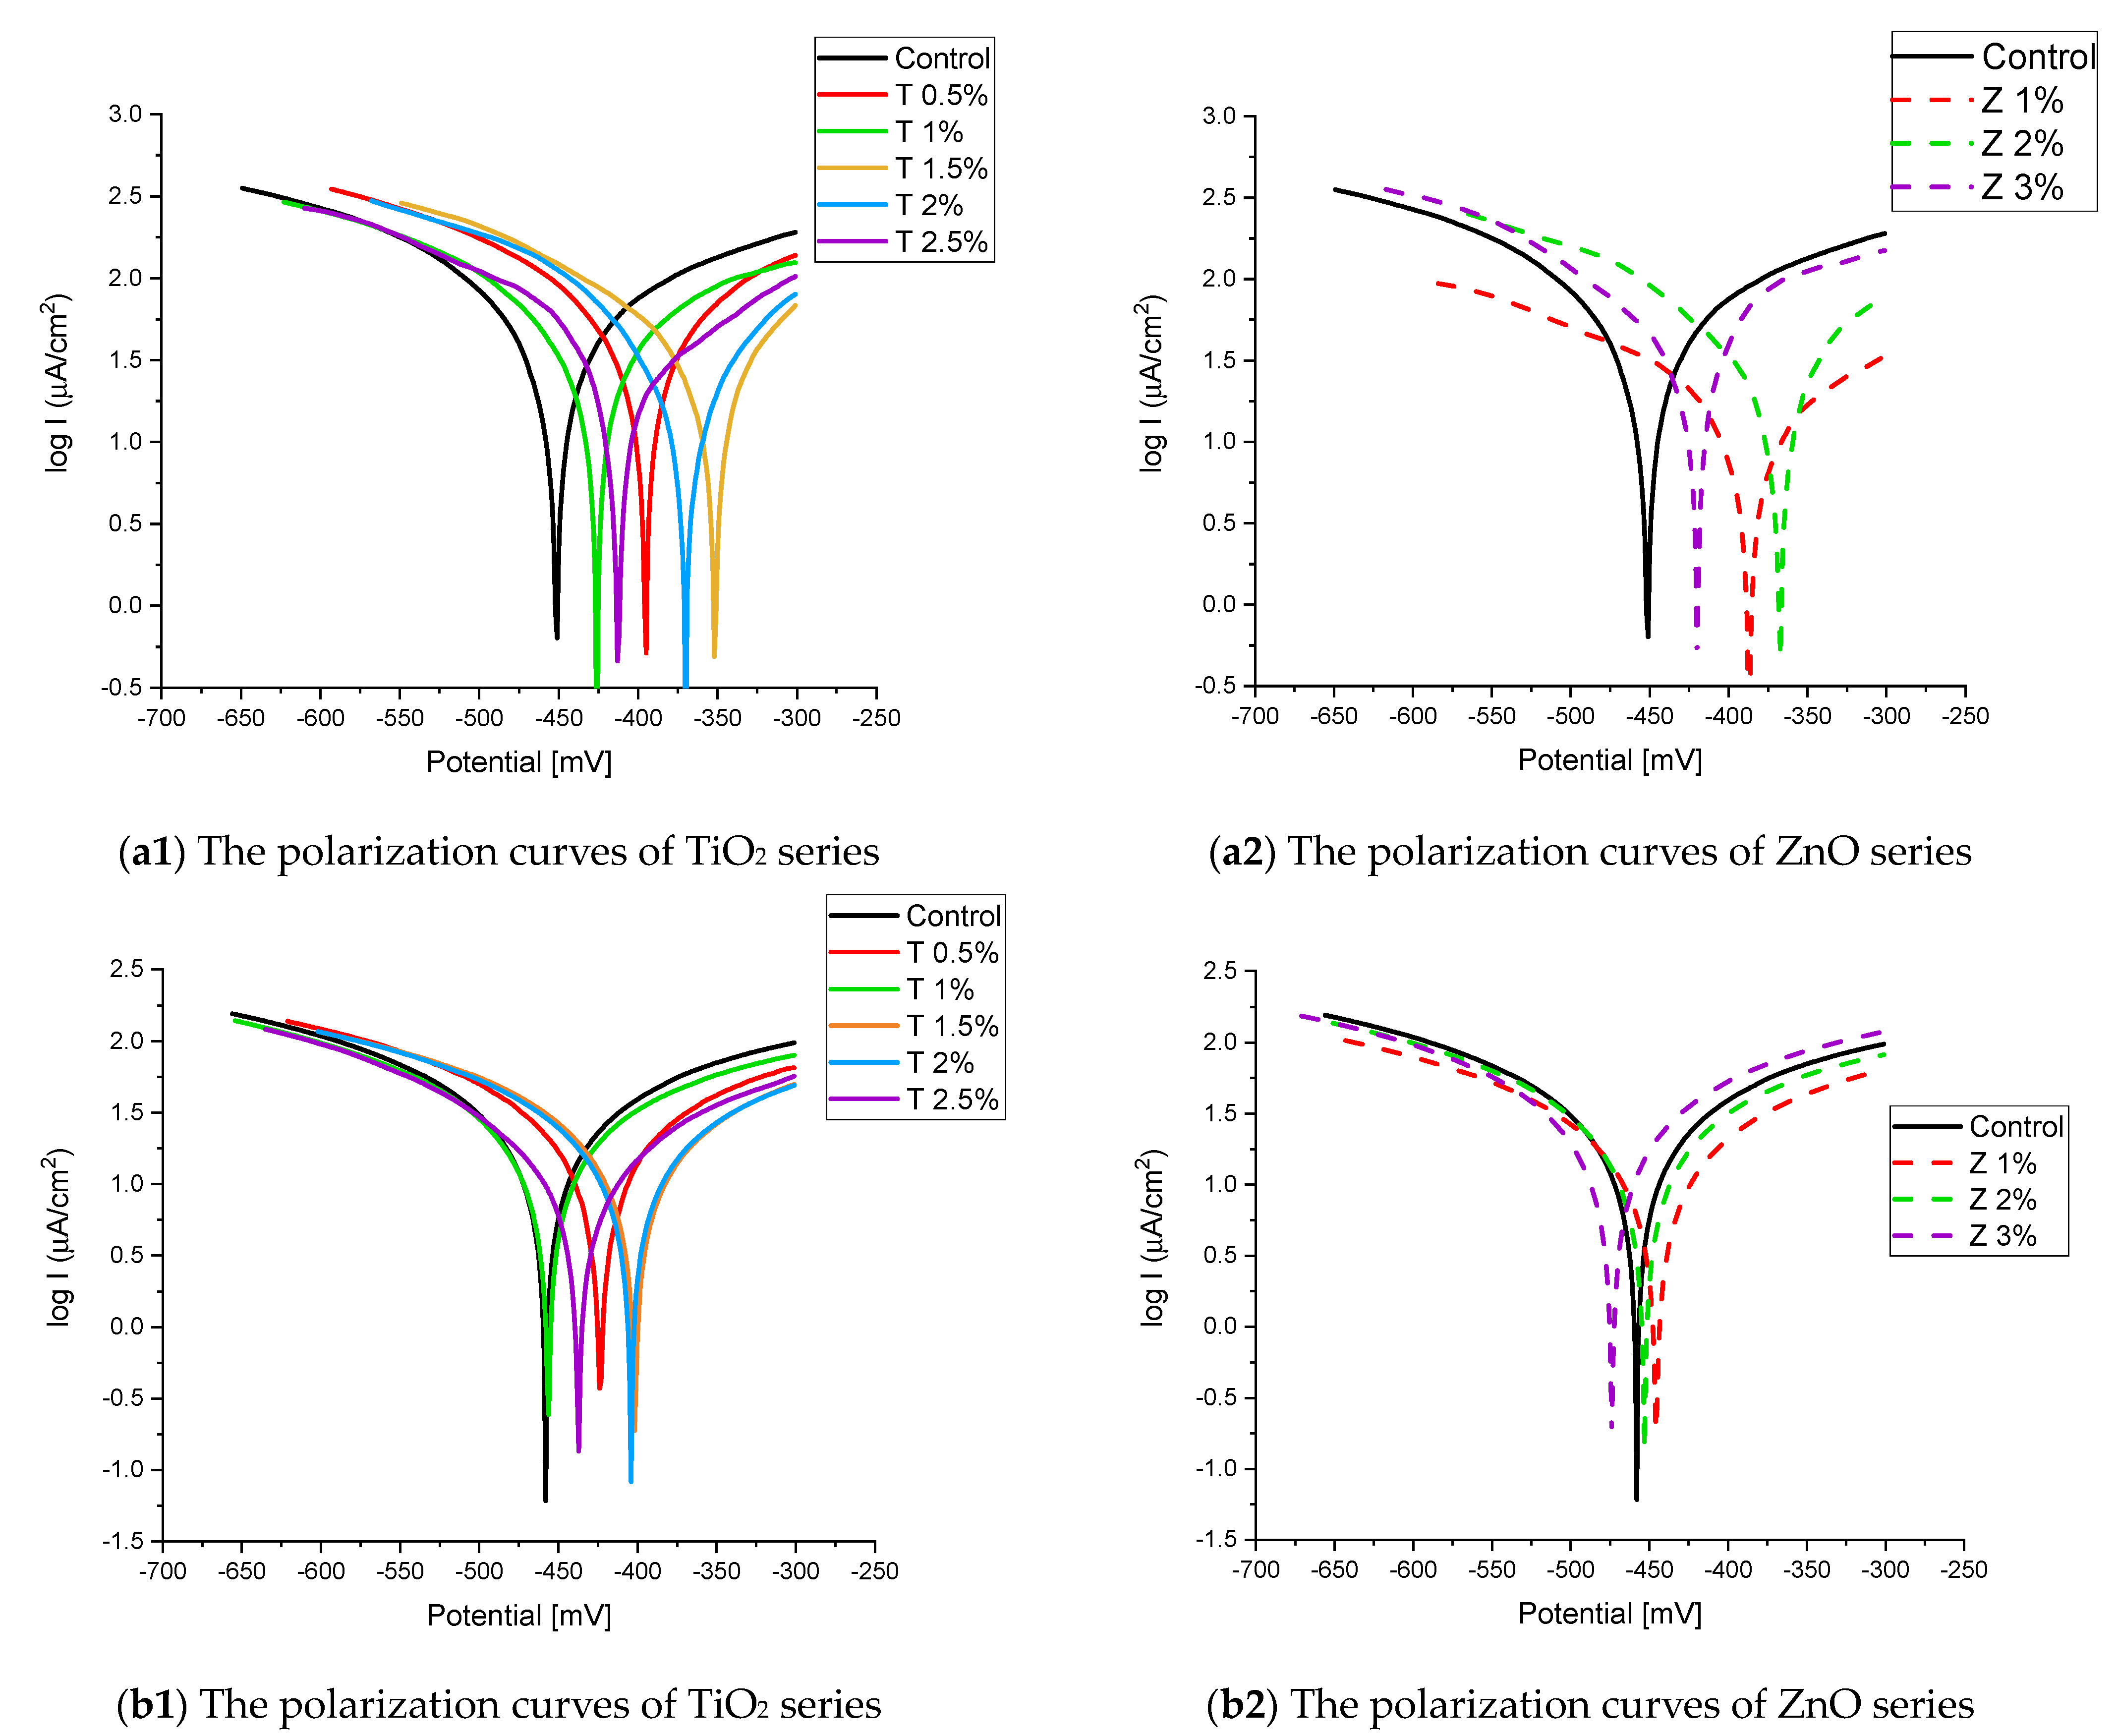
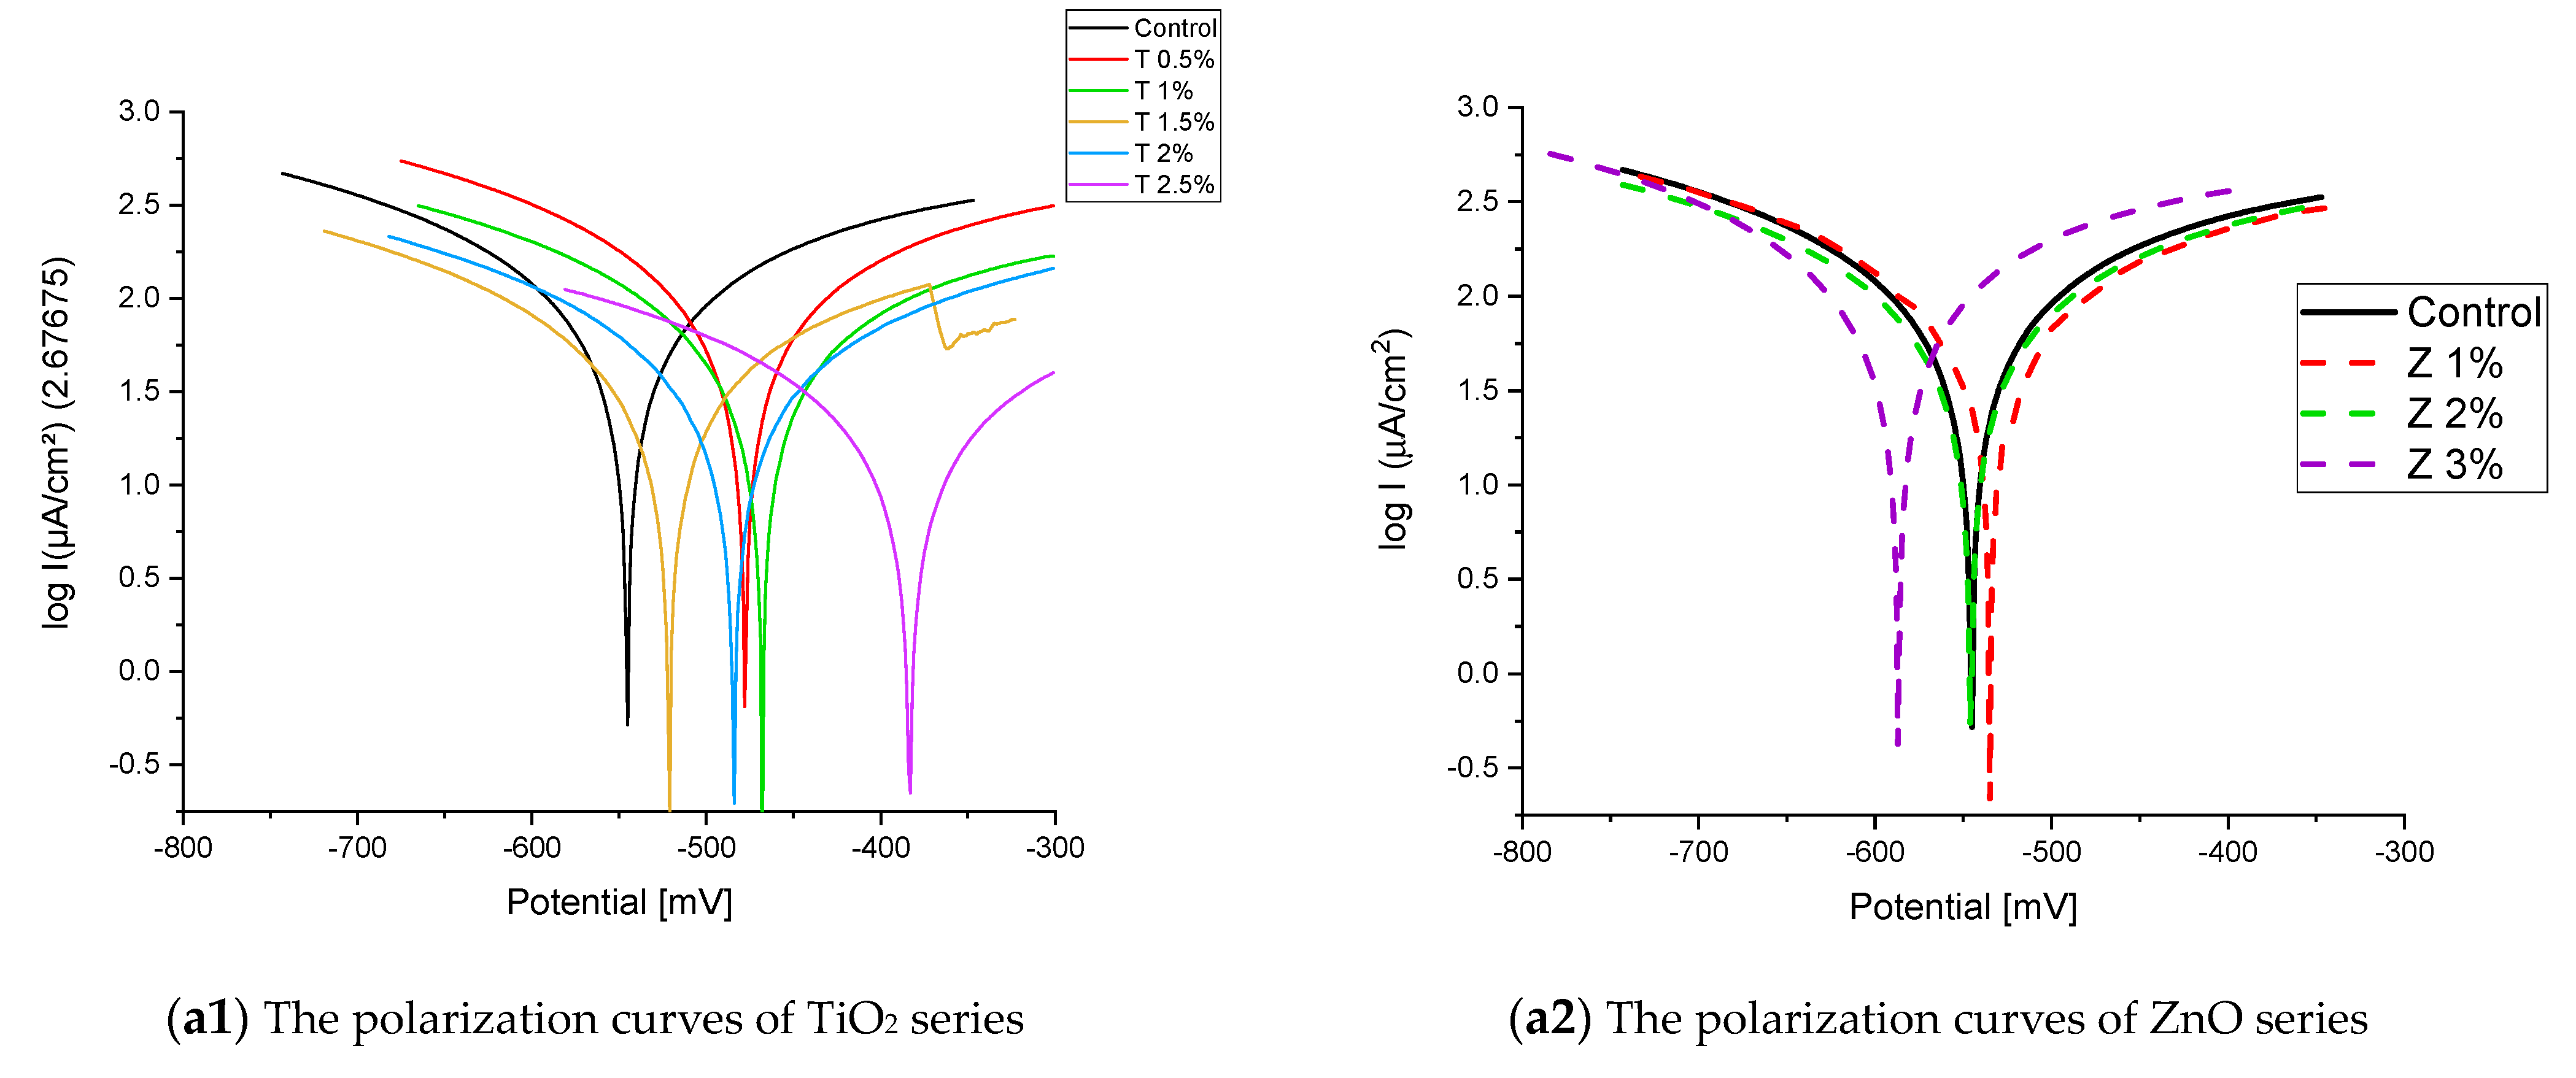
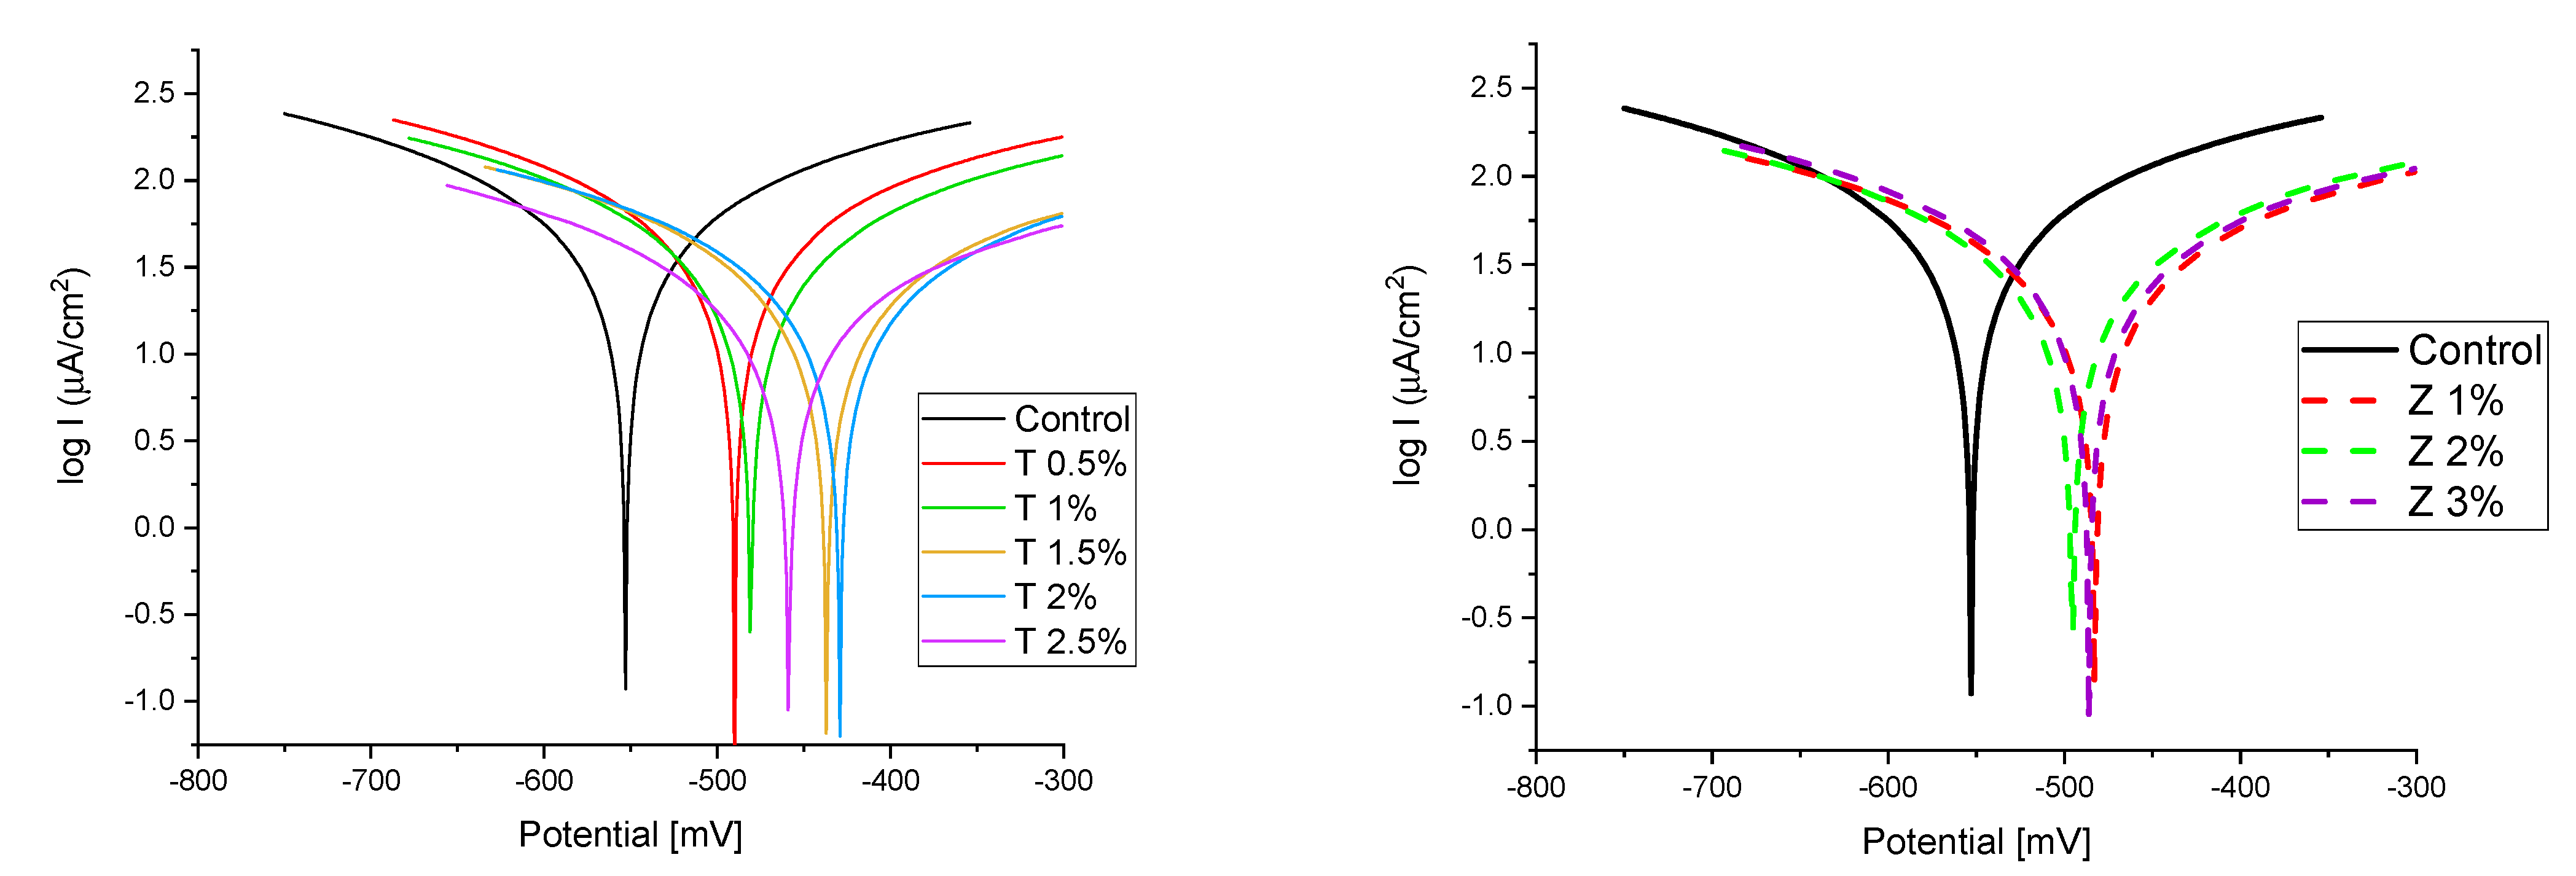
Figure 8 and Figure 9 show the Tafel potentiodynamic polarization curves for each specimen exposed to fresh tap water and salt water, respectively, after 2 and 6 months. For every mix, half of the samples were cured in fresh tap water (normal water) and the other half in water from Qaroun Lake (salt water). Previous research has shown that seawater negatively affects and damages concrete [50,51], and this study’s findings are in line with previous studies’ findings, as shown in Table 9, Figure 10, Table 10, and Figure 11. For nps-TiO2 specimens, according to this research, it can be noted that the corrosion rate gradually decreases with the increasing nps-TiO2 ratio. This may occur because nps-TiO2 increases the amount of C–S–H gel and decreases amount of pores [22,39,41]. On the other hand, for nps-ZnO samples, the results show that increasing the nps-ZnO ratio about 1% increases the corrosion rate (these results agreed with those noted by Thangapandi et al. [44]). This could be due to the fact that nps-ZnO delays the setting time [42,45]. The results of the inhibitor efficiency (ƞ) show that nps-ZnO samples have higher efficiency than nps-TiO2 samples, as illustrated in Table 11, Table 12, Table 13 and Table 14.
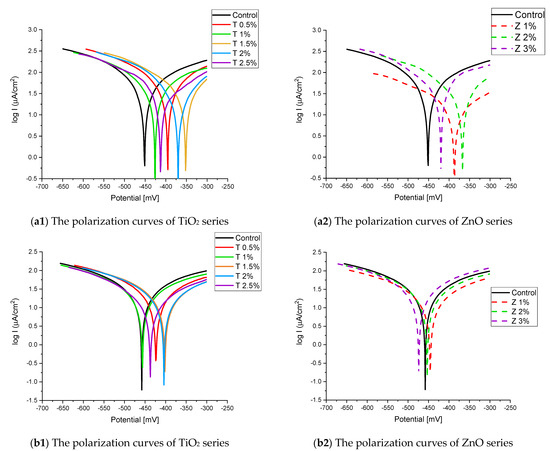
Figure 8.
The polarization curves of the tap-water-cured series: (a) after 2 months and (b) after 6 months.
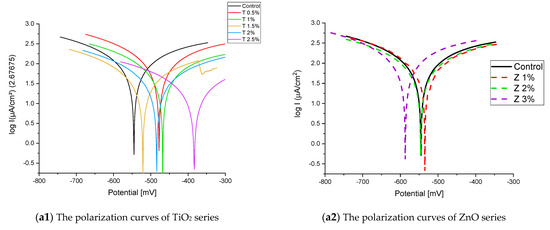
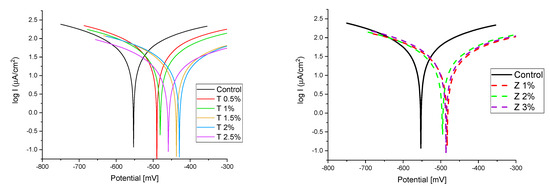
Figure 9.
The polarization curves of the Qaroun’s Lake water-cured series: (a) after 2 months and (b) after 6 months.
Table 9.
Corrosion rate at 2 and 6 months of exposure to fresh tap water.

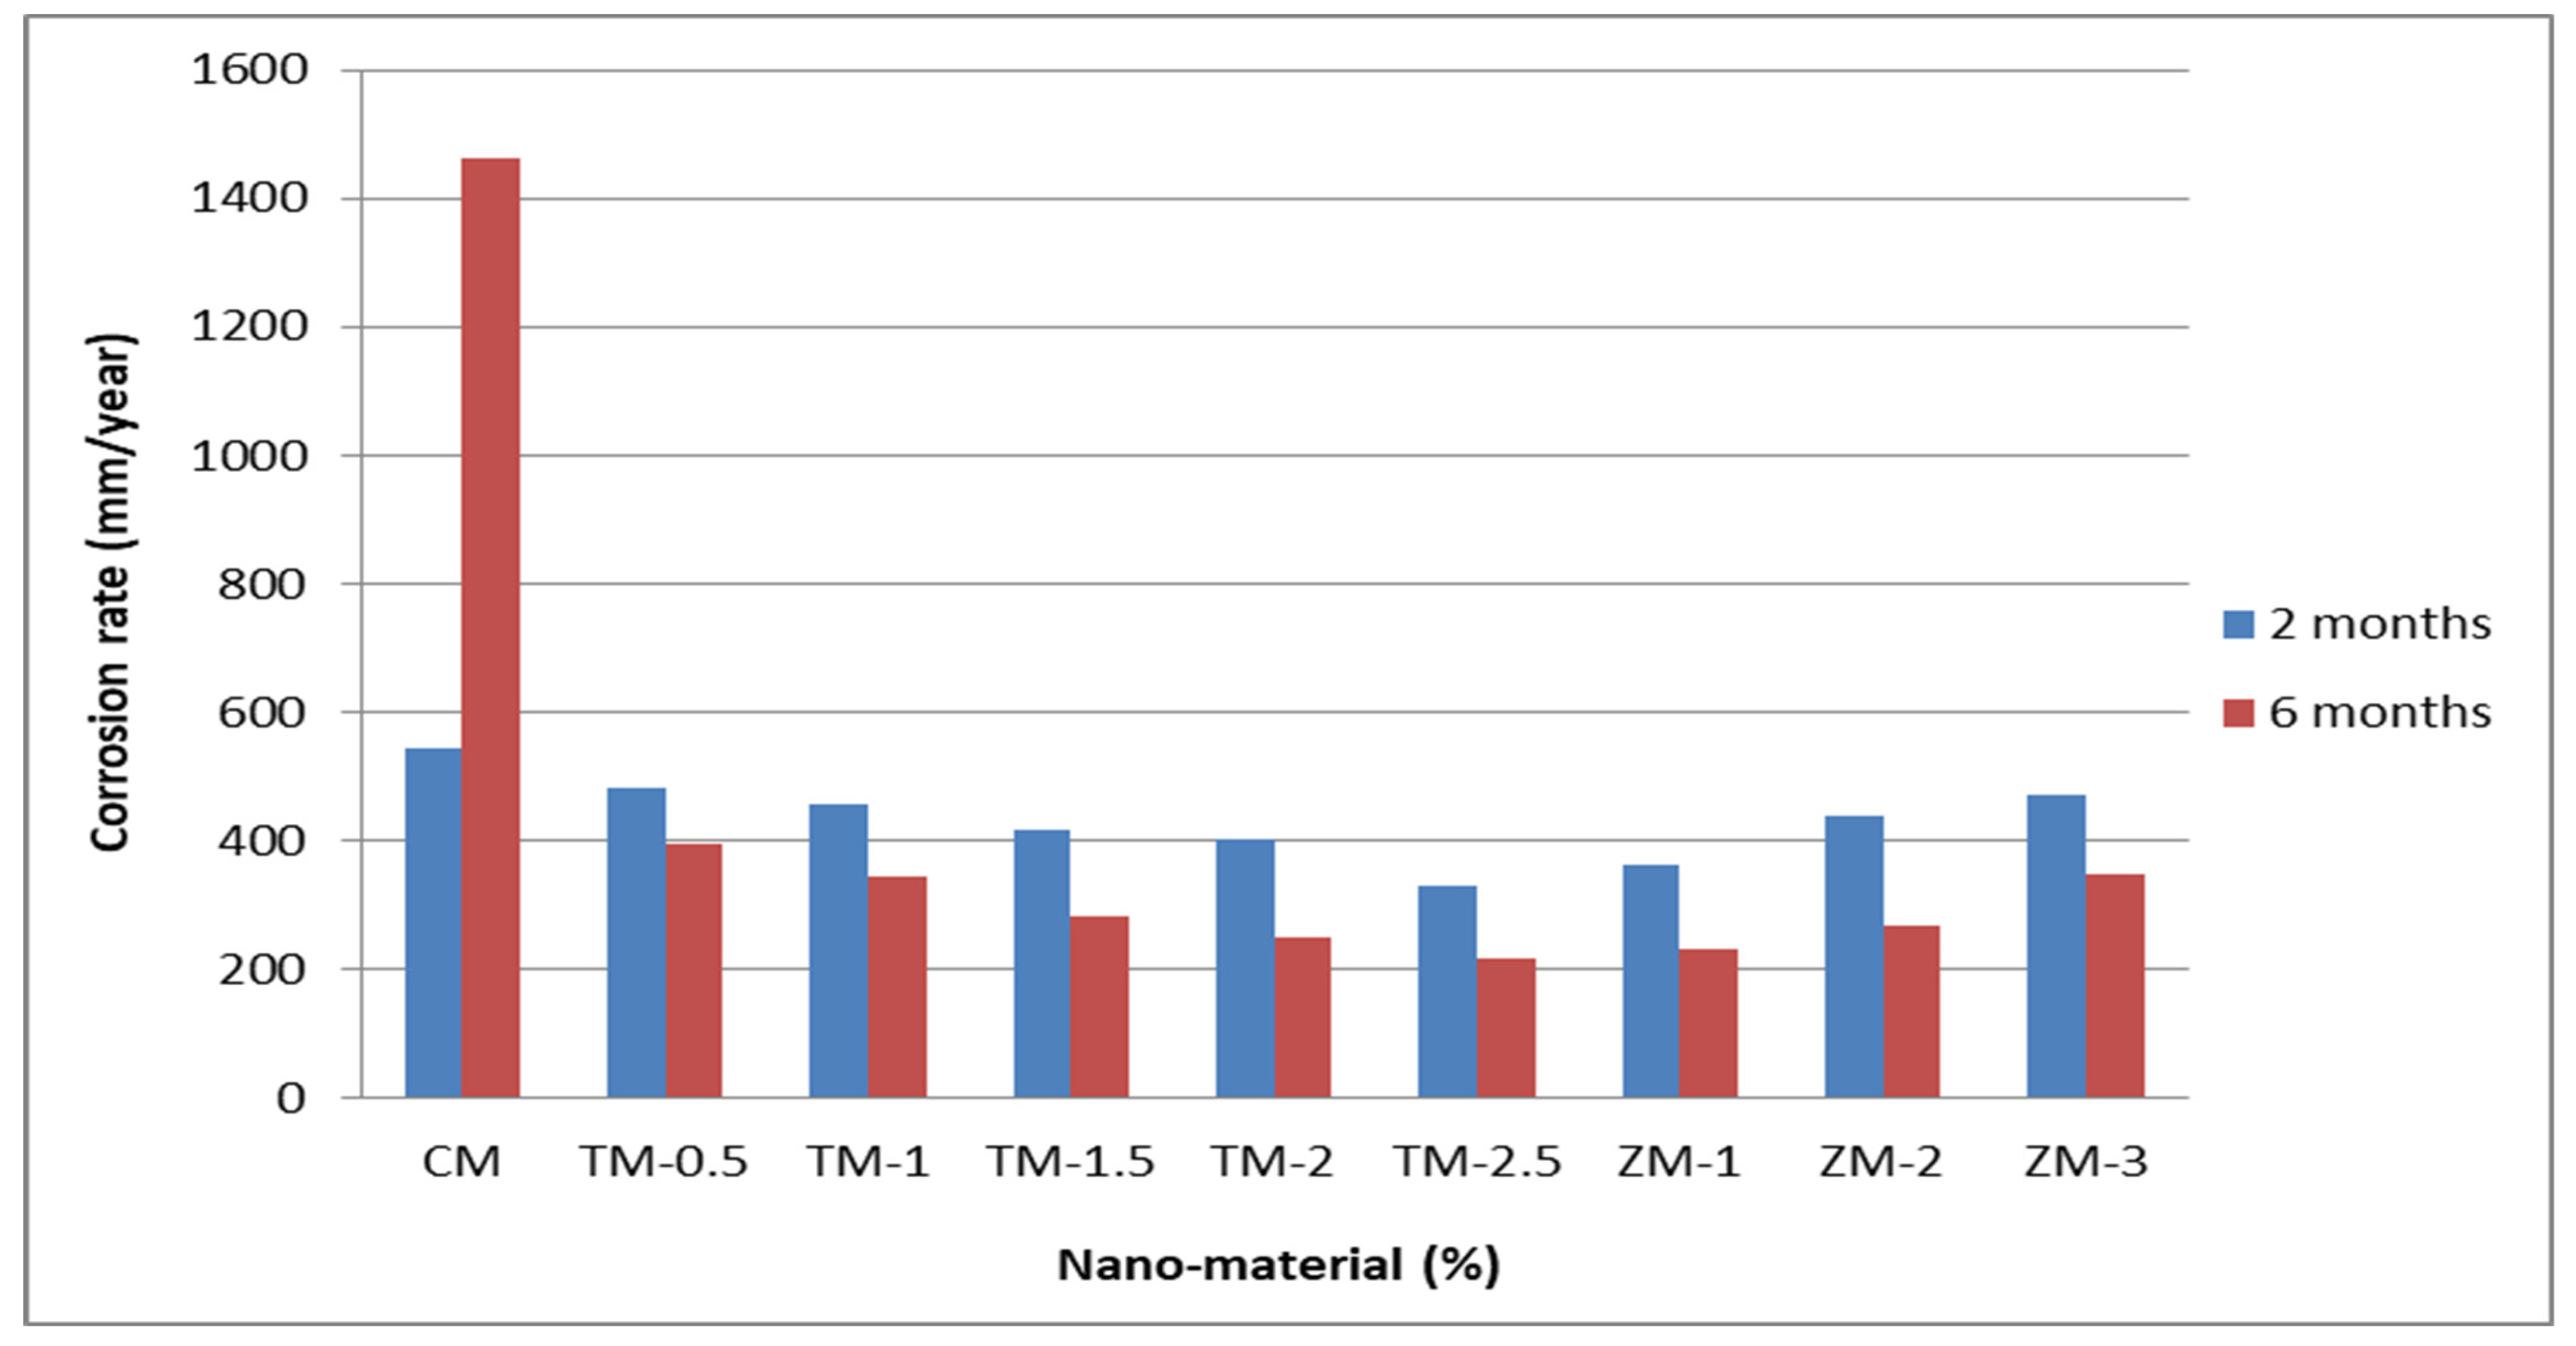
Figure 10.
Corrosion rate in rebar bars of specimens that were cured in fresh tap water.
Table 10.
Corrosion rate at 2 and 6 months of exposure to Qaroun’s Lake water.
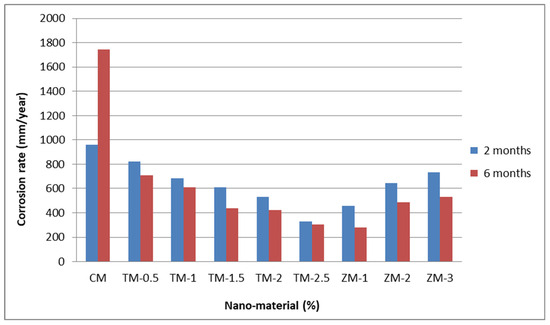
Figure 11.
Corrosion rate in rebar bars of specimens that were cured in Qaroun’s Lake water.
Table 11.
Percentages of inhibitor efficiency at 2 months for nps-TiO2 specimens.
Table 12.
Percentages of inhibitor efficiency at 2 months for nps-ZnO specimens.
Table 13.
Percentages of inhibitor efficiency at 6 months for nps-TiO2 specimens.
Table 14.
Percentages of inhibitor efficiency at 6 months for nps-ZnO specimens.
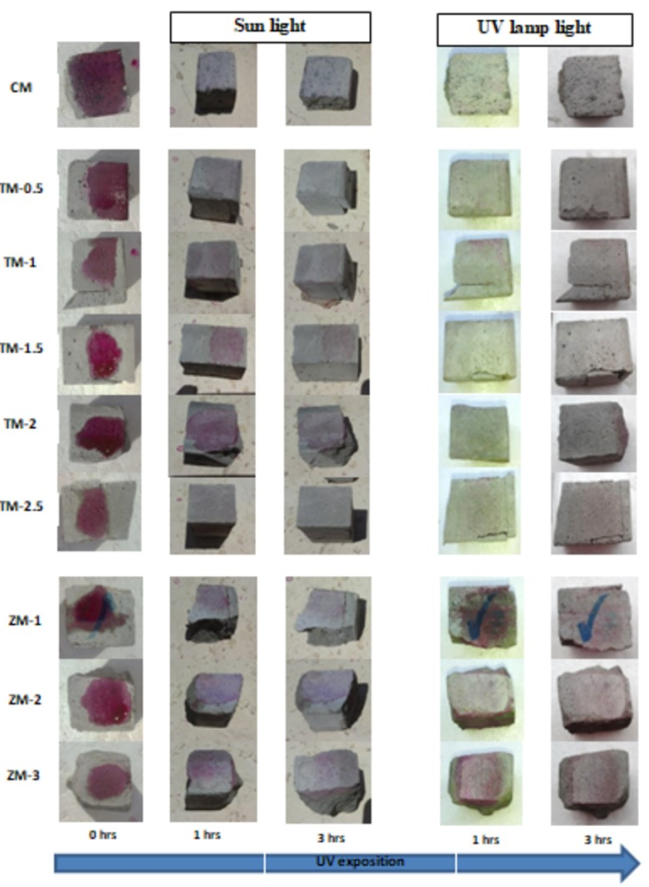
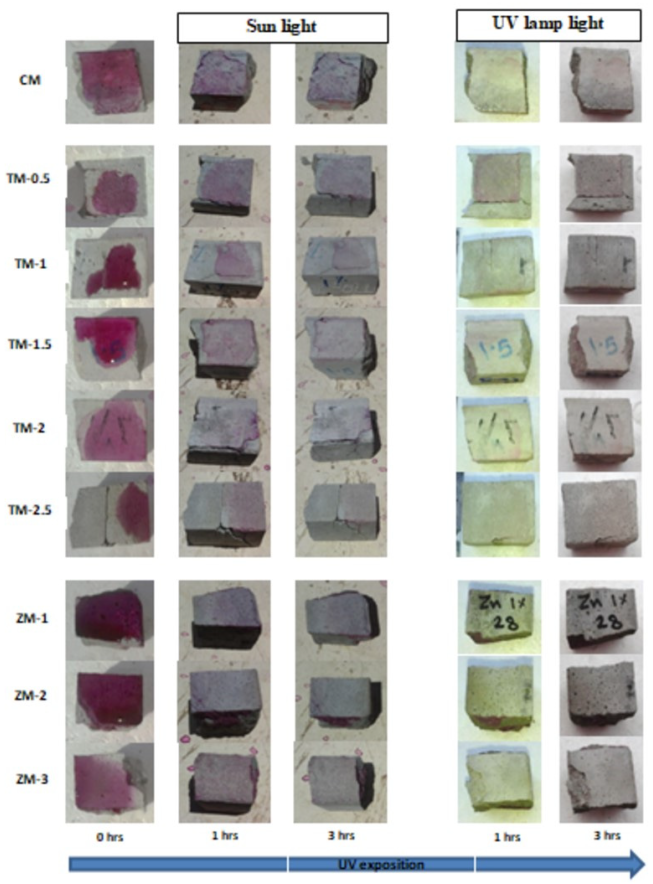
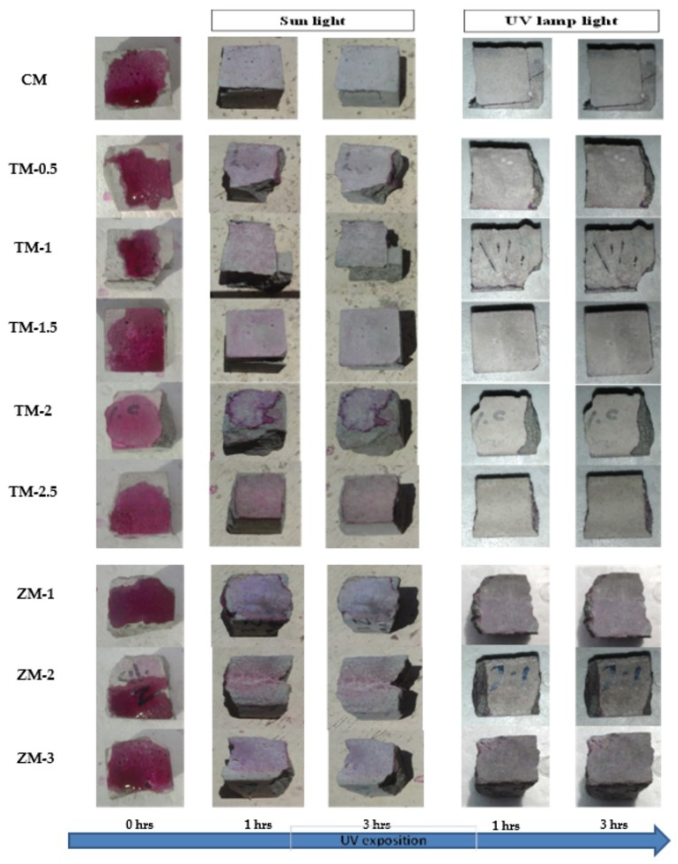
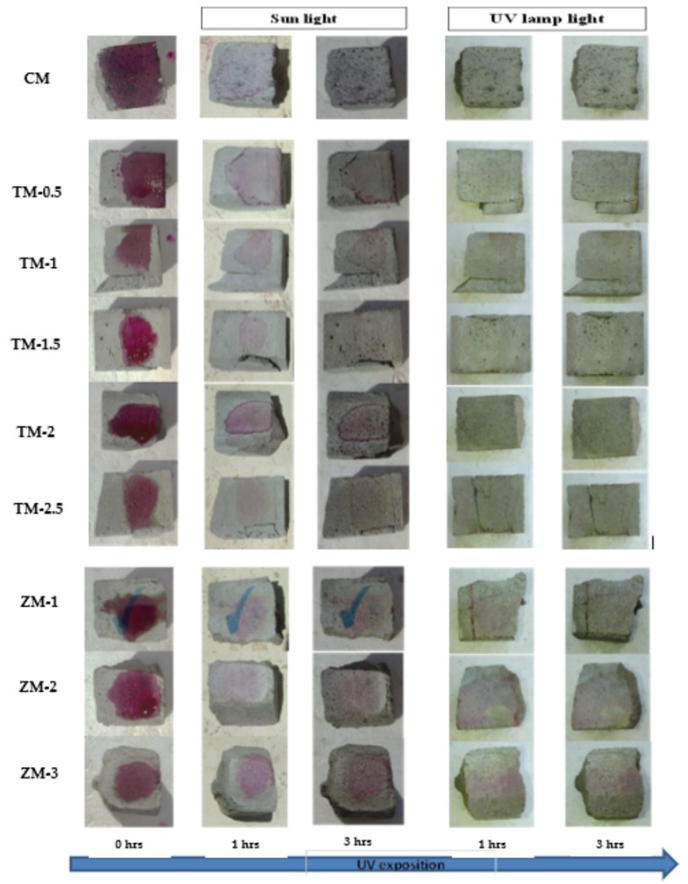
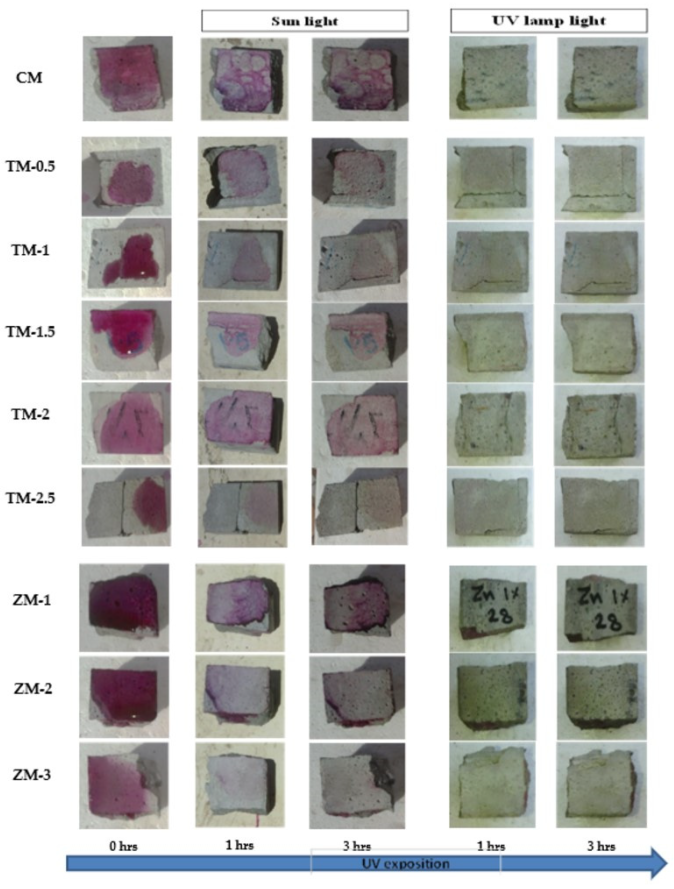
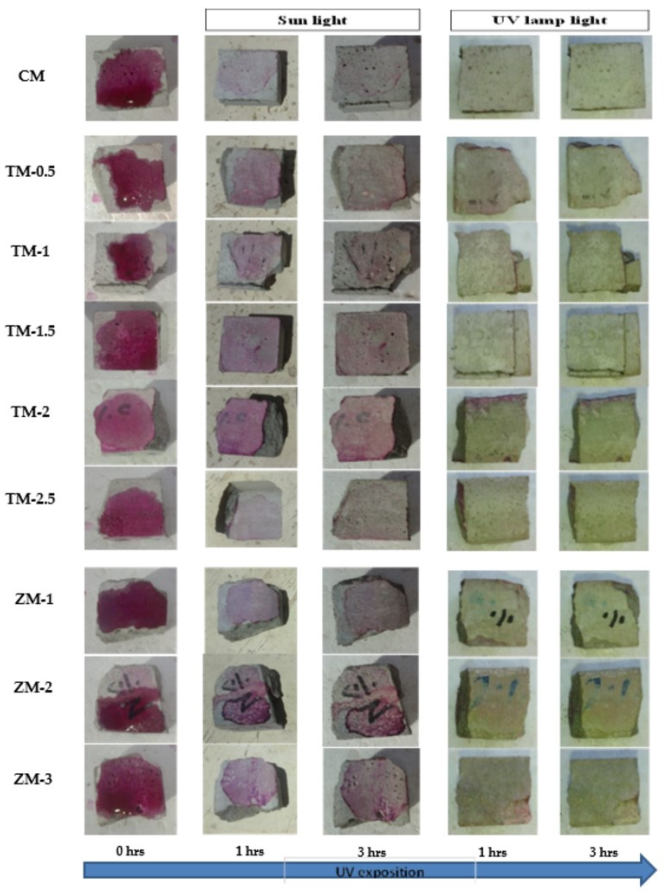
4.4. Results of Phenolphthalein Discoloration Test
Phenolphthalein Discoloration is a different approach that has been used to assess photocatalytic activity [52]. Depending on the duration of ultraviolet (UV) exposure, specimens colored with Phenolphthalein dye are shown in Figure 12, Figure 13 and Figure 14 at 1000 ppm concentration of solution and Figure 15, Figure 16 and Figure 17 at 4000 ppm concentration of solution. It is evident that as exposure time is increased, the samples are gradually self-cleaning because of photocatalytic degradation. The results show that nps-TiO2 samples give better results in general than nps-ZnO samples, like the one described by Amor et al. [52], but these results are in contrast with those reported by K. Loh et al. [53]. For nps-TiO2 samples, by increasing the titanium content, the sample’s ability to self-clean improves; this result is similar to the argument made by Amor et al. [52]. For UV-lamp light, the results of the samples are much better compared to the effect of sunlight, but titanium samples are still better than zinc samples. Noting all the results, we find that the TM-2.5% sample always gives the best result in all stages, even with the increased concentration of the solution.

Figure 12.
Phenolphthalein discoloration based on the duration of sun light and UV exposure for the specimens at 7 days of curing using 1000 ppm concentration of solution.
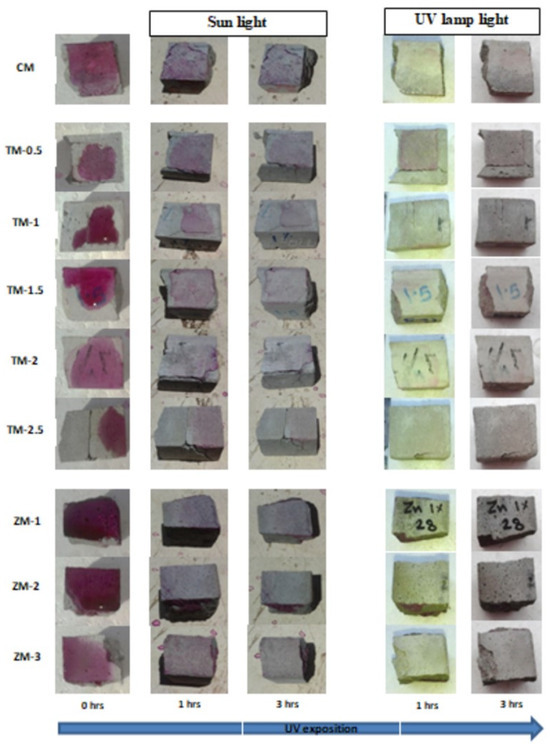
Figure 13.
Phenolphthalein discoloration based on the duration of sun light and UV exposure for the specimens at 28 days of curing using 1000 ppm concentration of solution.
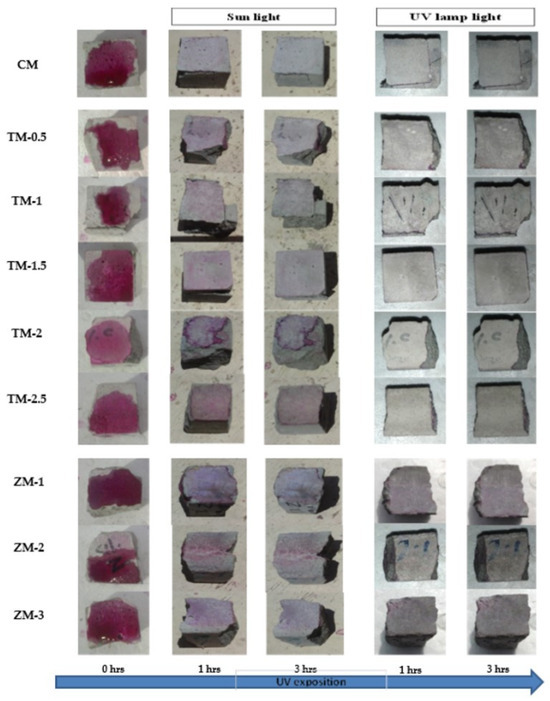
Figure 14.
Phenolphthalein discoloration based on the duration of sun light and UV exposure for the specimens at 90 days of curing using 1000 ppm concentration of solution.

Figure 15.
Phenolphthalein discoloration based on the duration of sun light and UV exposure for the specimens at 7 days of curing using 4000 ppm concentration of solution.
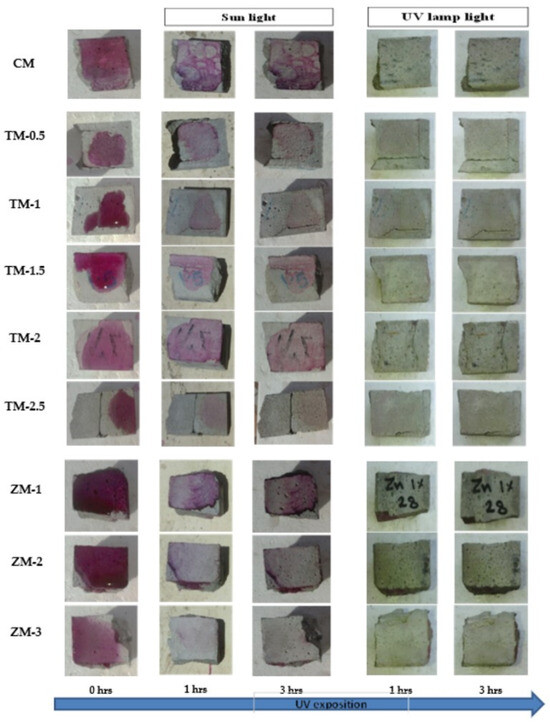
Figure 16.
Phenolphthalein discoloration based on the duration of sun light and UV exposure for the specimens at 28 days of curing using 4000 ppm concentration of solution.

Figure 17.
Phenolphthalein discoloration based on the duration of sun light and UV exposure for the specimens at 90 days of curing using 4000 ppm concentration of solution.
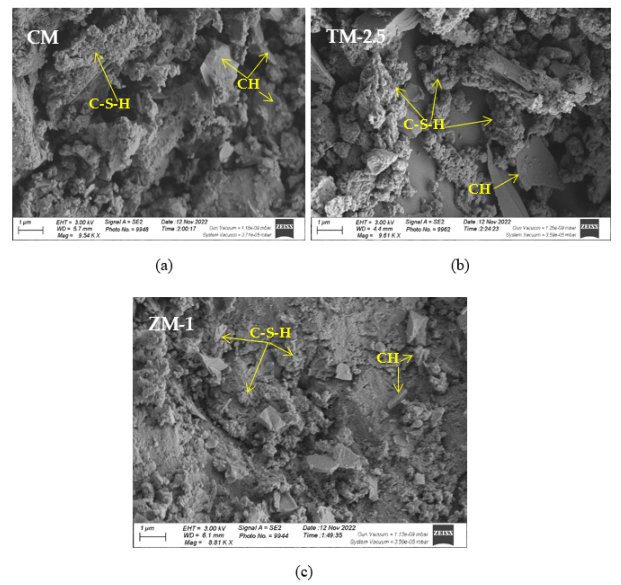
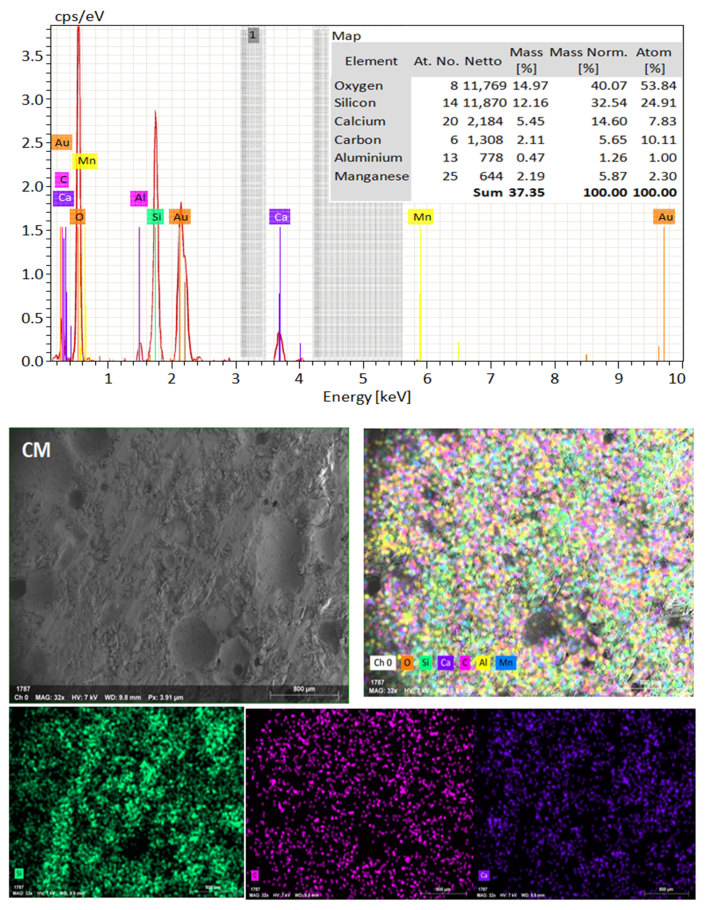
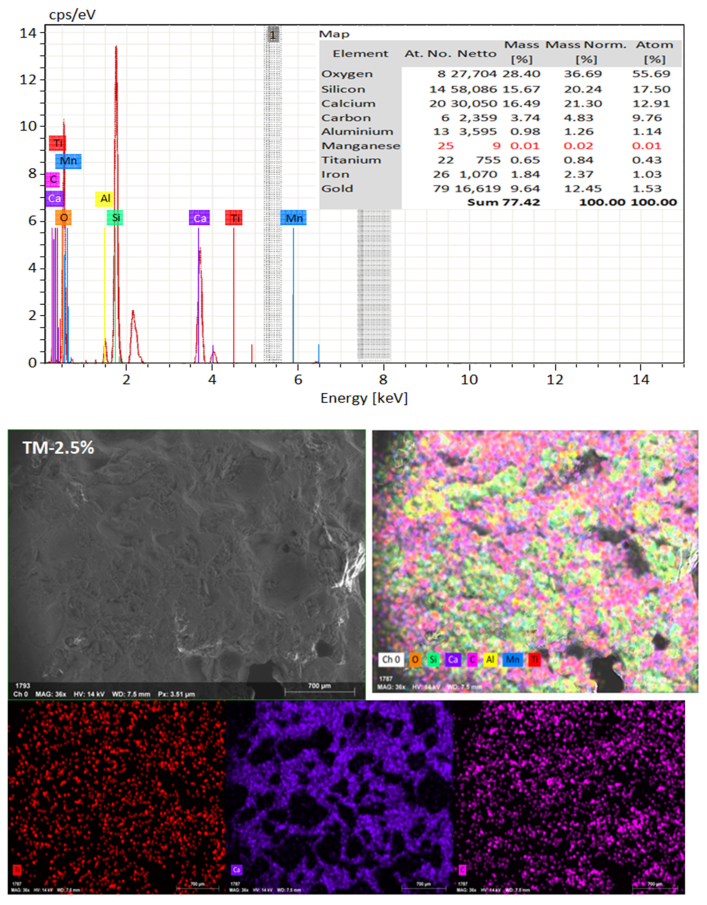
4.5. Microstructure Analysis
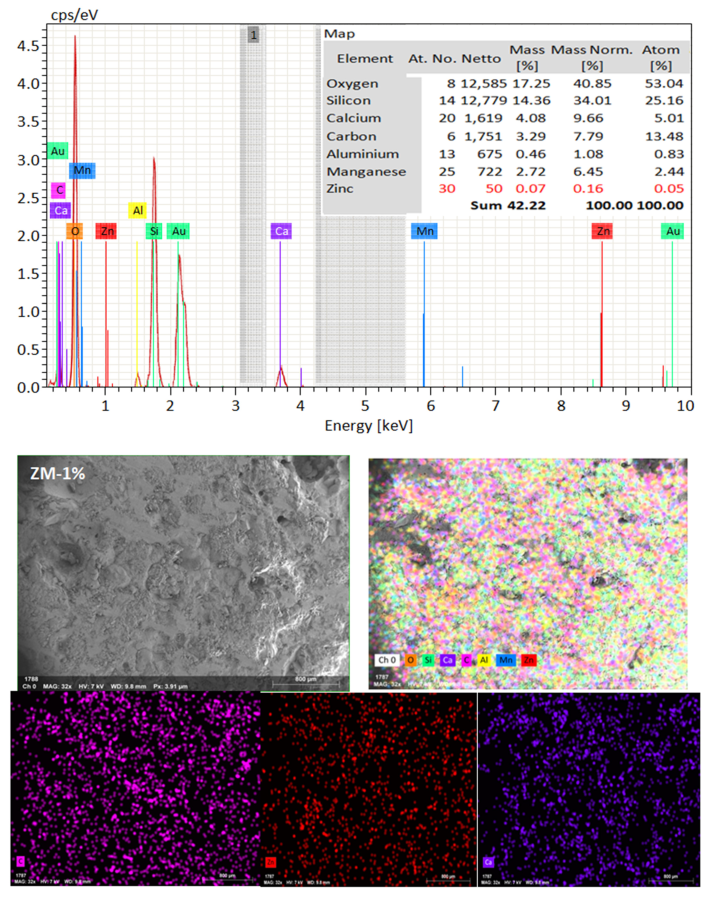
SEM frequently does in-depth microstructure examination, as illustrated in Figure 18, which displays the SEM images of the control, TM-2.5%, and ZM-1% samples at 90 days. For the control sample, there are many large-sized pores. Conversely, nano-samples have fewer pores compared to the control sample. Furthermore, the nps-TM specimen has low levels of calcium hydroxide (CH) and significant amounts of calcium silicate hydrate (C-S-H) that are absent from the control image. Figure 19, Figure 20 and Figure 21 show, respectively, the mapping images for specimens of the control, TM-2.5%, and ZM-1% that were treated in fresh tap water for 90 days and their corresponding EDX spectra. Also, Figure 19, Figure 20 and Figure 21 include the tables that list the expected chemical compounds of these specimens as well as the associated individual chemical components. According to these results, notice that the percentage of calcium in the nps-ZnO mixture is lower than that of the control combination, demonstrating the delay in setting time.

Figure 18.
SEM micrographs of (a) control mix, (b) nps-TiO2, and (c) nps-ZnO specimens at 90 days of curing age.
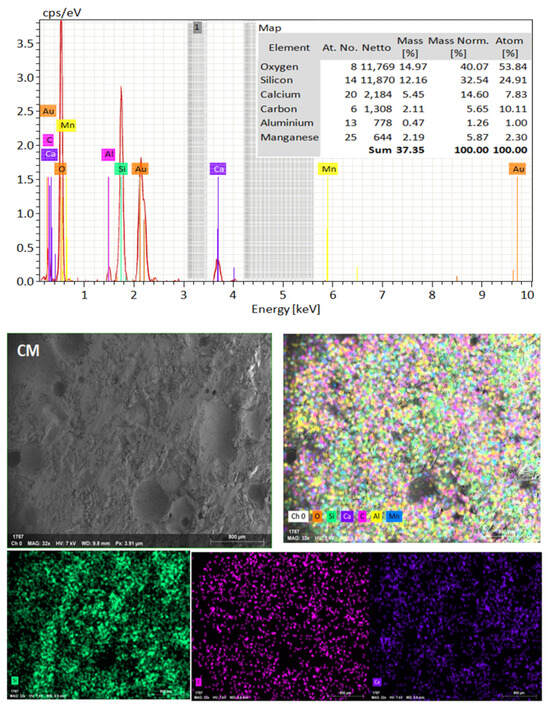
Figure 19.
EDX and Mapping analysis for control mix at 90 days of curing age.

Figure 20.
EDX and Mapping analysis for nps-TiO2 sample at 90 days of curing age.
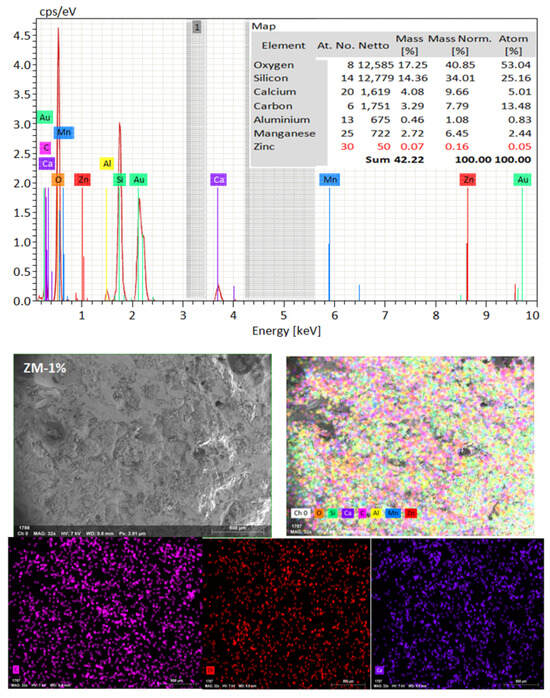
Figure 21.
EDX and Mapping analysis for nps-ZnO sample at 90 days of curing age.
5. Conclusions
Based on our results, it can be concluded that adding the photocatalyst oxide powder of nano-materials (TiO2 and ZnO) to Portland cement mortar improves its mechanical, electrochemical, and photocatalytic characteristics. Furthermore, this effect is valid for all cement-based materials. The study’s findings can be summarized as follows:
- In nps-TiO2 and nps-ZnO mixes, the best percentages for compressive strength are TM-2.5% and ZM-1%. However, the optimal ratios for flexural strength are 1% for nps-TiO2 mixtures and 1% for nps-ZnO mixtures. With higher nps-TiO2 concentrations, the nps-TiO2 mixture’s compressive strength increased, with 2.5% of nps-TiO2 being the ideal concentration. As a result, at 7, 28, and 90 days, the increment ratios of the sample containing 2.5% of nps-TiO2 were 23.82%, 22.64%, and 28.54%, respectively.
- As increasing nps-ZnO percentages reduce compressive strength in comparison to ZM-1, the ideal nps-ZnO percentage for samples is 1%. At 28 and 90 days, ZM-1 improved the corresponding strengths by 10.90% and 9.38%, respectively.
- For the flexural strength test, TM-1 (1%), for nps-TiO2, is the ideal value. For this sample, the percentages increased by about 33.46%, 33.33%, and 20% for 7, 28, and 90 days, respectively. Additionally, the findings of this study indicate that the flexural strength of nps-ZnO samples decreases with increasing nps-ZnO ratios. For samples containing 1% nps-ZnO, the percentages rose by 50.29%, 33.33%, and 16% at 7, 28, and 90 days, respectively (this is the ideal ratio for nps-ZnO samples).
- In regard to corrosion rate, this study shows that the corrosion rate for nps-TiO2 specimens gradually reduces with an increasing nps-TiO2 percentage in all exposure conditions. This may happen as a result of increasing the volume of C-S-H gel and reducing the number of pores. However, the results for the nps-ZnO samples indicate that the corrosion rate increases when the nps-ZnO ratio increases more than 1%. Additionally, ZM-1% from the nps-ZnO mixes was the optimum percentage. It is obvious that the samples increasingly self-clean as exposure duration is extended due to photocatalytic deterioration. The findings demonstrate that nps-TiO2 samples perform better overall than nps-ZnO samples.
- According to this study’s findings, all samples display some degree of self-cleaning effectiveness in exposure to UV light or sunlight, even when no nano-materials are present (0%). In general, the self-cleaning effectiveness of the mixtures improves as the TiO2 concentration rises from 0.5% to 2.5%. Although an increase in the quantity of active TiO2 does not considerably speed up the samples’ degradation of RhB, an increase in the TiO2 content is predicted to increase the amount of activated TiO2. Due to titanium dioxide’s photocatalytic activity, the organic material decomposes, which causes the color shift.
- Similar to the photocatalyst of nps-TiO2, nps-ZnO, as a nano-photocatalyst, has significant potential for use as a self-cleaning agent in concrete buildings. According to the results of this study, nps-ZnO has reduced photodegradation efficiency, this may be why it does not perform as well in these interactions. Also, the photocatalytic activity of nps-ZnO may be affected by crystallinity.
Author Contributions
F.E.-Z.M.M.: Methodology, Investigation, Resources, Visualization, and Writing—original draft. P.S.: Visualization and Writing—review & editing. G.M.A.E.H.: Supervision on electrochemical work and Writing—review & editing. A.A.F.: Supervision on nano-materials and Writing—review & editing. W.M.M.: Conceptualization, Supervision on physical work, and Writing—review & editing. A.S.F.: Conceptualization, Supervision, and Writing—review & editing. T.A.T.: Conceptualization, Supervision, and Writing—review & editing. All authors have read and agreed to the published version of the manuscript.
Funding
The publication fee was supported by the Faculty of Civil Engineering and Geodesy of the Military University of Technology in the framework of the internal grant No. UGB 814/2023.
Data Availability Statement
Not applicable.
Conflicts of Interest
The authors declare that they have no known competing financial interest or personal relationships that could have appeared to influence the work reported in this paper.
References
- Hernández-Rodríguez, M.J.; Santana Rodríguez, R.; Darias, R.; González Díaz, O.; Pérez Luzardo, J.M.; Doña Rodríguez, J.; Pulido Melián, E. Effect of TiO2 addition on mortars: Characterization and photoactivity. Appl. Sci. 2019, 9, 2598. [Google Scholar] [CrossRef]
- Arora, N.K.; Parmar, K.A.; Odedra, R.K. Photocatalytic Self cleaning Concrete. IJSRD—Int. J. Sci. Res. Dev. 2014, 1, 2521–2523. [Google Scholar]
- Fujishima, A.; Honda, K. Electrochemical photolysis of water at a semiconductor electrode. Nature 1972, 238, 37–38. [Google Scholar] [CrossRef]
- Ishchenko, O.M.; Rogé, V.; Lamblin, G.; Lenoble, D. TiO2-and ZnO-based materials for photocatalysis: Material properties, device architecture and emerging concepts. In Semiconductor Photocatalysis-Materials, Mechanisms and Applications; IntechOpen: London, UK, 2016; pp. 3–30. [Google Scholar]
- Zailan, S.N.; Mahmed, N.; Abdullah, M.M.A.B.; Sandu, A.V.; Shahedan, N.F. Review on characterization and mechanical performance of self-cleaning concrete. In Proceedings of the MATEC Web of Conferences, Ho Chi Minh City, Vietnam, 5–6 August 2016; Volume 97, p. 01022. [Google Scholar]
- Bocci, M.; Cerni, G.; Colagrande, S. Experimental investigation of the dynamic behaviour of asphalt concrete treated with photocatalytic mortars. In Proceedings of the 3rd International Conference on Tranportation Infrastructure, Pisa, Italy, 22–25 April 2014; pp. 95–102. [Google Scholar]
- Venturini, L.; Bacchi, M. Research, design, and development of a photocatalytic asphalt pavement. In Proceedings of the 2nd International Conference on Environmentally Friendly Roads: ENVIROAD, Warsaw Poland, 15–16 October 2009. [Google Scholar]
- Han, B.; Ding, S.; Wang, J.; Ou, J. Nano-Engineered Cementitious Composites: Principles and Practices; Springer: Singapore, 2019. [Google Scholar]
- Raki, L.; Beaudoin, J.; Alizadeh, R.; Makar, J.; Sato, T. Cement and concrete nanoscience and nanotechnology. Materials 2010, 3, 918–942. [Google Scholar] [CrossRef]
- Veedu, V.P. Multifunctional Cementitious Nanocomposite Material and Methods of Making the Same. Google Patents US7875211B1, 25 January 2011. [Google Scholar]
- Ochiai, T.; Fujishima, A. Photoelectrochemical properties of TiO2 photocatalyst and its applications for environmental purification. J. Photochem. Photobiol. C Photochem. Rev. 2012, 13, 247–262. [Google Scholar] [CrossRef]
- Si, H.; Zhou, M.; Fang, Y.; He, J.; Yang, L.; Wang, F. Photocatalytic concrete for NOx degradation: Influence factors and durability. Constr. Build. Mater. 2021, 298, 123835. [Google Scholar] [CrossRef]
- Talaiekhozani, A.; Rezania, S.; Kim, K.-H.; Sanaye, R.; Amani, A.M. Recent advances in photocatalytic removal of organic and inorganic pollutants in air. J. Clean. Prod. 2021, 278, 123895. [Google Scholar] [CrossRef]
- Sargam, Y.; Wang, K. Influence of dispersants and dispersion on properties of nanosilica modified cement-based materials. Cem. Concr. Compos. 2021, 118, 103969. [Google Scholar] [CrossRef]
- Mendoza, C.; Valle, A.; Castellote, M.; Bahamonde, A.; Faraldos, M. TiO2 and TiO2–SiO2 coated cement: Comparison of mechanic and photocatalytic properties. Appl. Catal. B Environ. 2015, 178, 155–164. [Google Scholar] [CrossRef]
- Fernandes, C.N.; Ferreira, R.L.; Bernardo, R.D.; Avelino, F.; Bertini, A.A. Using TiO2 nanoparticles as a SO2 catalyst in cement mortars. Constr. Build. Mater. 2020, 257, 119542. [Google Scholar] [CrossRef]
- Wang, J.; Han, B.; Li, Z.; Yu, X.; Dong, X. Effect investigation of nanofillers on CSH gel structure with Si NMR. J. Mater. Civ. Eng. 2019, 31, 04018352. [Google Scholar] [CrossRef]
- Li, Z.; Ding, S.; Yu, X.; Han, B.; Ou, J. Multifunctional cementitious composites modified with nano titanium dioxide: A review. Compos. Part A Appl. Sci. Manuf. 2018, 111, 115–137. [Google Scholar] [CrossRef]
- Pacheco-Torgal, F.; Jalali, S. Nanotechnology: Advantages and drawbacks in the field of construction and building materials. Constr. Build. Mater. 2011, 25, 582–590. [Google Scholar] [CrossRef]
- Deb, P.S.; Sarker, P.K.; Barbhuiya, S. Effects of nano-silica on the strength development of geopolymer cured at room temperature. Constr. Build. Mater. 2015, 101, 675–683. [Google Scholar] [CrossRef]
- Deb, P.S.; Sarker, P.K.; Barbhuiya, S. Sorptivity and acid resistance of ambient-cured geopolymer mortars containing nano-silica. Cem. Concr. Compos. 2016, 72, 235–245. [Google Scholar] [CrossRef]
- Chen, J.; Kou, S.-C.; Poon, C.-S. Hydration and properties of nano-TiO2 blended cement composites. Cem. Concr. Compos. 2012, 34, 642–649. [Google Scholar] [CrossRef]
- Nazari, A.; Riahi, S. The effects of TiO2 nanoparticles on physical, thermal and mechanical properties of concrete using ground granulated blast furnace slag as binder. Mater. Sci. Eng. A 2011, 528, 2085–2092. [Google Scholar] [CrossRef]
- Asadi, S.; Hassan, M.M.; Kevern, J.T.; Rupnow, T.D. Development of photocatalytic pervious concrete pavement for air and storm water improvements. Transp. Res. Rec. 2012, 2290, 161–167. [Google Scholar] [CrossRef]
- Kenanakis, G.; Vernardou, D.; Katsarakis, N. Light-induced self-cleaning properties of ZnO nanowires grown at low temperatures. Appl. Catal. A Gen. 2012, 411, 7–14. [Google Scholar] [CrossRef]
- Khayyat, S.A.; Abaker, M.; Umar, A.; Alkattan, M.O.; Alharbi, N.D.; Baskoutas, S. Synthesis and characterizations of Cd-doped ZnO multipods for environmental remediation application. J. Nanosci. Nanotechnol. 2012, 12, 8453–8458. [Google Scholar] [CrossRef]
- Copeland, L.; Kantro, D.; Verbeck, G. Paper IV–3. Chemistry of Hydration of Portland Cement. In Chemistry of Cement, Proceedings of the Fourth International Symposium, Washington, DC, USA, 2–7 October 1960; National Bureau of Standards: Washington, DC, USA, 1962; Volume 1, p. 429. [Google Scholar]
- Sakthivel, S.; Neppolian, B.; Shankar, M.; Arabindoo, B.; Palanichamy, M.; Murugesan, V. Solar photocatalytic degradation of azo dye: Comparison of photocatalytic efficiency of ZnO and TiO2. Sol. Energy Mater. Sol. Cells 2003, 77, 65–82. [Google Scholar] [CrossRef]
- De Rincon, O.T.; Perez, O.; Paredes, E.; Caldera, Y.; Urdaneta, C.; Sandoval, I. Long-term performance of ZnO as a rebar corrosion inhibitor. Cem. Concr. Compos. 2002, 24, 79–87. [Google Scholar] [CrossRef]
- Kamal, H.M.; Kadhim, M.J.; Jawad, R.K.M. Investigate the colloidal nano-zinc oxide addition on the strength acceleration of G-sand cement mortar. AIP Conf. Proc. 2020, 2213, 020148. [Google Scholar]
- Taylor-Lange, S.C.; Riding, K.A.; Juenger, M.C. Increasing the reactivity of metakaolin-cement blends using zinc oxide. Cem. Concr. Compos. 2012, 34, 835–847. [Google Scholar] [CrossRef]
- C150/C150M-17; Standard Specification for Portland Cement. ASTM International: West Conshohocken, PA, USA, 2017.
- Han, B.; Li, Z.; Zhang, L.; Zeng, S.; Yu, X.; Han, B.; Ou, J. Reactive powder concrete reinforced with nano SiO2-coated TiO2. Constr. Build. Mater. 2017, 148, 104–112. [Google Scholar] [CrossRef]
- ASTM D1193-06; Standard Specification for Reagent Water. ASTM International: West Conshohocken, PA, USA, 2011; Volume 51, pp. 4–6.
- ASTM C494; Standard specification for chemical admixtures for concrete. ASTM International: West Conshohocken, PA, USA, 2005.
- C192/C192M-07; Standard Practice for Making and Curing Concrete Test Specimens in the Laboratory. ASTM International: West Conshohocken, PA, USA, 2007.
- Ren, J.; Lai, Y.; Gao, J. Exploring the influence of SiO2 and TiO2 nanoparticles on the mechanical properties of concrete. Constr. Build. Mater. 2018, 175, 277–285. [Google Scholar] [CrossRef]
- Staub de Melo, J.V.; Trichês, G. Study of the influence of nano-TiO2 on the properties of Portland cement concrete for application on road surfaces. Road Mater. Pavement Des. 2018, 19, 1011–1026. [Google Scholar] [CrossRef]
- Ying, J.; Zhou, B.; Xiao, J. Pore structure and chloride diffusivity of recycled aggregate concrete with nano-SiO2 and nano-TiO2. Constr. Build. Mater. 2017, 150, 49–55. [Google Scholar] [CrossRef]
- Staub de Melo, J.V.; Trichês, G. Evaluation of mechanical behavior and microstructural characteristics of photocatalytic concretes to be used as pavement blocks. J. Eng. Mater. Technol. 2016, 138, 031013. [Google Scholar] [CrossRef]
- Daniyal, M.; Akhtar, S.; Azam, A. Effect of nano-TiO2 on the properties of cementitious composites under different exposure environments. J. Mater. Res. Technol. 2019, 8, 6158–6172. [Google Scholar] [CrossRef]
- Liu, J.; Li, Q.; Xu, S. Influence of nanoparticles on fluidity and mechanical properties of cement mortar. Constr. Build. Mater. 2015, 101, 892–901. [Google Scholar] [CrossRef]
- Nayak, C.B.; Taware, P.P.; Jagadale, U.T.; Jadhav, N.A.; Morkhade, S.G. Effect of SiO2 and ZnO nano-composites on mechanical and chemical properties of modified concrete. Iran. J. Sci. Technol. Trans. Civ. Eng. 2022, 46, 1237–1247. [Google Scholar] [CrossRef]
- Thangapandi, K.; Anuradha, R.; Archana, N.; Muthuraman, P.; Awoyera Paul, O.; Gobinath, R. Experimental study on performance of hardened concrete using nano materials. KSCE J. Civ. Eng. 2020, 24, 596–602. [Google Scholar] [CrossRef]
- Kumar, M.; Bansal, M.; Garg, R. An overview of beneficiary aspects of zinc oxide nanoparticles on performance of cement composites. Mater. Today Proc. 2021, 43, 892–898. [Google Scholar] [CrossRef]
- Garg, R.; Garg, R. Effect of zinc oxide nanoparticles on mechanical properties of silica fume-based cement composites. Mater. Today Proc. 2021, 43, 778–783. [Google Scholar] [CrossRef]
- Yousuf, M.; Mollah, A.; Hess, T.R.; Tsai, Y.-N.; Cocke, D.L. An FTIR and XPS investigations of the effects of carbonation on the solidification/stabilization of cement based systems-Portland type V with zinc. Cem. Concr. Res. 1993, 23, 773–784. [Google Scholar] [CrossRef]
- Nochaiya, T.; Sekine, Y.; Choopun, S.; Chaipanich, A. Microstructure, characterizations, functionality and compressive strength of cement-based materials using zinc oxide nanoparticles as an additive. J. Alloys Compd. 2015, 630, 1–10. [Google Scholar] [CrossRef]
- Nazari, A.; Riahi, S. The effects of curing medium on the flexural strength and water permeability of cementitious composites containing Fe2O3 nanofillers. Int. J. Mater. Res. 2011, 102, 1312–1317. [Google Scholar] [CrossRef]
- Kaushik, S.; Islam, S. Suitability of sea water for mixing structural concrete exposed to a marine environment. Cem. Concr. Compos. 1995, 17, 177–185. [Google Scholar] [CrossRef]
- Dasar, A.; Patah, D.; Hamada, H.; Sagawa, Y.; Yamamoto, D. Applicability of seawater as a mixing and curing agent in 4-year-old concrete. Constr. Build. Mater. 2020, 259, 119692. [Google Scholar] [CrossRef]
- Amor, F.; Baudys, M.; Racova, Z.; Scheinherrová, L.; Ingrisova, L.; Hajek, P. Contribution of TiO2 and ZnO nanoparticles to the hydration of Portland cement and photocatalytic properties of High Performance Concrete. Case Stud. Constr. Mater. 2022, 16, e00965. [Google Scholar] [CrossRef]
- Loh, K.; Gaylarde, C.; Shirakawa, M. Photocatalytic activity of ZnO and TiO2 ‘nanoparticles’ for use in cement mixes. Constr. Build. Mater. 2018, 167, 853–859. [Google Scholar] [CrossRef]


Disclaimer/Publisher’s Note: The statements, opinions and data contained in all publications are solely those of the individual author(s) and contributor(s) and not of MDPI and/or the editor(s). MDPI and/or the editor(s) disclaim responsibility for any injury to people or property resulting from any ideas, methods, instructions or products referred to in the content. |
© 2023 by the authors. Licensee MDPI, Basel, Switzerland. This article is an open access article distributed under the terms and conditions of the Creative Commons Attribution (CC BY) license (https://creativecommons.org/licenses/by/4.0/).