Abstract
A series of glasses based on (80-y) TeO2-20 BiCl3-y RE2O3 (y = 0, 0.6 mol%; RE = Nd, Sm, Dy, and Er) were prepared. The thermal stability of the glass was determined by differential scanning calorimetry (DSC). The density and optical energy values of the prepared glass increased in the order of Sm2O3, Nd2O3, Dy2O3, and Er2O3. In addition, the glass doped with Er2O3 had the highest refractive index values compared to the other samples. Subsequently, Judd–Ofelt parameters (Ω2, Ω4, and Ω6) were obtained for the family of RE3+ trivalent rare-earth ions introduced as dopants in a tellurite glass. These parameters were calculated from the absorption spectra for each RE3+. The structures were studied by Raman spectroscopy deconvolution, which determined that TeO4, TeO3, TeO3+1, BiO6, and BiCl6 units had formed. In addition, the structural changes in the glass are related to the intensity ratio of TeO4/TeO3, depending on the type of rare-earth. For the optics and Judd–Ofelt parameters, the ray spectroscopy results of the prepared glass show that it is a good candidate for nonlinear optics fibers, a solid laser material.
1. Introduction
Nd, Sm, Dy, and Er are examples of rare-earth (RE) elements that have several multilateral uses in innovative technology [1]. Due to the fact that it is utilized to make optoelectronic components, including planar waveguides, optical detectors, fluorescent display technology, visible lasers, optical fibers, and optical amplifiers, rare-earth (RE) ion-doped glass has recently attracted interest [2].
Tellurite oxide-based glasses offer special physical characteristics features such as high linear and nonlinear indices of refraction, low melting points, simple forming and dimensions, high transparency, chemical resistance, high thermal stability, and infrared transmittance [3]. Glasses including TeO2 have potential applications in the fields of photonics; optoelectronics; and optical instrumentation, including laser technology, telecommunications, amplifiers, and electrical storage devices [4].
Additionally, tellurium dioxide is convertible with other glass materials, enabling the incorporation of several compositions inside tellurate glass. These glasses are thought to be effective hosts, enhancing the luminescence characteristics of a number of lanthanide ions. Therefore, it is interesting to peer into the tellurate glass’s structure, particularly when the glass is doped with rare-earth ions. An asymmetrical TeO4 trigonalbipyramidal (tbp), which contains two axials, two different kinds of sites, and three equatorial positions, is the distinctive structural unit of crystalline TeO2. An individual pair of electrons is present in one of the latter. There are two distinct types of fundamental structural units in TeO2-based glasses, namely TeO4 tbp and TeO4 tbp with a lone pair electron, which makes their structure interesting.
The addition of bismuth chloride (BiCl3) as a second glass forming helps in the creation of superior structural units, which have an impact on the physical and optical characteristics of the glass system. Tellurite glass research has attracted a lot of attention. Due to its potential applications in various industries, this has changed recently. Doped with appropriate rare-earth (RE) ions, tellurite glass is a candidate for use in optical fibers, nonlinear optics, lasers, solar cells, and sensors [5]. Sm2O3-doped glass exhibits and produces an intense orange-red luminescence in the visible region related to the 4G5/2 and 6H9/2 transitions, depending on the excitation wavelength. Glass that has Er2O3 is thought to be a potential material for optical amplifier production (EDFAS) and the application of optical communications.
The J–O intensity characteristics also reveal the glass bonding type, according to a number of scientists, in order to know more about the optical and physical characteristics of Nd3+, Sm3+, Dy3+, and Er3+ ions in the glass matrix, as well as the radiative lifetimes of erbium doped in tellurite glasses. Research has also looked into determining the feasibility of applying this glass system in optical glasses for photonics and lasers.
A reliable approach for determining estimated radiative properties such as the rate of spontaneous emission, duration, and branching ratio is the Judd–Ofelt analysis. Furthermore, the computation of the gain and quantum efficiency includes a few Judd–Ofelt spectroscopic parameters [6,7]. When choosing a vitreous matrix, several glasses’ chemical compositions have been adjusted. Low phonon energy considerably increases the probabilities of radiative transition in glasses such as fluoro-zirconate and heavy metal oxide-based glasses (HMOGs), making these glasses the best candidates for photoluminescence [8].
The current work uses the Judd–Ofelt method to investigate the radiative characteristics of tellurate glasses (TeO2-BiCl3) doped with lanthanide ions (Nd3+, Sm3+, Dy3+, and Er3+). In order to investigate whether these rare-earth ions influence the structural characteristics of the TB glass system, we provide general physical and optical characteristics. The structure of these glasses has been extensively studied using the Raman technique.
2. Materials and Methods
2.1. Glass Synthesis
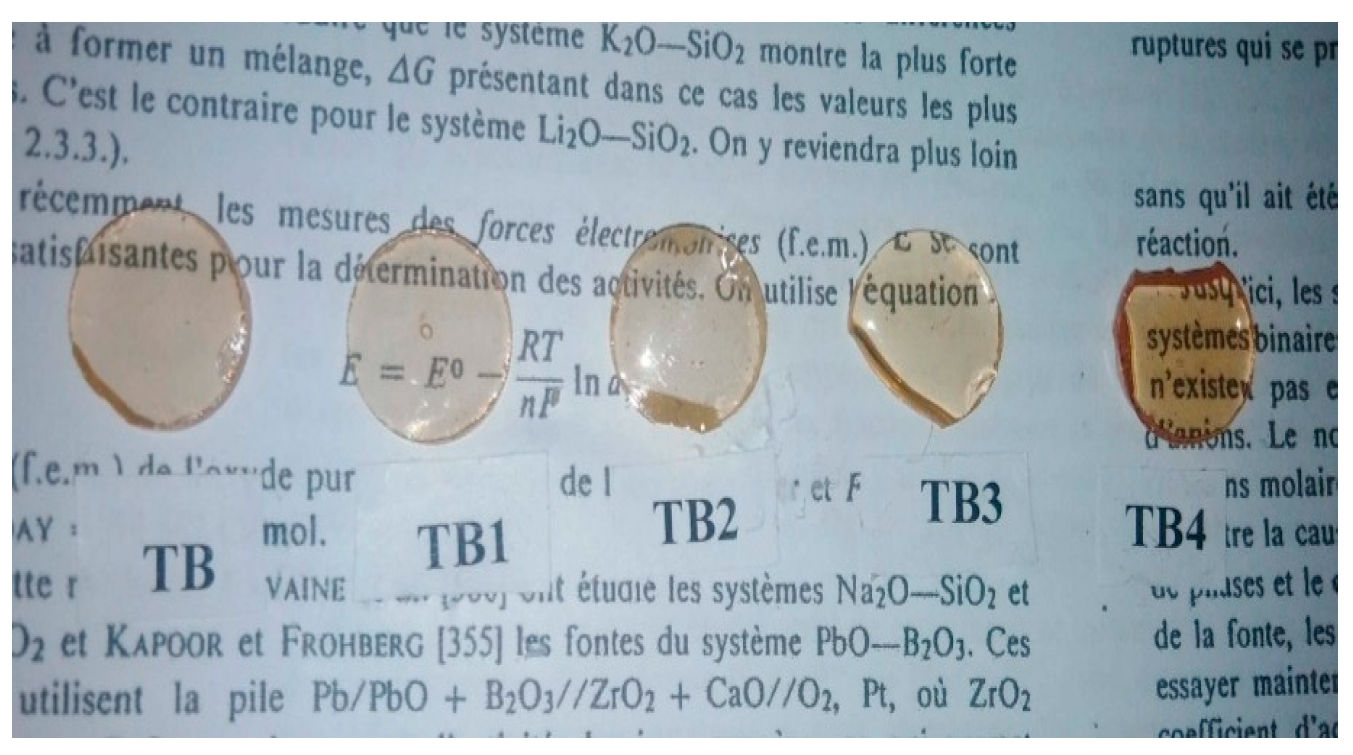
With a chemical formula of (80-y) TeO2-20 BiCl3-y RE2O3 (y = 0, 0.6% mol; RE = Nd, Sm, Dy, and Er), glass samples from Sigma Aldrich (St. Louis, MO, USA) were created with a high purity of 99.9%. To remove adsorbed water, all chemical compositions were preheated in a furnace at 200 °C for 3 h. The glass sample code and material composition are shown in Table 1. Each of the components was weighed and combined in a mortar using a weight (about 5 g), and the mixtures were melted at a temperature of 750 °C in the air under flame heat for 10 min until a homogeneous liquid was obtained. Then, the melt was cast on a mold brass, maintained at a temperature lower than the glass transition (T ≈ Tg − 10 °C). The obtained glasses were annealed for 6 h at Tg-20 °C in an electric furnace to eliminate the stresses induced during quenching. The photography of the samples is presented in the Figure 1. The samples were polished and cut to a few millimeters thick. The current study investigates the radiative properties of tellurate glasses (TeO2-BiCl3) doped with lanthanide ions (Nd3+, Sm3+, Dy3+, and Er3+) using the Judd–Ofelt method. We present general physical and optical features to evaluate whether these rare-earth ions affect the structural properties of the TB glass system. The Raman method has been used for considerable research on the structure of these glasses.

Table 1.
The nominal composition of the (80-y) TeO2-20 BiCl3-y RE2O3 (y = 0, 0.6% mol; RE = Nd, Sm, Dy, and Er) glass sample codes.
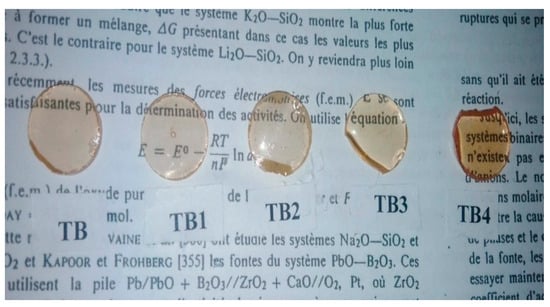
Figure 1.
Photography of the samples.
2.2. Characterization
By utilizing CuKα radiation at 40 kV and 100 mA during XRD studies SHIMADZU XRD 6000 (Chiyoda-ku, Tokyo, Japan) the materials’ amorphous natures are confirmed. The 2θ range had a step size of 0.04° per second and a range of 0–60°. Glass density measurements were taken with a precision of 0.001 g/cm3 utilizing the Archimedes method. The TA Instrument DSC Q20 model (New Castle, DE, USA) which has a greater sensitivity of 0.1 °C and a heating rate of 10 K/min, was used to record the samples’ thermal properties. The Tg value was judged to be 2 K, whereas the Tx and Tp values were 1 K. The Tx-Tg stability factor demonstrated the outstanding stability of our glasses. A
Scienta Omicron R3000 spectrometer (Danmarksgatan 22, Uppsala, Sweden) operating between 100 and 1000 cm−1 was used for the Raman spectroscopy. Measurements of the optical transmissions in the UV–Visible band between 400 and 800 nm were performed using an Agilent Technologies Cary 5000 spectrometer (Santa Clara, CA, USA).
3. Results and Discussion
3.1. X-ray Diffraction Analysis
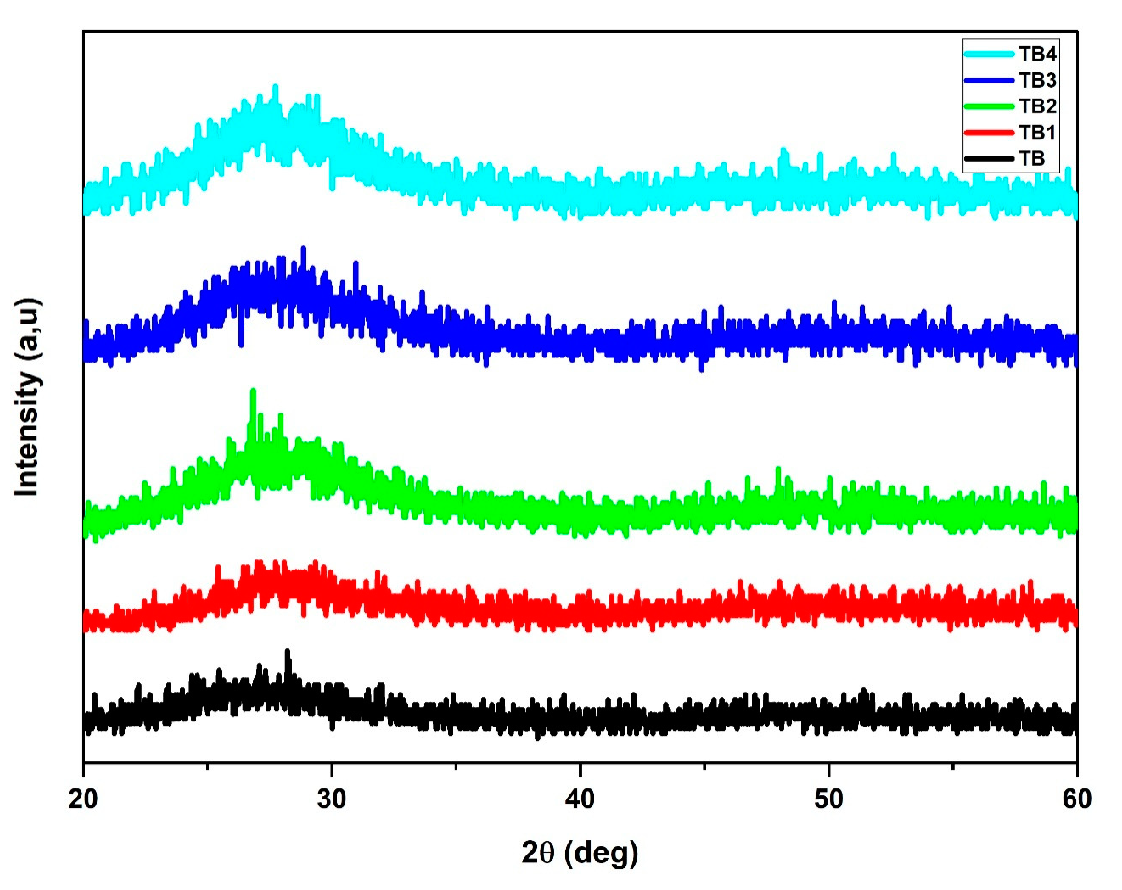
The X-ray diffraction patterns of a system glass made of (80-y) TeO2-20 BiCl3-y RE2O3 (y = 0, 0.6% mol; RE = Nd, Sm, Dy, and Er) are depicted in Figure 2. A broad peak curve was seen between 20° and 30° of the 2θ. The absence of diffraction peaks confirms the amorphous structure of these glasses [9].
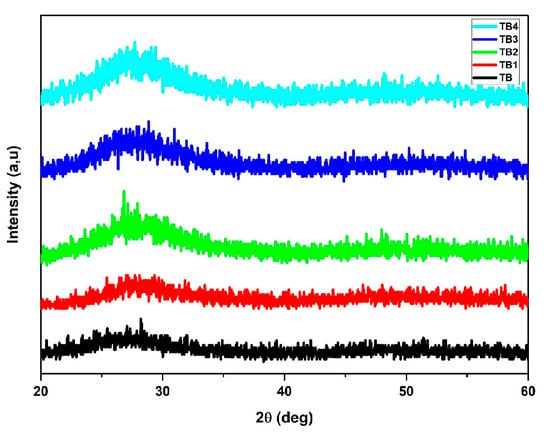
Figure 2.
Typical XRD pattern of glass with the composition (80-y) TeO2-20 BiCl3-y RE2O3 (y = 0, 0.6% mol; RE = Nd, Sm, Dy, and Er).
3.2. Thermal Properties
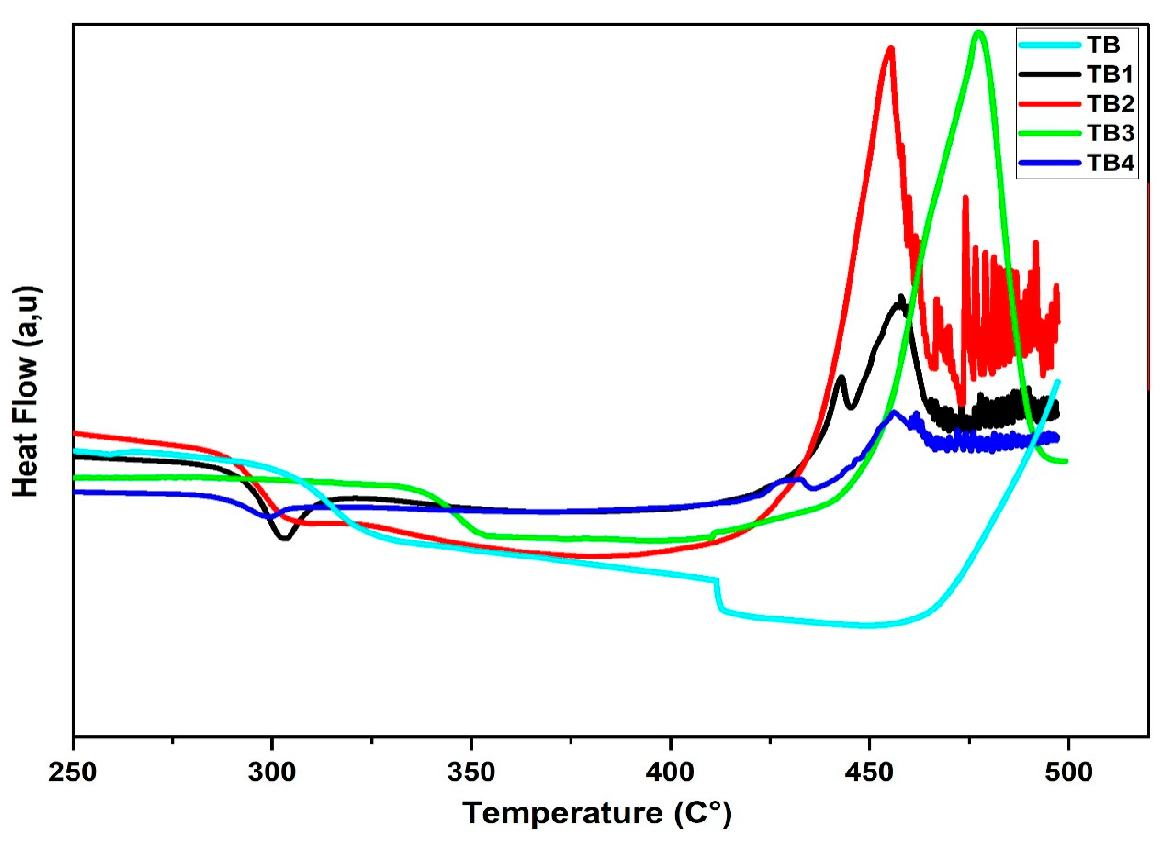
Figure 3 displays the differential scanning calorimetry (DSC) patterns for each of the investigated glass samples: the glass transition temperature (Tg), the onset crystallization peak temperature (Tx), the peak of the crystallization temperature (Tp), the thermal stability factor ΔT = Tx – Tg [10], and Hruby’s parameter H = (Tx – Tg)/Tg.
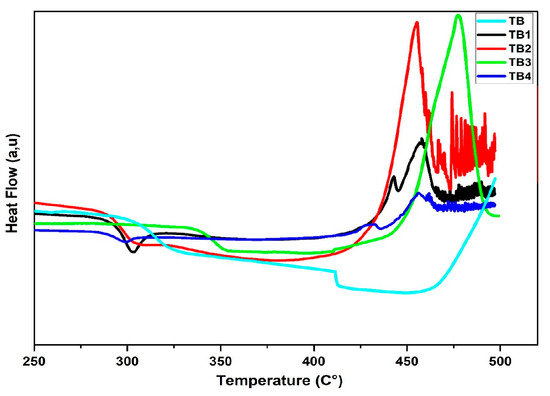
Figure 3.
The DSC curves of the (80-y) TeO2-20 BiCl3-y RE2O3 (x = 0, 0.6% mol; RE = Nd, Sm, Dy, and Er) glass system.
Table 2 lists the glasses’ thermal stability of anticrystallization or resistance to crystallization [11]. The Tg, Tx, Tp, ΔT, H, and S are in the range of 285–333 °C, 390–439 °C, 430–477 °C, 116–127 °C, 0.32–0.44, and 7.54–15.63 °C, respectively, according to Table 2. The rigidity of the network is what causes an increase in the Tg with the addition of 0.6 mol% of Nd2O3, Sm2O3, Dy2O3, and Er2O3 in the glass system. Glass is considered thermally stable if the difference ∆T, which is used to calculate thermal stability, is larger than 100 °C. The ΔT was greater than 100 °C for all glass samples. TB4 had the highest glass stability (127 °C) [12].

Table 2.
The glass transition temperature Tg, onset crystallization temperatures Tx, crystallization temperatures Tp, thermal stability factor ΔT, Hruby parameter, and glass stability range S of the (80-y) TeO2-20 BiCl3-y RE2O3 (y = 0, 0.6% mol; RE = Nd, Sm, Dy, and Er) glass system.
Glass stability can be shown by Hruby’s parameters; a greater H denotes an improved degree of glass formation stability. The highest value of H is displayed by TB4 glass, with a value of 0.44 signifying the highest glass-forming potential. Because there is a significant correlation between the stability of the glass and exothermic broadness, the thermal stability, S, given by Saad and Bolin, stands out [13]. The resistance is reflected in the parameter S. The value at TB2 was the greatest, and the value at TB4 was the lowest. The alteration in solid-state bond formation in complex matrices is related to changes in the material’s thermal characteristics.
3.3. Physical, Optical Properties
The diverse physical parameters, including density (ρg, g/cm3), the molecular weights (Mwt, g/mol), molar volume (Vmol, cm3/mol), oxygen volume (VOXG, cm3/mol), oxygen packing density (OPD, g atom/l), indirect optical band gap (, eV), refractive index (n), molar refractivity (Rmol, cm3/mol), molar polarizability (αmol, (A°)3), refraction loss (RLoss), dielectric constant (ε), polaron radius (rpl, A°), inter ionic distance (rin, A°), RE ion concentration (N × 1020, ions/cm3), and field strength (Fs × 1014, cm−2), were calculated using the expressions provided in the literature [14], and the estimated values are shown in Table 3. Equation (1) was used to calculate the density value (ρg) [15].
where ua and ub are the weights of the glass sample in air and in immersion liquid, respectively, and ρwat is the water density. The calculated density value of the prepared glass decreased from 5.506 g/cm3 to 5.468 g/cm3, which corresponded to TB and TB4 glass. Table 3 presents the results.

Table 3.
Physical and optical glass system parameters (80-y) TeO2-20 BiCl3-y RE2O3 (y = 0, 0.6% mol; RE = Nd, Sm, Dy, and Er).
Rare-earth compounds are ranked according to their molecular weights (Mwt) as follows: TB1 < TB2 < TB3 < TB4, with respective Mwt values of 191.879, 191.953, 192.098, and 192.156 g/mol. Erbium-doped glass is denser and more compact than undoped glass. Using Equations (2) and (3), find out how much glass there is in the sample and how much oxygen there is in the sample. Table 2 lists the density of the glass samples used to carry out these calculations.
where Mi is the molecular weight, and Xi is the fraction ratio of every oxide. The oxygen molar volume, VOXG, can be calculated using the relationship below.
where ni is the number of individual oxide oxygen atoms [11]. From 35.10 cm3/molto 35.01 cm3/mol, corresponding to TB1 and TB4, the molar volume, Vmol, decreased. From 45.86 cm3/mol, VO decreased to 45.74 cm3/mol. In addition, it is possible that the reduction in VO reflected an increase in the synthesis of NBO atoms, given that the OPD was determined using Equation (4) [2].
The value of OPD reduced from 21.87 to 21.65 g atom/l as the rare-earth ions in the glass matrix were doped.
The polaron radius rpl (A°), inter ionic distance rin (A°), and field strength Fs (×1017cm−2) were calculated from Equations (5)–(8) [15]. The concentration of ions:
where (NRE) is the concentration of rare-earth ions, (NAVG) is the Avogadro’s number, (ρg) is the density of the glass sample, A is the atomic mass of the rare-earth ions, (rin) is the mean distance between the RE3+ ions, (rpl) is the polaron radius, and (Fs) is the field strength of TB glass that has been doped. Table 3 displays the results of the calculations. The estimated results show that, for RE+3 ions, ri and rp are identical. As a result, the field strength (F) surrounding Er+3 ions is enhanced, and the RE-O bond becomes more stable. When taken together with the intensity results, these values prove that the addition of Er3+ ions causes the glass structure to compress, which, in turn, reduces the degree of electron delocalization by increasing the number of donor centers in the glass matrix, which reduces the optical band gap [9].
Using Davis’s and Mott’s relation and Equation (9), the Eopt for amorphous material was calculated [16].
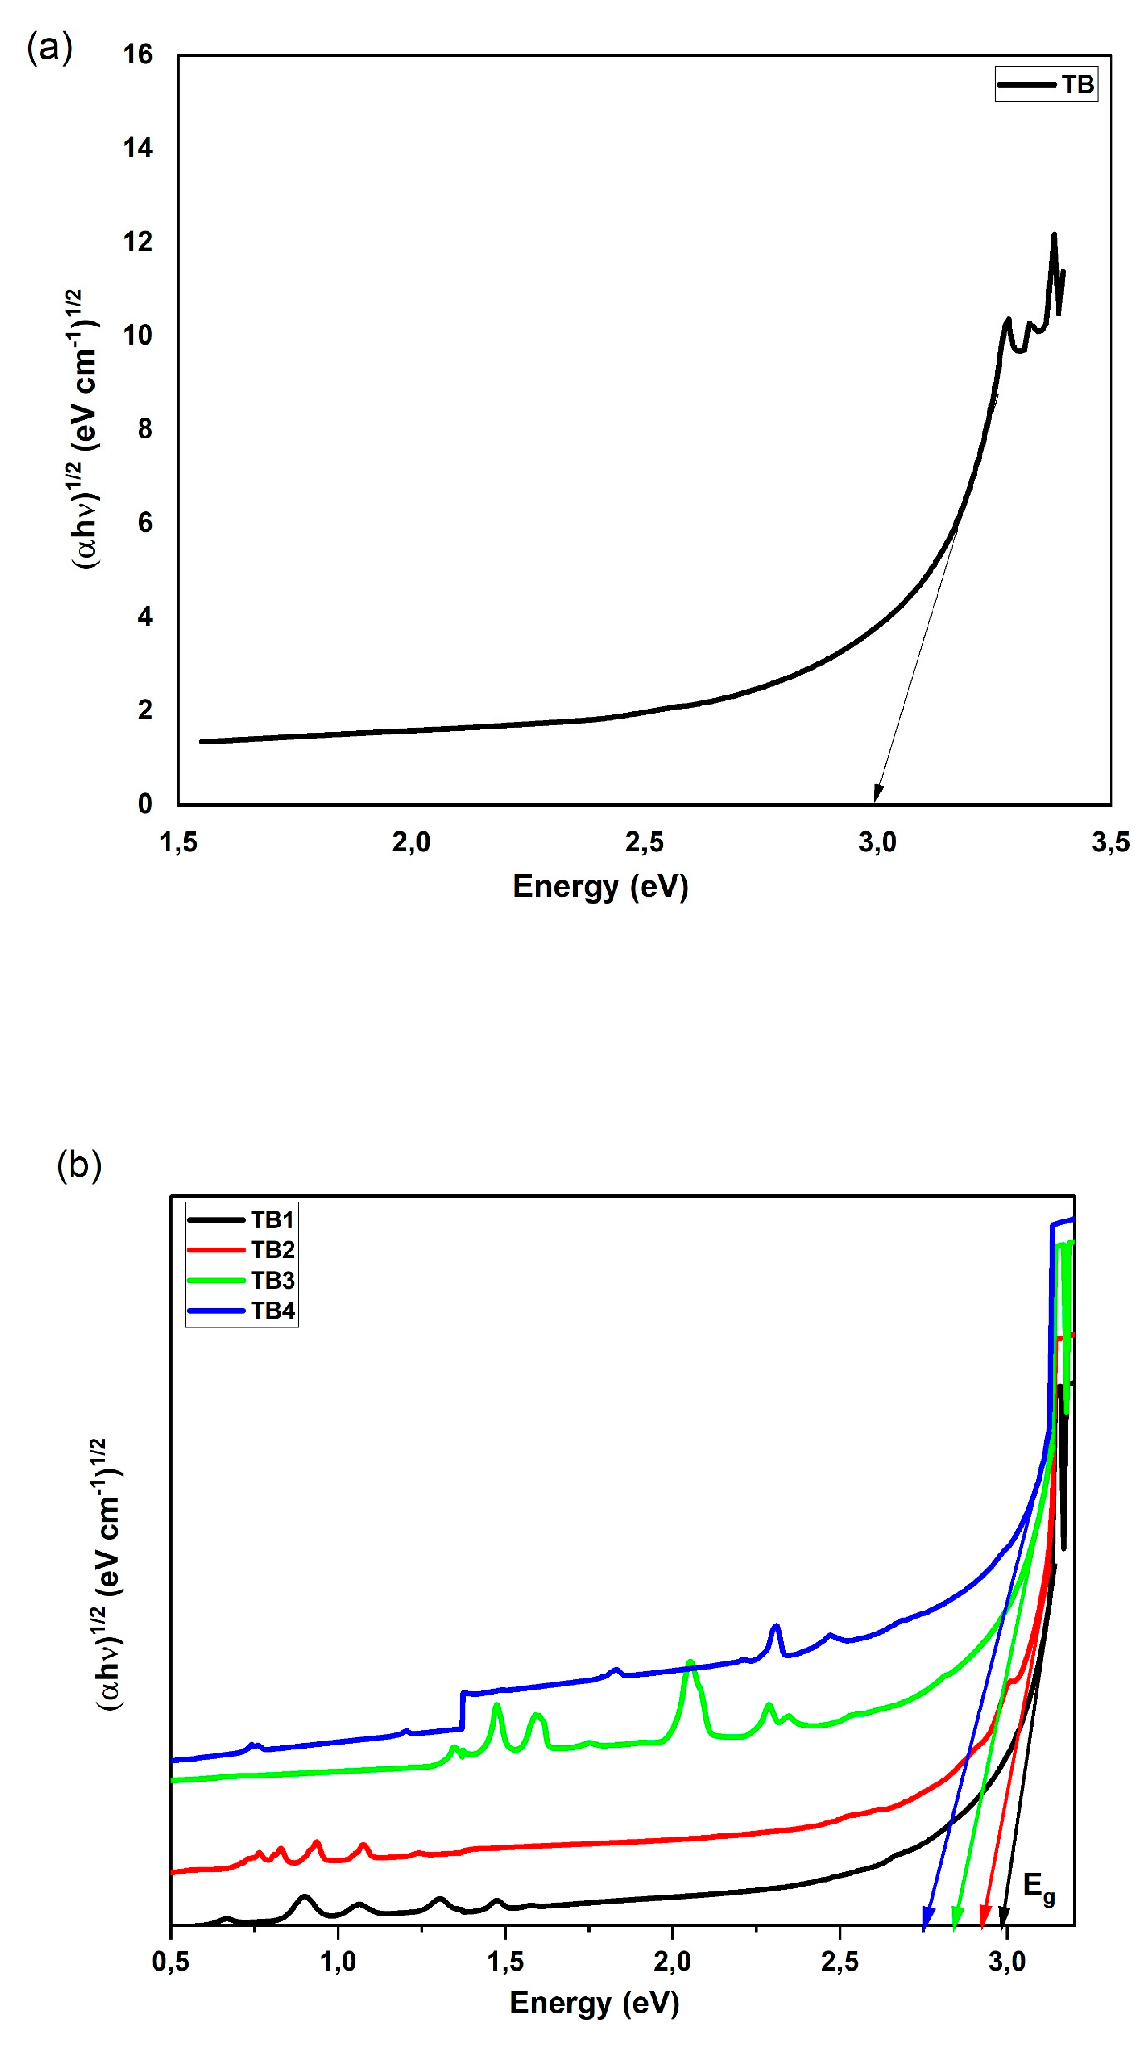
For every value of r between 1/2 and 2, where B is a constant, allowable indirect transitions have an r value of 1/2, whereas direct transitions have an r value of 2 in Equation (10). The values of indirect Eopt were calculated by extrapolating the linear fit on the x-axis of the plot of (αhν)1/2 against photon hν, as shown in Figure 4.
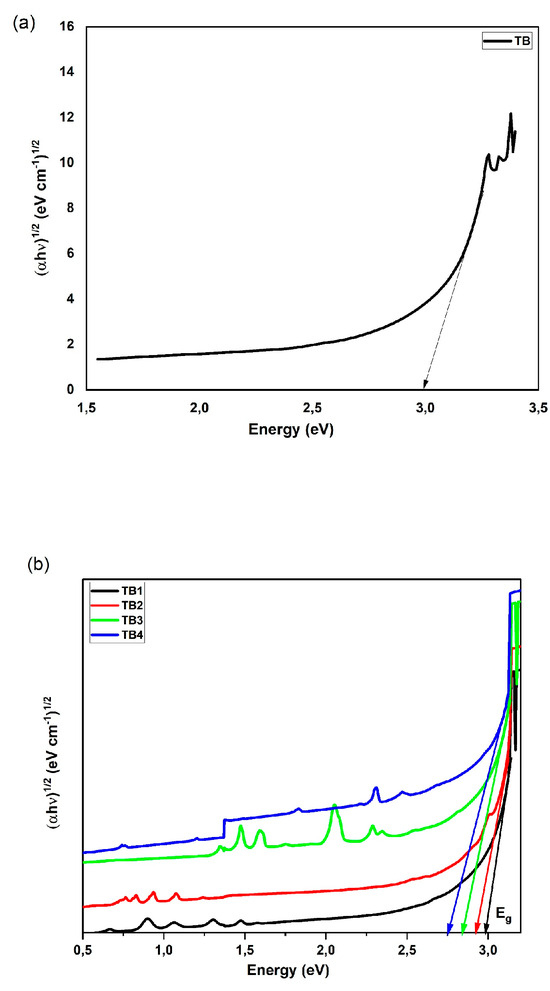
Figure 4.
Plot of (αhʋ)1/2 against the energy of (a) a TB glass sample and (b) of doped glass samples for indirect band gap measurements.
The Eopt value ranges from 2.75 to 2.99 eV, depending on the kind of glass and how it was manufactured. Table 3 displays the values of Eopt for each sample, with TB having the highest value and TB4 the lowest.
The index of refraction n is one of the most important characteristics of optical glasses. The refractive index values of prepared glass samples were obtained using the Dimitrov and Sakka relation, as depicted in Equation (11) [17] and tabulated in Table 3.
With the change in the doping RE3+ ion concentration in the produced glass, the n value rises from 2.39 to 2.47. The molar mass, electron density, and ion polarity are all factors. Strong polarization of non-bridged oxygen production (NBO) in the glass lattice is responsible for the enhancement of the refractive index. The polarizability is increased due to the greater refractive index resulting from the creation of non-bridging oxygen when compared to covalent oxygen bridging bonds.
The calculation of the molar refraction (Rmol, cm3/mol) is carried out by using the Lorentz–Lorenz Equation (12) [11]:
The calculation of the molar polarizability (αmol) can be determined using Equation (13):
Table 3 presents the values of polarizability (αmol) and molar refraction (Rmol) for the glass samples doped with rare-earth ions. The dielectric constant (ε) and refraction loss (RL) are determined using Equations (14) and (15), respectively [11].
The increase in the Rmol, αmol, ε, and RLoss can be attributed to an increase in the (NBO) and RE3+ ions in the glasses’ network structure.
3.4. Judd–Ofelt Analysis
Laser action and optical amplification are two phenomena for which the J–O theory is often utilized to make predictions. Bands of absorption were seen in this research, and it was shown that they were most often connected with transitions involving induced electric dipoles [7,18]. Oscillator strength was defined as the intensity of the absorption spectral lines. Furthermore, Equation (16) [8,14] was utilized to calculate the experimental oscillator strength () for each absorption band.
where represents the molar extinction coefficient in cm−1, k represents the optical path length in cm, C represents the concentration of RE3+ in mol.L−1, and represents the area under the absorption curve. The transition frequency () between RE3+’s ground state (aJ) and excited state (aJ’) was calculated. Equation (17) was used to determine the ionization transition.
The variables and represent Lorentz-localized field corrections that are accountable for the dipole transitions, and is the Planck’s constant. They are written using the refractive index as
is the glass sample’s determined refractive index. The line strength for both electric and magnetic dipoles, and , respectively, can be calculated as follows.
The values of the doubly reduced matrix elements of order Ωλ (λ = 2, 4, 6) between the manifold states of and were obtained from [14,19]. The J–O intensity parameters were calculated using the least squares fitting method. The root mean square (RMS) deviation was used to assess the quality of fitting between and .
represents the total number of observed transitions. The probability of spontaneous transition is given by
The average magnetic and electric dipole contributions are denoted by and , respectively. Expression (24) yields the branching ratio () for the upper state J.
The radiative lifetime of the emitting state is related to the global spontaneous probabilities [19] for the overall transitions.
The upper state’s total angular momentum is denoted by J.
3.5. Spectra of Absorption and Judd–Ofelt Analysis
We provide data for the full RE3+ series, including experimental and calculated oscillator strength for the corresponding transitions, absorption spectra, J–O parameters, and root mean square (RMSE) error of the oscillator strength calculations.
3.5.1. Neodymium (Nd3+)
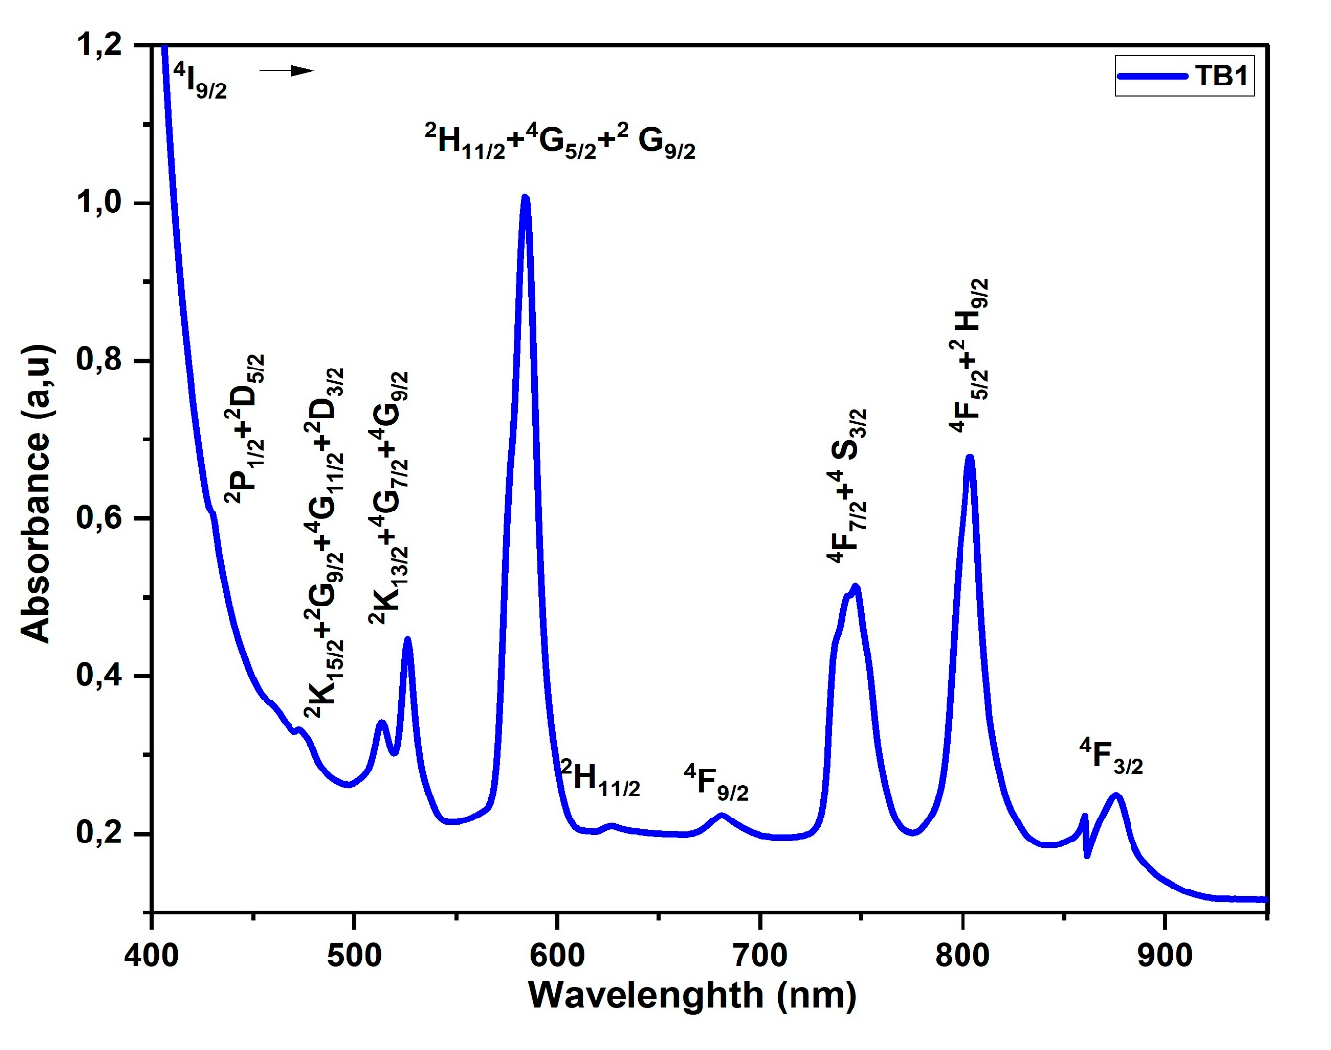
From 350 to 1200 nm, Figure 5 displays the absorption bands that were produced when Nd3+ ions were doped into glass. The spectral lines from the lowest level, 4I9/2, to the highest, the excited levels, are clearly visible. Table 4 presents the experimental and theoretical oscillator strengths for the transitions from 4F3/2, 4F5/2 + 2H9/2, 4F7/2 + 4S3/2, 4F9/2, 2H11/2, 2H11/2 + 4G5/2 + 2G9/2, 2K13/2 + 4G7/2 + 4G9/2, 2K15/2 + 2G9/2 + 4G11/2 + 2D3/2, and 2P1/2 + 2D5/2 [20]. The experimental and calculated oscillator strengths for the Nd3+ ions agreed with the J–O calculations for the most part, but there were some challenges in determining the oscillator strength in the UV region due to the overlapping bands of the following transitions: 4I9/2 (2P1/2), (2K15/2, 2G9/2, 2D3/2, 2G11/2), and (2K13/2, 4G7/2, 4G9/2). Other authors have suggested that the most effective transition is the hypersensitive 4I9/2 (4G5/2, 2G7/2). These findings follow the same quadrupole selection rules ( as those found in bismuth borated glasses and other fluorophosphate glasses [21,22].
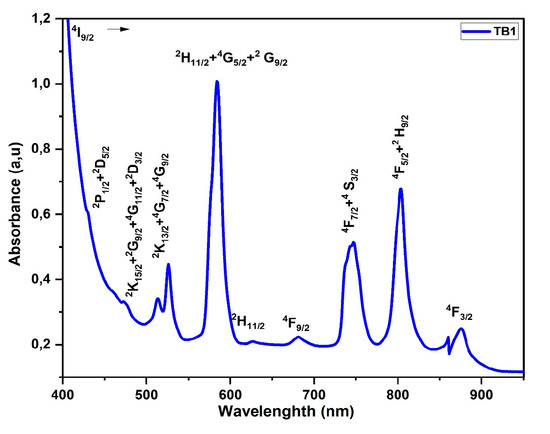
Figure 5.
Absorption spectra of Nd3+-doped glass.

Table 4.
The oscillator strengths and J–O parameters determined from the absorption spectra of TB1 glass.
3.5.2. Samarium (Sm3+)
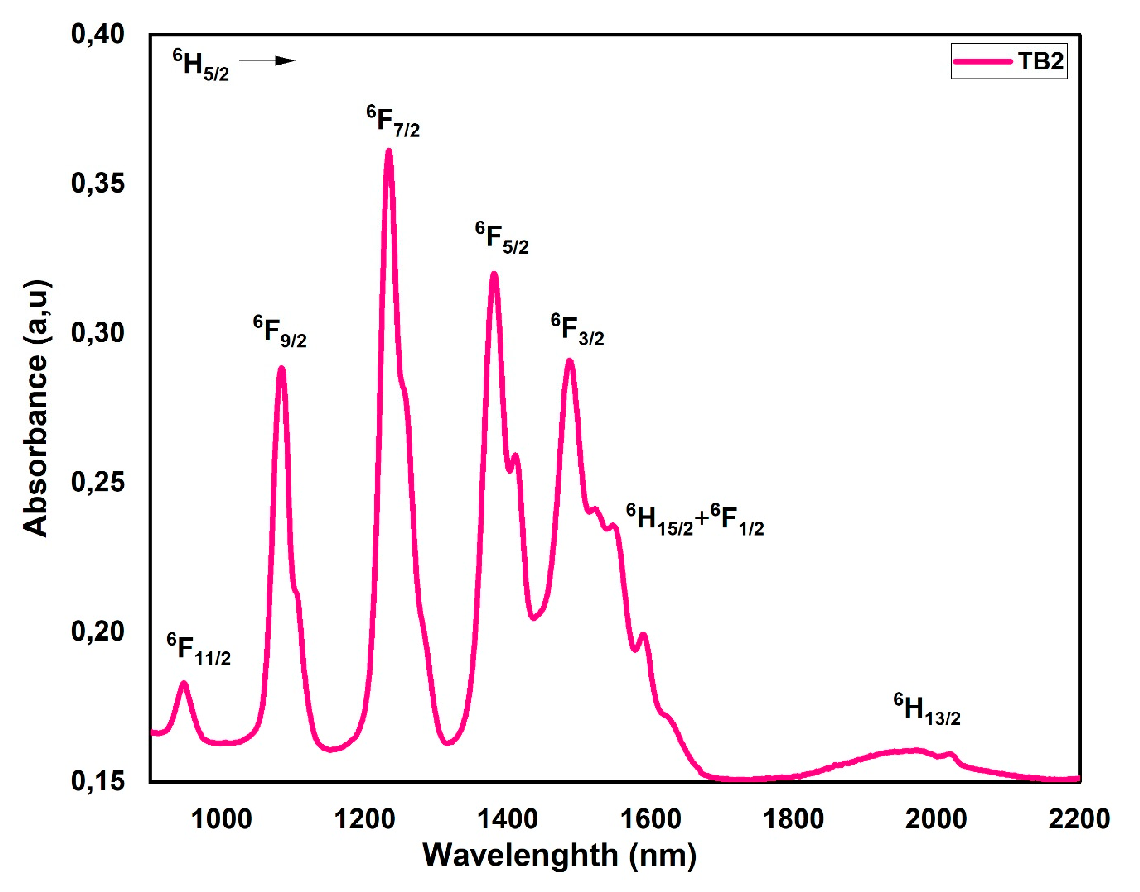
Visible range absorption spectra were assigned, as seen in Figure 6. Considering the intricacy of the total of the 2S+1LJ transitions, it was not surprising that calculating the J–O parameters was complex. The oscillator strengths at the ground level 6H5/2 and the excited levels 6H13/2, 6F1/2 + 6H15/2, 6F3/2, 6F5/2, 6F7/2, 6F9/2, and 6F11/2 were measured experimentally and computed [23]. As shown in Table 5, there was a high agreement between the experimental and calculated oscillator strengths and the J–O parameters, proving the accuracy of the J–O predictions. Consistent with previous research by authors such R. Van Deun et al. [18], the findings show that the strongest transitions occur in the near-infrared (NIR) spectrum between 950 nm and 1600 nm.
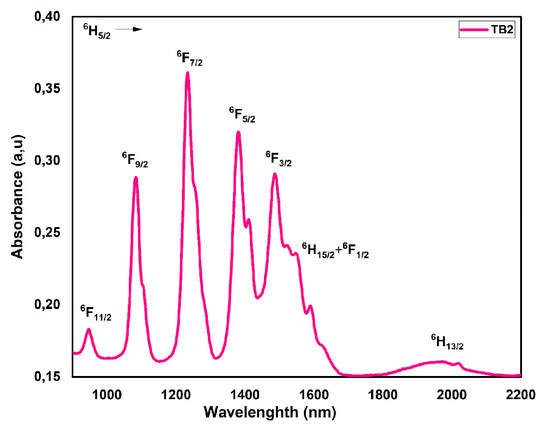
Figure 6.
Absorption spectra of Sm3+-doped glass.

Table 5.
The oscillator strengths and J–O parameters determined from TB2 glass absorption spectra.
3.5.3. Dysprosium (Dy3+)
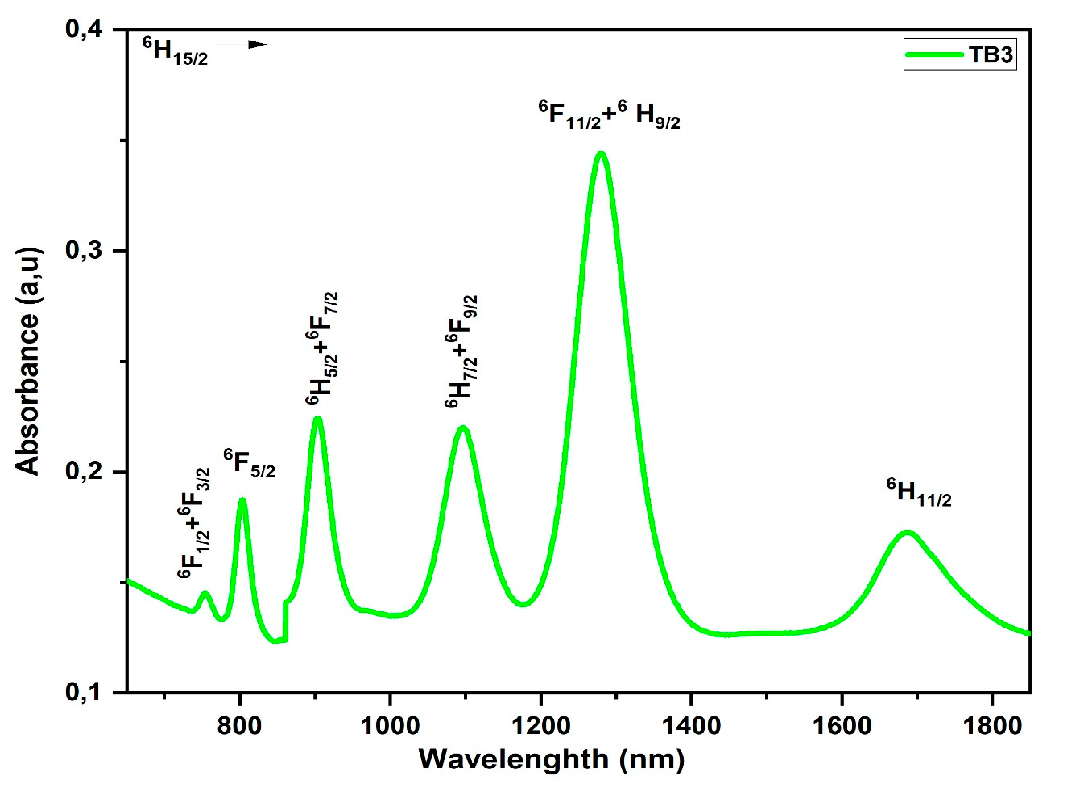
In Figure 7, we see the spectra of TB3 glass, which has many bands concentrated in the 700 to 1900 nm range. The transition from the ground state 6H15/2 to the excited states 6H11/2, 6F11/2 + 6 H9/2, 6F9/2 + 6H7/2, 6F7/2 + 6H5/2, 6F5/2, and 6F3/2 + 6F1/2, respectively, is reflected in absorption bands at 1686, 1279, 1095, 903,803, and 753 nm for Dy3+ with the 4f9 electronic configuration [24]. Table 6 shows the calculated and experimental oscillator strengths, as well as the J–O parameters.
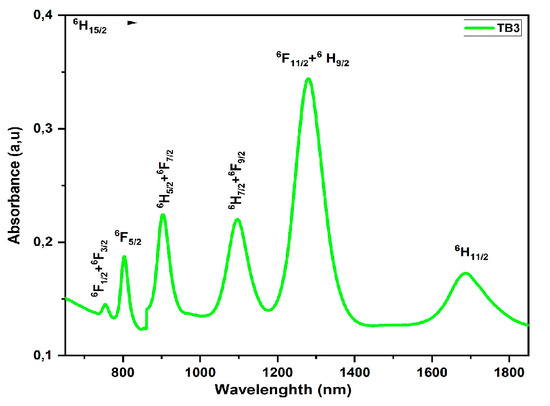
Figure 7.
Absorption spectra of Dy3+-doped glass.

Table 6.
The oscillator strengths and J–O parameters determined from TB3 glass absorption spectra.
3.5.4. Erbium (Er3+)
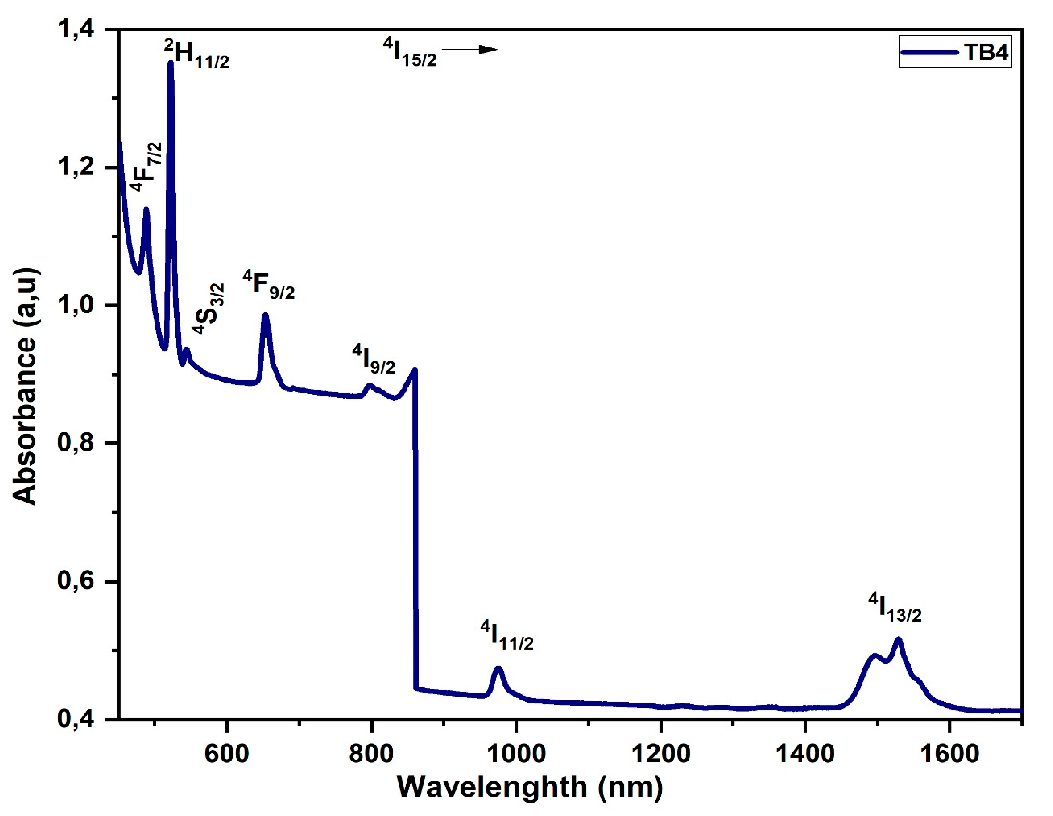
Starting with the ground state 4I15/2 to the excited states 4I13/2, 4I11/2, 4I9/2,4F9/2, 4S3/2, 2H11/2, and 4F7/2, the absorption transitions of Er3+ ions in tellurite glass connect with absorption bands centered about 1529, 974, 796, 652, 544, 522, and 486 nm [14,25], which are presented in Figure 8. Table 7 shows there is no overlap between the spectra and J–O parametrization. The small RMS confirms that the intensities of the experimental and theoretical oscillators are very similar.
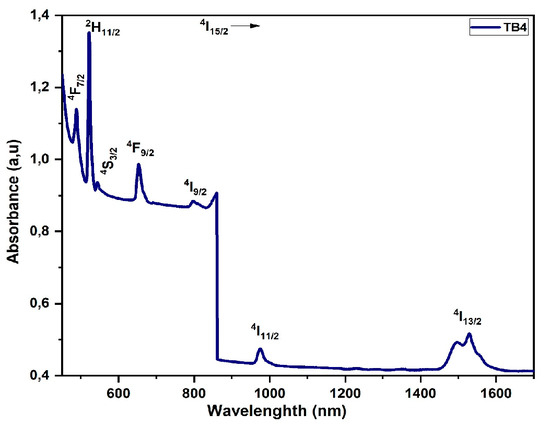
Figure 8.
Absorption spectra of Er3+-doped glass.

Table 7.
The oscillator strengths and J–O parameters determined from TB4 glass absorption spectra.
For the lanthanide series, we now know the J–O parameters. Since the intensities of the f-f transitions in lanthanides are ligand-dependent, the findings indicate the predicted trends of the (Ω2, Ω4, Ω6) parameters with the rising of f-f electrons across the rare-earth series. The RMSE measures how well the data fit the model. In addition, we compared the (Ω2, Ω4, Ω6) calculations in our matrices to those in the scientific literature (Table 8) [8,25,26,27,28,29,30,31,32,33,34,35,36,37,38,39].

Table 8.
Comparison of the Judd–Ofelt parameters Ωλ (λ = 2; 4; 6) of glass sample (80-y) TeO2-20 BiCl3-y RE2O3 (y = 0, 0.6% mol; RE = Nd, Sm, Dy, and Er).
The molecular nature of metal–ligand bonds has also been connected to the J–O parameters. Due to the matrix structure complex that these ligands are a part of, the Ω2 is dependent on a hypersensitive transition. Due to the fact that f orbitals are far more insulated from the environment than metal d orbitals, consideration must be taken while inferring the spectroscopic and structural connection. On the other hand, the matrix plays an important role, because it provides a broad compositional field that changes with the glass transition, crystallization temperature, and melting temperature. Consequently, these variables affect the dimensions of intensity in different ways. Therefore, the parameters of intensity are still within the experimentally acceptable range [18].
The J–O parameter trend over the lanthanides in tellurite glasses is well recognized. When the number of f-f electrons is higher, the Ω2 behavior tendency increases, which is similar to other matrices like fluorohafnate glasses and oxyfluoride glass ceramics.
The high oscillator strengths at the hypersensitive transitions may explain why the Ω2 values of Nd3+ and Dy3+ ions are so large relative to the predicted trend. When the values of the individual matrix’s elements are large, the resulting Ω2 parameter are also large. Furthermore, it is difficult to determine the exact values of Ω2 due to the overlap of bands in the UV region, as shown in Figure 4 and Figure 6. This is because the observed and theoretical oscillator strengths for Nd3+ and Dy3+ are consistent. As a consequence, it is possible to derive many transitions from a single, complicated absorption band.
In fact, the predicted and experimental findings for the oscillator strengths of the hypersensitive transitions were more in agreement than those for the lesser oscillator strength of the UV transitions (i.e., Nd3+ and Dy3+). According to R. Van Deun et al. [8,18], the absorption spectra of Er3+ exhibit strong, nonoverlapping absorption bands, equally scattered from the UV area to the NIR region; hence, the Ω2 values for these spectra do not cause any complications for J–O calculations. The strength of the oscillator may be calculated, and the J–O parameters can be estimated.
For Sm3+, the transition spectra and computed modified J–O parameters exhibited good agreement, with low RMSE and non-negative parameter values for the predicted oscillator strengths.
The findings in Table 8 indicate that the trend towards a series that is suitable with the literature [18] decreases for the parameters Ω4 and Ω6. The nuclear charge increased by 4f N causes lanthanide shell contraction, which causes a decrease in the radius integrations in the matrix elements, an observable decreasing tendency [22].
Covalence of the RE3+-F bond was investigated by comparing the findings to those of previous spectral studies published in the literature (Table 8). There was no obvious correlation between the spectral profile and the glass composition in our data. Therefore, it is not obvious that the spectral profile of the hypersensitive transition is dependent on the tellurite concentration, but the data clearly suggest that the intensity of the oscillator increases with the higher concentration.
3.6. Raman Spectra
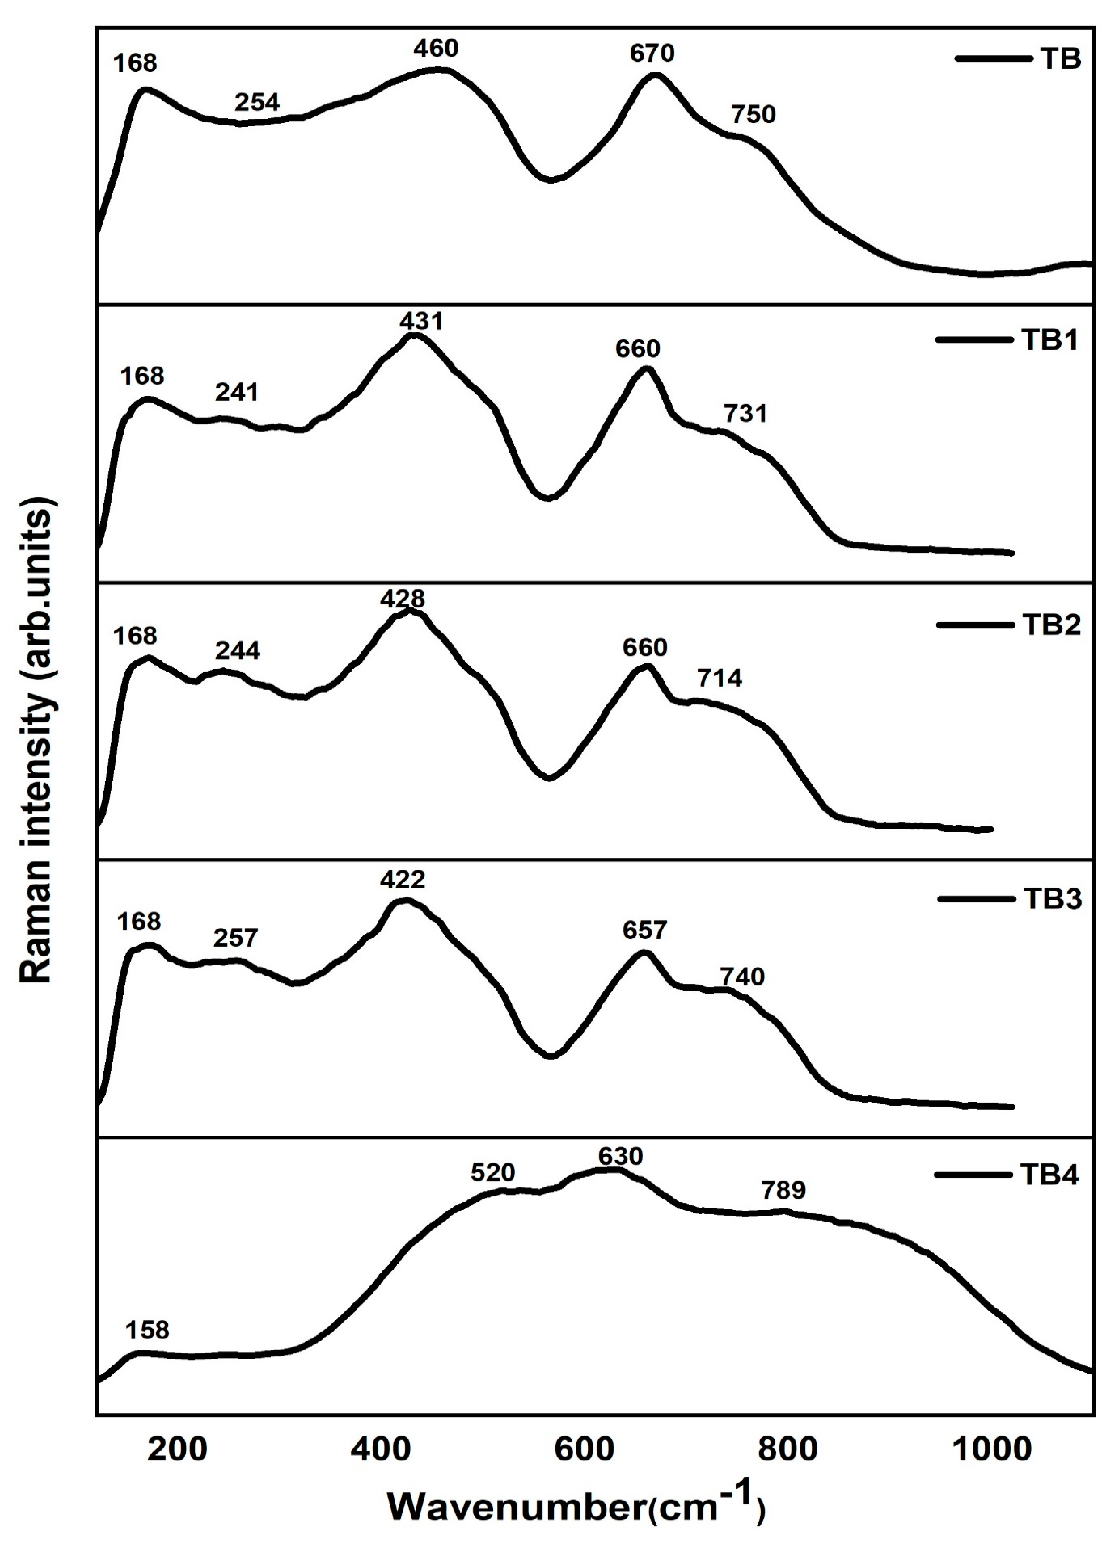
The glass samples (80-y) TeO2-20 BiCl3-y RE2O3 (y = 0, 0.6% mol; RE = Nd, Sm, Dy, and Er) have Raman spectra that are obtained in the spectral range of 50–1200 cm−1 (Figure 9). Table 9 lists the Raman band assignments, while Table 10 lists the observed Raman band positions for all compositions.
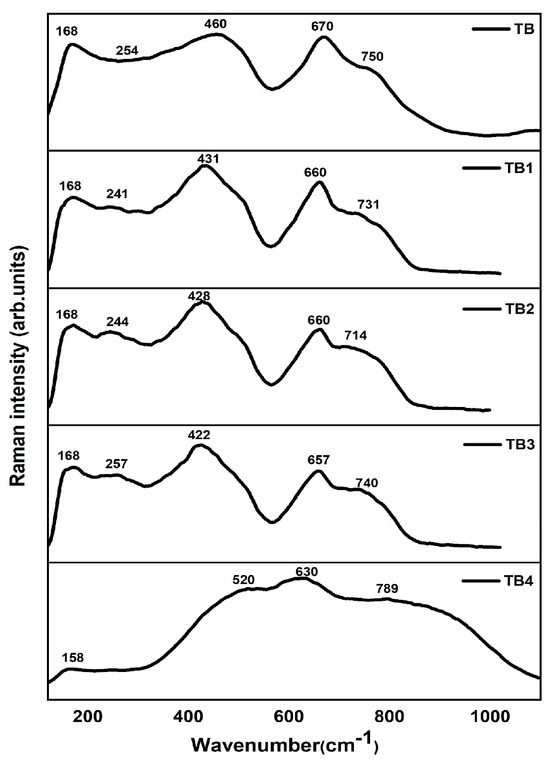
Figure 9.
Raman spectra of TB glasses.

Table 9.
Peak positions in cm−1 of the prepared glasses.

Table 10.
Assignments of deconvoluted Raman bands of the TB glass samples.
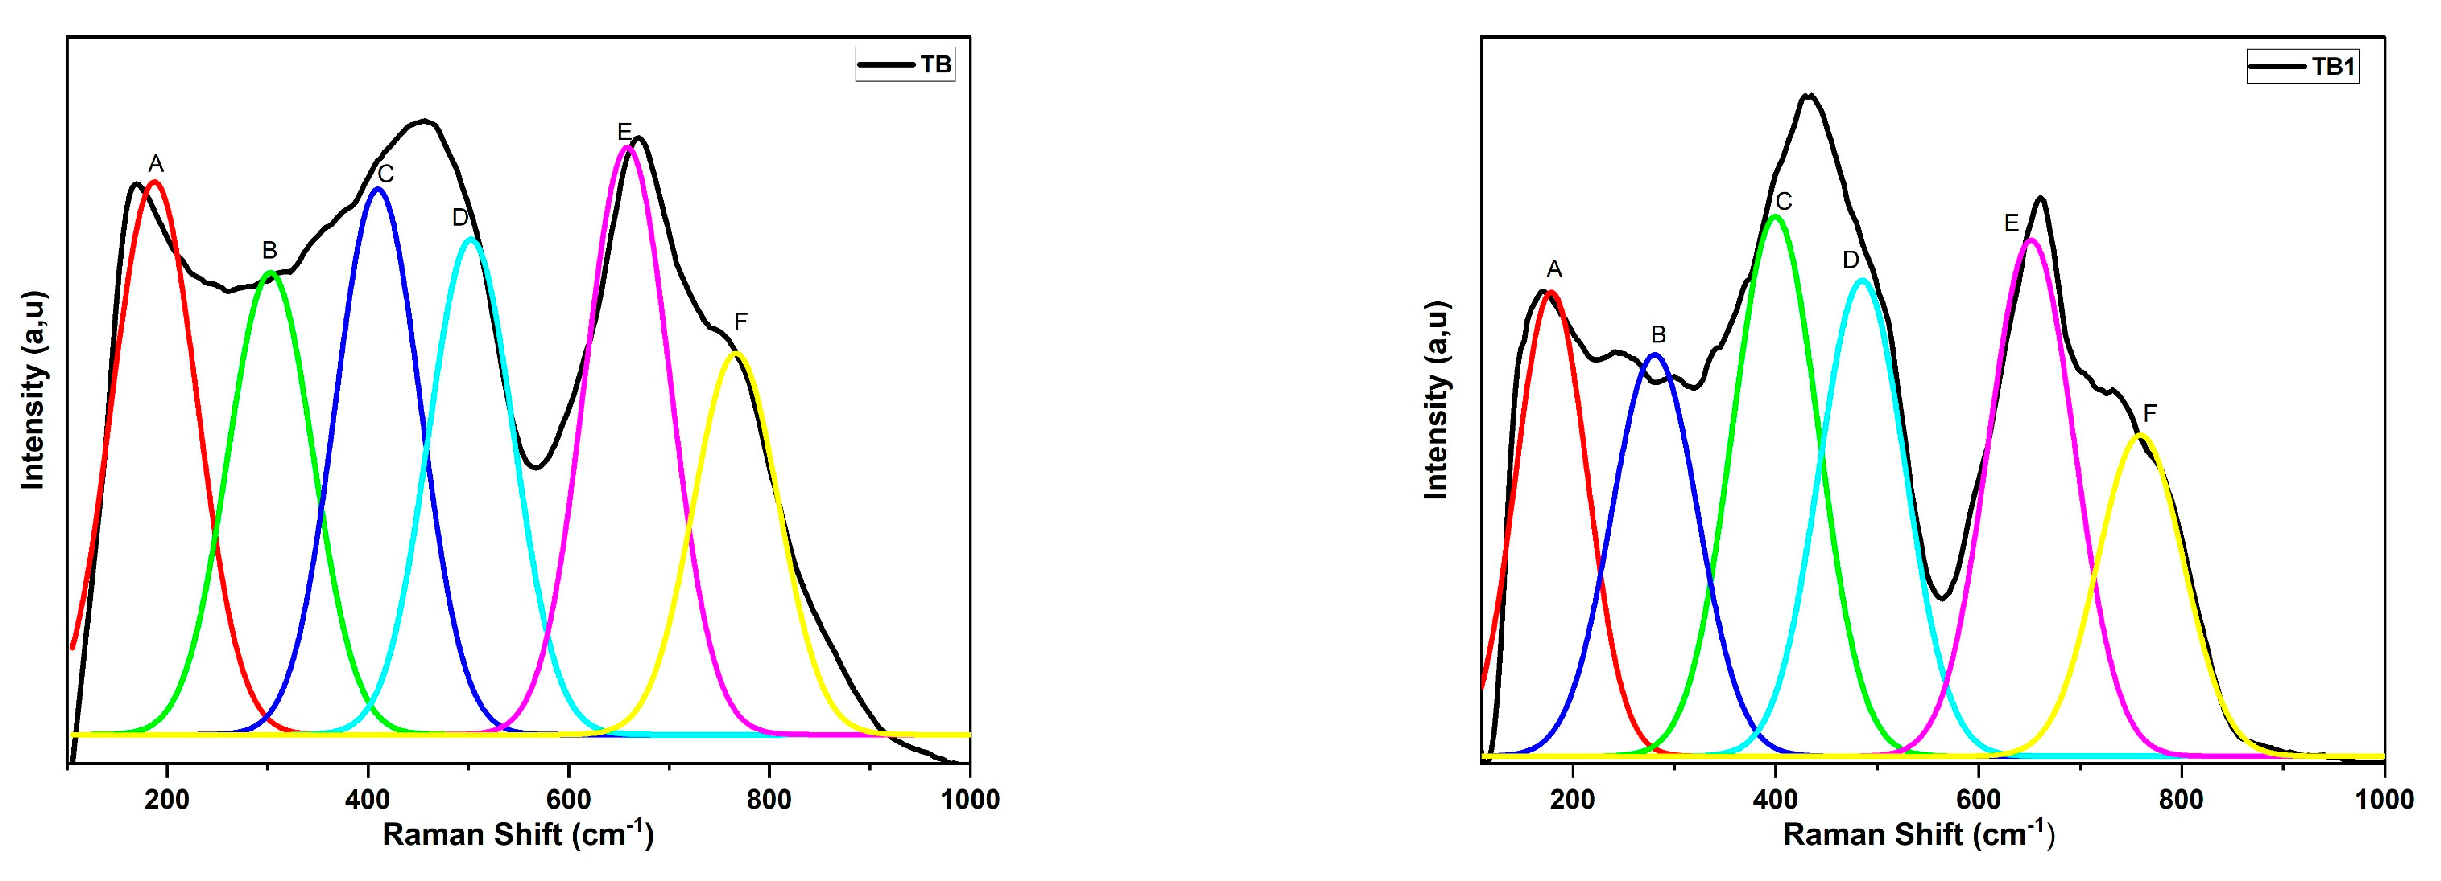
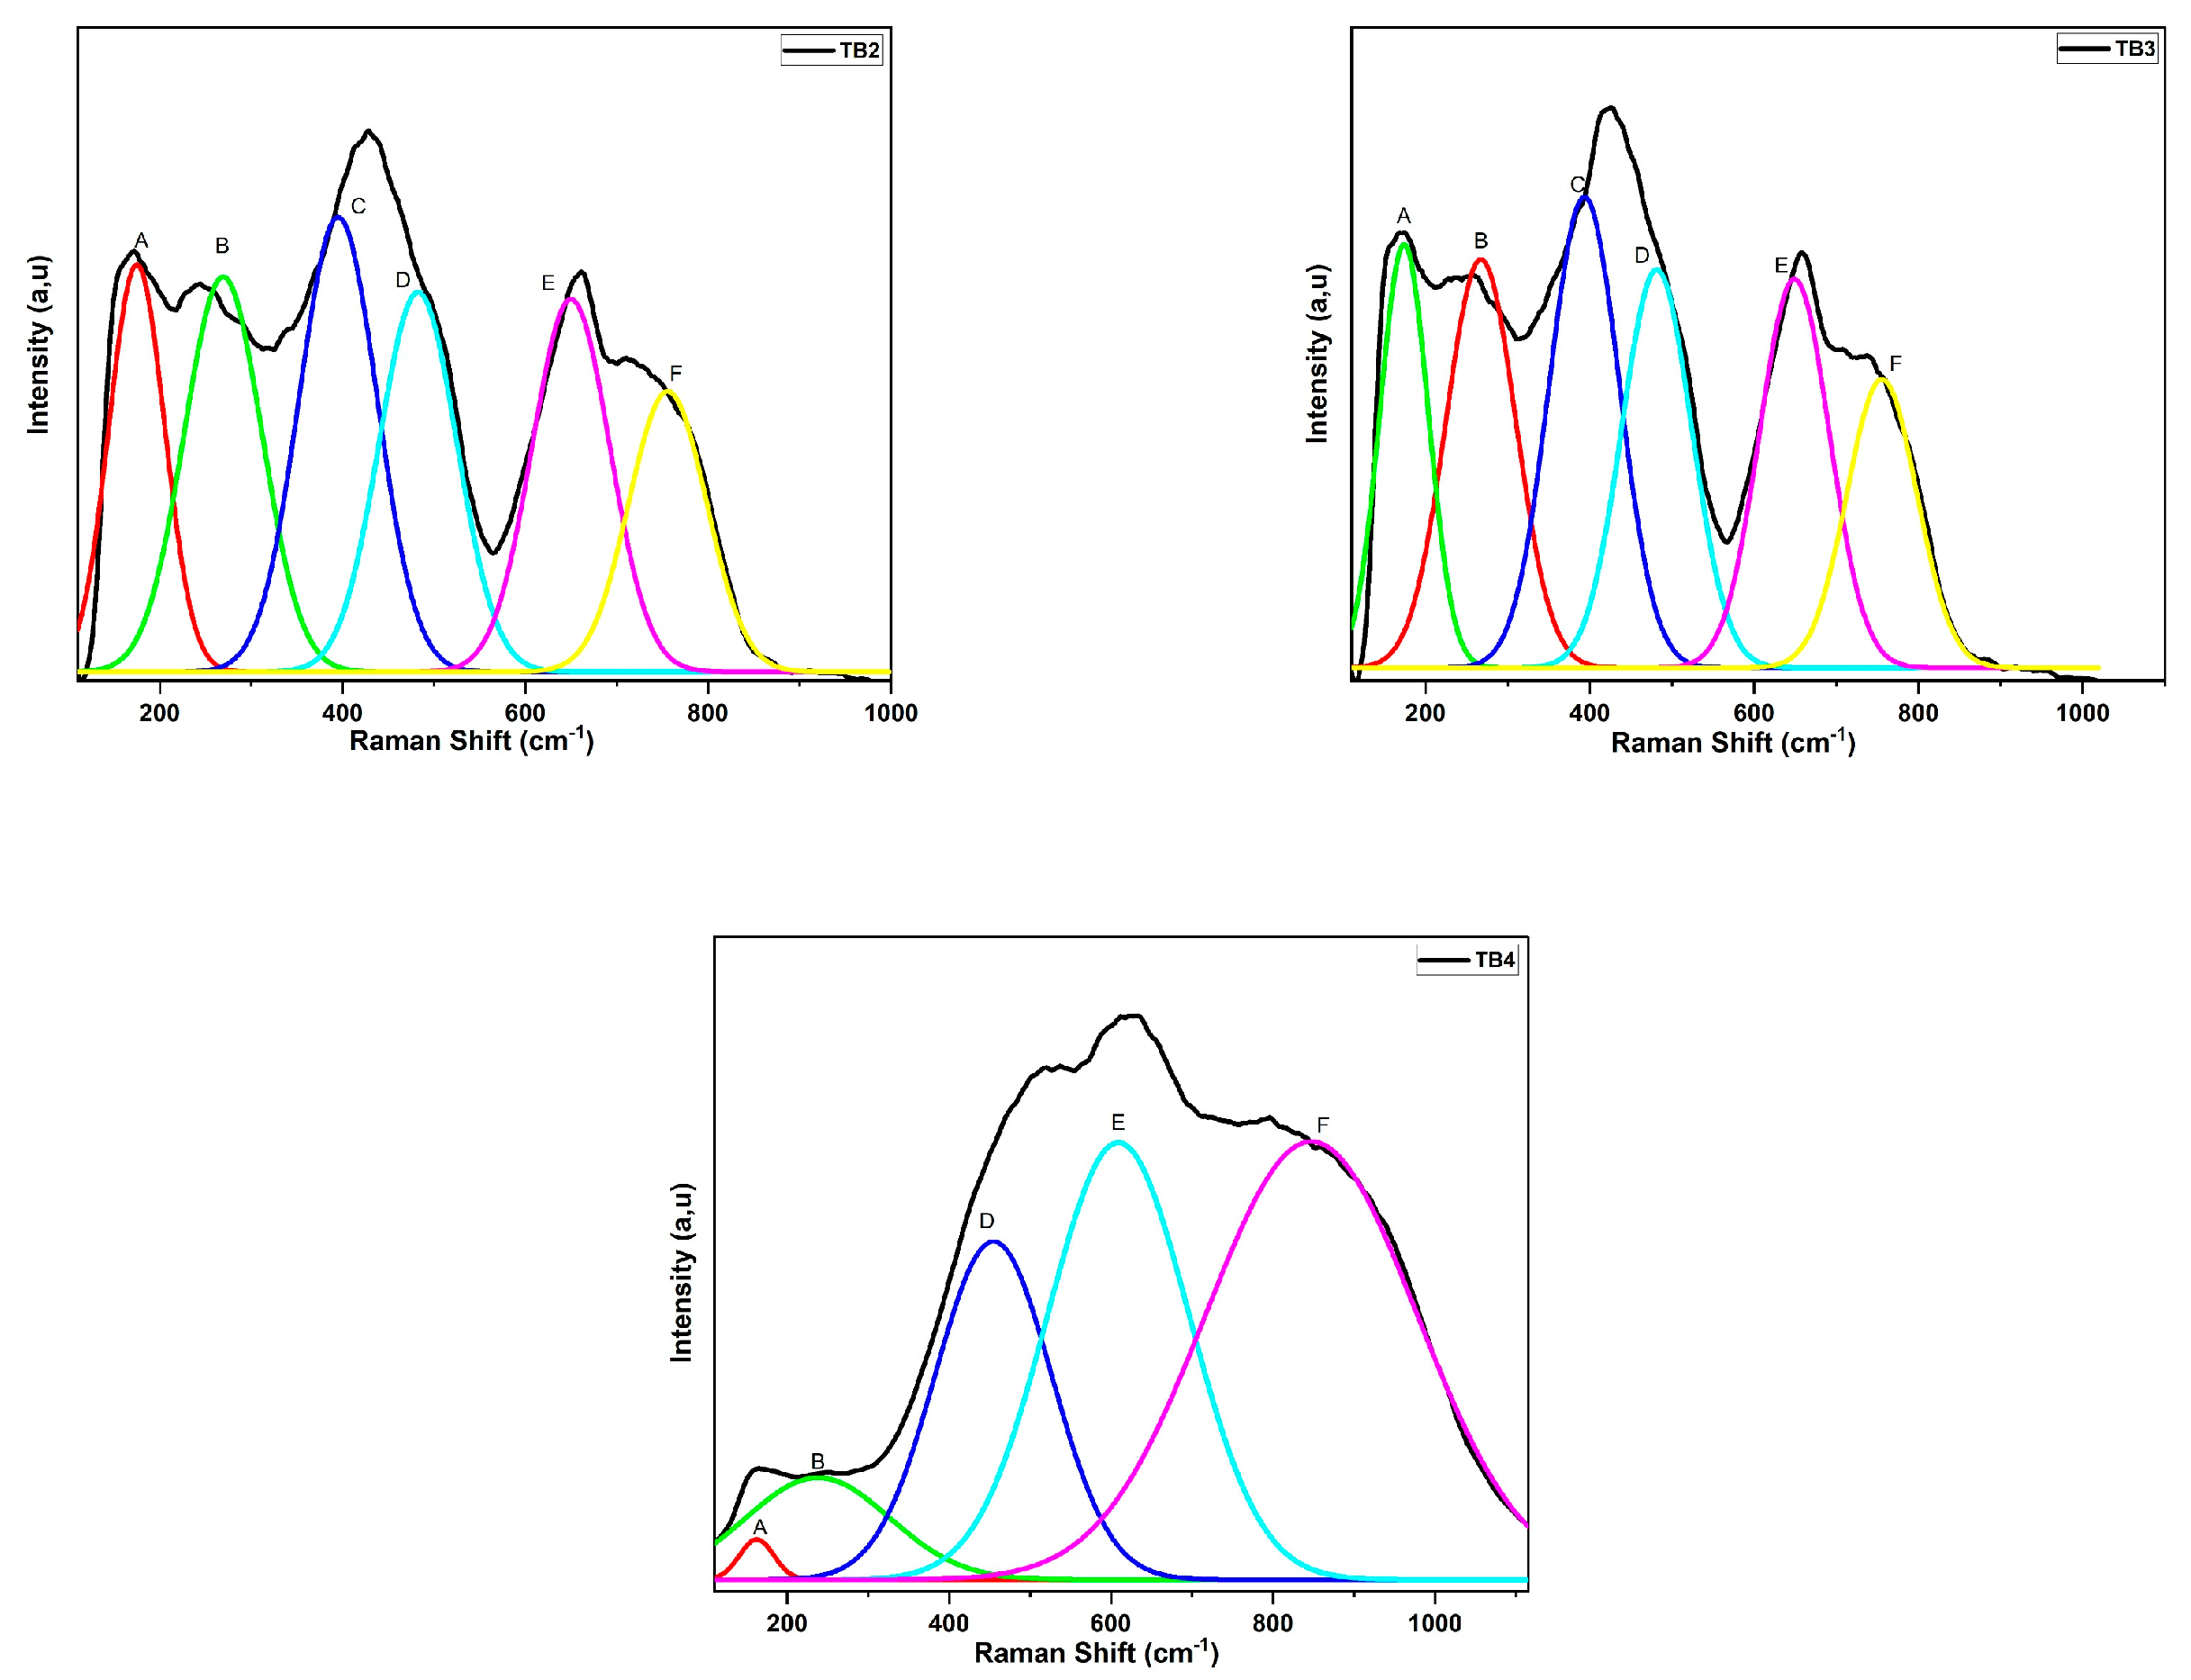
Figure 10 displays the deconvoluted Raman spectra for TB. Six symmetrical Gaussian peaks can be found in the Raman spectra of the TB glass, which are located around 163–188, 237–303, 394–411, 453–503, 609–658, and 757–854 cm−1. Peaks A, B, C, D, E, and F are used to determine them, respectively.
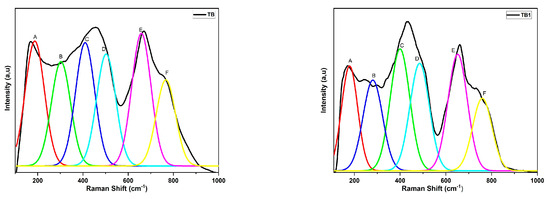
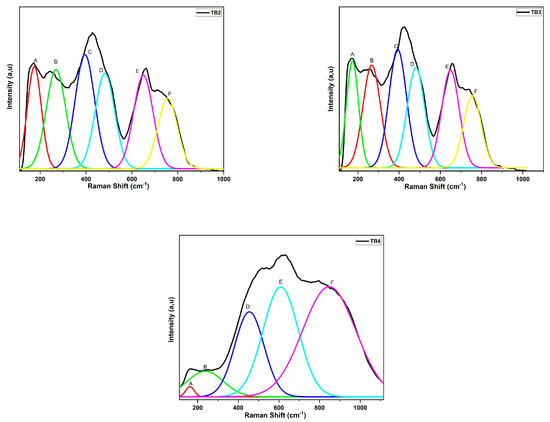
Figure 10.
Peak deconvolution of Raman spectra of the (80-y) TeO2-20 BiCl3-y RE2O3 (y = 0, 0.6% mol; RE = Nd, Sm, Dy, and Er) glass system.
According to several tellurite glasses, including TeO2-BiCl3 [40], ZnO-Bi2O3- TeO2 [41], TeO2-TiO2-WO3-Nd2O3 [42], TeO2-ZnO-Na2CO3-Er2O3 [43], and TeO2- TiO2-WO3-Dy2O3 [44], the Raman band 394–854 cm−1 appears to be characteristic for a tellurite matrix. It is important to note that the TeO2 network is made up of a number of asymmetric structural elements, including TeO4 trigonal bipyramids (tbp), TeO3+1 polyhedra, and TeO3 trigonal pyramids (tp). The TeO4 group also contains two axial and two equatorial oxygen atoms and doping with rare-earth ions has a significant impact on how TeO4 tbp transforms into TeO3+1 and TeO3 tp units. Additionally, the addition of a network modifier to TeO2-based glasses causes the Te-O-Te bonds to break, resulting in the creation of non-bridging oxygen (NBO) atoms and a shift in the Te coordination polyhedron from TeO4 to TeO3 [3].
The collective modes of local structures and heavy metal ion vibrations, such as the motion of Bi3+ or Bi+3 cations in BiO6 octahedral and/or BiO3 pyramidal units, are responsible for the observed band labeled (A) around 163–188 cm−1, which was observed when studying the structure of these glasses [5,15]. Bi-O-Bi and Bi-O vibrations of BiO6 octahedral units may be responsible for the band designated (B) at 237–303 cm−1 [40].
The TeO4 axial bending vibration mode (Oac-Te-Oac) at corner sharing sites, which combines the structure’s equatorial oxygen atoms with axial oxygen atoms, is responsible for the band designated (C) around 394–411 cm−1 in the sample. Sample TB4 does not include a peak around 360 cm−1, which may be attributed to either TeO3 tp or the Er-O bond; therefore, its presence may have been hidden by the strong Raman response of the TeO2 matrix or have been very low. Symmetrical or bending vibrations of Teeq-Oax-Te connections at corner sharing sites in TeO4 [40,45] account for the band designated (D) at 453–503 cm−1. Anti-symmetrical stretching of the continuous TeO4 tbps network is responsible for the (E) band seen between 609 and 658 cm−1 [2,42]. The (F) band at 757–854 cm−1 is due to Te-O and Te=O bond stretching vibrations in non-bridging oxygen in TeO3 tps and TeO3+1 polyhedra or Te2O7 bridged tetrahedra (Te-O-Te antisymmetric stretch) [40,42].
4. Conclusions
Research on rare-earth ion-doped tellurite glass was performed. It was observed that, when the number of doped ions varied, unbridged oxygen formed, causing a change in density. The glasses we produced had excellent thermal stability (>100 °C), as shown by the thermal inverted. The measurements for the refractive index showed an extremely high value (n = 2.47).
Studies of the Raman spectrum have shown that the addition of rare-earth ions modifies the structure of the system under investigation. We can deduce the following conclusions from this:
TeO2 exists in the TeO4 trigonal bipyramid, TeO3 tps, and TeO3+1 polyhedral structural unit with non-bridging oxygen (NBO).
In all of the studied glasses, bismuth acts as both network-forming BiO3 pyramidal units and network-changing BiO6 octahedral units.
The presence of rare-earth ions influences the formation of distinct tellurite structural units, thus the appearance of shifting Raman bands toward lower or higher wave numbers with varying intensities.
Trivalent lanthanide ions in tellurite glasses have been characterized by their J–O parameters, which we report. In the cases of Ω2 and Ω4, the findings show that there is no consistent pattern in the abundance of 4f electrons. However, Ω6 provides a universal connection that holds true not just in tellurite glass containers but also in other host matrices.
Author Contributions
Abstract and Methodology, M.L.; Introduction and Formal analysis, F.G.; Tables and Investigation, M.I.; Design of the study and discussion, N.B.; Interpretation of data and Visualization, P.S.P.; Data analysis and Supervision, P.V.R. All authors have read and agreed to the published version of the manuscript.
Funding
The authors extend their appreciation to the Ministry of Education in KSA for funding this research work through project number KKU-IFP2-DA-6.
Data Availability Statement
Not applicable.
Acknowledgments
The authors would like to express their gratitude to Khalid I. Hussain for the following contributions to this manuscript: conceptualization, methodology, investigation, funding acquisition, writing—editing, visualization, and review discussion. Also, the authors extend their appreciation to the Ministry of Education in KSA for funding this research work through project number KKU-IFP2-DA-6.
Conflicts of Interest
The authors declare no conflict of interest.
References
- Selvi, S.; Marimuthu, K.; Muralidharan, G. Structural and luminescence behavior of Sm3+ ions doped lead boro-telluro-phosphate glasses. J. Lumin. 2015, 159, 207–218. [Google Scholar] [CrossRef]
- Elkhoshkhany, N.; Marzouk, S.; El-Sherbiny, M.; Ibrahim, H.; Burtan-Gwizdala, B.; Alqahtani, M.S.; Hussien, K.I.; Reben, M.; Yousef, E.S. Investigation of structural, physical, and attenuation parameters of glass: TeO2-Bi2O3-B2O3-TiO2-RE2O3 (RE: La, Ce, Sm, Er, and Yb), and applications thereof. Materials 2022, 15, 5393. [Google Scholar] [CrossRef]
- Yousef, E.; Hegazy, H.; Elokr, M.; Aboudeif, Y. Raman spectroscopy and raman gain coefficient of telluroniobium-zinc-lead oxyglasses doped with rare earth. Chalcogenide Lett. 2015, 12, 653–663. [Google Scholar]
- Stalin, S.; Gaikwad, D.; Samee, M.; Edukondalu, A.; Ahmmad, S.K.; Joshi, A.; Syed, R. Structural, optical features and gamma ray shielding properties of Bi2O3– TeO2– B2O3-GeO2 glass system. Ceram. Int. 2020, 46, 17325–17334. [Google Scholar] [CrossRef]
- Fong, W.; Baki, S.O.; Arifin, N.; Mansor, Y.; Nazri, A.; Abbas, B.K. Structural, thermal and optical properties of rare earth doped lead-tellurite oxide glasses. J. Adv. Res. Fluid Mech. Therm. Sci. 2021, 81, 52–58. [Google Scholar]
- Layne, C.; Lowdermilk, W.; Weber, M.J. Multiphonon relaxation of rare-earth ions in oxide glasses. Phys. Rev. B 1977, 16, 10. [Google Scholar] [CrossRef]
- Serqueira, E.; Dantas, N.; Monte, A.; Bell, M. Judd Ofelt calculation of quantum efficiencies and branching ratios of Nd3+ doped glasses. J. Non-Cryst. Solids 2006, 352, 3628–3632. [Google Scholar] [CrossRef]
- Lalla, E.; Konstantinidis, M.; De Souza, I.; Daly, M.; Martín, I.; Lavín, V.; Rodríguez-Mendoza, U. Judd-Ofelt parameters of RE3+-doped fluorotellurite glass (RE3+ = Pr3+, Nd3+, Sm3+, Tb3+, Dy3+, Ho3+, Er3+, and Tm3+). J. Alloys Compd. 2020, 845, 156028. [Google Scholar] [CrossRef]
- Baki, S.; Tan, L.; Kan, C.; Kamari, H.; Noor, A.; Mahdi, M. Structural and optical properties of Er3+-Yb3+ codoped multicomposition TeO2-ZnO-PbO-TiO2-Na2O glass. J. Non-Cryst. Solids 2013, 362, 156–161. [Google Scholar] [CrossRef]
- Damak, K.; Maâlej, R.; Qusti, A.H.; Rüssel, C. Thermal and spectroscopic properties of Tm3+ doped TZPPN transparent glass laser material. J. Non-Cryst. Solids 2012, 358, 2974–2980. [Google Scholar] [CrossRef]
- Damak, K.; Charfi, B.; Algarni, H.; Alqahtani, M.S.; Alshari, A.; Reben, M.; Abd-Rabboh, H.S. Characterization of oxyfluoride glasses doped with rare-earth ions through structural, thermal, and optical application thereof. Results Phys. 2022, 34, 105255. [Google Scholar]
- Dousti, M.; Amjad, R.; Sahar, M.; Zabidi, Z.; Alias, A.; de Camargo, A.S.S. Er3+-doped zinc tellurite glasses revisited: Concentration dependent chemical durability, thermal stability and spectroscopic properties. J. Non-Cryst. Solids 2015, 429, 70–78. [Google Scholar] [CrossRef]
- Saad, M.; Poulain, M. Glass forming ability criterion. In Materials Science Forum; Trans Tech Publications Ltd.: Bach, Switzerland, 1987; pp. 11–18. [Google Scholar]
- Iezid, M.; Goumeidane, F.; Abidi, A.; Poulain, M.; Legouera, M.; Prasad, P.S.; Środa, M.; Rao, P.V. Judd-Ofelt analysis and luminescence studies of Er3+ doped halogeno-antimonate glasses. Opt. Mater. 2021, 120, 111422. [Google Scholar] [CrossRef]
- Suthanthirakumar, P.; Arunkumar, S.; Marimuthu, K. Spectroscopic properties and excited state dynamics of Sm3+ ions in zinc telluro-fluoroborate glasses. J. Lumin. 2018, 202, 289–300. [Google Scholar] [CrossRef]
- Elkhoshkhany, N.; Marzouk, S.; El–Sherbiny, M.; Yousri, S.; Alqahtani, M.S.; Algarni, H.; Reben, M. Enhanced thermal stability and optical and structural properties of Tm3+ ions in doped tellurite glasses for photonic use. Results Phys. 2021, 24, 104202. [Google Scholar] [CrossRef]
- Dimitrov, V.; Sakka, S. Linear and nonlinear optical properties of simple oxides. II. J. Appl. Phys. 1996, 79, 1741–1745. [Google Scholar] [CrossRef]
- Van Deun, R.; Binnemans, K.; Görller-Walrand, C.; Adam, J.-L. Judd–Ofelt intensity parameters of trivalent lanthanide ions in a NaPO3–BaF2 based fluorophosphate glass. J. Alloys Compd. 1999, 283, 59–65. [Google Scholar] [CrossRef]
- Wu, J. Thulium Doped Microsphere Laser and Fiber Laser; The University of Arizona: Tucson, AZ, USA, 2005. [Google Scholar]
- Azlan, M.; Halimah, M. Role of Nd3+ nanoparticles on enhanced optical efficiency in borotellurite glass for optical fiber. Results Phys. 2018, 11, 58–64. [Google Scholar] [CrossRef]
- Klimesz, B.; Dominiak-Dzik, G.; Żelechower, M.; Ryba-Romanowski, W. Optical study of GeO2–PbO–PbF2 oxyfluoride glass single doped with lanthanide ions. Opt. Mater. 2008, 30, 1587–1594. [Google Scholar] [CrossRef]
- Nieboer, E.; Jørgensen, C.; Peacock, R.; Reisfeld, R.; Peacock, R.D. The intensities of lanthanide f↔ f transitions. In Rare Earths; Springer: Berlin/Heidelberg, Germany, 1975; pp. 83–122. [Google Scholar]
- Rao, V.H.; Prasad, P.S.; Babu, M.M.; Rao, P.V.; Santos, L.F.; Raju, G.N.; Veeraiah, N. Luminescence properties of Sm3+ ions doped heavy metal oxide tellurite-tungstate-antimonate glasses. Ceram. Int. 2017, 43, 16467–16473. [Google Scholar] [CrossRef]
- Amjad, R.J.; Sahar, M.; Ghoshal, S.; Dousti, M.; Arifin, R. Synthesis and characterization of Dy3+ doped zinc–lead-phosphate glass. Opt. Mater. 2013, 35, 1103–1108. [Google Scholar] [CrossRef]
- Kumar, V.R.K.; Bhatnagar, A.K.; Jagannathan, R. Structural and optical studies of Pr3+, Nd3+, Er3+ and Eu3+ ions in tellurite based oxyfluoride, TeO2-LiF, glass. J. Phys. D Appl. Phys. 2001, 34, 1563. [Google Scholar] [CrossRef]
- Yuliantini, L.; Djamal, M.; Hidayat, R.; Boonin, K.; Kaewkhao, J.; Yasaka, P. Luminescence and Judd-Ofelt analysis of Nd3+ ion doped oxyfluoride boro-tellurite glass for near-infrared laser application. Mater. Today Proc. 2021, 43, 2655–2662. [Google Scholar] [CrossRef]
- Costa, F.; Yukimitu, K.; Nunes, L.; Figueiredo, M.; Andrade, L.; Lima, S.; Moraes, J. Spectroscopic properties of Nd3+-doped tungsten–tellurite glasses. J. Phys. Chem. Solids 2016, 88, 54–59. [Google Scholar] [CrossRef]
- Mahraz, Z.A.S.; Sazali, E.; Sahar, M.; Amran, N.U.; Yaacob, S.; Aziz, S.M.; Mawlud, S.; Noor, F.; Harun, A. Spectroscopic investigations of near-infrared emission from Nd3+-doped zinc-phosphate glasses: Judd-Ofelt evaluation. J. Non-Cryst. Solids 2019, 509, 106–114. [Google Scholar] [CrossRef]
- Thomas, S.; Rasool, S.N.; Rathaiah, M.; Venkatramu, V.; Joseph, C.; Unnikrishnan, N. Spectroscopic and dielectric studies of Sm3+ ions in lithium zinc borate glasses. J. Non-Cryst. Solids 2013, 376, 106–116. [Google Scholar] [CrossRef]
- Thomas, S.; George, R.; Rasool, S.N.; Rathaiah, M.; Venkatramu, V.; Joseph, C.; Unnikrishnan, N. Optical properties of Sm3+ ions in zinc potassium fluorophosphate glasses. Opt. Mater. 2013, 36, 242–250. [Google Scholar] [CrossRef]
- Rayappan, I.A.; Selvaraju, K.; Marimuthu, K. Structural and luminescence investigations on Sm3+ doped sodium fluoroborate glasses containing alkali/alkaline earth metal oxides. Phys. B Condens. Matter 2011, 406, 548–555. [Google Scholar] [CrossRef]
- Jamalaiah, B.; Kumar, J.S.; Babu, A.M.; Suhasini, T.; Moorthy, L.R. Photoluminescence properties of Sm3+ in LBTAF glasses. J. Lumin. 2009, 129, 363–369. [Google Scholar] [CrossRef]
- Rajesh, D.; Ratnakaram, Y.; Seshadri, M.; Balakrishna, A.; Krishna, T.S. Structural and luminescence properties of Dy3+ ion in strontium lithium bismuth borate glasses. J. Lumin. 2012, 132, 841–849. [Google Scholar] [CrossRef]
- Pisarska, J. Optical properties of lead borate glasses containing Dy3+ ions. J. Phys. Condens. Matter 2009, 21, 285101. [Google Scholar] [CrossRef] [PubMed]
- Elkhoshkhany, N.; Marzouk, S.; El–Sherbiny, M.; Anwer, H.; Alqahtani, M.S.; Algarni, H.; Reben, M. Investigation of structural and luminescence properties of borosilicate glass doped with Dy2O3. Results Phys. 2021, 27, 104544. [Google Scholar] [CrossRef]
- Mahraz, Z.A.S.; Sahar, M.; Ghoshal, S.; Dousti, M.R. Concentration dependent luminescence quenching of Er3+-doped zinc boro-tellurite glass. J. Lumin. 2013, 144, 139–145. [Google Scholar] [CrossRef]
- Rodin, N.L.A.; Sahar, M. Erbium doped sodium magnesium boro-tellurite glass: Stability and Judd-Ofelt analysis. Mater. Chem. Phys. 2018, 216, 177–185. [Google Scholar] [CrossRef]
- Fang, R.; Mei, Y.-Z.; Chao, G.; Zhu, L.-G.; Lu, A.-X. Thermal stability and Judd-Ofelt analysis of optical properties of Er3+-doped tellurite glasses. Trans. Nonferrous Met. Soc. China 2012, 22, 2021–2026. [Google Scholar]
- Sajna, M.; Thomas, S.; Mary, K.A.; Joseph, C.; Biju, P.; Unnikrishnan, N. Spectroscopic properties of Er3+ ions in multicomponent tellurite glasses. J. Lumin. 2015, 159, 55–65. [Google Scholar] [CrossRef]
- Wang, G.; Zhang, J.; Dai, S.; Wen, L.; Yang, J.; Jiang, Z. Structural investigation on TeO2–BiCl3 glassy system. J. Mol. Struct. 2005, 750, 1–6. [Google Scholar] [CrossRef]
- Ozdanova, J.; Ticha, H.; Tichy, L. Remark on the optical gap in ZnO–Bi2O3–TeO2 glasses. J. Non-Cryst. Solids 2007, 353, 2799–2802. [Google Scholar] [CrossRef]
- Fares, H.; Jlassi, I.; Elhouichet, H.; Férid, M. Investigations of thermal, structural and optical properties of tellurite glass with WO3 adding. J. Non-Cryst. Solids 2014, 396, 1–7. [Google Scholar] [CrossRef]
- Jlassi, I.; Elhouichet, H.; Hraiech, S.; Ferid, M. Effect of heat treatment on the structural and optical properties of tellurite glasses doped erbium. J. Lumin. 2012, 132, 832–840. [Google Scholar] [CrossRef]
- Jyothi, L.; Upender, G.; Kuladeep, R.; Rao, D.N. Structural, thermal, optical properties and simulation of white light of titanium-tungstate-tellurite glasses doped with dysprosium. Mater. Res. Bull. 2014, 50, 424–431. [Google Scholar] [CrossRef]
- Elkholy, H.; Othman, H.; Hager, I.; Ibrahim, M.; de Ligny, D. Thermal and optical properties of binary magnesium tellurite glasses and their link to the glass structure. J. Alloys Compd. 2020, 823, 153781. [Google Scholar] [CrossRef]
Disclaimer/Publisher’s Note: The statements, opinions and data contained in all publications are solely those of the individual author(s) and contributor(s) and not of MDPI and/or the editor(s). MDPI and/or the editor(s) disclaim responsibility for any injury to people or property resulting from any ideas, methods, instructions or products referred to in the content. |
© 2023 by the authors. Licensee MDPI, Basel, Switzerland. This article is an open access article distributed under the terms and conditions of the Creative Commons Attribution (CC BY) license (https://creativecommons.org/licenses/by/4.0/).

