
Analyzing the Relationship between the Chemical Composition and the Surface Finish of Alnico Alloys in EDM


Abstract
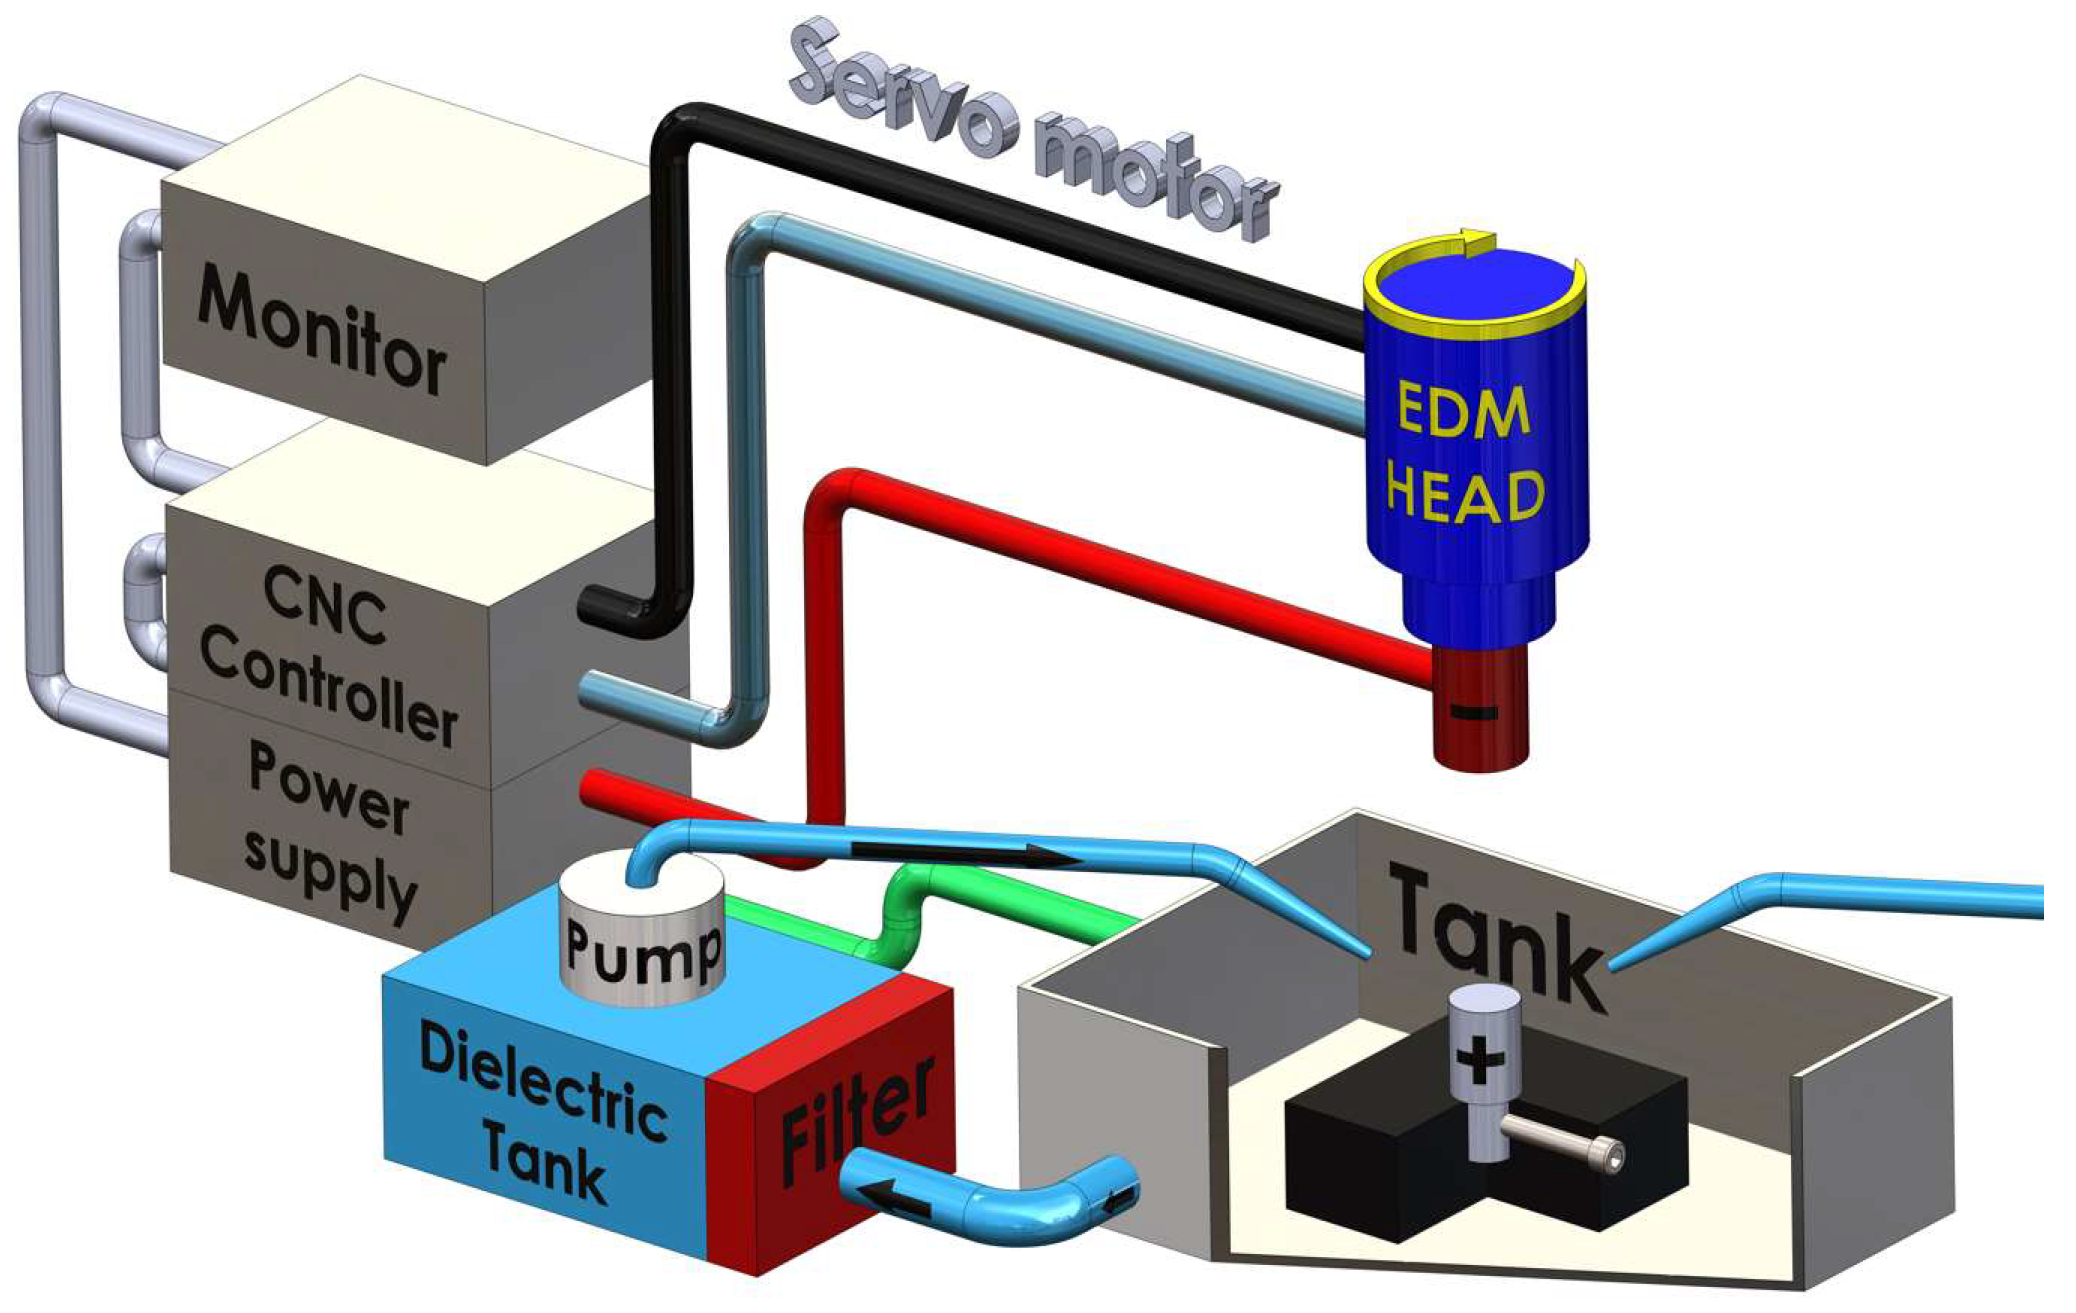
:1. Introduction
2. Materials and Methods
3. Results and Discussion
- where: m1—specimen mass before EDM, [g],
- m2—specimen mass after EDM, [g],
- ρ—density of Alnico = 7.3 [g/cm3],
- t—pulse duration time, [s].
4. Conclusions
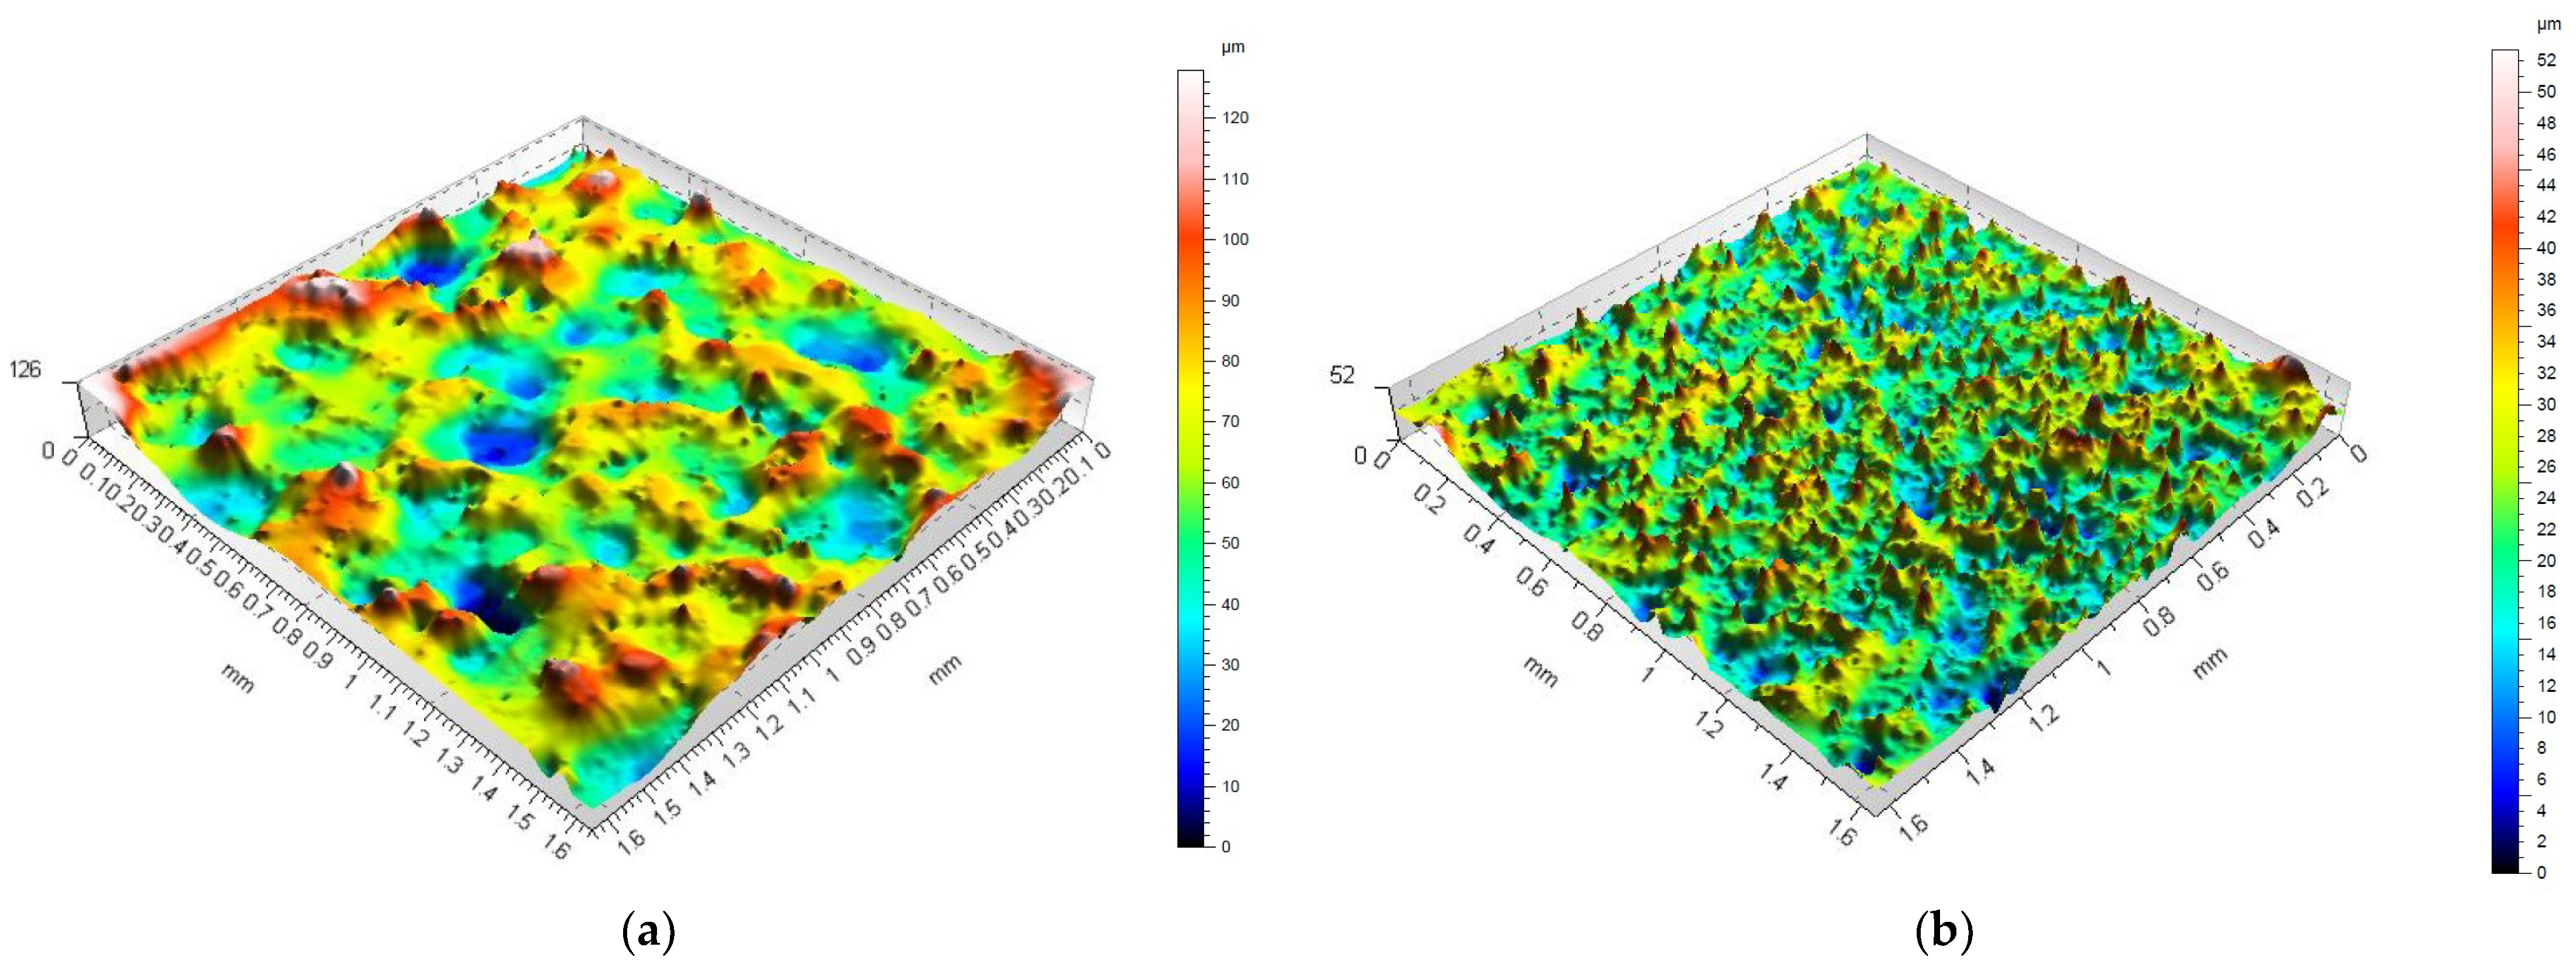
- the medium thickness of the white layer forming in EDM in the central point of experiments; for Alnico 2, Alnico 5, and Alnico 8, it was about 73.6 µm, 53.3 µm, and 33.0 µm, respectively;
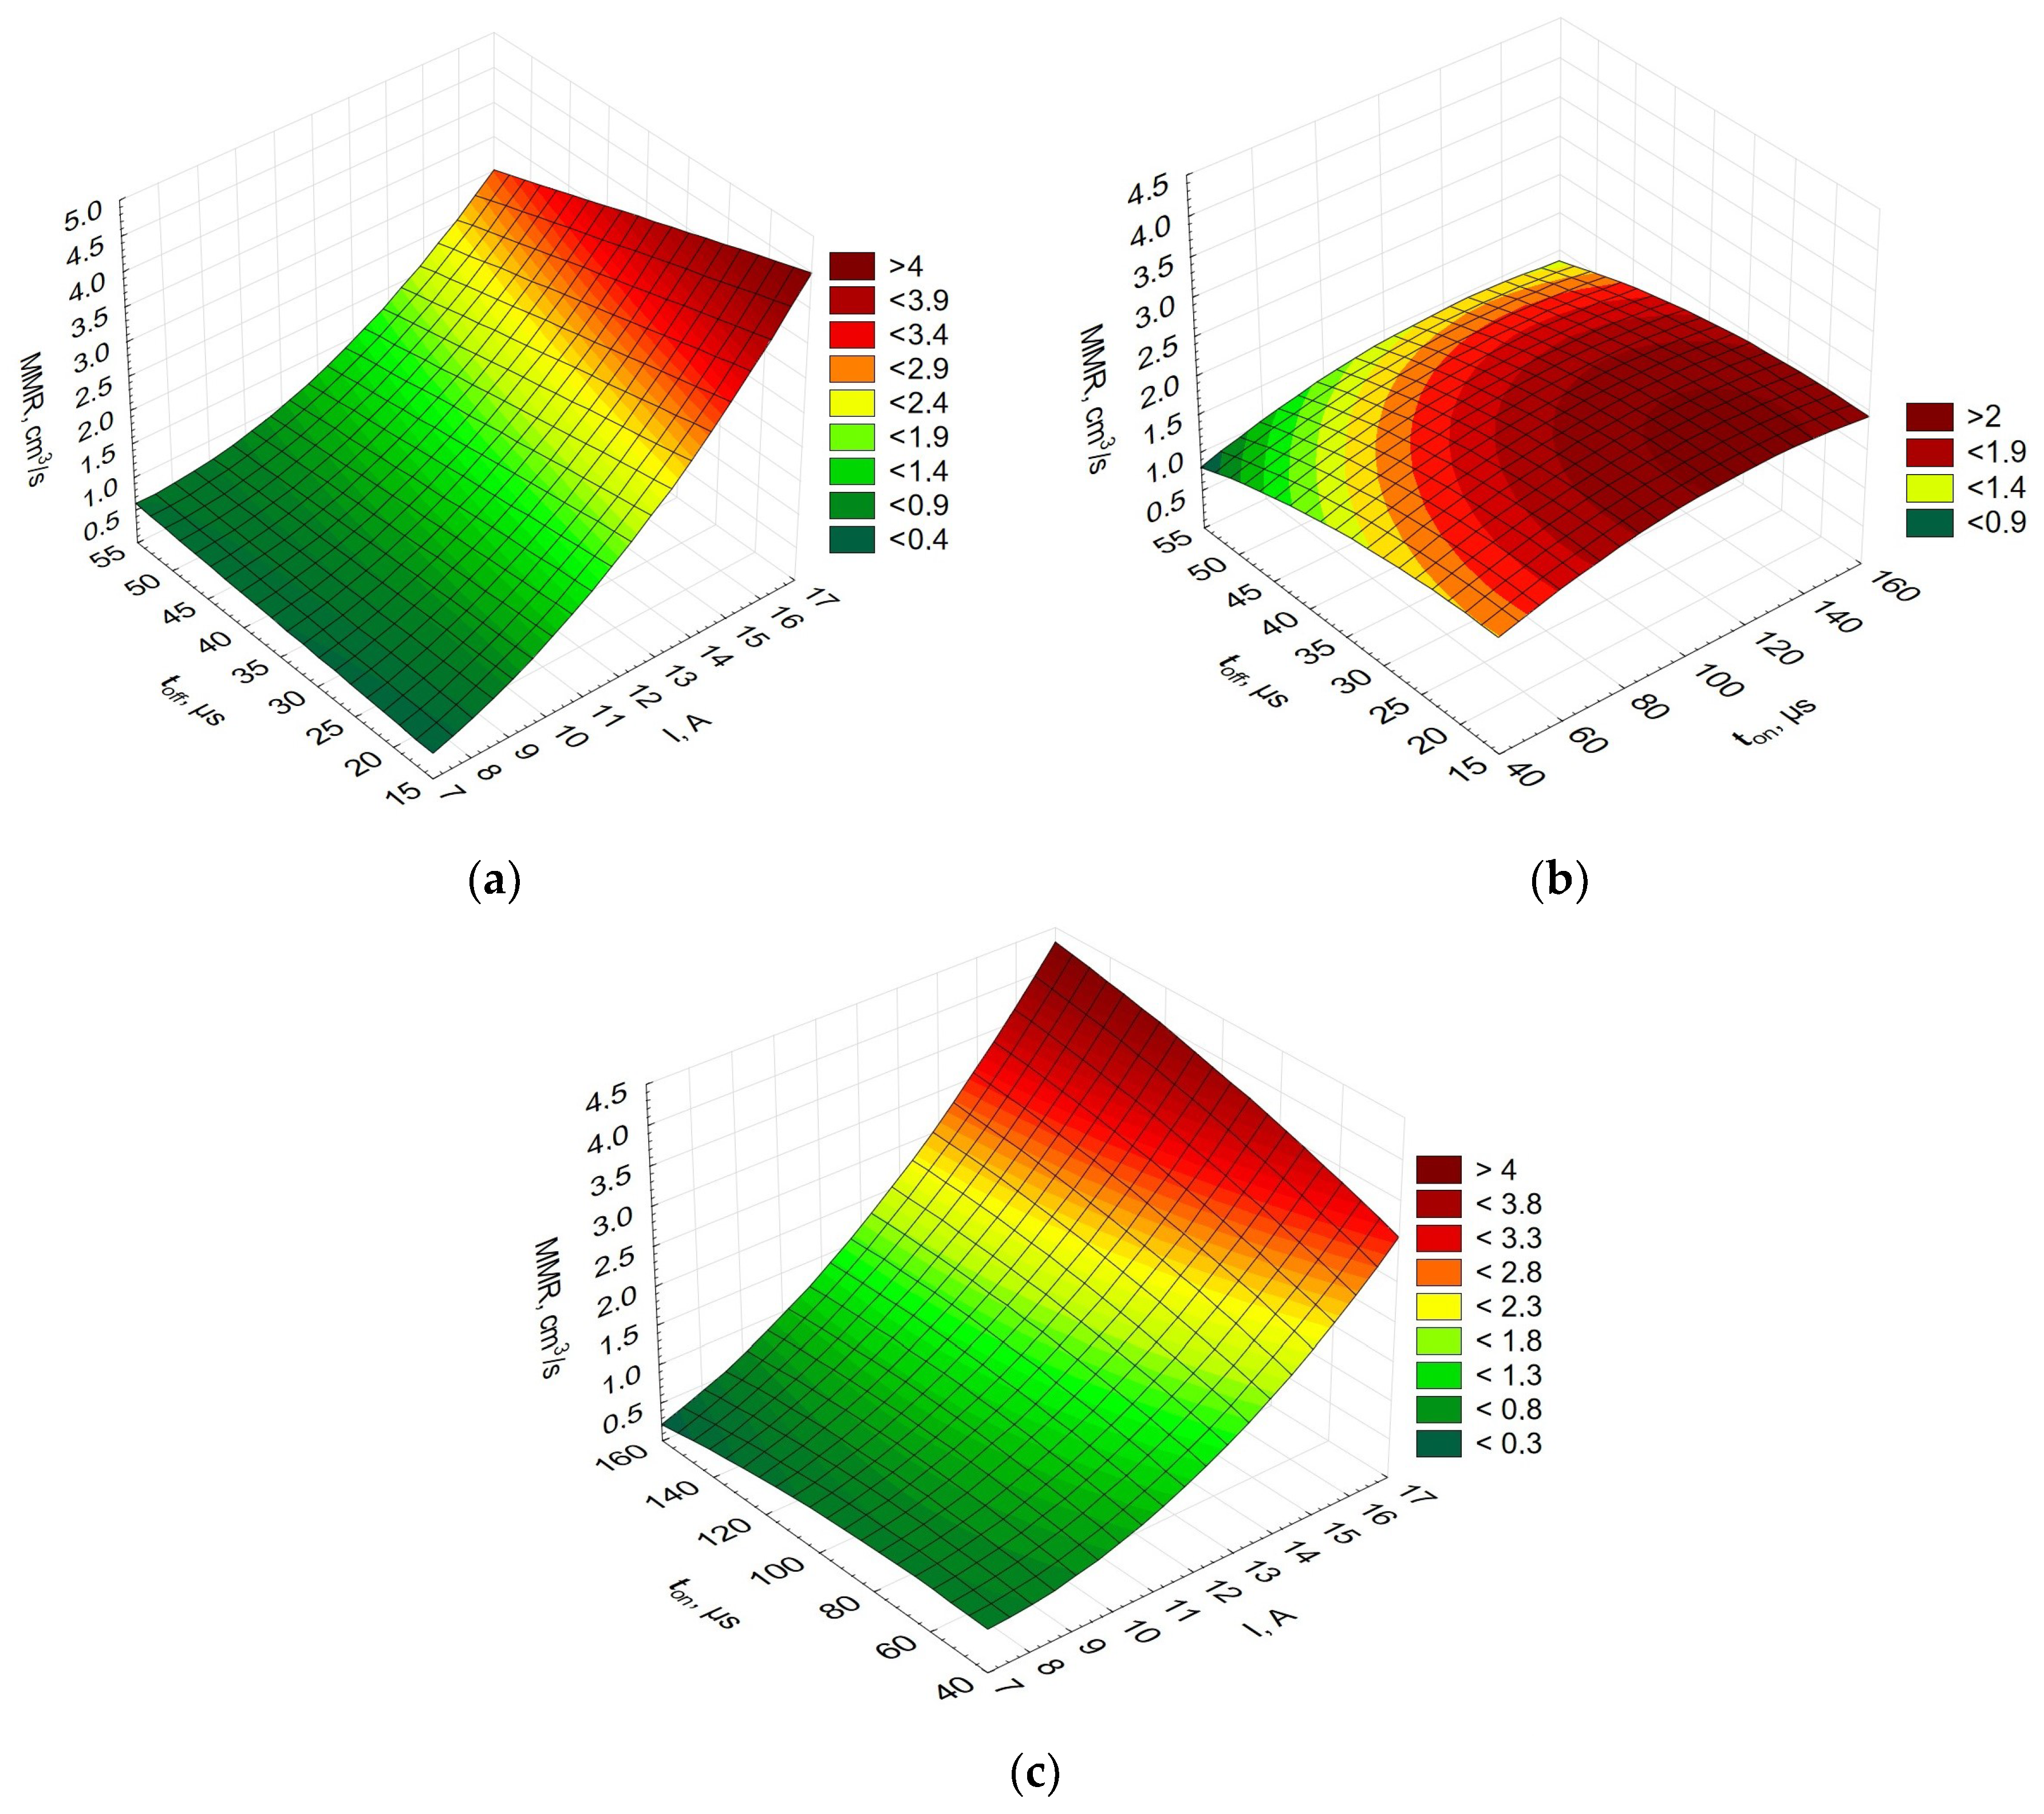
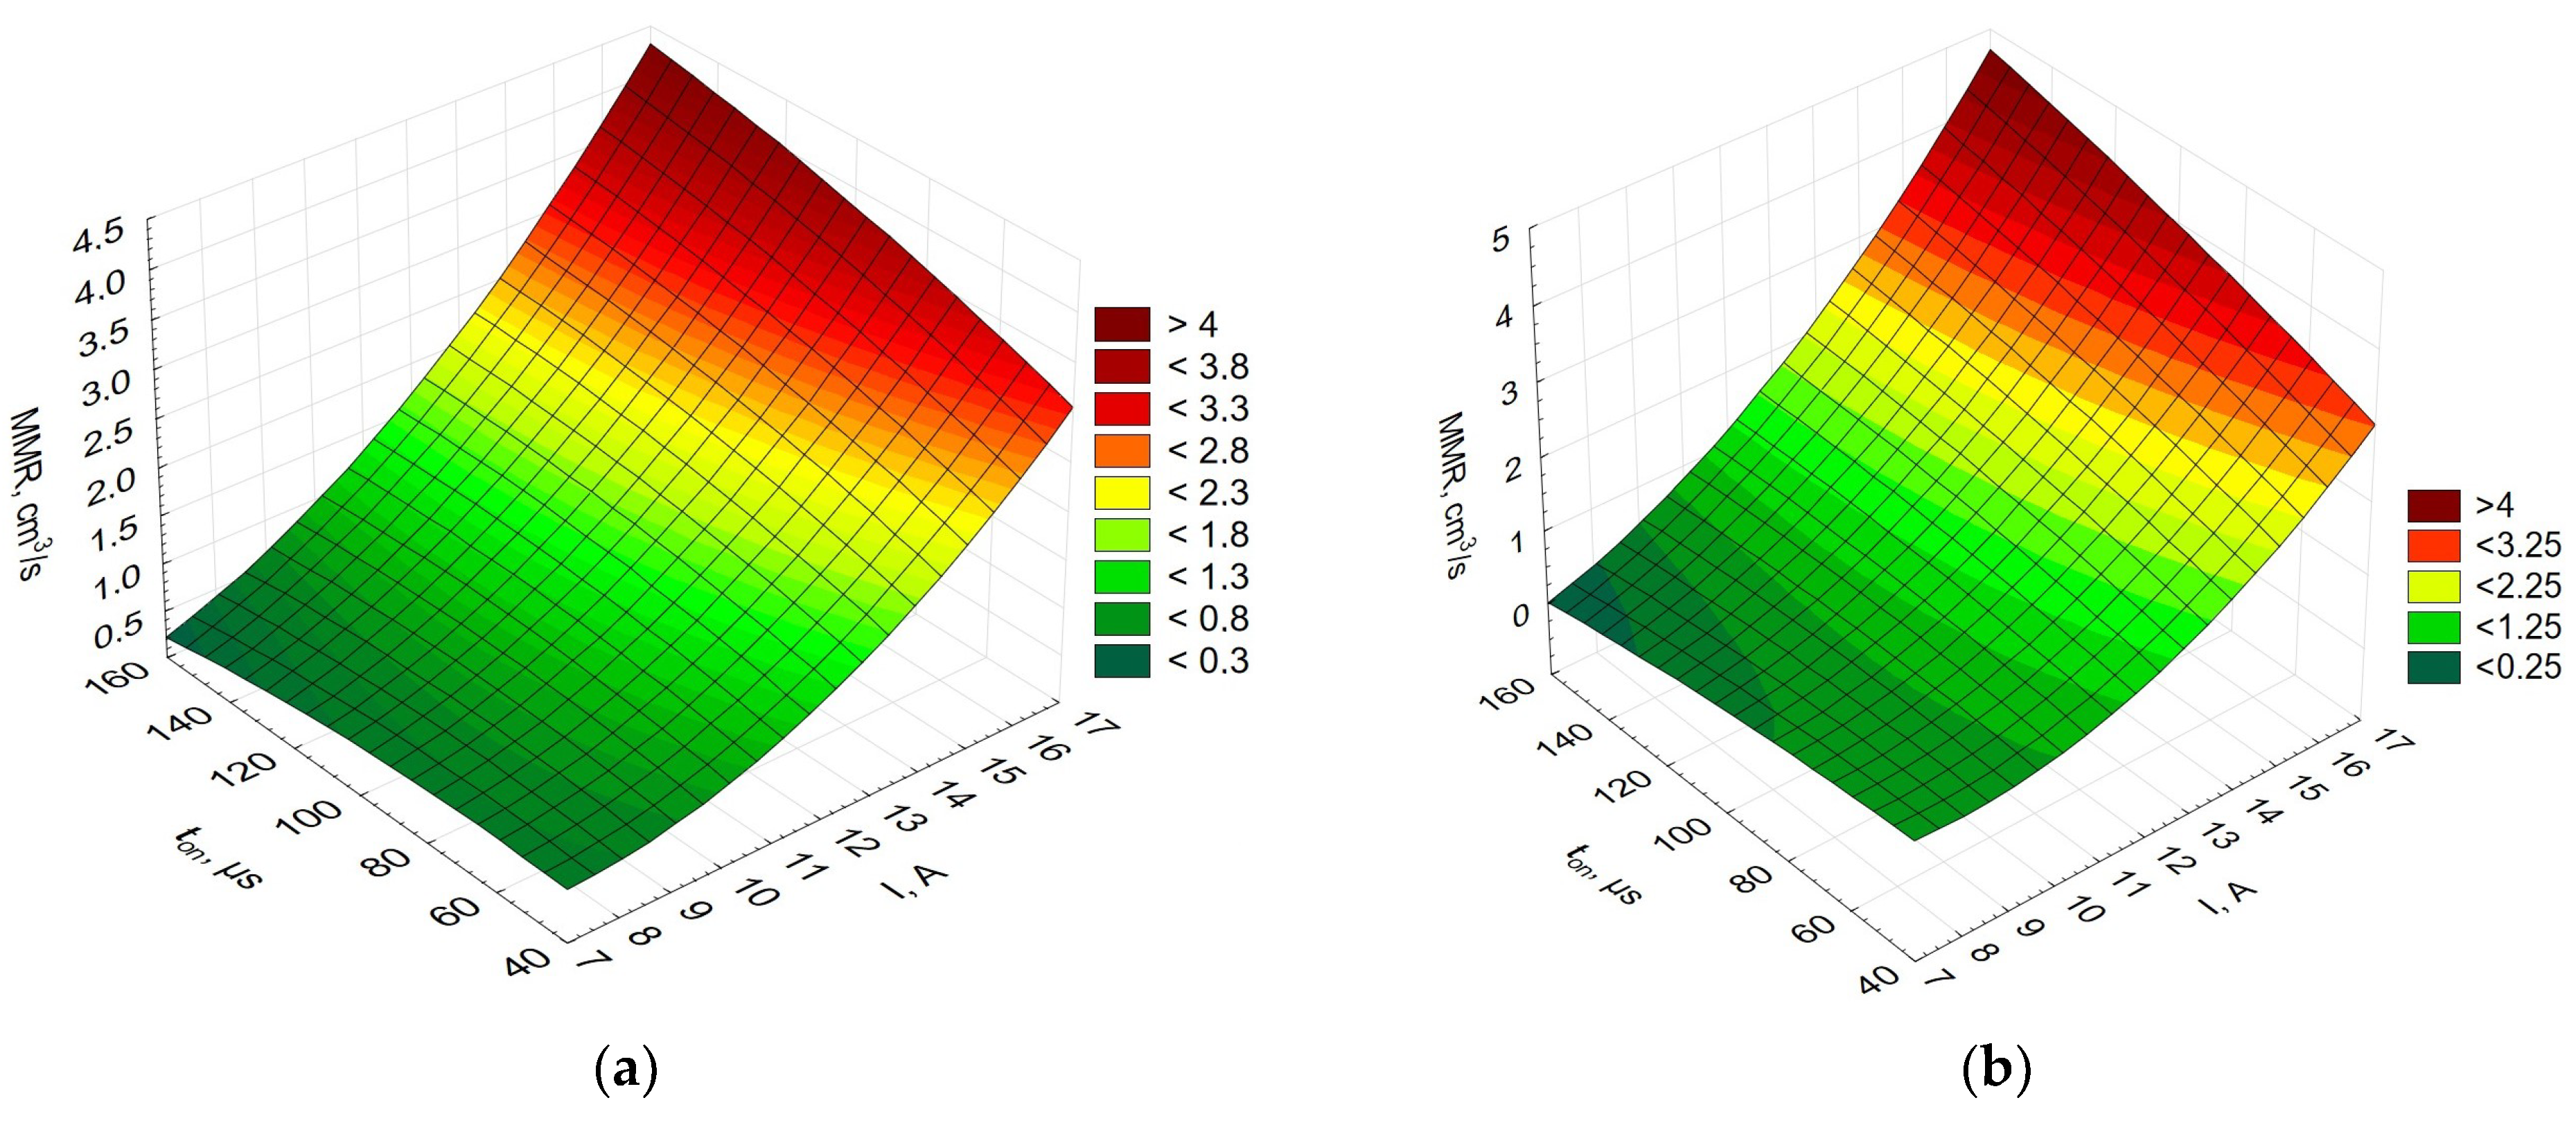
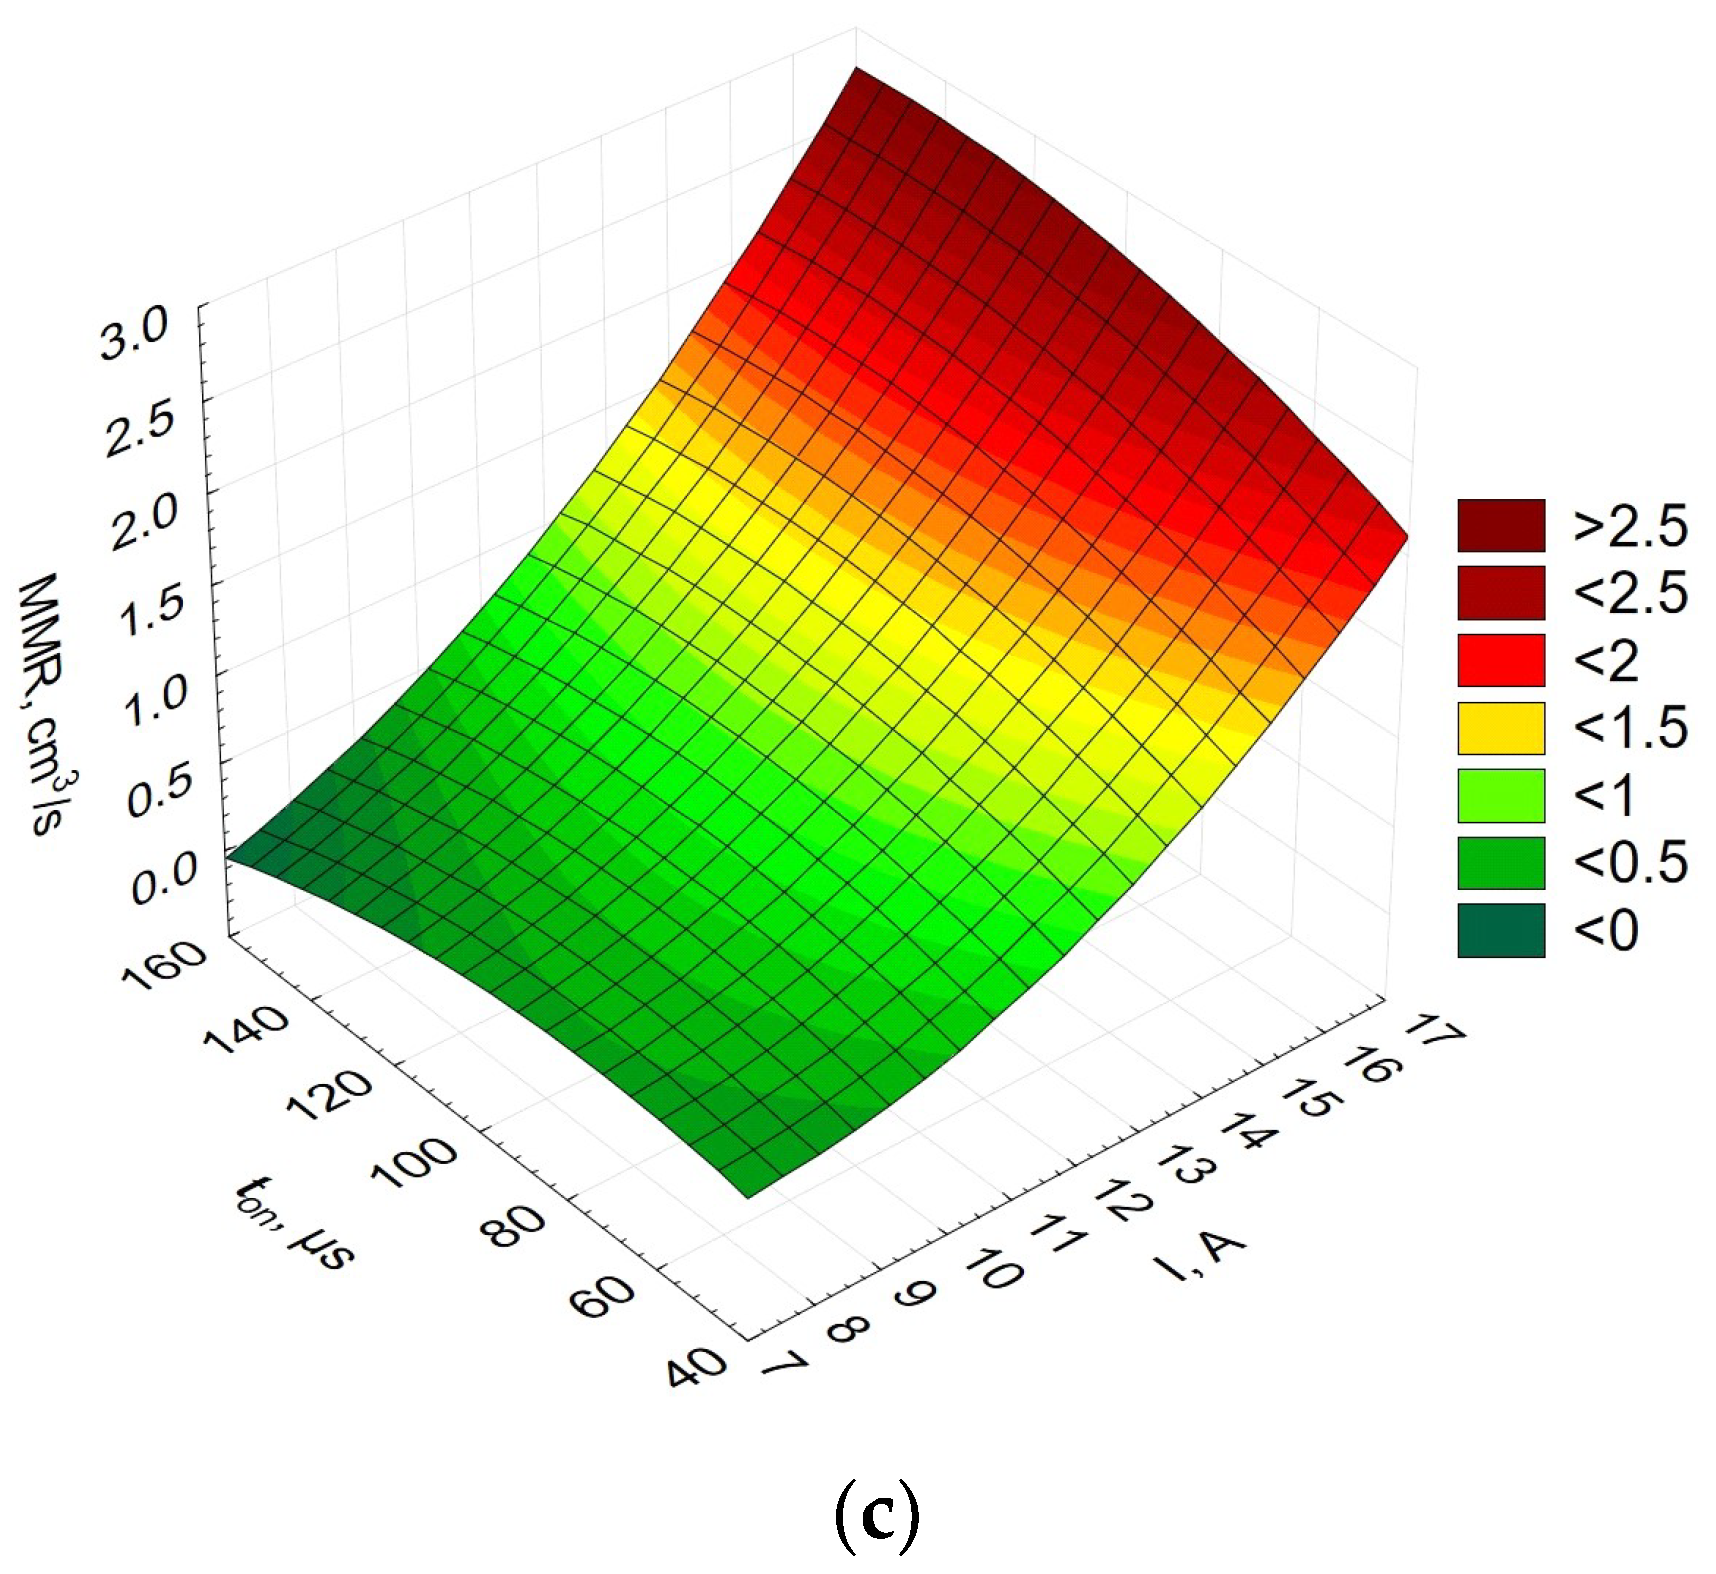
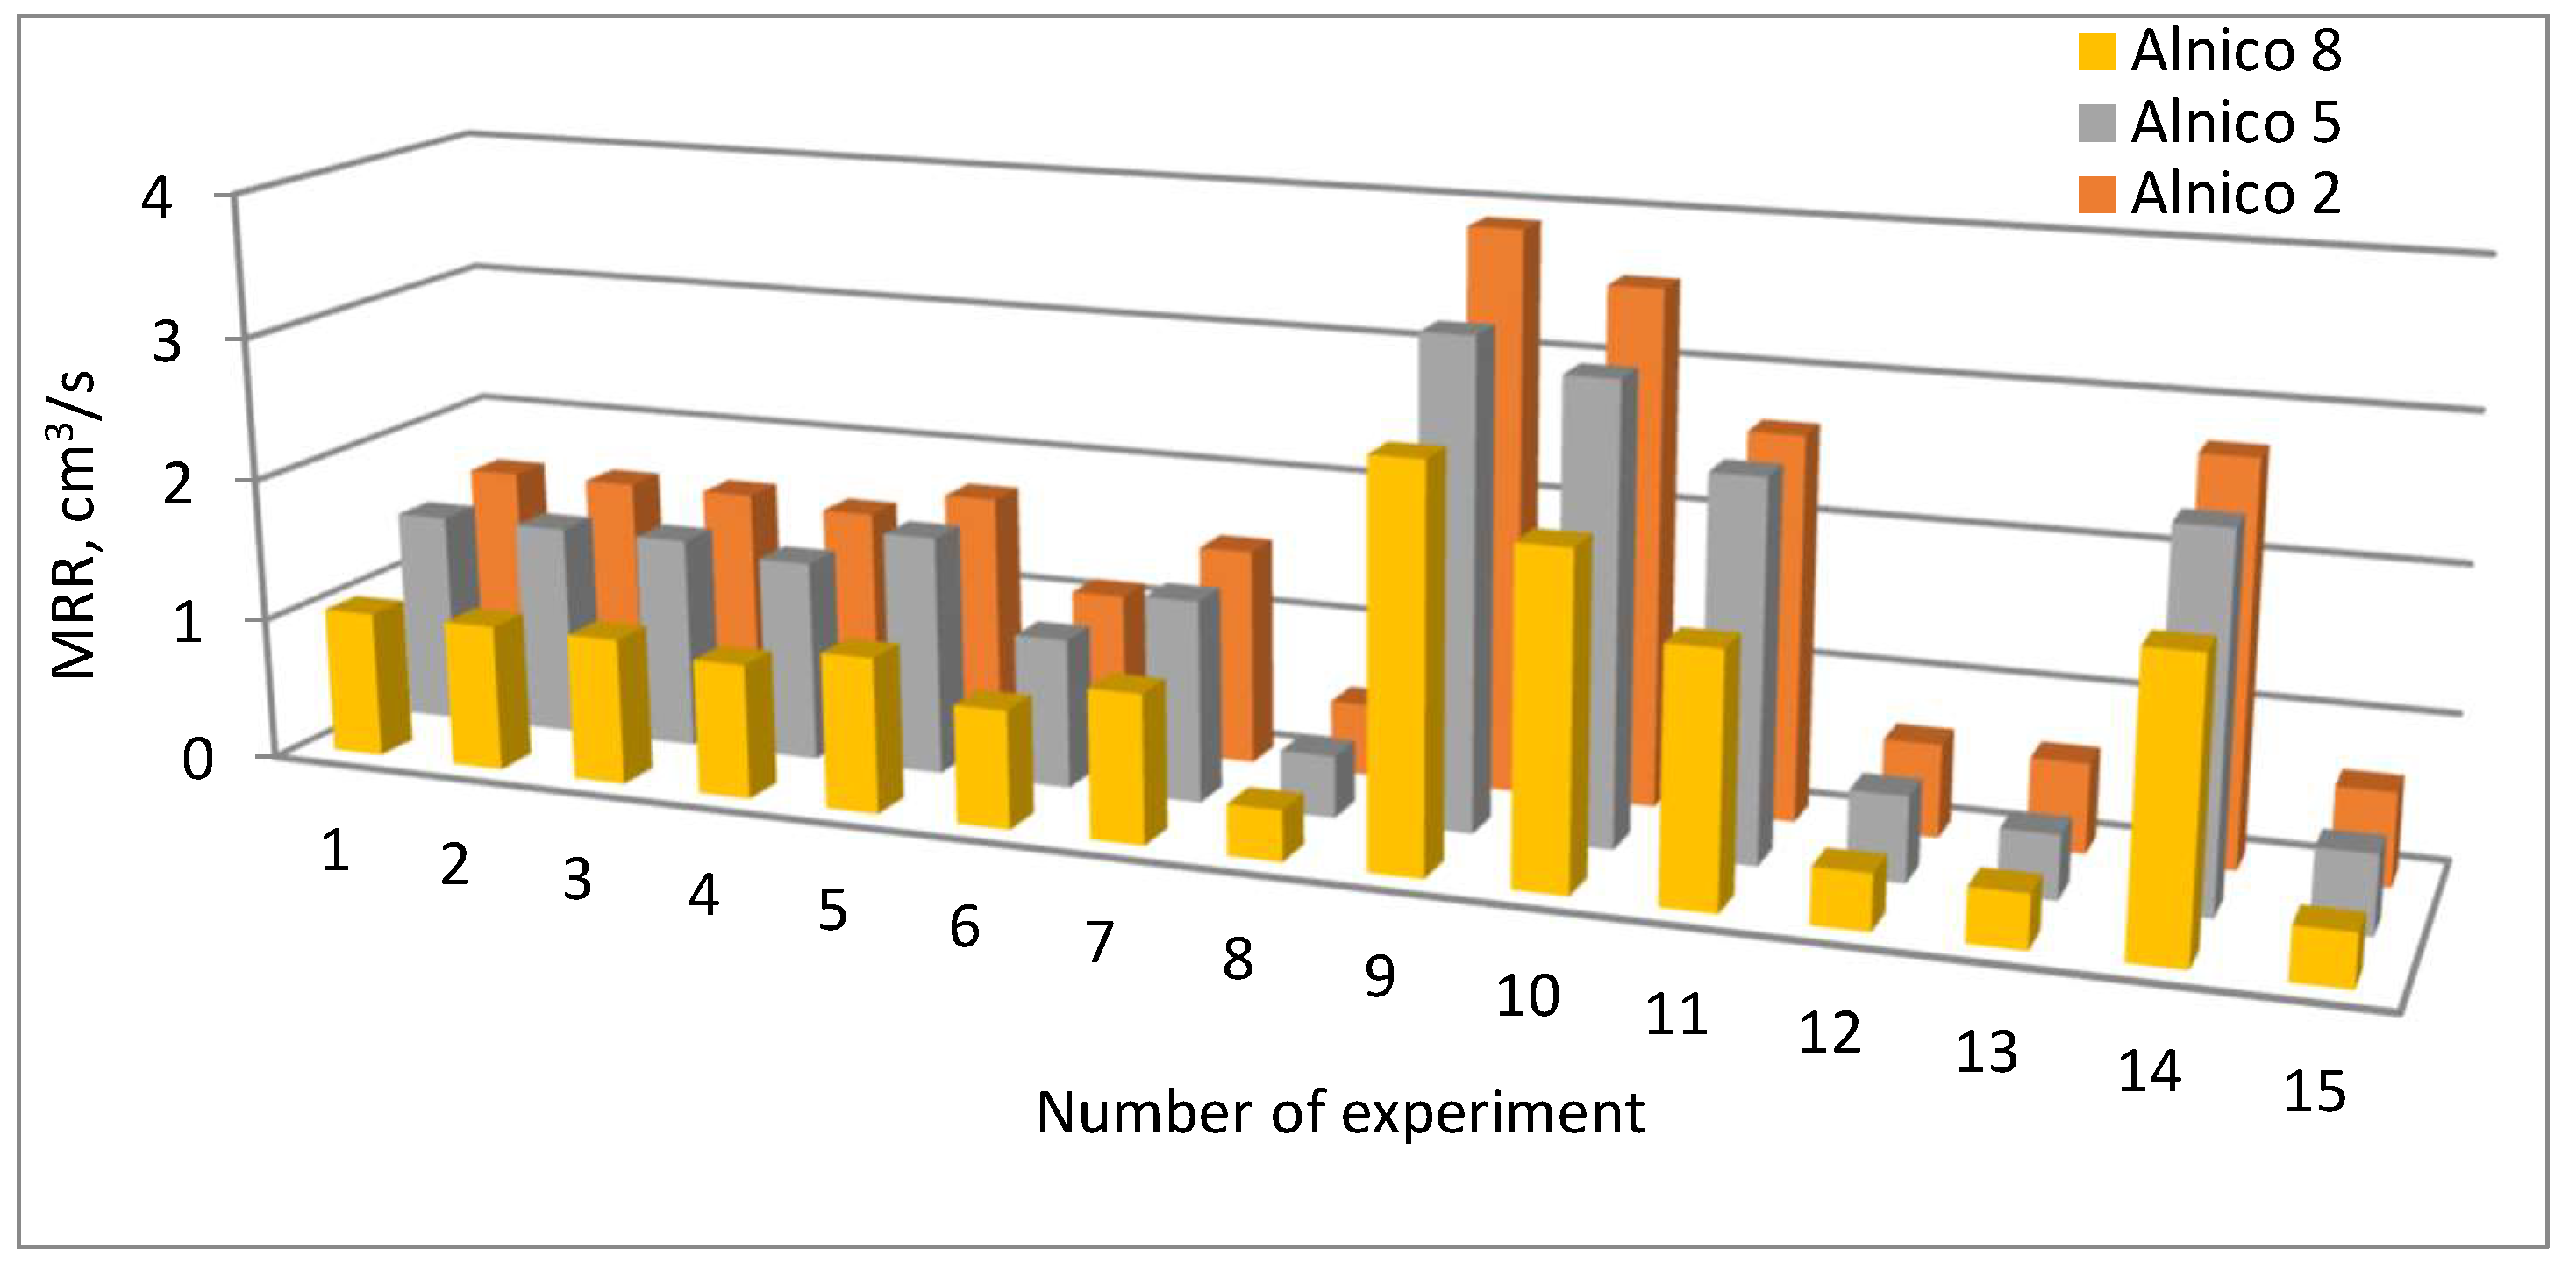
- the material removal rate (MRR); for Alnico 2, it was the fastest, and for Alnico 8, it was the slowest;
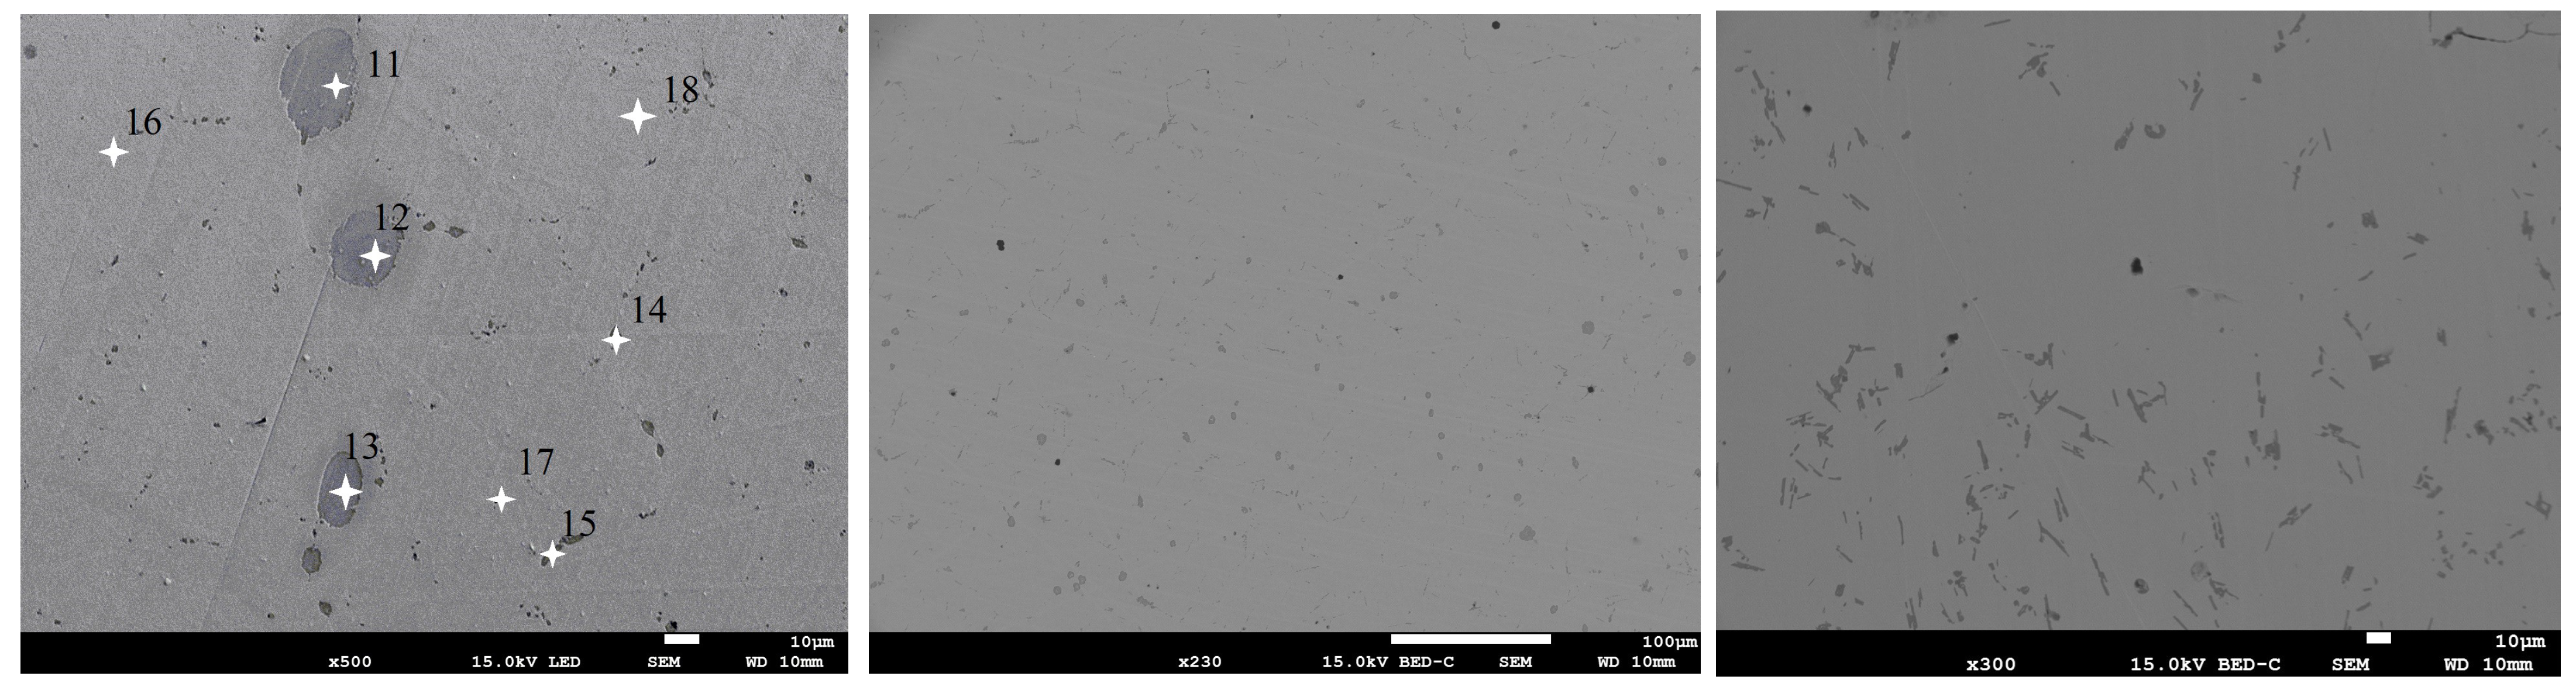
- the shape of precipitates rich in aluminum, nickel, and copper; an increase in the content of cobalt in Alnico alloys causes a change in the shape of precipitates from spheroidal (Alnico 2 with 13.0% Co) to leaf-like (Alnico 8 with 32.2% Co). Alnico 5, containing about 21.3% Co, had both spheroidal and leaf-like precipitates.
Author Contributions
Funding
Institutional Review Board Statement
Informed Consent Statement
Data Availability Statement
Conflicts of Interest
References
- Singh, R.; Singh, R.P.; Trehan, R. Surface integrity and accuracy based aspects in EDM of Cu-based SMA: An experimental investigation with microstructural analysis. Adv. Mater. Process. Technol. 2022, 1–14. [Google Scholar] [CrossRef]
- Abdudeen, A.; Abu Qudeiri, J.E.; Kareem, A.; Ahammed, T.; Ziout, A. Recent advances and perceptive insights into powder-mixed dielectric fluid of EDM. Micromachines 2020, 11, 754. [Google Scholar] [CrossRef] [PubMed]
- Alam, M.N.; Siddiquee, A.N.; Khan, Z.A.; Khan, N.Z. A comprehensive review on wire EDM performance evaluation. Proc. Inst. Mech. Eng. Part E J. Process Mech. Eng. 2022, 236, 1724–1746. [Google Scholar] [CrossRef]
- Mao, X.; Almeida, S.; Mo, J.; Ding, S. The state of the art of electrical discharge drilling: A review. Int. J. Adv. Manuf. Technol. 2022, 121, 2947–2969. [Google Scholar] [CrossRef]
- Dąbrowski, L.; Paczkowski, T. Computer simulation of two-dimensional electrolyte flow in electrochemical machining. Elektrokhimiya 2005, 41, 102–110. [Google Scholar] [CrossRef]
- Młynarczyk, P.; Krajcarz, D.; Bańkowski, D. The selected properties of the micro electrical discharge alloying process using tungsten electrode on aluminum. Procedia Eng. 2017, 192, 603–608. [Google Scholar] [CrossRef]
- Sahu, A.K.; Thomas, J.; Mahapatra, S.S. An intelligent approach to optimize the electrical discharge machining of titanium alloy by simple optimization algorithm. Proc. Inst. Mech. Eng. Part E J. Process Mech. Eng. 2021, 235, 371–383. [Google Scholar] [CrossRef]
- Chaudhari, R.; Vora, J.J.; Patel, V.; Lacalle, L.L.d.; Parikh, D. Effect of WEDM process parameters on surface morphology of nitinol shape memory alloy. Materials 2020, 13, 4943. [Google Scholar] [CrossRef]
- Farooq, M.U.; Anwar, S.; Kumar, M.S.; AlFaify, A.; Ali, M.A.; Kumar, R.; Haber, R. A Novel Flushing Mechanism to Minimize Roughness and Dimensional Errors during Wire Electric Discharge Machining of Complex Profiles on Inconel 718. Materials 2022, 15, 7330. [Google Scholar] [CrossRef]
- Ishfaq, K.; Anwar, S.; Ali, M.A.; Raza, M.H.; Farooq, M.U.; Ahmad, S.; Pruncu, C.I.; Saleh, M.; Salah, B. Optimization of WEDM for Precise Machining of Novel Developed Al6061-7.5% SiC Squeeze-Casted Composite. Int. J. Adv. Manuf. Technol. 2020, 111, 2031–2049. [Google Scholar] [CrossRef]
- Khan, A.A.; Ndaliman, M.B.; Zain, Z.M.; Jamaludin, M.F.; Patthi, U. Surface modification using electric discharge machining. (EDM) with powder addition. Appl. Mech. Mater. 2011, 110–116, 725–733. [Google Scholar] [CrossRef]
- Tosun, N.; Pihtili, H. The Effect of Cutting Parameters on Wire Crater Sizes in Wire EDM. Int. J. Adv. Manuf. Technol. 2003, 21, 857–865. [Google Scholar] [CrossRef]
- Kozak, J.; Ivanov, A.; Al-Naemi, F.; Gulbinowicz, Z. EDM electrode wear and its effecton processes accuracy and process modelling. In Proceedings of the 15th International Symposium on Electromachining, Pittsburgh, PA, USA, 23–27 April 2007; pp. 81–86. [Google Scholar]
- Kozak, J.; Gulbinowicz, Z. The Mathematical Modeling and Computer Simulation of Rotating Electrical Discharge Machining. WCECS 2009. In Proceedings of the World Congress on Engineering and Computer Science, San Francisco, CA, USA, 20–22 October 2009; Volume II; p. 943. [Google Scholar]
- Chaudhari, R.; Vora, J.J.; Prabu, S.; Palani, I.; Patel, V.K.; Parikh, D. Pareto optimization of WEDM process parameters for machining a NiTi shape memory alloy using a combined approach of RSM and heat transfer search algorithm. Adv. Manuf. 2021, 9, 64–80. [Google Scholar] [CrossRef]
- Klocke, F.; Lung, D.; Antonoglou, G.; Thomaidis, D. The Effects of Powder Suspended Dielectrics on the Thermal Influenced Zone by Electro discharge Machining with Small Discharge Energies. J. Mater. Process. Technol. 2004, 149, 191–197. [Google Scholar] [CrossRef]
- Sharma, D.; Hiremath, S.S. Review on tools and tool wear in EDM. Mach. Sci. Technol. 2021, 25, 802–873. [Google Scholar] [CrossRef]
- Oniszczuk-Świercz, D.; Kopytowski, A.; Nowicki, R.; Świercz, R. Finishing Additively Manufactured Ti6Al4V Alloy with Low-Energy Electrical Discharges. Materials 2023, 16, 5861. [Google Scholar] [CrossRef] [PubMed]
- Oniszczuk-Świercz, D.; Świercz, R. Effects of Wire Electrical Discharge Finishing Cuts on the Surface Integrity of Additively Manufactured Ti6Al4V Alloy. Materials 2023, 16, 5476. [Google Scholar] [CrossRef]
- Oniszczuk-Świercz, D.; Świercz, R.; Kopytowski, A.; Nowicki, R. Experimental Investigation and Optimization of Rough EDM of High-Thermal-Conductivity Tool Steel with a Thin-Walled Electrode. Materials 2023, 16, 302. [Google Scholar] [CrossRef] [PubMed]
- Oniszczuk-Świercz, D.; Świercz, R.; Michna, Š. Evaluation of Prediction Models of the Micro wire EDM Process of Inconel 718 Using ANN and RSM Methods. Materials 2022, 15, 8317. [Google Scholar] [CrossRef]
- Chaudhari, R.; Shah, Y.; Khanna, S.; Patel, V.K.; Vora, J.; Pimenov, D.Y.; Giasin, K. Experimental Investigations and Effect of Nano-Powder-Mixed EDM Variables on Performance Measures of Nitinol SMA. Materials 2022, 15, 7392. [Google Scholar] [CrossRef]
- Singh, S.K.; Mali, H.S.; Unune, D.R.; Wojciechowski, S.; Wilczyński, D. Application of Generalized Regression Neural Network and Gaussian Process Regression for Modelling Hybrid Micro-Electric Discharge Machining: A Comparative Study. Processes 2022, 10, 755. [Google Scholar] [CrossRef]
- Bańkowski, D.; Młynarczyk, P. Influenceof EDM Process Parameters on the Surface Finish of Alnico Alloys. Materials 2022, 15, 7277. [Google Scholar] [CrossRef]
- Bańkowski, D.; Młynarczyk, P.; Szwed, B. Effects of EDM on the Chemical Composition and Microstructure of the Surface Layer of Alnico Alloys. Arch. Foundry Eng. 2023, 23, 1–6. [Google Scholar]
- Młynarczyk, P.; Bańkowski, D.; Spadło, S.; Ziarkowski, P.; Grzęda, J. Non Destructive Testing of Alnico Alloys. In Proceedings of the 31st International Conference on Metallurgy and Materials, Brno, Czech Republic, 18–19 May 2022; pp. 750–755. [Google Scholar]
- Bańkowski, D.; Młynarczyk, P.; Spadło, S.; Sójka, R.; Klamczyński, K. Tomographic Testing of Alnico Alloys. In Proceedings of the 31st International Conference on Metallurgy and Materials, Brno, Czech Republic, 18–19 May 2022; pp. 675–681. [Google Scholar]
- Available online: https://pl.wikipedia.org/wiki/Alnico (accessed on 22 April 2022).
- Available online: https://magnesy.pl/magnesy-alnico (accessed on 22 April 2022).
- Ablyaz, T.R.; Shlykov, E.S.; Muratov, K.R.; Osinnikov, I.V. Study of the Structure and Mechanical Properties after Electrical Discharge Machining with Composite Electrode Tools. Materials 2022, 15, 1566. [Google Scholar] [CrossRef] [PubMed]
- Konieczny, M.; Szwed, B.; Mola, R. Diffusion bonding and transient liquid phase joining of titanium to AlSi 304 stainless steel with analuminum interlayer. In Proceedings of the Metal 2015: 24th International Conference on Metallurgy and Materials, Brno, Czech Republic, 3–5 June 2015; pp. 1513–1518. [Google Scholar]
- Masuzawa, T.; Yamaguchi, M.; Fujino, M. Surface Finishing of Micro pins Produced by WEDG. CIRP Ann.-Manuf. Technol. 2005, 54, 171–174. [Google Scholar] [CrossRef]
- Guu, Y.H. AFM surface imaging of AISI D2 tool steel machined by the EDM process. Appl. Surf. Sci. 2005, 242, 245–250. [Google Scholar] [CrossRef]
- Han, F.; Jiang, J.; Yu, D. Influence of discharge current on machined surfaces by thermoanalysis in finish cut of WEDM. Int. J. Mach. Tools Manuf. 2007, 47, 1187–1196. [Google Scholar] [CrossRef]
- Mohanty, C.P.; Mahapatra, S.S.; Singh, M.R. An intelligent approach to optimize the EDM process parameters using utility concept and QPSO algorithm. Eng. Sci. Technol. Int. J. 2017, 20, 552–562. [Google Scholar] [CrossRef]
- Świercz, R. Modeling and Optimization of Electrical Discharge Machining of Difficult-to-Machine Materials; Publishing House of the Warsaw University of Technology: Warsaw, Poland, 2019. [Google Scholar]
- Mohapatra, J.; Xing, M.; Elkins, J.; Liu, P.J. Hard and semi-hard magnetic materials based on cobalt and cobalt alloys. J. Alloys Compd. 2020, 824, 153874. [Google Scholar] [CrossRef]
- Przybyłowicz, K. Metalozanawstwo; WNT: Warsaw, Poland, 2007. [Google Scholar]
- Dabade, U.A.; Karidkar, S.S. Analysis of Response Variables in WEDM of Inconel 718 Using Taguchi Technique. Procedia CIRP 2016, 41, 886–891. [Google Scholar] [CrossRef]
- Adamczak, S.; Zmarzły, P. Research of the influence of the 2D and 3D surface roughness parameters of bearing race ways on the vibration level. J. Phys. Conf. Ser. 2019, 1183, 012001. [Google Scholar] [CrossRef]
- Adamczak, S.; Miko, E.; Cus, F. A model of surface roughness constitution in the metal cutting process applying tools with defined stereometry. Stroj. J. Mech. Eng. 2009, 55, 45–54. [Google Scholar]
- PN EN ISO 25178-6:2011; Geometrical Product Specifications (GPS)—Surface Texture: Areal—Part 6: Classification of Methods for Measuring Surface Texture. ISO: Geneva, Switzerland, 2010.


| Element | Al | Si | Ti | Fe | Co | Ni | Cu |
|---|---|---|---|---|---|---|---|
| Alnico 2 | 17.4 | 0.8 | 0.8 | 46.1 | 13.0 | 17.2 | 4.7 |
| Alnico 5 | 14.7 | 1.6 | - | 46.2 | 21.3 | 13.3 | 2.8 |
| Alnico 8 | 13.3 | 0.8 | 5.8 | 31.9 | 32.2 | 13.2 | 2.9 |
| Variable | Value | ||
|---|---|---|---|
| Voltage | 230 V | 230 V | 230 V |
| Discharge current | 8 A | 12 A | 16 A |
| Pulse-on time | 50 µs | 100 µs | 150 µs |
| Pulse-off time | 20 µs | 35 µs | 50 µs |
| Dielectric liquid | Kerosene | ||
| No. | Code Values | Actual Values | Alnico 2 | Alnico 5 | Alnico 8 | ||||||||||
|---|---|---|---|---|---|---|---|---|---|---|---|---|---|---|---|
| I, A | ton, µs | toff, µs | I, A | ton, µs | toff, µs | MRR, cm3/s | Ra, µm | Sds | MRR, cm3/s | Ra, µm | Sds | MRR, cm3/s | Ra, µm | Sds | |
| 1 | 0 | 0 | 0 | 12 | 100 | 35 | 1.59 | 9.08 | 255 | 1.50 | 8.55 | 270 | 1.01 | 9.59 | 213 |
| 2 | 0 | 0 | 0 | 12 | 100 | 35 | 1.60 | 8.92 | 276 | 1.49 | 8.13 | 264 | 1.08 | 9.67 | 222 |
| 3 | 0 | 0 | 0 | 12 | 100 | 35 | 1.60 | 9.23 | 233 | 1.49 | 8.96 | 276 | 1.03 | 9.52 | 202 |
| 4 | 0 | 1 | 1 | 12 | 140 | 50 | 1.54 | 9.63 | 281 | 1.42 | 9.13 | 244 | 0.95 | 9.89 | 269 |
| 5 | 0 | 1 | −1 | 12 | 140 | 20 | 1.73 | 9.33 | 249 | 1.68 | 9.15 | 235 | 1.09 | 9.73 | 200 |
| 6 | 0 | −1 | 1 | 12 | 50 | 50 | 1.11 | 5.52 | 405 | 1.05 | 5.63 | 321 | 0.83 | 6.78 | 244 |
| 7 | 0 | −1 | −1 | 12 | 50 | 20 | 1.52 | 8.00 | 301 | 1.42 | 6.40 | 267 | 1.04 | 7.37 | 247 |
| 8 | −1 | 0 | 1 | 8 | 100 | 50 | 0.50 | 4.39 | 636 | 0.43 | 3.91 | 549 | 0.36 | 4.15 | 524 |
| 9 | 1 | 0 | −1 | 16 | 100 | 20 | 3.90 | 10.20 | 245 | 3.96 | 10.30 | 217 | 2.77 | 9.72 | 180 |
| 10 | 1 | 1 | 0 | 16 | 140 | 35 | 3.56 | 12.10 | 248 | 3.84 | 10.20 | 200 | 2.29 | 8.95 | 189 |
| 11 | 1 | −1 | 0 | 16 | 50 | 35 | 2.65 | 7.65 | 258 | 2.60 | 6.60 | 280 | 1.73 | 8.16 | 243 |
| 12 | −1 | −1 | 0 | 8 | 50 | 35 | 0.64 | 4.06 | 562 | 0.59 | 3.74 | 562 | 0.39 | 4.18 | 459 |
| 13 | −1 | 1 | 0 | 8 | 140 | 35 | 0.62 | 4.53 | 436 | 0.44 | 4.26 | 569 | 0.37 | 4.90 | 412 |
| 14 | 1 | 0 | 1 | 16 | 100 | 50 | 2.74 | 9.51 | 213 | 2.80 | 9.89 | 228 | 1.99 | 9.42 | 199 |
| 15 | −1 | 0 | −1 | 8 | 100 | 20 | 0.64 | 5.01 | 373 | 0.54 | 3.85 | 456 | 0.36 | 4.64 | 407 |
| Alnico 2 | Alnico 5 | Alnico 8 | |
|---|---|---|---|
| white layer thickness, µm | 73.6 | 53.3 | 33.0 |
| Spectrum Label | Al | Si | S | Ti | Fe | Co | Ni | Cu | Total |
|---|---|---|---|---|---|---|---|---|---|
| 11 | 31.2 | 0.5 | 20.8 | 9.7 | 29. | 8.2 | 100.0 | ||
| 12 | 33.8 | 0.5 | 1.5 | 11.1 | 8.2 | 34.9 | 10.0 | 100.0 | |
| 13 | 30.9 | 0.5 | 19.8 | 9.9 | 30.5 | 8.4 | 100.0 | ||
| 14 | 31.1 | 0.5 | 2.3 | 0.8 | 15.2 | 9.3 | 32.3 | 8.5 | 100.0 |
| 15 | 31.2 | 0.6 | 0.7 | 15.8 | 9.3 | 33.7 | 8.7 | 100.0 | |
| 16 | 18.5 | 0.8 | 45.4 | 12.9 | 17.9 | 4.5 | 100.0 | ||
| 17 | 18.5 | 0.9 | 45.2 | 12.6 | 18.0 | 4.8 | 100.0 | ||
| 18 | 18.3 | 0.9 | 45.2 | 12.7 | 18.0 | 4.9 | 100.0 |
Disclaimer/Publisher’s Note: The statements, opinions and data contained in all publications are solely those of the individual author(s) and contributor(s) and not of MDPI and/or the editor(s). MDPI and/or the editor(s) disclaim responsibility for any injury to people or property resulting from any ideas, methods, instructions or products referred to in the content. |
© 2023 by the authors. Licensee MDPI, Basel, Switzerland. This article is an open access article distributed under the terms and conditions of the Creative Commons Attribution (CC BY) license (https://creativecommons.org/licenses/by/4.0/).
Share and Cite
Młynarczyk, P.; Bańkowski, D.; Szwed, B. Analyzing the Relationship between the Chemical Composition and the Surface Finish of Alnico Alloys in EDM. Materials 2023, 16, 6765. https://doi.org/10.3390/ma16206765
Młynarczyk P, Bańkowski D, Szwed B. Analyzing the Relationship between the Chemical Composition and the Surface Finish of Alnico Alloys in EDM. Materials. 2023; 16(20):6765. https://doi.org/10.3390/ma16206765
Chicago/Turabian StyleMłynarczyk, Piotr, Damian Bańkowski, and Bartłomiej Szwed. 2023. "Analyzing the Relationship between the Chemical Composition and the Surface Finish of Alnico Alloys in EDM" Materials 16, no. 20: 6765. https://doi.org/10.3390/ma16206765
APA StyleMłynarczyk, P., Bańkowski, D., & Szwed, B. (2023). Analyzing the Relationship between the Chemical Composition and the Surface Finish of Alnico Alloys in EDM. Materials, 16(20), 6765. https://doi.org/10.3390/ma16206765