


Parametric Optimization of Torsional Parameters of Ferrocement “U” Wrapped Beams Using Recent Meta-Heuristic Optimization Algorithms

 ,
,  ,
,  and
and 
Abstract
:1. Introduction
- To measure the torsional characteristics of “U” wrapped beams at the cracking and final phases, develop a soft computing model.
- Compare the torsional capabilities of reinforced concrete beams with “U” wraps to soft computing values obtained by experimentation and analysis.
2. Different Approaches to Predict Torsional Parameters
2.1. Experimental Approach
2.2. Analytical Model
2.3. Soft Computing Method
2.3.1. Regression Analysis Method
Simple Linear Regression
3. Theory of Optimization Approaches
3.1. Artificial Rabbits Optimization
- Xa(t) is the position of the adult rabbit at time t;
- Xbest(t) is the position of the best rabbit in the population at time t;
- Xworst(t) is the position of the worst rabbit in the population at time t;
- α and β are two parameters that control the exploration and exploitation behavior of the algorithm.
- Xj(t) is the position of the juvenile rabbit at time t;
- Xa(t) is the position of the adult rabbit that the juvenile rabbit is following at time t;
- rand() is a random number between 0 and 1;
Pseudo-Code of Artificial Rabbits Optimization Algorithm
3.2. Dynamic Arithmetic Optimization Algorithm
- Xi(t) is the position of the individual at time t;
- Xbest(t) is the position of the best individual in the population at time t;
- Xworst(t) is the position of the worst individual in the population at time t;
- a and b are two parameters that control the exploration and exploitation behavior of the algorithm.
Pseudo-Code of Dynamic Arithmetic Optimization Algorithm
4. Discussion
Torsional Behavior of Normal-Strength Beams
- Design of the beam: the beam should be designed to ensure that it has the desired geometry and reinforcement pattern, which is critical for torsional strength.
- Material properties: the properties of the materials used in the beam, such as the type and quality of cement, reinforcement steel, and mortar, should be known and considered.
- Load testing: The beam should be subjected to a series of load tests to determine its torsional strength. This can be carried out using a universal testing machine, where the beam is subjected to a torsional load until failure.
- Data collection and analysis: the load–displacement data from the load tests should be collected and analyzed to determine the torsional strength of the beam.
- Finite element analysis: Finite element analysis (FEA) can be used to model the behavior of the beam under torsional loading, providing an accurate estimate of its torsional strength. This can be compared to the results obtained from load testing to validate the FEA results.
- Comparison with theoretical models: the torsional strength of the beam can be compared to theoretical models, such as Timoshenko’s theory, to determine its accuracy.
5. Novel Contributions of the Study
6. Conclusions
- Experimental testing is the most reliable method for validating the results of numerical simulations.
- The ferrocement wrapping increases the cracking and ultimate torque of beams with respect to unwrapped beams of the same dimension.
- Regardless of the number of mesh layers, the cracking torque for a certain grade of core concrete and ferrocement “U” wrap is almost the same for all states of torsion.
- Due to an increase in the shear strength of a higher grade of material in the peripheral, cracking torque rises as the grade of core concrete and mortar in the ferrocement wrap increases.
- The breaking torque of the ferrocement “U” wrapped beams was comparable to that of the unwrapped control beams.
- Maximum ultimate torque was noticed for completely over-reinforced beams and found to be 98% greater than that of the control specimen.
- The quality of the core concrete and mortar in the ferrocement wrap rises, increasing ultimate torque.
- The cracking and ultimate torque of ferrocement “U” wrapped beams with single-type reinforcement in the core concrete were similar to those of plain beams with “U” wrap.
- Regardless of torsion states, M35 grade concrete “U” wrap beams have a twist at cracking torque that is almost the same.
- Maximum twist was found under reinforced beams of M35 grade concrete, as stiffness at ultimate torque is low.
- The only kind of beam that has experienced higher twists than transversely reinforced beams was under-reinforced beams.
Author Contributions
Funding
Institutional Review Board Statement
Informed Consent Statement
Data Availability Statement
Conflicts of Interest
Nomenclature
| e | effective parameter involving beam code, long. steel diameter, and trans. steel diameter |
| A | beam code |
| B | longitudinal steel diameter |
| C | transverse steel diameter |
| Expt. | experimental |
| ARO | artificial rabbits optimization |
| DAOA | differential ant colony optimization algorithm |
| FEA | finite element analysis |
| M20 | grade of concrete with 20 MPa compressive strength |
| M25 | grade of concrete with 25 MPa compressive strength |
| M30 | grade of concrete with 30 MPa compressive strength |
| Long. steel diameter | diameter of longitudinal reinforcement |
| Trans. steel diameter | diameter of transverse reinforcement |
| Beam code | type of beam (e.g., rectangular, I-beam, etc.) |
| Cracking torque | torque at which the first crack appears |
| Ultimate torque | maximum torque that the beam can withstand before failure |
| Cracking twist | angle of twist at cracking torque |
| Ultimate twist | angle of twist at ultimate torque |
| Rotational ductility index | measure of the beam’s ability to deform plastically before failure |
References
- Deifalla, A.; Awad, A.; Elgarhy, M. Effectiveness of externally bonded CFRP strips for strengthening flanged beams under torsion: An experimental study. J. Eng. Struct. 2013, 56, 2065–2075. [Google Scholar] [CrossRef]
- Dong, Z.Q.; Wu, G.; Xu, B.; Wang, X.; Taerwe, L. Bond performance of alkaline solution pre-exposed FRP bars with concrete. Mag. Concr. Res. 2018, 70, 894–904. [Google Scholar] [CrossRef]
- Tahir, M.; Wang, Z.U.; Ali, K.M. Axial compressive behavior of square concrete columns confined with CFRP strip ties using wet lay-up technique. Constr. Build. Mater. 2019, 200, 282–292. [Google Scholar] [CrossRef]
- Karayannis, C.G.; Chalioris, C.E.; Sirkelis, G.M. Local retrofit of exterior RC beam-column joints using thin RC jackets—An experimental study. Earthq. Eng. Struct. Dyn. 2008, 37, 727–746. [Google Scholar] [CrossRef]
- Isleem, H.F.; Wang, D.; Wang, Z. Modeling the axial compressive stress-strain behavior of CFRP-confined rectangular RC columns under monotonic and cyclic loading. Compos. Struct. 2018, 185, 229–240. [Google Scholar] [CrossRef]
- Pancharam, S.; Belarbi, A. Torsional behavior of reinforced concrete beams strengthened with FRP Composites. In Proceedings of the First FIB Congress, Osaka, Japan, 13–19 October 2002; pp. 1–11. [Google Scholar]
- Behera, G.C. A model to predict the torsional stiffness of ‘U-wrapped’ reinforced concrete beams. Proc. Inst. Civ. Eng. Struct. Build. 2018, 171, 676–687. [Google Scholar] [CrossRef]
- Yaseen, T.O.; Ashteyat, A.M.; Obaidat, A.T. Performance of RC beam strengthened with NSM-CFRP strip under pure torsion: Experimental and numerical study. Int. J. Civ. Eng. 2020, 18, 585–593. [Google Scholar]
- Chalioris, C.E. Torsional strengthening of rectangular and flanged beams using carbon fiber-reinforced-polymers—Experimental study. Constr. Build. Mater. 2008, 22, 21–29. [Google Scholar] [CrossRef]
- Li, B.; Lam, E.S.S.; Wu, B.; Wang, Y.Y. Experimental investigation on reinforced concrete interior beam-column joints rehabilitated by ferrocement jackets. Eng. Struct. 2013, 56, 897–909. [Google Scholar] [CrossRef]
- ACI Committee. Ferrocement-Materials and Applications; ACI Symposium Proceedings SP-61; American Concrete Institute: Farmington Hills, MI, USA, 1979; Volume 549. [Google Scholar]
- ACI-549 Committee Report R-97. State of Art Report on Ferrocement; ACI: Detroit, MI, USA, 1997.
- Shannag, M.J.; Mourad, S.M. Flowable high strength cementitious matrices for ferrocement applications. Constr. Build. Mater. 2012, 36, 933–939. [Google Scholar] [CrossRef]
- Chalioris, C.E.; Thermou, G.E.; Pantazopoulou, S.J. Behaviour of rehabilitated rc beams with self-compacting concrete jacketing—Analytical model and test results. Constr. Build. Mater. 2014, 55, 257–273. [Google Scholar] [CrossRef]
- Behera, G.C.; Rao, T.D.G.; Rao, C.B.K. Study of Post-Cracking Torsional Behaviour of High-Strength Reinforced Concrete Beams with a Ferrocement Wrap. Slovak J. Civ. Eng. 2014, 22, 1–12. [Google Scholar] [CrossRef]
- Zhang, W.; Zhang, R.; Wu, C.; Goh, A.T.C.; Lacasse, S.; Liu, Z.; Liu, H. State-of-the-art review of soft computing applications in underground excavations. Geosci. Front. 2020, 11, 1095–1106. [Google Scholar] [CrossRef]
- Ajay, S.S.; Masuku, M.B. Applications of Modeling and Statistical Regression Techniques in Research. Res. J. Math. Stat. Sci. 2013, 2320, 14–20. [Google Scholar]
- Wang, L.; Cao, Q.; Zhang, Z.; Mirjalili, S.; Zhao, W. Artificial Rabbits Optimization: A new bio-inspired meta-heuristic algorithm for solving engineering optimization problems. Eng. Appl. Artif. Intell. 2020, 114, 105082. [Google Scholar] [CrossRef]
- Maher, M.; Abdel, A.S.H.; Ibrahim, A.M.; El-Shahat, A. Novel Mathematical Design of Triple-Tuned Filters for Harmonics Distortion Mitigation. Energies 2023, 16, 39. [Google Scholar] [CrossRef]
- Mori, H.; Tani, H. Two-staged tabu search for determining optimal allocation of D-FACTS in radial distribution systems with distributed generation. IEEE/PES Transm. Distrib. Conf. Exhib. 2002, 1, 56–61. [Google Scholar]
- Li, X.D.; Wang, J.S.; Hao, W.K.; Song, H.M.; Zhao, X.R. Lorentz chaotic trigonometric function pedigree based arithmetic optimization algorithm. J. Intell. Fuzzy Syst. 2023, 44, 3527–3559. [Google Scholar]
- Khodadadi, N.; Snasel, V.; Mirjalili, S. Dynamic arithmetic optimization algorithm for truss optimization under natural frequency constraints. IEEE Access 2022, 10, 16188–16208. [Google Scholar] [CrossRef]
- Behera, G.C.; Dhal, M. Torsional behaviour of normal strength RCC beams with ferrocement “U” wraps. Facta Univ. Ser. Archit. Civ. Eng. 2018, 16, 1–16. [Google Scholar] [CrossRef]
- Ćirović, G.; Radonjanin, V.; Trivunić, M.; Nikolić, D. Optimization of UHPFRC beams subjected to bending using genetic algorithms. J. Civ. Eng. Manag. 2014, 20, 527–536. [Google Scholar] [CrossRef]
- Li, Z.; Gao, Y. Structural Optimization of Main Beam of Ultra-Low Clearance Hoisting System for EHV Cables. In Proceedings of the 10th International Conference on Informatics, Environment, Energy and Applications, Xi’an, China, 12–14 March 2021; pp. 28–34. [Google Scholar]
- Silva, H.M.; Meireles, J.F. Structural Optimization of Internally Reinforced Beams Subjected to Uncoupled and Coupled Bending and Torsion Loadings for Industrial Applications. Mech. Mech. Eng. 2017, 21, 731–753. [Google Scholar]
- Silva, H.M.; de Meireles, J.F.B. Design Optimisation of Internally Reinforced Beams Subjected to Bending Loading. In Advanced Engineering Forum; Trans Tech Publications Ltd.: Stafa-Zurich, Switzerland, 2018; Volume 28, pp. 18–32. [Google Scholar]


| Beam Code | Series | Designation | Beam Code | Long. Steel Diameter | Long. Steel Yield Strength | Trans. Steel Diameter | Trans. Steel Yield Strength | No. of Mesh Layers |
|---|---|---|---|---|---|---|---|---|
| 1 | U—Under-reinforced beams | U3N | 1 | 6 | 350 | 6 | 350 | 3 |
| 2 | U—Under-reinforced beams | U4N | 2 | 6 | 350 | 6 | 350 | 4 |
| 3 | U—Under-reinforced beams | U5N | 3 | 6 | 350 | 6 | 350 | 5 |
| 4 | L—Longitudinally over-reinforced beams | Lo3N | 4 | 12 | 440 | 6 | 350 | 3 |
| 5 | L—Longitudinally over-reinforced beams | Lo4N | 5 | 12 | 440 | 6 | 350 | 4 |
| 6 | L—Longitudinally over-reinforced beams | Lo5N | 6 | 12 | 440 | 6 | 350 | 5 |
| 7 | T—Transversely over-reinforced beams | To3N | 7 | 6 | 350 | 8 | 465 | 3 |
| 8 | T—Transversely over-reinforced beams | To4N | 8 | 6 | 350 | 8 | 465 | 4 |
| 9 | T—Transversely over-reinforced beams | To5N | 9 | 6 | 350 | 8 | 465 | 5 |
| 10 | C—Completely over-reinforced beams | Co3N | 10 | 12 | 440 | 8 | 465 | 3 |
| 11 | C—Completely over-reinforced beams | Co4N | 11 | 12 | 440 | 8 | 465 | 4 |
| 12 | C—Completely over-reinforced beams | Co5N | 12 | 12 | 440 | 8 | 465 | 5 |
| Sl. No. | Beam Code | Initial Stiffness | Predicted Initial Stiffness | Cracking Secant Stiffness | Predicted Cracking Secant Stiffness | Ultimate Secant Stiffness | Predicted Ultimate Secant Stiffness | Expt. Cracking Torque | Predicted Expt. Cracking Torque | Expt. Ultimate Torque | Predicted Expt. Ultimate Torque | Expt. Toughness | Predicted Expt. Toughness | Expt. Cracking Twist | Predicted Expt. Cracking Twist | Expt. Ultimate Twist | Predicted Expt. Ultimate Twist | Rotational Ductility Index | Predicted Rotational Ductility Index |
|---|---|---|---|---|---|---|---|---|---|---|---|---|---|---|---|---|---|---|---|
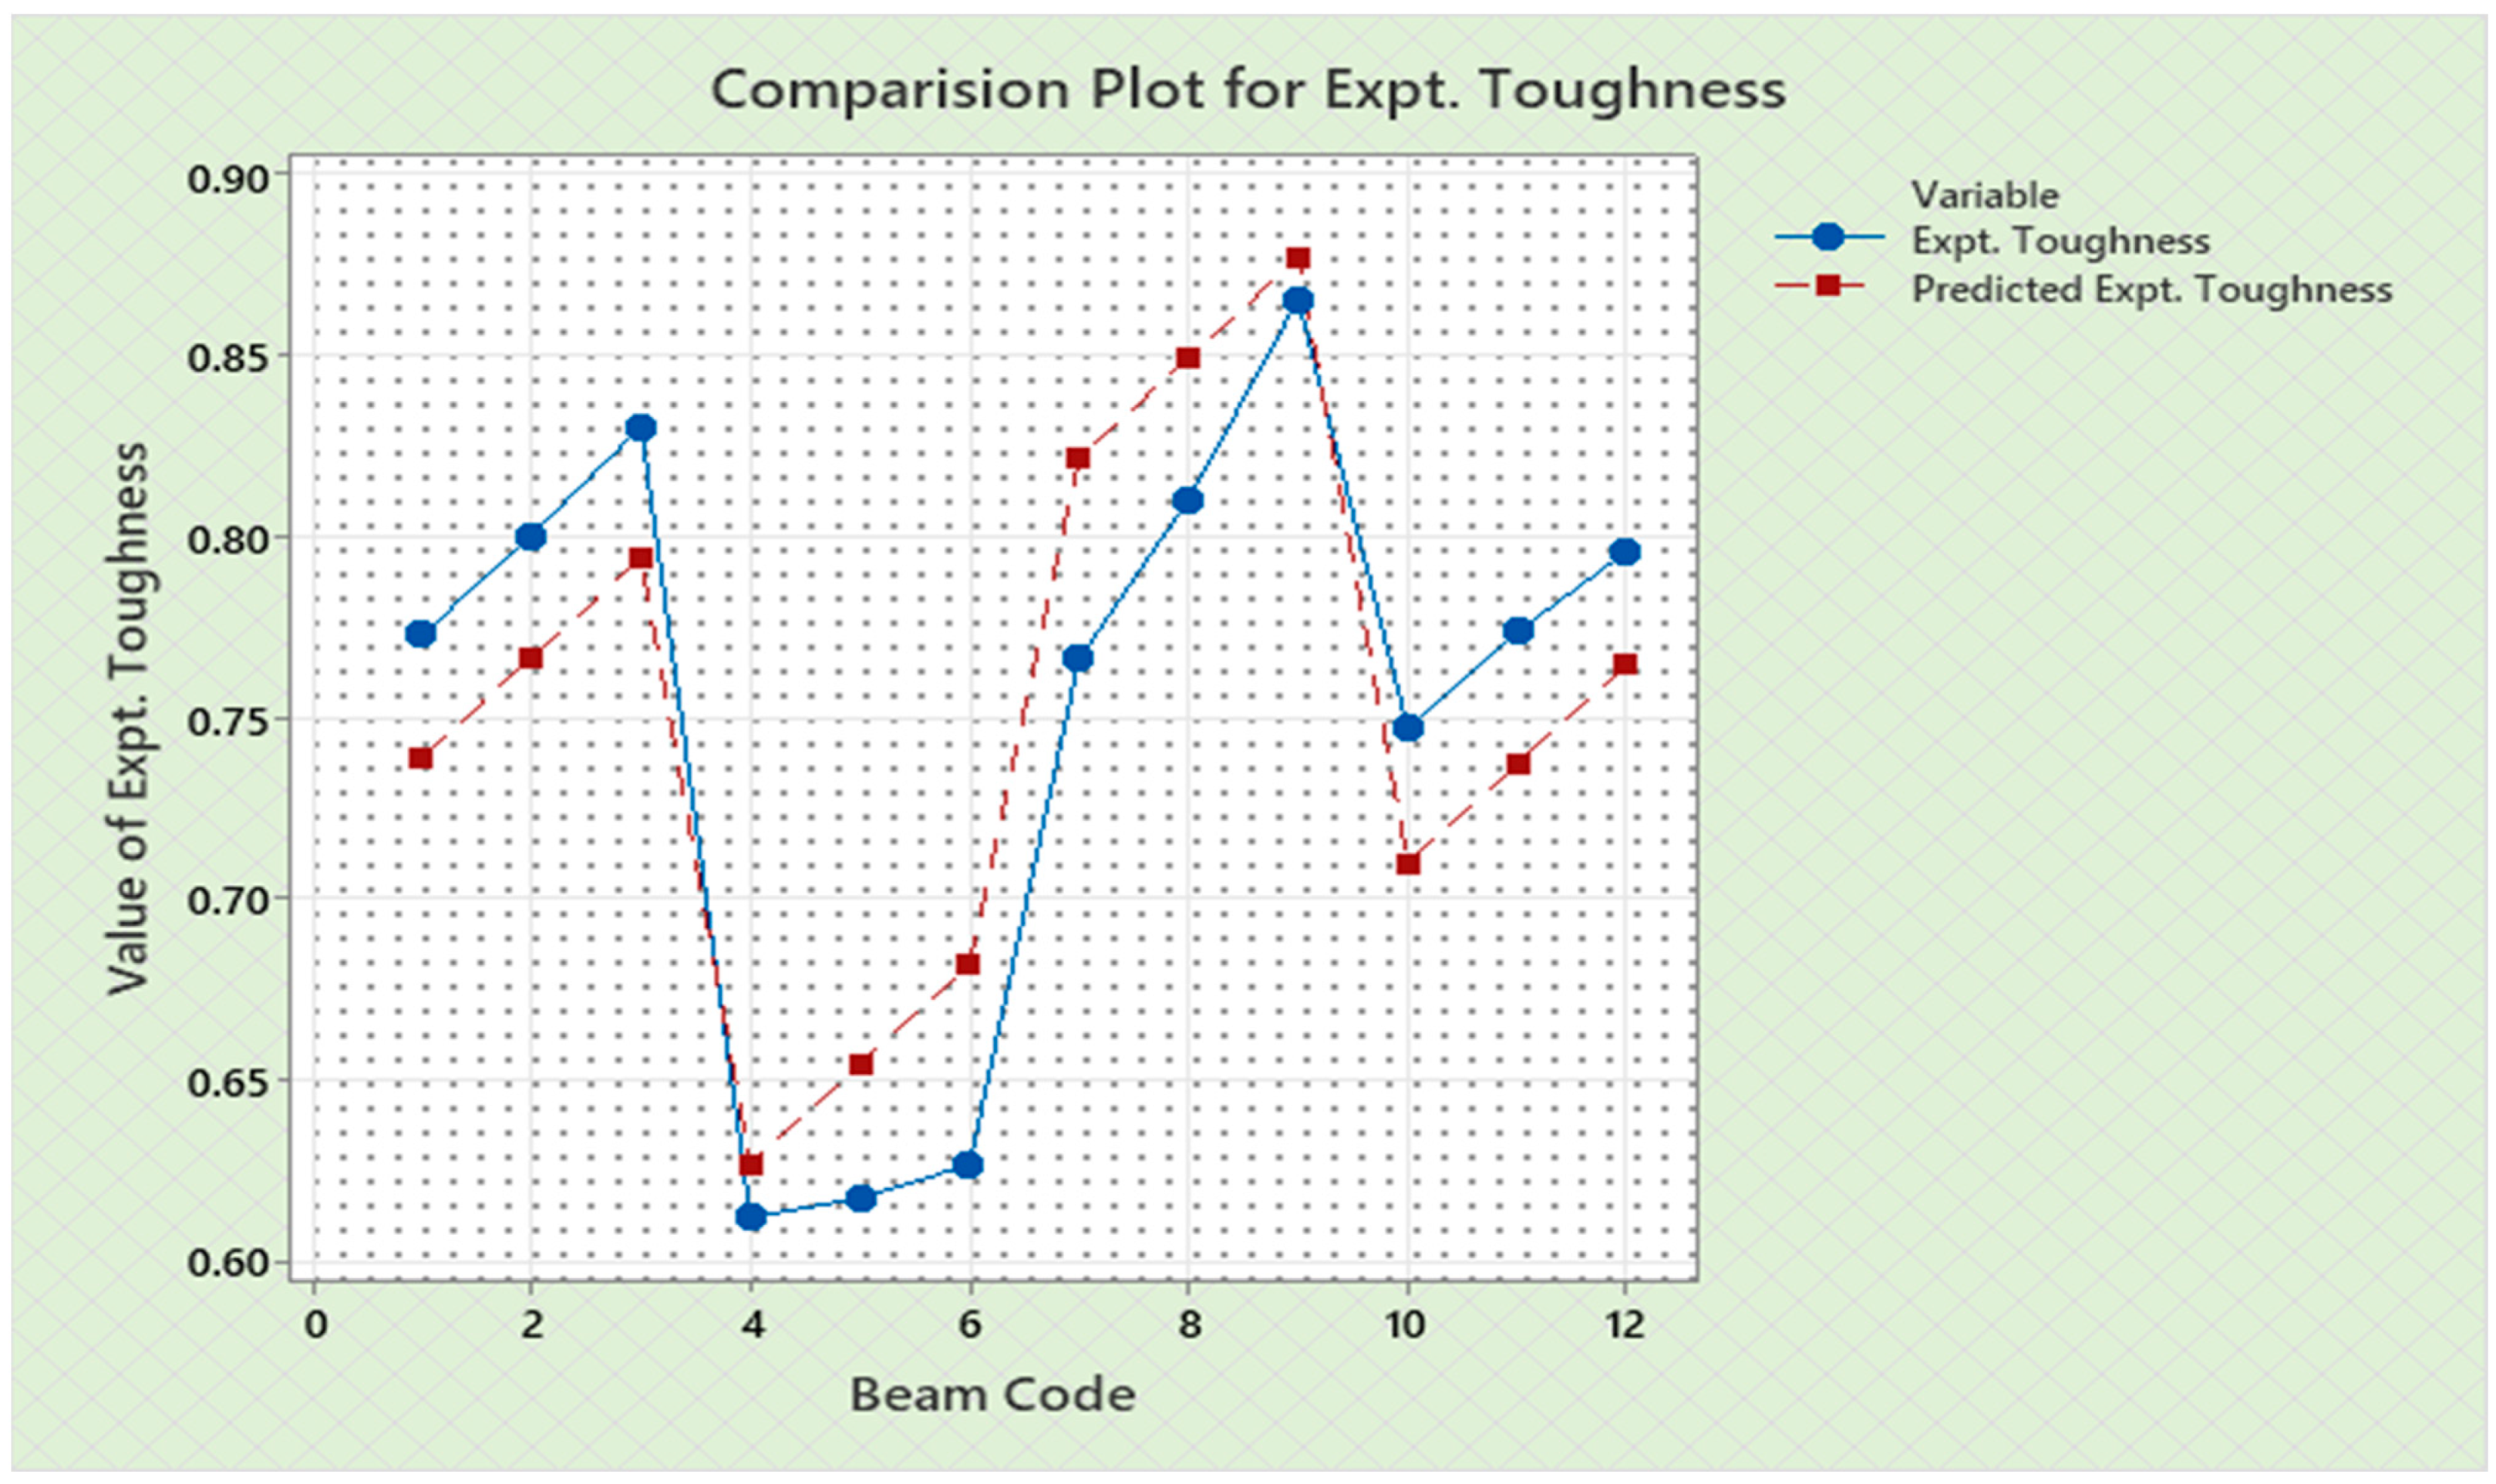
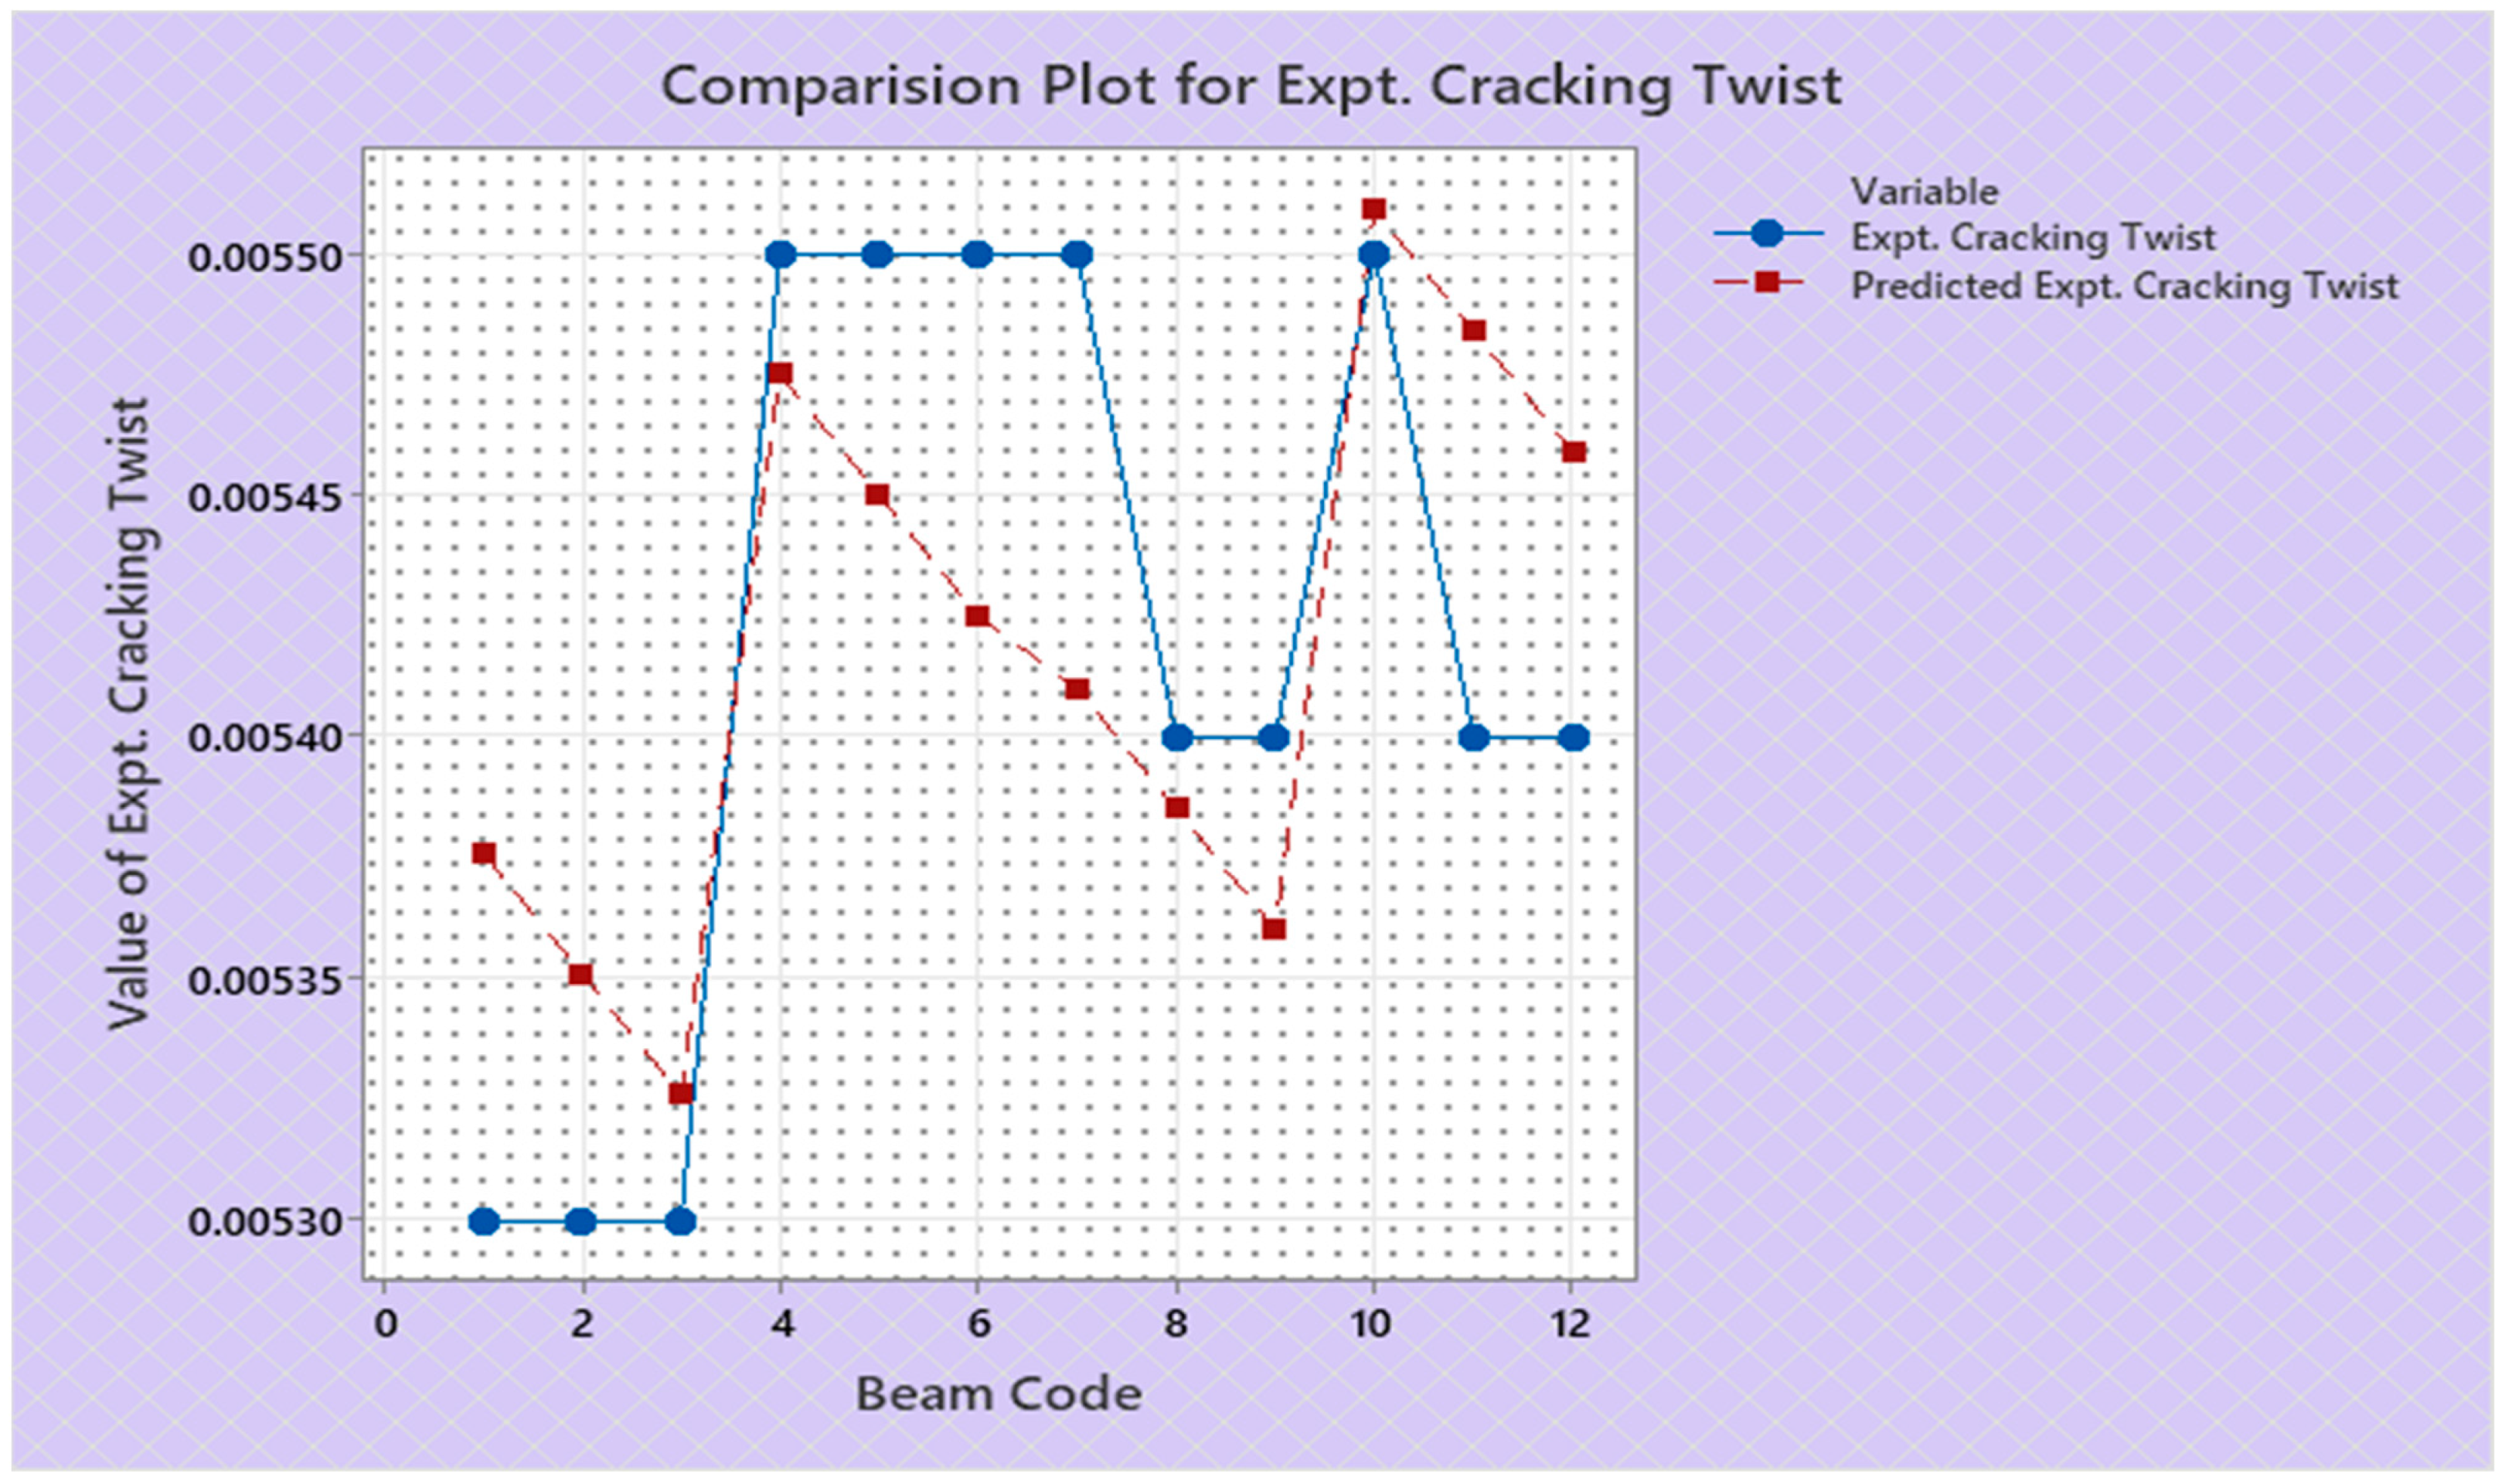
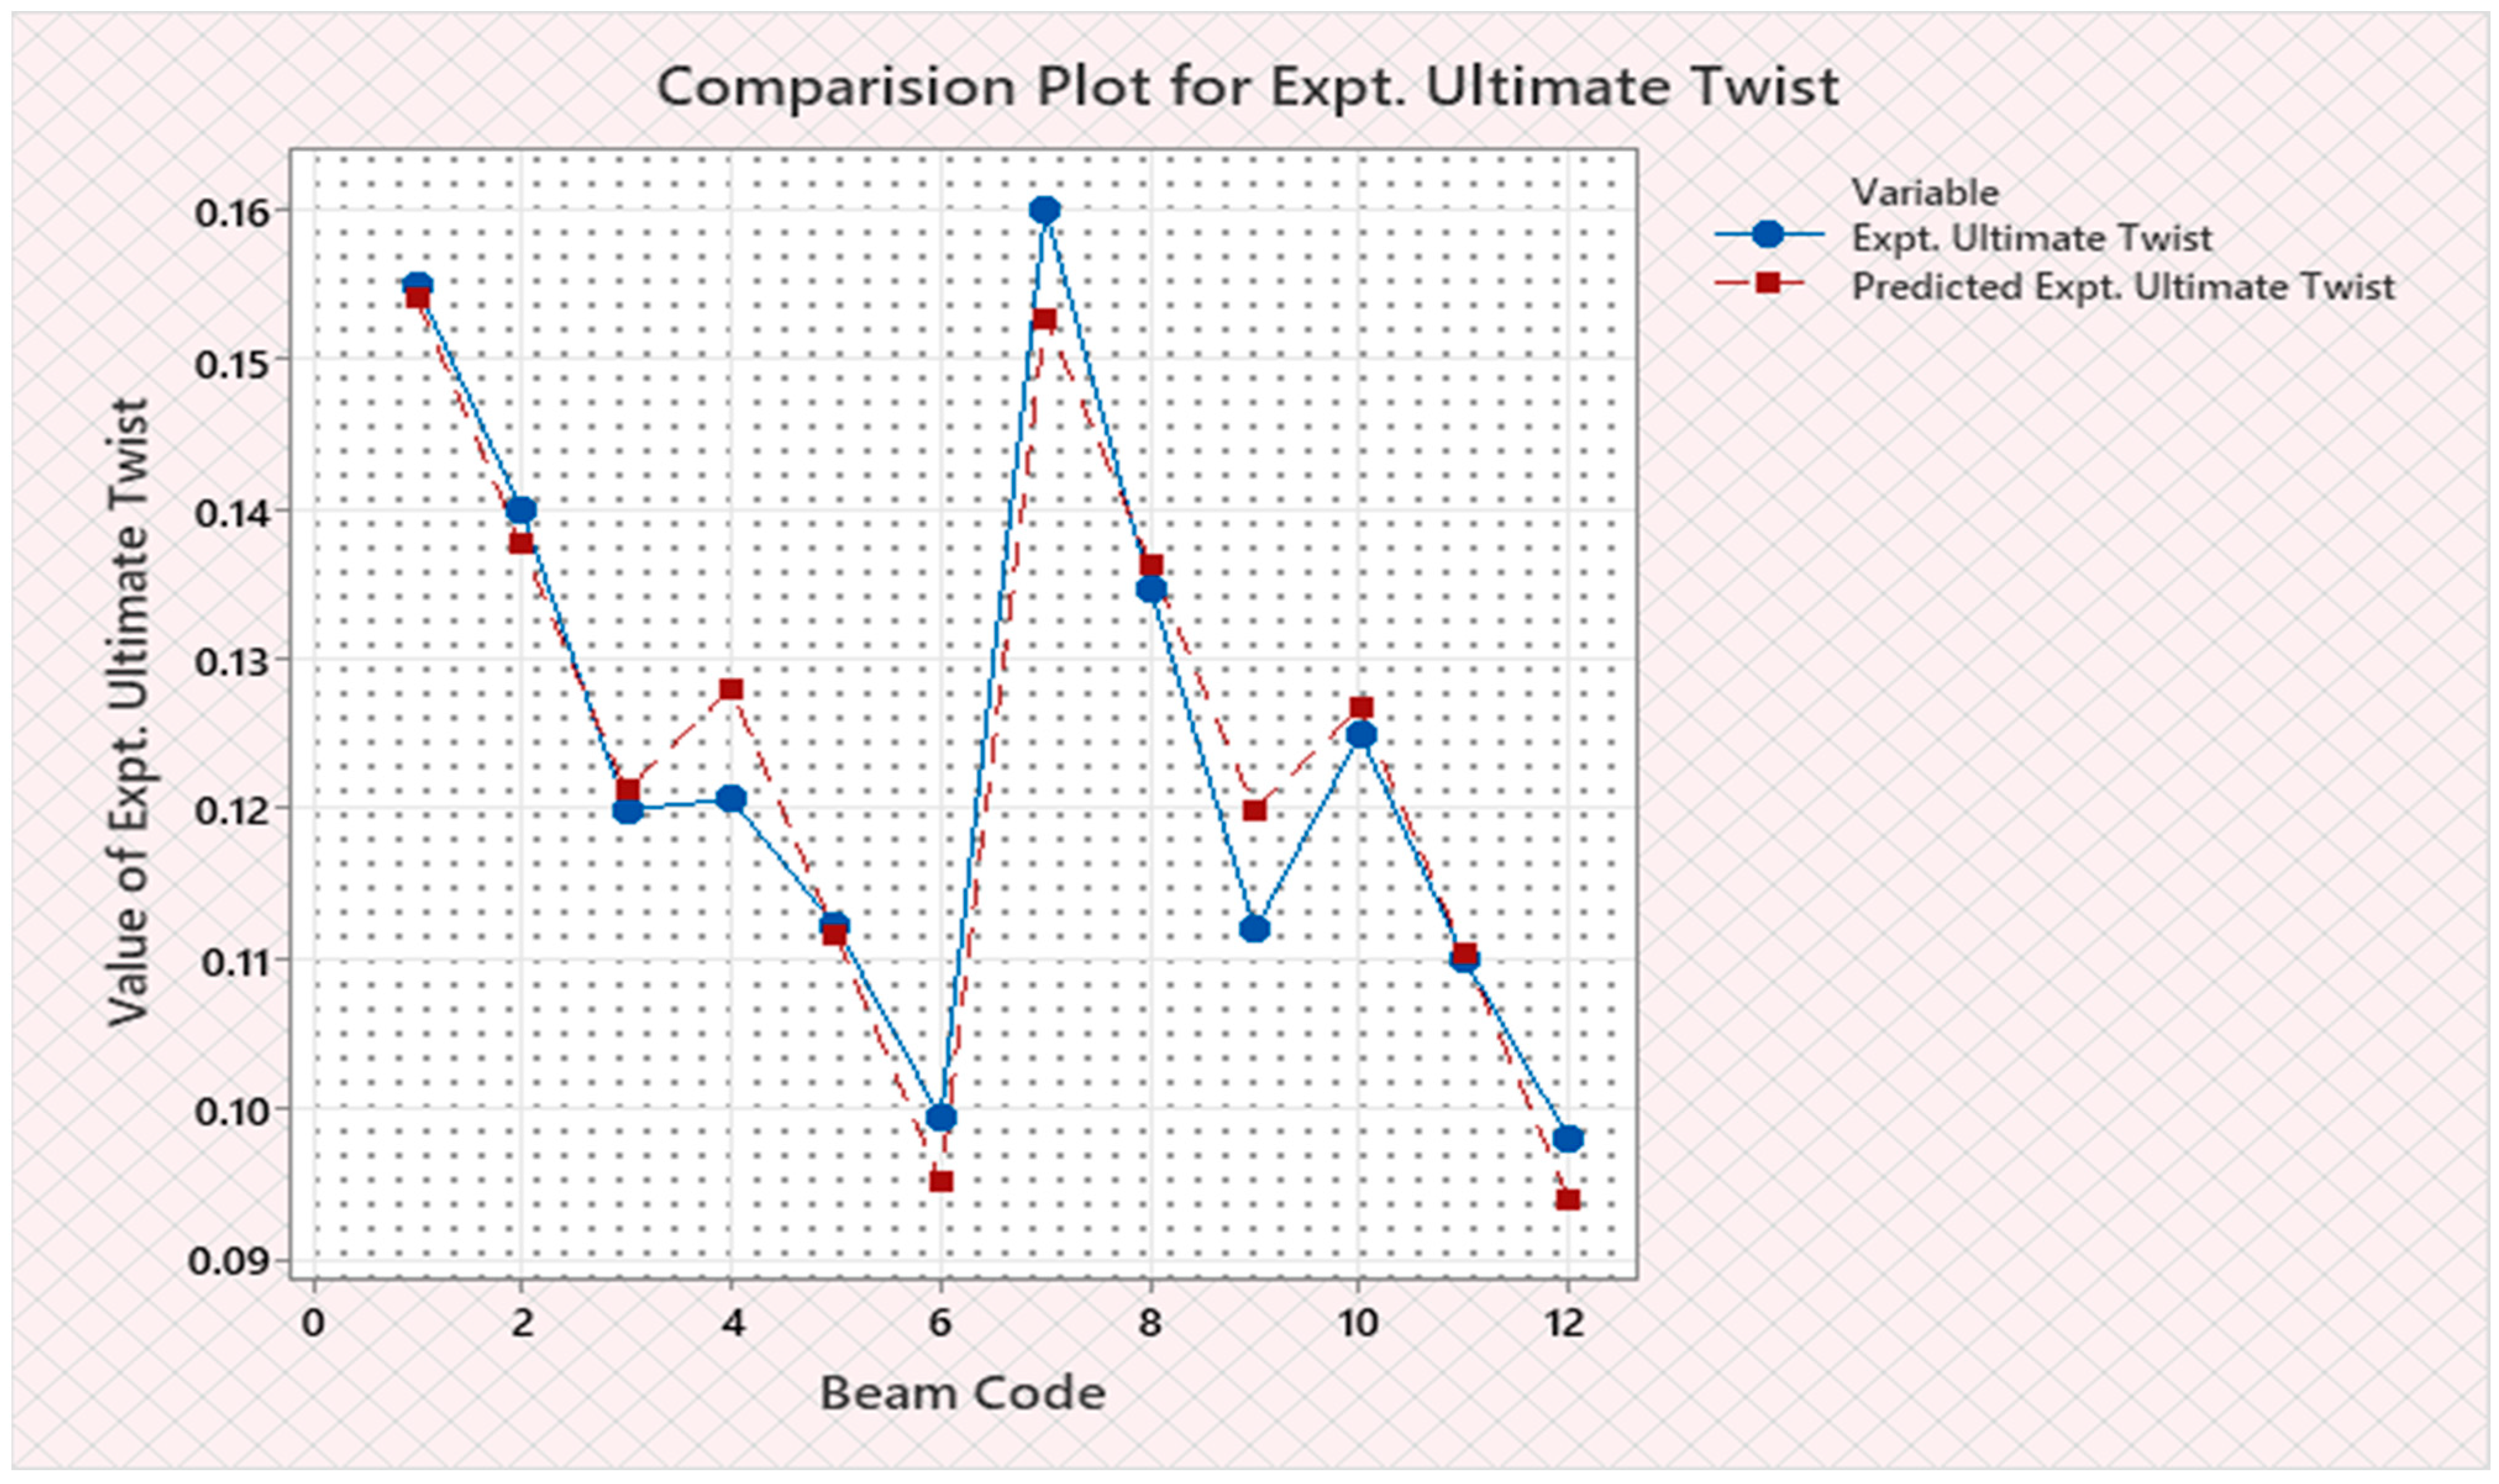
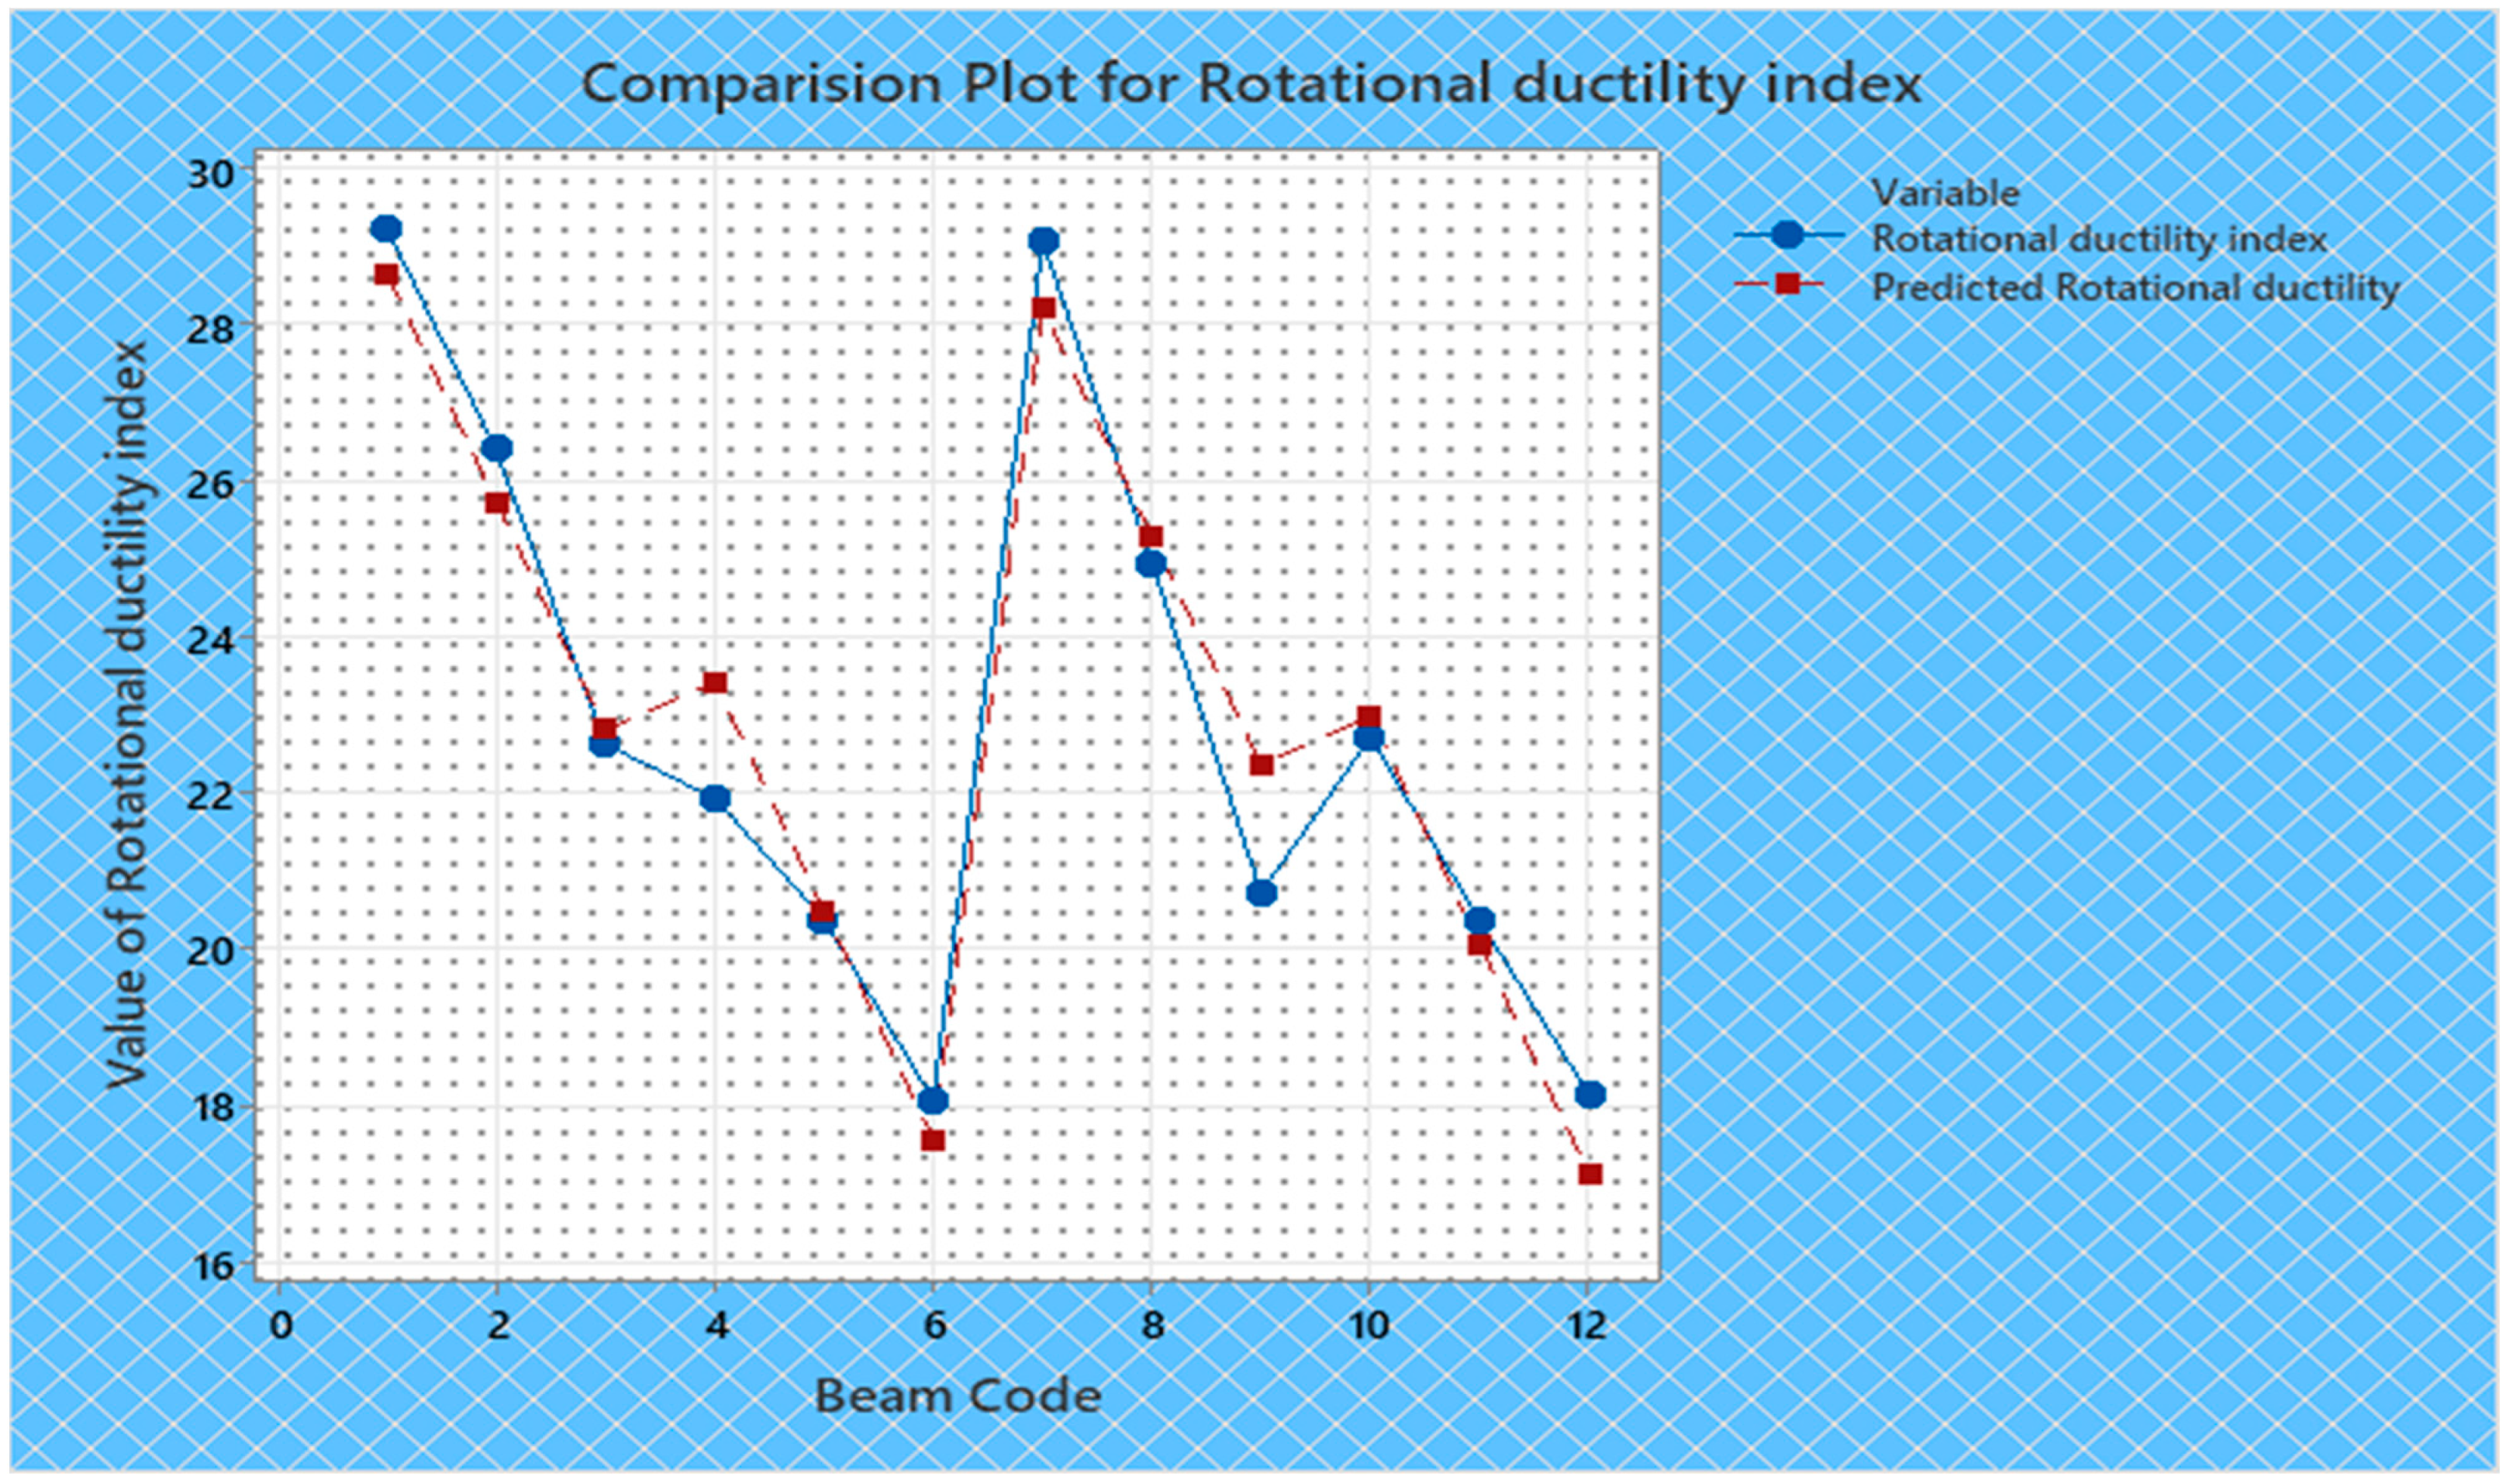
| U3N | 1 | 1456 | 1425.88 | 1044 | 1042.61 | 30 | 27.14 | 5.53 | 5.6046 | 5.816 | 5.4754 | 0.7726 | 0.73896 | 0.0053 | 0.005376 | 0.155 | 0.15408 | 29.25 | 28.675 |
| U4N | 2 | 1456 | 1439.88 | 1059 | 1050.36 | 42.97 | 39.28 | 5.61 | 5.6188 | 6.01 | 5.6944 | 0.8 | 0.76636 | 0.0053 | 0.005351 | 0.14 | 0.13768 | 26.42 | 25.75 |
| U5N | 3 | 1470 | 1453.88 | 1059 | 1058.11 | 49.8 | 51.42 | 5.615 | 5.633 | 6.01 | 5.9134 | 0.83 | 0.79376 | 0.0053 | 0.005326 | 0.12 | 0.12128 | 22.64 | 22.825 |
| Lo3N | 4 | 1455 | 1477.36 | 1057 | 1059.44 | 57.15 | 60.98 | 5.816 | 5.7678 | 6.899 | 6.9748 | 0.6126 | 0.62712 | 0.0055 | 0.005475 | 0.1207 | 0.12804 | 21.95 | 23.44 |
| Lo4N | 5 | 1475 | 1491.36 | 1067 | 1067.19 | 61.84 | 73.12 | 5.816 | 5.782 | 6.939 | 7.1938 | 0.6177 | 0.65452 | 0.0055 | 0.00545 | 0.1122 | 0.11164 | 20.4 | 20.515 |
| Lo5N | 6 | 1482 | 1505.36 | 1067 | 1074.94 | 95.09 | 85.26 | 5.816 | 5.7962 | 6.979 | 7.4128 | 0.627 | 0.68192 | 0.0055 | 0.005425 | 0.0995 | 0.09524 | 18.09 | 17.59 |
| To3N | 7 | 1453 | 1467.68 | 1042 | 1047.77 | 43.11 | 45.64 | 5.735 | 5.6834 | 6.899 | 7.4174 | 0.766 | 0.82156 | 0.0055 | 0.00541 | 0.16 | 0.15282 | 29.09 | 28.225 |
| To4N | 8 | 1453 | 1481.68 | 1052 | 1055.52 | 54.75 | 57.78 | 5.73 | 5.6976 | 7.38 | 7.6364 | 0.81 | 0.84896 | 0.0054 | 0.005385 | 0.1348 | 0.13642 | 24.96 | 25.3 |
| To5N | 9 | 1477 | 1495.68 | 1062 | 1063.27 | 70.19 | 69.92 | 5.73 | 5.7118 | 7.86 | 7.8554 | 0.865 | 0.87636 | 0.0054 | 0.00536 | 0.112 | 0.12002 | 20.74 | 22.375 |
| Co3N | 10 | 1535 | 1519.16 | 1067 | 1064.6 | 85.95 | 79.48 | 5.816 | 5.8466 | 9.105 | 8.9168 | 0.7469 | 0.70972 | 0.0055 | 0.005509 | 0.125 | 0.12678 | 22.73 | 22.99 |
| Co4N | 11 | 1545 | 1533.16 | 1077 | 1072.35 | 95.5 | 91.62 | 5.816 | 5.8608 | 9.426 | 9.1358 | 0.7734 | 0.73712 | 0.0054 | 0.005484 | 0.11 | 0.11038 | 20.37 | 20.065 |
| Co5N | 12 | 1582 | 1547.16 | 1084 | 1080.1 | 98.23 | 103.76 | 5.85 | 5.875 | 9.62 | 9.3548 | 0.7957 | 0.76452 | 0.0054 | 0.005459 | 0.098 | 0.09398 | 18.15 | 17.14 |
| Optimization Technique | Global Optimum Value | Optimum Value of Beam Code | Optimum Value of Long. Steel Diameter | Optimum Value of Trans. Steel Diameter |
|---|---|---|---|---|
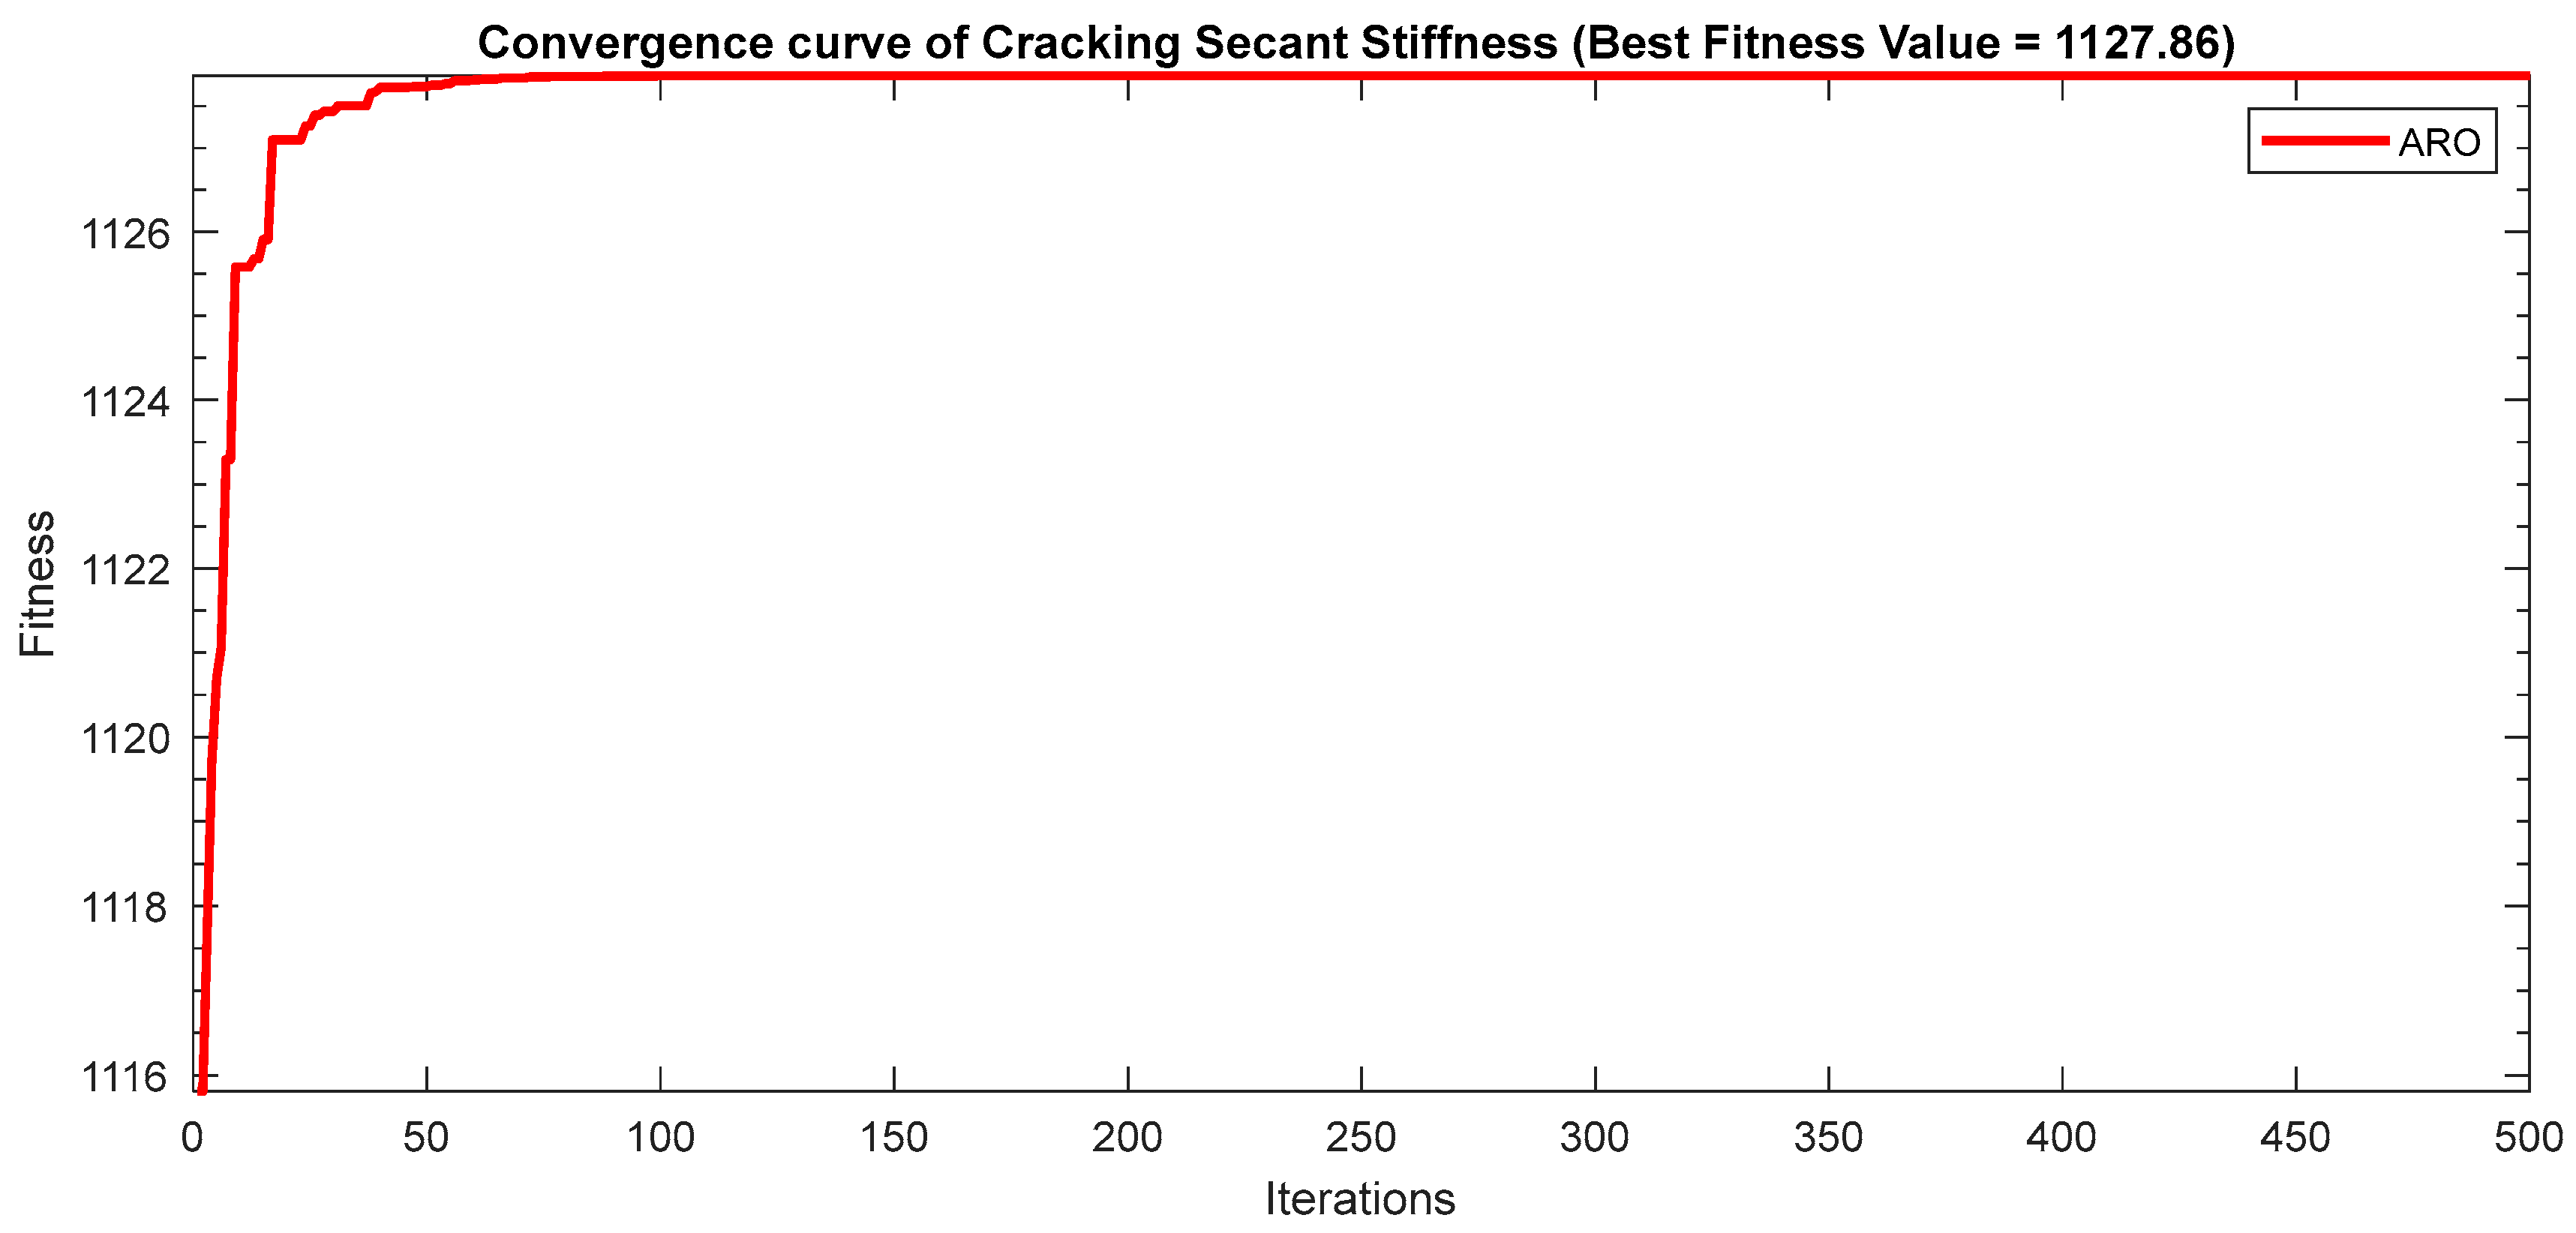
| ARO | 1589.36 | 12 | 12 | 6 |
| 1127.86 | 12 | 6 | 6 | |
| 160.68 | 12 | 6 | 6 | |
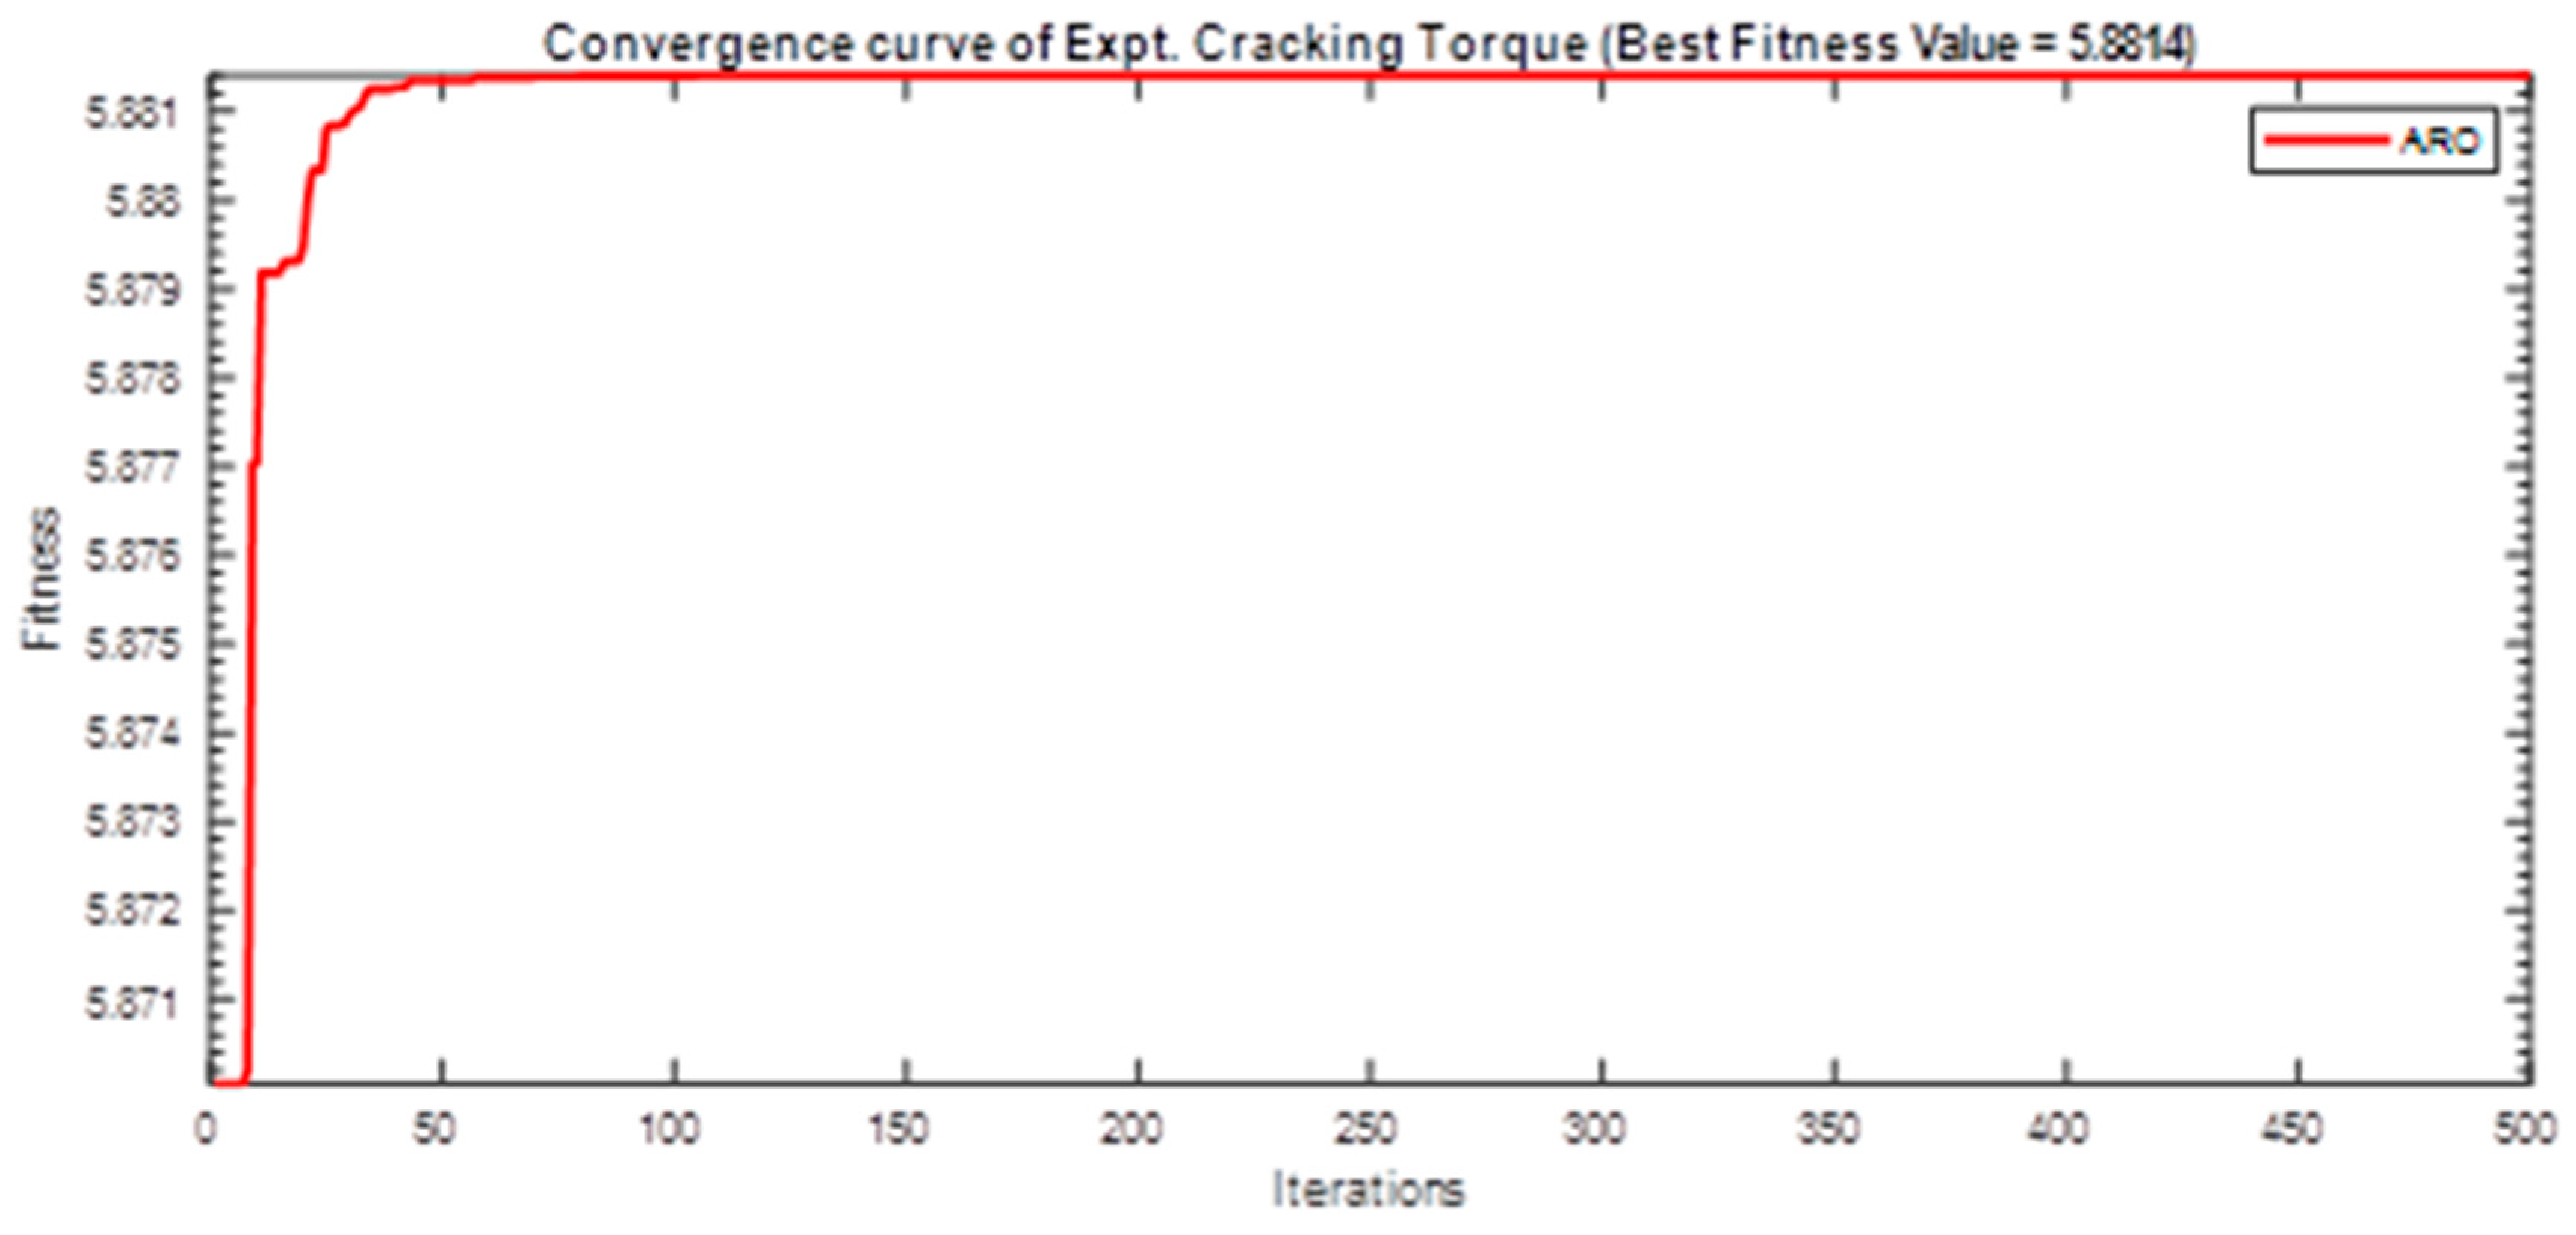
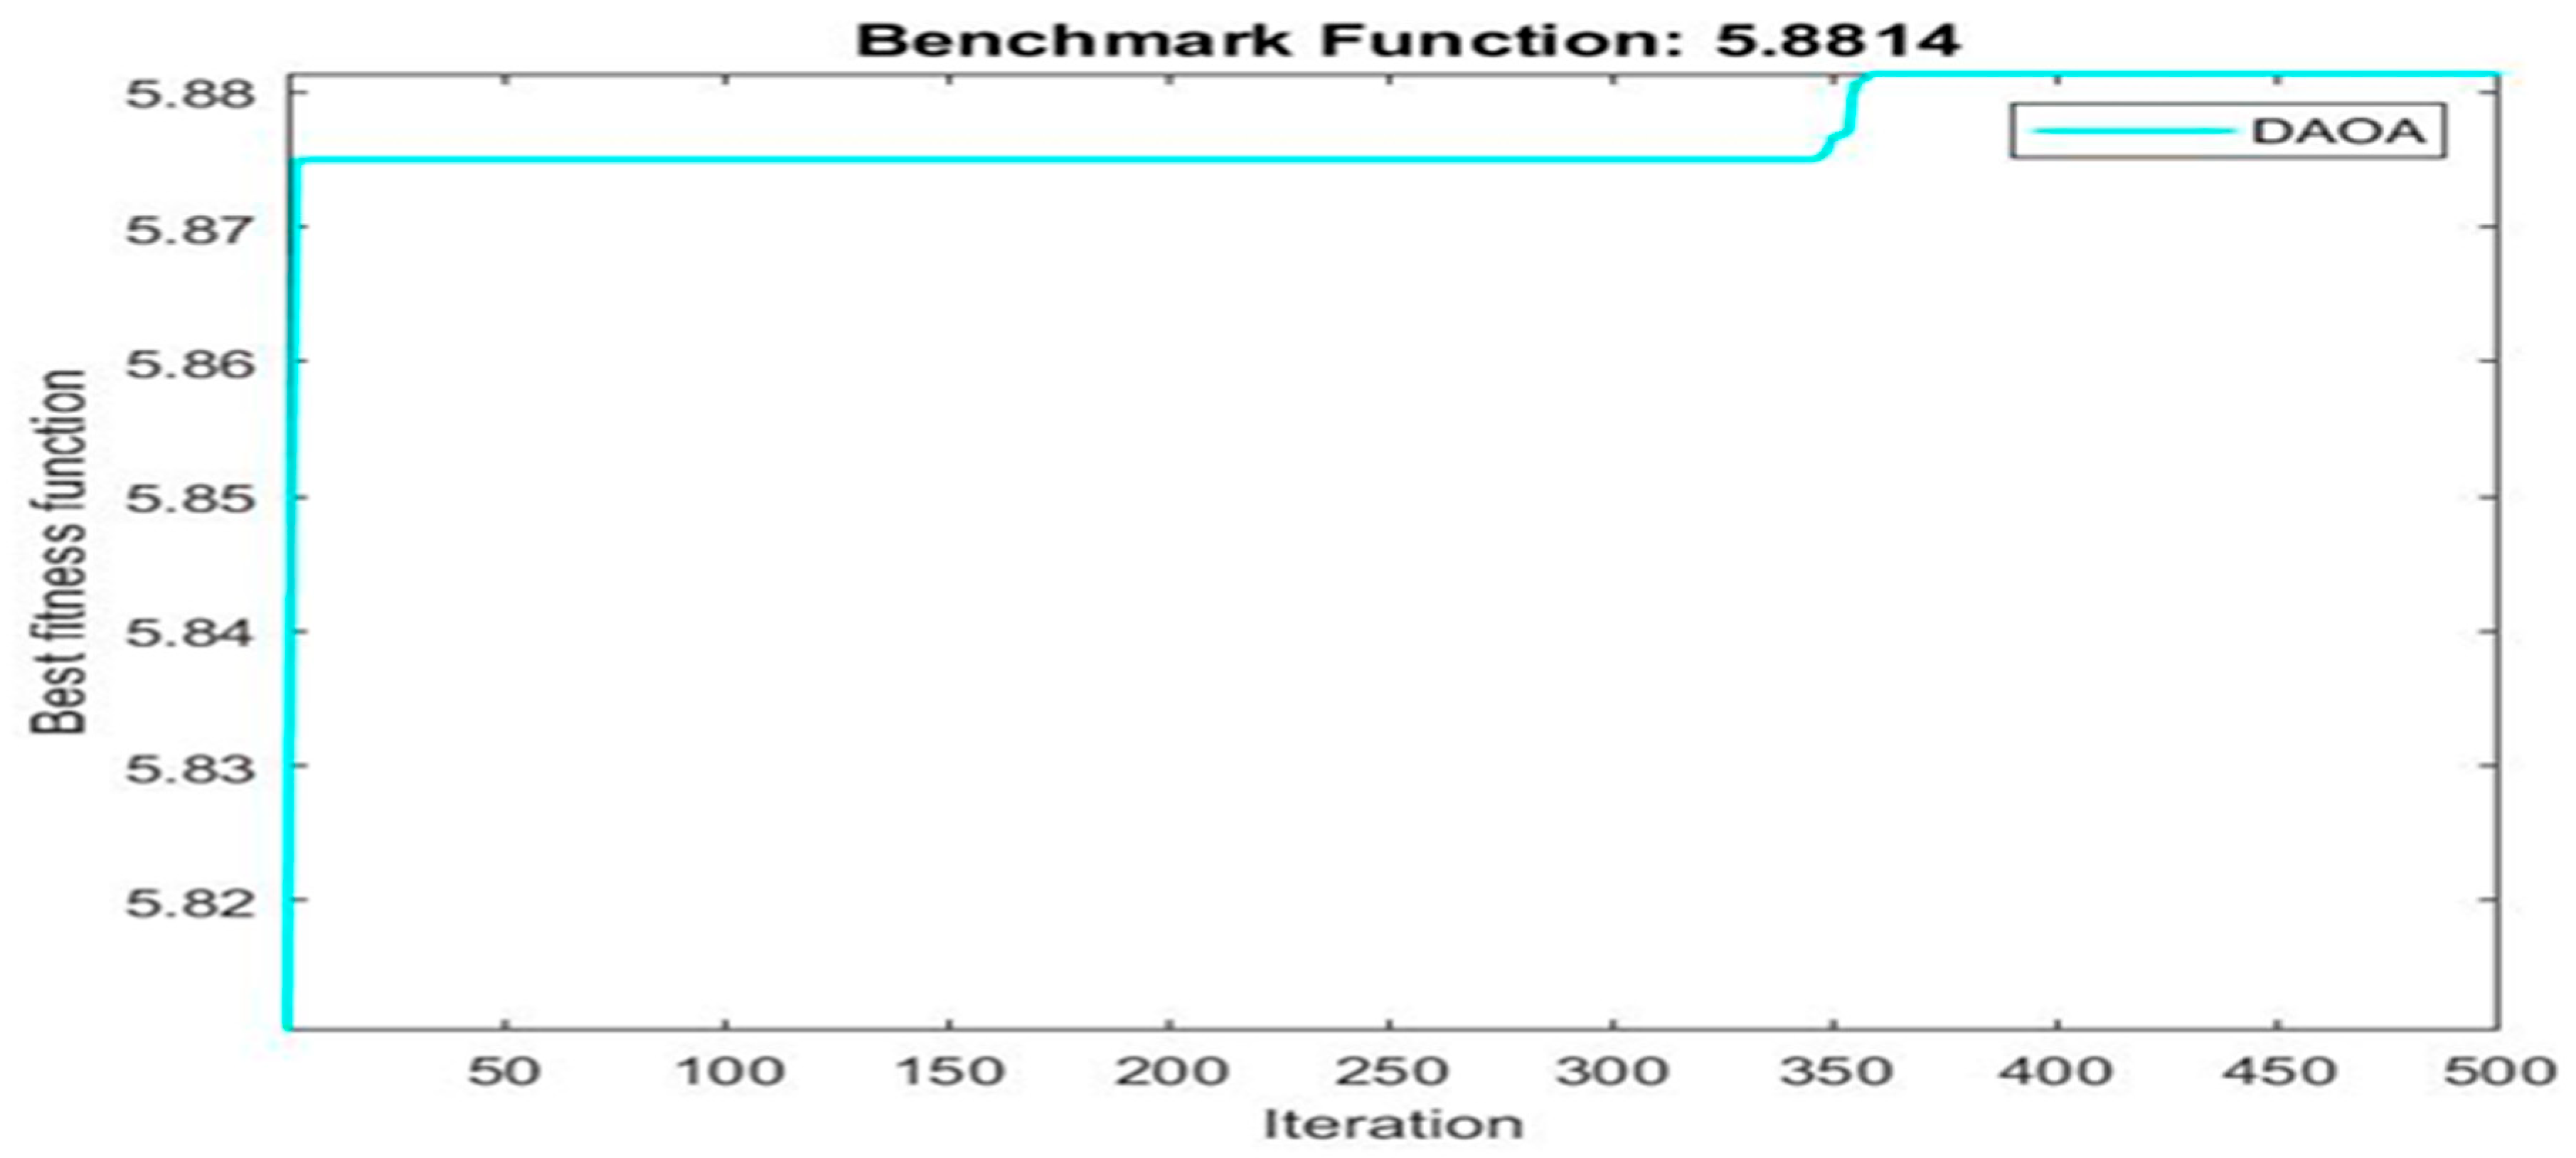
| 5.8814 | 12 | 12 | 6 | |
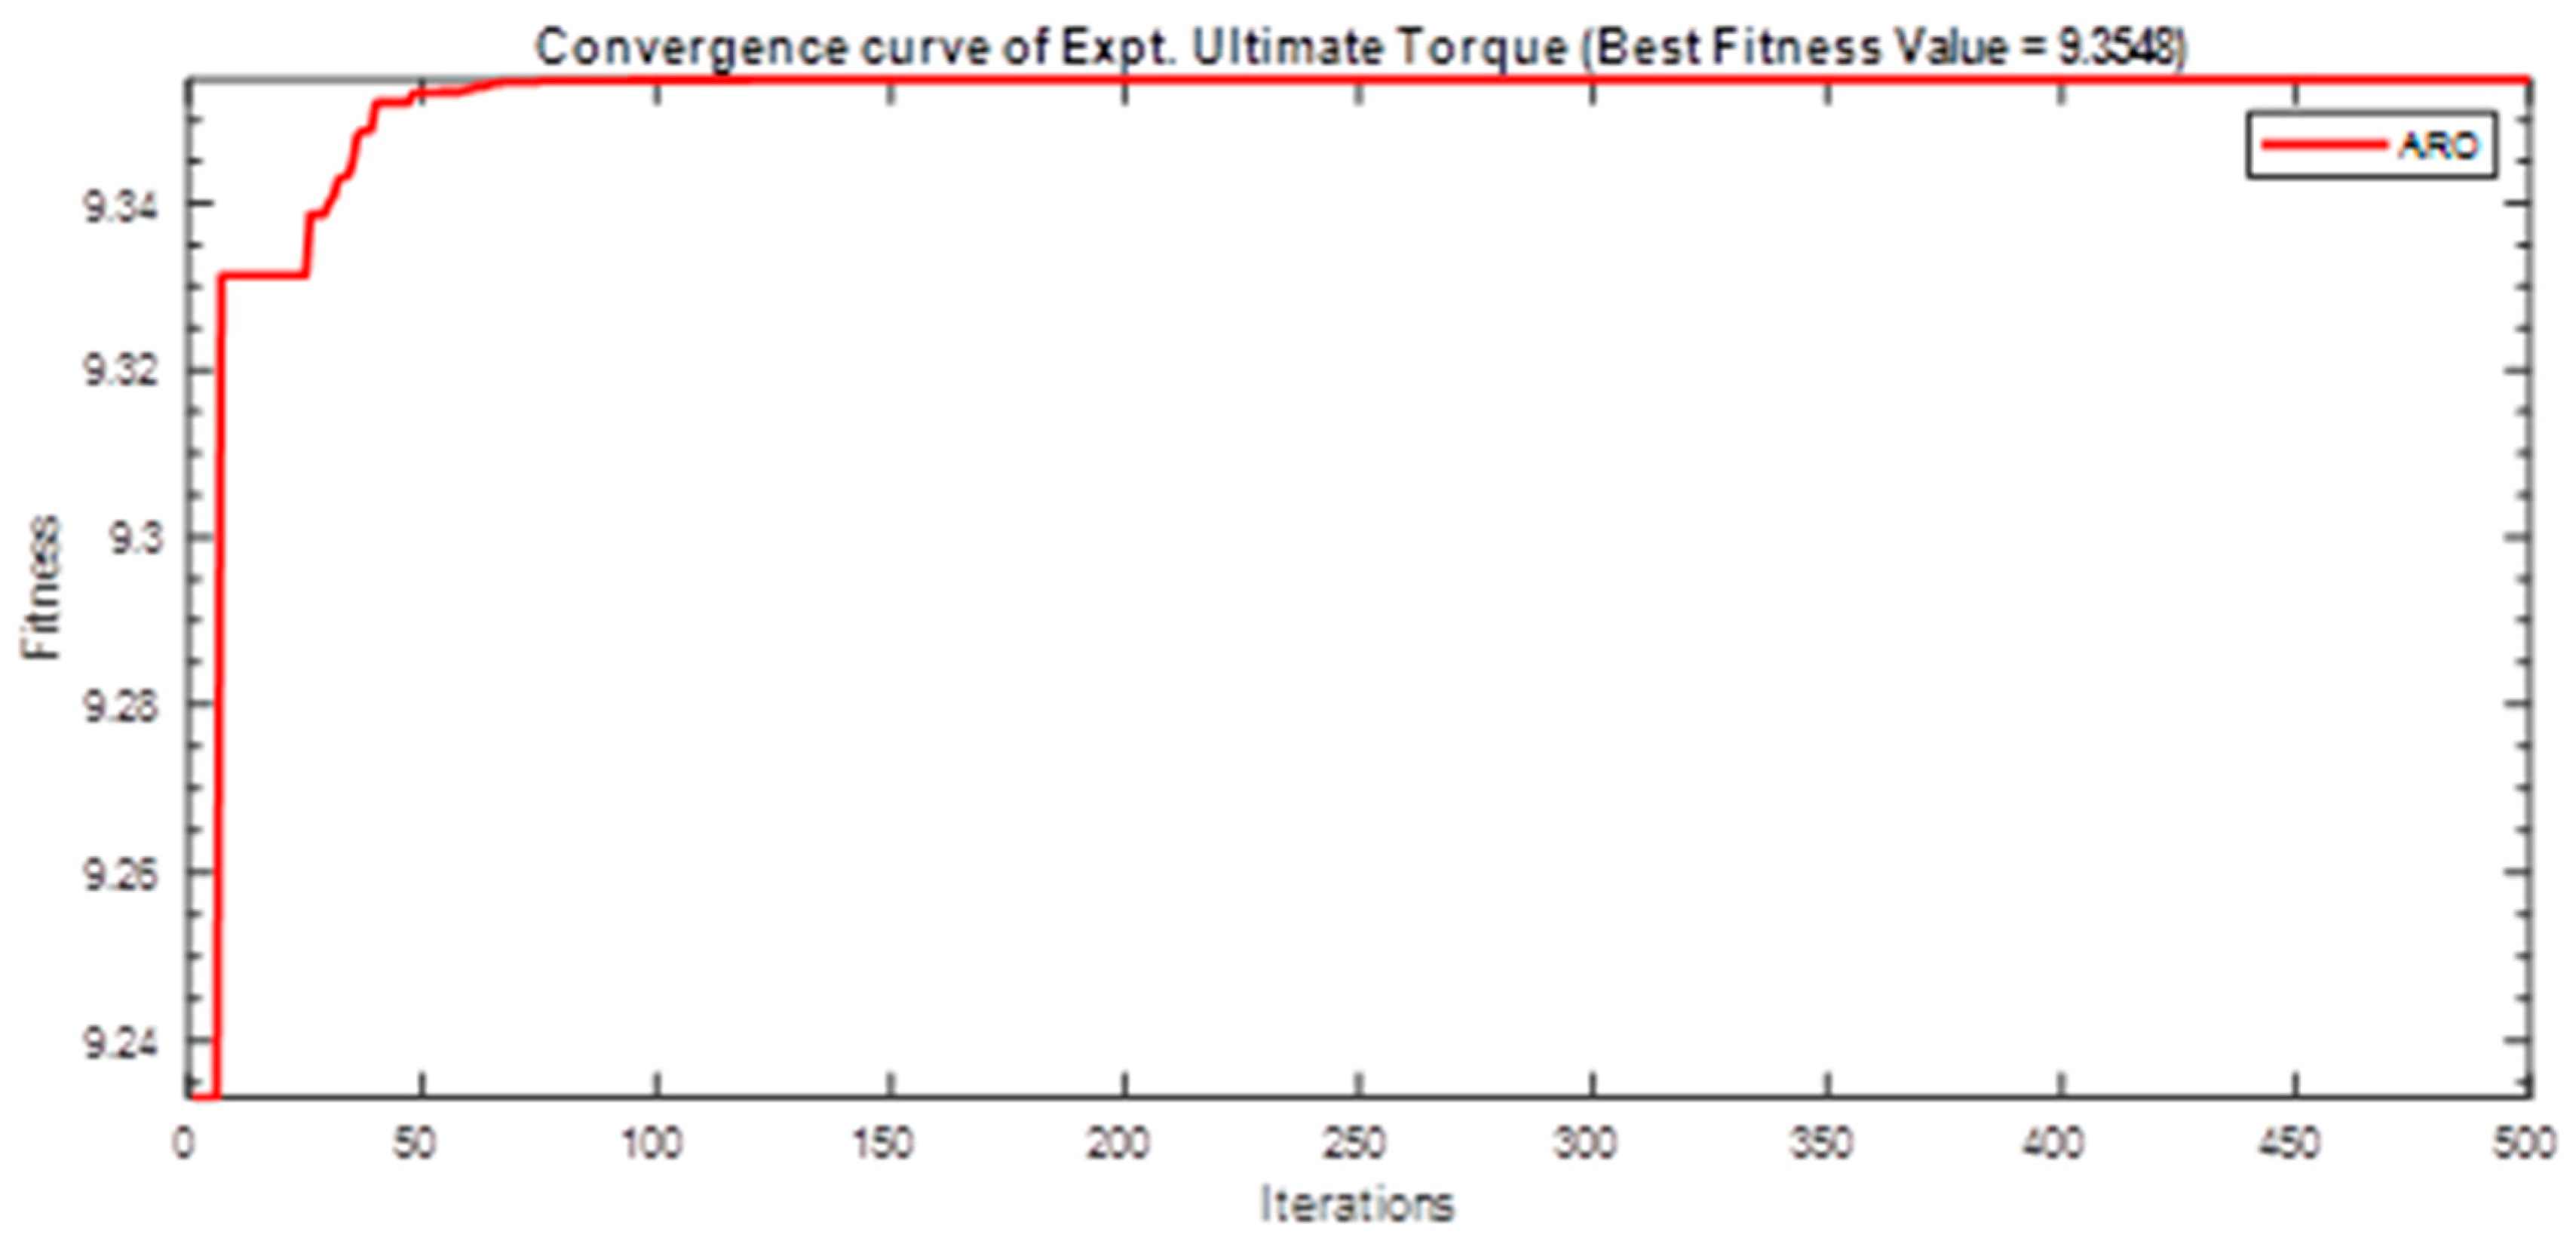
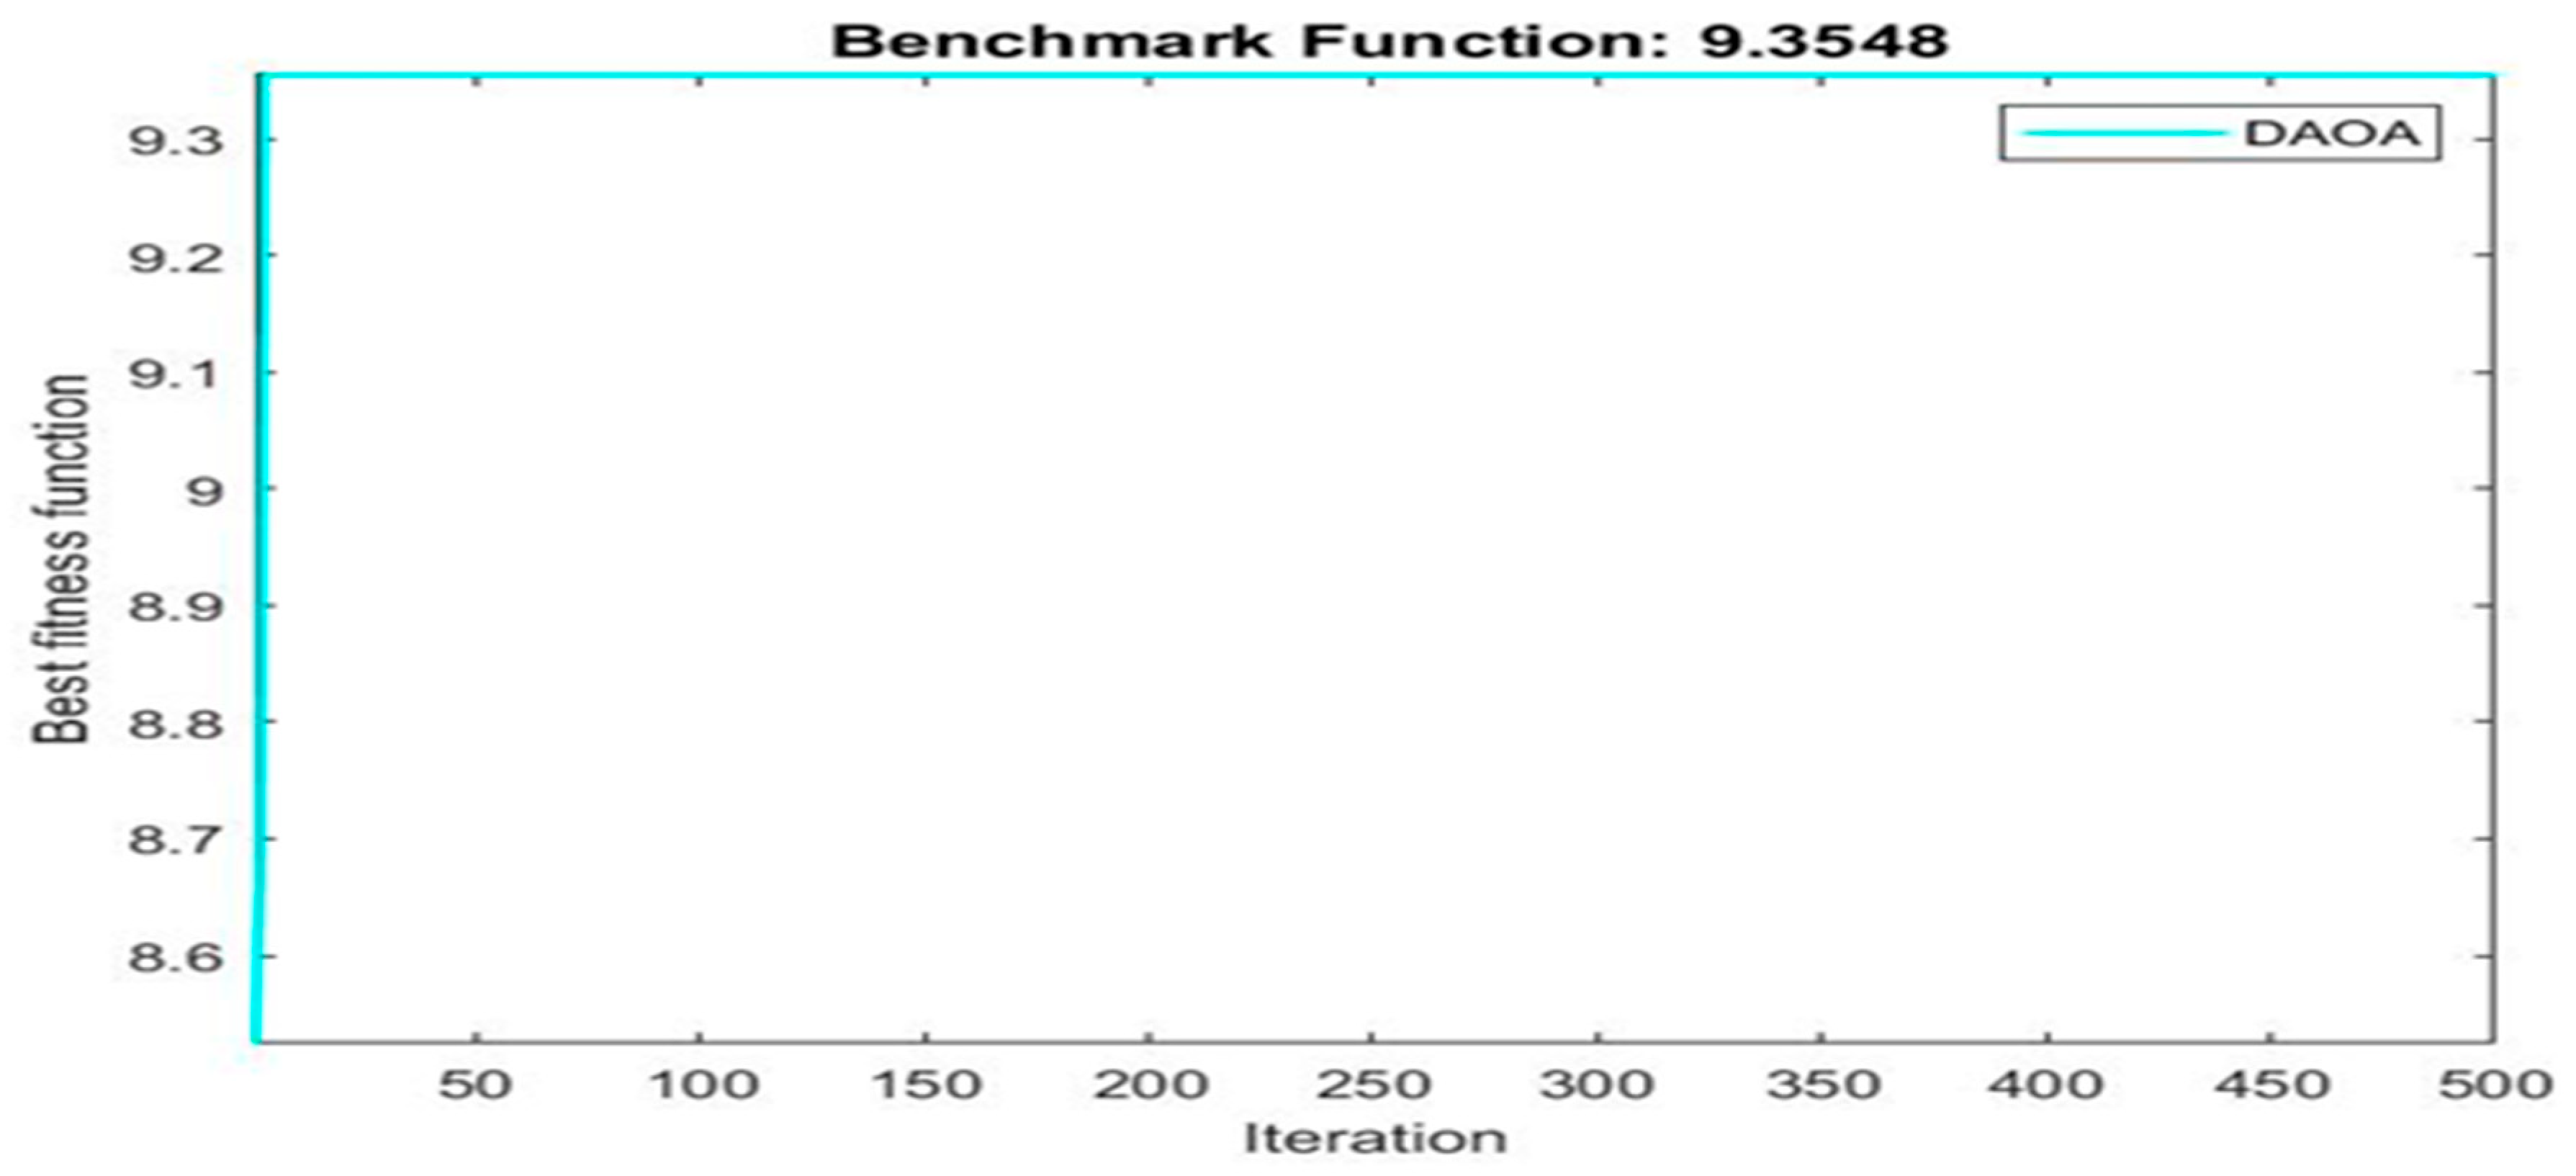
| 9.3548 | 12 | 12 | 8 | |
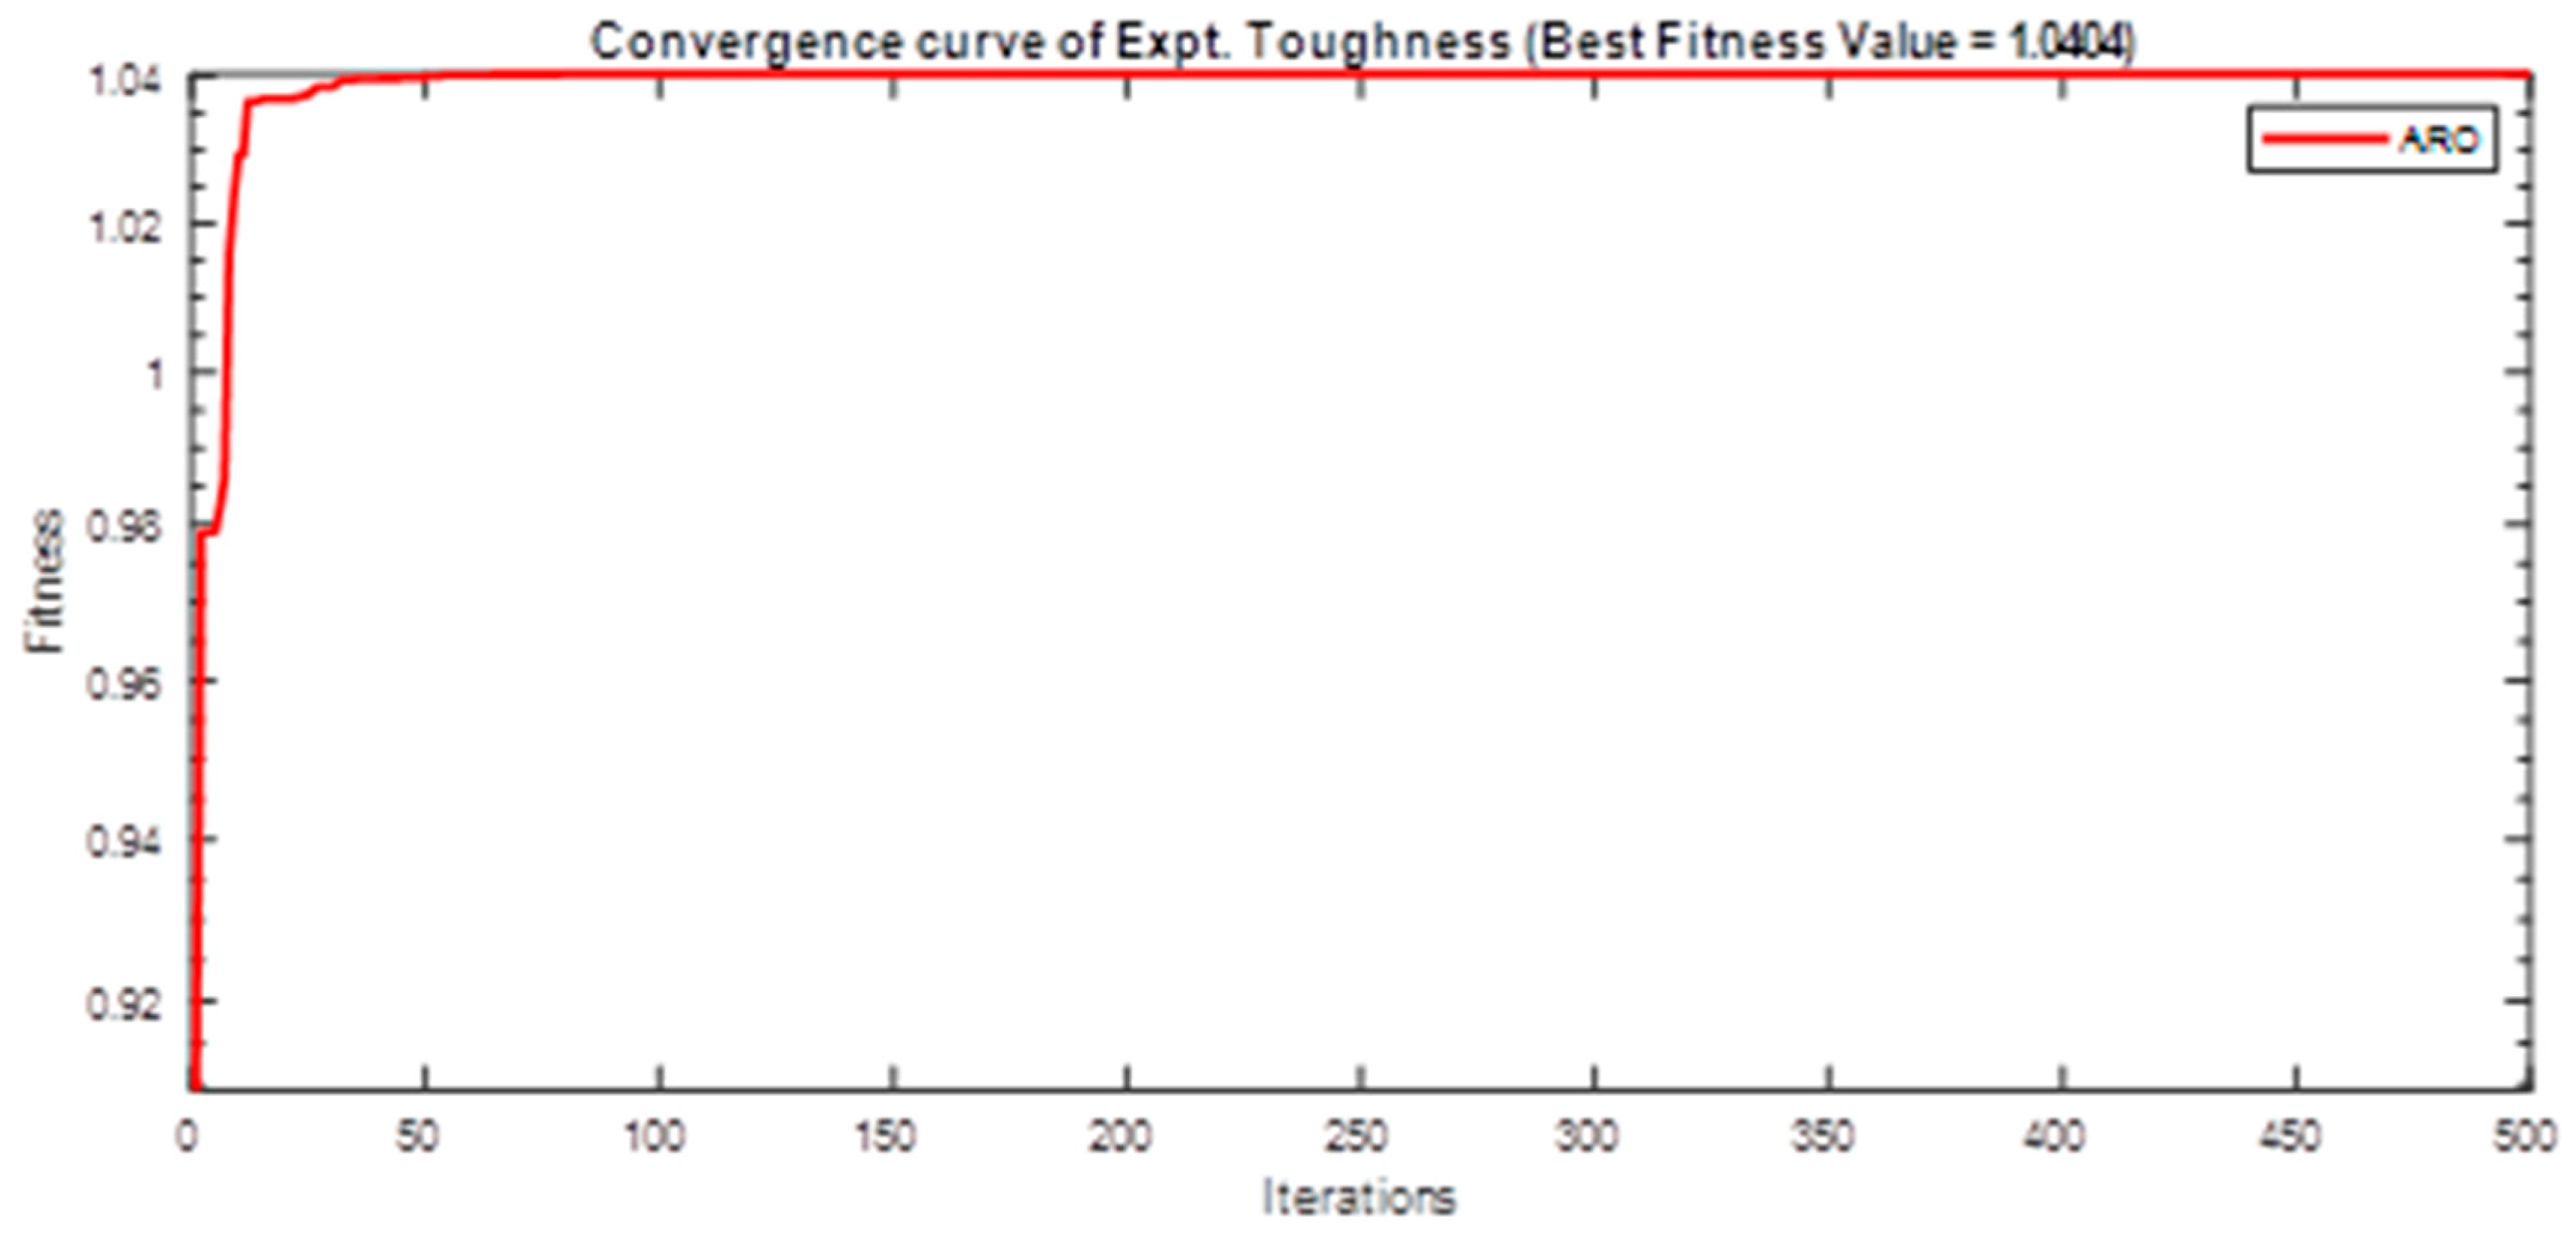
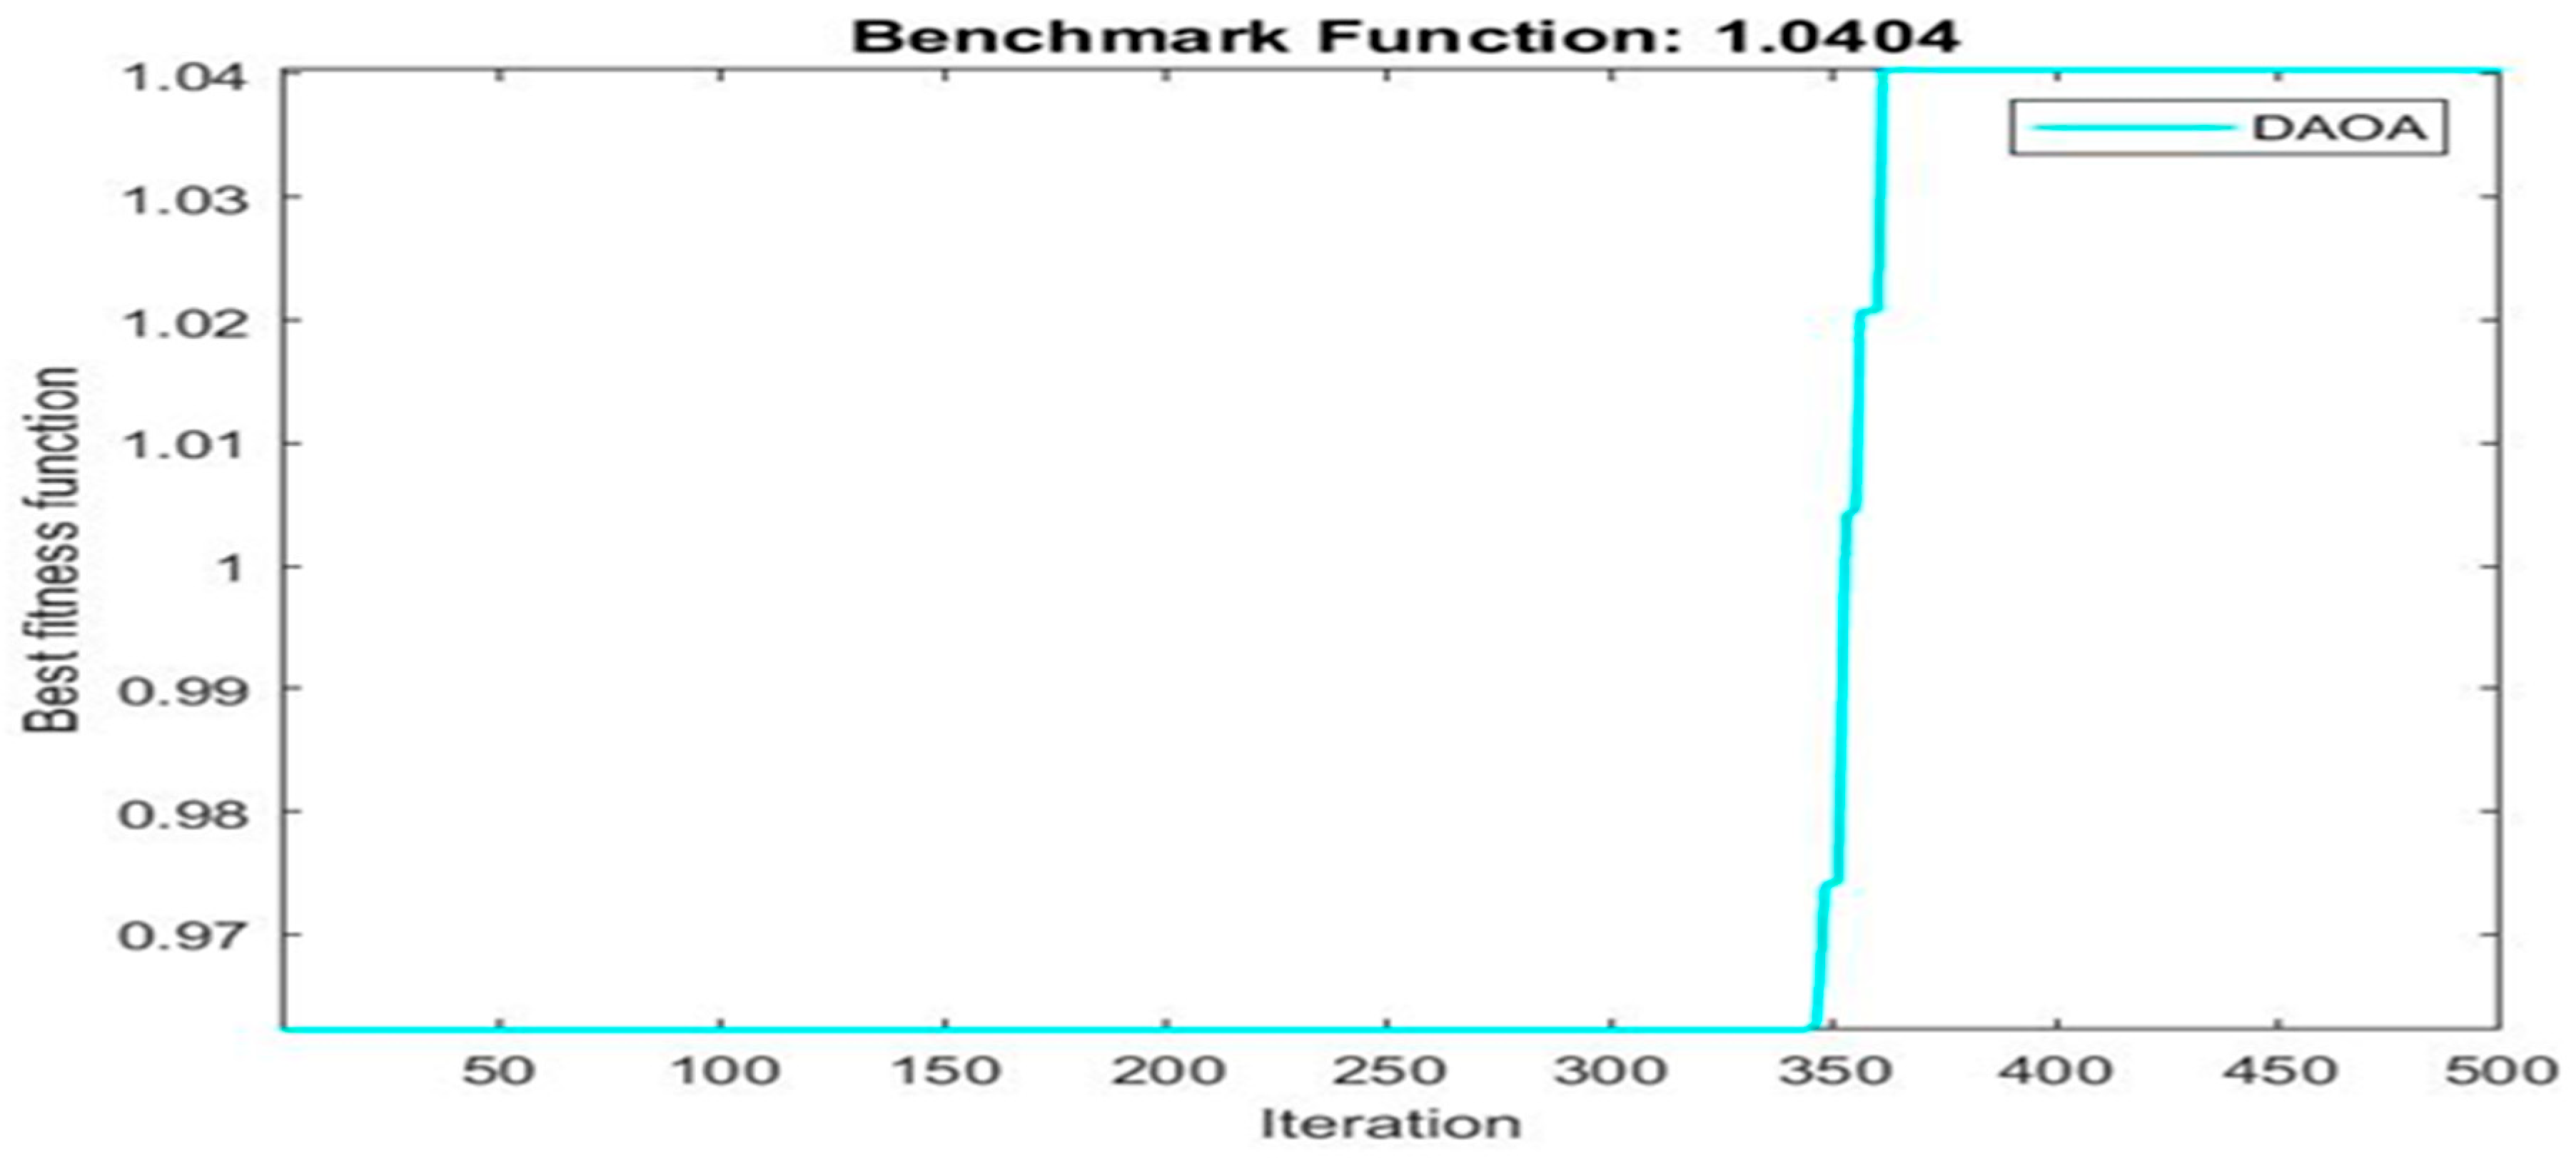
| 1.0404 | 12 | 6 | 6 | |
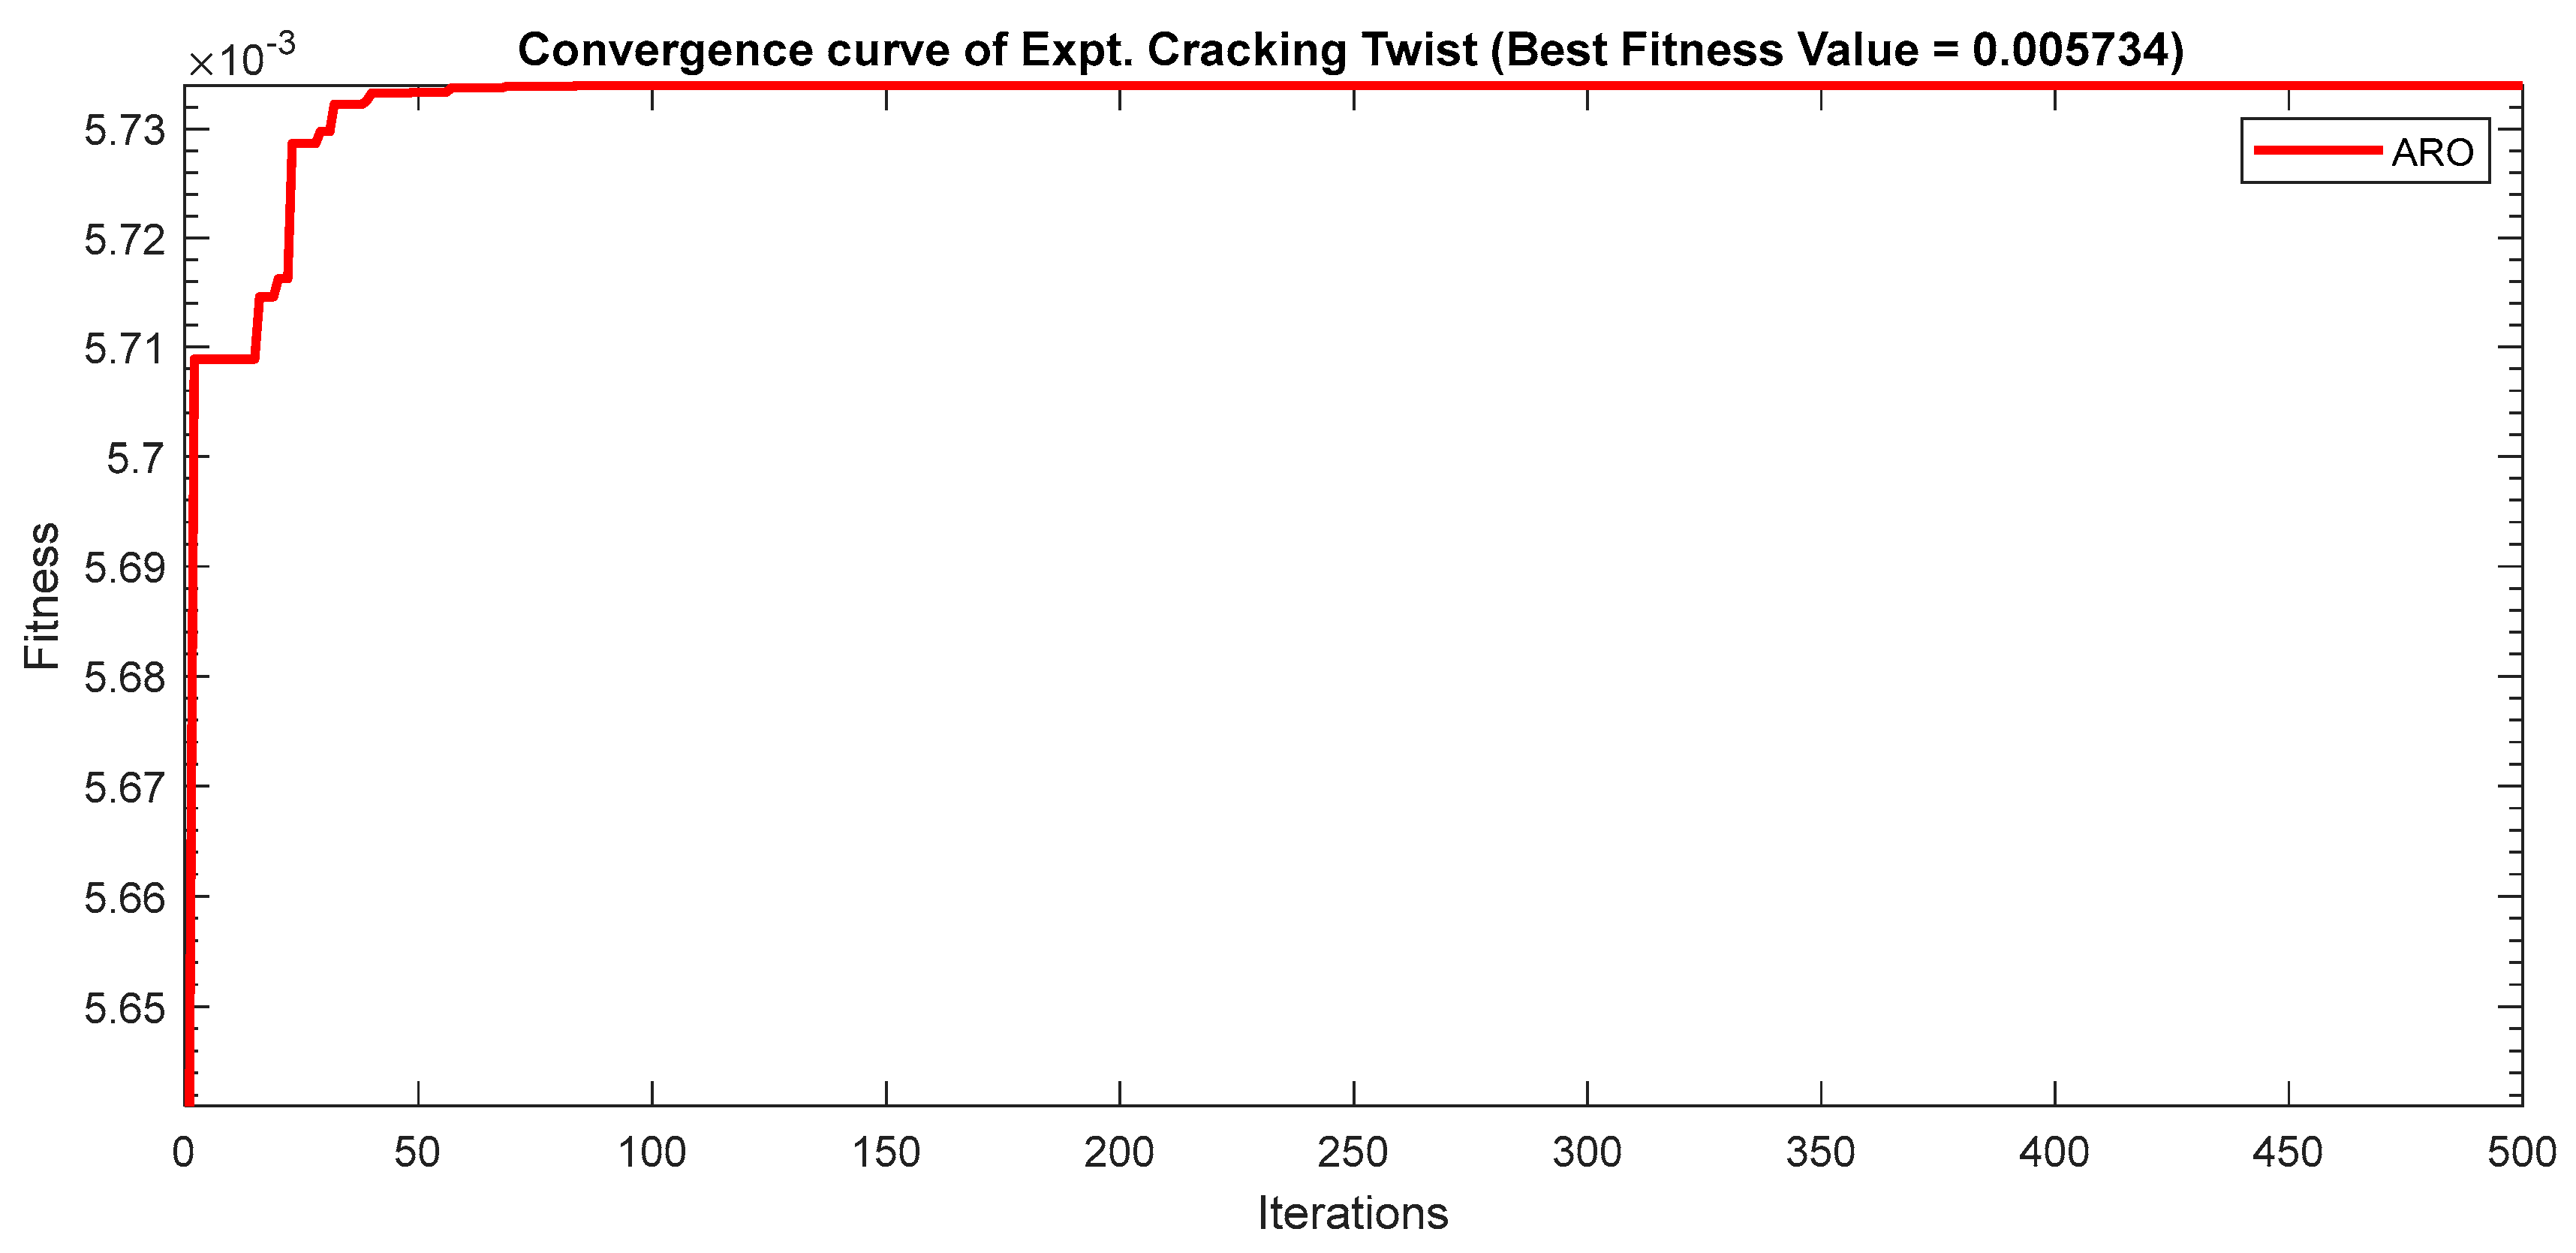
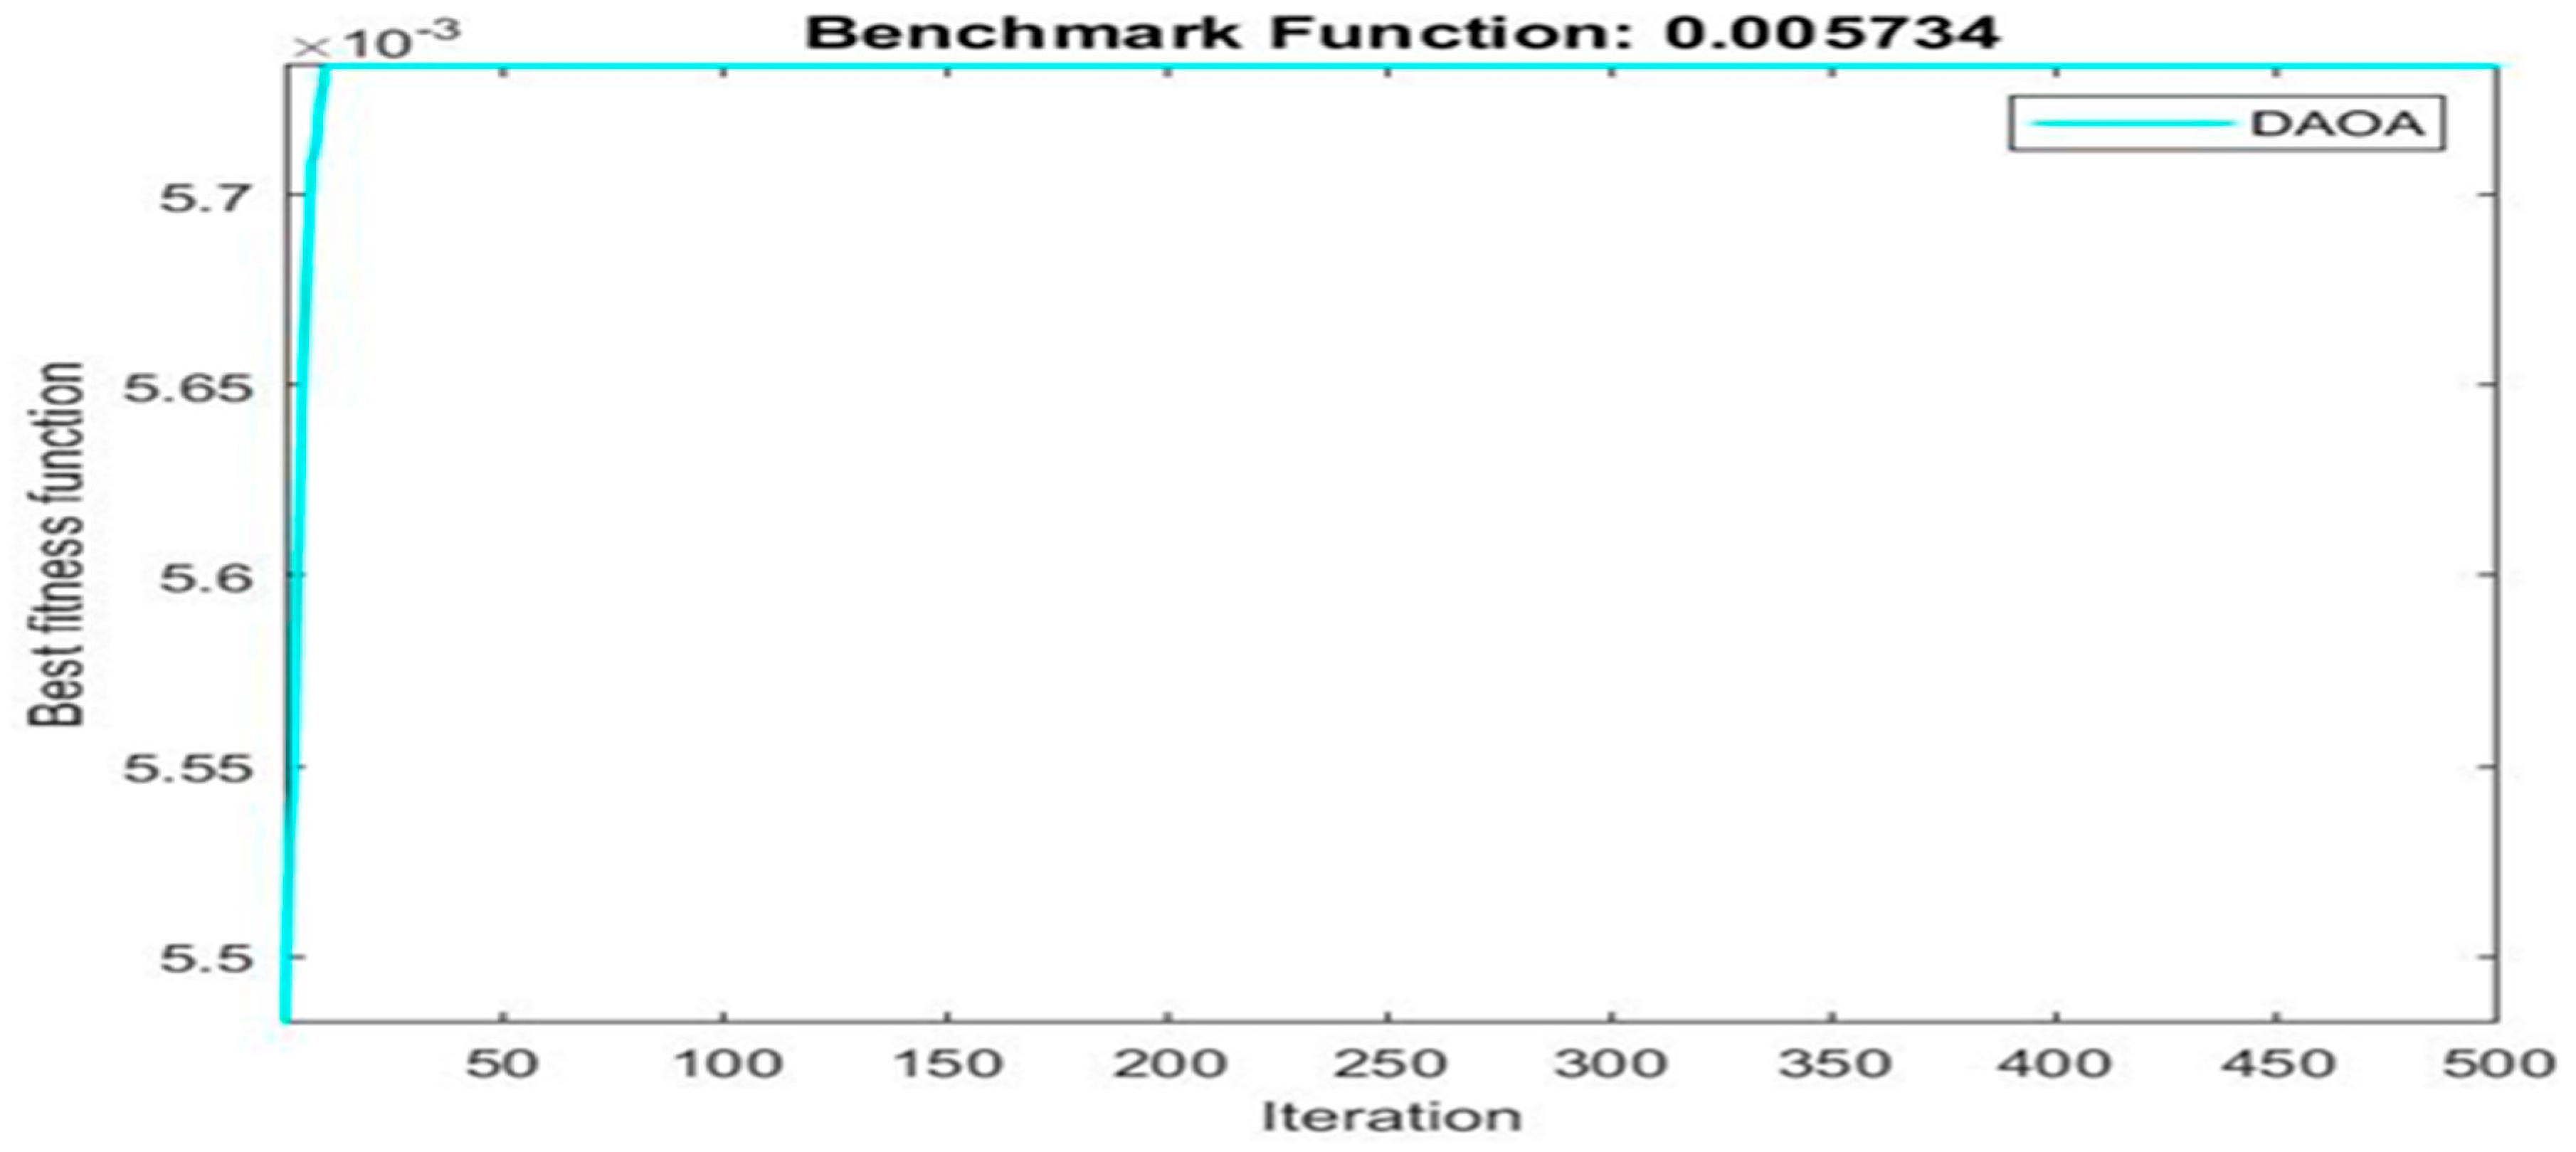
| 0.005734 | 1 | 12 | 8 | |
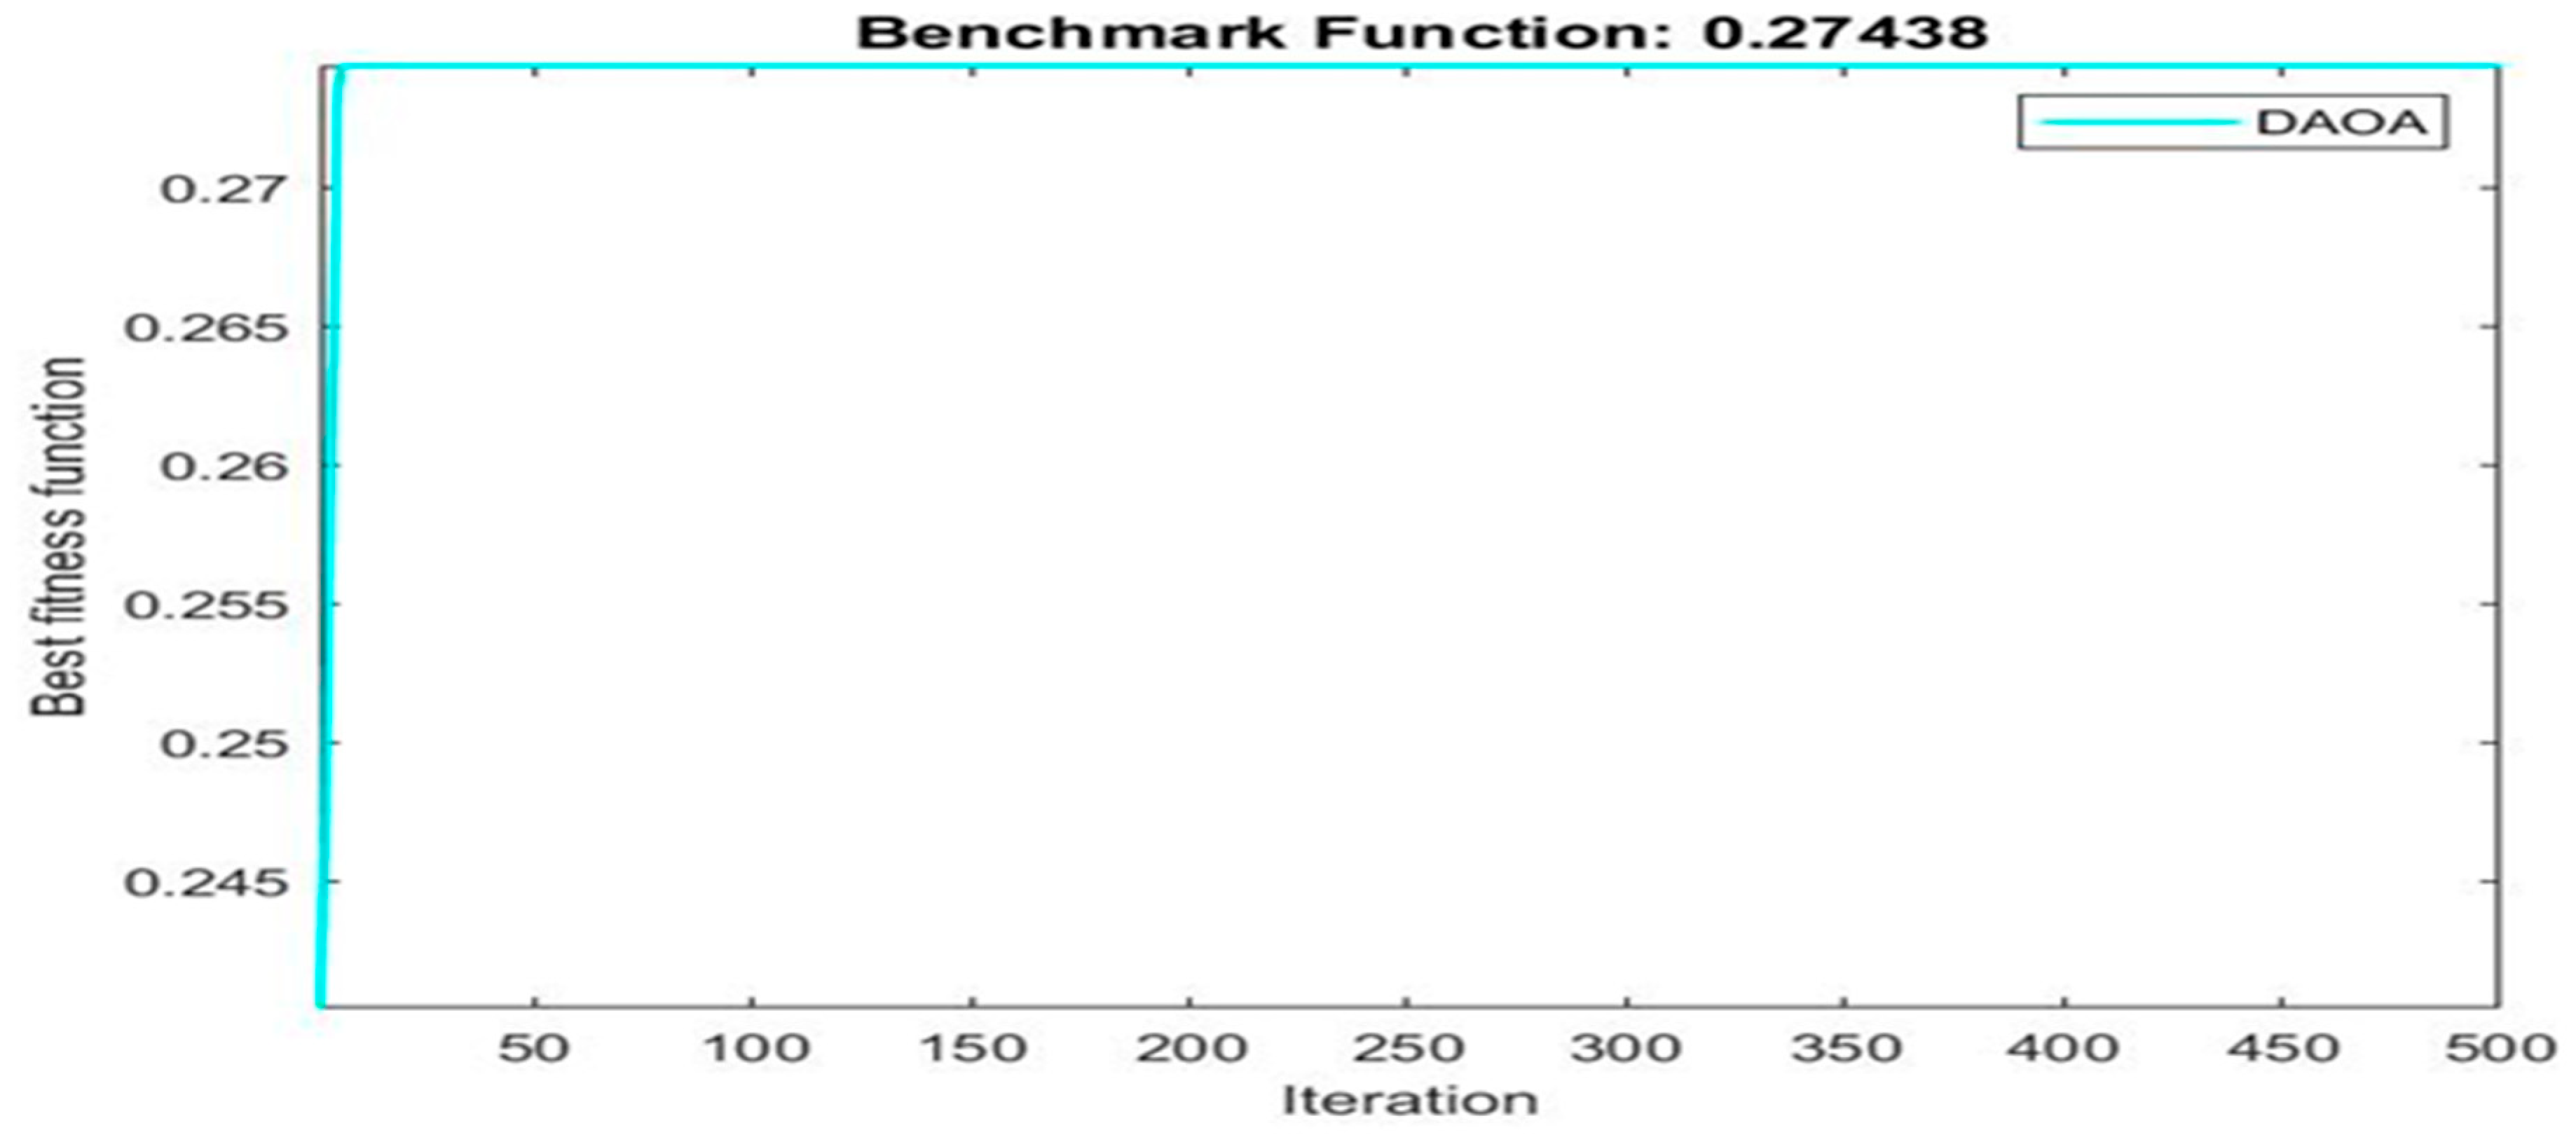
| 0.27438 | 1 | 12 | 8 | |
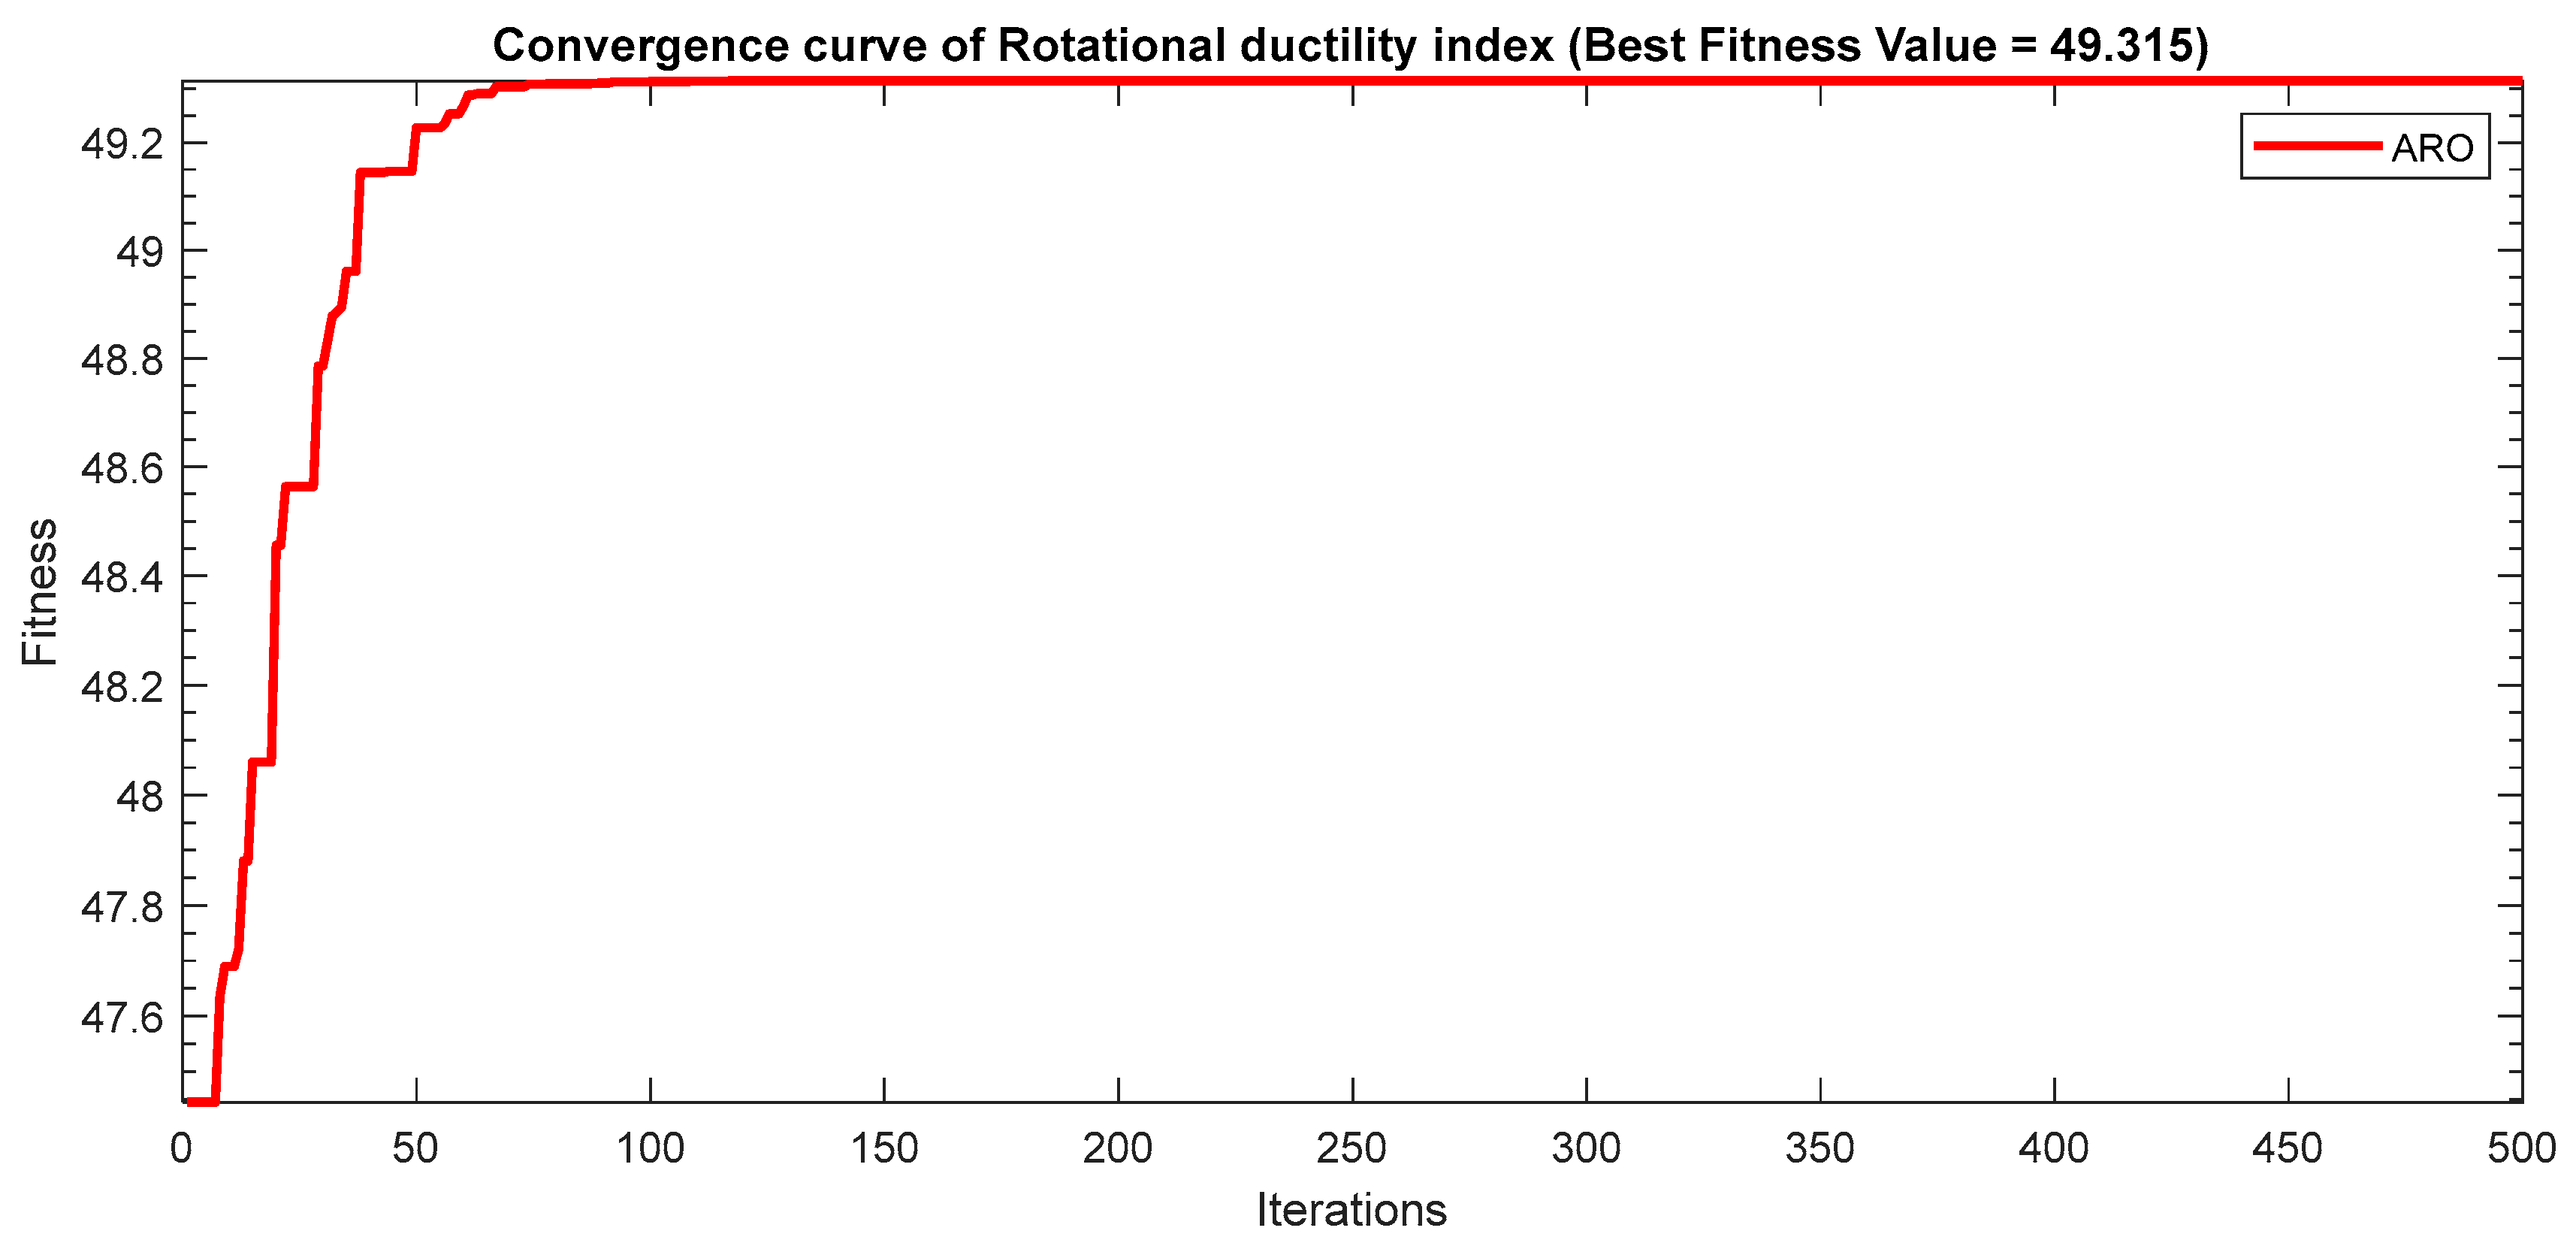
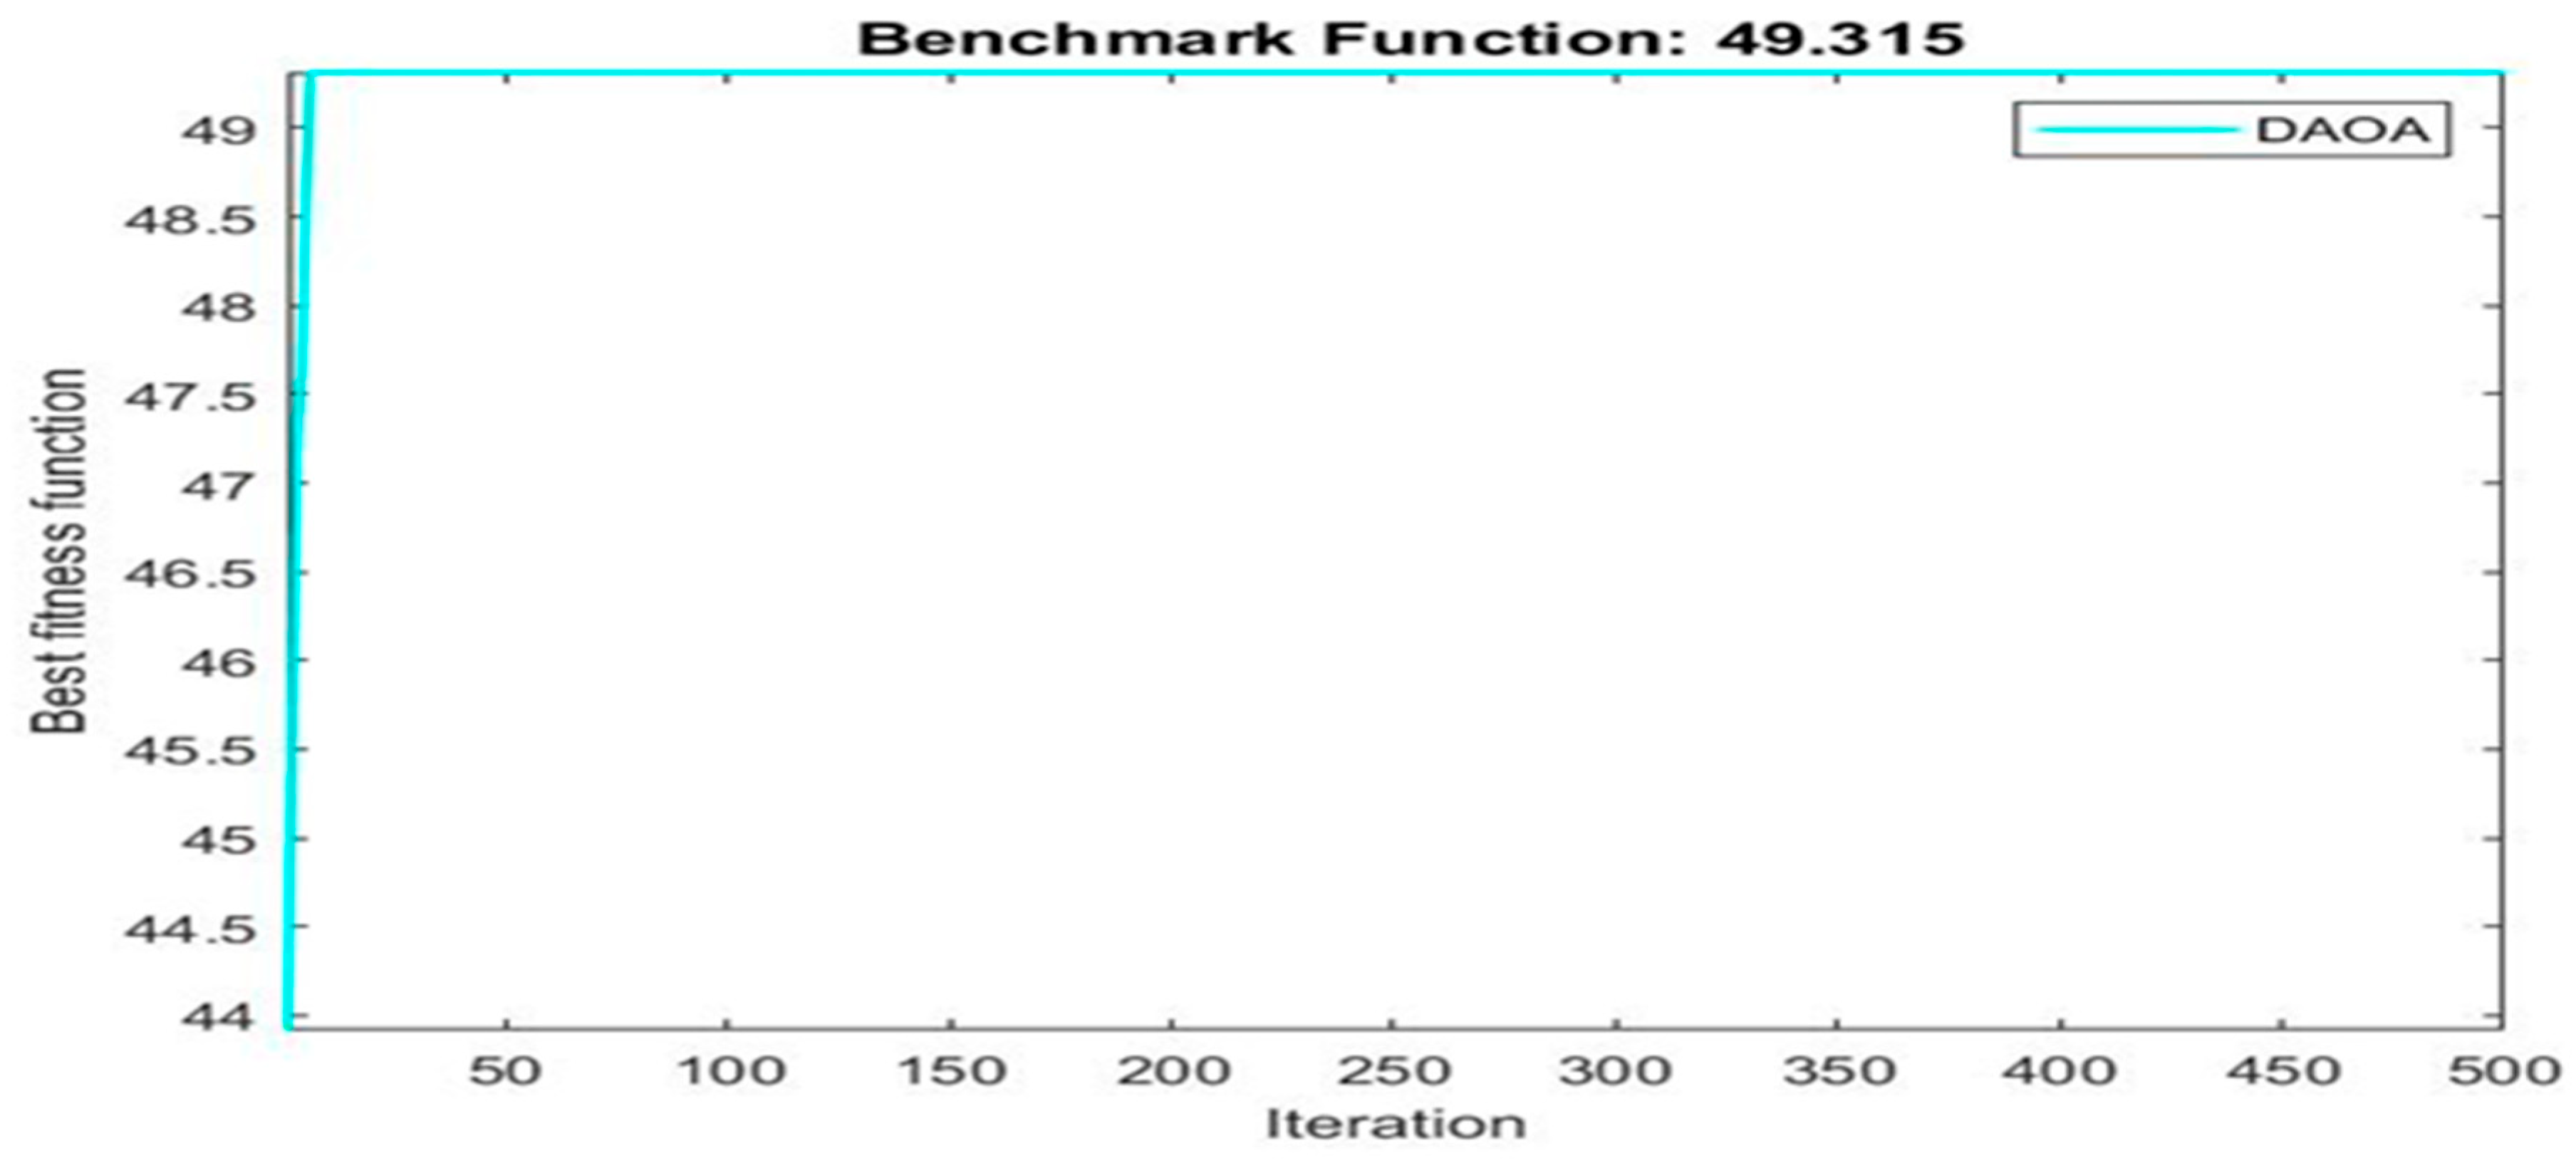
| 49.315 | 1 | 12 | 8 | |
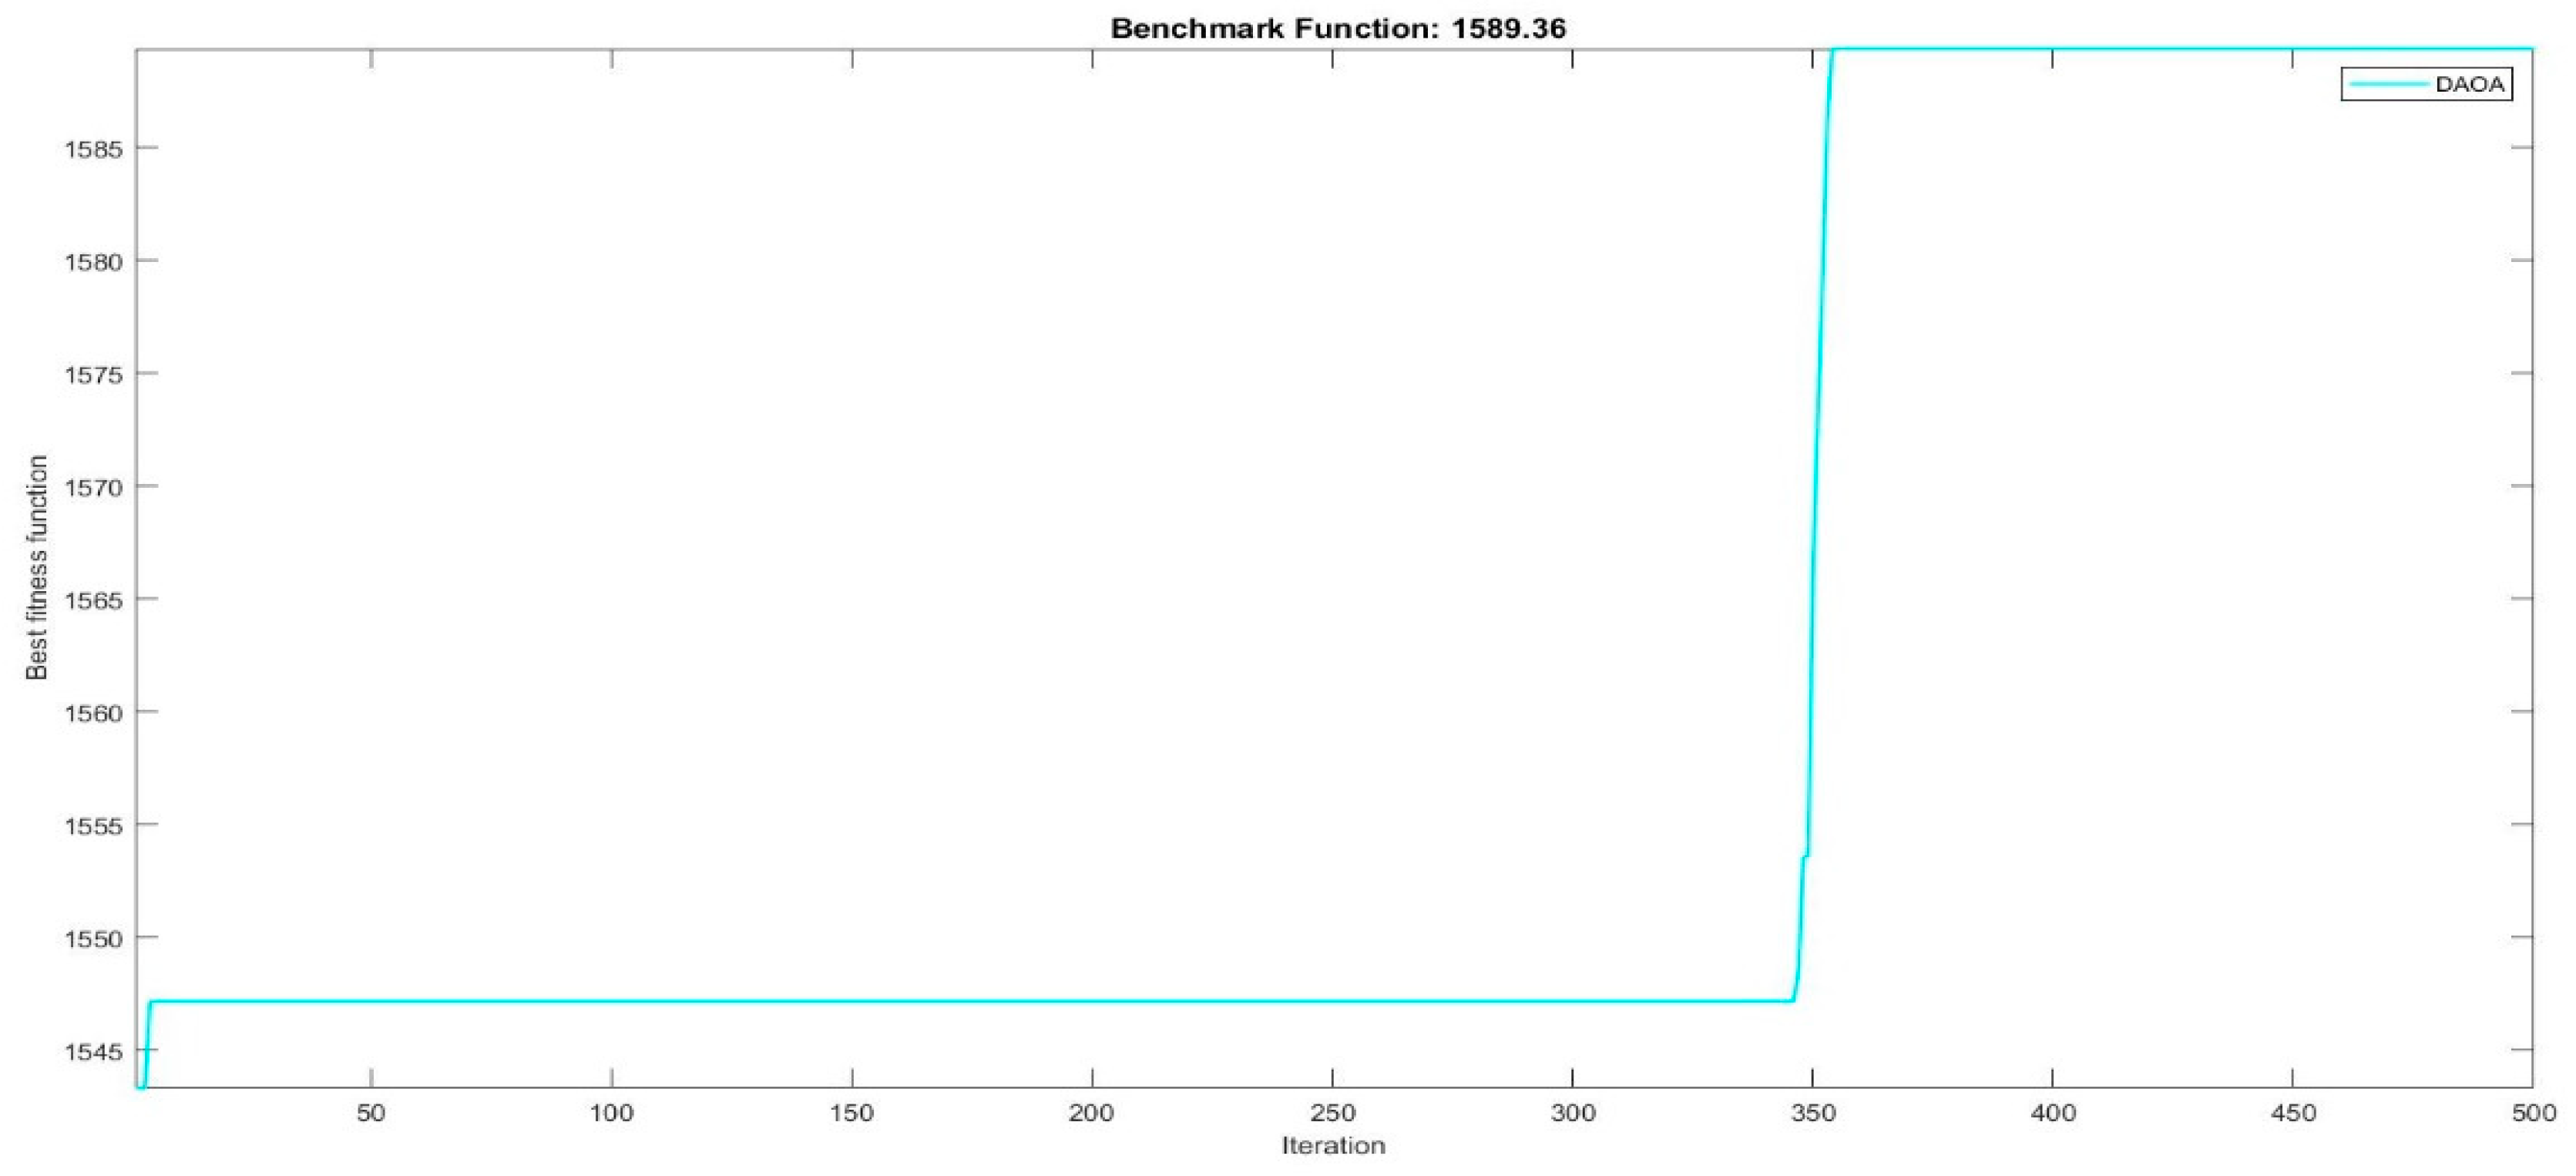
| DAOA | 1589.36 | 12 | 12 | 6 |
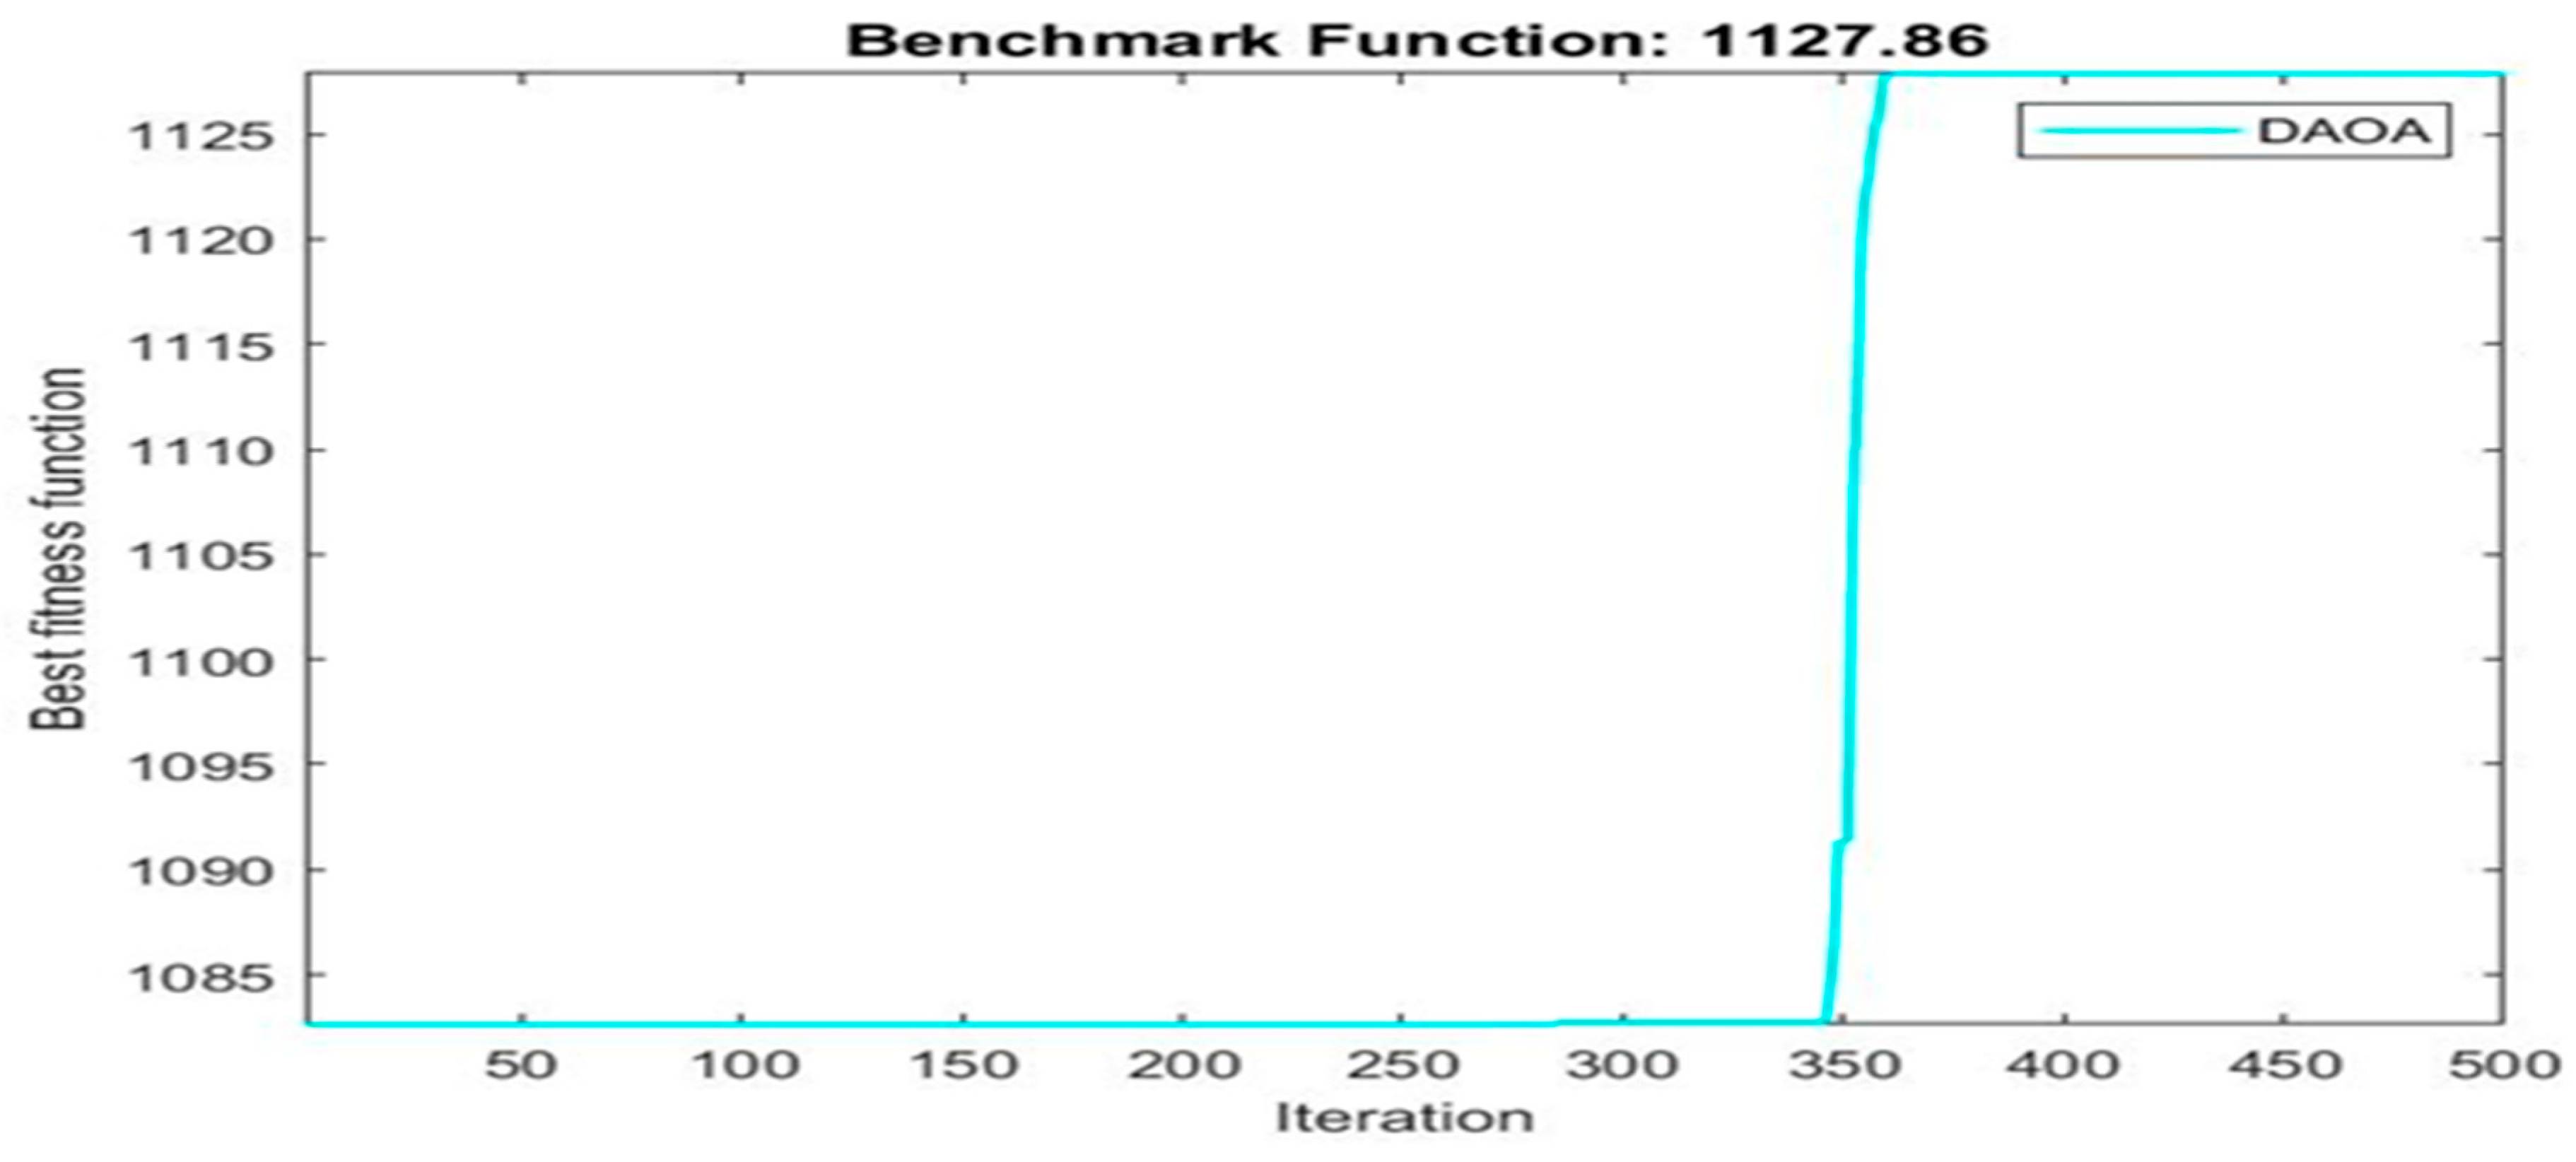
| 1127.86 | 12 | 6 | 6 | |
| 160.68 | 12 | 6 | 6 | |
| 5.8814 | 12 | 12 | 6 | |
| 9.3548 | 12 | 12 | 8 | |
| 1.0404 | 12 | 6 | 6 | |
| 0.005734 | 1 | 12 | 8 | |
| 0.27438 | 1 | 12 | 8 | |
| 49.315 | 1 | 12 | 8 |
Disclaimer/Publisher’s Note: The statements, opinions and data contained in all publications are solely those of the individual author(s) and contributor(s) and not of MDPI and/or the editor(s). MDPI and/or the editor(s) disclaim responsibility for any injury to people or property resulting from any ideas, methods, instructions or products referred to in the content. |
© 2023 by the authors. Licensee MDPI, Basel, Switzerland. This article is an open access article distributed under the terms and conditions of the Creative Commons Attribution (CC BY) license (https://creativecommons.org/licenses/by/4.0/).
Share and Cite
Behera, G.C.; Bagal, D.K.; Muduli, P.K.; Maghrabi, L.A.; Mohanta, H.C. Parametric Optimization of Torsional Parameters of Ferrocement “U” Wrapped Beams Using Recent Meta-Heuristic Optimization Algorithms. Materials 2023, 16, 6727. https://doi.org/10.3390/ma16206727
Behera GC, Bagal DK, Muduli PK, Maghrabi LA, Mohanta HC. Parametric Optimization of Torsional Parameters of Ferrocement “U” Wrapped Beams Using Recent Meta-Heuristic Optimization Algorithms. Materials. 2023; 16(20):6727. https://doi.org/10.3390/ma16206727
Chicago/Turabian StyleBehera, Gopal Charan, Dilip Kumar Bagal, Praddyut Kumar Muduli, Louai A. Maghrabi, and Harish Chandra Mohanta. 2023. "Parametric Optimization of Torsional Parameters of Ferrocement “U” Wrapped Beams Using Recent Meta-Heuristic Optimization Algorithms" Materials 16, no. 20: 6727. https://doi.org/10.3390/ma16206727
APA StyleBehera, G. C., Bagal, D. K., Muduli, P. K., Maghrabi, L. A., & Mohanta, H. C. (2023). Parametric Optimization of Torsional Parameters of Ferrocement “U” Wrapped Beams Using Recent Meta-Heuristic Optimization Algorithms. Materials, 16(20), 6727. https://doi.org/10.3390/ma16206727