
An Analytical Method for Mechanical Analysis of Offshore Pipelines during Lifting Operation


Abstract
:1. Introduction
2. Theoretical Model
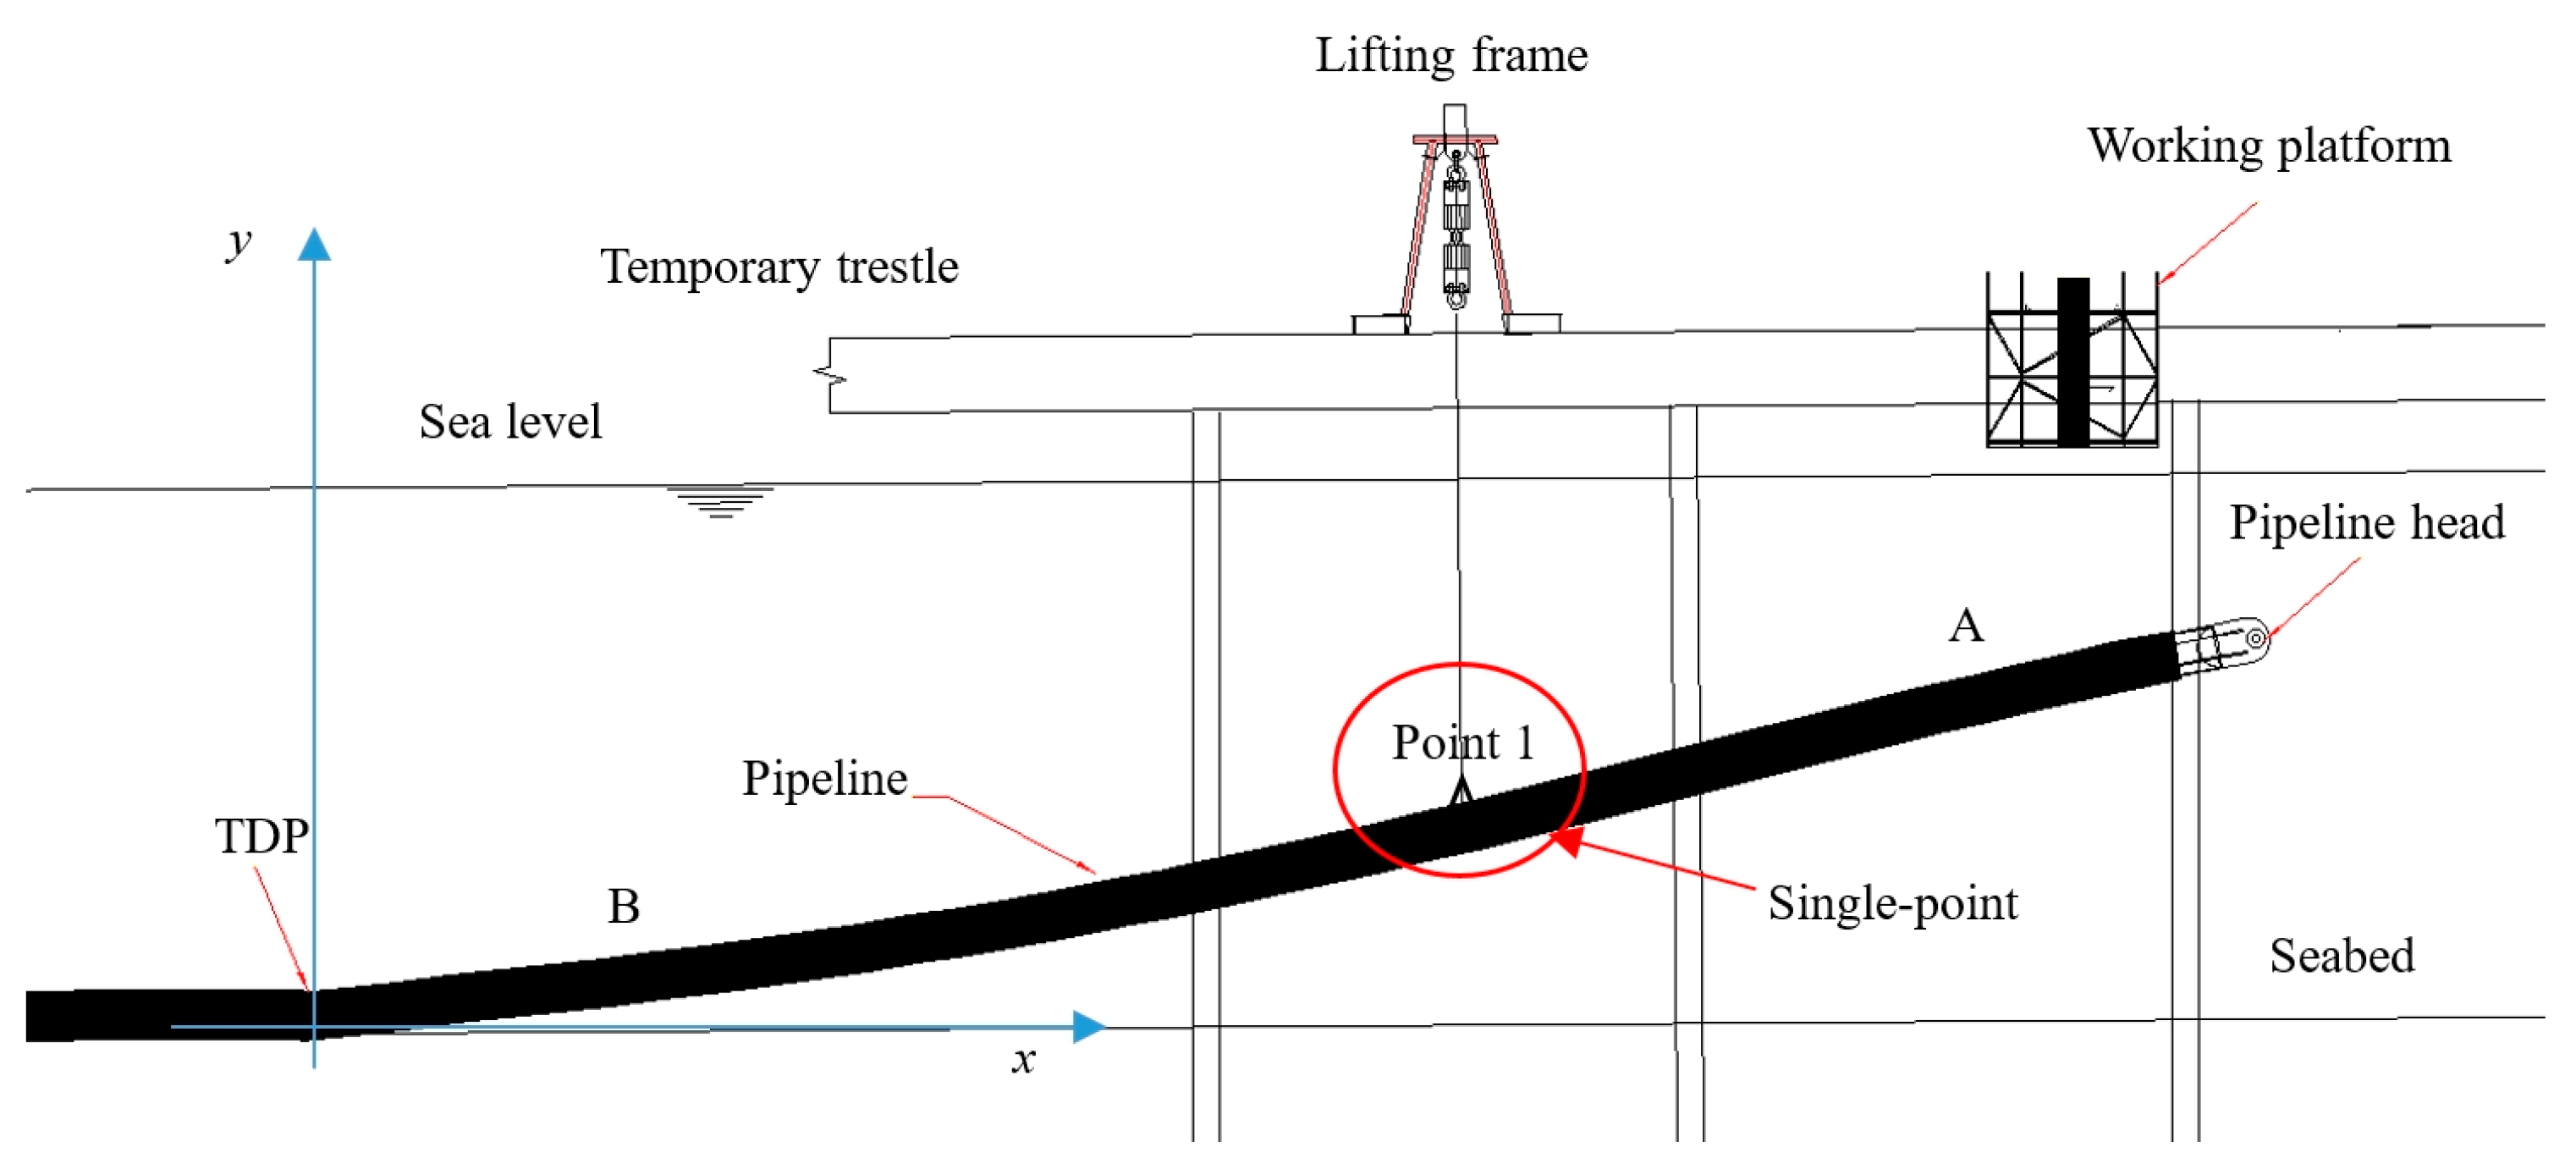
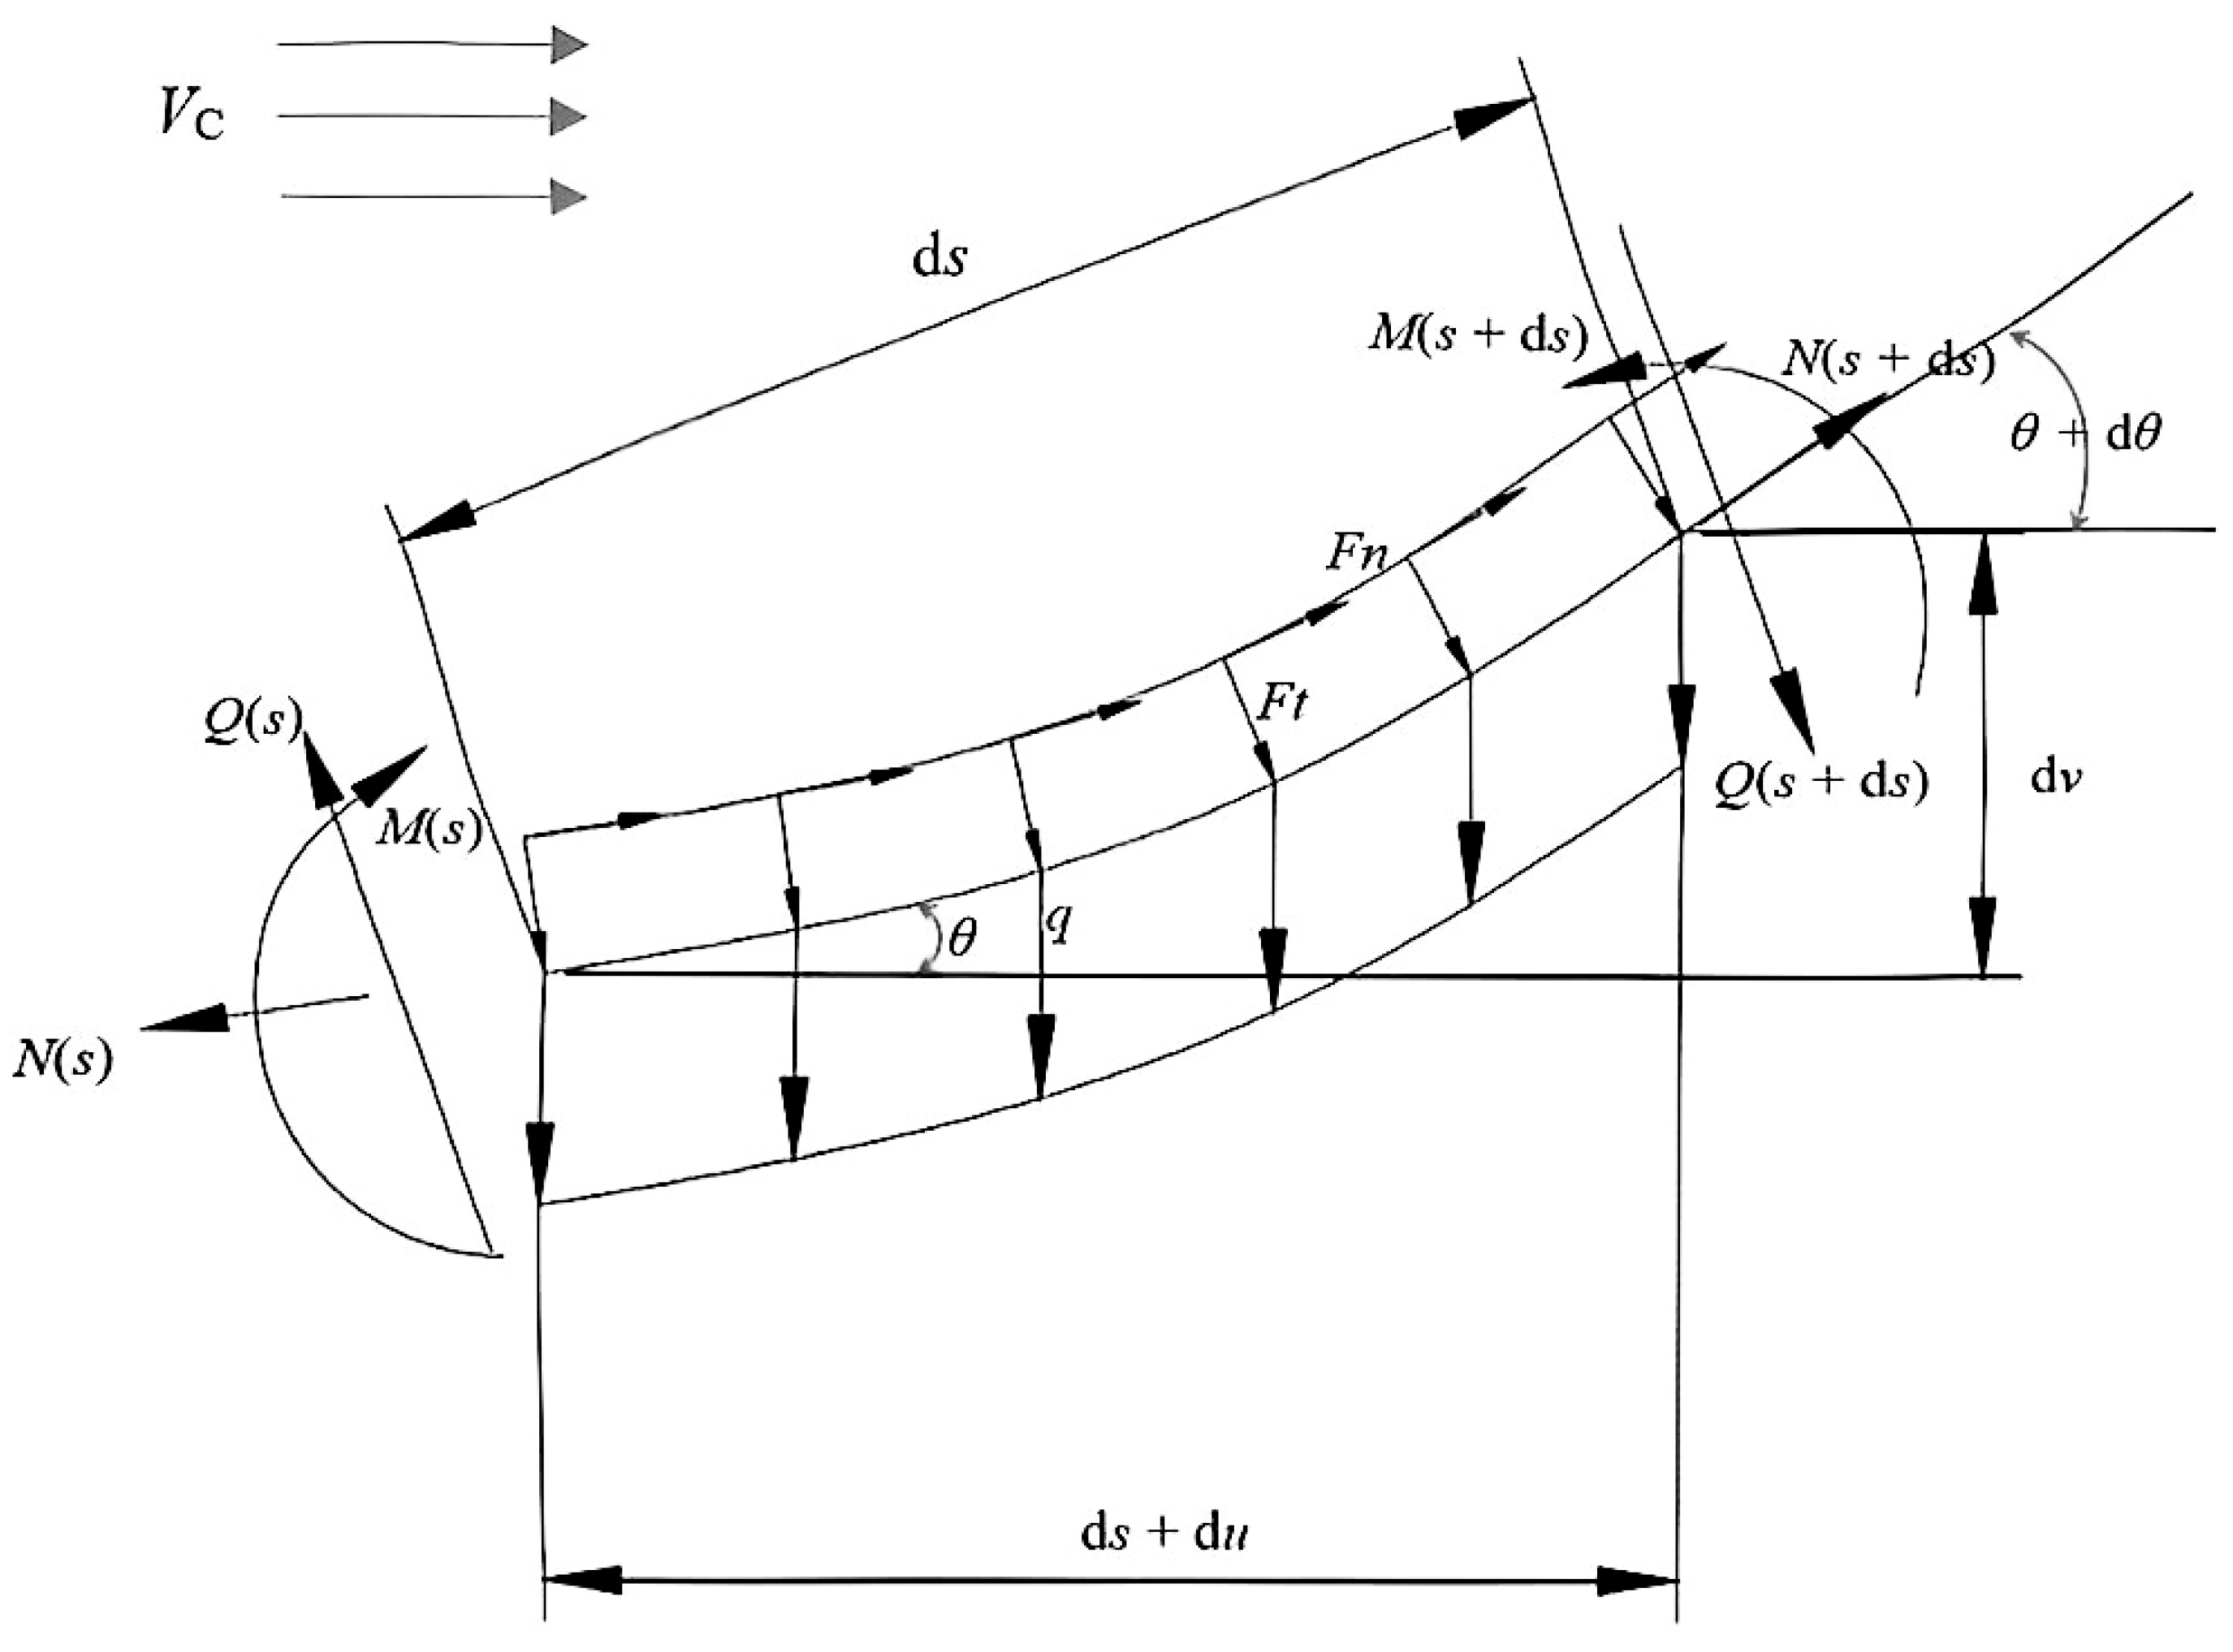
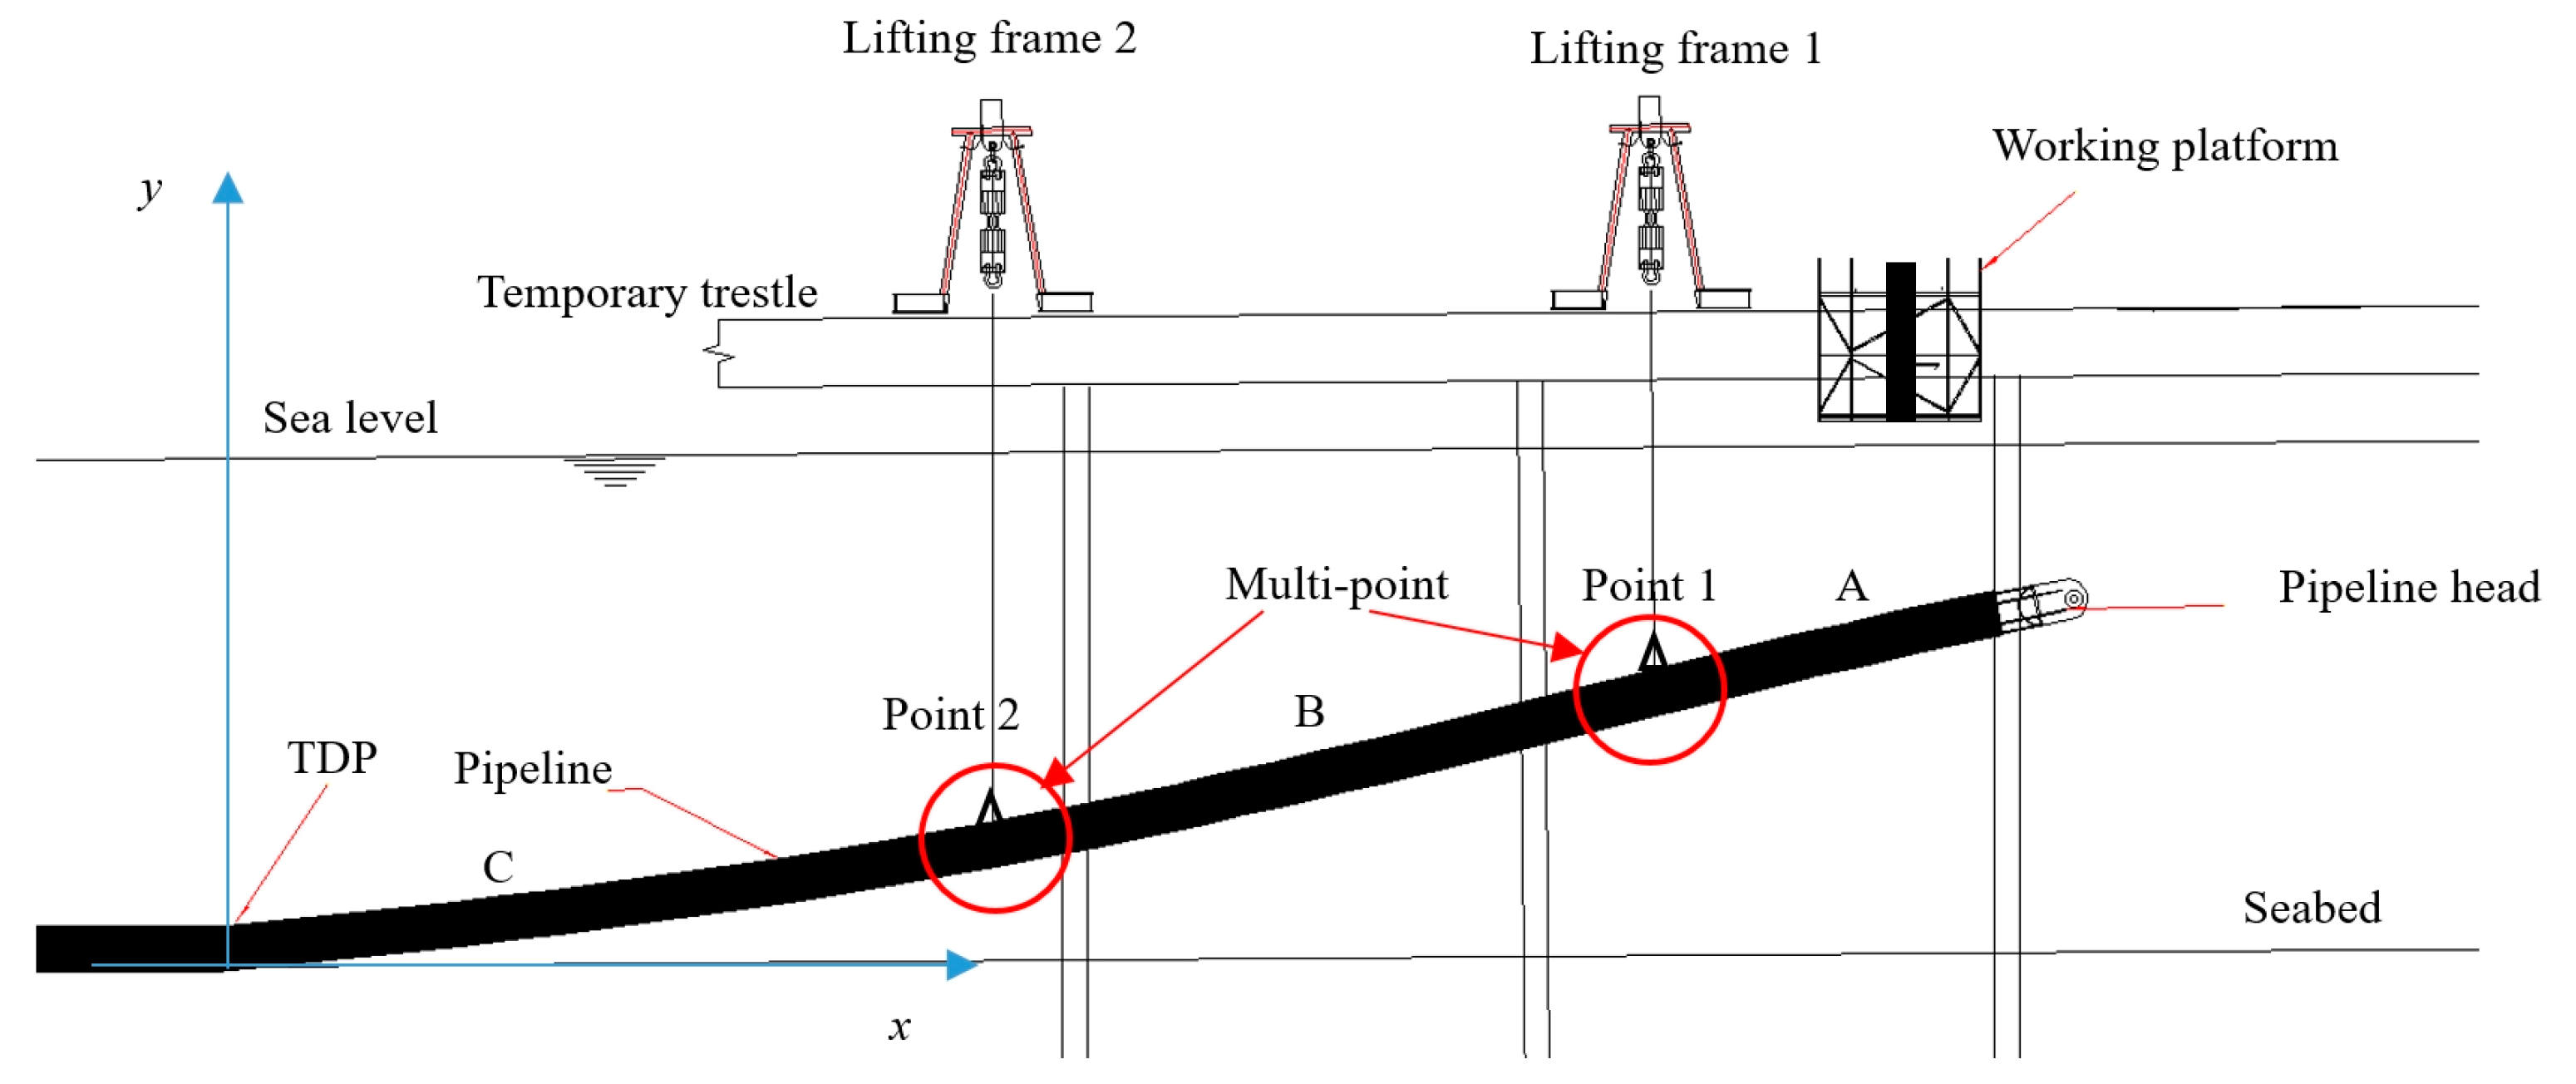
2.1. Model of Suspended Section of Pipeline
2.2. Environmental Loadings
2.3. Configuration Calculation
2.4. Check for Mechanical Properties and Engineering Parameters
2.4.1. Von Mises Stress
2.4.2. Load-Controlled Condition (LCC)
3. Model Validation and Parameter Analysis
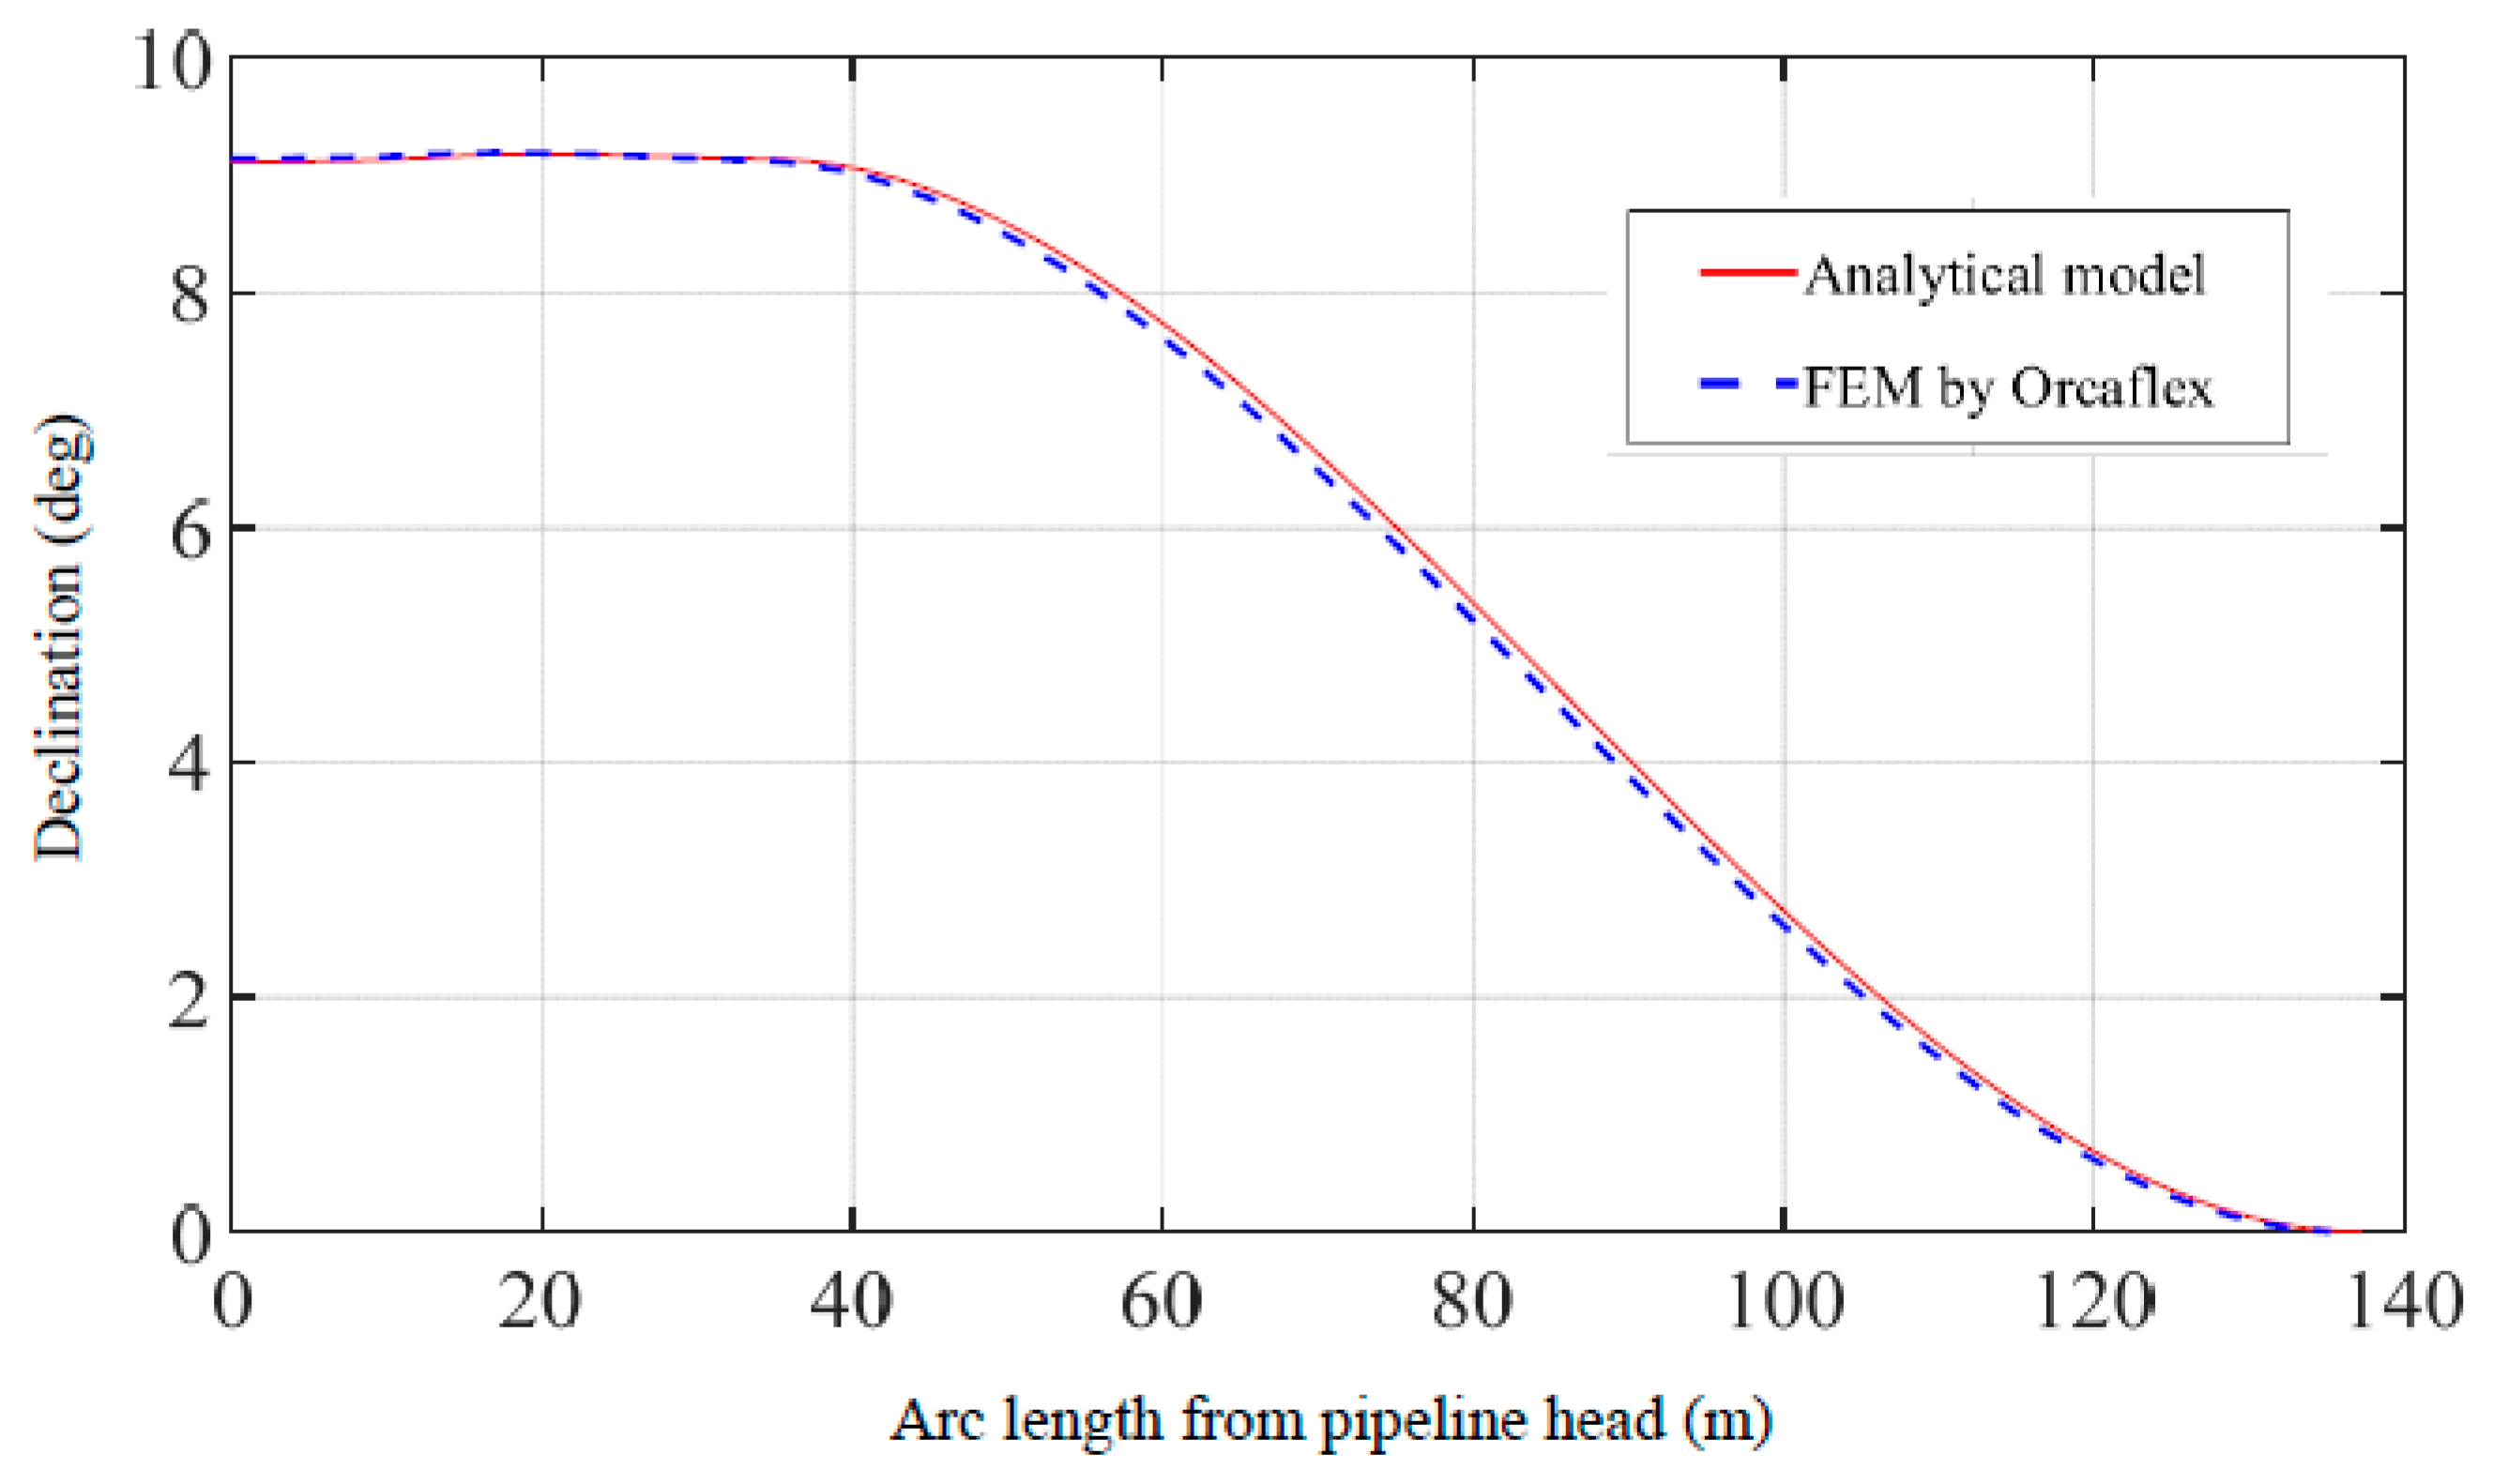
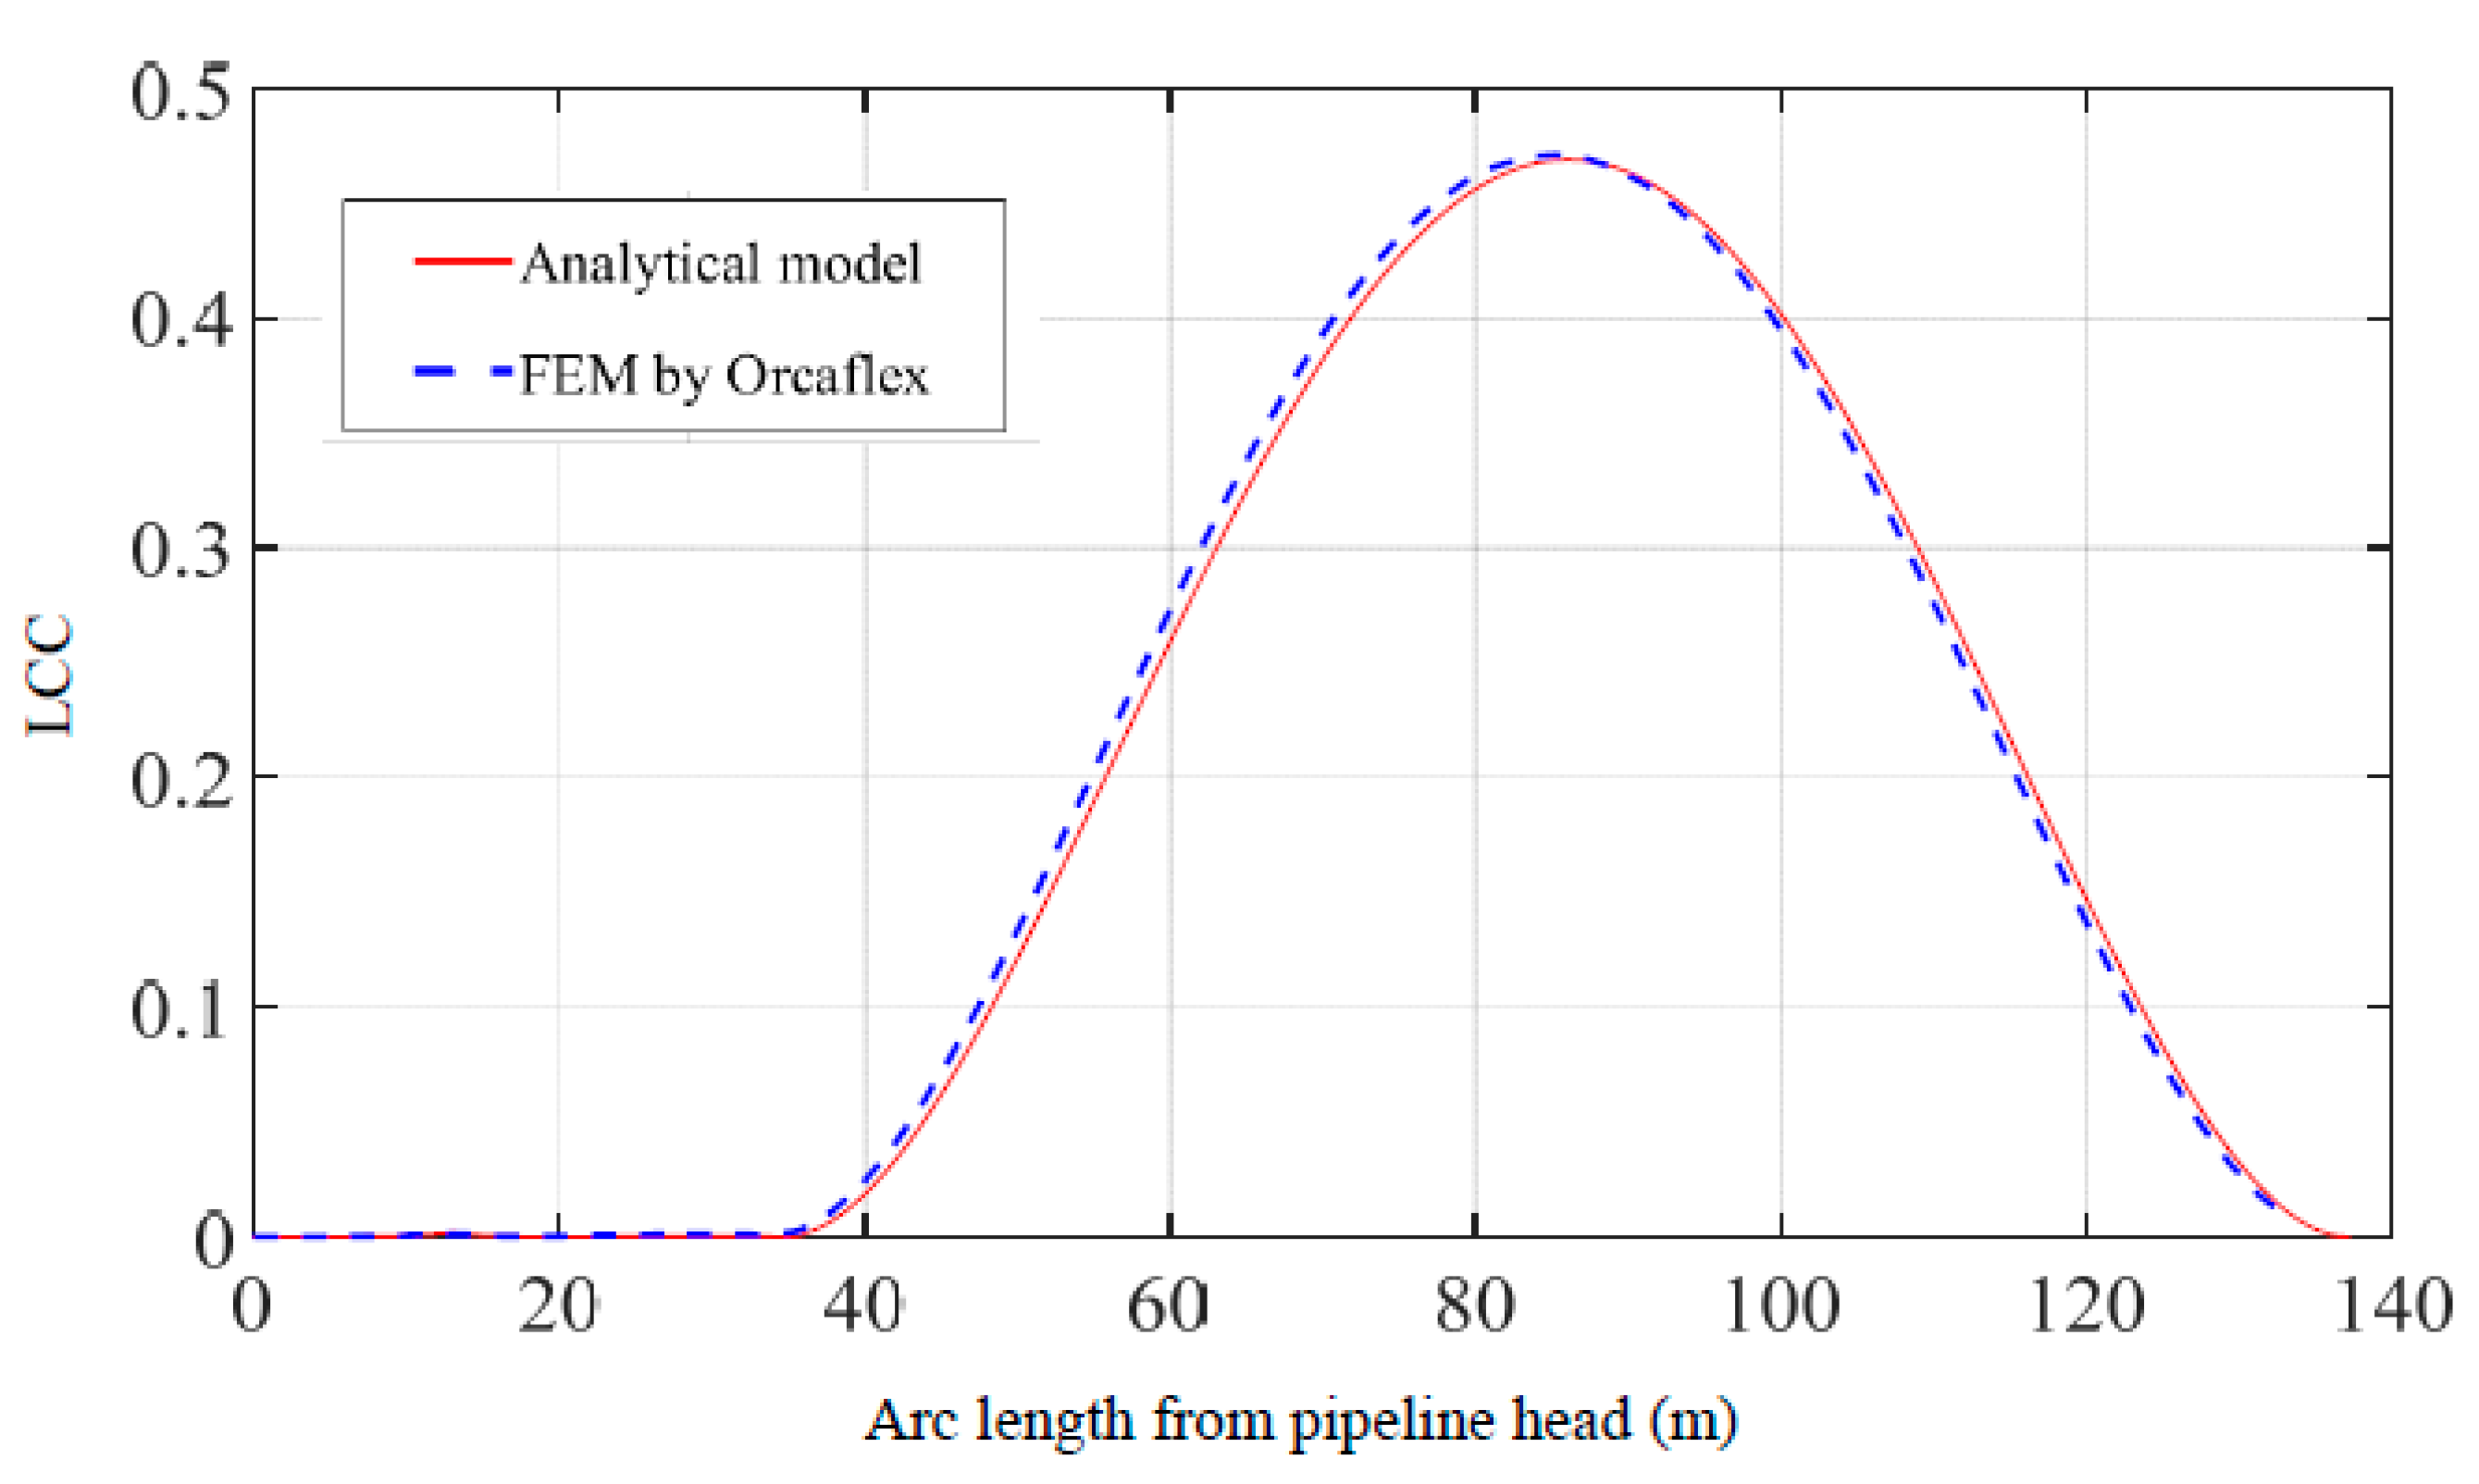
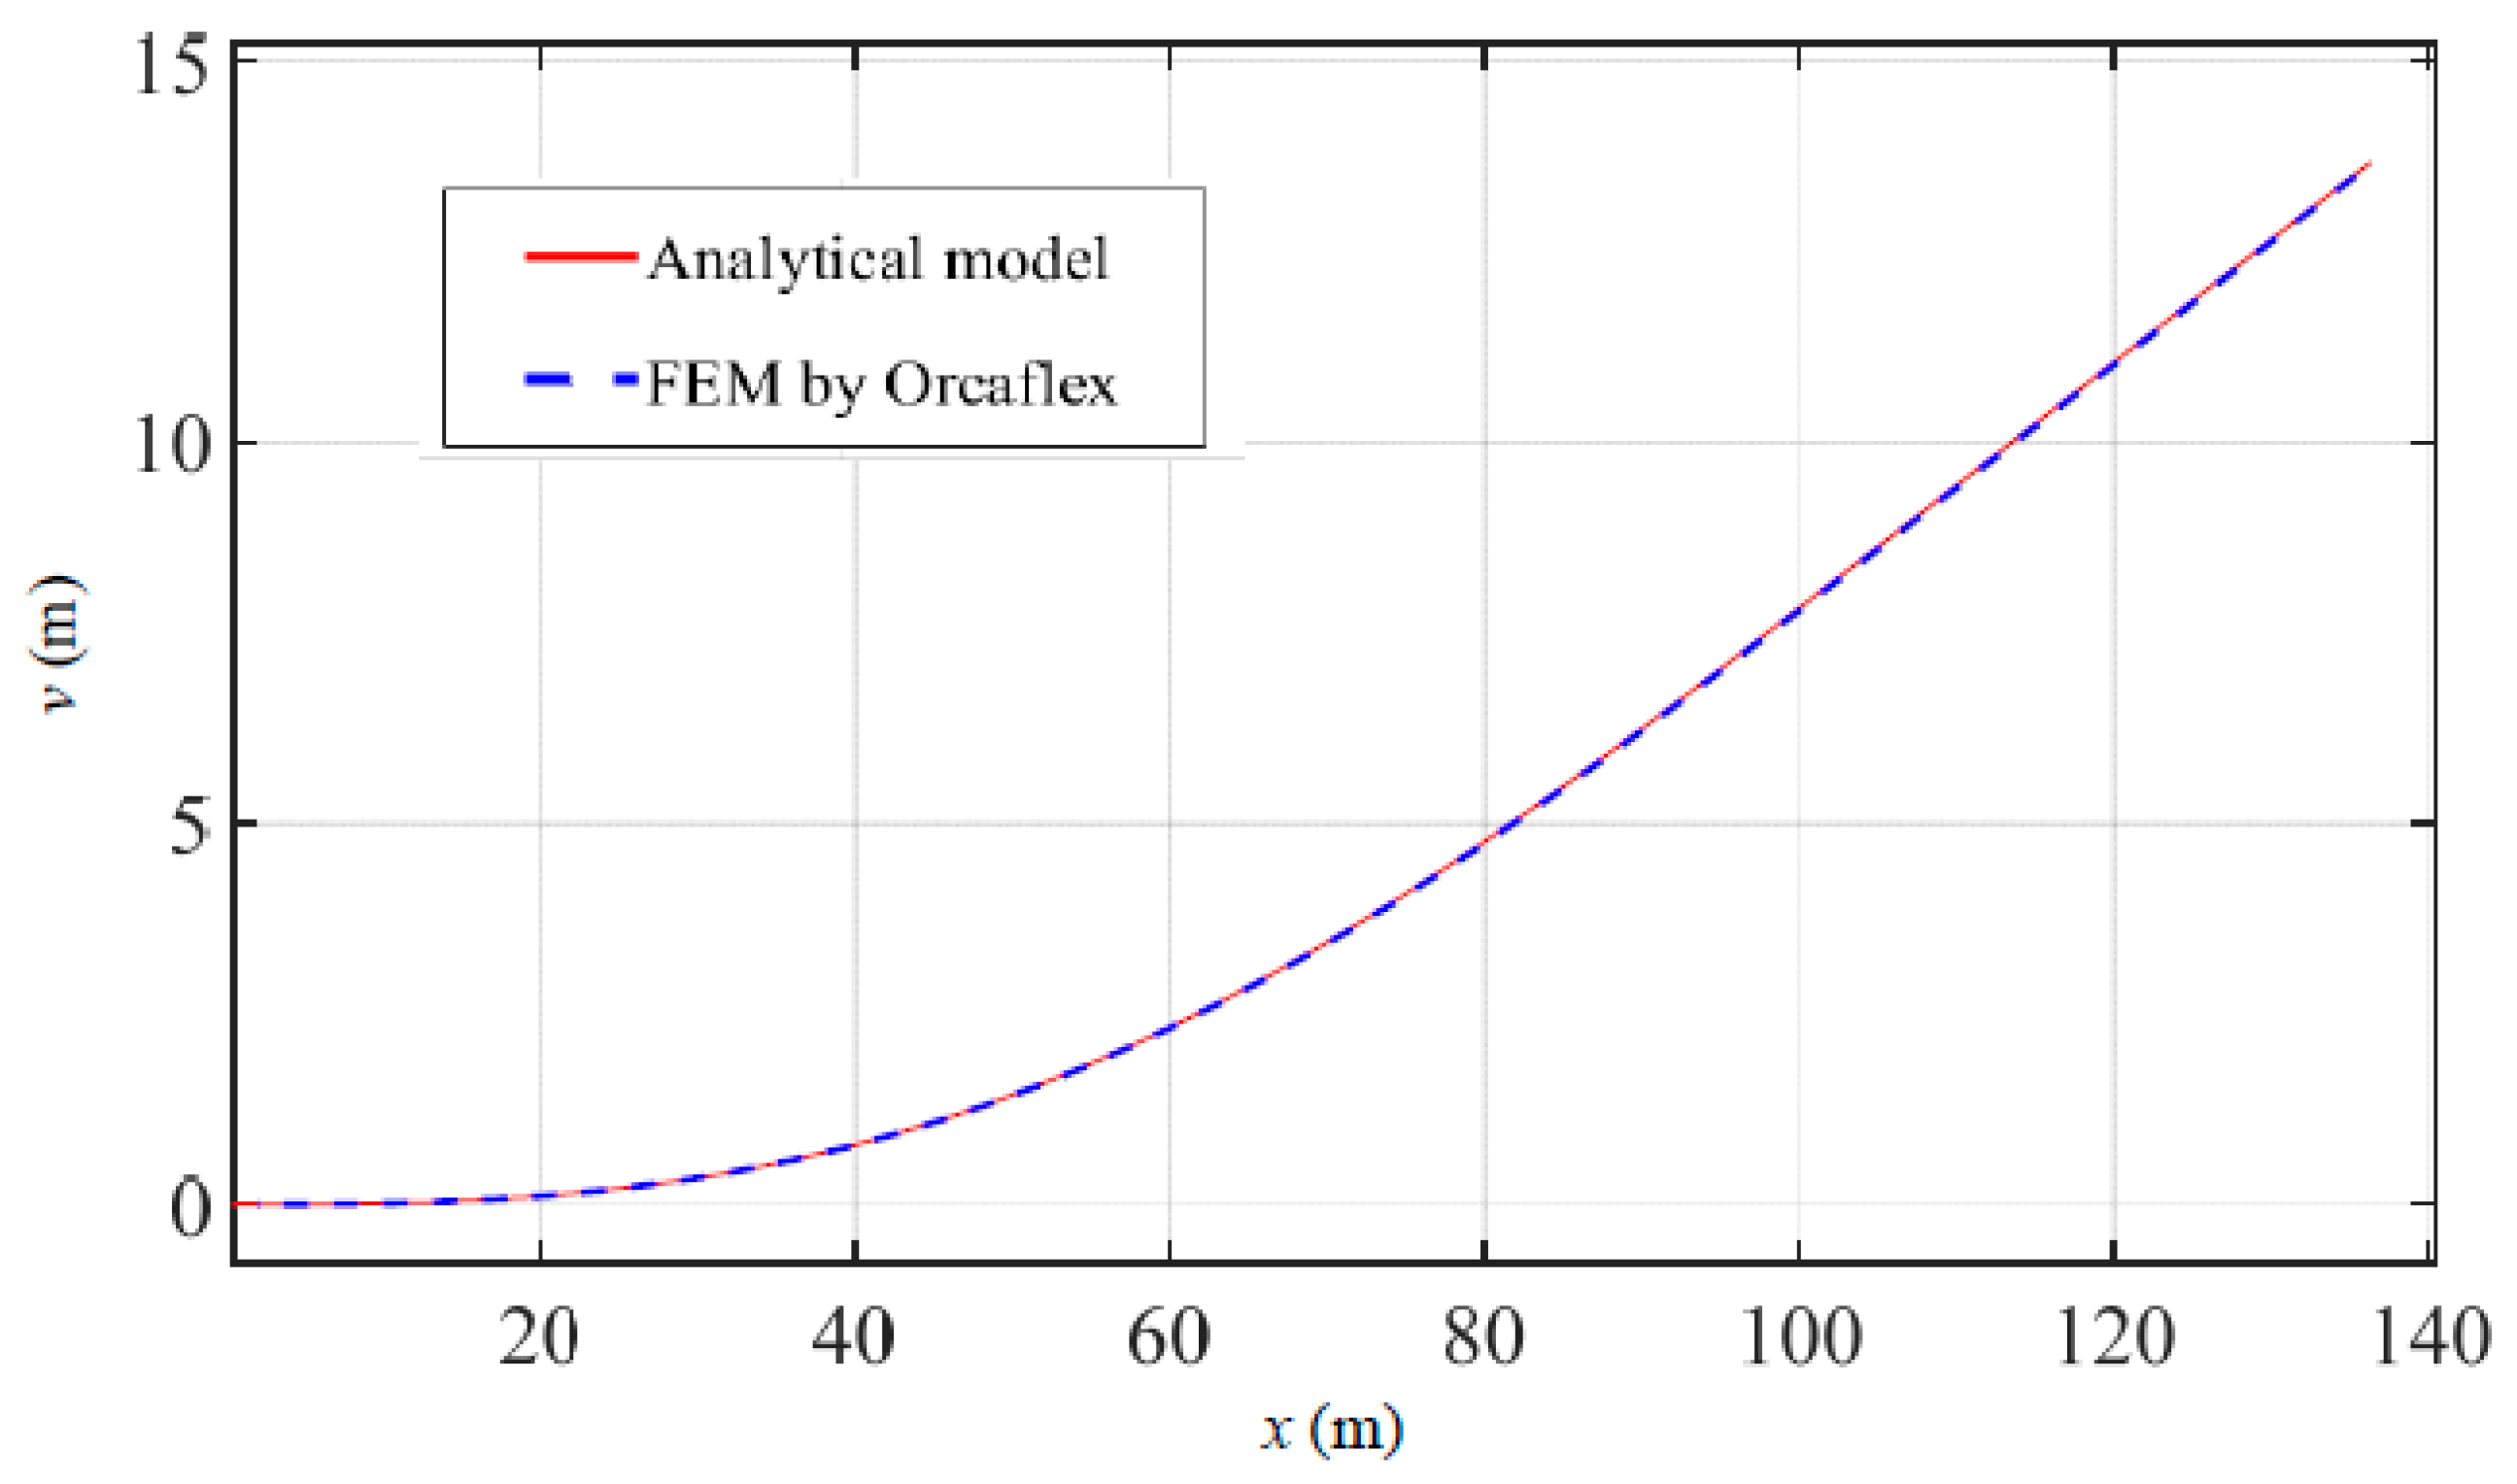
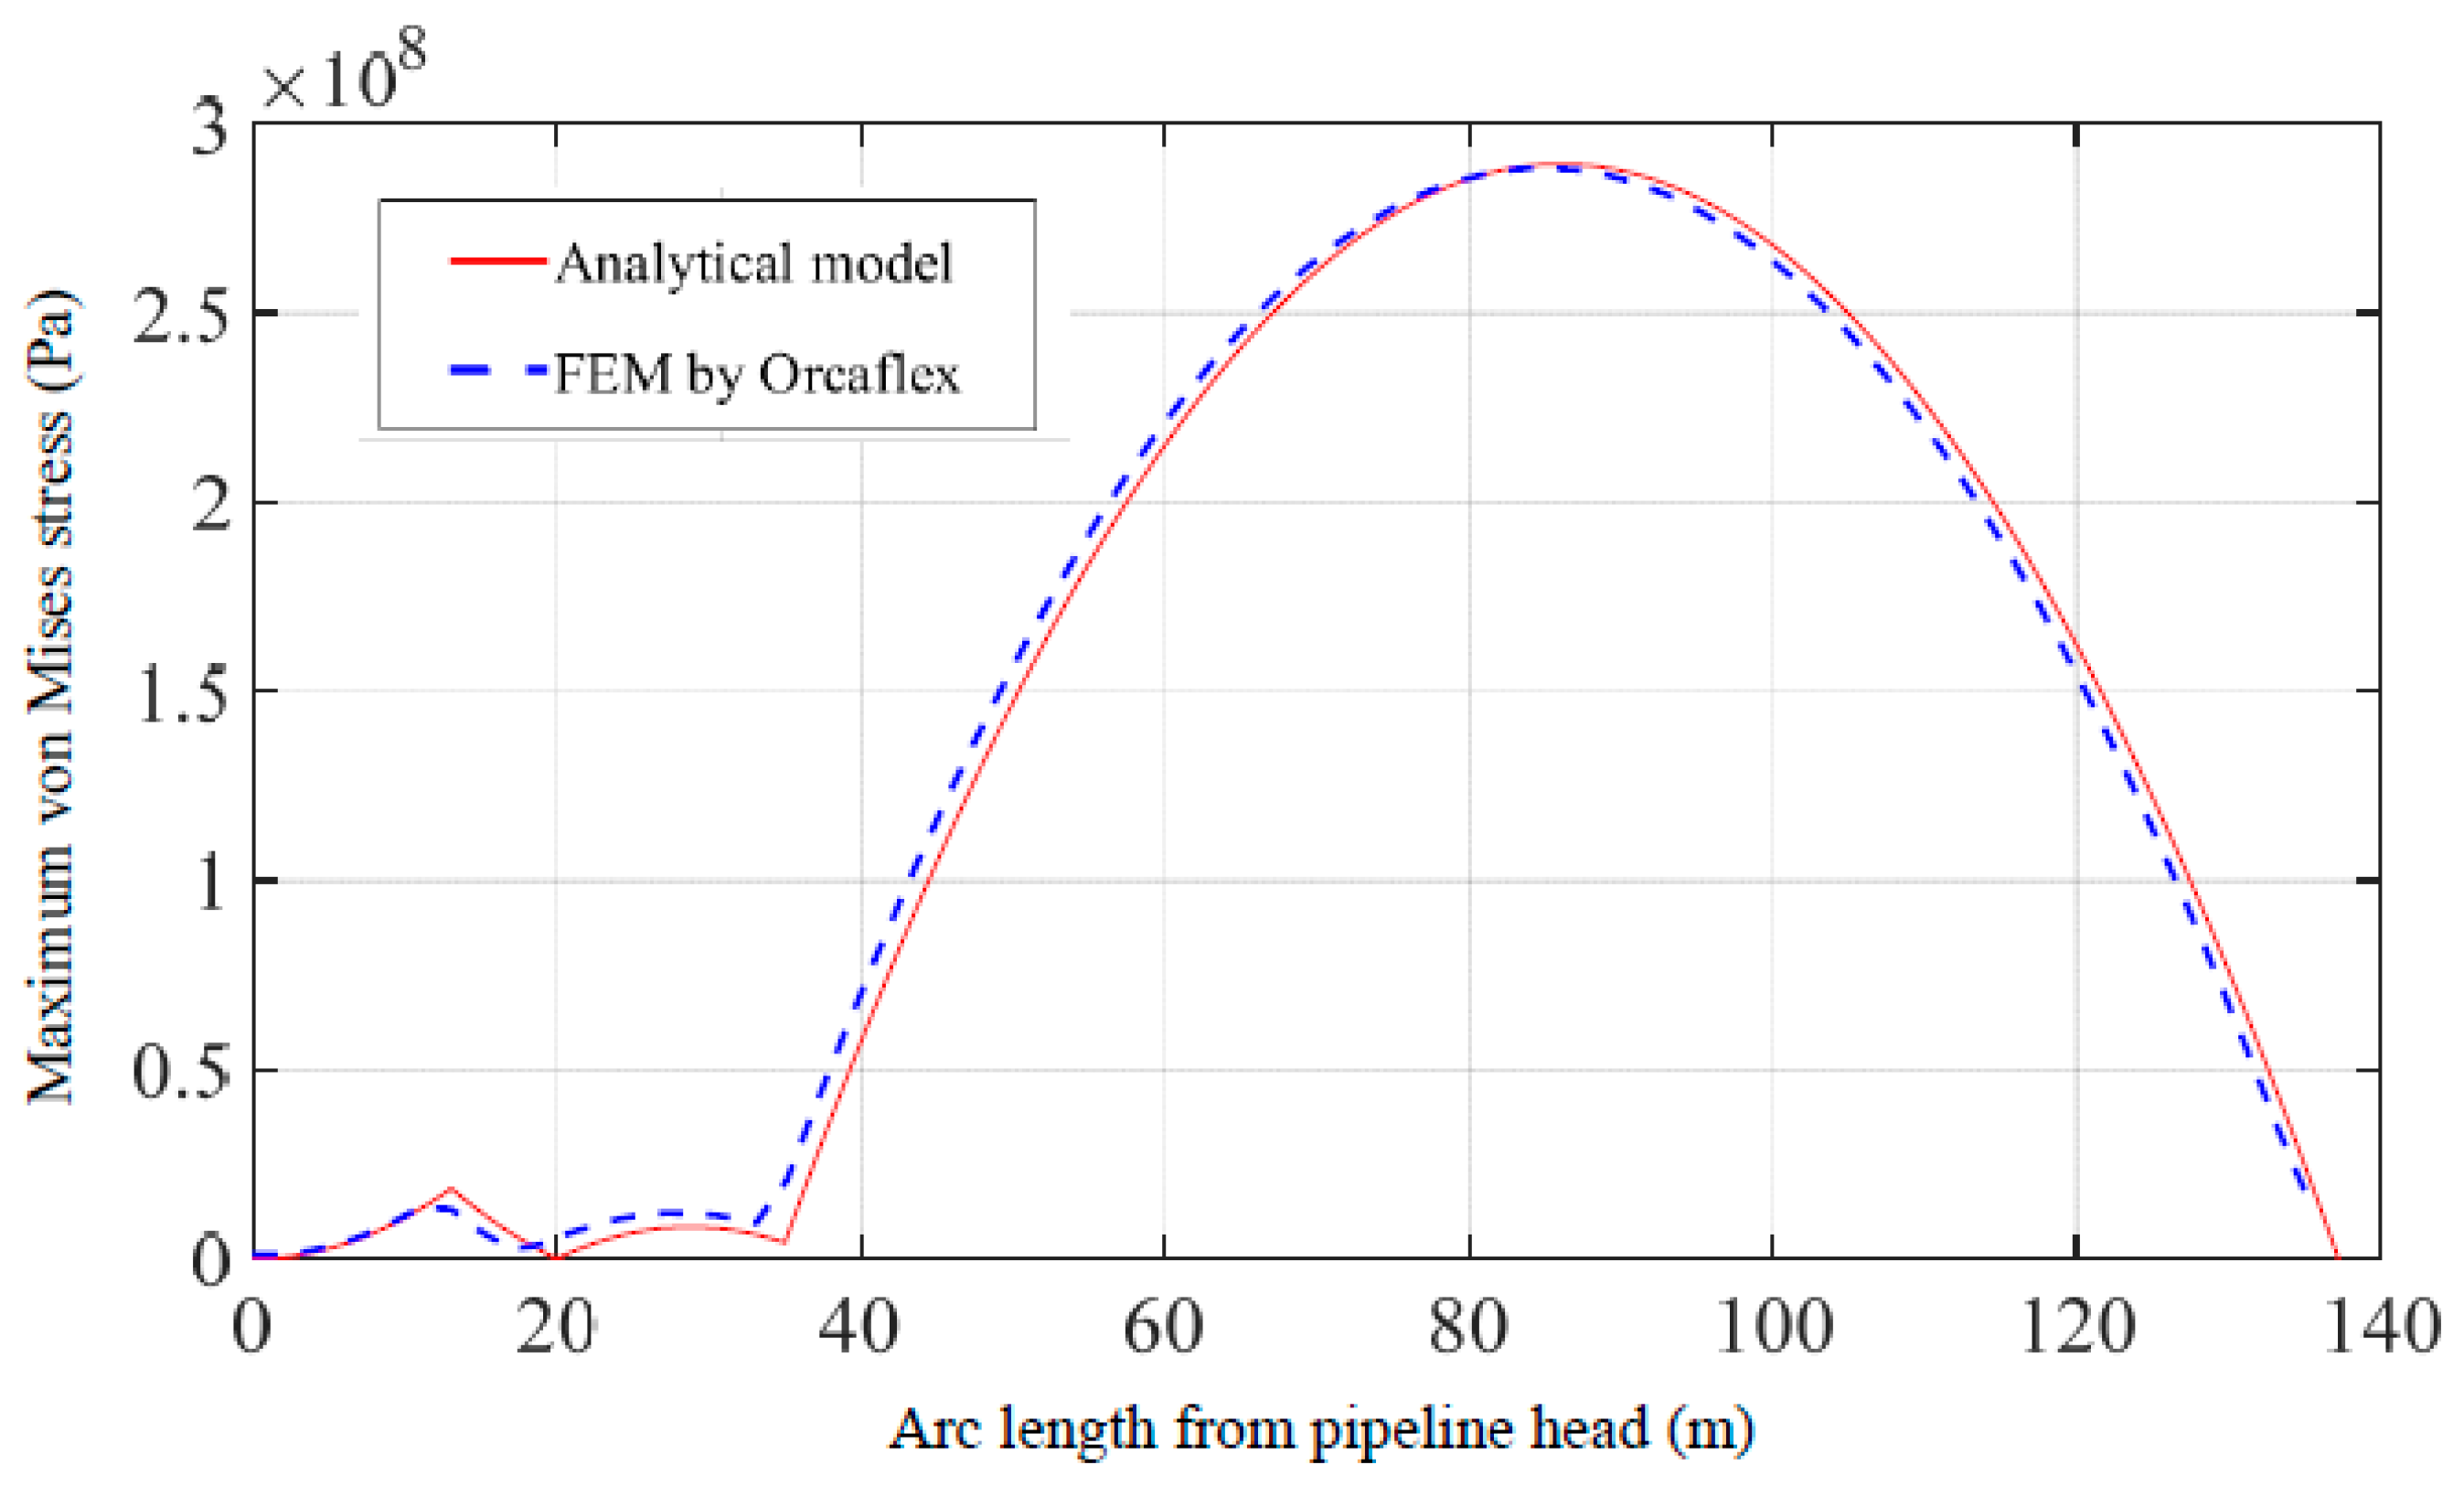
3.1. Model Validation
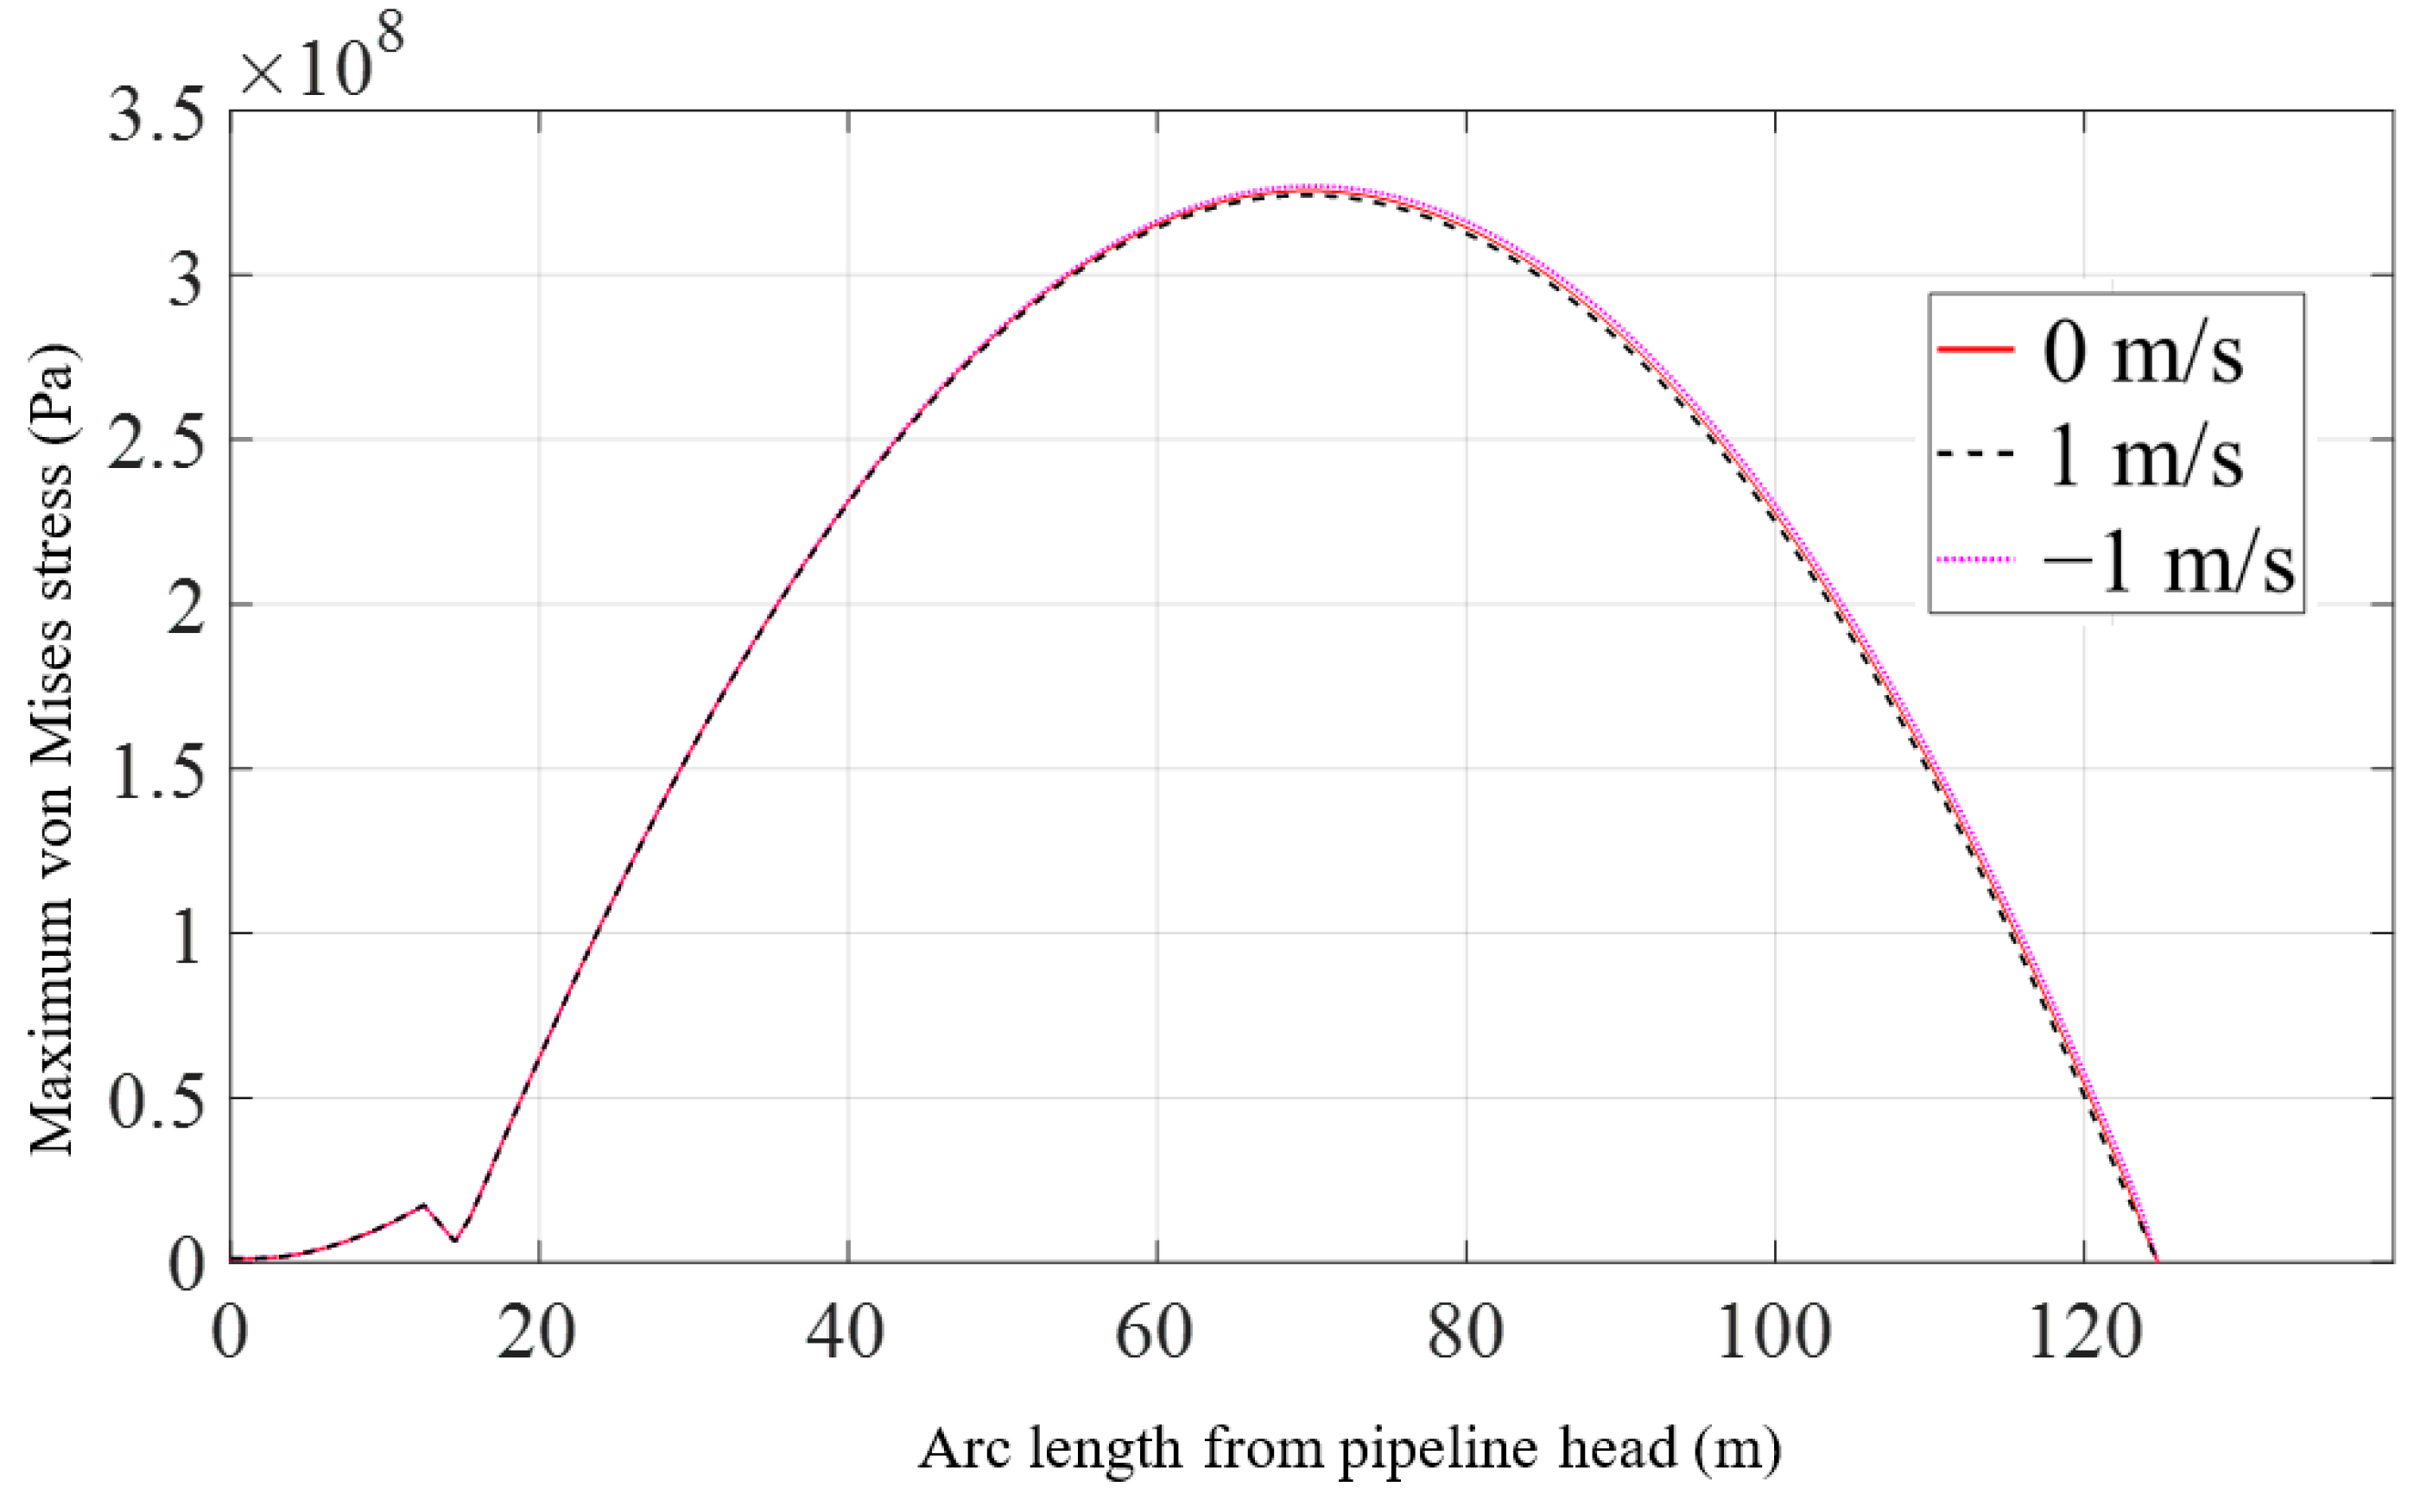
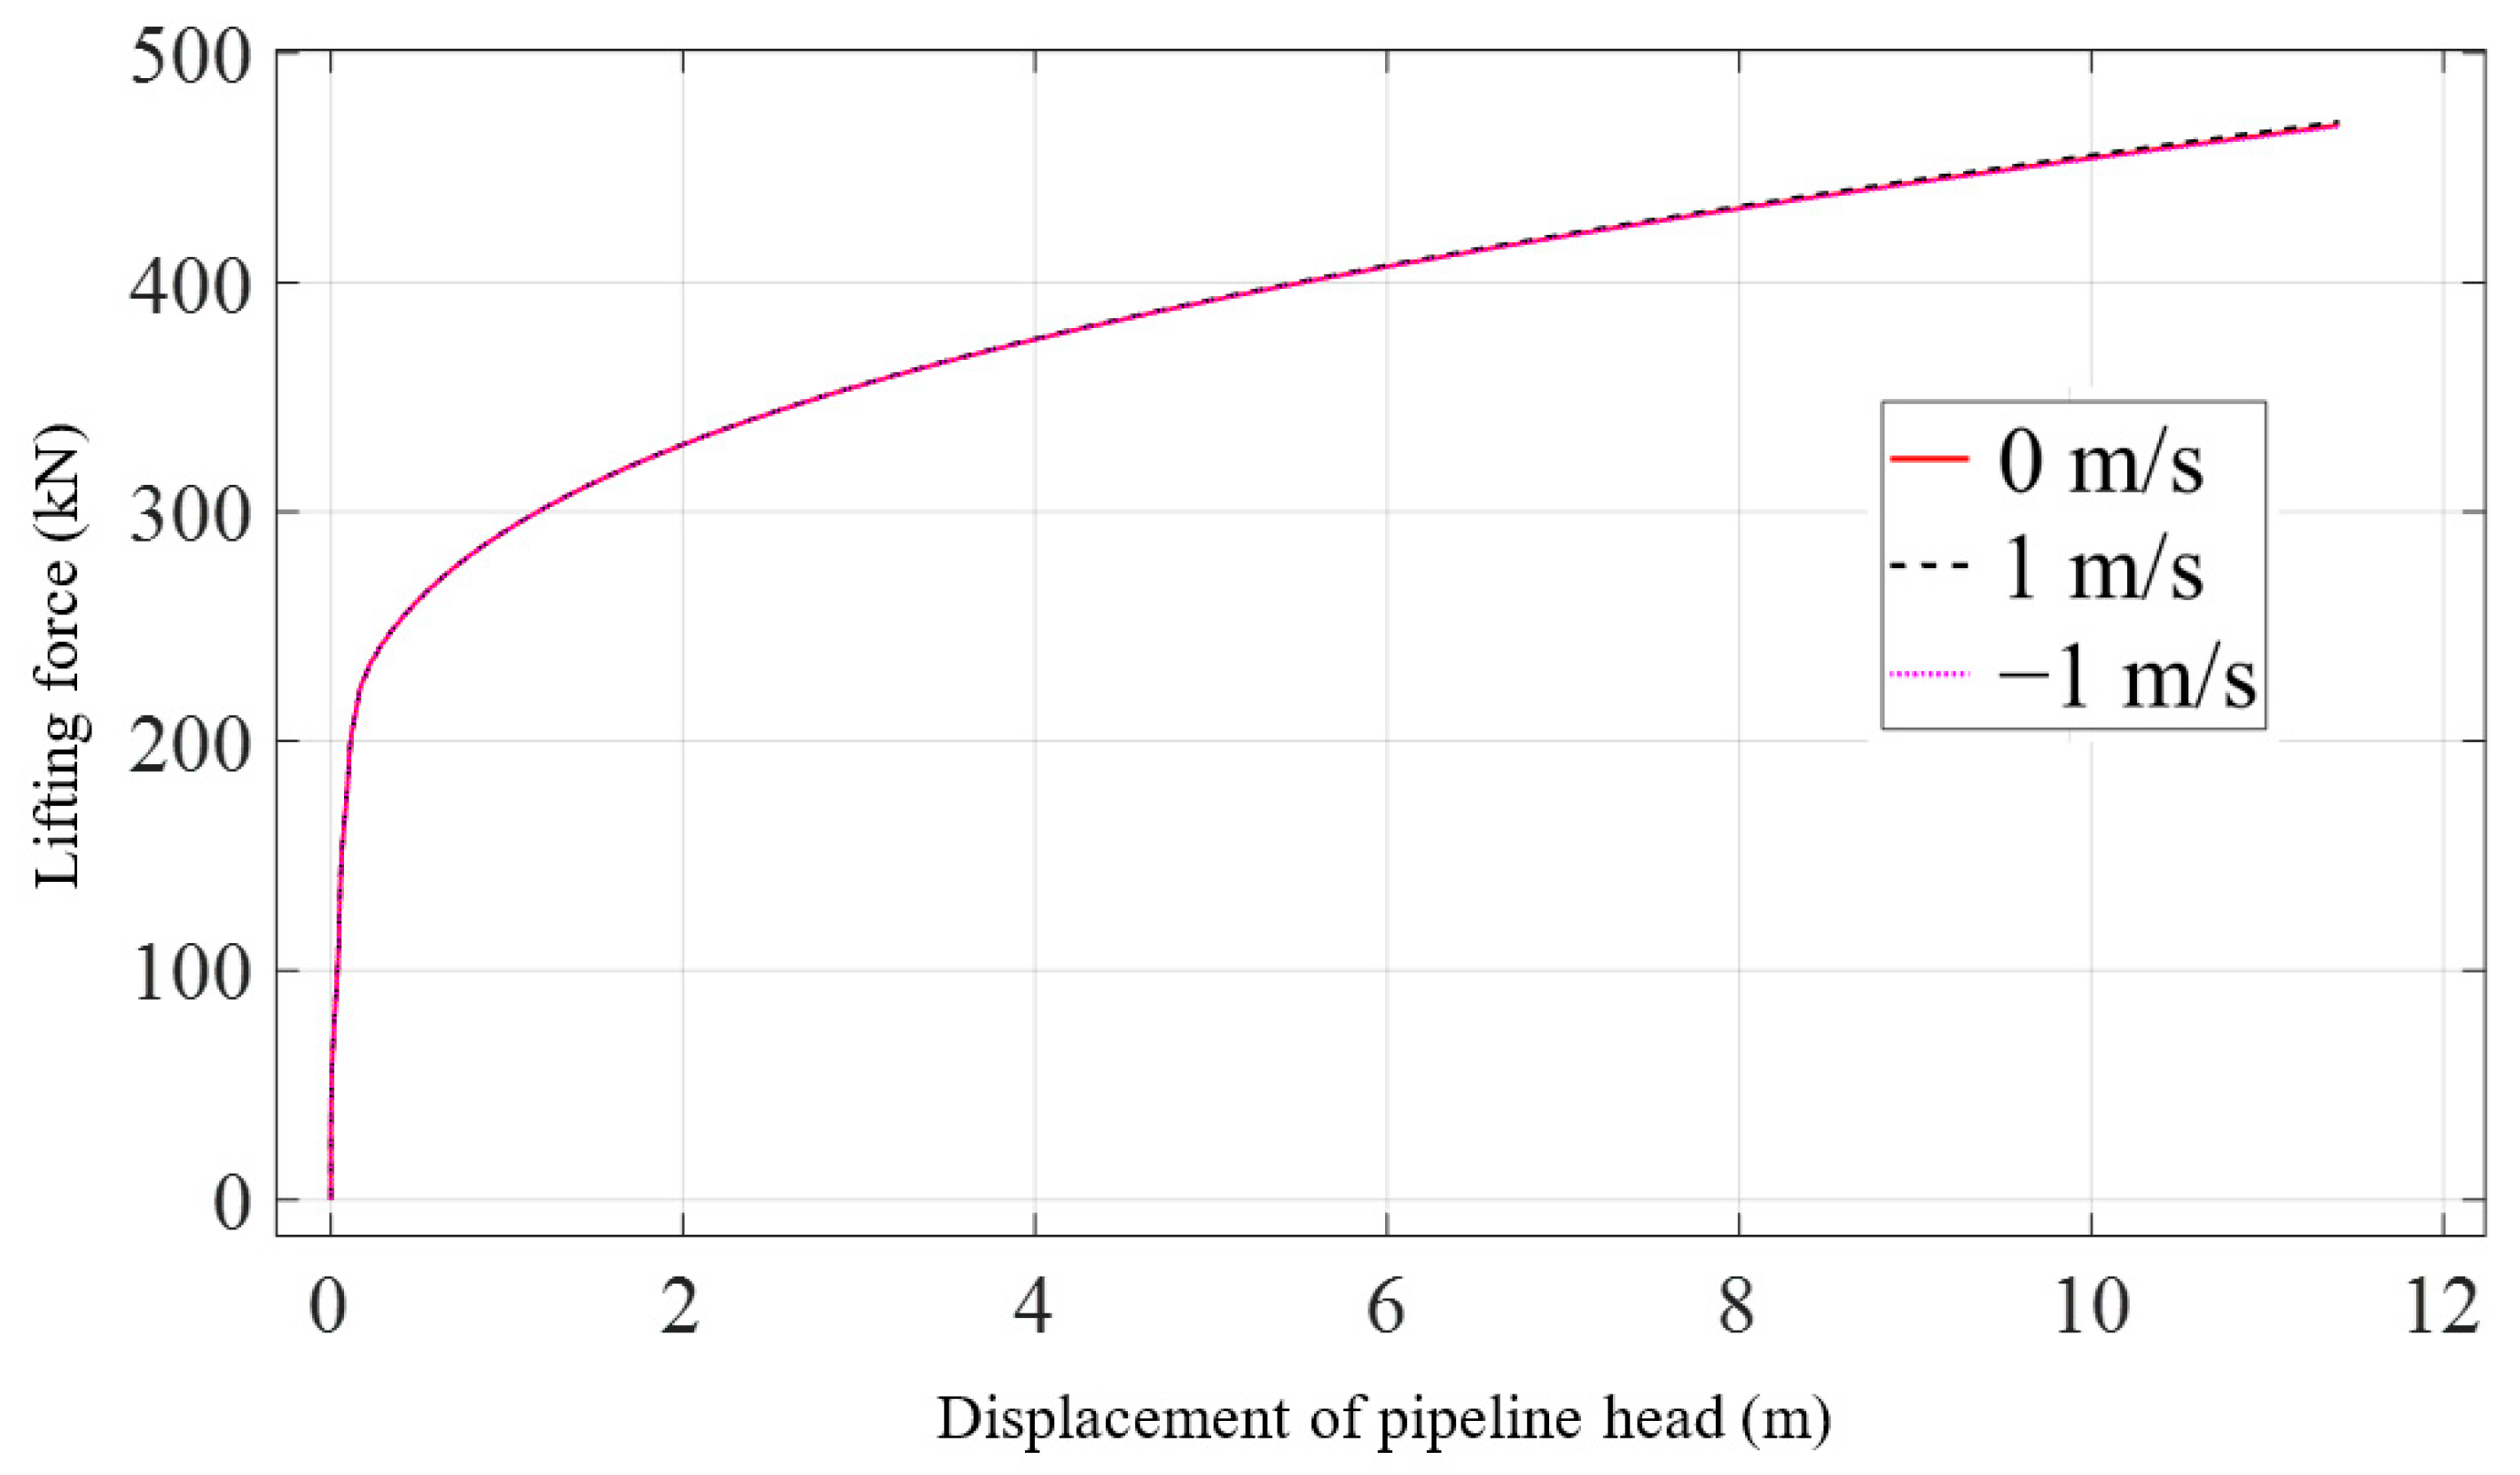
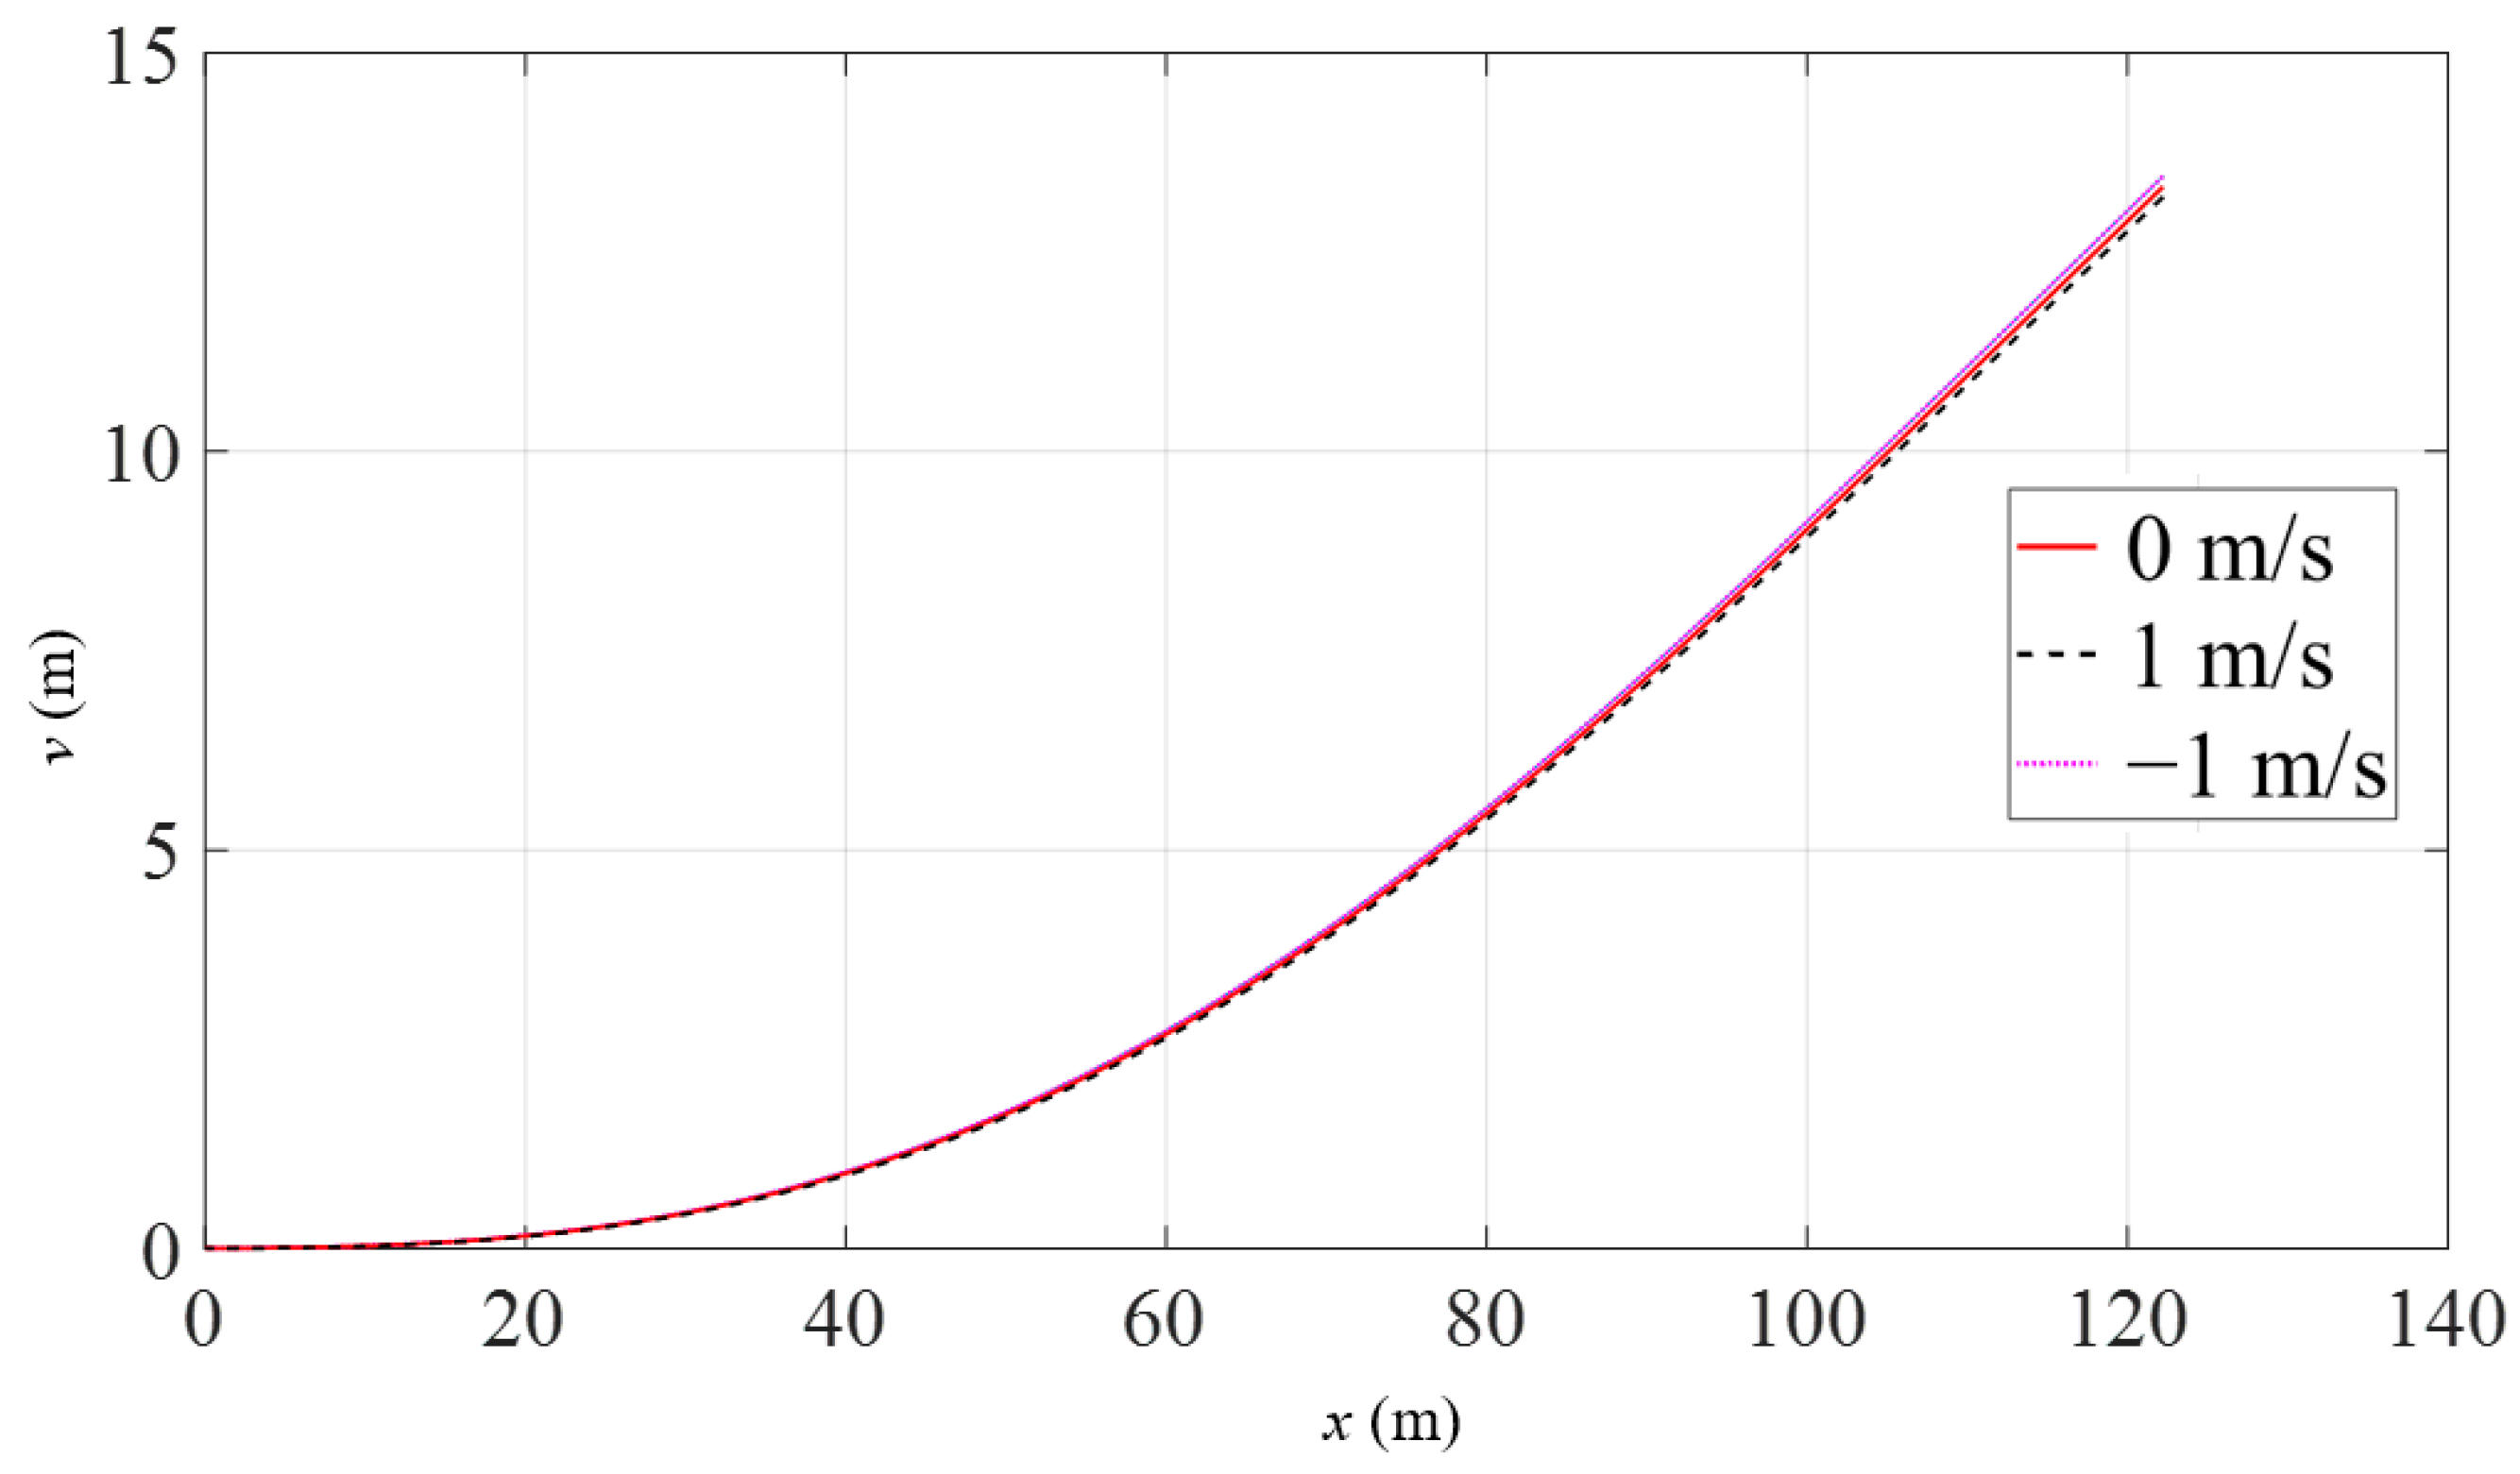
3.2. Effect of Current Velocity
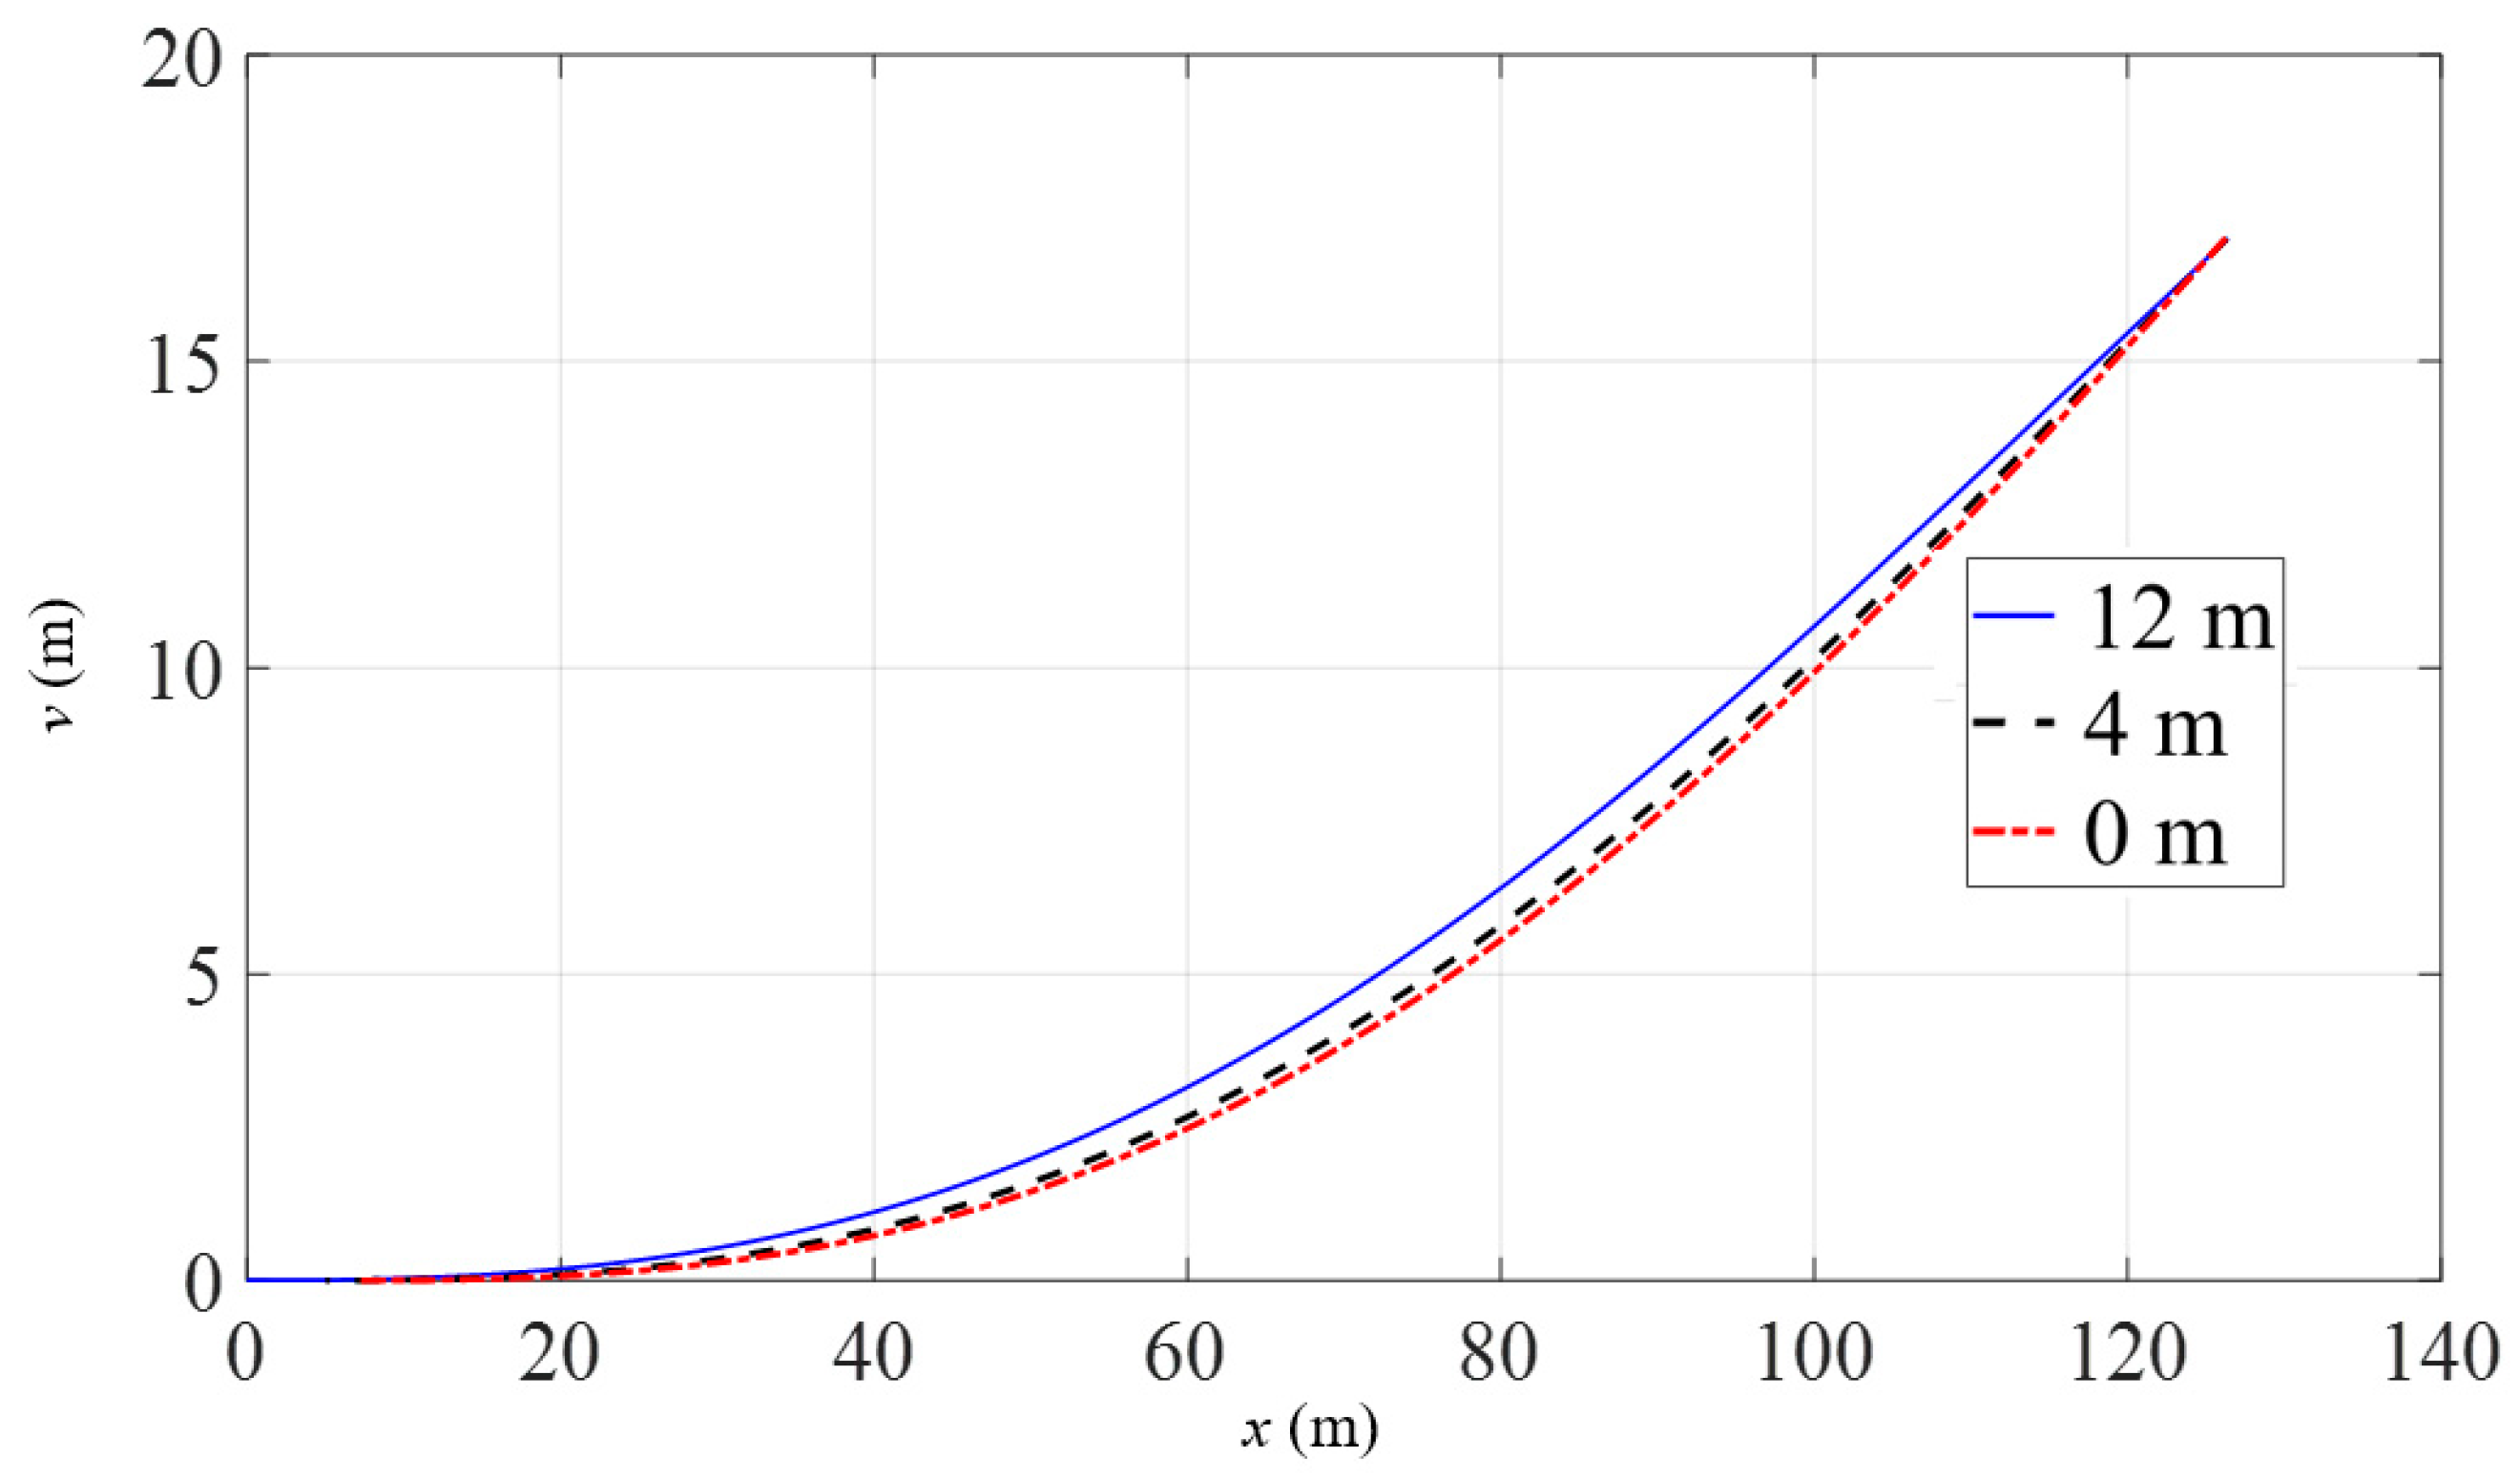
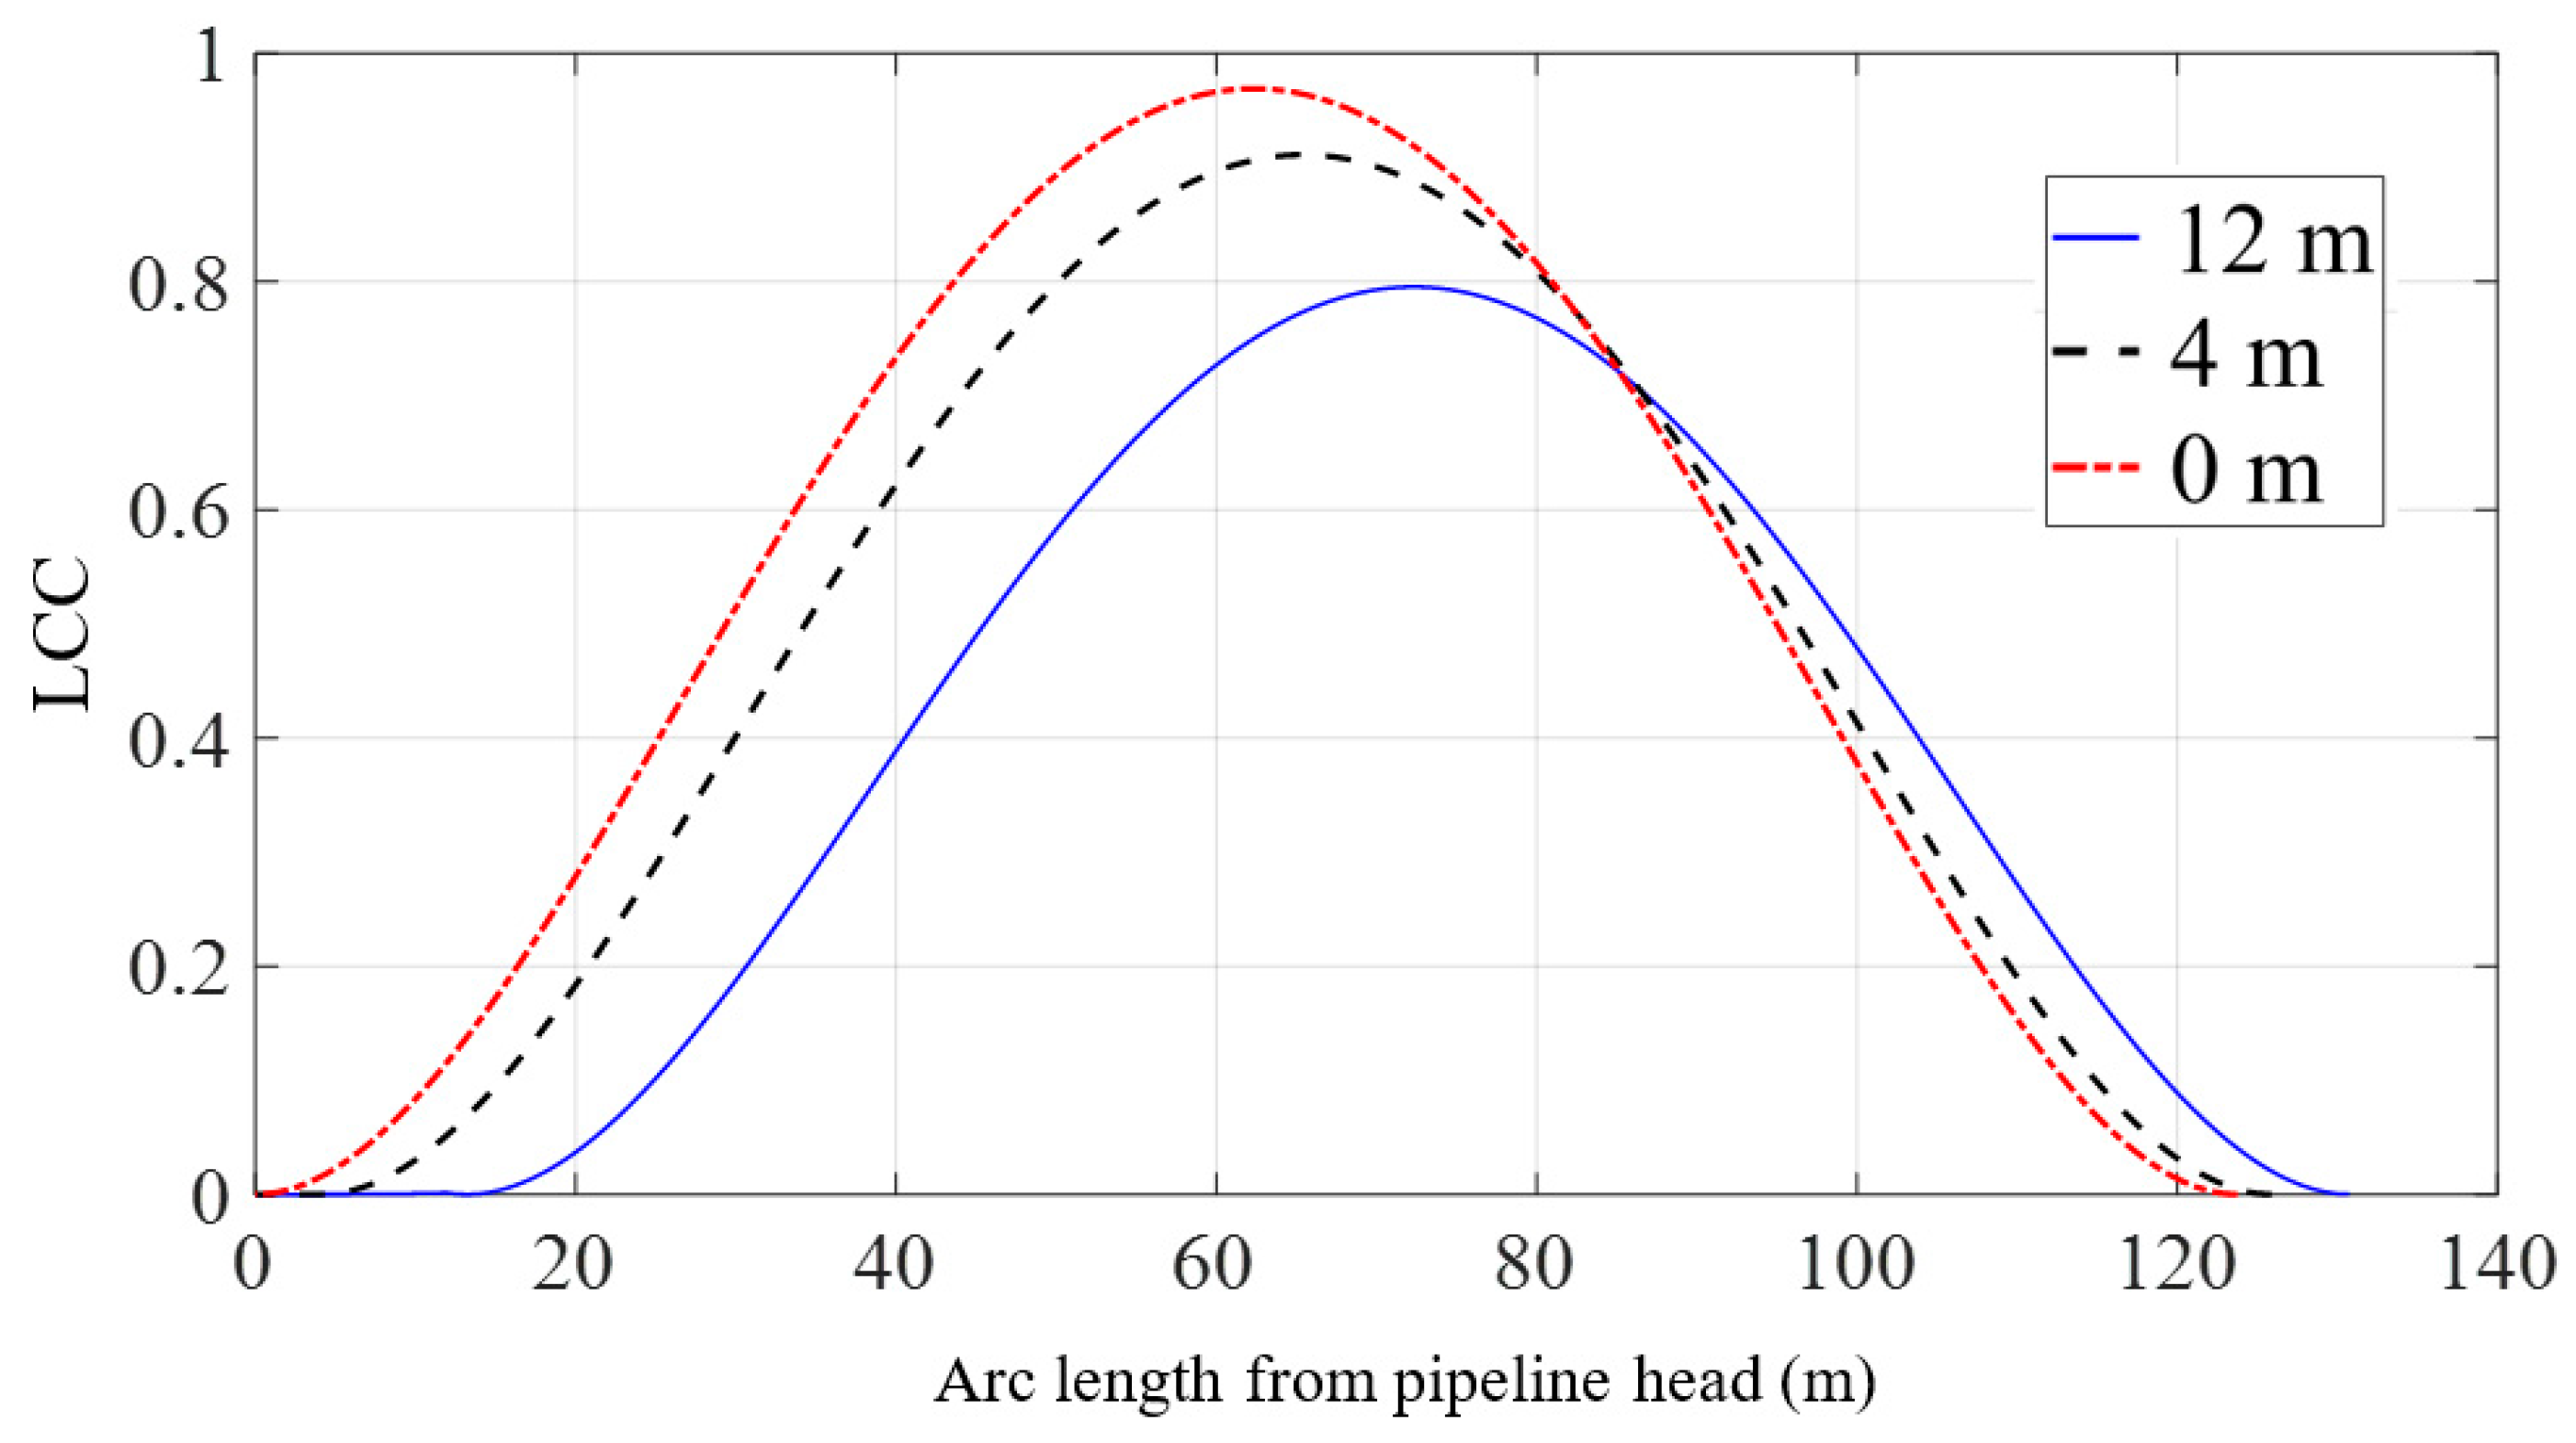
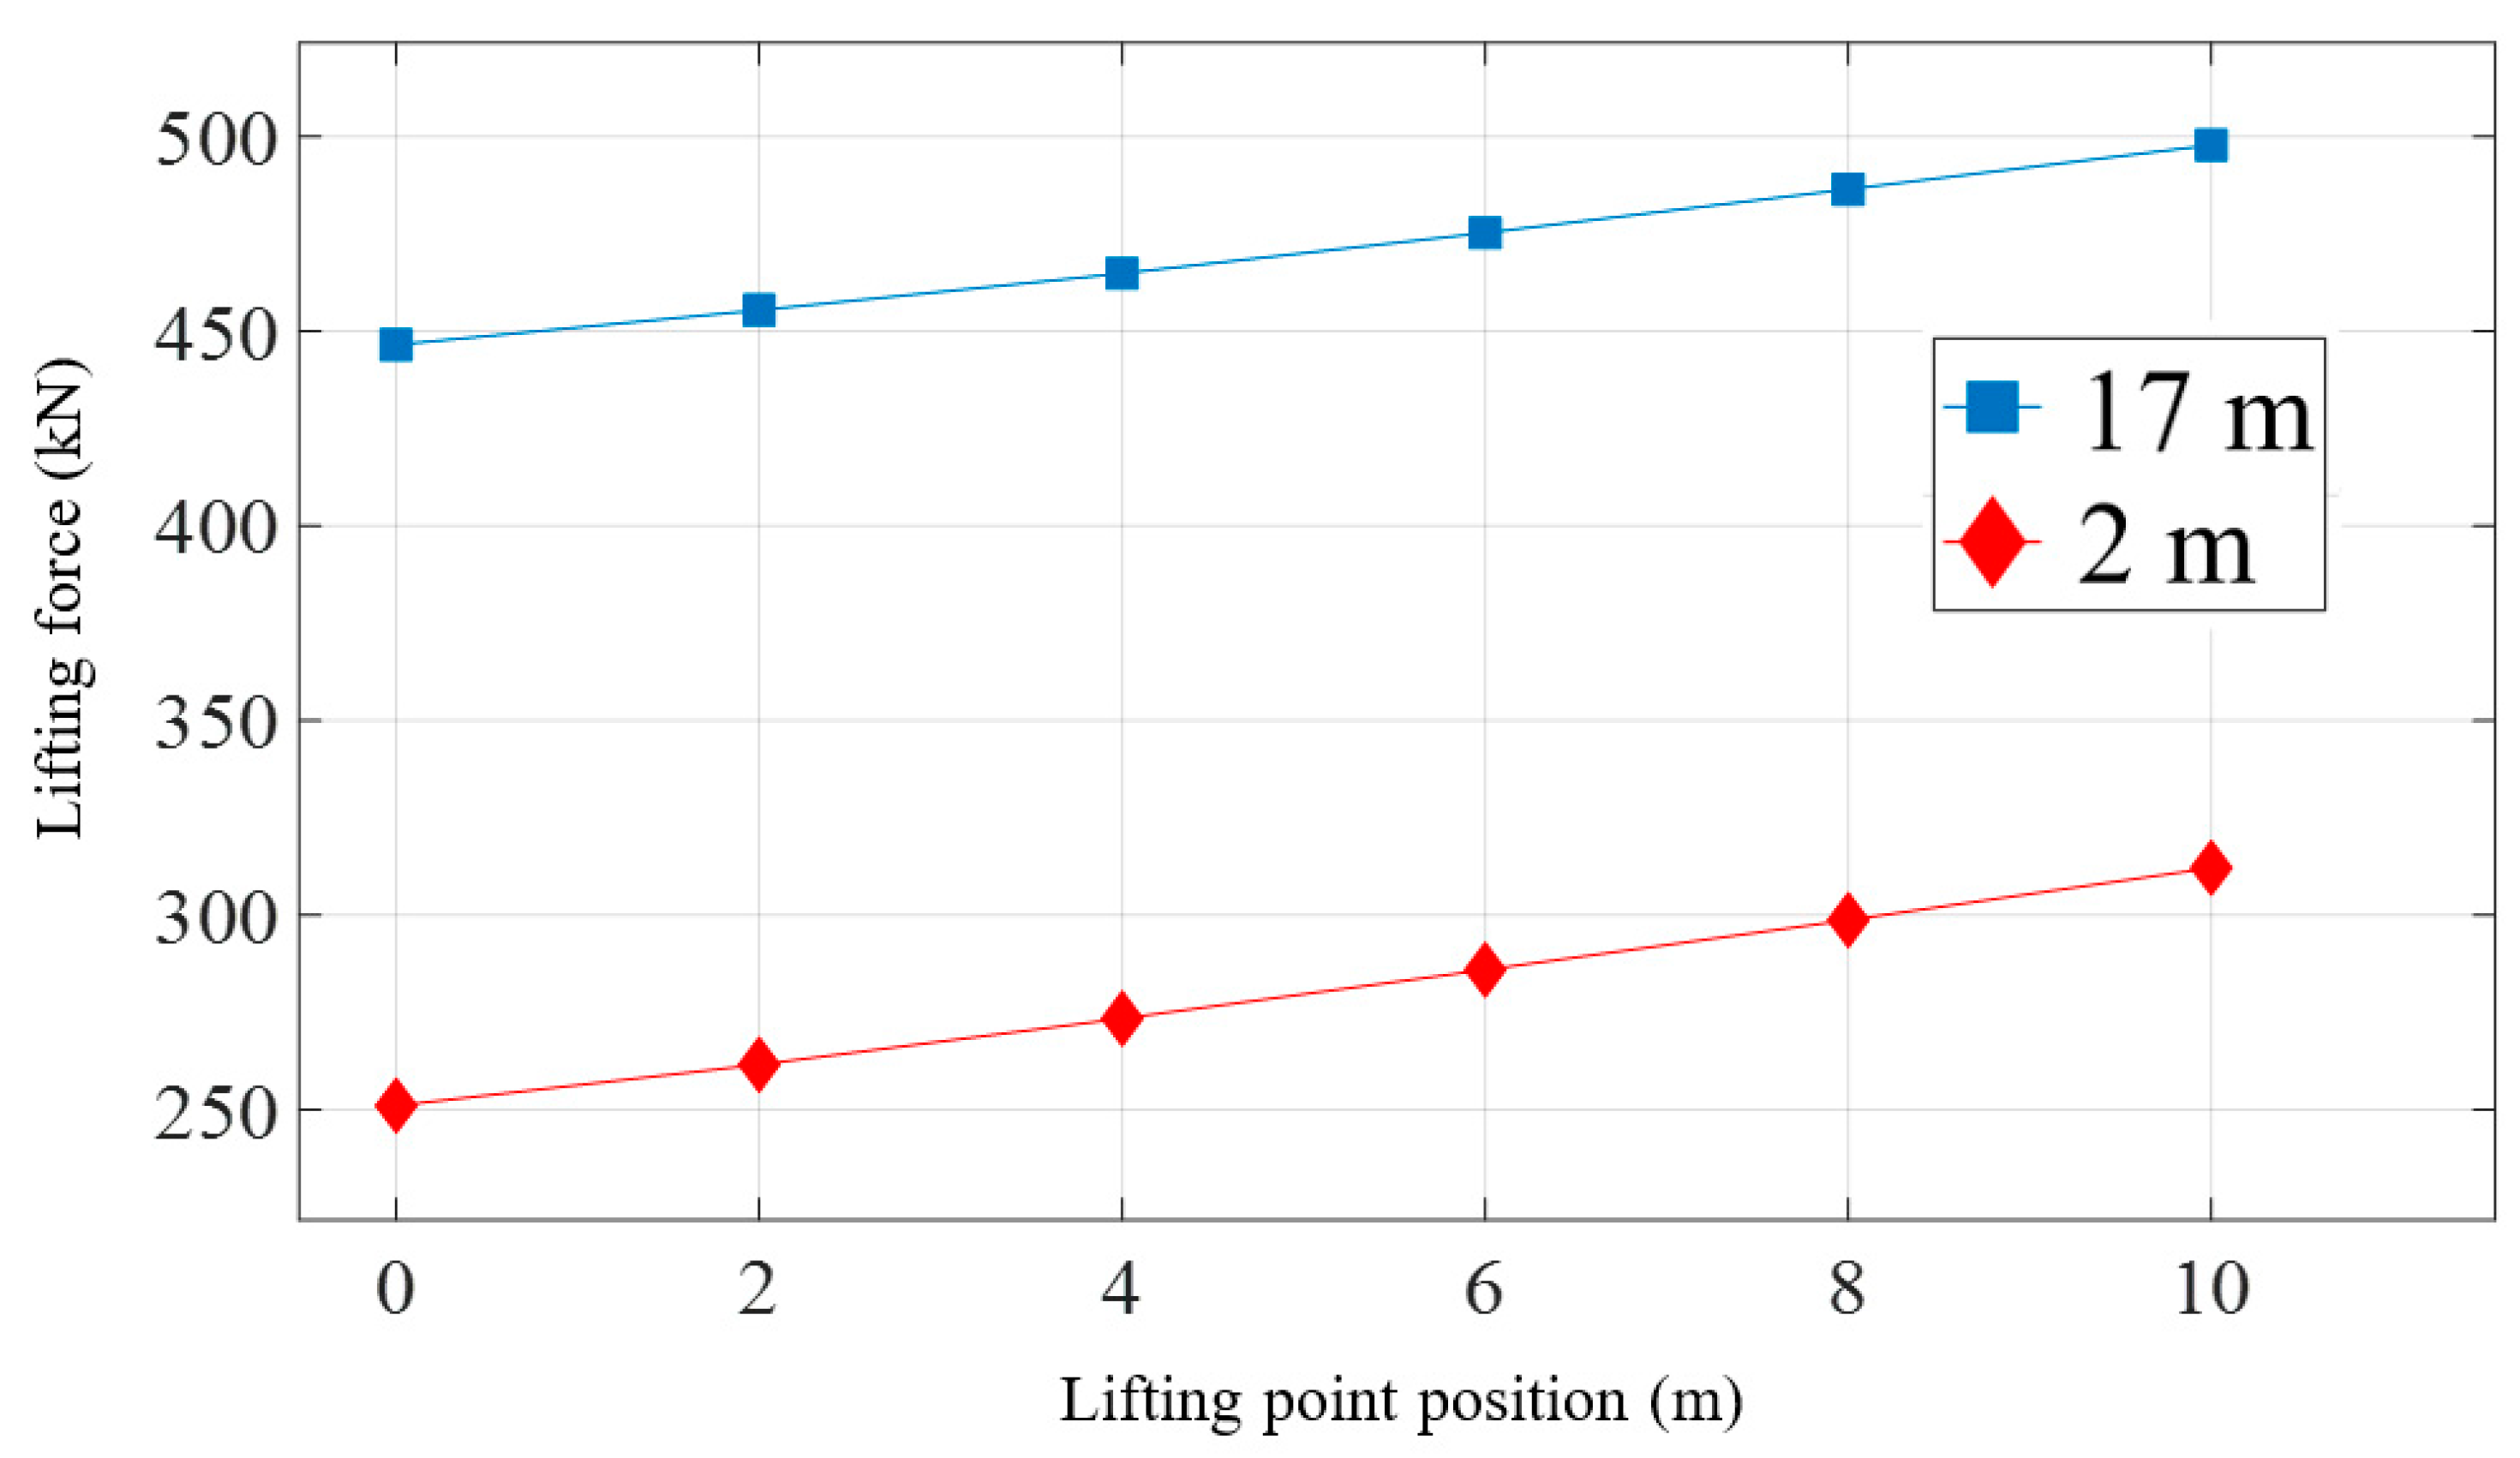
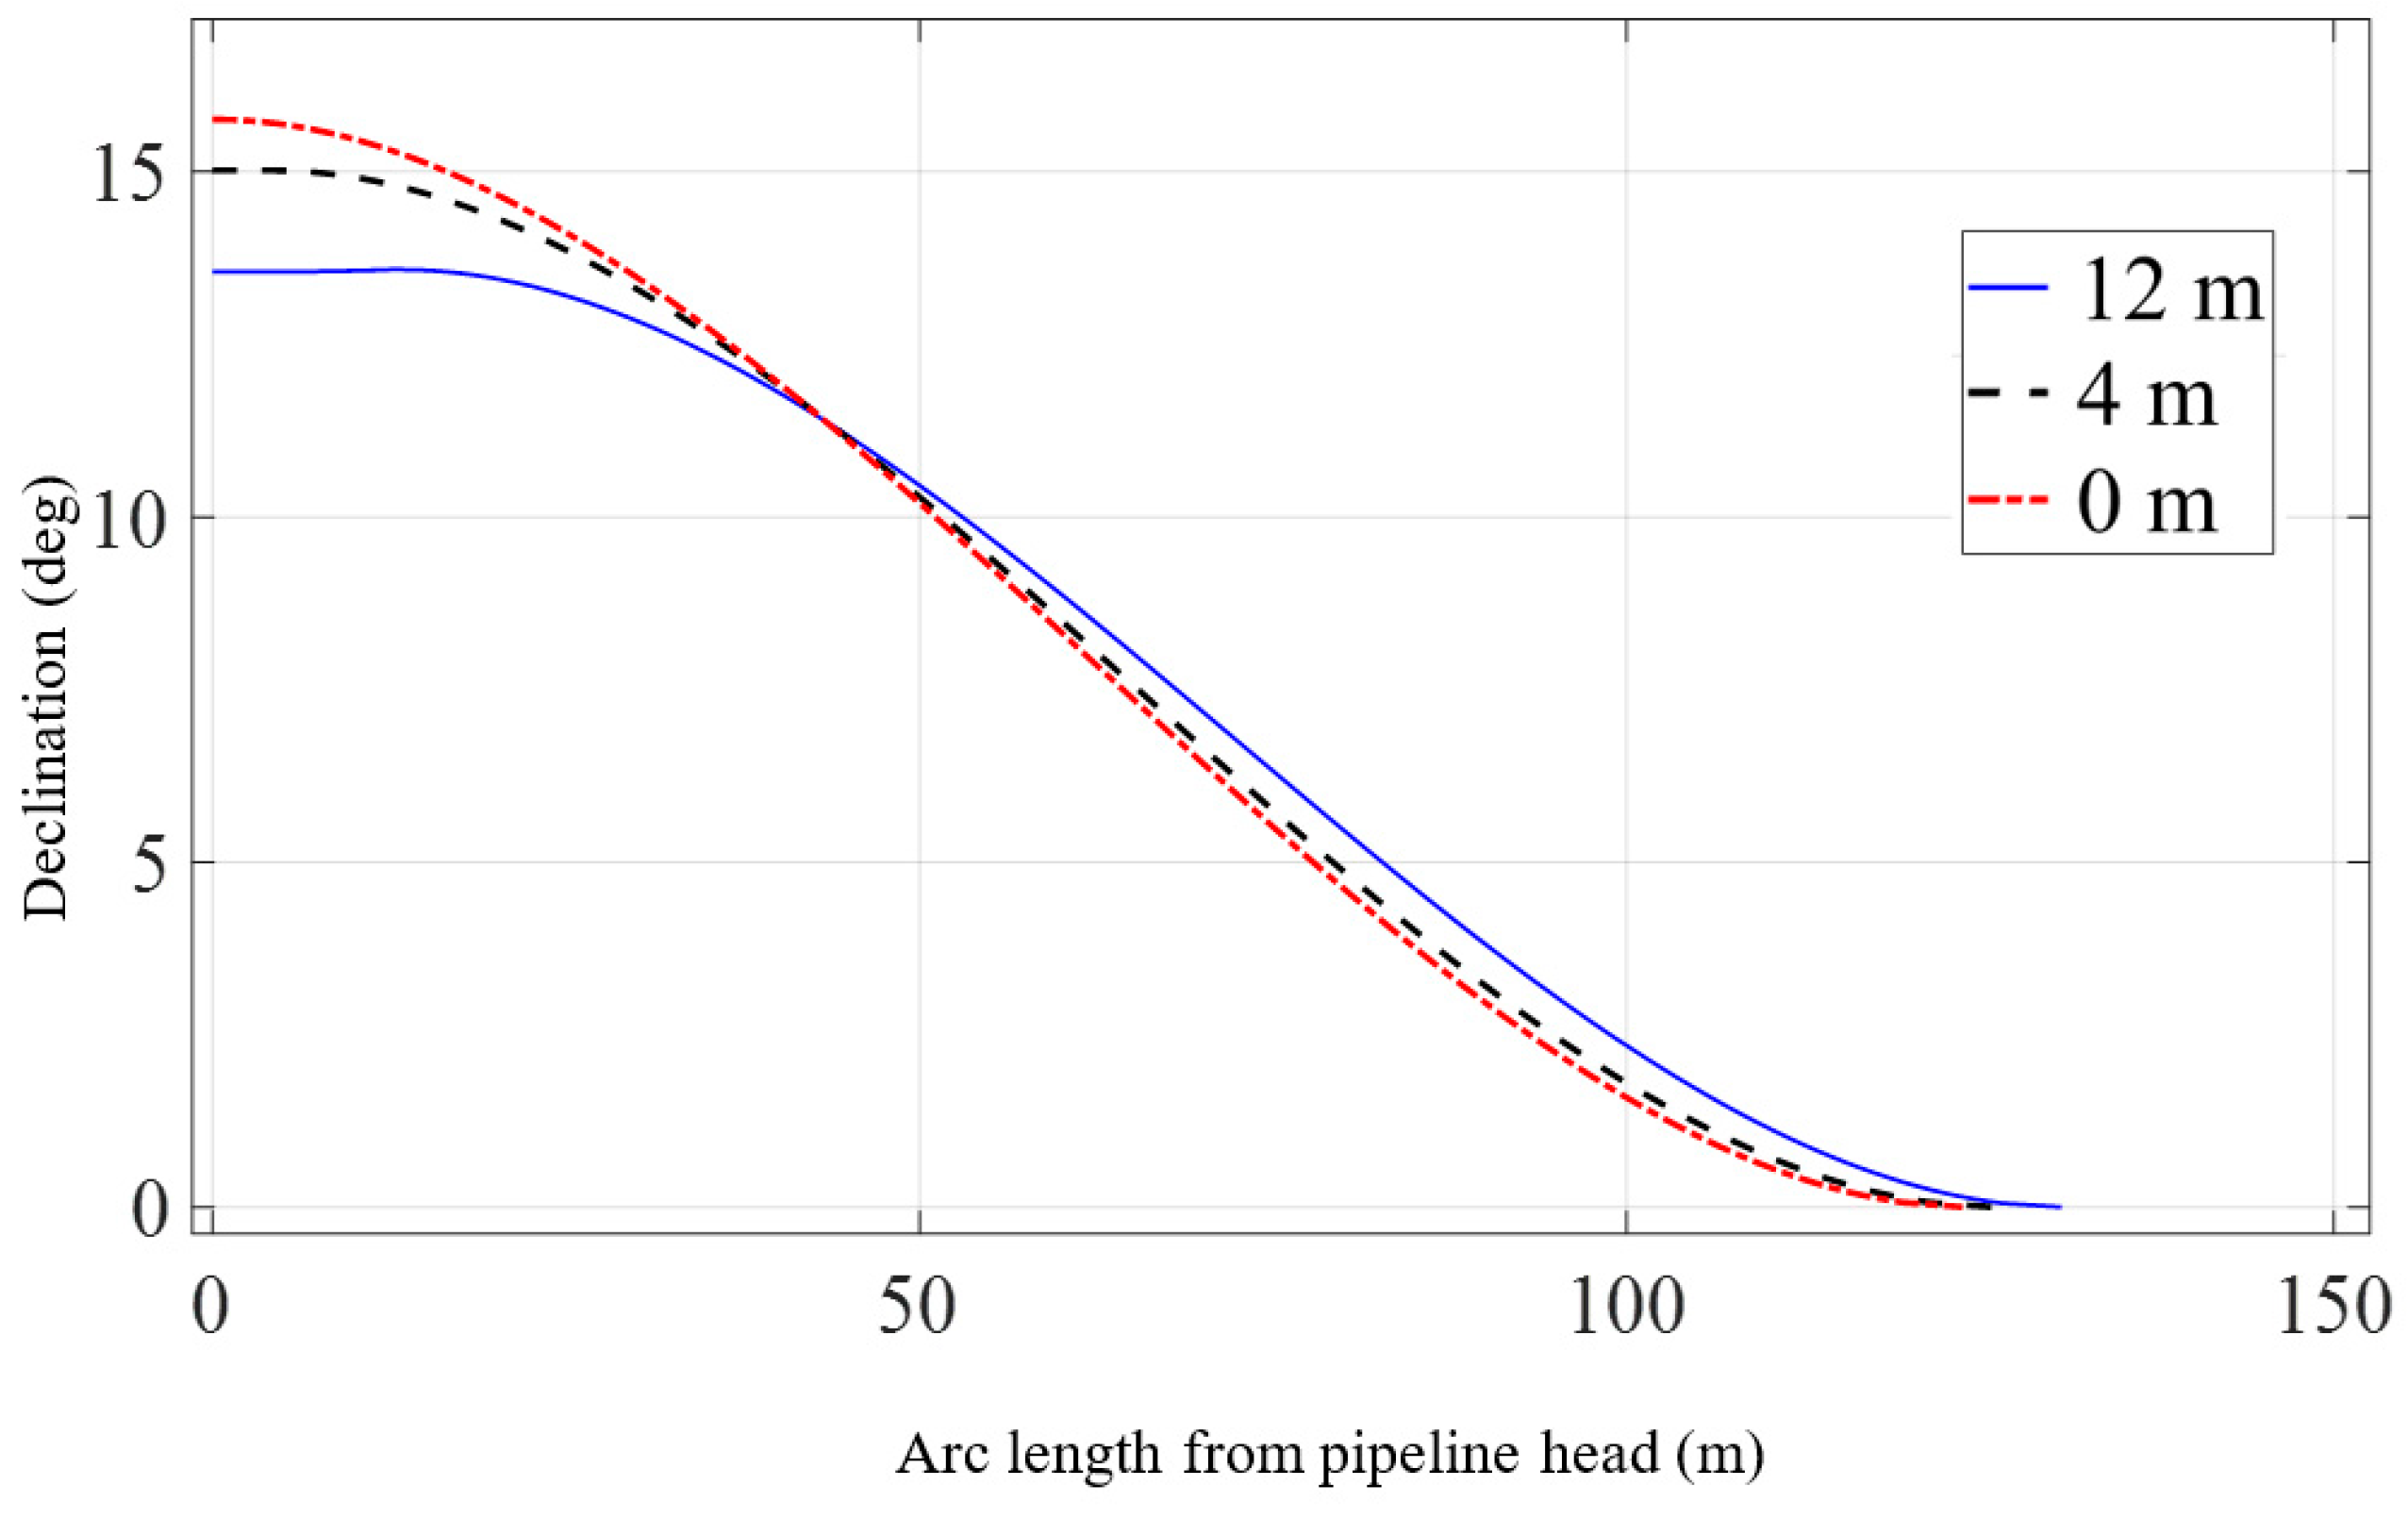
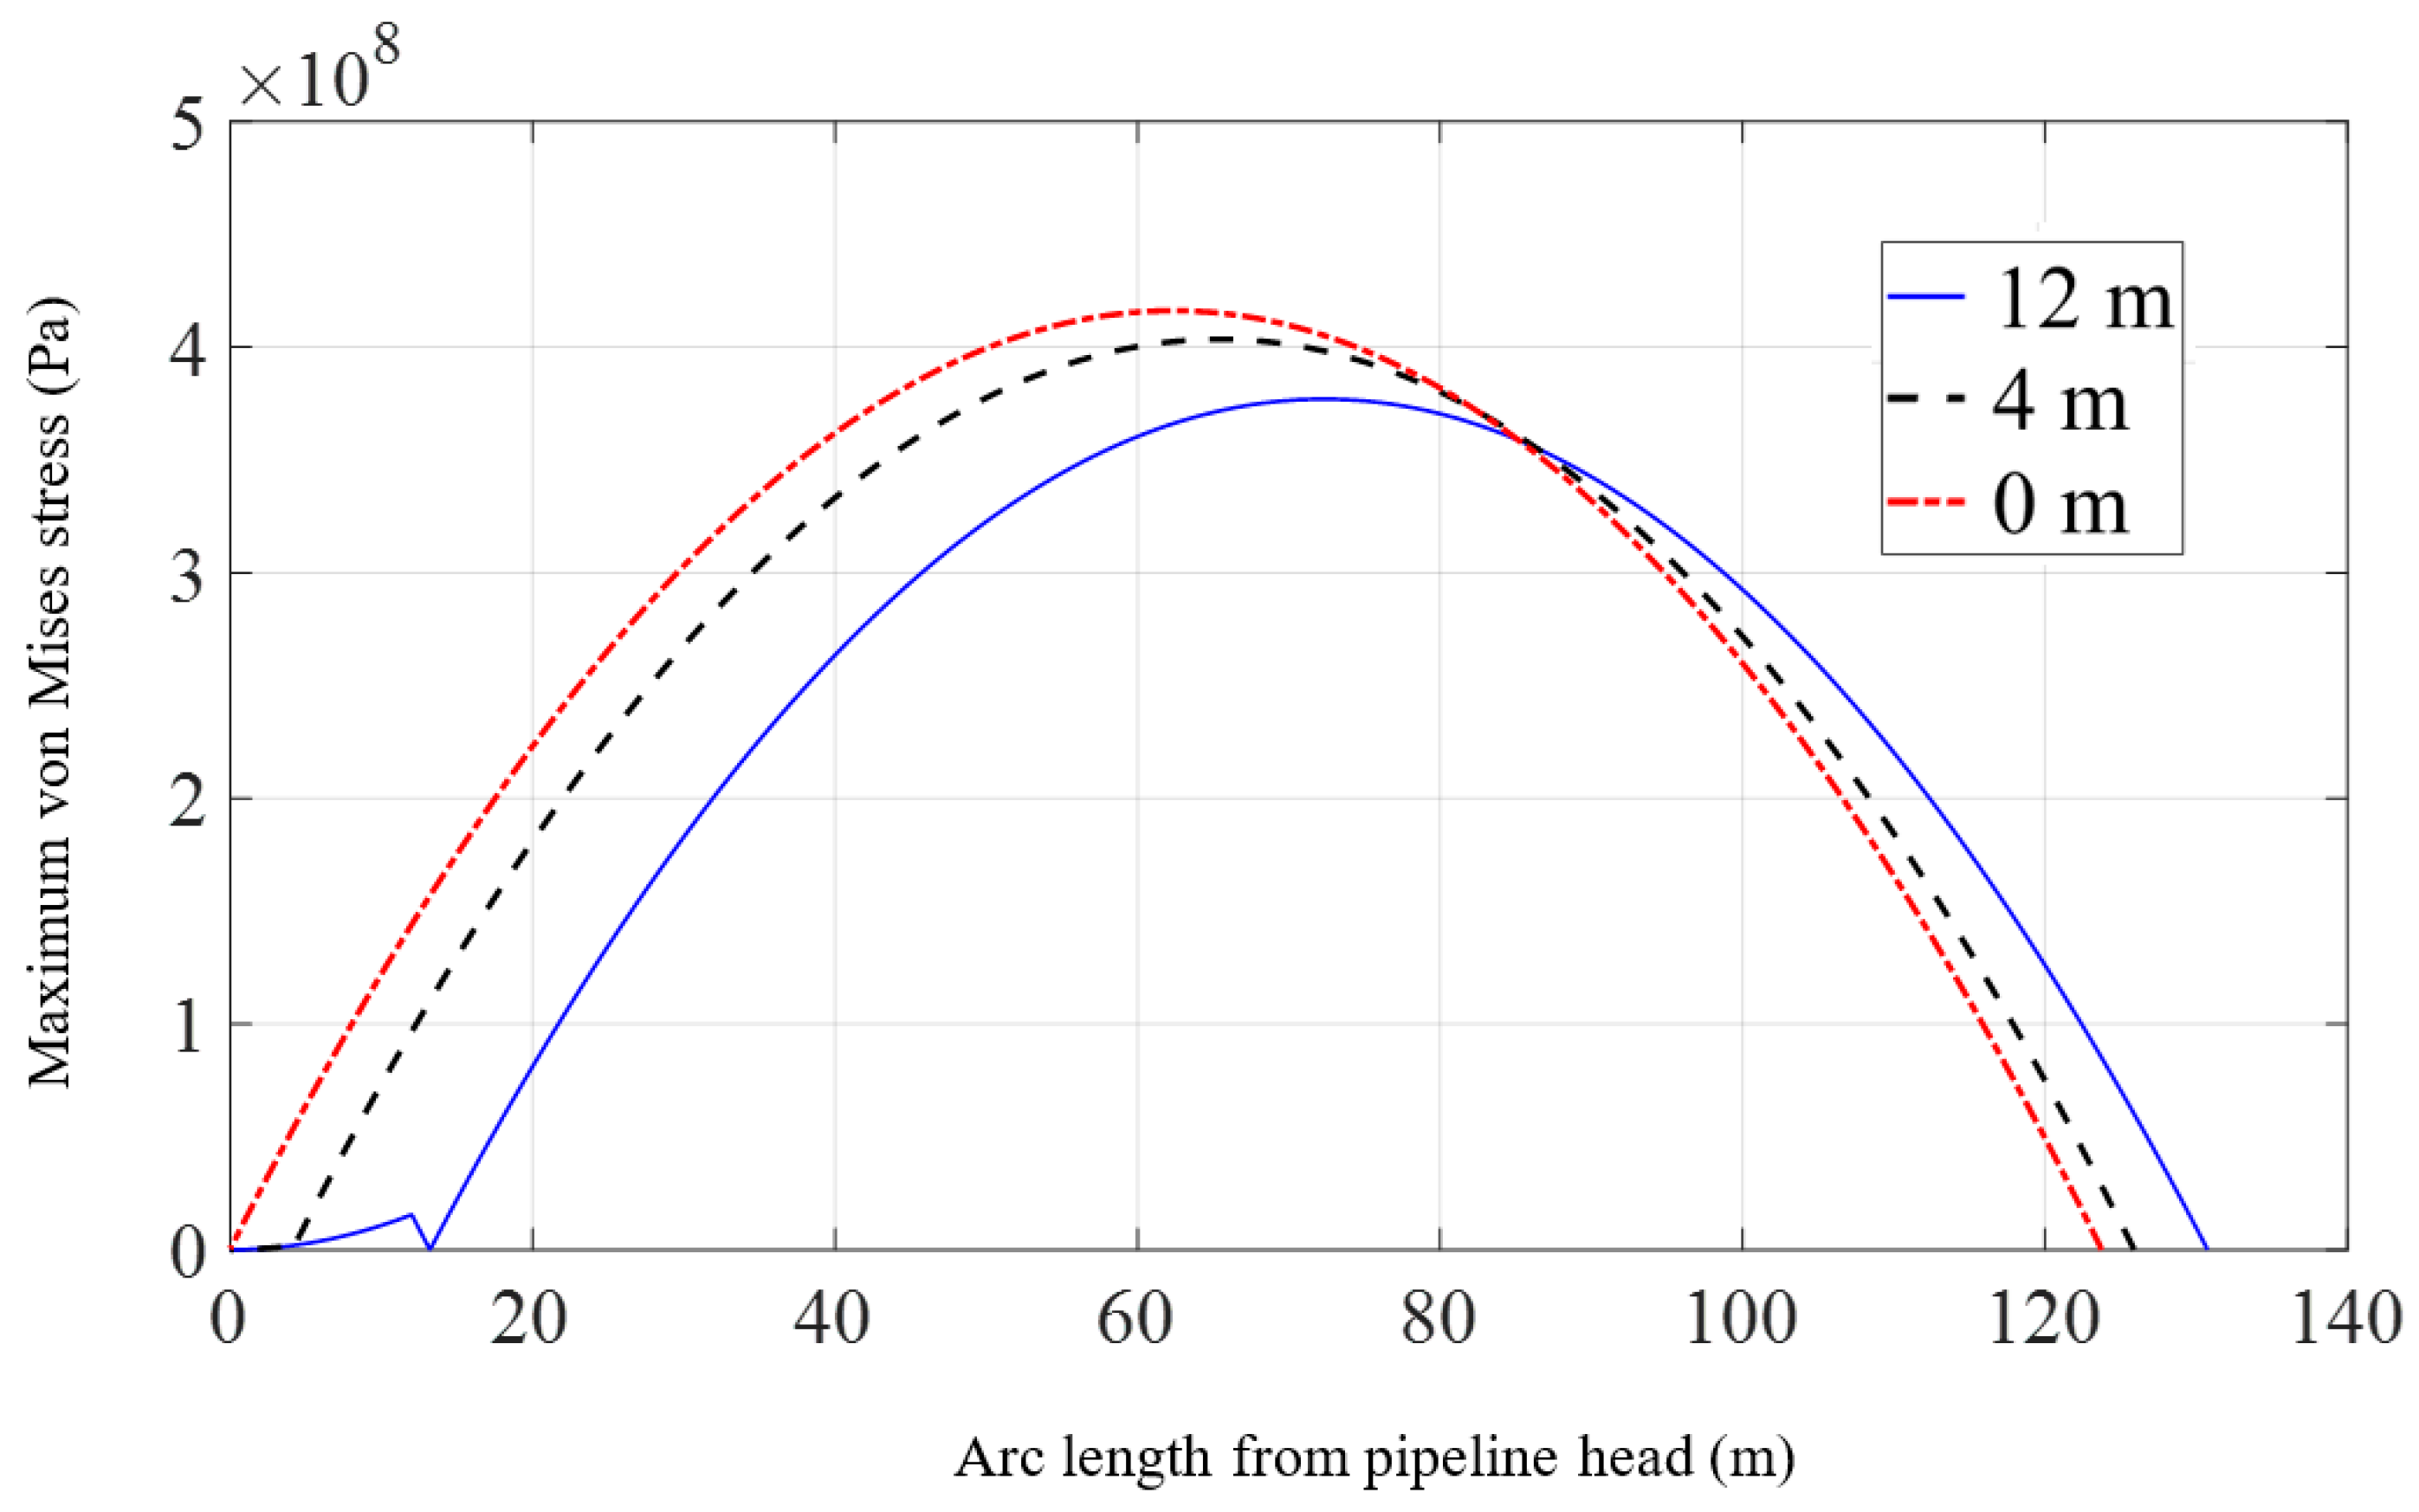
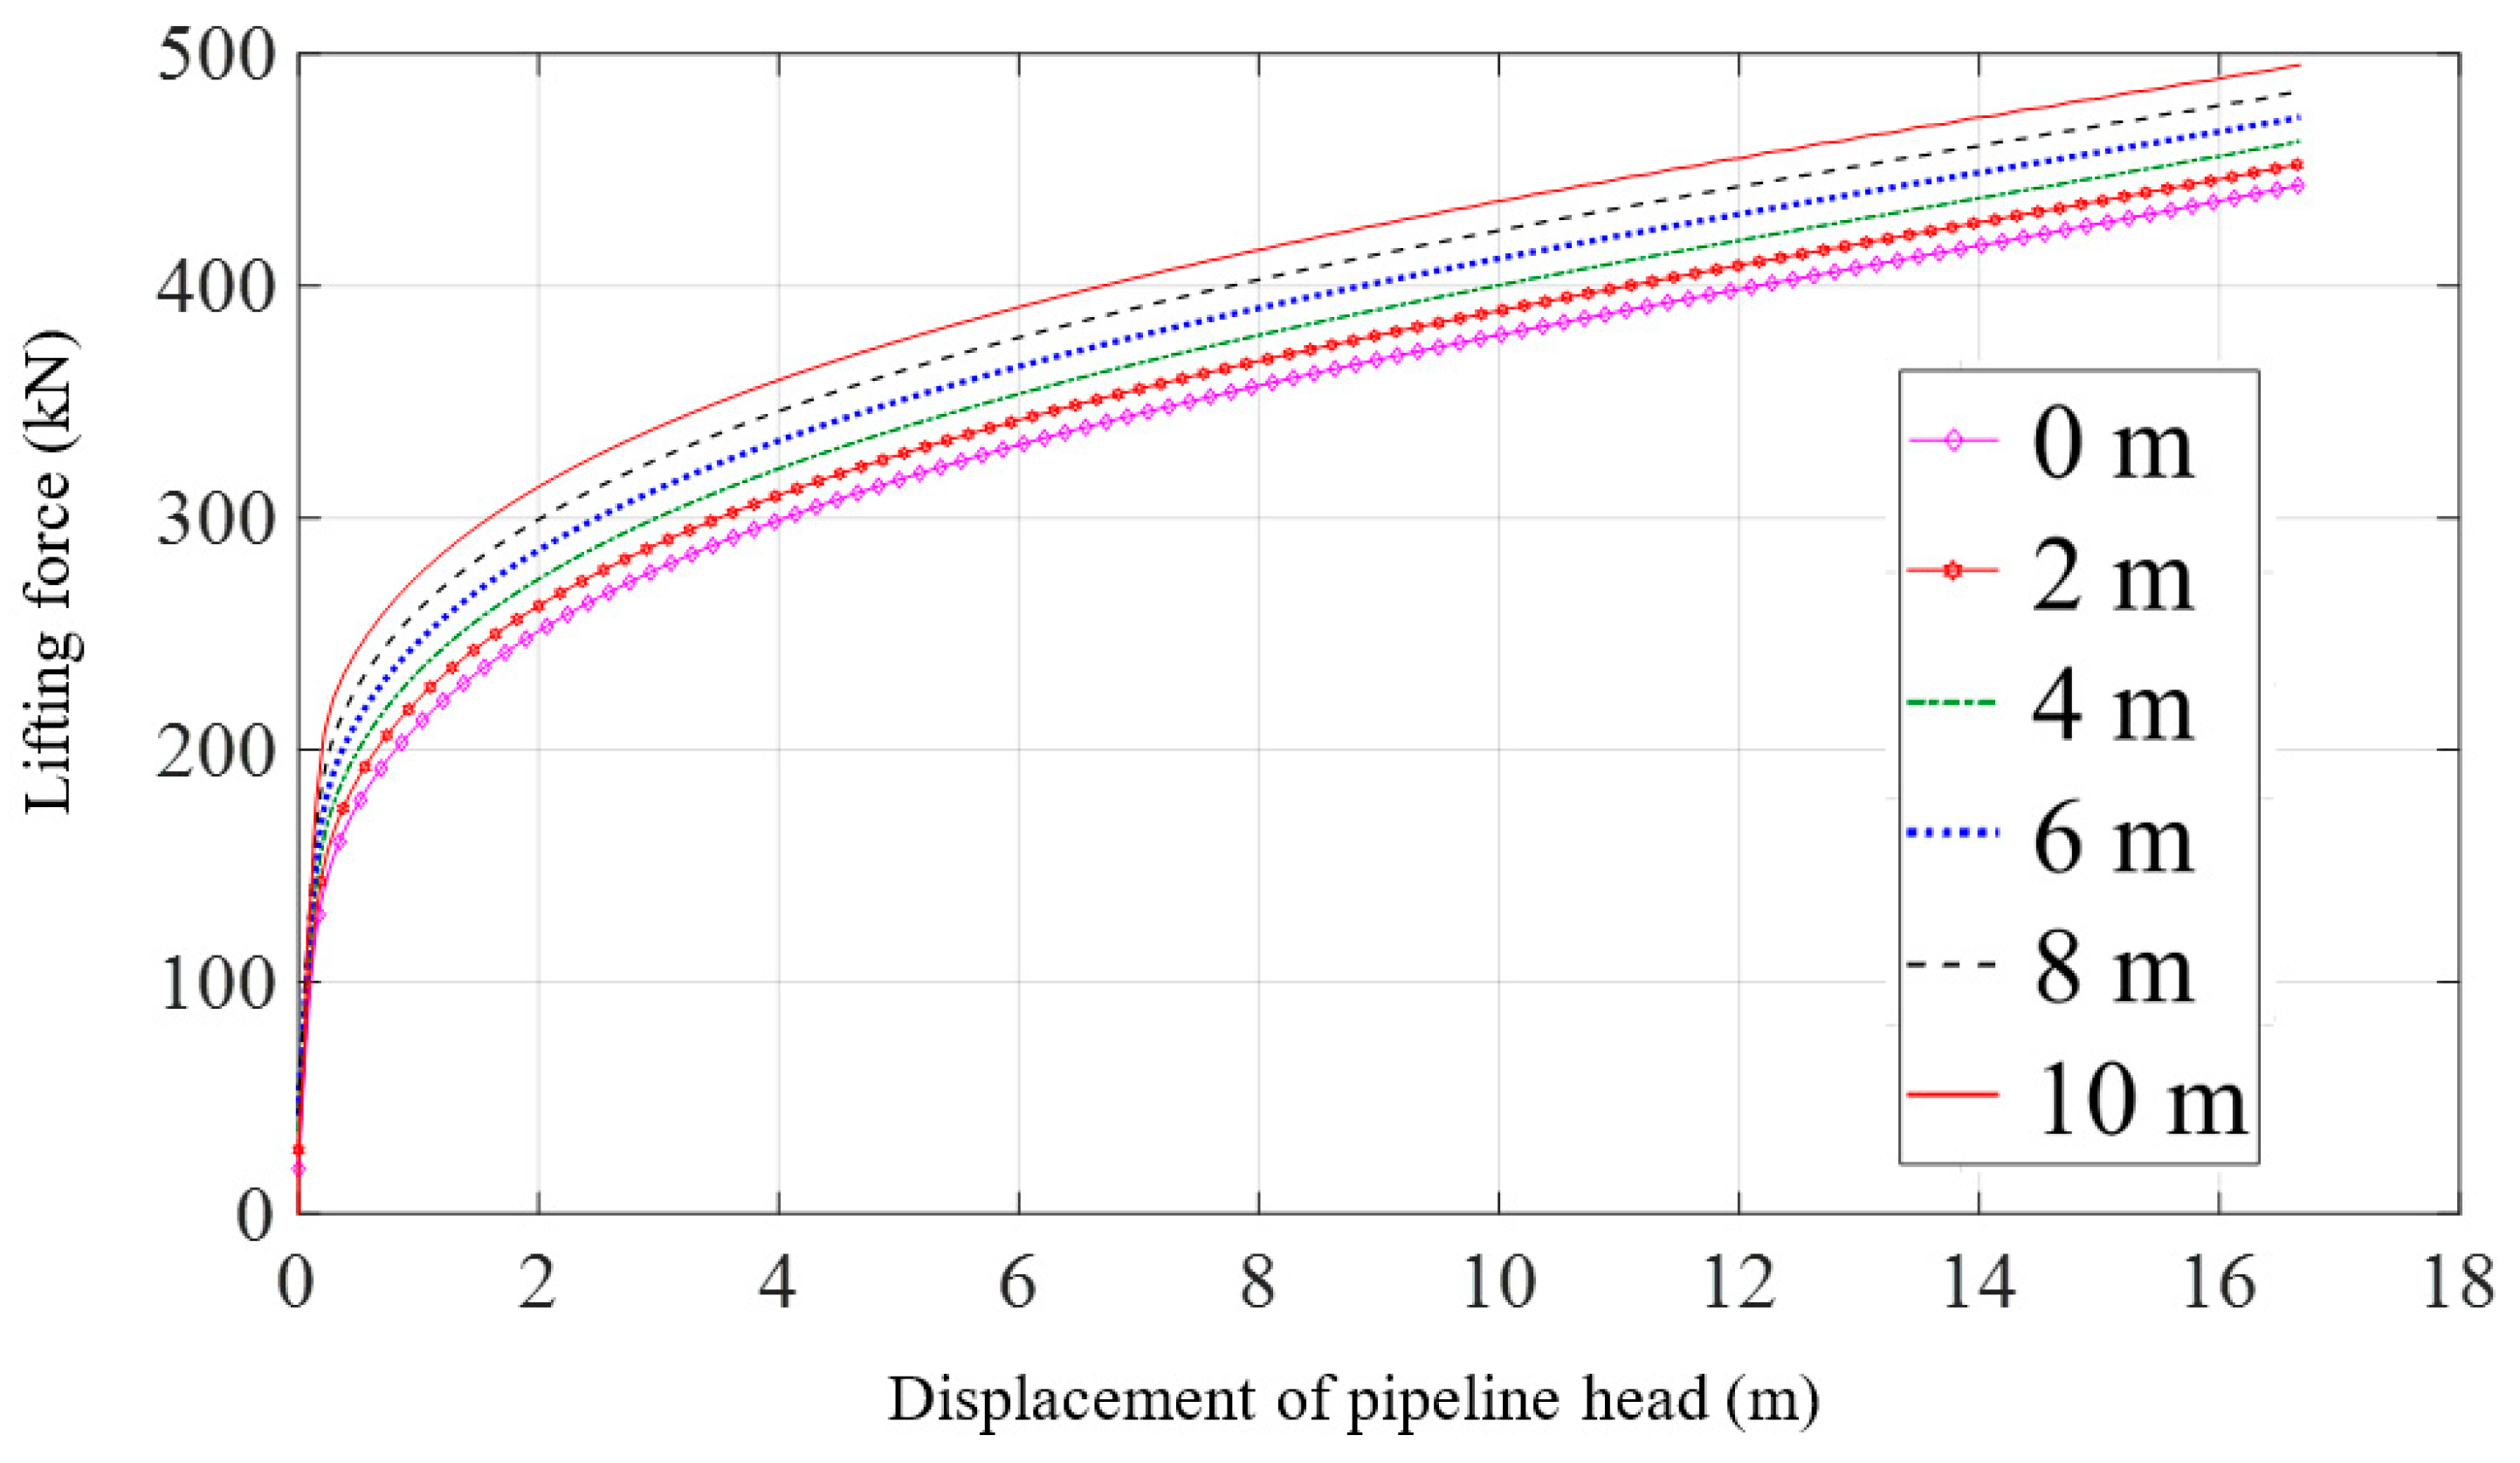
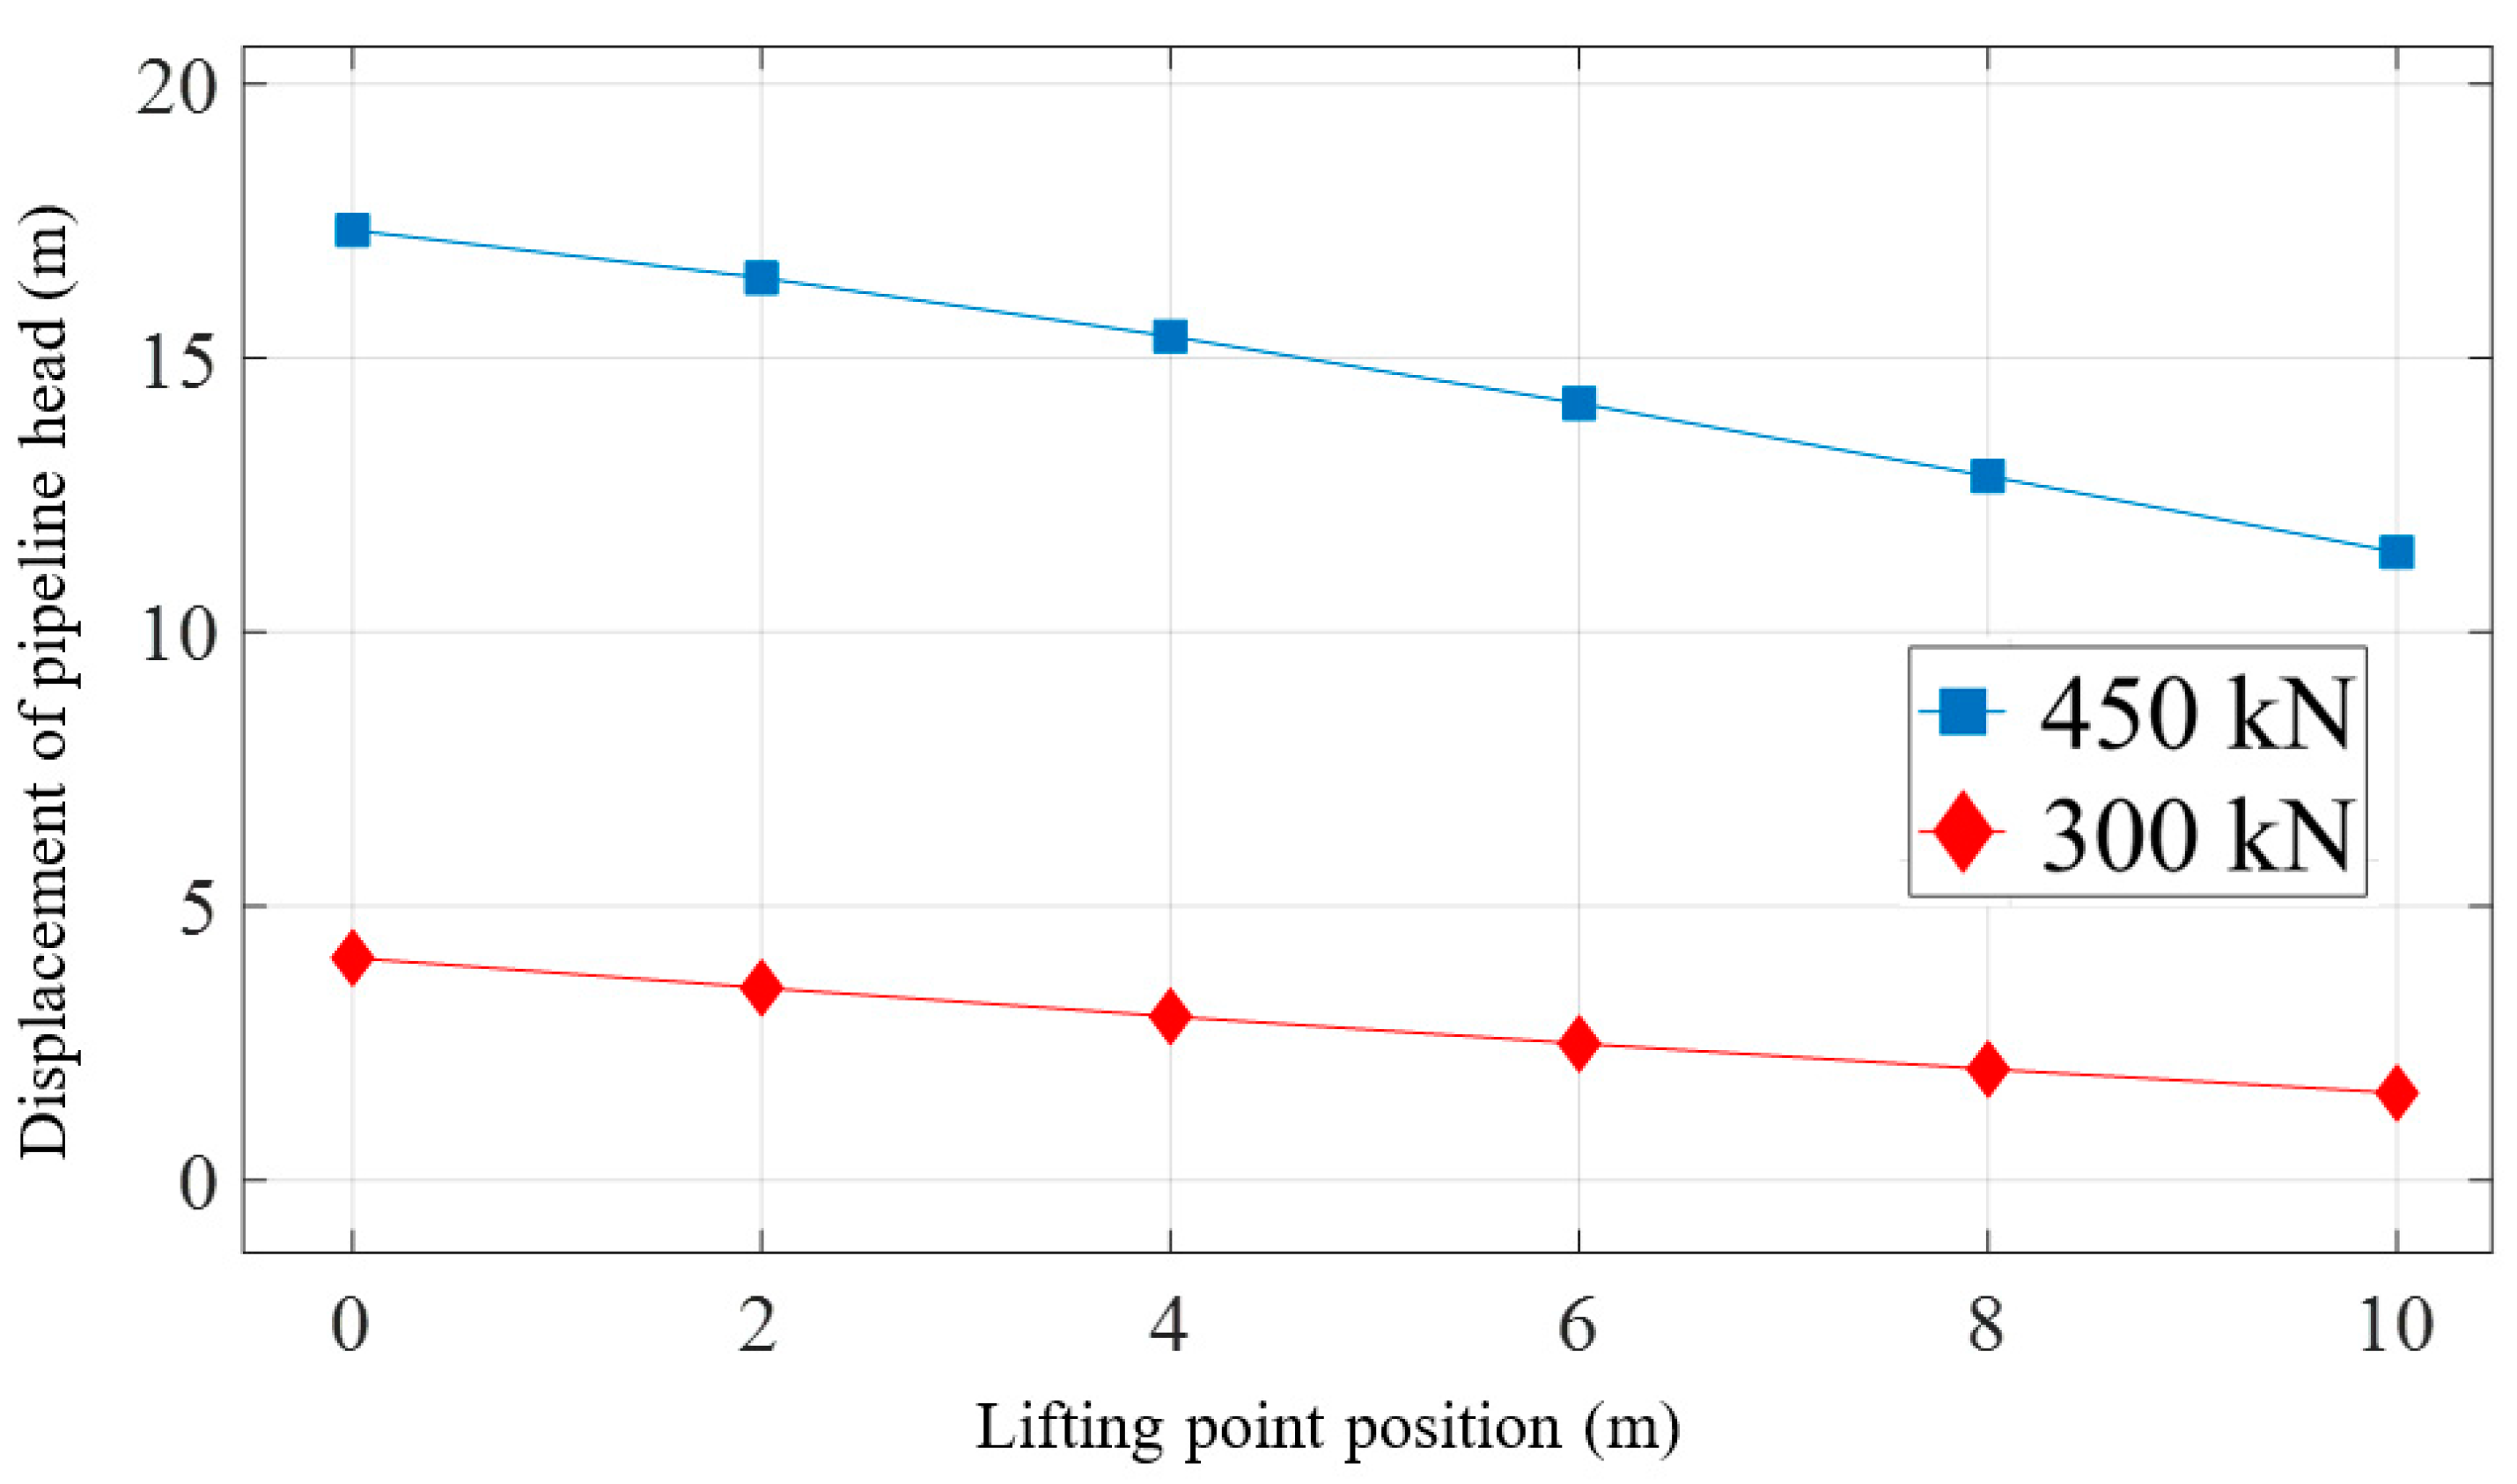
3.3. Effect of Lifting Point Position
4. Conclusions
Author Contributions
Funding
Institutional Review Board Statement
Informed Consent Statement
Data Availability Statement
Conflicts of Interest
Abbreviations/Nomenclature
| a | length of the suspended section of the pipeline |
| Cn | normal drag coefficient |
| Ct | tangential drag coefficient |
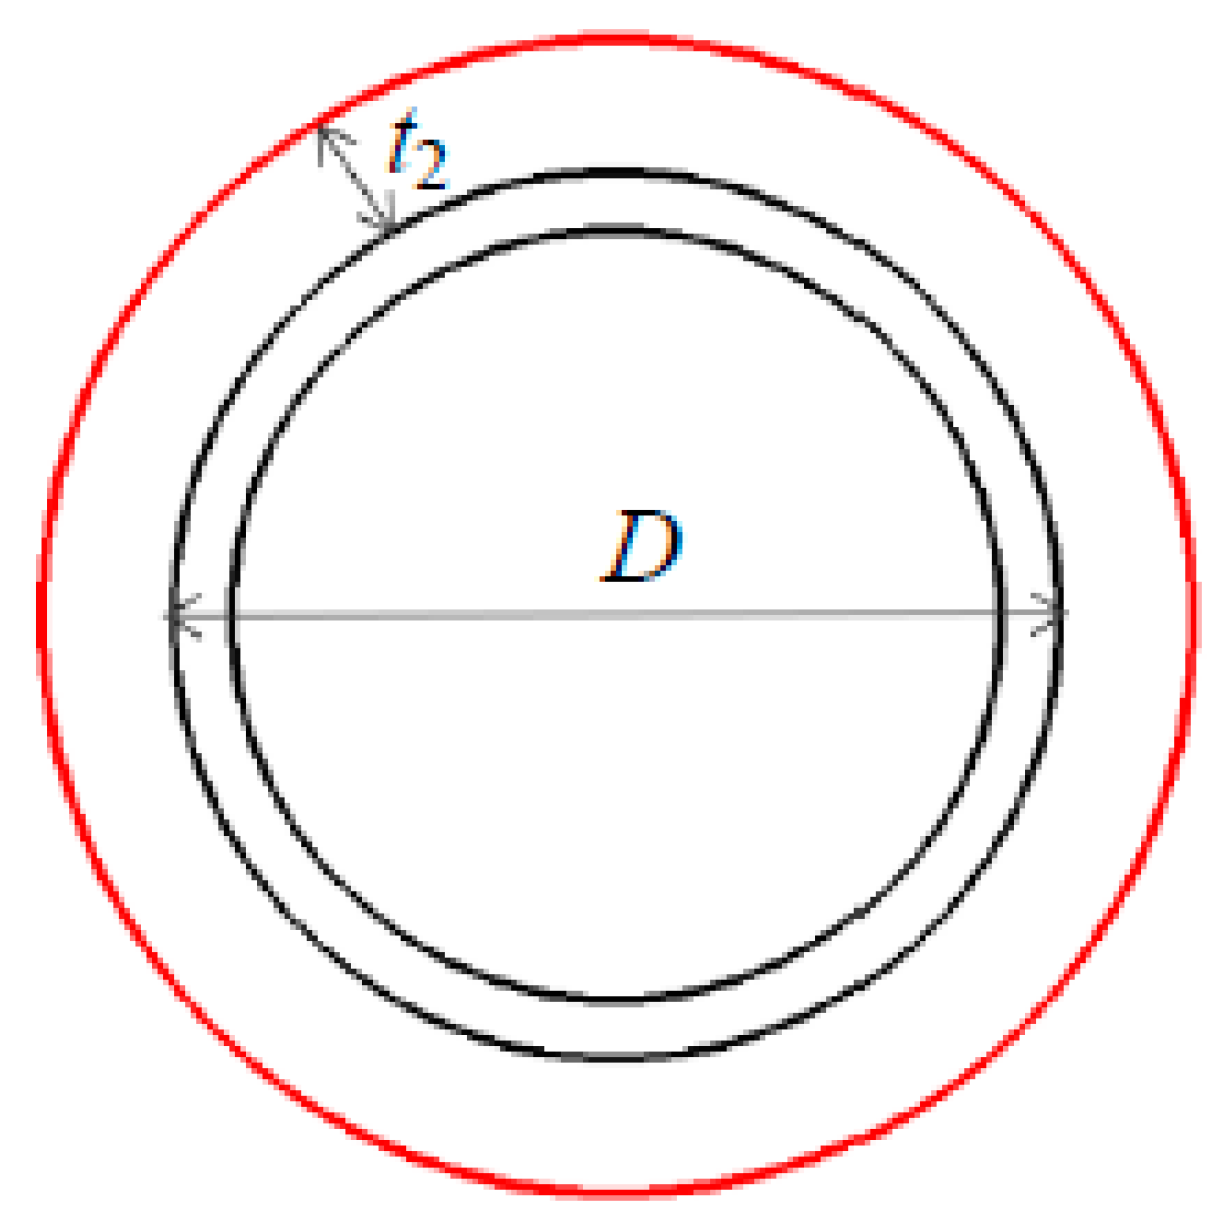
| D | outer diameter of the steel part of the pipeline |
| E | Young’s modulus |
| EI | flexural rigidity of the pipeline |
| Fn | normal environmental loading in the section of pipeline |
| Ft | tangential environmental loading in the section of pipeline |
| f0 | ovality |
| fu | tensile strength to be used in design |
| fy | yield stress to be used in design |
| IDstress | inner diameter of stress |
| M | bending moment of the section of pipeline |
| N | axial force in the section of pipeline |
| ODstress | outer diameter of stress |
| p0 | external pressure |
| pi | internal pressure |
| pmin | minimum internal pressure |
| q | gravity of unit length of the pipeline in the sea |
| Q | shear force in the section of pipeline |
| s | length of the pipeline |
| t1 | pipeline wall thickness |
| t2 | thickness of coating layer |
| u | transverse displacement of the pipeline |
| v | axial displacement of the pipeline |
| Vc | velocity of ocean current |
| αfab | fabrication factor |
| αpm | plastic moment reduction factor for point loads |
| γm | material resistance factor |
| γsc | safety class resistance factor |
| ρs | density of seawater |
| θ | inclination angle of the section of pipeline |
| σ1 | axial stress |
| σ2 | radial stress |
| σ3 | hoop stress |
References
- Wang, S.H.; Lu, B.B.; Yin, K.D. Financial development, productivity, and high-quality development of the marine economy. Mar. Policy 2021, 130, 104553. [Google Scholar] [CrossRef]
- Peng, D.M.; Yang, Q.; Yang, H.J.; Liu, H.H.; Zhu, Y.G.; Mu, Y.T. Analysis on the relationship between fisheries economic growth and marine environmental pollution in China’s coastal regions. Sci. Total Environ. 2020, 713, 136641. [Google Scholar] [CrossRef] [PubMed]
- Cherepovitsyn, A.; Rutenko, E.; Solovyova, V. Sustainable development of oil and gas resources: A system of environmental, socio-economic, and innovation indicators. J. Mar. Sci. Eng. 2021, 9, 1307. [Google Scholar] [CrossRef]
- Wang, Y.; Zhang, Z.K.; Xu, M.H. Evolution pattern of African countries’ oil trade under the changing in the global oil market. Energy 2023, 284, 128656. [Google Scholar] [CrossRef]
- Koley, S.; Panduranga, K.; Trivedi, K.; Al-Ragum, A.; Neelamani, S. Numerical and experimental modeling of wave-induced forces on submarine pipeline buried in the soil of different engineering properties. Ocean Eng. 2023, 273, 113941. [Google Scholar] [CrossRef]
- Guo, X.S.; Stoesser, T.; Nian, T.K.; Jia, Y.G.; Liu, X.L. Effect of pipeline surface roughness on peak impact forces caused by hydrodynamic submarine mudflow. Ocean Eng. 2022, 243, 110184. [Google Scholar] [CrossRef]
- Zhang, B.; Gong, R.; Wang, T.; Wang, Z. Causes and treatment measures of submarine pipeline free-spanning. J. Mar. Sci. Eng. 2020, 8, 329. [Google Scholar] [CrossRef]
- Gong, S.F.; Zhang, T.; Wang, X.P.; Liu, C.B. Numerical simulation on dynamic behaviour of deepwater J-lay systems. Ocean Eng. 2020, 196, 106771. [Google Scholar] [CrossRef]
- Gu, J.J.; Huang, J.; Xu, X.; Gao, L.; Chen, L.L.; Jia, J.C.; Levi, C. Parametric analysis for free standing riser by a new calculation procedure. Ocean Eng. 2021, 242, 110144. [Google Scholar] [CrossRef]
- Hu, B.; Wang, Z.W.; Du, H.W.; Carriveau, R.; Ting DS, K.; Xiong, W.; Wang, Z.W. Response characteristics of flexible risers in offshore compressed air energy storage systems. J. Mar. Sci. Appl. 2019, 18, 353–365. [Google Scholar] [CrossRef]
- Wang, F.C.; Chen, J.; Gao, S.; Tang, K.; Meng, X.W. Development and sea trial of real-time offshore pipeline installation monitoring system. Ocean Eng. 2017, 146, 468–476. [Google Scholar] [CrossRef]
- Wang, Y.Y.; Tuo, H.H.; Li, L.W.; Zhao, Y.; Qin, H.; An, C. Dynamic simulation of installation of the subsea cluster manifold by drilling pipe in deep water based on Orcaflex. J. Pet. Sci. Eng. 2018, 163, 67–78. [Google Scholar] [CrossRef]
- Triantafyllaki, A.; Loukidis, D.; Papanastasiou, P. Design of offshore gas pipelines against active tectonic fault movement. Soil Dyn. Earthq. Eng. 2023, 166, 107702. [Google Scholar] [CrossRef]
- Fu, C.W.; Nian, T.K.; Guo, X.S.; Gu, Z.D.; Zheng, D.F. Investigation on responses and capacity of offshore pipelines subjected to submarine landslides. Appl. Ocean Res. 2021, 117, 102904. [Google Scholar] [CrossRef]
- Liu, X.B.; Zhang, H.; Wu, K.; Zheng, Q.; Li, Y.; Ndubuaku, O.; Adeeb, S. A refined analytical strain analysis method for offshore pipeline under strike-slip fault movement considering strain hardening effect of steel. Ships Offshore Struct. 2020, 15, 215–226. [Google Scholar] [CrossRef]
- Rajeev, P.; Robert, D.J. Effect of irregular seabed profile on upheaval buckling of buried offshore pipelines. J. Pipeline Syst. Eng. Pract. 2017, 8, 04017017. [Google Scholar] [CrossRef]
- Zhang, Y.; Wang, Z.T.; Yang, Q.; Wang, H.Y. Numerical analysis of the impact forces exerted by submarine landslides on pipelines. Appl. Ocean Res. 2019, 92, 101936. [Google Scholar] [CrossRef]
- Rao, N.R.; Kaliveeran, V. Finite element modeling and experimental validation of rectangular pin buckle arrestors for offshore pipelines. Mech. Based Des. Struct. Mach. 2022, 50, 651–671. [Google Scholar] [CrossRef]
- Du, H.W. Static analysis and verification of flexible riser for underwater compressed air energy storage system with different boundary conditions. Ships Offshore Struct. 2022, 17, 1427–1436. [Google Scholar] [CrossRef]
- Liang, H.; Zhao, Y.; Yue, Q.J. Experimental study on dynamic interaction between pipe and rollers in deep S-lay. Ocean Eng. 2019, 175, 188–196. [Google Scholar] [CrossRef]
- Eidsvik OA, N.; Schjølberg, I. Finite element cable-model for Remotely Operated Vehicles (ROVs) by application of beam theory. Ocean Eng. 2018, 163, 322–336. [Google Scholar] [CrossRef]
- Xiao, Y.Y.; Wu, Z.W.; Wang, T.C.; Gary, A.; Ni, P.P.; Mei, G.X. Experimental and numerical investigation on hydrodynamic behavior of a long curved pipeline system with multiple floating bodies in immersion construction. Ocean Eng. 2023, 270, 113629. [Google Scholar] [CrossRef]
- Shin, M.B.; Park, D.S.; Seo, Y.K. Response of subsea pipelines to anchor impacts considering pipe–soil–rock interactions. Int. J. Impact Eng. 2020, 143, 103590. [Google Scholar] [CrossRef]
- Song, Q.H.; Jiang, H.Y.; Song, Q.J.; Xiao, L.J.; Wang, Y. Study on vessel–pipe coupling dynamic behavior under regular waves in deep sea mining process. Ocean Eng. 2022, 244, 110401. [Google Scholar] [CrossRef]
- Plunkett, R. Static bending stresses in catenaries and drill strings. J. Eng. Ind. 1967, 89, 31–36. [Google Scholar] [CrossRef]
- Dareing, D.W.; Neathery, R.F. Marine pipeline analysis based on Newton’s method with an arctic application. J. Eng. Ind. 1970, 92, 827–833. [Google Scholar] [CrossRef]
- Pedersen, P.T. Equilibrium of offshore cables and pipelines during laying. Int. Shipbuild. Prog. 1975, 22, 399–408. [Google Scholar] [CrossRef]
- Datta, T.K.; Basu, A.K. Stress analysis of submarine pipelines. Proc. Inst. Civ. Eng. 1977, 63, 833–841. [Google Scholar] [CrossRef]
- Andreuzzi, F.; Maier, G. Simplified analysis and design of abandonment and recovery of offshore pipelines. Ocean Manag. 1981, 7, 211–230. [Google Scholar] [CrossRef]
- Guarracino, F.; Mallardo, V. A refined analytical analysis of submerged pipelines in seabed laying. Appl. Ocean Res. 1999, 21, 281–293. [Google Scholar] [CrossRef]
- Lenci, S.; Callegari, M. Simple analytical models for the J-lay problem. Acta Mech. 2005, 178, 23–39. [Google Scholar] [CrossRef]
- Cheng, E.; Polak, M.A. Theoretical model for calculating pulling loads for pipes in horizontal directional drilling. Tunn. Undergr. Space Technol. 2007, 22, 633–643. [Google Scholar] [CrossRef]
- Szczotka, M. A modification of the rigid finite element method and its application to the J-lay problem. Acta Mech. 2011, 220, 183–198. [Google Scholar] [CrossRef]
- Ruan, W.; Bai, Y.; Cheng, P. Static analysis of deepwater lazy-wave umbilical on elastic seabed. Ocean Eng. 2014, 91, 73–83. [Google Scholar] [CrossRef]
- Trapper, P.A. Feasible numerical method for analysis of offshore pipeline in installation. Appl. Ocean Res. 2019, 88, 48–62. [Google Scholar] [CrossRef]
- Xu, P.; Du, Z.X.; Huang, F.Y.; Javanmardi, A. Numerical simulation of deepwater S-lay and J-lay pipeline using vector form intrinsic finite element method. Ocean Eng. 2021, 234, 109039. [Google Scholar] [CrossRef]
- Li, X.M.; Guo, X.L.; Guo, H.Y. Vector form intrinsic finite element method for nonlinear analysis of three-dimensional marine risers. Ocean Eng. 2018, 161, 257–267. [Google Scholar] [CrossRef]
- Gu, H.L.; Guo, H.Y.; Li, X.M.; Li, F.H. Static behaviours and collision onset criterion of two adjacent vertical risers. Ships Offshore Struct. 2023, 18, 263–271. [Google Scholar] [CrossRef]
- Kim, H.S.; Kim, B.W. An efficient linearised dynamic analysis method for structural safety design of J-lay and S-lay pipeline installation. Ships Offshore Struct. 2019, 14, 204–219. [Google Scholar] [CrossRef]
- Mao, L.J.; Zeng, S.; Liu, Q.Y.; Wang, G.R.; He, Y.F. Dynamical mechanics behavior and safety analysis of deep water riser considering the normal drilling condition and hang-off condition. Ocean Eng. 2020, 199, 106996. [Google Scholar] [CrossRef]
- Ruan, W.D.; Shang, Z.H.; Wu, J.G. Effective static stress range estimation for deepwater steel lazy-wave riser with vessel slow drift motion. Ships Offshore Struct. 2019, 14, 899–909. [Google Scholar] [CrossRef]
- Tian, D.Q.; Fan, H.H.; Leira, B.J.; Sævik, S. Study on the static behavior of installing a deep-water drilling riser on a production platform. J. Pet. Sci. Eng. 2020, 185, 106652. [Google Scholar] [CrossRef]
- Tian, D.Q.; Fan, H.H.; Leira, B.J.; Sævik, S.; Fu, P. Static analysis of interaction between two adjacent top tensioned risers with consideration of wake effects. Ocean Eng. 2020, 195, 106662. [Google Scholar] [CrossRef]
- DNVGL-ST-F101; Submarine Pipeline Systems. DNV: Oslo, Norway, 2017.
- Lin, Z.H.; Zan, X.X. Numerical study on load characteristics by internal solitary wave on cylinder sections at different depth and its parameterization. Ocean Eng. 2021, 219, 108343. [Google Scholar] [CrossRef]
- Taylor, P.H.; Santo, H.; Choo, Y.S. Current blockage: Reduced Morison forces on space frame structures with high hydrodynamic area, and in regular waves and current. Ocean Eng. 2013, 57, 11–24. [Google Scholar] [CrossRef]
- Terro, M.J.; Abdel-Rohman, M. Wave induced forces in offshore structures using linear and nonlinear forms of Morison’s equation. J. Vib. Control 2007, 13, 139–157. [Google Scholar] [CrossRef]
- Xie, W.D.; Liang, Z.L.; Jiang, Z.Y.; Pan, J.H.; Hu, Z.Y.; Cabrera, J. A study on the dynamic responses of a steel catenary riser transporting varying-density flow and subjected to regular waves. Ocean Eng. 2022, 265, 112670. [Google Scholar] [CrossRef]
- Vedeld, K.; Sollund, H.A.; Fyrileiv, O.; Collbery, L.; Aamlid, O. Effective axial force in multi-layered cylinders with applications to insulated offshore pipelines. Eng. Struct. 2018, 172, 55–65. [Google Scholar] [CrossRef]
- Zhang, J.; Xie, R. Mechanical behavior analysis of suspended pipelines caused by ground subsidence. J. Pipeline Syst. Eng. Pract. 2021, 12, 04021030. [Google Scholar] [CrossRef]
- Zhao, J.H.; Liao, K.X.; Li, X.X.; He, G.X.; Xia, F.; Zeng, Q. Collaborative detection and on-line monitoring of pipeline stress in oil and gas stations. Meas. Sci. Technol. 2022, 33, 105001. [Google Scholar] [CrossRef]
- Orcina Ltd. Visual Orcaflex User Manual; Orcina Ltd.: Ulverston, UK, 2019. [Google Scholar]


| Descriptions | Values |
|---|---|
| Structural material | Steel |
| Classification | X65 |
| Outer diameter (m) | 1.2 |
| Wall thickness (m) | 0.03 |
| Density (kg/m3) | 7850 |
| Young’s modulus (Pa) | 2.07 × 10¹¹ |
| Poisson’s ratio | 0.3 |
| Yield stress (Pa) | 448 × 106 |
| Tensile strength (Pa) | 531 × 106 |
| Weight coating material | Concrete |
| Density of weight coating (kg/m3) | 3044 |
| Thickness of weight coating (m) | 0.12 |
| Content | Air |
| Descriptions | Value |
|---|---|
| Ovality, | 0 |
| Material resistance factor, | 1.15 |
| Safety class resistance factor, | 1.26 |
| Fabrication factor, | 0.93 |
| Plastic moment reduction factor, | 1 |
| Descriptions | Analytical Model | FEM Used by Orcaflex | Relative Error (%) |
|---|---|---|---|
| Length of lifting part (m) | 137.2 | 134.3 | 2.2 |
| Height of pipeline head (m) | 13.6 | 13.4 | 1.5 |
| Declination of pipeline head (deg) | 9.0 | 9.1 | 1.1 |
| Peak value of maximum von Mises stress (Pa) | 289.5 × 10⁶ | 288.4 × 10⁶ | 0.4 |
| Peak value of LCC | 0.469 | 0.472 | 0.6 |
Disclaimer/Publisher’s Note: The statements, opinions and data contained in all publications are solely those of the individual author(s) and contributor(s) and not of MDPI and/or the editor(s). MDPI and/or the editor(s) disclaim responsibility for any injury to people or property resulting from any ideas, methods, instructions or products referred to in the content. |
© 2023 by the authors. Licensee MDPI, Basel, Switzerland. This article is an open access article distributed under the terms and conditions of the Creative Commons Attribution (CC BY) license (https://creativecommons.org/licenses/by/4.0/).
Share and Cite
Wang, Z.; Chen, Y.; Gao, Q.; Li, F. An Analytical Method for Mechanical Analysis of Offshore Pipelines during Lifting Operation. Materials 2023, 16, 6685. https://doi.org/10.3390/ma16206685
Wang Z, Chen Y, Gao Q, Li F. An Analytical Method for Mechanical Analysis of Offshore Pipelines during Lifting Operation. Materials. 2023; 16(20):6685. https://doi.org/10.3390/ma16206685
Chicago/Turabian StyleWang, Zhongxiao, Yongxin Chen, Qingyou Gao, and Fengming Li. 2023. "An Analytical Method for Mechanical Analysis of Offshore Pipelines during Lifting Operation" Materials 16, no. 20: 6685. https://doi.org/10.3390/ma16206685
APA StyleWang, Z., Chen, Y., Gao, Q., & Li, F. (2023). An Analytical Method for Mechanical Analysis of Offshore Pipelines during Lifting Operation. Materials, 16(20), 6685. https://doi.org/10.3390/ma16206685