Article

CO2 Physisorption over an Industrial Molecular Sieve Zeolite: An Experimental and Theoretical Approach

by
Anastasios I. Tsiotsias
,
Amvrosios G. Georgiadis
,
Nikolaos D. Charisiou
and
Maria A. Goula
*
Laboratory of Alternative Fuels and Environmental Catalysis (LAFEC), Department of Chemical Engineering, University of Western Macedonia, GR-50100 Kozani, Greece
*
Author to whom correspondence should be addressed.
These authors contributed equally to this work.
Materials 2023, 16(20), 6656; https://doi.org/10.3390/ma16206656
Submission received: 12 September 2023 / Revised: 6 October 2023 / Accepted: 10 October 2023 / Published: 11 October 2023

Abstract

:
The present work studies the adsorption of CO2 using a zeolitic industrial molecular sieve (IMS) with a high surface area. The effect of the CO2 feed concentration and the adsorption temperature in conjunction with multiple adsorption–desorption cycles was experimentally investigated. To assess the validity of the experimental results, theoretical calculations based on well-established equations were employed and the values of equilibrium, kinetic, and thermodynamic parameters are presented. Three additional column kinetic models were applied to the data obtained experimentally, in order to predict the breakthrough curves and thus facilitate process design. Results showed a negative correlation between temperature and adsorption capacity, indicating that physical adsorption takes place. Theoretical calculations revealed that the Langmuir isotherm, the Bangham kinetic model (i.e., pore diffusion is the rate-determining step), and the Thomas and Yoon–Nelson models were suitable to describe the CO2 adsorption process by the IMS. The IMS adsorbent material maintained its high CO2 adsorption capacity (>200 mg g−1) after multiple adsorption–desorption cycles, showing excellent regenerability and requiring only a mild desorption treatment (200 °C for 15 min) for regeneration.

Graphical Abstract

1. Introduction

The removal of CO2 from flue gases has gained great significance during the attempt to decarbonize our economy, since the remaining emitters and hard-to-decarbonize sectors face increasing demands to cut down on their CO2 output via the integration of carbon capture procedures [1,2,3]. CO2 adsorption from solid materials is regarded as an attractive option due to potential energy savings, with solids such as zeolites, activated carbons, and calcium oxides commonly employed for this purpose (including commercially available solid materials) [4]. A CO2 adsorbent material is typically required to possess an abundance of surface basic sites with a high affinity towards the mildly acidic CO2 molecules [5,6]. Moreover, a high surface area is also desired since it improves the diffusion of CO2 molecules and increases the population of available surface sites for adsorption [7,8]. Microporous materials and, more specifically, zeolites are quite popular for CO2 capture processes due to their ability to adsorb large quantities of CO2 at room temperature, fast uptake kinetics, and regenerability [4,8,9,10,11]. These materials offer a very high surface area and an abundance of CO2-philic sites due to the presence of alkaline counterions that charge-balance the negatively charged Al-sites in the zeolitic framework [8,12,13,14]. Moreover, their structural stability allows for reversible CO2 desorption at higher temperatures and, as such, they can be used in multiple CO2 adsorption–desorption cycles, enabling the cost-effective and efficient capture and release of CO2 that helps reduce the energy requirements during the process [4,10,11,15].
Many research works have been published that utilize novel zeolite materials with great performance during low-temperature CO2 capture [4,7,8,12,13,16,17]. Indicatively, Dabbawala et al. [7] synthesized a hierarchical porous zeolite Y using a mesopore directing template and managed to achieve a CO2 adsorption capacity of approx. 240 mg CO2 per g sorbent at 25 °C and 100 kPa, a 20% increase compared to the non-templated zeolite Y. Shen et al. [16] prepared a lamellar LTA-type zeolite from kaolin and showed that the 2D zeolite LTA could capture more CO2 than the conventional 3D one, and it also presented a high CO2/CH4 selectivity. Moreover, Cavallo et al. [13] tested LTA and clinoptilolite zeolites in shaped form for CO2 capture at various temperatures. LTA could increase its CO2 adsorption capacity following ion-exchange with Ca, while the natural zeolite clinoptilolite could perform better at higher adsorption temperatures, a property that was attributed to its Fe2+ ion content inside the zeolitic framework. Typical commercially available zeolites that have been employed for CO2 adsorption/separation include ZSM-5, Y (NaY), X (NaX), A (NaA), and other synthetic or natural zeolites [18,19,20,21,22,23]. In general, commercial zeolites are also quite effective for CO2 adsorption (for example, 190 mg g−1 CO2 adsorption capacity was achieved using a commercial 13X type zeolite at 30 °C and 1 bar in Ref. [21]), and they are often employed for comparison purposes in works dealing with laboratory synthetized zeolites [19,22] or in works dealing with modelling of CO2 adsorption processes [21,23,24].
The application of theoretical modelling in such adsorption processes is quite important for parameter optimization, and various theoretical models have been previously employed [20,24,25,26,27]. For example, Karka et al. [26] prepared polyethylenimine-modifed zeolite 13x and tested it for CO2 capture while also performing kinetic studies. The CO2 adsorption kinetics could best be described by the Avrami’s fractional order and the dual kinetic model, while intraparticle diffusion was the rate limiting step. Feng et al. [20] modelled the adsorption isotherms of various gases (CO2, CH4, CO, N2, and H2) over a NaY zeolite via the Langmuir, Toth, and Sips equations, while the isosteric heats of adsorption were also calculated via the Clausius–Clapeyron equation. The Toth model was found to be the best fit for CO2 adsorption, while CO2 demonstrated the highest heat of adsorption when compared to the other gases. Regarding the adsorption of gases other than CO2, Georgiadis et al. [27] utilized a commercial LTA-type zeolite with high microporosity, coined as an industrial molecular sieve (IMS), in order to model the room temperature adsorption of H2S, and they found that the adsorption results under varying H2S feed concentrations could best be fitted by the Langmuir isotherm, whereas the Bangham model could better describe the adsorption kinetics, which were limited by pore diffusion.
In short, zeolite-based materials (commercial, natural, and synthetic) are commonly studied for CO2 adsorption because they are considered to be high-performance and cost-efficient adsorbents with high CO2 adsorption capacity and fast adsorption kinetics, whereas the temperature of adsorption and efficient adsorbent regeneration are considered some areas that are worthy of further investigation [4,8,9,11]. Furthermore, the combination of experimental adsorption results over commonly available and inexpensive zeolite-based materials with theoretical modelling results is very important, since it allows for the theoretical model validation and parametric optimization of CO2 adsorption processes, which is a crucial step towards the design of efficient sorption reactors for practical applications [23,24,27,28].
Based on the excellent adsorption characteristics of the commercial IMS zeolitic material utilized in our previous work [27], we herein employed it again in order to study the physical adsorption of CO2 from diluted gas streams and corroborate the experimental results with the ones obtained from computational modelling, taking into account various models and using nonlinear fitting methods (Python). The Python’s curve_fit function that we used herein is an effective tool for curve fitting in many situations and is based on powerful optimization algorithms. Furthermore, contrary to the most frequently used linear methods that may introduce inaccuracies and error propagation, the non-linear approaches employed in this study for the statistical analysis can provide more accurate results. Dynamic adsorption tests (breakthrough experiments) were performed under a varying feed CO2 partial pressure and the results were fitted to an adsorption isotherm model. The kinetics and thermodynamics of the adsorption process were also studied under different CO2 adsorption temperatures, while three column kinetic models were applied to the experimental data. Finally, the adsorbent was studied under multiple CO2 adsorption–desorption cycles, showing the ability to fully regenerate (i.e., recover its initial CO2 adsorption capacity) following a mild desorption treatment (200 °C, 15 min). This work therefore contributes to the fundamental understanding of CO2 adsorption processes over inexpensive zeolite-type materials, investigates the effect of CO2 feed partial pressure and adsorption temperature, and is expected to be useful for researchers working in the field of modelling CO2 adsorption processes.

2. Materials and Methods

2.1. Adsorbent Material

An industrial molecular sieve (IMS) material (Merck) with a zeolitic structure was used for the CO2 adsorption tests. The physicochemical properties of this silicon–aluminum and alkali–metallic sorbent are presented in Table 1. Detailed information regarding the structural and textural characteristics and physicochemical properties obtained from X-ray diffraction (XRD), N2 adsorption–desorption, and scanning emission microscopy along with energy-dispersive X-ray spectroscopy (SEM-EDX) can be found in Ref. [27]. In short, the zeolite structure corresponds to an LTA-type zeolite (3A or 4A) with well-shaped cubic crystallites (1.5–2 μm). The Si/Al ratio was found to be 0.97 (very close to 1, typical for LTA-type zeolites), while the detected elements by SEM-EDX were Al, Si, Ca, Na, and O, as well as traces of Mg (the majority of counterions were Ca2+). The zeolite mostly consists of micropores (possibly also a limited presence of mesopores), displays a Type I N2 adsorption–desorption isotherm, and has a specific surface area of approx. 590 m2 g−1 with an average pore size of 1.73 nm.

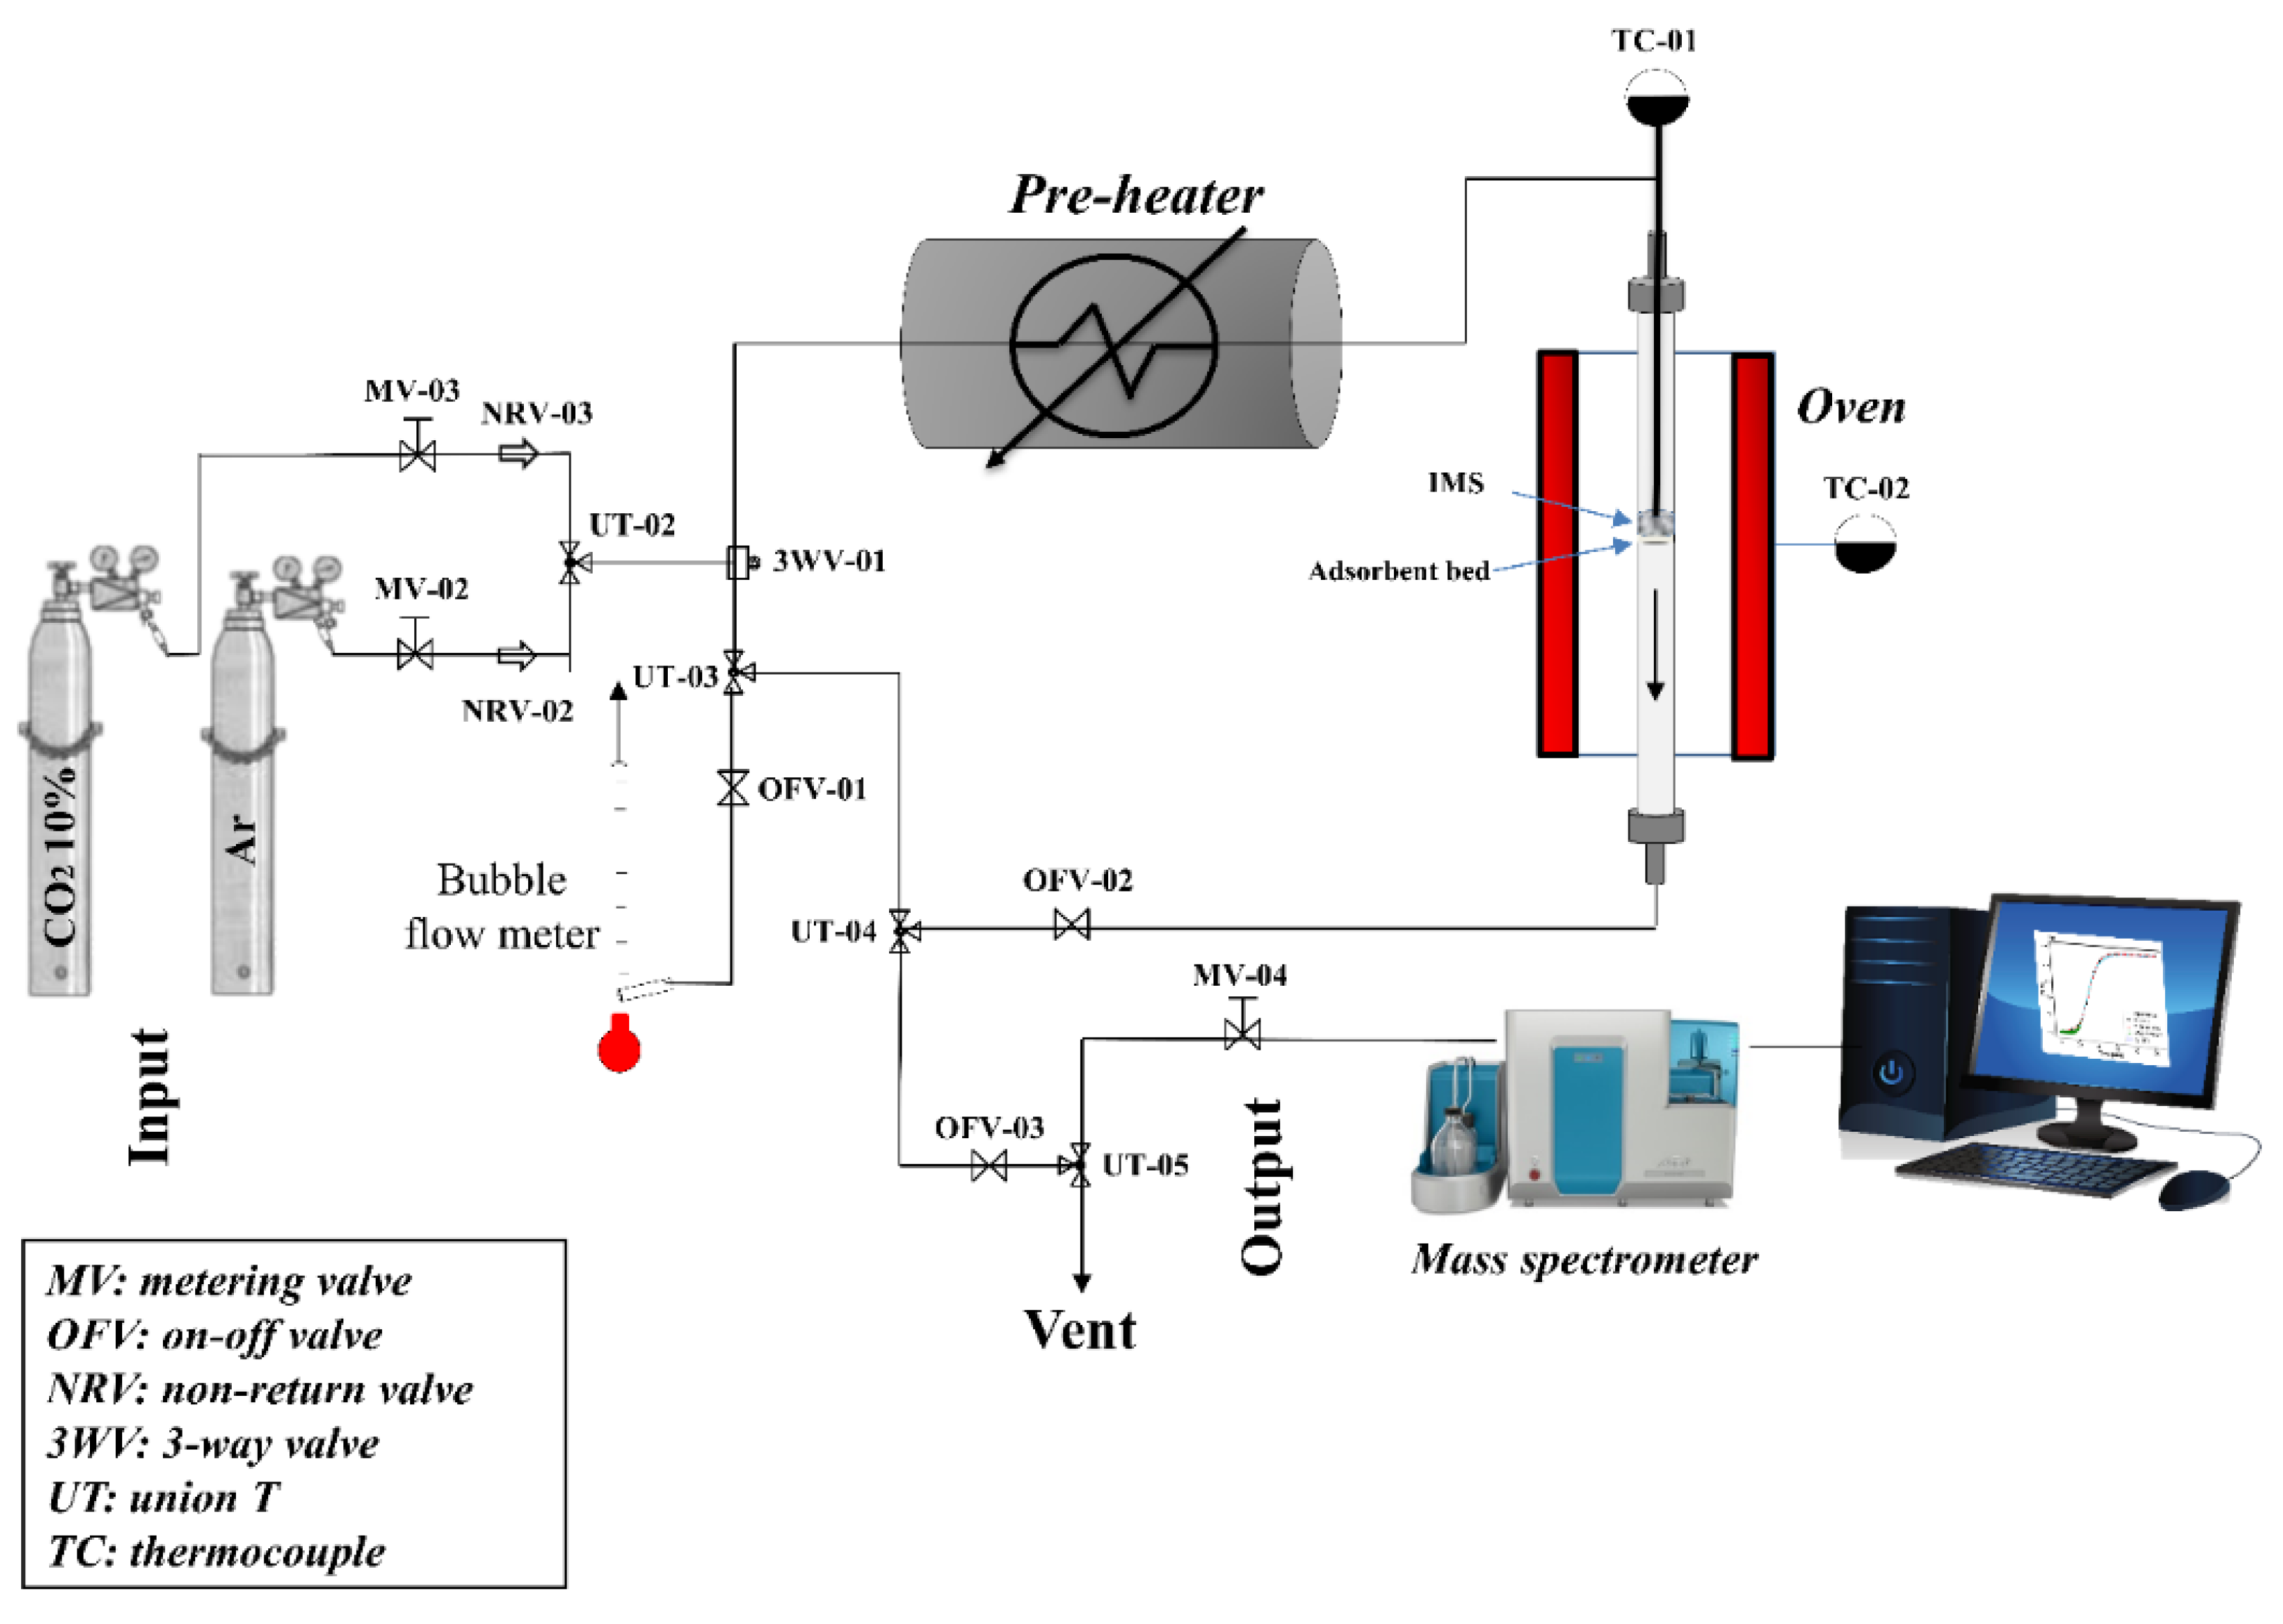
2.2. CO2 Adsorption Tests

The dynamic CO2 adsorption tests were conducted in a fixed-bed quartz reactor (length: 40 cm, internal diameter: 0.9 cm), which was placed inside an electrical furnace. The schematic of the testing apparatus can be found in Figure 1. The bed height was approximately 2 cm, and it was made by packing 1.0 g of the sorbent material along with inert quartz wool for all the adsorption tests. To measure the temperature, a centered K-type thermocouple was located within the bed. Another K-type thermocouple was responsible for controlling the temperature of the reactor furnace.
The gases used were 10% CO2/Ar and Ar (5.0). Gas flows were adjusted by both metering valves (SS) and mass flow controllers. A bubble flowmeter was used to carefully measure the gas flows prior to the initiation of each adsorption test. The analysis was performed on a QMS 300 Prisma mass spectrometer (Pfeiffer vacuum, Aßlar, Germany) to ensure immediate and continuous monitoring for CO2 concentrations at the reactor outlet.
To evaluate the CO2 adsorption capacity of the IMS adsorbent under atmospheric pressure, numerous CO2 breakthrough tests were carried out through altering parameters such as the gas feed CO2 volume concentration (i.e., 0.2%, 0.5%, 1%, 2%, 5%, 10%, 20%, 50%, and 100%) and the adsorption temperature (i.e., 25 °C, 35 °C, 50 °C, and 100 °C) while keeping the overall flow rate at 100 mL min−1.
Before the experiments commenced, an activation procedure was applied, where the sorbent was pretreated at 300 °C under a flow of Ar in order to ensure that moisture and other adsorbed gaseous impurities (incl. CO2) were removed. After cooling down the reactor to the required temperature, a CO2/Ar mixture (100 mL min−1 total flow rate) was flown through the adsorbent bed. The CO2 adsorption capacity was estimated by the following equation [29]:
q t = C in F in W a d s 0 t 1 C t C 0 d t
where the integral term provides the adsorption time in minutes. In addition, q t (mg g−1) is the adsorbed quantity of CO2, Cin (mg mL−1) is the CO2 concentration in the bed entry, F i n is the total flow rate at the bed entry (mL min−1), and W a d s is the weight of the adsorbent.
The breakthrough experiments were continued until the value of C t / C 0 was the one implying the equilibrium of the system, whereas the breakpoint was assumed to occur when the ratio of C t / C 0 reached the value of 0.05. The regeneration ability of the material was also assessed after undergoing ten adsorption–desorption cycles, with the desorption temperature being 200 °C with a 15 min hold time.

3. Results and Discussion

3.1. Effect of the CO2 Feed Concentration

Investigating the effect of CO2 feed concentration is crucial for process optimization purposes and the designing of cost-effective and efficient adsorption systems [30,31]. Moreover, different types of flue gases contain a different CO2 concentrations (or CO2 partial pressures) [32]. As such, a high-performing adsorbent should be able to efficiently capture CO2 even at low CO2 partial pressures [31,33]. The CO2 feed concentration (or pressure) variation also allows us to draw conclusions regarding the CO2 adsorption isotherm [7]. That said, the effect of the CO2 feed concentration was studied for the IMS molecular sieve in the range of 0.2 vol% to 100 vol% at ambient temperature and pressure with 100 mL min−1 of total flow. Figure 2a displays the different concentration profiles tested. In line with the literature, higher CO2 concentrations were associated with shorter breakthrough times and steeper breakthrough curves, since the available adsorption sites were saturated faster due to the increased driving force along the pores [27,31,34]. The highest CO2 adsorption capacity was recorded at the highest concentration tested (i.e., 205 mg g−1 at pure CO2 flow), a relatively high value for a zeolite-based adsorbent [8], whilst the lowest one was obtained at 0.2 vol% of CO2 (i.e., 53 mg g−1). Practically, the isotherm reached a plateau for concentrations values that exceeded 10 vol% of CO2 with insignificant changes in the adsorption capacity from that point on (Figure 2b).
In general, a higher CO2 feed concentration (or CO2 feed partial pressure) can increase the driving force of the CO2 gas flow along the pores of the sorbent and thermodynamically favor the CO2 adsorption process, which, in turn, can a result in higher CO2 uptake values, a behavior that is evident from the steeper breakthrough curves for higher CO2 vol% concentrations (i.e., faster and more complete saturation of adsorption active sites) [27,31,34]. Since the adsorption active sites have a finite capacity, it means that they can only adsorb a certain amount of adsorbate molecules before becoming saturated [27,31]. Moreover, from a mathematical point view, when the independent variable (i.e., CO2 feed concentration) stops affecting the dependent variable (i.e., CO2 adsorption capacity), it suggests that the relationship between the two variables has likely reached a point of equilibrium or saturation. A detailed representation of the results obtained from this series of adsorption tests can be found in Table 2.
Subsequently, in order to optimize the design of the adsorption system by establishing the most suitable correlations for the equilibrium curves, four different adsorption isotherm models (i.e., Langmuir, Freundlich, Temkin, and Dubinin–Radushkevich (DR)), which are typically used for low-temperature adsorption processes, were applied (Figure 2b) [23,27]. Unlike the frequently used linearized forms of these equations, which may increase the propagate errors to the dependent and independent variables, nonlinear methods (Python) were adopted in order to provide more accurate estimations [35,36,37]. In addition, in order to assess the applicability of each model, R a d j 2 , which is a modified version of R 2 , was used in order to better express the correlation by also considering the number of independent variables that are added to a particular model. R a d j 2 is given by:
R a d j 2 = 1 1 R 2 n 1 n p 1
where R 2 is the R square, n is the number of rows in the data set, and p is the number of predictors.
The Langmuir equation is defined as [38,39]:
q e = K L q m a x , L C e 1 + K L C e
where K L is the Langmuir constant, and q m a x , L is the theoretically estimated CO2 uptake. Note that the Langmuir isotherm characteristic form, which is usually obtained when monolayer surface coverage takes place, can also be met in the case of microporous sorbents due to the micropore volume-filling process [40,41].
The Freundlich equation is represented as [38,39]:
q e = K F C e 1 / n F
where K F is the Freundlich constant and n F is an indicator of the intensity of adsorption. In particular, a more intense interaction between the adsorbate and the adsorbent can be assumed for higher n F values.
The Temkin equation is expressed as [38,39]:
q e = R T B T l n A T C e
where A T corresponds to the equilibrium binding constant, while B T corresponds to the Temkin constant, which is related to the heat of adsorption. The literature mentions that physical adsorption predominates for heat adsorption values that are lower than 20 kJ mol−1 [42].
The DR equation is reflected as [38,39]:
q e = q m a x , D R e K D R R T l n 1 + 1 / C e 2
where K D R is the DR constant that is related to the mean free energy of the adsorption process, and q m a x , D R is the CO2 adsorption capacity calculated theoretically. As it concerns the mean free adsorption energy, E M , it is described as [27]:
E M = 1 2 K D R 0.5
E M values lower that 8 kJ mol−1 suggest that the process is governed by physical adsorption phenomena (e.g., van der Waals Forces) whereas for E M values exceeding 16 kJ mol−1, chemisorption predominates [27]. Furthermore, q e and C e represent the CO2 adsorption capacity and concentration at equilibrium, respectively, in all equations.
The results of the nonlinear fitting are presented in Table 3 and in Figure 2b. Since the Langmuir model demonstrated the highest R a d j 2 value and the theoretically calculated adsorption capacity (211.8 mg g−1) diverged only by 3% in comparison to the one obtained experimentally (205 mg g−1), it can be assumed that this equation, i.e., Langmuir, can best describe the adsorption isotherm data. The Langmuir isotherm was also found to better describe the CO2 adsorption data in other works in the literature [8,16,23,24,40].

3.2. Effect of the Adsorption Temperature

Generally, it is known that the adsorption temperature plays a crucial role in the adsorption kinetics, which, in turn, have always been considered to be a significant property of a high-performance adsorbent since the residence time required for the process to be completed, the size of the adsorption bed, and, consequently, the unit capital expenses, are intrinsically related to the rate of adsorption [7,17,27,31,43]. The flue gas temperature is also typically higher than ambient, and thus cooling is often required prior to CO2 adsorption [8]. The adsorption temperature variation also allows us to calculate important thermodynamic and kinetic parameters, like the activation energy of the adsorption process, as well as the heat and entropy of adsorption [17,27,43].
The adsorption temperature was varied from 25 °C to 100 °C using a feed gas mixture of 10 vol% CO2/Ar with the flow being 100 mL min−1 (Figure 3a). The observed decreased CO2 adsorption capacity values at higher adsorption temperatures are an indication that electrostatic interactions are rather present (and not strong molecular bonding), as is usually the case during low-temperature CO2 adsorption processes over zeolitic materials [17,22,31,43]. Typically, increasing the adsorption temperature results in increased molecular velocity and, therefore, weaker electrostatic interactions (e.g., ion–dipole or dipole–dipole interactions) [17,27]. These interactions tend to be less significant as the thermal energy of the molecules overcomes the electrostatic forces, which means that a smaller number of adsorbate molecules can be captured by the adsorbent [17,27,31]. The exothermic nature of CO2 adsorption on the zeolitic material (as will be shown later via the negative values of the calculated isosteric heat of adsorption) also means that increasing the adsorption temperature leads to a decrease in the CO2 adsorption capacity [43].
Indeed, at 25 °C, the CO2 adsorption capacity was calculated at 204 mg g−1, whereas at the highest tested temperature (i.e., 100 °C) the adsorbed amount of CO2 fell to 35 mg g−1, which translates to a decrease of 83%. The CO2 adsorption capacities at 35, 50, and 75 °C were calculated at 162, 116, and 65 mg g−1, respectively.
In this sense, in order to delve deeper into the adsorption kinetics of CO2 by the IMS material, and in order to theoretically calculate the activation energy of the process ( k m o d e l vs. T), four different kinetic models were applied (i.e., pseudo-first order (PFO), pseudo-second order (PSO), intraparticle diffusion, also known as Weber–Morris (WM), and Bangham).
The PFO equation is written as [44,45]:
q t = q e , P F O 1 e k P F O t
where q e , P F O is the adsorption capacity calculated theoretically, and k P F O is the rate constant of adsorption for pseudo-first order.
The PSO equation is expressed as:
q t = k P S O q e , P S O 2 t 1 + k P S O q e , P S O t
where q e , P S O represents the adsorption capacity that the model predicts, and k P S O is the rate constant of adsorption for pseudo-second order.
The WM equation is described as:
q t = k W M t 0.5 + C
where k W M is the rate constant of the adsorption process, and C is also a constant.
The Bangham equation is presented as follows:
q t = q e , B 1 e k B t n B
where k B is the rate constant of the corresponding adsorption process, while n also denotes a constant. The Bangham model typically fits the experimental data when the rate limiting step of the adsorption process is pore diffusion (gas diffusion through the pores) [27,46,47,48]. The term q t in all of the above equation represents the amount of CO2 adsorbed at any given time.
The kinetic results obtained from the nonlinear fitting are displayed in Figure 3b and Table 4.
Since the Bangham model exhibits the highest R a d j 2 values, and since the theoretically calculated adsorption capacities, q e , B , only deviate by 0.1–0.3% compared to the ones obtained experimentally, it can be said that it best fits the adsorption data and that the process is controlled by pore diffusion. This is in line with other literature works, where microporous materials are used in physical adsorption processes [27,46,47,48].
Afterwards, the rate constants, k B , of the best-fitted Bangham model at various temperatures were used to calculate the activation energy of the adsorption process via the nonlinear modified Arrhenius equation (Equation (12)) [27]. The activation energy value was calculated as 32.9 kJ mol−1, whilst R a d j 2 was 0.984. This is a relatively low value, in line with other works in the literature regarding CO2 physical adsorption [43,49,50].
k B = A e E a R 1 T 1 T a v e r a g e
Thermodynamic parameters, like the heat and the entropy of adsorption, were then calculated through the Van’t Hoff equation. The linear equation used is the following [37]:
l n K D = Δ H o R T + Δ S o R
where K D is defined as the ratio q e / C e .
The slope and the intercept of the above equation provide the values of adsorption enthalpy and adsorption entropy, respectively, given that the high estimated R a d j 2 value (i.e., 0.992) ensures the linear relationship between the dependent and the independent variables. In particular, the calculated values were −21.8 kJ mol−1 for the heat of adsorption, Δ H o , and −71.5 J mol−1 K−1 for the entropy of adsorption, Δ S o . This corroborates, on the one hand, the exothermic nature of the physical adsorption process ( Δ H o < 0) and, on the other hand, the insignificant internal structural changes that the material undergoes during the process. These results seem to be in agreement with those of other literature works, where it is reported that the absolute Δ H o values in physical adsorption processes lie between 20 and 45 kJ mol−1 [17,43,51].

3.3. Column Studies

Three column kinetic models, Adams–Bohart, Thomas and Yoon–Nelson, were then applied to the data obtained experimentally for the prediction of the breakthrough curves using nonlinear methods in order to determine those parameters that are characteristic of the column and that are necessary for the process design of the sorption reactor.
The Adams–Bohart (AB) model is described as [52,53,54]:
C t C 0 = e x p k A B C 0 t k A B N 0 h v
where C 0 , v , and h are the initial concentration, initial flow velocity, and bed height, respectively, whereas k A B is a rate constant, and N 0 is the saturation concentration. To describe the initial part of the breakthrough curve ( C t / C 0 < 0.15 ), this model is quite suitable. It postulates that the adsorption rate is proportional to both the adsorbing species concentration as well as the residual adsorbent capacity.
The Thomas (TH) model is expressed as [53,54]:
C t C 0 = 1 1 + e x p k T H q e , T H W Q k T H C 0 t
where C 0 , Q , and W are the initial concentration, initial flow rate, and weight of the adsorbent, respectively, whilst k T H is a rate constant, and q e , T H is the adsorbate quantity that is adsorbed by the adsorbent. Principally, this model is used to predict the maximum adsorption capacity of an adsorbent and is required for the design of a bed column.
The Yoon–Nelson (YN) model is written as [54,55]:
C t C 0 = e x p k Y N t τ 1 + e x p k Y N t τ
where k Y N is the adsorption dynamic constant, and τ corresponds to the time required for retaining 50% of the initial adsorbate concentration. The advantage of this model lies in its simplicity, given that no detailed data with respect to the adsorbate characteristics, the physical properties of the adsorption column, and the type of the adsorbent are needed. The Yoon–Nelson equation postulates that the rate that the probability of adsorption for each adsorbed species decreases is proportional to the adsorbate breakthrough probability on the adsorbent and the probability of adsorbate retention.
The obtained column data were fitted to the three aforementioned equations (Equations (14)–(16)) using nonlinear methods, and the results are presented in Table 5 and Figure 4. The determined R a d j 2 range from 0.992 to 0.999 indicates a significant correlation between C t / C 0 and t .
By comparing the values of R a d j 2 , it seems that the models of Thomas and Yoon–Nelson better describe the adsorption behavior. Interestingly, the Thomas model predicted the CO2 adsorption capacity of the IMS adsorbent with excellent precision in the case of 5 vol% and 10 vol% CO2 feed concentration, presenting less than 5% deviation between the theoretically and the experimentally obtained values for the equilibrium CO2 adsorption capacity. The predicted CO2 adsorption capacity diverged by 13% when 2 vol% of inlet CO2 concentration was used, which is again a fairly good prediction. Regarding the Yoon–Nelson model, it can be observed that the rate constant, k Y N , was increased and the 50% breakthrough time, τ, was decreased upon increasing the inlet CO2 concentration, as anticipated, meaning that a higher CO2 feed concentration benefits the adsorption kinetics [31]. A good fitting to the aforementioned models has also been reported in other literature works regarding CO2 adsorption [54,56].

3.4. Effect of Multiple Adsorption–Desorption Cycles

Cyclic experiments of adsorption followed by desorption were also conducted for a total of 10 cycles in order to study the stability and regenerability of the IMS adsorbent (Figure 5). The experimental conditions were 10% of inlet CO2 volume concentration in Ar, ambient temperature and pressure, and 100 mL min−1 of total flow. The activation procedure was carried out once at 300 °C prior to the first cycle. Desorption was carried out after each cycle at 200 °C for 15 min under pure Ar flow.
The results revealed that the CO2 adsorption capacity was only slightly altered during the repeated CO2 adsorption–desorption cycles and was kept in the range between 200 and 205 mg g−1 (Table 6), with the small discrepancies between the calculated values being within the experimental error. The difference between the highest and the lowest adsorption capacity value was just 2.1%. As such, great reproducibility of the repeated experiments was ensured by the fact that the obtained values laid well within the corresponding confidence intervals, meaning that the adsorption process is fully reversible.
In general, the mechanism of this reversible CO2 adsorption process is expected to proceed via the formation of linear CO2 molecular species and probably also some weakly-bound and labile carbonate-like complexes in the cavities of the zeolite [57,58]. According to Martin-Calvo et al. [58], the presence of more labile and easy-to-desorb carbonates agrees with the fact that the majority of the alkaline counterions in our zeolite are bivalent calcium ones (according to the SEM-EDX analysis reported in Ref. [27]). This suggested adsorption mechanism corroborates the reversibility of the CO2 adsorption process, as these weakly-adsorbed linear molecular species and/or labile carbonate-like complexes are apparently completely removed following the desorption treatment [19,31]. The process reversibility is also supported by the theoretical calculations, where low values of activation energy and enthalpy of adsorption were found, since, generally, the activation energy and adsorption enthalpy values are indicators of the interaction strength between the adsorbate molecules and the solid adsorbent [43,51,59]. This very high reversibility/stability also means that the desorption treatment does not cause any detrimental structural modifications on the adsorbent material and that it can be used in thermal swing adsorption processes [19,31].

4. Conclusions

In the work presented herein, a commercial LTA-type zeolite material, coined as IMS, was employed during the study of CO2 adsorption. A joint experimental and theoretical approach was adopted to gain insight into the equilibrium, kinetic, thermodynamic, and column design properties of the CO2 adsorption process. The key results are synopsized below:
  • By varying the initial CO2 feed concentration (or partial pressure), it was found that a higher feed concentration led to increased CO2 adsorption capacity. The CO2 adsorption isotherm could best be fitted to a Langmuir type isotherm and reached a plateau for CO2 feed concentrations that exceeded the value of 10 vol%.
  • By varying the CO2 adsorption temperature, it was found that a higher temperature led to decreased CO2 adsorption capacity. This is indicative that CO2 is adsorbed via van der Waals forces, or, rather, via electrostatic interactions (i.e., physical adsorption).
  • The Bangham model (i.e., pore diffusion) could best describe the adsorption kinetic behavior, as is usually the case in physical adsorption processes.
  • The activation energy (Ea) was calculated at 32.9 kJ mol−1 and the adsorption enthalpy (ΔHo) at −21.8 kJ mol−1, indicating that CO2 adsorption over the IMS adsorbent is exothermic.
  • The Thomas and Yoon–Nelson kinetic models were the most suitable to describe the adsorption process of CO2 on the IMS adsorbent during column studies.
  • Lastly, the IMS adsorbent successfully maintained its high adsorption capacity (>200 mg g−1) after 10 consecutive adsorption–desorption cycles, with desorption/regeneration being carried out under mild conditions (200 °C for 15 min).

Author Contributions

Conceptualization, A.I.T., A.G.G., N.D.C. and M.A.G.; methodology, A.I.T. and A.G.G., investigation, A.I.T. and A.G.G.; formal analysis, A.I.T., A.G.G. and N.D.C.; funding acquisition, M.A.G.; writing—review and editing, A.I.T., A.G.G., N.D.C. and M.A.G. All authors have read and agreed to the published version of the manuscript.

Funding

NDC and MAG acknowledge support of this work from the project “Development of new innovative low carbon energy technologies to improve excellence in the Region of Western Macedonia” (MIS 5047197), which is implemented under the Action “Reinforcement of the Research and Innovation Infrastructure” funded by the Operational Program “Competitiveness, Entrepreneurship and Innovation” (NSRF 2014–2020) and co-financed by Greece and the European Union (European Regional Development Fund). AIT thanks the Hellenic Foundation for Research and Innovation (HFRI) for supporting this research work under the 3rd Call for HFRI PhD Fellowships (Fellowship Number: 6033).

Institutional Review Board Statement

Not applicable.

Informed Consent Statement

Not applicable.

Data Availability Statement

The data presented in this study are available on request from the corresponding author.

Conflicts of Interest

The authors declare no conflict of interest.

References

  1. Olabi, A.G.; Abdelkareem, M.A. Renewable Energy and Climate Change. Renew. Sustain. Energy Rev. 2022, 158, 112111. [Google Scholar] [CrossRef]
  2. Koytsoumpa, E.I.; Bergins, C.; Kakaras, E. The CO2 Economy: Review of CO2 Capture and Reuse Technologies. J. Supercrit. Fluids 2018, 132, 3–16. [Google Scholar] [CrossRef]
  3. Latsiou, A.I.; Charisiou, N.D.; Frontistis, Z.; Bansode, A.; Goula, M.A. CO2 Hydrogenation for the Production of Higher Alcohols: Trends in Catalyst Developments, Challenges and Opportunities. Catal. Today 2023, 420, 114179. [Google Scholar] [CrossRef]
  4. Choi, S.; Drese, J.H.; Jones, C.W. Adsorbent Materials for Carbon Dioxide Capture from Large Anthropogenic Point Sources. ChemSusChem 2009, 2, 796–854. [Google Scholar] [CrossRef]
  5. Gouveia, L.G.T.; Agustini, C.B.; Perez-Lopez, O.W.; Gutterres, M. CO2 Adsorption Using Solids with Different Surface and Acid-Base Properties. J. Environ. Chem. Eng. 2020, 8, 103823. [Google Scholar] [CrossRef]
  6. Tsiotsias, A.I.; Charisiou, N.D.; Harkou, E.; Hafeez, S.; Manos, G.; Constantinou, A.; Hussien, A.G.S.; Dabbawala, A.A.; Sebastian, V.; Hinder, S.J.; et al. Enhancing CO2 Methanation over Ni Catalysts Supported on Sol-Gel Derived Pr2O3-CeO2: An Experimental and Theoretical Investigation. Appl. Catal. B Environ. 2022, 318, 121836. [Google Scholar] [CrossRef]
  7. Dabbawala, A.A.; Ismail, I.; Vaithilingam, B.V.; Polychronopoulou, K.; Singaravel, G.; Morin, S.; Berthod, M.; Al Wahedi, Y. Synthesis of Hierarchical Porous Zeolite-Y for Enhanced CO2 Capture. Microporous Mesoporous Mater. 2020, 303, 110261. [Google Scholar] [CrossRef]
  8. Kumar, S.; Srivastava, R.; Koh, J. Utilization of Zeolites as CO2 capturing Agents: Advances and Future Perspectives. J. CO2 Util. 2020, 41, 101251. [Google Scholar] [CrossRef]
  9. Singh, G.; Lee, J.; Karakoti, A.; Bahadur, R.; Yi, J.; Zhao, D.; Albahily, K.; Vinu, A. Emerging Trends in Porous Materials for CO2 Capture and Conversion. Chem. Soc. Rev. 2020, 49, 4360–4404. [Google Scholar] [CrossRef] [PubMed]
  10. Rahmah, W.; Kadja, G.T.M.; Mahyuddin, M.H.; Saputro, A.G.; Dipojono, H.K.; Wenten, I.G. Small-Pore Zeolite and Zeotype Membranes for CO2 Capture and Sequestration—A Review. J. Environ. Chem. Eng. 2022, 10, 108707. [Google Scholar] [CrossRef]
  11. Zagho, M.M.; Hassan, M.K.; Khraisheh, M.; Al-Maadeed, M.A.A.; Nazarenko, S. A Review on Recent Advances in CO2 Separation Using Zeolite and Zeolite-like Materials as Adsorbents and Fillers in Mixed Matrix Membranes (MMMs). Chem. Eng. J. Adv. 2021, 6, 100091. [Google Scholar] [CrossRef]
  12. Murge, P.; Dinda, S.; Roy, S. Zeolite-Based Sorbent for CO2 Capture: Preparation and Performance Evaluation. Langmuir 2019, 35, 14751–14760. [Google Scholar] [CrossRef]
  13. Cavallo, M.; Dosa, M.; Porcaro, N.G.; Bonino, F.; Piumetti, M.; Crocella, V. Shaped Natural and Synthetic Zeolites for CO2 Capture in a Wide Temperature Range. J. CO2 Util. 2023, 67, 102335. [Google Scholar] [CrossRef]
  14. Tsiotsias, A.I.; Charisiou, N.D.; Yentekakis, I.V.; Goula, M.A. The Role of Alkali and Alkaline Earth Metals in the CO2 Methanation Reaction and the Combined Capture and Methanation of CO2. Catalysts 2020, 10, 812. [Google Scholar] [CrossRef]
  15. Georgiadis, A.G.; Charisiou, N.D.; Goula, M.A. Removal of Hydrogen Sulfide from Various Industrial Gases: A Review of the Most Promising Adsorbing Materials. Catalysts 2020, 10, 521. [Google Scholar] [CrossRef]
  16. Shen, J.; Sun, Q.; Cao, J.; Wang, P.; Jia, W.; Wang, S.; Zhao, P.; Wang, Z. A Lamellar Structure Zeolite LTA for CO2 Capture. N. J. Chem. 2022, 46, 6720–6728. [Google Scholar] [CrossRef]
  17. Davarpanah, E.; Armandi, M.; Hernández, S.; Fino, D.; Arletti, R.; Bensaid, S.; Piumetti, M. CO2 Capture on Natural Zeolite Clinoptilolite: Effect of Temperature and Role of the Adsorption Sites. J. Environ. Manag. 2020, 275, 111229. [Google Scholar] [CrossRef] [PubMed]
  18. Li, Y.; Yi, H.; Tang, X.; Li, F.; Yuan, Q. Adsorption Separation of CO2/CH4 Gas Mixture on the Commercial Zeolites at Atmospheric Pressure. Chem. Eng. J. 2013, 229, 50–56. [Google Scholar] [CrossRef]
  19. De Aquino, T.F.; Estevam, S.T.; Viola, V.O.; Marques, C.R.M.; Zancan, F.L.; Vasconcelos, L.B.; Riella, H.G.; Pires, M.J.R.; Morales-Ospino, R.; Torres, A.E.B.; et al. CO2 Adsorption Capacity of Zeolites Synthesized from Coal Fly Ashes. Fuel 2020, 276, 118143. [Google Scholar] [CrossRef]
  20. Feng, L.; Shen, Y.; Wu, T.; Liu, B.; Zhang, D.; Tang, Z. Adsorption Equilibrium Isotherms and Thermodynamic Analysis of CH4, CO2, CO, N2 and H2 on NaY Zeolite. Adsorption 2020, 26, 1101–1111. [Google Scholar] [CrossRef]
  21. Wang, L.; Liu, Z.; Li, P.; Yu, J.; Rodrigues, A.E. Experimental and Modeling Investigation on Post-Combustion Carbon Dioxide Capture Using Zeolite 13X-APG by Hybrid VTSA Process. Chem. Eng. J. 2012, 197, 151–161. [Google Scholar] [CrossRef]
  22. Pham, T.D.; Hudson, M.R.; Brown, C.M.; Lobo, R.F. Molecular Basis for the High CO2 Adsorption Capacity of Chabazite Zeolites. ChemSusChem 2014, 7, 3031–3038. [Google Scholar] [CrossRef] [PubMed]
  23. Shafeeyan, M.S.; Wan Daud, W.M.A.; Shamiri, A. A Review of Mathematical Modeling of Fixed-Bed Columns for Carbon Dioxide Adsorption. Chem. Eng. Res. Des. 2014, 92, 961–988. [Google Scholar] [CrossRef]
  24. Akinola, T.E.; Bonilla Prado, P.L.; Wang, M. Experimental Studies, Molecular Simulation and Process Modelling\simulation of Adsorption-Based Post-Combustion Carbon Capture for Power Plants: A State-of-the-Art Review. Appl. Energy 2022, 317, 119156. [Google Scholar] [CrossRef]
  25. Deng, Z.; Gopalan, A.; Sarkisov, L. In Silico Engineering of Ion-Exchanged Zeolites for High-Performance Carbon Capture in PSA Processes. Chem. Eng. J. 2023, 459, 141597. [Google Scholar] [CrossRef]
  26. Karka, S.; Kodukula, S.; Nandury, S.V.; Pal, U. Polyethylenimine-Modified Zeolite 13X for CO2 Capture: Adsorption and Kinetic Studies. ACS Omega 2019, 4, 16441–16449. [Google Scholar] [CrossRef] [PubMed]
  27. Georgiadis, A.G.; Charisiou, N.D.; Gaber, S.; Polychronopoulou, K.; Yentekakis, I.V.; Goula, M.A. Adsorption of Hydrogen Sulfide at Low Temperatures Using an Industrial Molecular Sieve: An Experimental and Theoretical Study. ACS Omega 2021, 6, 14774–14787. [Google Scholar] [CrossRef]
  28. Won, W.; Lee, S.; Lee, K.S. Modeling and Parameter Estimation for a Fixed-Bed Adsorption Process for CO2 Capture Using Zeolite 13X. Sep. Purif. Technol. 2012, 85, 120–129. [Google Scholar] [CrossRef]
  29. Faria, A.C.; Trujillano, R.; Rives, V.; Miguel, C.V.; Rodrigues, A.E.; Madeira, L.M. Cyclic Operation of CO2 Capture and Conversion into Methane on Ni-Hydrotalcite Based Dual Function Materials (DFMs). J. CO2 Util. 2023, 72, 102476. [Google Scholar] [CrossRef]
  30. Antzaras, A.N.; Heracleous, E.; Lemonidou, A.A. Sorption Enhanced–Chemical Looping Steam Methane Reforming: Optimizing the Thermal Coupling of Regeneration in a Fixed Bed Reactor. Fuel Process. Technol. 2020, 208, 106513. [Google Scholar] [CrossRef]
  31. Raganati, F.; Chirone, R.; Ammendola, P. CO2 Capture by Temperature Swing Adsorption: Working Capacity as Affected by Temperature and CO2 Partial Pressure. Ind. Eng. Chem. Res. 2020, 59, 3593–3605. [Google Scholar] [CrossRef]
  32. Wang, X.; Song, C. Carbon Capture from Flue Gas and the Atmosphere: A Perspective. Front. Energy Res. 2020, 8, 560849. [Google Scholar] [CrossRef]
  33. Li, Z.; Liu, P.; Ou, C.; Dong, X. Porous Metal-Organic Frameworks for Carbon Dioxide Adsorption and Separation at Low Pressure. ACS Sustain. Chem. Eng. 2020, 8, 15378–15404. [Google Scholar] [CrossRef]
  34. Hussin, F.; Aroua, M.K.; Yusoff, R. Adsorption of CO2 on Palm Shell Based Activated Carbon Modified by Deep Eutectic Solvent: Breakthrough Adsorption Study. J. Environ. Chem. Eng. 2021, 9, 105333. [Google Scholar] [CrossRef]
  35. Siakavelas, G.I.; Georgiadis, A.G.; Charisiou, N.D.; Yentekakis, I.V.; Goula, M.A. Cost-Effective Adsorption of Oxidative Coupling-Derived Ethylene Using a Molecular Sieve. Chem. Eng. Technol. 2021, 44, 2041–2048. [Google Scholar] [CrossRef]
  36. Raghav, S.; Kumar, D. Adsorption Equilibrium, Kinetics, and Thermodynamic Studies of Fluoride Adsorbed by Tetrametallic Oxide Adsorbent. J. Chem. Eng. Data 2018, 63, 1682–1697. [Google Scholar] [CrossRef]
  37. Chung Lau, L. Adsorption Isotherm, Kinetic, Thermodynamic and Breakthrough Curve Models of H2S Removal Using CeO2/NaOH/PSAC. Int. J. Petrochem. Sci. Eng. 2016, 1, 00009. [Google Scholar] [CrossRef]
  38. Xiao, Y.; Wang, S.; Wu, D.; Yuan, Q. Experimental and Simulation Study of Hydrogen Sulfide Adsorption on Impregnated Activated Carbon under Anaerobic Conditions. J. Hazard. Mater. 2008, 153, 1193–1200. [Google Scholar] [CrossRef] [PubMed]
  39. Mahmoud, M.A. Kinetics and Thermodynamics of Aluminum Oxide Nanopowder as Adsorbent for Fe (III) from Aqueous Solution. Beni Suef Univ. J. Basic Appl. Sci. 2015, 4, 142–149. [Google Scholar] [CrossRef]
  40. Zito, P.F.; Caravella, A.; Brunetti, A.; Drioli, E.; Barbieri, G. Estimation of Langmuir and Sips Models Adsorption Parameters for NaX and NaY FAU Zeolites. J. Chem. Eng. Data 2015, 60, 2858–2868. [Google Scholar] [CrossRef]
  41. Thommes, M.; Kaneko, K.; Neimark, A.V.; Olivier, J.P.; Rodriguez-Reinoso, F.; Rouquerol, J.; Sing, K.S.W. Physisorption of Gases, with Special Reference to the Evaluation of Surface Area and Pore Size Distribution (IUPAC Technical Report). Pure Appl. Chem. 2015, 87, 1051–1069. [Google Scholar] [CrossRef]
  42. Xie, M.; Leung, A.K.; Ng, C.W.W. Mechanisms of Hydrogen Sulfide Removal by Ground Granulated Blast Furnace Slag Amended Soil. Chemosphere 2017, 175, 425–430. [Google Scholar] [CrossRef] [PubMed]
  43. Jedli, H.; Almoneef, M.M.; Mbarek, M.; Jbara, A.; Slimi, K. Adsorption of CO2 onto Zeolite ZSM-5: Kinetic, Equilibrium and Thermodynamic Studies. Fuel 2022, 321, 124097. [Google Scholar] [CrossRef]
  44. Müller, B.R.; Calzaferri, G. Thin Mo(CO)6-Y-Zeolite Layers: Preparation and in Situ Transmission FTIR Spectroscopy. J. Chem. Soc. Faraday Trans. 1996, 92, 1633–1637. [Google Scholar] [CrossRef]
  45. Mall, I.D.; Srivastava, V.C.; Agarwal, N.K. Adsorptive Removal of Auramine-O: Kinetic and Equilibrium Study. J. Hazard. Mater. 2007, 143, 386–395. [Google Scholar] [CrossRef] [PubMed]
  46. Gong, H.; Liu, W.; Liu, L.; Goyal, N.; Xiao, P.; Li, G.; Wei, Y.; Du, T. In-Situ Synthesis of an Excellent CO2 Capture Material Chabazite. J. Taiwan Inst. Chem. Eng. 2019, 103, 160–166. [Google Scholar] [CrossRef]
  47. Lu, S.; Liu, Q.; Han, R.; Shi, J.; Guo, M.; Song, C.; Ji, N.; Lu, X.; Ma, D. Core-Shell Structured Y Zeolite/Hydrophobic Organic Polymer with Improved Toluene Adsorption Capacity under Dry and Wet Conditions. Chem. Eng. J. 2021, 409, 128194. [Google Scholar] [CrossRef]
  48. Song, T.; Liao, J.M.; Xiao, J.; Shen, L.H. Effect of Micropore and Mesopore Structure on CO2 Adsorption by Activated Carbons from Biomass. N. Carbon Mater. 2015, 30, 156–166. [Google Scholar] [CrossRef]
  49. Singh, V.K.; Kumar, E.A. Comparative Studies on CO2 Adsorption Kinetics by Solid Adsorbents. Energy Procedia 2016, 90, 316–325. [Google Scholar] [CrossRef]
  50. Cheng, H.; Song, H.; Toan, S.; Wang, B.; Gasem, K.A.M.; Fan, M.; Cheng, F. Experimental Investigation of CO2 Adsorption and Desorption on Multi-Type Amines Loaded HZSM-5 Zeolites. Chem. Eng. J. 2021, 406, 126882. [Google Scholar] [CrossRef]
  51. Ridha, F.N.; Webley, P.A. Entropic Effects and Isosteric Heats of Nitrogen and Carbon Dioxide Adsorption on Chabazite Zeolites. Microporous Mesoporous Mater. 2010, 132, 22–30. [Google Scholar] [CrossRef]
  52. Bohart, G.S.; Adams, E.Q. Some Aspects of the Behavior of Charcoal with Respect to Chlorine. J. Am. Chem. Soc. 1920, 42, 523–544. [Google Scholar] [CrossRef]
  53. Han, R.; Wang, Y.; Zhao, X.; Wang, Y.; Xie, F.; Cheng, J.; Tang, M. Adsorption of Methylene Blue by Phoenix Tree Leaf Powder in a Fixed-Bed Column: Experiments and Prediction of Breakthrough Curves. Desalination 2009, 245, 284–297. [Google Scholar] [CrossRef]
  54. Boonchuay, A.; Worathanakul, P. The Diffusion Behavior of CO2 Adsorption from a CO2/N2 Gas Mixture on Zeolite 5A in a Fixed-Bed Column. Atmosphere 2022, 13, 513. [Google Scholar] [CrossRef]
  55. Dima, J.B.; Ferrari, M.; Zaritzky, N. Mathematical Modeling of Fixed-Bed Columns Adsorption: Hexavalent Chromium onto Chitosan Flakes. Ind. Eng. Chem. Res. 2020, 59, 15378–15386. [Google Scholar] [CrossRef]
  56. Deng, Y.; Seville, J.P.K.; Bell, S.D.; Ingram, A.; Zhang, H.; Sweygers, N.; Dewil, R.; Baeyens, J.; Appels, L. Reviewing Fundamental CO2 Adsorption Characteristics of Zeolite and Activated Carbon by In-Situ Measurements with Radioactively Labelled CO2. Sep. Purif. Rev. 2022, 51, 318–329. [Google Scholar] [CrossRef]
  57. Montanari, T.; Busca, G. On the Mechanism of Adsorption and Separation of CO2 on LTA Zeolites: An IR Investigation. Vib. Spectrosc. 2008, 46, 45–51. [Google Scholar] [CrossRef]
  58. Martin-Calvo, A.; Parra, J.B.; Ania, C.O.; Calero, S. Insights on the Anomalous Adsorption of Carbon Dioxide in LTA Zeolites. J. Phys. Chem. C 2014, 118, 25460–25467. [Google Scholar] [CrossRef]
  59. Pokhrel, J.; Bhoria, N.; Wu, C.; Reddy, K.S.K.; Margetis, H.; Anastasiou, S.; George, G.; Mittal, V.; Romanos, G.; Karonis, D.; et al. Cu- and Zr-Based Metal Organic Frameworks and Their Composites with Graphene Oxide for Capture of Acid Gases at Ambient Temperature. J. Solid State Chem. 2018, 266, 233–243. [Google Scholar] [CrossRef]
Figure 1. Experimental layout for the CO2 adsorption tests.
Materials 16 06656 g001
Figure 2. (a) CO2 breakthrough curves for a gas mixture containing CO2/Ar (25 °C, WGHSV = 6000 mL g−1 h−1) at different CO2 feed gas concentrations (i.e., 0.2–10 vol%) and (b) predicted adsorption isotherms (i.e., Langmuir, Freundlich, Temkin, DR).
Materials 16 06656 g002
Figure 3. (a) CO2 breakthrough curves for a gas mixture containing 10 vol% CO2/Ar (1 atm, total flow rate = 100 mL min−1, WGHSV = 6000 mL g−1 h−1) at different adsorption temperatures (i.e., 25–100 °C), (b) kinetic model (i.e., PFO, PSO, WM, Bangham) fitting for the adsorption data at 25 °C, (c) modified Arrhenius equation fitting, and (d) thermodynamic parameters estimation.
Materials 16 06656 g003
Figure 4. Model breakthrough curves for different initial CO2 feed concentrations: (a) 2 vol%, (b) 5 vol%, and (c) 10 vol% (25 °C, 1 atm, total flow rate = 100 mL min−1, WGHSV = 6000 mL g−1 h−1).
Materials 16 06656 g004
Figure 5. CO2 breakthrough curves during 10 adsorption–desorption cycles (Adsorption: 25 °C, 10% CO2/Ar, 1 atm, total flow rate = 100 mL min−1, time = 45 min, WGHSV = 6000 mL g−1 h−1; Desorption: 200 °C, Ar, 1 atm, total flow rate = 100 mL min−1, time = 15 min).
Materials 16 06656 g005
Table 1. Characteristics of the IMS adsorbent.
CharacteristicValue
Shape aSpherical
Density (g dm−3) a1.36
Bulk density (kg m−3) a700–750
pH a8–11
Melting point a<1600 °C
Si/Al ratio b0.97
Specific surface area (m2 g−1) c590
Average pore size (nm) b1.73
a Obtained from the manufacturer’s product specification sheet. b Obtained from SEM-EDX analysis. c Obtained from N2 adsorption–desorption analysis.
Table 2. Effect of CO2 feed concentration on the equilibrium adsorption capacity.
CO2 Feed Concentration (%)Equilibrium Adsorption Capacity (mg g−1)
0.253
0.573
1100
2142
5183
10204
20204
50204
100205
Table 3. Theoretically estimated parameters of the Langmuir, Freundlich, Temkin, and DR models.
ModelParameterValue
Langmuir K L L   m g 1 0.06
q m a x , L m g   g 1 211.8
R a d j 2 0.979
Freundlich K F m g 1 1 / n F g 1 L 1 / n F 71.66
n F 6.26
R a d j 2 0.704
Temkin A T L   m g 1 2.98
B T k J   m o l 1 0.09
R a d j 2 0.836
DR K D R 2.3 × 10⁻⁵
q m a x , D R m g   g 1 192.6
E M ( k J   m o l 1 ) 147.6
R a d j 2 0.721
Table 4. Theoretically estimated kinetic parameters for PFO, PSO, WM, and Bangham kinetic models.
ModelParameter25 °C35 °C50 °C75 °C100 °C
PFO k P F O m i n 1 0.1390.1910.2340.4110.714
q e , P F O m g   g 1 206.92164.40117.5165.6634.59
q e , e x p m g   g 1 203.69162.23116.2865.1434.46
R a d j 2 0.9790.9700.9770.9700.979
PSO k P S O g   m g 1 m i n 1 7.7 × 10−41.5 × 10−32.7 × 10−31.0 × 10−23.8 × 10⁻²
q e , P S O m g   g 1 235.78182.56129.1169.8336.06
q e , e x p m g   g 1 203.69162.23116.2865.1434.46
R a d j 2 0.9270.9010.9080.8770.871
WM k W M m g 1   g 1 m i n 1 21.1815.1110.524.381.73
C   m g   g 1 72.0573.5157.5742.4026.06
R a d j 2 0.6500.5520.5280.3750.277
Bangham k B m i n n 0.0580.0740.1160.2300.550
q e , B m g   g 1 203.87162.60116.4865.3134.48
q e , e x p m g   g 1 203.69162.23116.2865.1434.46
n B 1.4261.5321.4421.5401.498
R a d j 2 0.9990.9980.9990.9980.998
Table 5. Theoretically estimated column parameters of the Adams–Bohart, Thomas, and Yoon–Nelson models, along with estimated values for 2%, 5%, and 10% volume concentration for CO2 in the gas feed.
ModelFixed ParameterValueEstimated Parameter2 vol% CO25 vol% CO210 vol% CO2
Adams–Bohart h c m 2.0 k A B m L   m g 1   m i n 1 7.1045.1785.977
v ( c m   m i n 1 ) 19.7 N 0 ( m g   m L 1 ) 10.6815.0716.71
R a d j 2 0.9920.9910.998
Thomas W   ( g ) 1.0 k T H m L   m g 1   m i n 1 4.1962.9802.780
Q ( c m 3   m i n 1 ) 100.0 q e , T H ( m g   g 1 ) 122.89175.06194.79
q e , e x p ( m g   g 1 ) 141.79182.48203.69
R a d j 2 0.9980.9990.996
Yoon–Nelson-- k Y N ( m i n 1 ) 0.1550.2690.481
-- τ ( m i n ) 33.2819.4011.23
R a d j 2 0.9980.9990.996
Table 6. CO2 adsorption capacity values during the cyclic experiment (10 consecutive adsorption–desorption cycles).
Cycle NumberCO2 Adsorption Capacity (mg g−1)Cycle NumberCO2 Adsorption Capacity (mg g−1)
12046200
22027202
32028203
42009205
520510203
Disclaimer/Publisher’s Note: The statements, opinions and data contained in all publications are solely those of the individual author(s) and contributor(s) and not of MDPI and/or the editor(s). MDPI and/or the editor(s) disclaim responsibility for any injury to people or property resulting from any ideas, methods, instructions or products referred to in the content.

