Article

Influence of Pre-Incubation of Inoculum with Biochar on Anaerobic Digestion Performance

by
Marvin T. Valentin
1,2,
Kacper Świechowski
1 and
Andrzej Białowiec
1,*
1
Department of Applied Bioeconomy, Wrocław University of Environmental and Life Sciences, 51-630 Wroclaw, Poland
2
Benguet State University, Km. 5, La Trinidad, Benguet 2601, Philippines
*
Author to whom correspondence should be addressed.
Materials 2023, 16(20), 6655; https://doi.org/10.3390/ma16206655
Submission received: 26 August 2023 / Revised: 5 October 2023 / Accepted: 9 October 2023 / Published: 11 October 2023
(This article belongs to the Special Issue Biochar and Carbon-Based Materials: Properties and Applications)

Abstract

:
The application of biochar as an additive to enhance the anaerobic digestion (AD) of biomass has been extensively studied from various perspectives. This study reported, for the first time, the influence of biochar incubation in the inoculum on the anaerobic fermentation of glucose in a batch-type reactor over 20 days. Three groups of inoculum with the same characteristics were pre-mixed once with biochar for different durations: 21 days (D21), 10 days (D10), and 0 days (D0). The BC was mixed in the inoculum at a concentration of 8.0 g/L. The proportion of the inoculum and substrate was adjusted to an inoculum-to-substrate ratio of 2.0 based on the volatile solids. The results of the experiment revealed that D21 had the highest cumulative methane yield, of 348.98 mL, compared to 322.66, 290.05, and 25.15 mL obtained from D10, D0, and the control, respectively. Three models—modified Gompertz, first-order, and Autoregressive Integrated Moving Average (ARIMA)—were used to interpret the biomethane production. All models showed promising fitting of the cumulative biomethane production, as indicated by high R 2 and low RMSE values. Among these models, the ARIMA model exhibited the closest fit to the actual data. The biomethane production rate, derived from the modified Gompertz Model, increased as the incubation period increased, with D21 yielding the highest rate of 31.13 mL/gVS. This study suggests that the application of biochar in the anaerobic fermentation of glucose, particularly considering the short incubation period, holds significant potential for improving the overall performance of anaerobic digestion.

1. Introduction

Anaerobic digestion (AD) is currently a relevant and compelling topic owing to its various advantages and positive impacts on the environment. It continues to offer solutions in the field of waste management and climate change mitigation, as well as adhering to the circular economy approach and creating various economic opportunities. AD can be used to treat a vast array of substrates such as food waste (FW) [1]; the organic fraction of municipal solid waste (OFMSW) [2]; animal excretion such as cow manure [3] and chicken dung [4]; wastewater [5]; and various biomasses [6,7].
Biochar (BC) has emerged as a valuable supplement with the potential to significantly enhance methane production during the anaerobic digestion of various substrates [3,8,9]. Several findings asserted the positive impact of integrating biochar into the AD system. Li et al. (2022) observed a 30.0% improvement in the lag phase during the co-digestion of corn straw and sewage sludge supplemented with biochar at 5 g/kg [10]. Pa et al. (2022) reported an 81.3% increase, relative to the control, in methane production after the addition of cow manure biochar [3]. Moreover, the introduction of BC can also stimulate the growth of important microorganisms in the reactor [11], further enhancing the efficiency of the anaerobic digestion process.
The anaerobic digestion process relies on a consortium of diverse microorganisms, each playing a crucial role in the sequential stages of hydrolysis, acidogenesis, acetogenesis, and methanogenesis. In the study of Wang et al. (2022), wheat straw biochar fostered an environment conducive to microbial activity [8]. The biochar was able to host numerous cocci and microbiota, consequently enhancing the utilization rate of the biomass being treated [8]. This phenomenon of microbial enrichment on the surface of biochar has also been consistently attested across various studies [12,13]. Importantly, the attachment of microorganisms onto BC’s surface facilitates the formation of biofilm [14]. Several studies have identified specific microorganisms that thrive in the presence of BC. For instance, Methanosarcina [10,15,16] and Methanosaeta [13,16] are common microorganisms that are enriched when BC is introduced into the system. Luo et al. (2015) found that BC could establish a methanogenic zone on its pore spaces, which is the preferred location for Methanosarcina [17]. Methanosarcina, being acetoclastic and hydrogenotrophic [6], is a versatile and multi-nutrient (H2, CO2, acetic acid)-using genus for CH4 production [4,18]. Lee et al. (2016) found that attached biomass on carbon materials had more sequences within Actinobacteria, Betaproteobacteria, and Deltaproteobacteria [19]. Furthermore, the pore structure of BC can reduce ammonia inhibition and immobilize methanogens [3,17,20]. BC contains oxygen-containing functional groups (C−O, C=O, and C−OH) [21]. The presence of these functional groups enables BC to shuttle electrons in dual mode, as a donor and an acceptor, which eventually creates the phenomenon known as direct interspecies electron transfer (DIET) [22].
The addition of BC in AD accelerates methanogenesis by promoting the DIET phenomenon [1,3], which is associated with various characteristics, such as electrical conductivity (EC) [23], redox property [21], and surface oxygen functional groups [1]. In addition, BC supplementation can selectively enrich several bacteria and archaea favorable for the AD process [24]. Specifically, BC can serve as an alternative for C-type cytochromes and conductive pili to promote the electron transfer process [1].
Currently, no information reported in the literature has addressed the pre-mixing of biochar in the inoculum or digestate before the AD experiment. However, there are similar studies that examine the continuity of the biofilm formed in the BC during AD for use in long runs [25], which may provide insight into the importance of BC incubation before the AD process. The incubation period allows the BC to interact with the microbes present in the inoculum, but the optimum period must be considered as BC nutrient leaching may be weakened by long-term incubation [22]. The incubation of BC in the inoculum for a certain duration before its application in AD experiments can condition the BC to colonize microorganisms and facilitate biofilm formation. According to Johnravindar et al. (2020), biofilm formation allows the efficient degradation of organic matter and is associated with DIET occurrence [26]. Biofilm formation was observed from reactors supplemented with carbon materials [25,26,27]. He et al. (2020) observed stability in methane production, using the biochar biofilm as an inoculant, despite the removal of planktonic microorganisms in the reactor, and no extra inoculum or biochar was added [25]. Sunyoto et al. (2019) affirmed the role of biochar in enriching microbial growth and initiating biofilm formation [27]. Hence, in this study, it is speculated that the incubation of biochar in the inoculum would result in an enriched mixture favoring the anaerobic digestion of biomass. This could also lead to the possibility of recycling BC from previous AD experiments for subsequent use in the next AD process, especially since most studies have only considered the single use of biochar in AD [25].
This study was carried out to investigate the incubation of biochar in inoculum before the anaerobic fermentation of glucose. Three incubation periods were used: 21, 10, and 0 days. The performance of the anaerobic process was evaluated in terms of cumulative methane production, methane production rate, and pH variation.
A literature search performed using Web of Science revealed 822 articles that contained biogas and biochar in the keywords, from which recent review articles were identified [28,29]. To perform a keyword analysis, VOSviewer software was used [30]. The map was created based on bibliographic data with co-occurrence, all keywords, and full counting as the settings for the type of analysis and counting method. To ensure the relevance and significance of the keywords, the maximum number of occurrences was set at a threshold of 2. Within these keywords, “biochar” emerged as the most prominent keyword, exhibiting a robust link frequency of 165, closely followed by “biogas” with a link frequency of 131. The generated visualization map has a scale of 1.3 with the weights set to links. Additionally, the variation in label and line sizes was set to 1.0, with the maximum line strength capped at 1000. The resulting generated network map of the keywords that were most used in these studies is shown in Figure 1. The color and size indicate the type of cluster and the occurrence frequency of the individual keywords, respectively, and the line between the circles represents links [30]. The network map shows three major clusters. The first cluster (red) is the representation of the biochar, which is mostly related to BC sources. The second cluster (yellow) represents the common application of biochar. BC preparation is also grouped in the third cluster (blue). This information justifies the continuing evaluation of biochar application in biogas production, which substantiates the value of the current investigation.

2. Materials and Methods

2.1. Materials

The biochar used in this study was synthesized from sun-dried wheat straw obtained from the Swojec farm in Wrocław, Poland. The wheat straw underwent size reduction through the use of an electric stainless steel grinding machine. The ground wheat straw was pyrolyzed in a muffle furnace at a temperature of 900 °C for 60 min residence time, according to [13,31]. The digestate was acquired from the 1.0 MWel commercial agricultural biogas plant (Świdnica, Poland) for treating food waste and agricultural residues. The digestate underwent filtration to remove fibers and other solid materials such as plastics and stones [32]. The suspended liquid was set aside in a climatic chamber (Pollab, model 140/40, Wilkowice, Poland) at 4 °C and used as an inoculum in the anaerobic fermentation experiment. Glucose (substrate) was used as a carbon source in the experiment. The proportions of the inoculum and glucose were adjusted to an inoculum-to-substrate ratio (ISR) of 2.0 based on volatile solids (VS) [5,33,34,35,36,37,38]. Important properties of the inoculum, such as volatile solids, total solids, and pH, were determined.

2.2. Experimental Setup

The experimental setup followed the procedure previously conducted in the laboratory by Świechowski et al. (2022) [39]. An automatic methane potential test system (BPC Instruments AB, AMPTS® II, Lund, Sweden) was used. The anaerobic fermentation was performed in 500 mL glass reactors with agitation [39,40] under mesophilic conditions (37 °C). The working volume of the reactor was 400 mL. The mixture comprised of 250 mL of inoculum, 3.0 g of glucose (ISR = 2), and 150 mL of nutrient solution. The 150 mL of nutrient solution contained (per liter) 0.2 g MgCl2.6H2O, 1 g NH4Cl, 0.1 g CaCl2, 0.2 g Na2S.9H2O, 2.77 g K2HPO4, 2.8 g KH2PO4, 0.1 g yeast extract, 5 mL trace element solution, and 2 mL vitamin solution [17,41]. The composition of the trace element solution (per liter) was 1000 mg Na2-EDTA.2H2O, 300 mg CoCl4, 200 mg MnCl2.4H2O, 200 mg FeSO4.7H2O, 200 mg ZnCl2, 80 mg AlCl3.6H2O, 60 mg NaWo4.2H2O, 40 mg CuCl2.2H2O, 40 mg NiSO4.6H2O, 20 mg H2SeO4, 200 mg HBO3, and 200 mg NaMoO4.2H2O [41]. The vitamin solution consisted of (per liter) 10 mg biotin, 50 mg pyridoxin HCl, 25 mg thiamine HCl, 25 mg D-calcium pantothenate, 10 mg folic acid, 25 mg riboflavin, 25 mg nicotinic acid, 25 mg P-aminobenzoic acid, and 0.5 mg vitamin B1 [41]. During the fermentation process, mixing occurred every hour for 3 min using the default mixing setting of the AMPTS to maintain homogeneity [40]. The produced biomethane was automatically measured and recorded by the AMPTS equipment.
Before the anaerobic fermentation, the initially prepared inoculum was mixed with biochar. This biochar-enhanced inoculum was subjected to three distinct incubation periods: 21 days, 10 days, and an immediate application (0 days). These experimental conditions were labeled as D21, D10, and D0, respectively, and C for the control. The control reactor did not receive biochar. The inoculum combined with biochar was carefully secured in a plastic container and was maintained at room temperature throughout the incubation period. The D0 treatment signifies the incorporation of biochar in the inoculum right at the commencement of the experiment, setting it apart from the other incubation periods.

2.3. Data Analysis

The biomethane generated from the glucose in the anaerobic fermentation was calculated using Equation (1).
S M P ( t ) = M P M V S D M × A S M P D S
where S M P ( t ) is the specific methane production ( m L / g V S ) from the anaerobic fermentation of glucose at any time; M P M is the biomethane production from the mixture of inoculum, biochar, and glucose ( m L ); V S D is the volatile solid concentration of the inoculum in the mixture ( g V S ); A S M P D is the average specific biomethane production of the inoculum from the control reactor ( m L / g V S ); and S is the amount of VS of the glucose placed into the specific reactor ( g V S ).
The SMP was modeled using the Modified Gompertz [42,43,44] (Equation (2)) and first-order equation (Equation (3)). The variables in the models were estimated with the use of Python and were validated in Statistica v13.0 software (TIBCO Software Inc., Palo Alto, CA, USA). The Python code was prepared in the Jupyter Notebook.
M t = P × e x p e x p R m a x × e P x λ t + 1
where M t is the cumulative biomethane production in m L / ( g V S ) at time, t ; P   is the ultimate biomethane production in m L / ( g V S ) ; R m a x is the maximum biomethane production rate in m L / ( g V S . d a y ) ; λ is the duration of lag time (day); t is the processing time in day; and e is a mathematical constant (2.718282). In the first-order model, the maximum biomethane yield and the apparent hydrolysis degradation coefficient, k d , were obtained (Equation (3)) [44]. The first-order kinetic model was used to characterize the hydrolytic process of the AD [2,45,46] at different conditions.
B = B 0     ( 1 e k d t )
where B is the cumulative biomethane production at a given time t , B 0 is the ultimate biomethane potential yield, k d is the first-order disintegration rate, and t is the process time in days. Furthermore, a machine learning model, specifically the Autoregressive Moving Average (ARIMA) model, was used to analyze the trend in biomethane production. The data were divided into training data (70%), validation data (10%), and prediction data (20%). The accuracy of the models used in the validation and data prediction was assessed in terms of R M S E [47] and R 2 [48].

3. Results

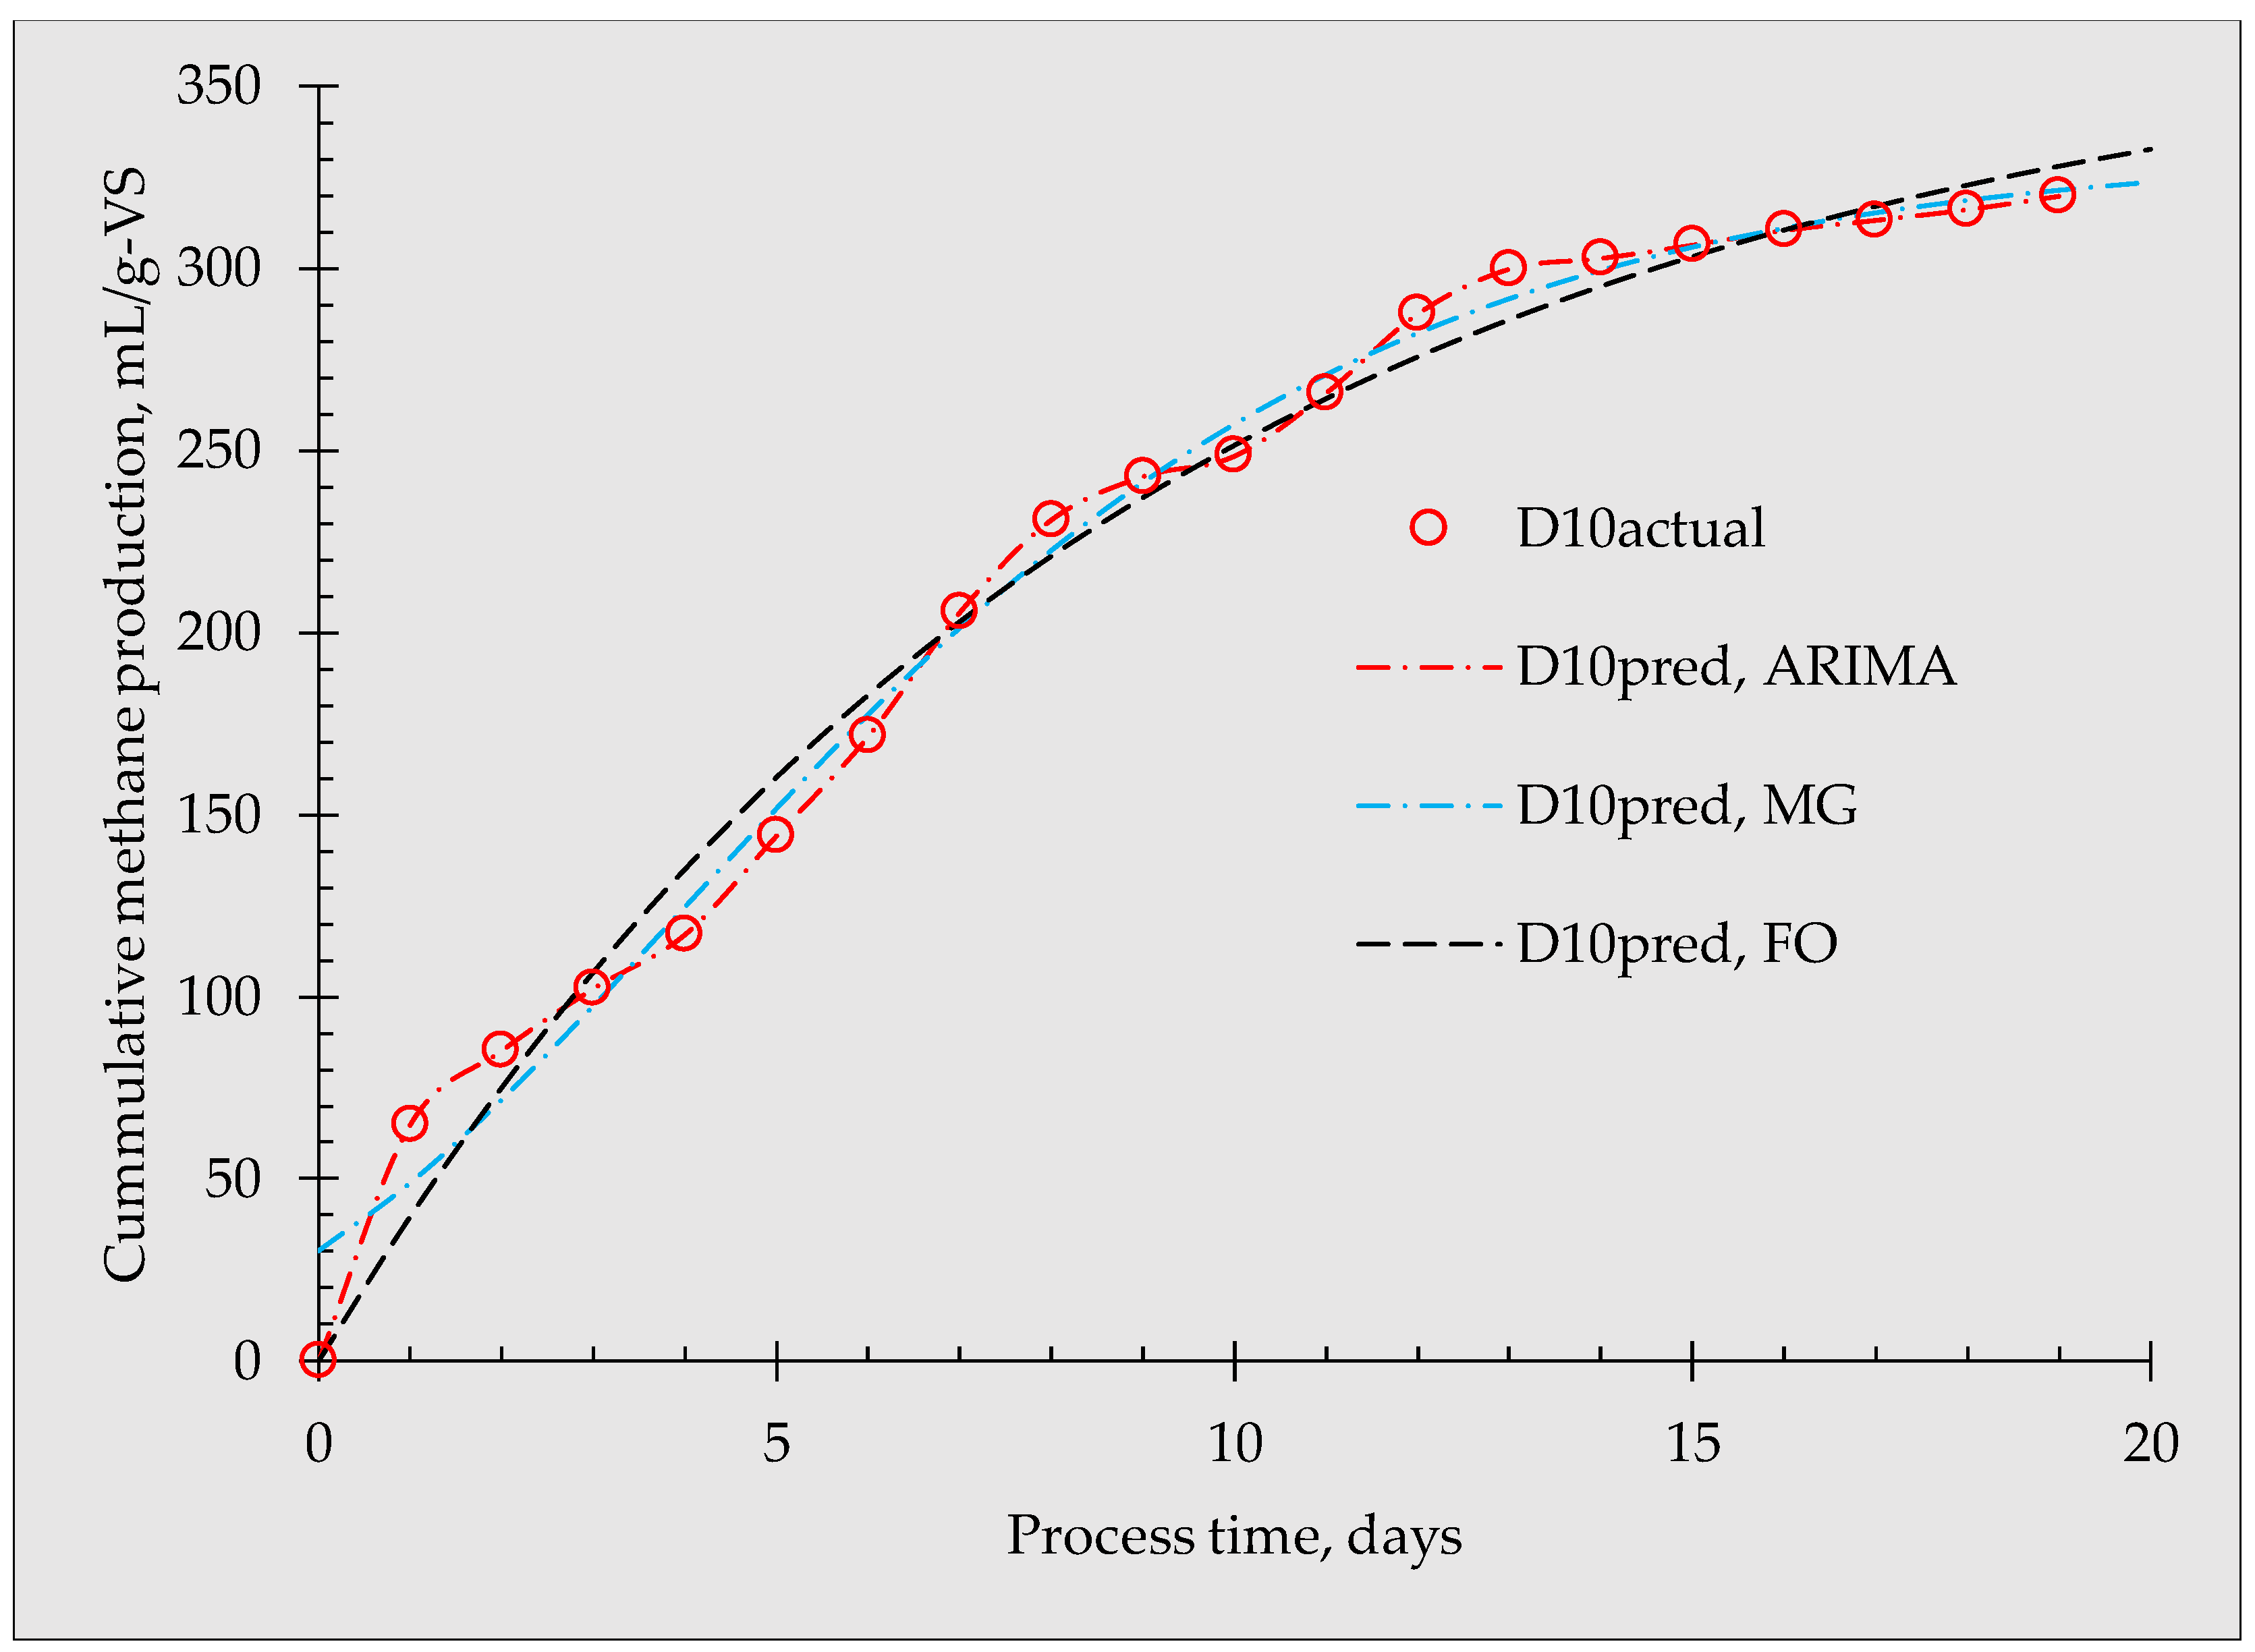
3.1. Effects of BC on Methane Production

The cumulative biomethane production from the anaerobic fermentation of glucose, including the effects of biochar incubation in the inoculum, is shown in Figure 2. The production of biomethane started at day 0 in all reactors, except for the control groups, which highlights the fast response of the microbial community toward the feedstock [49]. Statistical analysis demonstrated that biomethane productions were statistically different (p < 0.05) among the treatments. Specifically, D21 had the highest biomethane production throughout the experiment. When the reactors were applied with D10 and D0, the biomethane yields followed a similar path until day 7. However, after day 7, D0 lags behind D10. The cumulative biomethane production for D21 was 348.98 mL, followed by 322.66 mL and 290.05 mL for D10 and D0, respectively. The trend shows an increase in biomethane production when increasing the incubation period of the biochar in the inoculum before the anaerobic fermentation. The observed differences in the biomethane production demonstrate the positive impact of incubating the biochar in the inoculum for different durations. The positive observation on the influence of biochar relative to the control is highly consistent with previous works reported elsewhere [3,10,50,51,52].
Zang et al. (2021) concluded that BC addition in their experiment did not cause an obvious leap in CH4 yield [15]. In this study, a significant difference in the produced biomethane was observed as a result of the incubation of biochar in the inoculum. The reactors (D0) that received biochar at the start of the experiment (without incubation) deviated significantly, particularly from day 7 until the end of the fermentation period. Furthermore, the biomethane yield from D21 was consistently higher throughout the experiment. This indicates that the biochar incubation over a longer period (21 days) in the inoculum could have established adaptation and perhaps developed a higher microbial community.
The results of the modified Gompertz model as applied to the biomethane production of glucose are shown in Table 1. The maximum biomethane production and production rate were highest in D21, with values of 355.20 mL and 31.13 mL/gVS, respectively. This indicates a higher potential for biomethane generation compared to the other treatments. All treatments exhibit a negative lag phase, suggesting a temporary decline in biomethane production before the exponential growth phase is entered. Lauzurique et al. (2022) obtained a negative lag phase with the use of the same model and found out that it had no physical meaning to the fit; rather, it is just a result of the mathematical structure of the model [5]. D21 has the highest RMSE, implying a higher degree of error in predicting biomethane production for this treatment. Furthermore, all treatments show a high R 2 value, which is within the acceptable range (0.75–1.0) [4], suggesting a good fit for the modified Gompertz model.
The first-order model provides information about the maximum biogas produced (Bo) and the biodegradability constant (k) [32] for each treatment (Table 2). Similar to the modified Gompertz result, D21 has the highest biomethane production, of 372.96 mL, indicating a faster rate of biomethane generation compared to the other treatments. The predicted cumulative biomethane yield was higher than the actual value. In terms of error, D21 has the highest RMSE, suggesting a larger deviation between the model predictions and the actual data. The R 2 values indicate the good fit of the first-order model to the data, as they are high for all treatments.
The ARIMA model, in addition to the modified Gompertz and first-order models, was applied to further analyzed the trend of the biomethane production. The evaluation metrics (RMSE and R 2 ) of the model are given in Table 3. The optimum parameters for the ARIMA order (p, d, q) are also provided. The corresponding statistical parameters for this optimal condition in terms of RMSE indicate that D10, among the BC-supplemented reactors, has the lowest prediction error and deviation between the actual and predicted values. In terms of the proportion of variance in the data explained by the ARIMA model, all treatments have high R 2 values, suggesting the good fit of the ARIMA model.
All three models provided insights into the biomethane production process and exhibited reasonably good fitting to the data under various treatments. The modified Gompertz and first-order models offer more detailed parameter estimation, such as maximum biomethane production, maximum methane production rate, lag phase, and biodegradability. These parameters helped understand the dynamics of the biomethane production process. In terms of RMSE, all three models show varying levels of prediction errors across the treatments, with D21 having the highest error in all models. The R 2 values are consistently high for all treatments in all models, indicating a good fit and a high proportion of explained variance. The modified Gompertz and first-order models provide specific insights into maximum biogas production rate and biodegradability, while the ARIMA model assesses stationarity and provides statistical evaluation. Furthermore, in terms of the maximum production at D21, the modified Gompertz (355 mL/gVS) and the first-order (372 mL/gVS) models are reasonable owing to the theoretical biomethane production of glucose, which should be around 377 mL/gVS from the Buswell and Mueller stoichiometric formulas (Equations (4) and (5)).
C c H h O o H n S s + c h 4 o 2 + 3 n 4 + s 2 H 2 O c 2 + h 8 o 4 3 n 8 s 4 C H 4 + c 2 h 8 + o 4 + 3 n 8 + s 4 C O 2 + n N H 3 + s H 2 S
C c H h O o + c h 4 o 2 H 2 O c 2 h 8 + o 4 C O 2 + c 2 + h 8 o 4 C H 4
where C c H h O o H n S s is the elemental composition of the biomass that is comprised of carbon (C), hydrogen (H), oxygen (O), nitrogen (N), and sulfur (S); c ,   h ,   o ,   n ,   s are the percentage share of the volatile solids of biomass. Hence, with the complete degradation of 1.0 g VS of glucose, a theoretical quantity of 746.6 mL/g-VS biogas can be produced, with the production of the biomethane at the level of 377.95 mL/g-VS.
Further comparisons between the predicted and actual biogas production from the modified Gompertz, first-order, and ARIMA models obtained at D21 and D10 are shown in Figure 3 and Figure 4, respectively. As depicted in the figures, each model has different fittings to the actual data, especially at the beginning of the experiment. In the modified Gompertz, the predicted initial biomethane production at D21 was 44.83 mL/g-VS and 30.29 mL/g-VS at D10, which is far from the actual value of zero. The ARIMA and the first-order models had the same predicted values as that of the actual value (0 mL/g-VS) on day 0. The modified Gompertz showed a proportional increment during the first 8 days, giving a straight line of fit while the ARIMA model almost followed the actual data. The first-order model starts at zero but lags behind the actual data, particularly in the first 3 days. At the end of the anaerobic fermentation process (day 20), the predicted cumulative biomethane production from D21 was 348.98, and 349.02 mL/VS for the modified Gompertz and ARIMA models, respectively, which is closer to the measured value of 348.98 mL/gVS. However, the predicted higher value was at 354.39 mL/gVS (1.54%). At D10, the modified Gompertz and ARIMA predictions were likewise closer to the actual value (322.67 mL/gVS) while the first-order model predicted a higher value of 332.61 mL/gVS (3.08%). From this, considering the final cumulative biomethane production, the modified Gompertz model was more appropriate in this study compared to the first-order model. However, the modified Gompertz implied that biomethane was generated at day 0, when the value should have been zero.

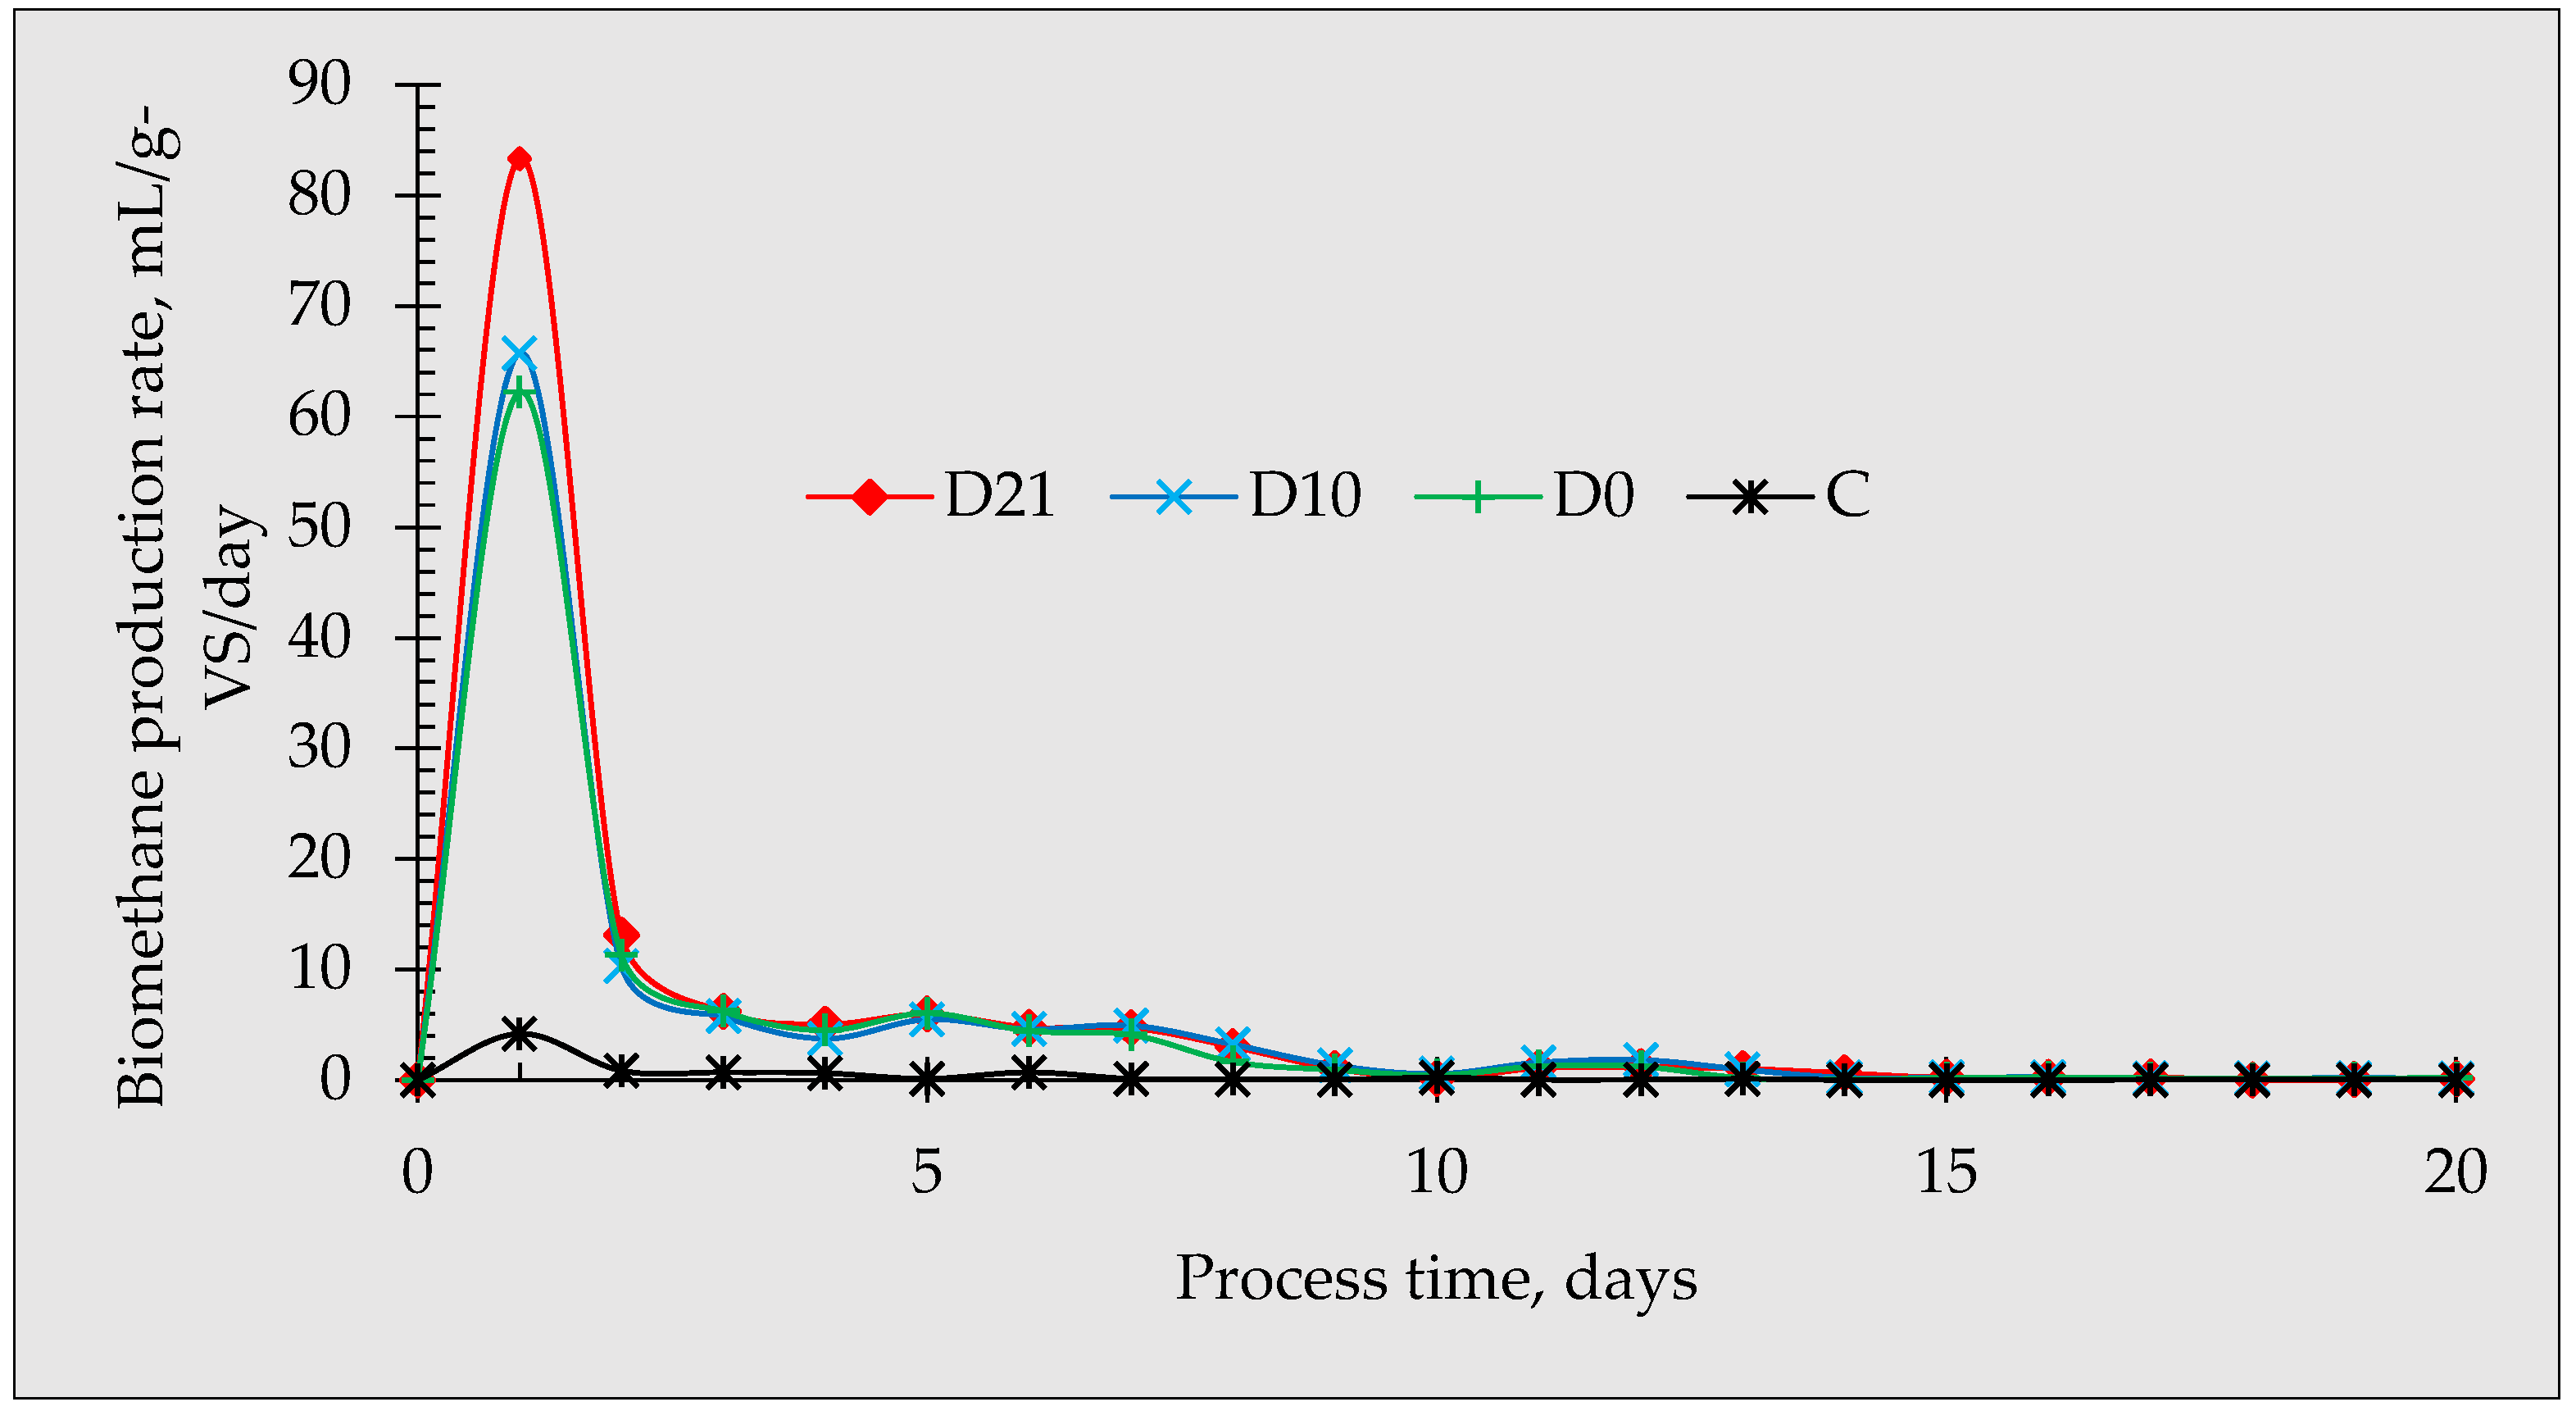
3.2. Biomethane Production Rate

The daily biomethane production of the anaerobic fermentation of glucose under various conditions is shown in Figure 5. The impact of the addition of biochar is evident on day 1, where the peak biomethane production rate was observed from all the reactors with D21 being the highest, with 83.33 mL/g-VS/day, followed by D10 with 65.71 mL/g-VS/day. A gradual decrease in the biomethane production rate was observed until day 4 and a slight rise attempting to approach a second peak was observed at day 5 for all reactors. A similar trend was reported by Li et al. (2022), except that peak production started at day 6 [10]. The high biodegradability in D21 can be due to the high microbial population developed during the incubation period. He et al. (2020) observed that microorganisms and functional methanogens were enriched and proliferated in recycled biochar [25]. This could suggest that, in the present study, the biochar that was inoculated and digested for a longer period had been enriched with functional microorganisms that resulted in higher biomethane production.

3.3. System Stability

The behavior of the anaerobic fermentation of glucose in terms of stability, as indicated by pH variation induced by the different biochar incubation periods, is shown in Figure 6. The reactors that received biochar showed lower pH throughout the anaerobic fermentation compared to the non-amended reactors. The initial pH was 7.61, 7.59, 7.70, and 8.15 for D21, D10, D0, and C, respectively. During the first 10 days, the BC-amended reactors showed a gradual shift to alkalinity conditions and were stable until day 20. Conversely, the pH in the control reactor continued to increase, indicating that the control becomes more alkaline during the process time. This indicates that biochar was effective in promoting stability in the reactor, which confirms the findings of Lu et al. (2016) [13]. Previous reports have consistently demonstrated that the supplementation of BC effectively maintained an optimum pH level while non-BC reactors were acidic [13,53]. This current study aligns with these findings, showcasing the positive effect of BC, except that the control was alkaline. Pan et al. (2019) reported a similar observation where non-amended reactors showed alkaline pH levels [53].

4. Conclusions

This study explored the potential advantages of incubating the biochar into the inoculum before subjecting to anaerobic fermentation. The results of the investigation revealed that the D21 treatment yielded the highest performance, with a total biomethane volume of 348.98 mL accumulated at the end of the experiment. The stability of the system, as indicated by the pH, demonstrated that the reactors with biochar maintained a pH range of 7.6 to 8.3 compared with the control, which reached a pH of 8.6. The biomethane production was modeled using modified Gompertz, first-order, and ARIMA models. The three models showed strong fitting of the data, as indicated by high values of R2 and low RMSE values. However, since biochar incubation showed better performance than when mixed during the experiment, a future study is recommended in which the incubated BC is subjected to microbial analysis.

Author Contributions

Conceptualization, A.B. and M.T.V.; methodology, A.B., M.T.V. and K.Ś.; formal analysis, A.B. and K.Ś.; investigation, M.T.V.; resources, M.T.V. and K.Ś.; data curation, M.T.V. and K.Ś.; writing—original draft preparation, M.T.V.; writing—review and editing, A.B., M.T.V. and K.Ś.; visualization, M.T.V.; supervision, A.B.; project administration, A.B.; funding acquisition, A.B. All authors have read and agreed to the published version of the manuscript.

Funding

This research was funded in whole by the National Science Centre, Poland, grant number UMO-2021/43/B/ST8/01924. For Open Access, the author has applied a CC-BY public copyright license to any Author Accepted Manuscript (AAM) version arising from this submission. The APC is financed by Wrocław University of Environmental and Life Sciences.

Institutional Review Board Statement

Not applicable.

Informed Consent Statement

Not applicable.

Data Availability Statement

The data presented in this study are contained within the article.

Acknowledgments

The presented article results were obtained as part of the activity of the leading research team—Waste and Biomass Valorization Group (WBVG).

Conflicts of Interest

The authors declare no conflict of interest.

References

  1. Zhang, C.; Yang, R.; Sun, M.; Zhang, S.; He, M.; Tsang, D.C.W.; Luo, G. Wood waste biochar promoted anaerobic digestion of food waste: Focusing on the characteristics of biochar and microbial community analysis. Biochar 2022, 4, 62. [Google Scholar] [CrossRef]
  2. Demichelis, F.; Tommasi, T.; Deorsola, F.A.; Marchisio, D.; Fino, D. Effect of inoculum origin and substrate-inoculum ratio to enhance the anaerobic digestion of organic fraction municipal solid waste (OFMSW). Clean. Prod. 2022, 351, 131539. [Google Scholar] [CrossRef]
  3. Pan, J.; Sun, J.; Ao, N.; Xie, Y.; Zhang, A.; Chen, Z.; Cai, L. Factors Influencing Biochar-Strengthened Anaerobic Digestion of Cow Manure. BioEnergy Res. 2022, 15, 10. [Google Scholar] [CrossRef]
  4. Ma, J.; Chen, F.; Xue, S.; Pan, J.; Khoshnevisan, B.; Yang, Y.; Liu, H.; Qiu, L. Improving anaerobic digestion of chicken manure under optimized biochar supplementation strategies. Bioresour. Technol. 2021, 325, 124697. [Google Scholar] [CrossRef] [PubMed]
  5. Lauzurique, Y.; Fermoso, F.G.; Sánchez, N.; Castillo, A.; Salazar, R.; García, V.; Huiliñir, C. Biogas production from winery wastewater: Effect of the substrate-inoculum ratio on fly ash addition and iron availability. J. Water Process. Eng. 2022, 47, 102826. [Google Scholar] [CrossRef]
  6. Blasco, L.; Kahala, M.; Ervasti, S.; Tampio, E. Dynamics of microbial community in response to co-feedstock composition in anaerobic digestion. Bioresour. Technol. 2022, 364, 128039. [Google Scholar] [CrossRef]
  7. Ünyay, H.; Yılmaz, F.; Başar, İ.A.; Perendeci, N.A.; Çoban, I.; Şahinkaya, E. Effects of organic loading rate on methane production from switchgrass in batch and semi-continuous stirred tank reactor system. Biomass Bioenergy 2022, 156, 106306. [Google Scholar] [CrossRef]
  8. Wang, S.; Shi, F.; Li, P.; Yang, F.; Pei, Z.; Yu, Q.; Zuo, X.; Liu, J. Effects of rice straw biochar on methanogenic bacteria and metabolic function in anaerobic digestion. Sci. Rep. 2022, 12, 6971. [Google Scholar] [CrossRef] [PubMed]
  9. Indren, M.; Birzer, C.H.; Kidd, S.P.; Medwell, P.R. Effect of total solids content on anaerobic digestion of poultry litter with biochar. J. Environ. Manag. 2020, 255, 109744. [Google Scholar] [CrossRef]
  10. Li, P.; Wang, Q.; He, X.; Yu, R.; He, C.; Shen, D.; Jiao, Y. Investigation on the effect of different additives on anaerobic co-digestion of corn straw and sewage sludge: Comparison of biochar, Fe3O4, and magnetic biochar. Bioresour. Technol. 2022, 345, 126532. [Google Scholar] [CrossRef]
  11. Li, Y.; Liu, M.; Che, X.; Li, C.; Liang, D.; Zhou, H.; Liu, L.; Zhao, Z.; Zhang, Y. Biochar stimulates growth of novel species capable of direct interspecies electron transfer in anaerobic digestion via ethanol-type fermentation. Environ. Res. 2020, 189, 109983. [Google Scholar] [CrossRef] [PubMed]
  12. Yang, Y.; Zhang, Y.; Li, Z.; Zhao, Z.; Quan, X.; Zhao, Z. Adding granular activated carbon into anaerobic sludge digestion to promote methane production and sludge decomposition. J. Clean. Prod. 2017, 149, 1101–1108. [Google Scholar] [CrossRef]
  13. FLü, F.; Luo, C.; Shao, L.; He, P. Biochar alleviates combined stress of ammonium and acids by firstly enriching Methanosaeta and then Methanosarcina. Water Res. 2016, 90, 34–43. [Google Scholar] [CrossRef]
  14. Cimon, C.; Kadota, P.; Eskicioglu, C. Effect of biochar and wood ash amendment on biochemical methane production of wastewater sludge from a temperature phase anaerobic digestion process. Bioresour. Technol. 2020, 297, 122440. [Google Scholar] [CrossRef] [PubMed]
  15. Yang, S.; Chen, Z.; Wen, Q. Impacts of biochar on anaerobic digestion of swine manure: Methanogenesis and antibiotic resistance genes dissemination. Bioresour. Technol. 2021, 324, 124679. [Google Scholar] [CrossRef] [PubMed]
  16. CWang, C.; Liu, Y.; Wang, C.; Xing, B.; Zhu, S.; Huang, J.; Xu, X.; Zhu, L. Biochar facilitates rapid restoration of methanogenesis by enhancing direct interspecies electron transfer after high organic loading shock. Bioresour. Technol. 2021, 320, 124360. [Google Scholar] [CrossRef]
  17. Luo, C.; Lü, F.; Shao, L.; He, P. Application of eco-compatible biochar in anaerobic digestion to relieve acid stress and promote the selective colonization of functional microbes. Water Res. 2015, 68, 710–718. [Google Scholar] [CrossRef]
  18. Zhang, Z.; Gao, P.; Cheng, J.; Liu, G.; Zhang, X.; Feng, Y. Enhancing anaerobic digestion and methane production of tetracycline wastewater in EGSB reactor with GAC/NZVI mediator. Water Res. 2018, 136, 54–63. [Google Scholar] [CrossRef]
  19. Lee, J.-Y.; Lee, S.-H.; Park, H.-D. Enrichment of specific electro-active microorganisms and enhancement of methane production by adding granular activated carbon in anaerobic reactors. Bioresour. Technol. 2016, 205, 205–212. [Google Scholar] [CrossRef]
  20. Mumme, J.; Srocke, F.; Heeg, K.; Werner, M. Use of biochars in anaerobic digestion. Bioresour. Technol. 2014, 164, 189–197. [Google Scholar] [CrossRef]
  21. Ren, S.; Usman, M.; Tsang, D.C.W.; O-Thong, S.; Angelidaki, I.; Zhu, X.; Zhang, S.; Luo, G. Hydrochar-Facilitated Anaerobic Digestion: Evidence for Direct Interspecies Electron Transfer Mediated through Surface Oxygen-Containing Functional Groups. Environ. Sci. Technol. 2020, 54, 5755–5766. [Google Scholar] [CrossRef] [PubMed]
  22. Shao, L.; Li, S.; Cai, J.; He, P.; Lü, F. Ability of biochar to facilitate anaerobic digestion is restricted to stressed surroundings. J. Clean. Prod. 2019, 238, 117959. [Google Scholar] [CrossRef]
  23. Zhang, J.; Zhao, W.; Zhang, H.; Wang, Z.; Fan, C.; Zang, L. Recent achievements in enhancing anaerobic digestion with carbon- based functional materials. Bioresour. Technol. 2018, 266, 555–567. [Google Scholar] [CrossRef] [PubMed]
  24. ZZhao, Z.; Li, Y.; Quan, X.; Zhang, Y. Towards engineering application: Potential mechanism for enhancing anaerobic digestion of complex organic waste with different types of conductive materials. Water Res. 2017, 115, 266–277. [Google Scholar] [CrossRef]
  25. He, P.; Zhang, H.; Duan, H.; Shao, L.; Lü, F. Continuity of biochar-associated biofilm in anaerobic digestion. Chem. Eng. J. 2020, 390, 124605. [Google Scholar] [CrossRef]
  26. Johnravindar, D.; Liang, B.; Fu, R.; Luo, G.; Meruvu, H.; Yang, S.; Yuan, B.; Fei, Q. Supplementing granular activated carbon for enhanced methane production in anaerobic co-digestion of post-consumer substrates. Biomass Bioenergy 2020, 136, 105543. [Google Scholar] [CrossRef]
  27. Sunyoto, N.M.; Sugiarto, Y.; Zhu, M.; Zhang, D. Transient performance during start-up of a two-phase anaerobic digestion process demonstration unit treating carbohydrate-rich waste with biochar addition. Int. J. Hydrogen Energy 2019, 44, 14341–14350. [Google Scholar] [CrossRef]
  28. Cai, Y.; Zhu, M.; Meng, X.; Zhou, J.L.; Zhang, H.; Shen, X. The role of biochar on alleviating ammonia toxicity in anaerobic digestion of nitrogen-rich wastes: A review. Bioresour. Technol. 2022, 351, 126924. [Google Scholar] [CrossRef]
  29. Tang, S.; Wang, Z.; Liu, Z.; Zhang, Y.; Si, B. The role of biochar to enhance anaerobic digestion: A review. J. Renew. Mater. 2020, 8, 1033–1052. [Google Scholar] [CrossRef]
  30. Zhao, W.; Yang, H.; He, S.; Zhao, Q.; Wei, L. A review of biochar in anaerobic digestion to improve biogas production: Performances, mechanisms and economic assessments. Bioresour. Technol. 2021, 341, 125797. [Google Scholar] [CrossRef]
  31. Shanmugam, S.R.; Adhikari, S.; Nam, H.; Sajib, S.K. Effect of bio-char on methane generation from glucose and aqueous phase of algae liquefaction using mixed anaerobic cultures. Biomass Bioenergy 2018, 108, 479–486. [Google Scholar] [CrossRef]
  32. Benito, P.C.; Greger, M. Influence of the Substrate/Inoculum Ratio on Process Stability and Performance during Batch Digestion of Grass Silage. Chem. Ing. Tech. 2017, 89, 724–732. [Google Scholar] [CrossRef]
  33. Gandhi, B.P.; Otite, S.V.; Fofie, E.A.; Lag-Brotons, A.J.; Ezemonye, L.I.; Semple, K.T.; Martin, A.D. Kinetic investigations into the effect of inoculum to substrate ratio on batch anaerobic digestion of simulated food waste. Renew. Energy 2022, 195, 311–321. [Google Scholar] [CrossRef]
  34. Juanga-Labayen, J.; Yanac, K.; Yuan, Q. Effect of substrate-to-inoculum ratio on anaerobic digestion of treated and untreated cotton textile waste. Int. J. Environ. Sci. Technol. 2021, 18, 287–296. [Google Scholar] [CrossRef]
  35. Meng, L.; Xie, L.; Kinh, C.T.; Suenaga, T.; Hori, T.; Riya, S.; Terada, A.; Hosomi, M. Influence of feedstock-to-inoculum ratio on performance and microbial community succession during solid-state thermophilic anaerobic co-digestion of pig urine and rice straw. Bioresour. Technol. 2018, 252, 127–133. [Google Scholar] [CrossRef]
  36. Ma, X.; Jiang, T.; Chang, J.; Tang, Q.; Luo, T.; Cui, Z. Effect of Substrate to Inoculum Ratio on Biogas Production and Microbial Community During Hemi-Solid-State Batch Anaerobic Co-digestion of Rape Straw and Dairy Manure. Appl. Biochem. Biotechnol. 2019, 189, 884–902. [Google Scholar] [CrossRef]
  37. Villamil, J.A.; Mohedano, A.F.; Rodriguez, J.J.; de la Rubia, M.A. Valorisation of the liquid fraction from hydrothermal carbonisation of sewage sludge by anaerobic digestion. J. Chem. Technol. Biotechnol. 2017, 93, 450–456. [Google Scholar] [CrossRef]
  38. Moset, V.; Al-Zohairi, N.; Møller, H.B. The impact of inoculum source, inoculum to substrate ratio and sample preservation on methane potential from different substrates. Biomass Bioenergy 2015, 83, 474–482. [Google Scholar] [CrossRef]
  39. Świechowski, K.; Matyjewicz, B.; Telega, P.; Białowiec, A. The Influence of Low-Temperature Food Waste Biochars on Anaerobic Digestion of Food Waste. Materials 2022, 15, 945. [Google Scholar] [CrossRef]
  40. Zhao, K.; Li, Y.; Zhou, Y.; Guo, W.; Jiang, H.; Xu, Q. Characterization of hydrothermal carbonization products (hydrochars and spent liquor) and their biomethane production performance. Bioresour. Technol. 2018, 267, 9–16. [Google Scholar] [CrossRef]
  41. Lin, Y.; Lü, F.; Shao, L.; He, P. Influence of bicarbonate buffer on the methanogenetic pathway during thermophilic anaerobic digestion. Bioresour. Technol. 2013, 137, 245–253. [Google Scholar] [CrossRef] [PubMed]
  42. Lin, R.; Cheng, J.; Zhang, J.; Zhou, J.; Cen, K.; Murphy, J.D. Boosting biomethane yield and production rate with graphene: The potential of direct interspecies electron transfer in anaerobic digestion. Bioresour. Technol. 2017, 239, 345–352. [Google Scholar] [CrossRef] [PubMed]
  43. Namal, O.O. Investigation of the effects of different conductive materials on the anaerobic digestion. Int. J. Environ. Sci. Technol. 2020, 17, 473–482. [Google Scholar] [CrossRef]
  44. Donoso-Bravo, A.; Pérez-Elvira, S.; Fdz-Polanco, F. Application of simplified models for anaerobic biodegradability tests. Evaluation of pre-treatment processes. Chem. Eng. J. 2010, 160, 607–614. [Google Scholar] [CrossRef]
  45. Li, Y.; Chen, Z.; Peng, Y.; Huang, W.; Liu, J.; Mironov, V.; Zhang, S. Deeper insights into the effects of substrate to inoculum ratio selection on the relationship of kinetic parameters, microbial communities, and key metabolic pathways during the anaerobic digestion of food waste. Water Res. 2022, 217, 118440. [Google Scholar] [CrossRef]
  46. De Gioannis, G.; Muntoni, A.; Cappai, G.; Milia, S. Landfill gas generation after mechanical biological treatment of municipal solid waste. Estimation of gas generation rate constants. Waste Manag. 2009, 29, 1026–1034. [Google Scholar] [CrossRef] [PubMed]
  47. Nguyen, D.D.; Jeon, B.-H.; Jeung, J.H.; Rene, E.R.; Banu, J.R.; Ravindran, B.; Vu, C.M.; Ngo, H.H.; Guo, W.; Chang, S.W. Thermophilic anaerobic digestion of model organic wastes: Evaluation of biomethane production and multiple kinetic models analysis. Bioresour. Technol. 2019, 280, 269–2769. [Google Scholar] [CrossRef]
  48. Pererva, Y.; Miller, C.D.; Sims, R.C. Existing Empirical Kinetic Models in Biochemical Methane Potential (BMP) Testing, Their Selection and Numerical Solution. Water 2020, 12, 1831. [Google Scholar] [CrossRef]
  49. Chen, M.; Liu, S.; Yuan, X.; Li, Q.X.; Wang, F.; Xin, F.; Wen, B. Methane production and characteristics of the microbial community in the co-digestion of potato pulp waste and dairy manure amended with biochar. Renew. Energy 2021, 163, 357–367. [Google Scholar] [CrossRef]
  50. Jang, H.M.; Choi, Y.-K.; Kan, E. Effects of dairy manure-derived biochar on psychrophilic, mesophilic and thermophilic anaerobic digestions of dairy manure. Bioresour. Technol. 2018, 250, 927–931. [Google Scholar] [CrossRef]
  51. AAkturk, A.S.; Demirer, G.N. Improved food waste stabilization and valorization by anaerobic digestion through supplementation of conductive materials and trace elements. Sustainability 2020, 12, 5222. [Google Scholar] [CrossRef]
  52. González-Arias, J.; Martínez, E.J.; Gómez, X.; Sánchez, M.E.; Cara-Jiménez, J. Enhancing biomethane production by biochar addition during anaerobic digestion is economically unprofitable. Environ. Chem. Lett. 2022, 20, 991–997. [Google Scholar] [CrossRef]
  53. Pan, J.; Ma, J.; Liu, X.; Zhai, L.; Ouyang, X.; Liu, H. Effects of different types of biochar on the anaerobic digestion of chicken manure. Bioresour. Technol. 2019, 275, 258–265. [Google Scholar] [CrossRef] [PubMed]
Figure 1. The network map of keyword co-occurrence generated from VOSviewer software v1.6.19.
Materials 16 06655 g001
Figure 2. Cumulative biomethane production from the anaerobic fermentation of glucose supplemented with biochar with different incubation periods.
Materials 16 06655 g002
Figure 3. Comparative graphs of predicted biomethane production and actual biomethane production from D21 for the modified Gompertz, first-order, and ARIMA models.
Materials 16 06655 g003
Figure 4. Comparative graphs of predicted biomethane production with actual biomethane production from D10 for the modified Gompertz, first-order, and ARIMA models.
Materials 16 06655 g004
Figure 5. The biomethane production rate (mL/g-VS/day) of the anaerobic fermentation of glucose under different biochar incubation periods.
Materials 16 06655 g005
Figure 6. Effect of biochar incubation duration in the inoculum on the pH changes.
Materials 16 06655 g006
Table 1. Kinetics parameters of the modified Gompertz model of the predicted biomethane production of glucose under different biochar incubation durations.
TreatmentCumulative CH4 Yield P R m a x λ RMSE R 2 k
MeasuredPredicted
D21348.98348.98355.20 31.13−1.1410.880.9870.087
D10322.66323.61332.68 27.31−0.578.900.9910.082
D0290.05284.33287.40 28.32−0.677.790.9900.098
C25.1524.1724.78 2.03−1.060.590.9920.082
Table 2. Kinetics parameters of the first-order model of the predicted biomethane production of glucose under different biochar incubation durations.
TreatmentCumulative CH4 Yield B o , m L k , d a y 1 RMSE R 2
MeasuredPredicted
D21348.98354.39372.96 0.14911.060.9861
D10322.66332.61371.40 0.11310.690.9867
D0290.05291.34305.21 0.1548.2310.9890
C25.1524.6626.640.1300.5600.9928
Table 3. Parameters of the ARIMA model of the predicted biomethane production of glucose under different biochar incubation durations.
Treatment RMSE R 2
(p, d, q)ValidationTestValidationTest
D215, 1, 60.023260.022560.999840.99972
D106, 1, 50.025380.022600.999840.99995
D05, 1, 10.020960.020690.999880.99995
C5, 1, 70.006890.0058120.998620.99995
Disclaimer/Publisher’s Note: The statements, opinions and data contained in all publications are solely those of the individual author(s) and contributor(s) and not of MDPI and/or the editor(s). MDPI and/or the editor(s) disclaim responsibility for any injury to people or property resulting from any ideas, methods, instructions or products referred to in the content.

