
Residual Stress Control Using Process Optimization in Directed Energy Deposition


Abstract
:1. Introduction
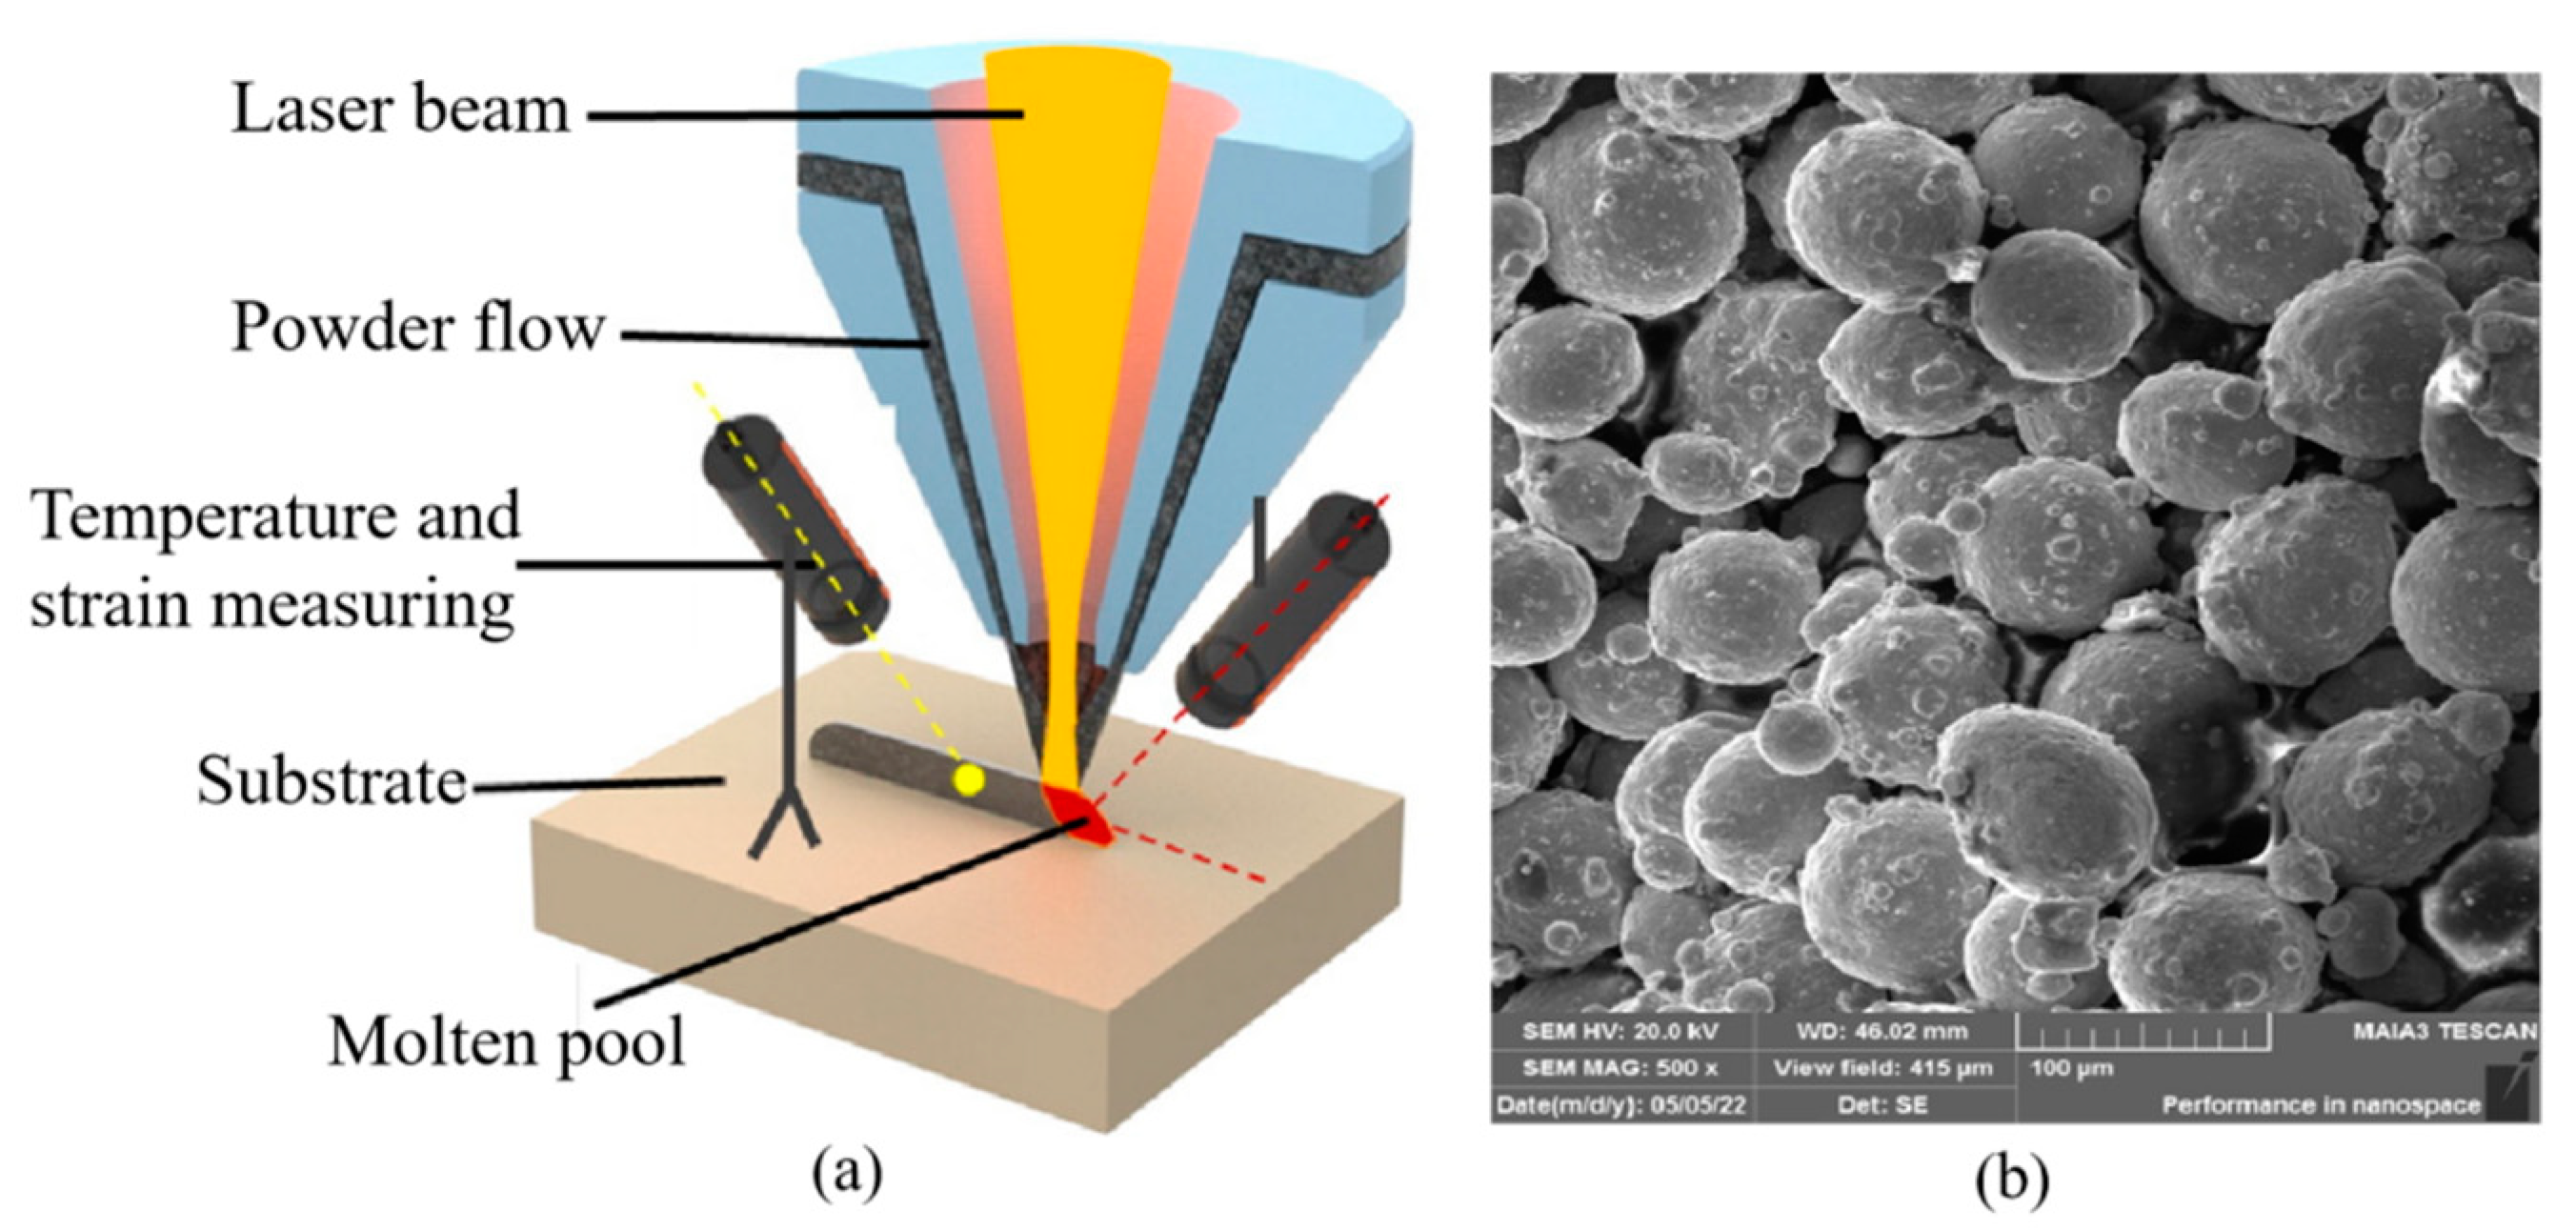
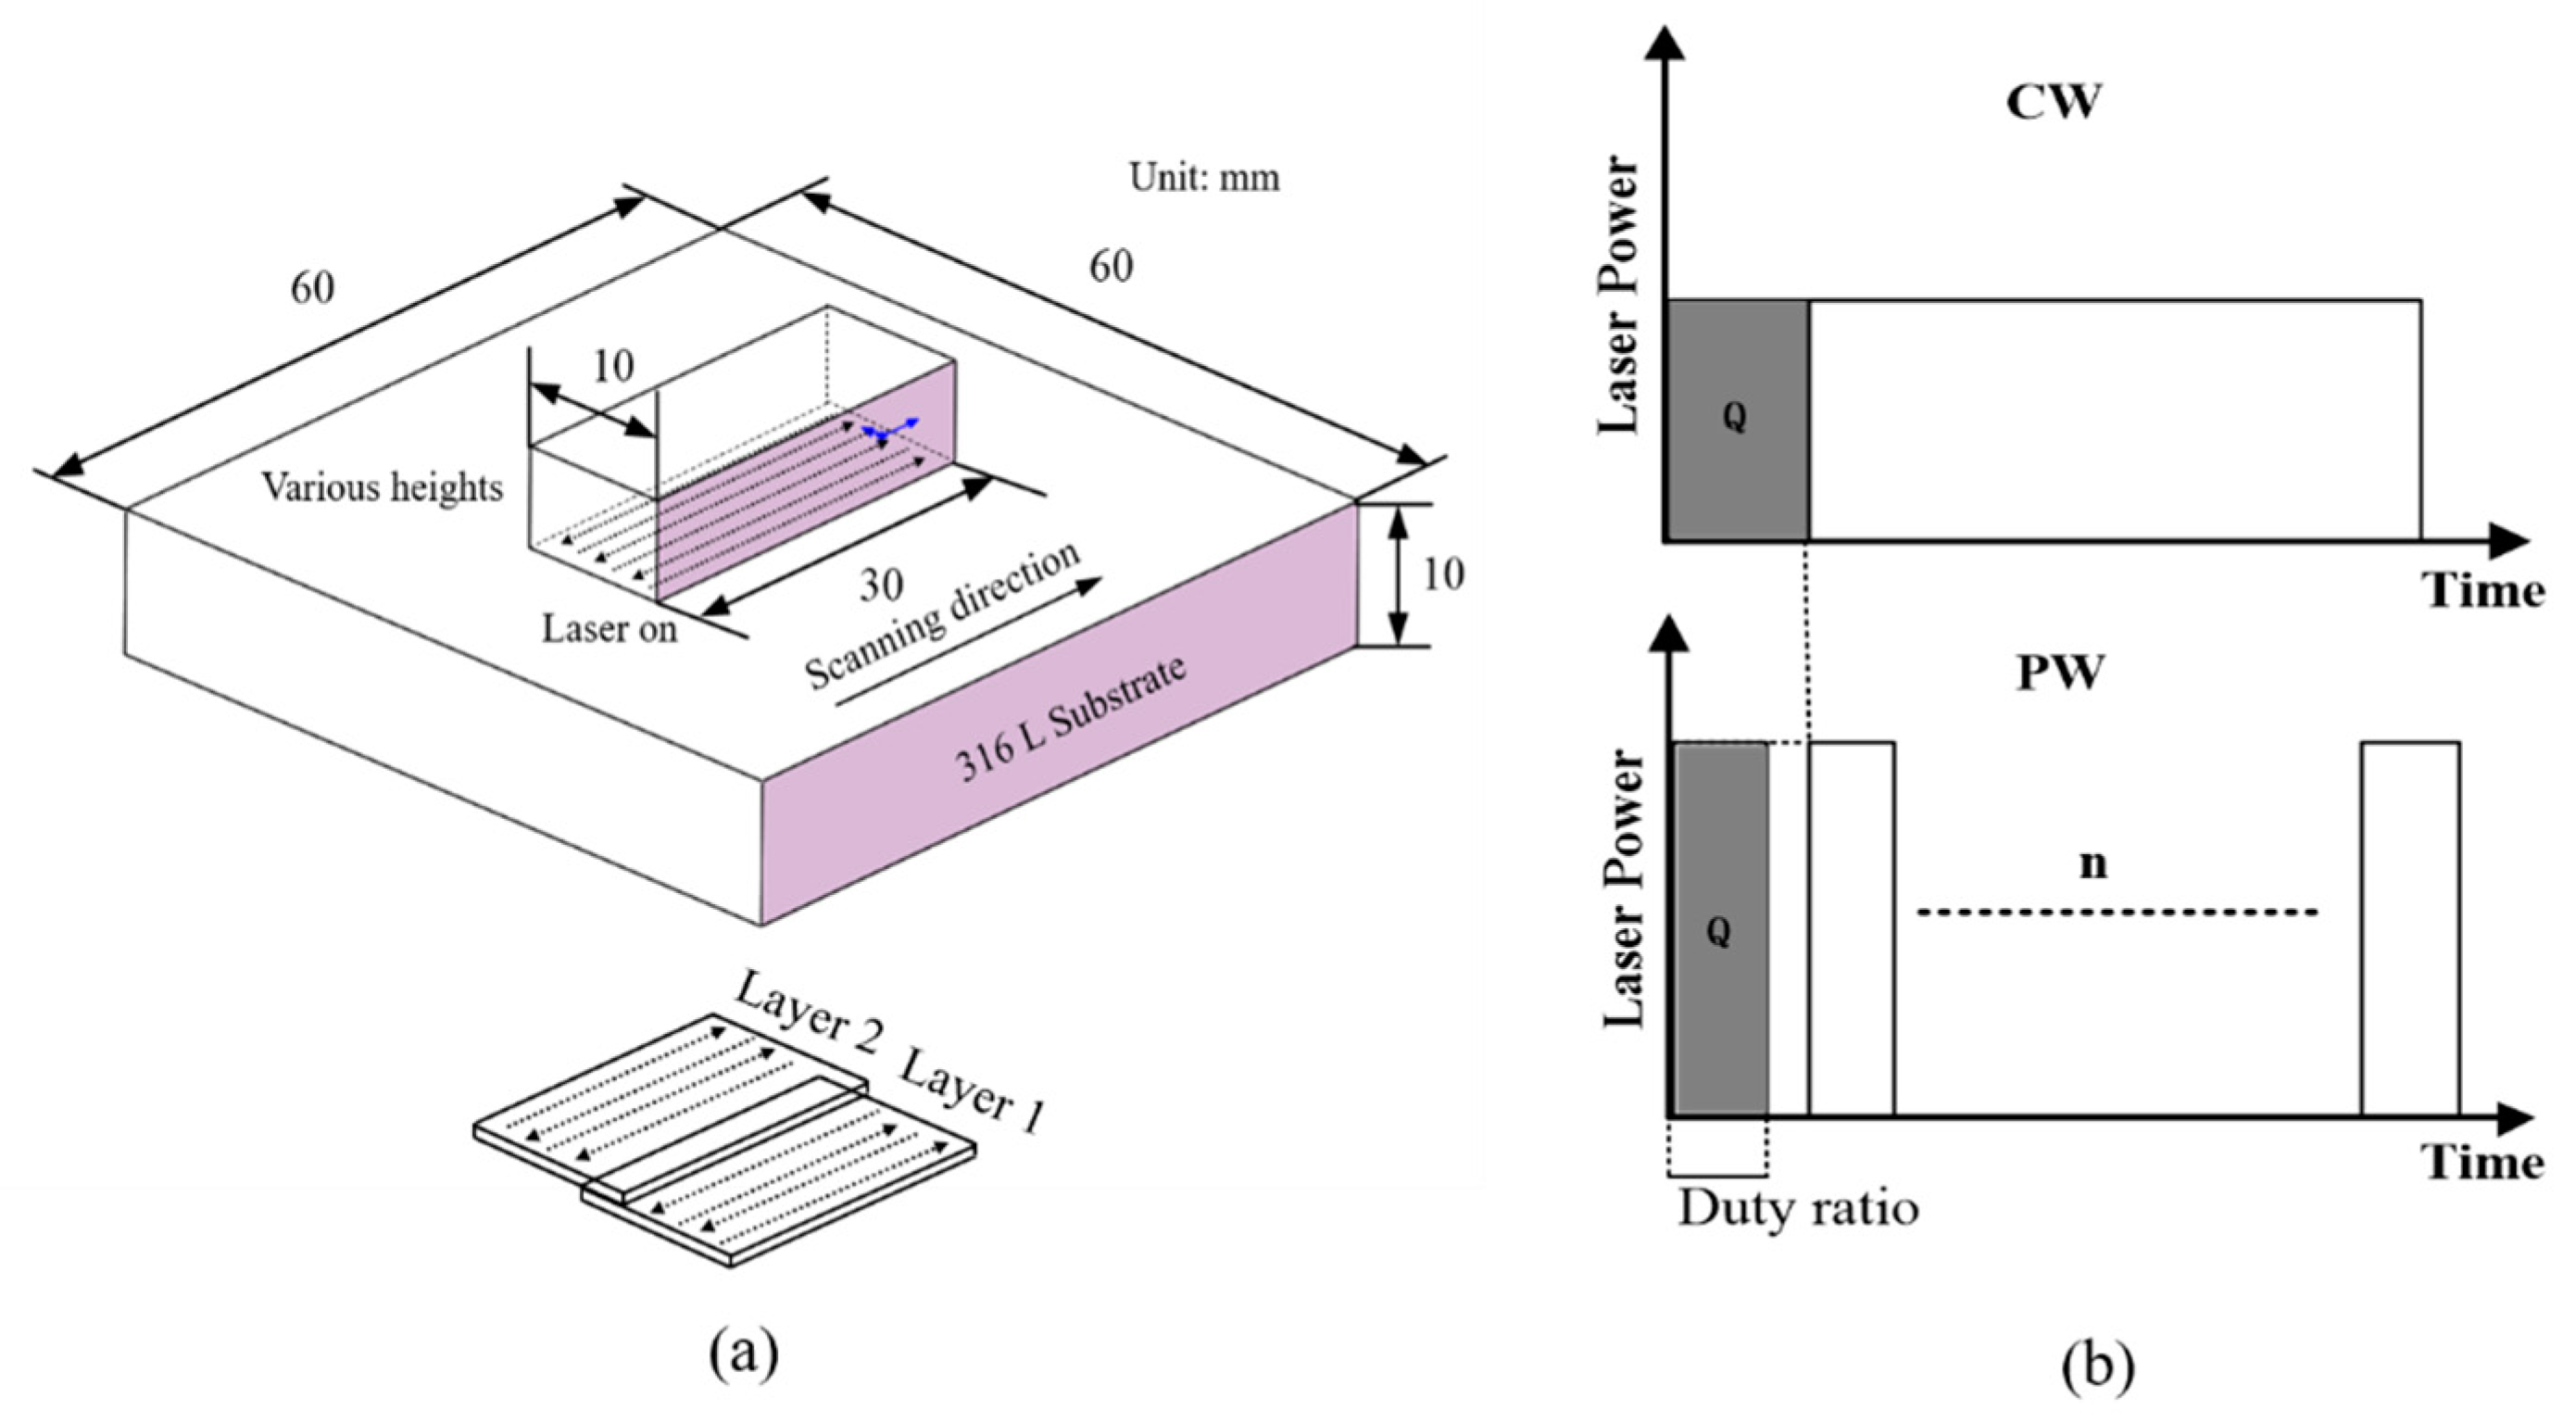
2. Materials and Methods
3. Results
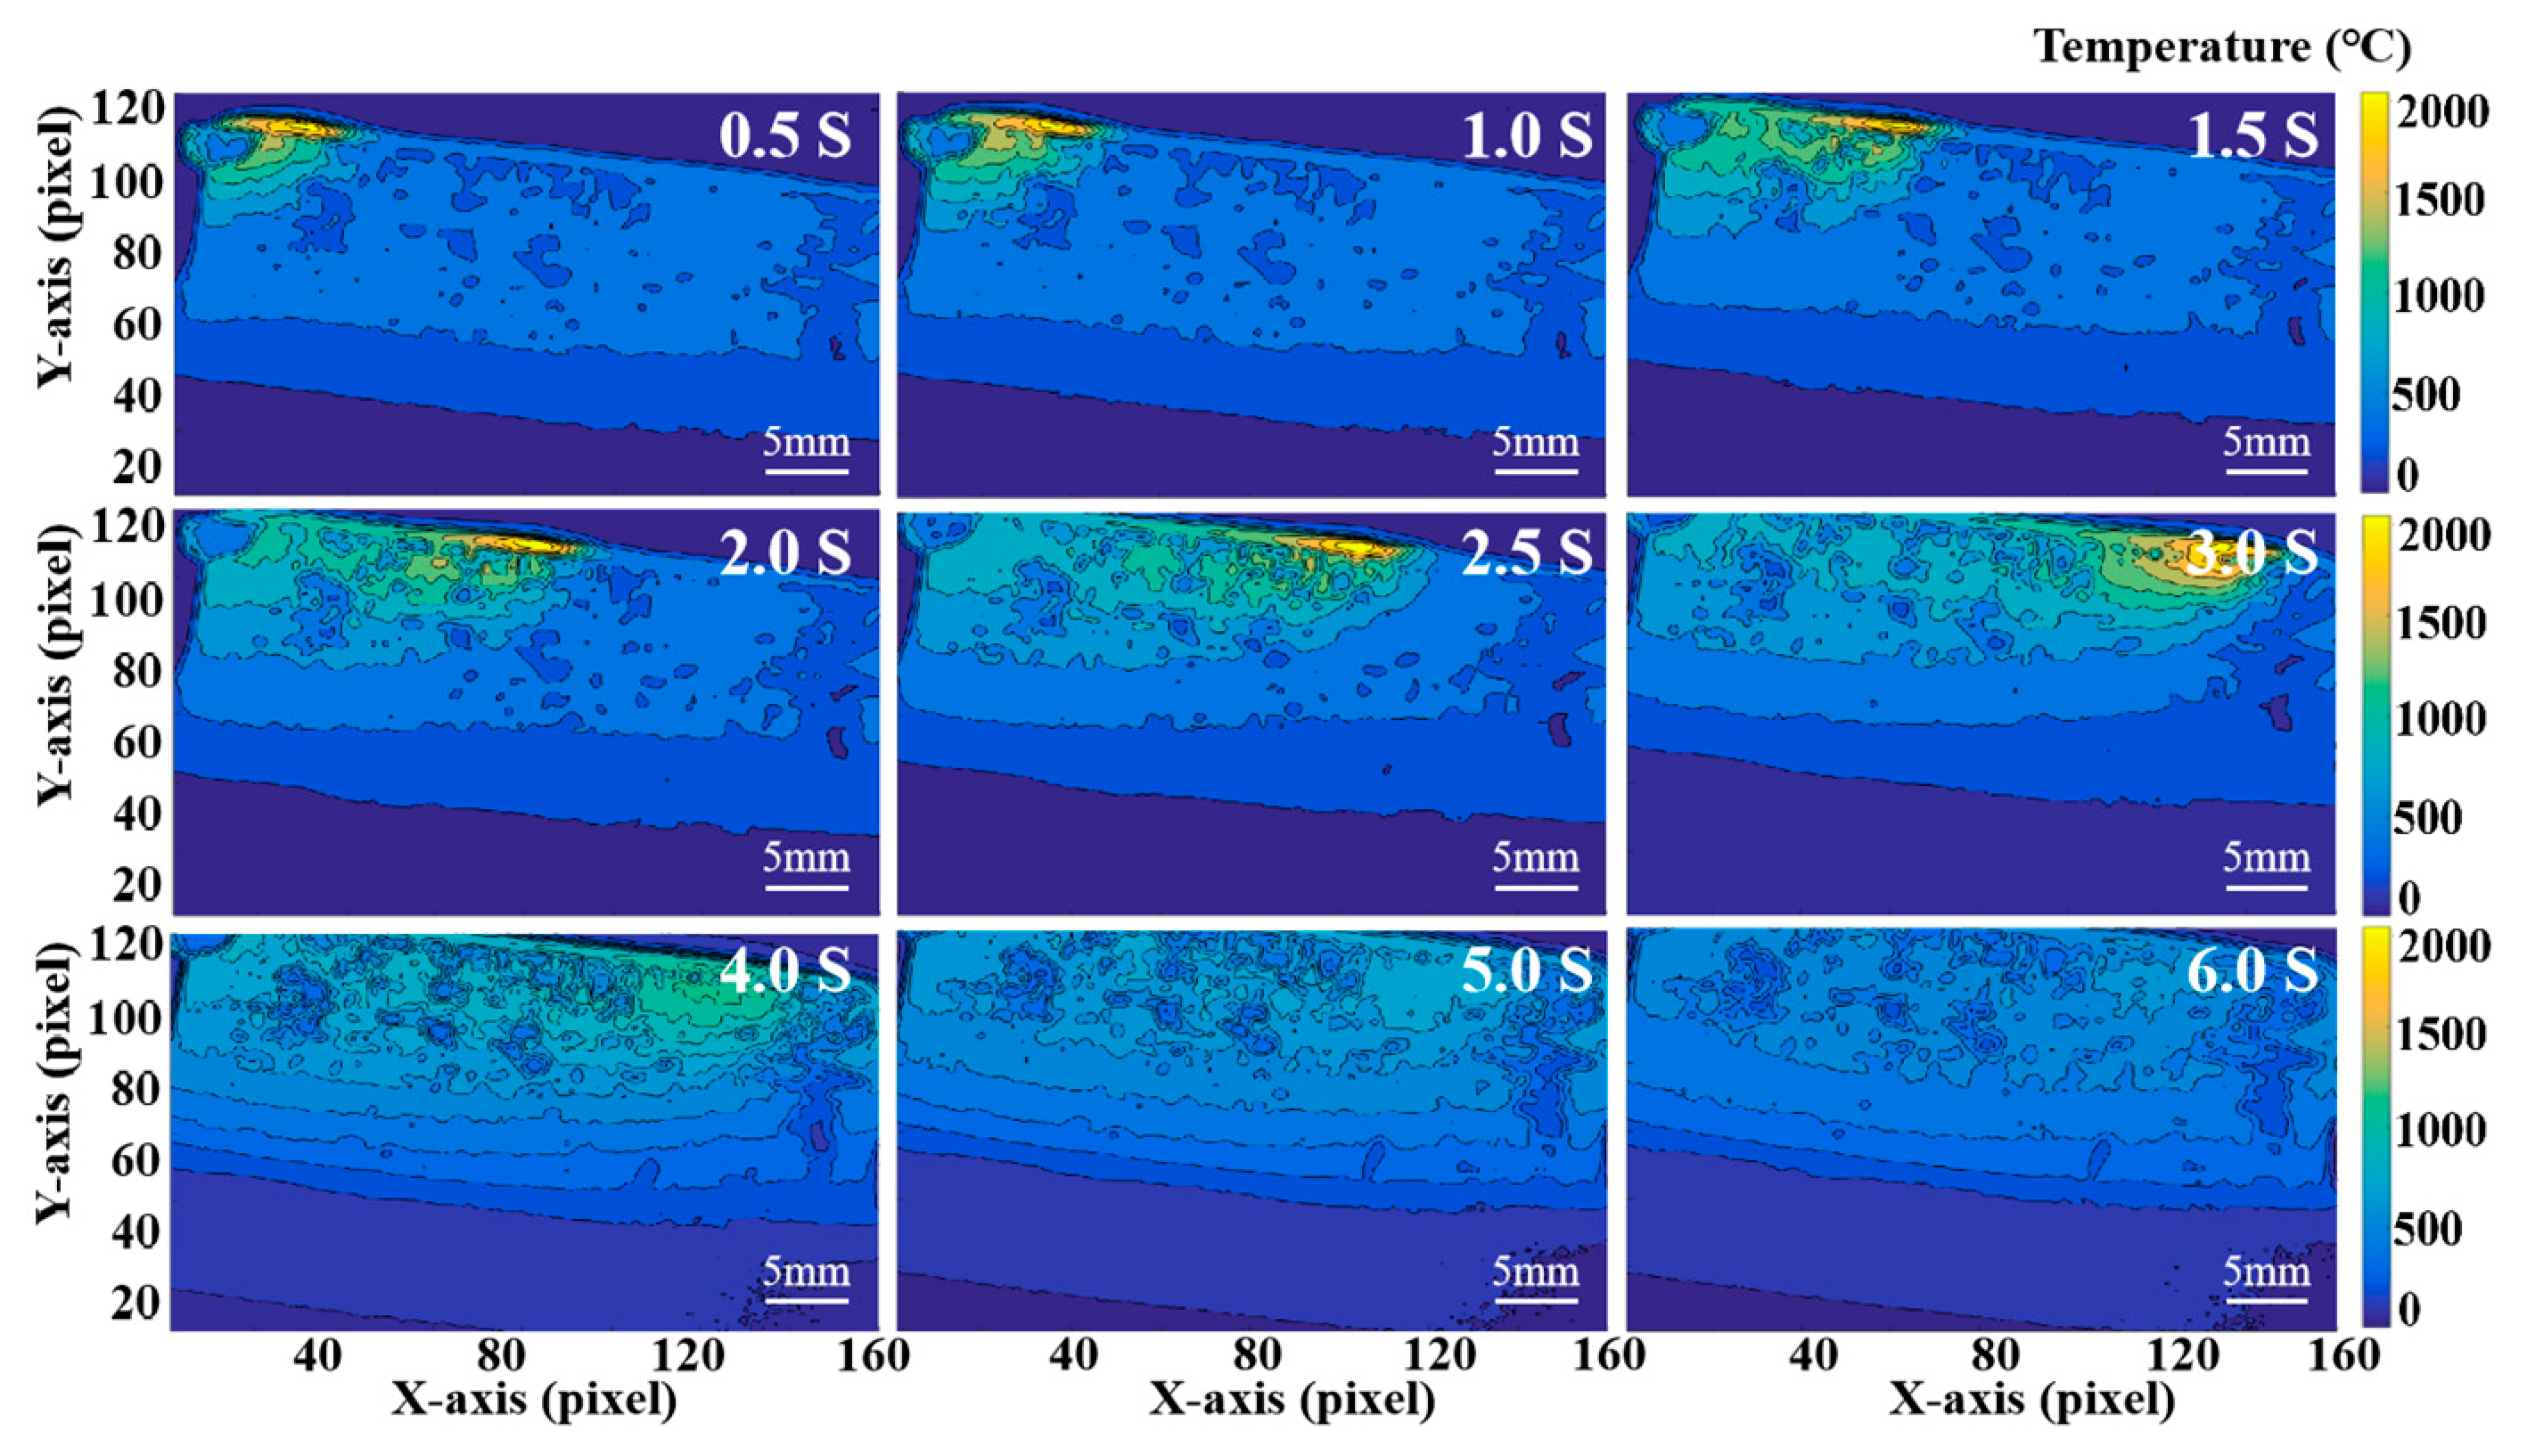
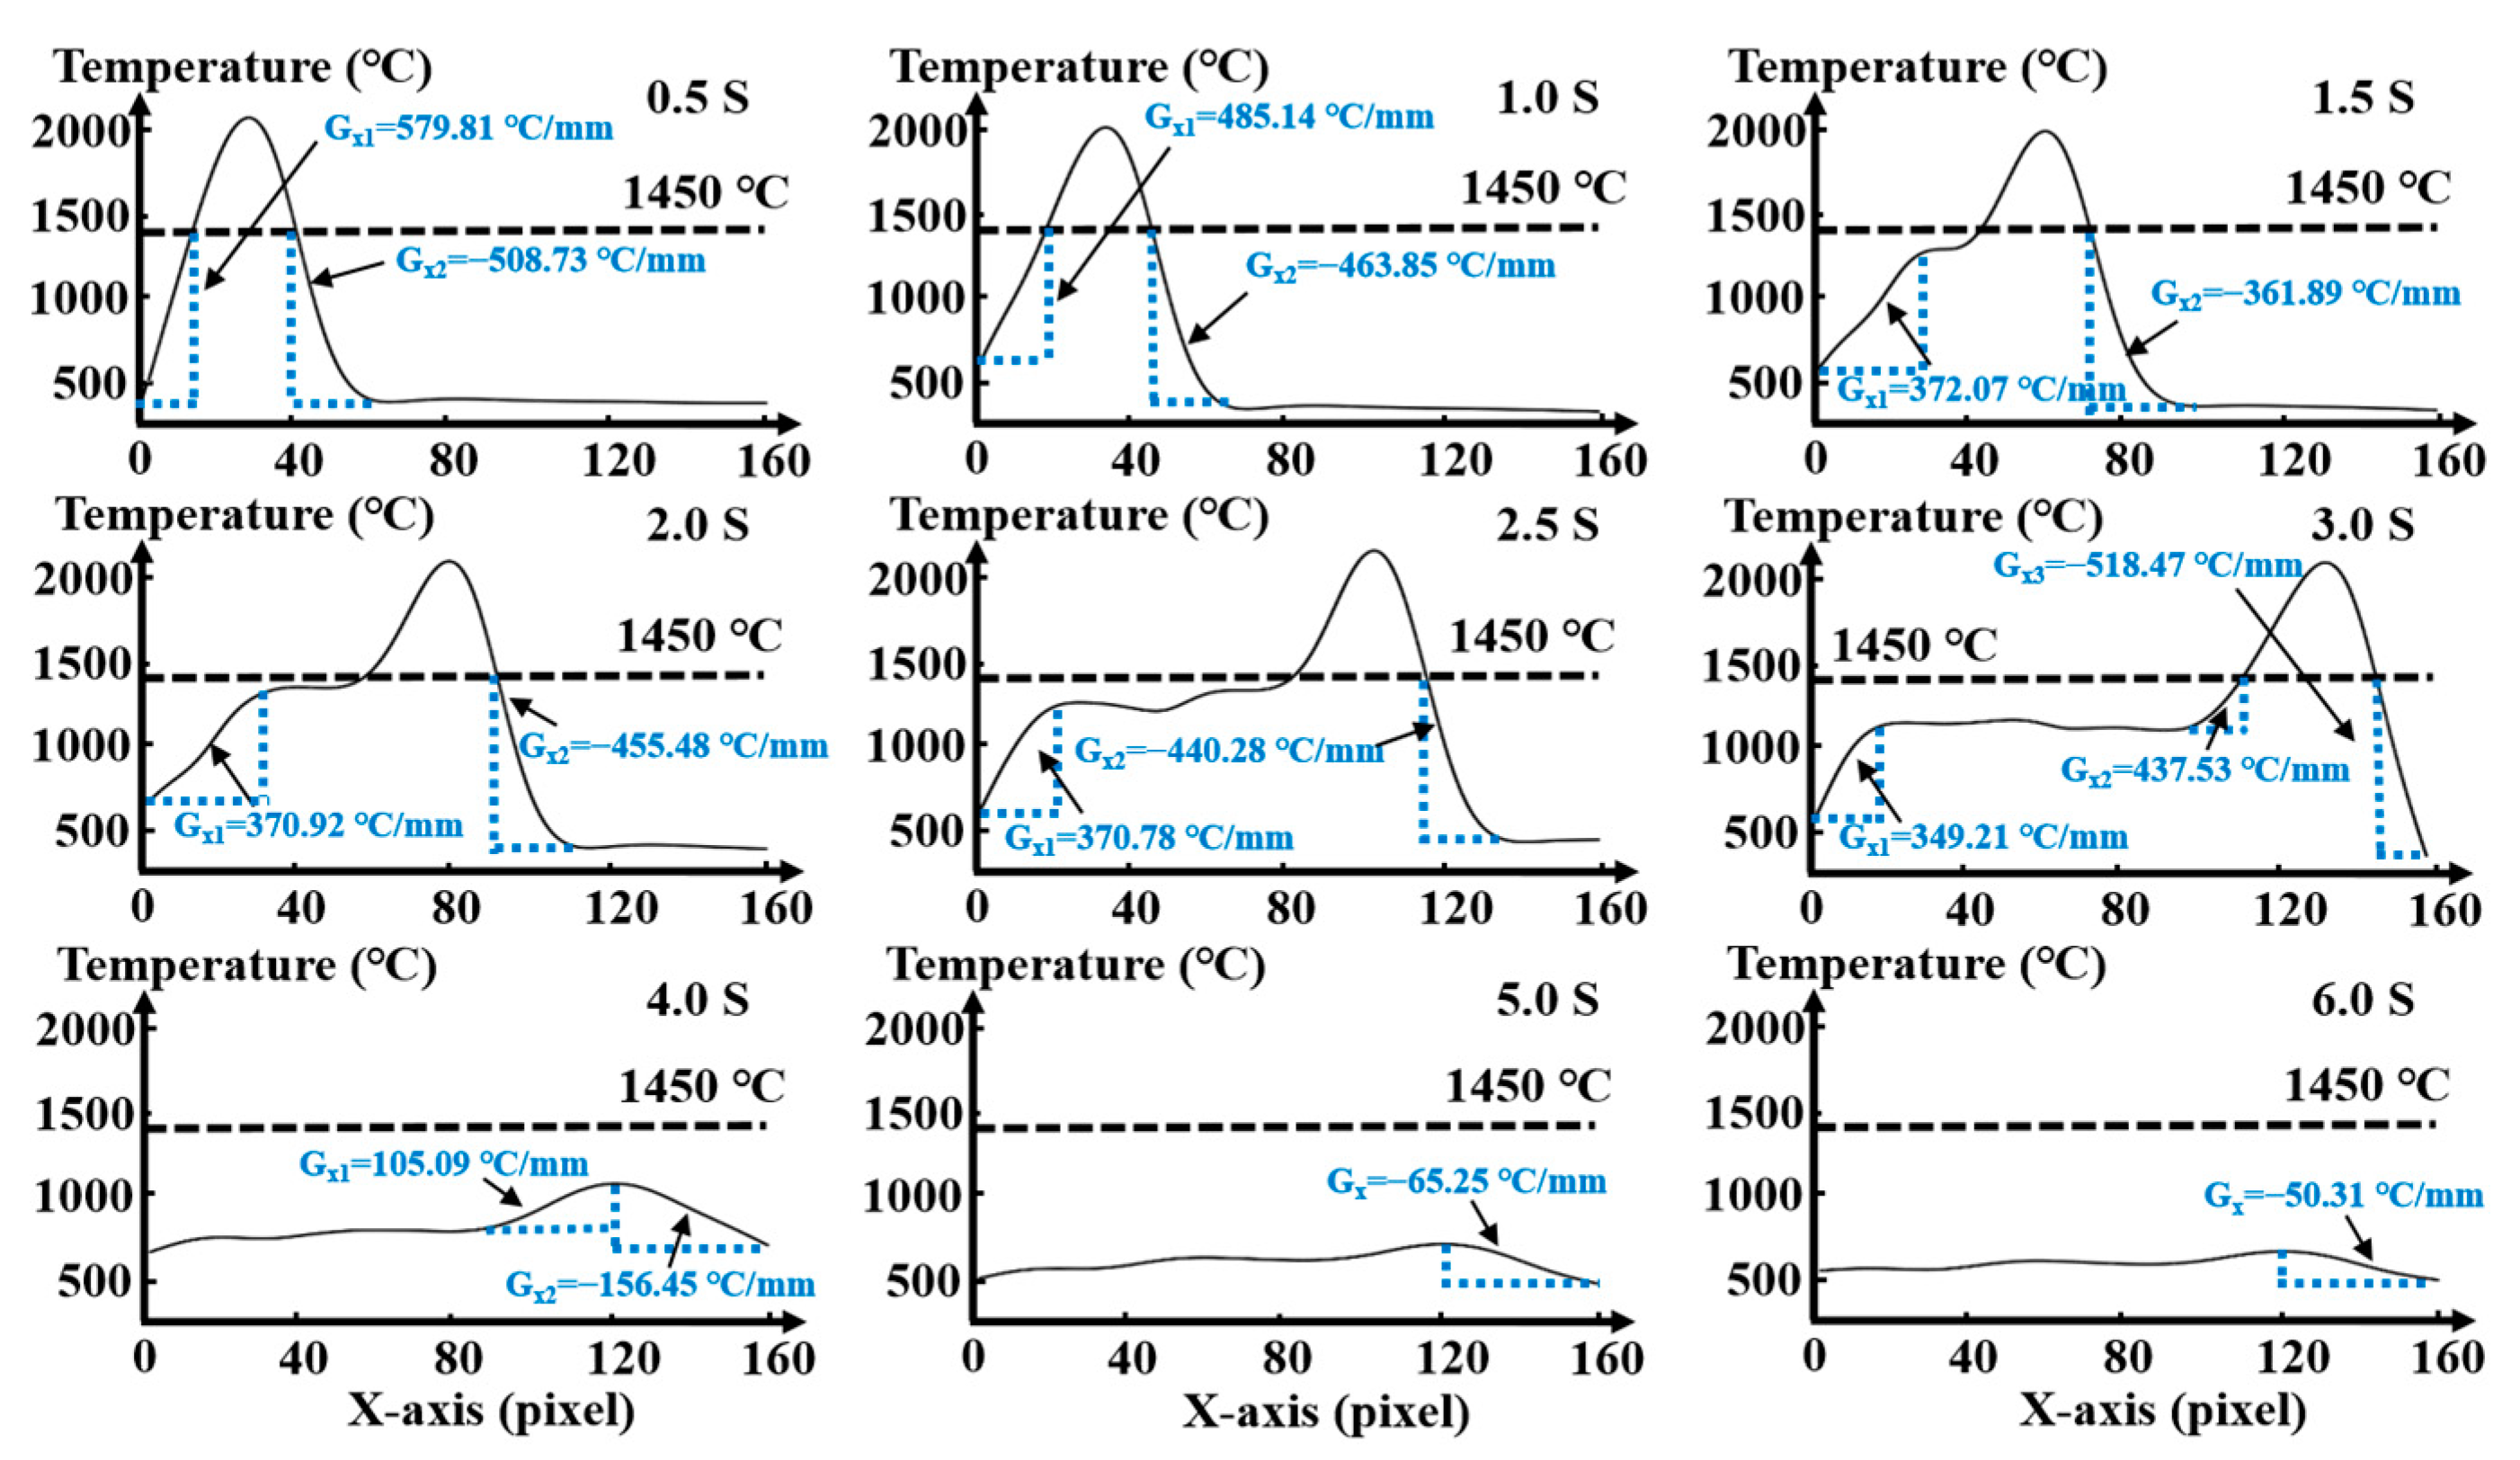
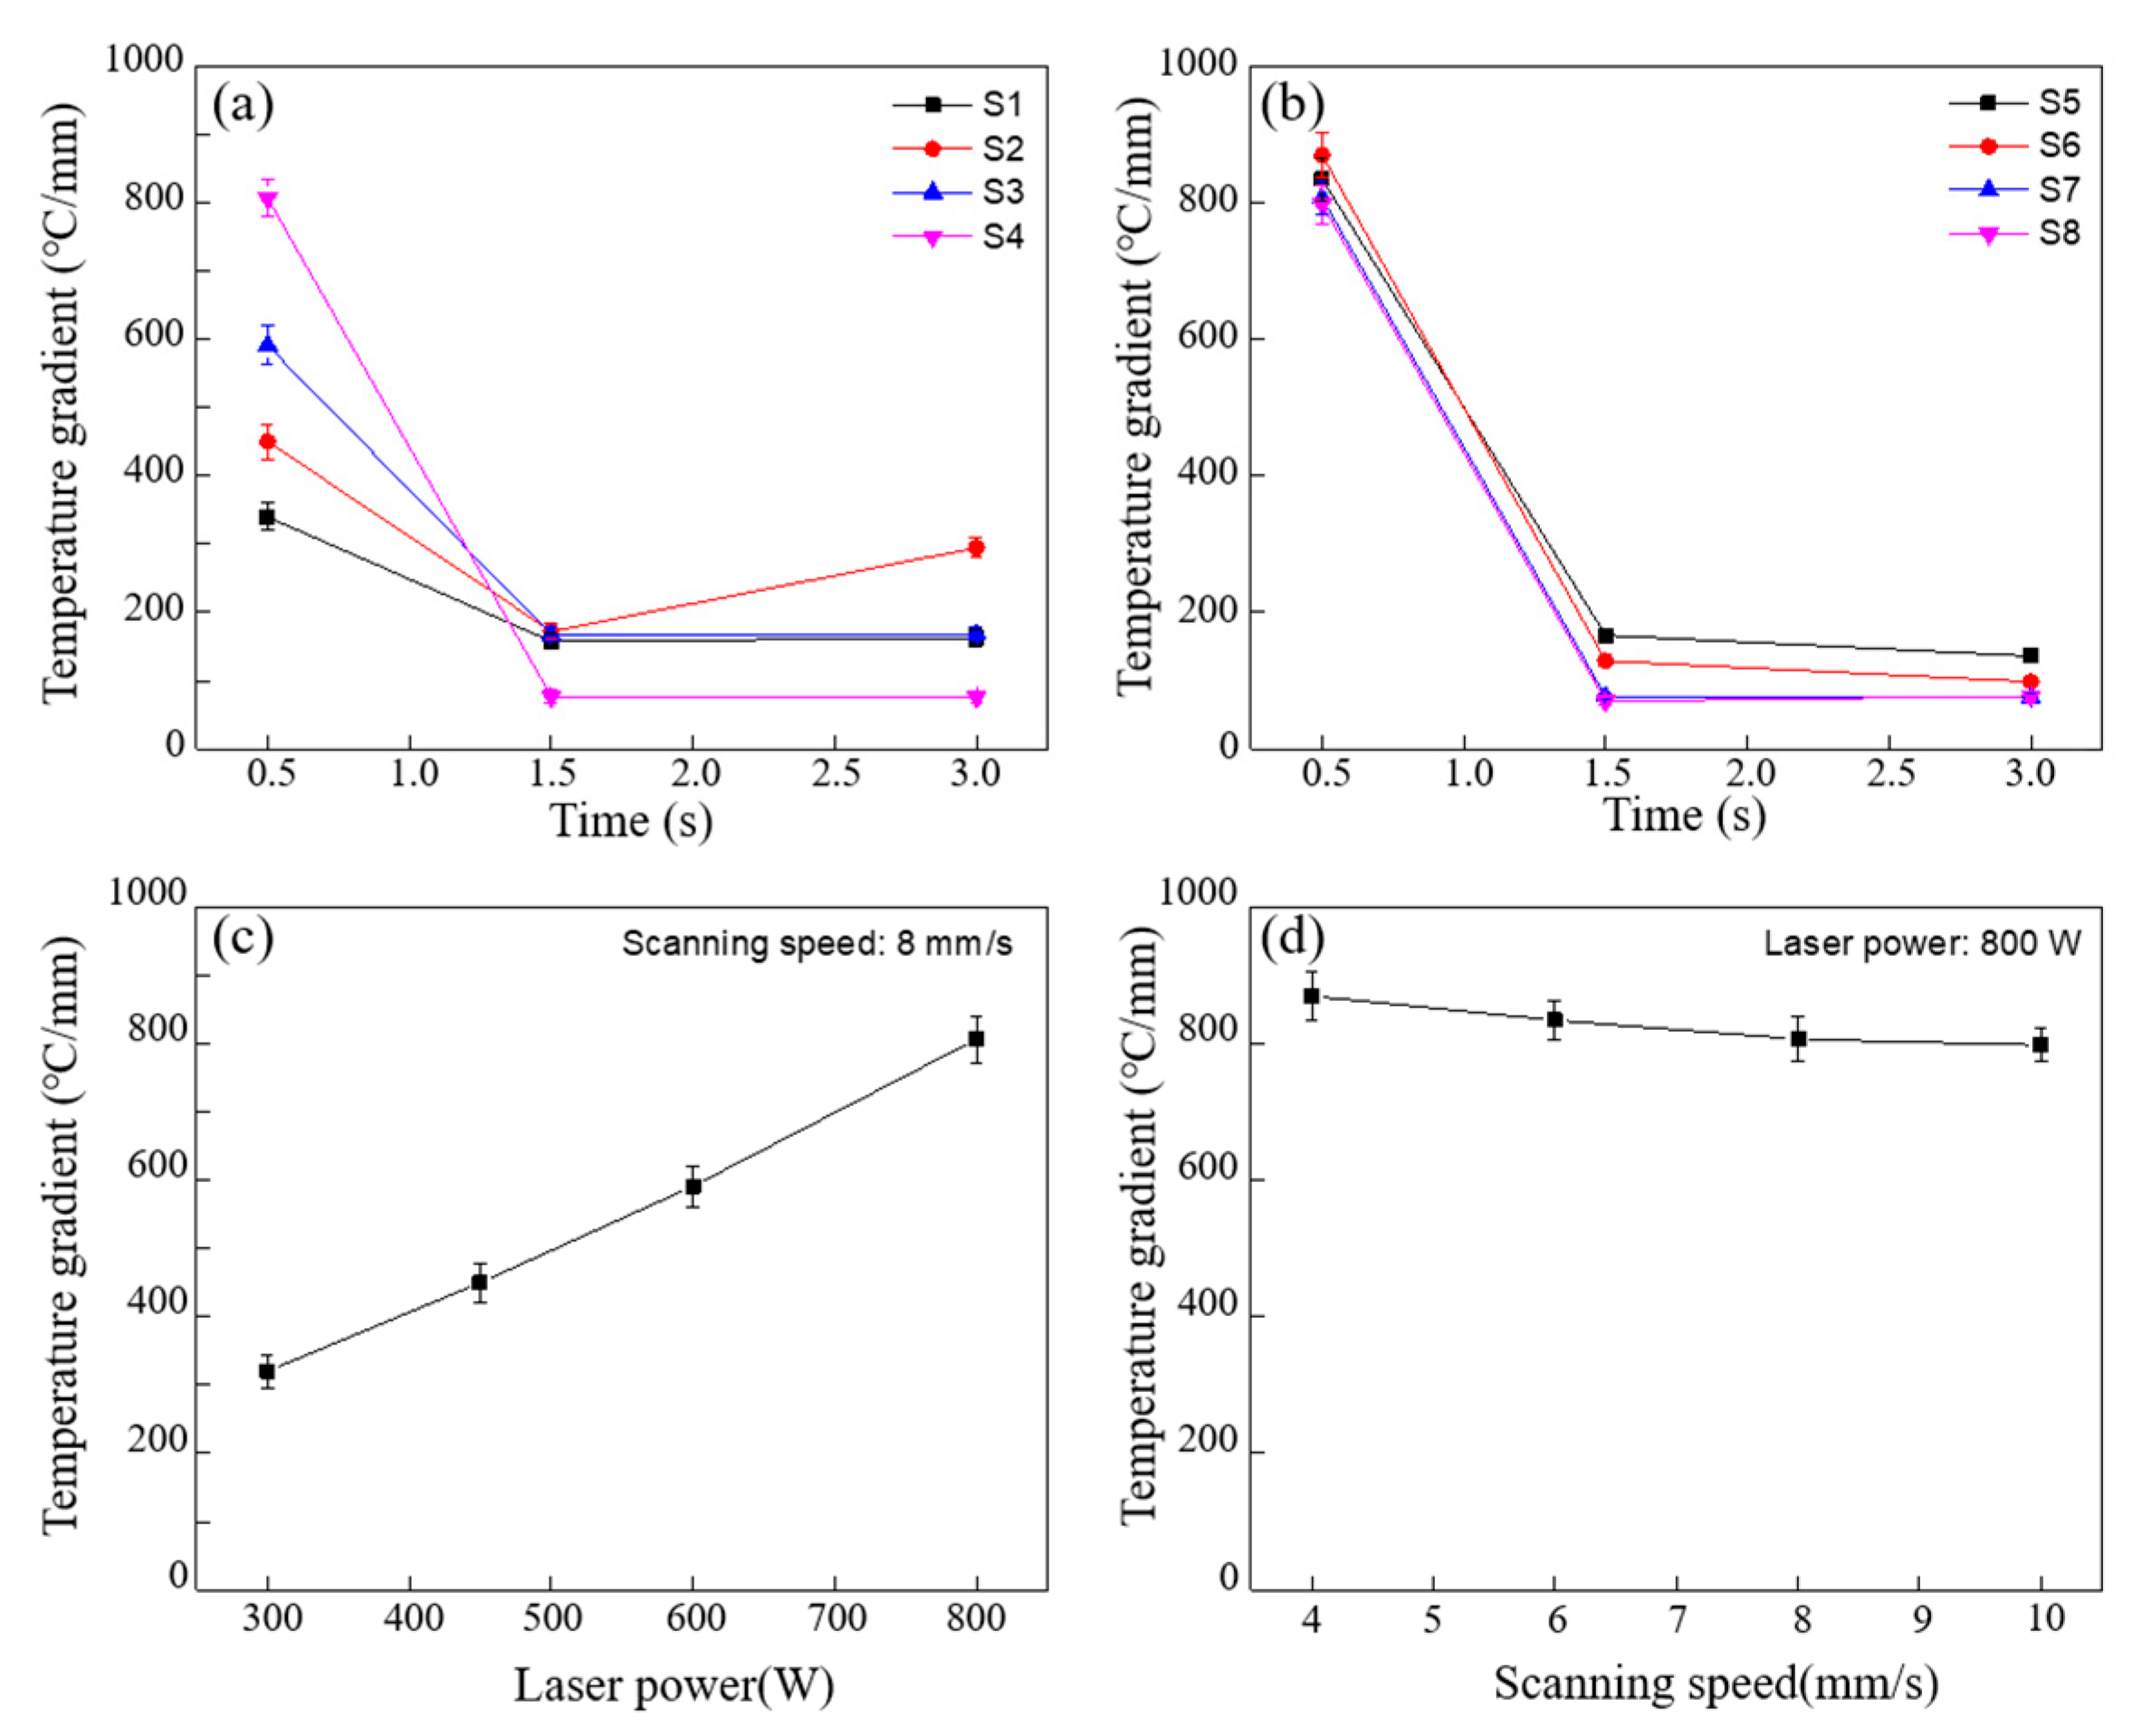
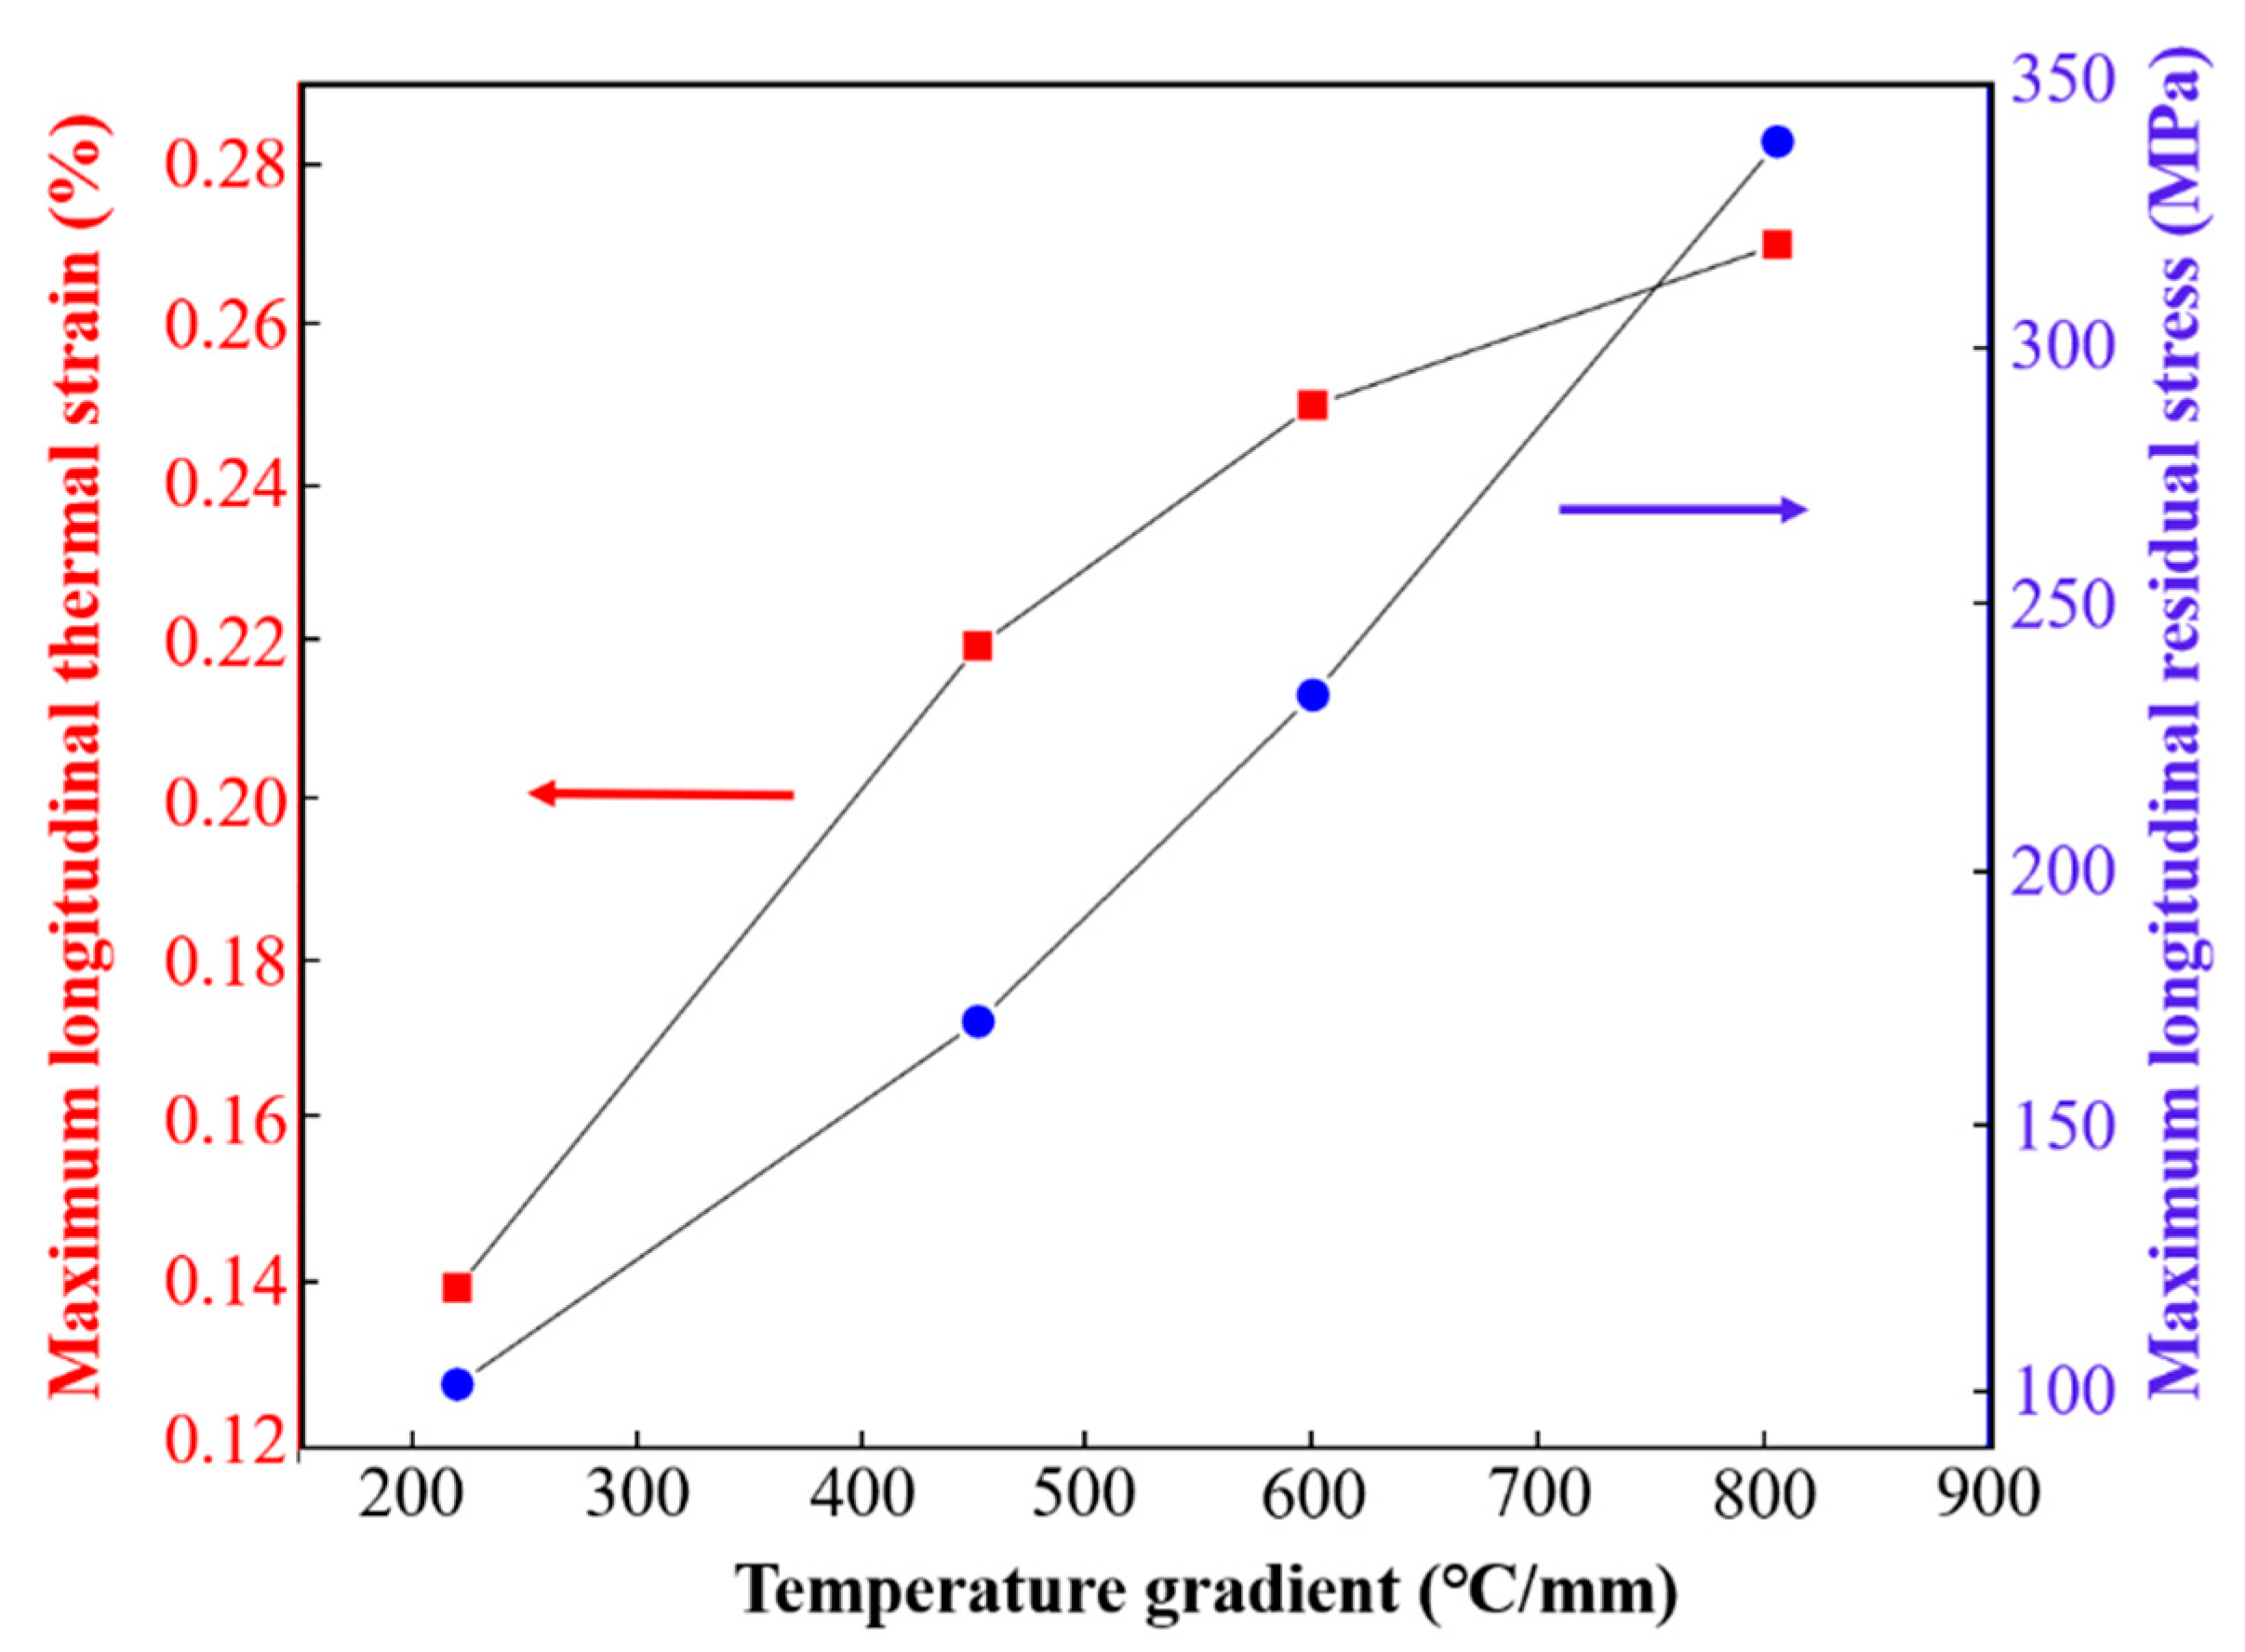
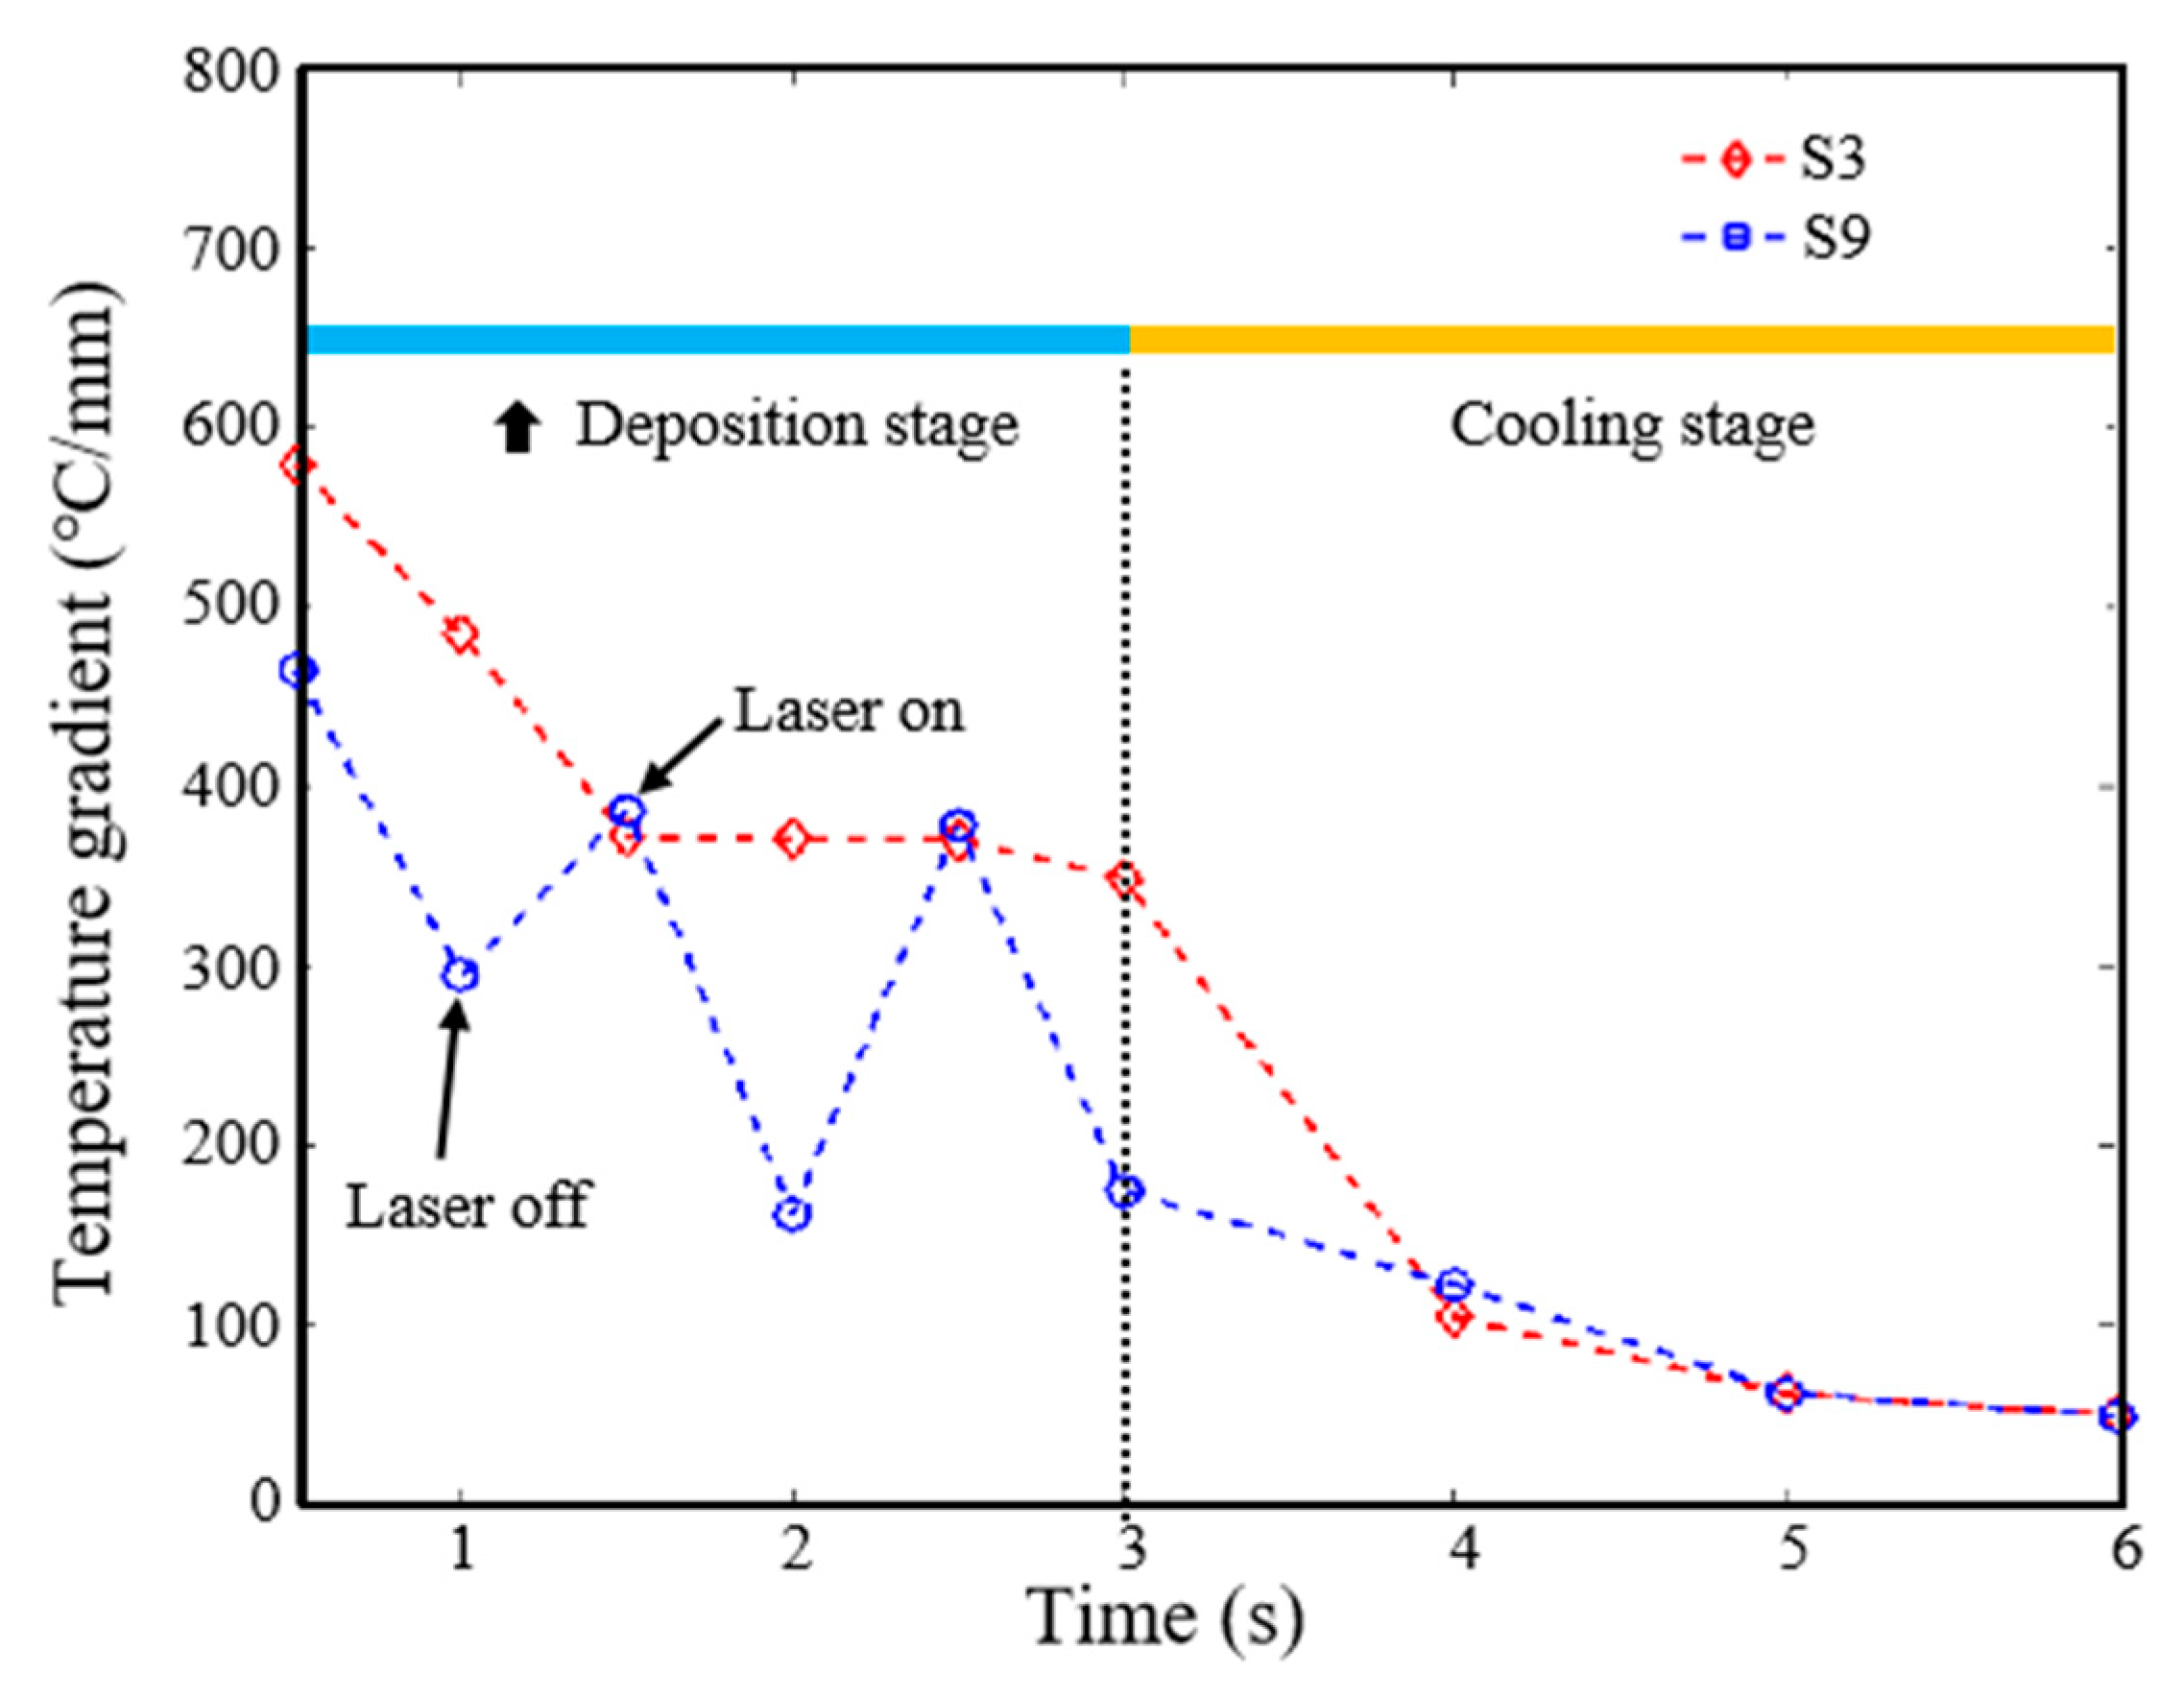
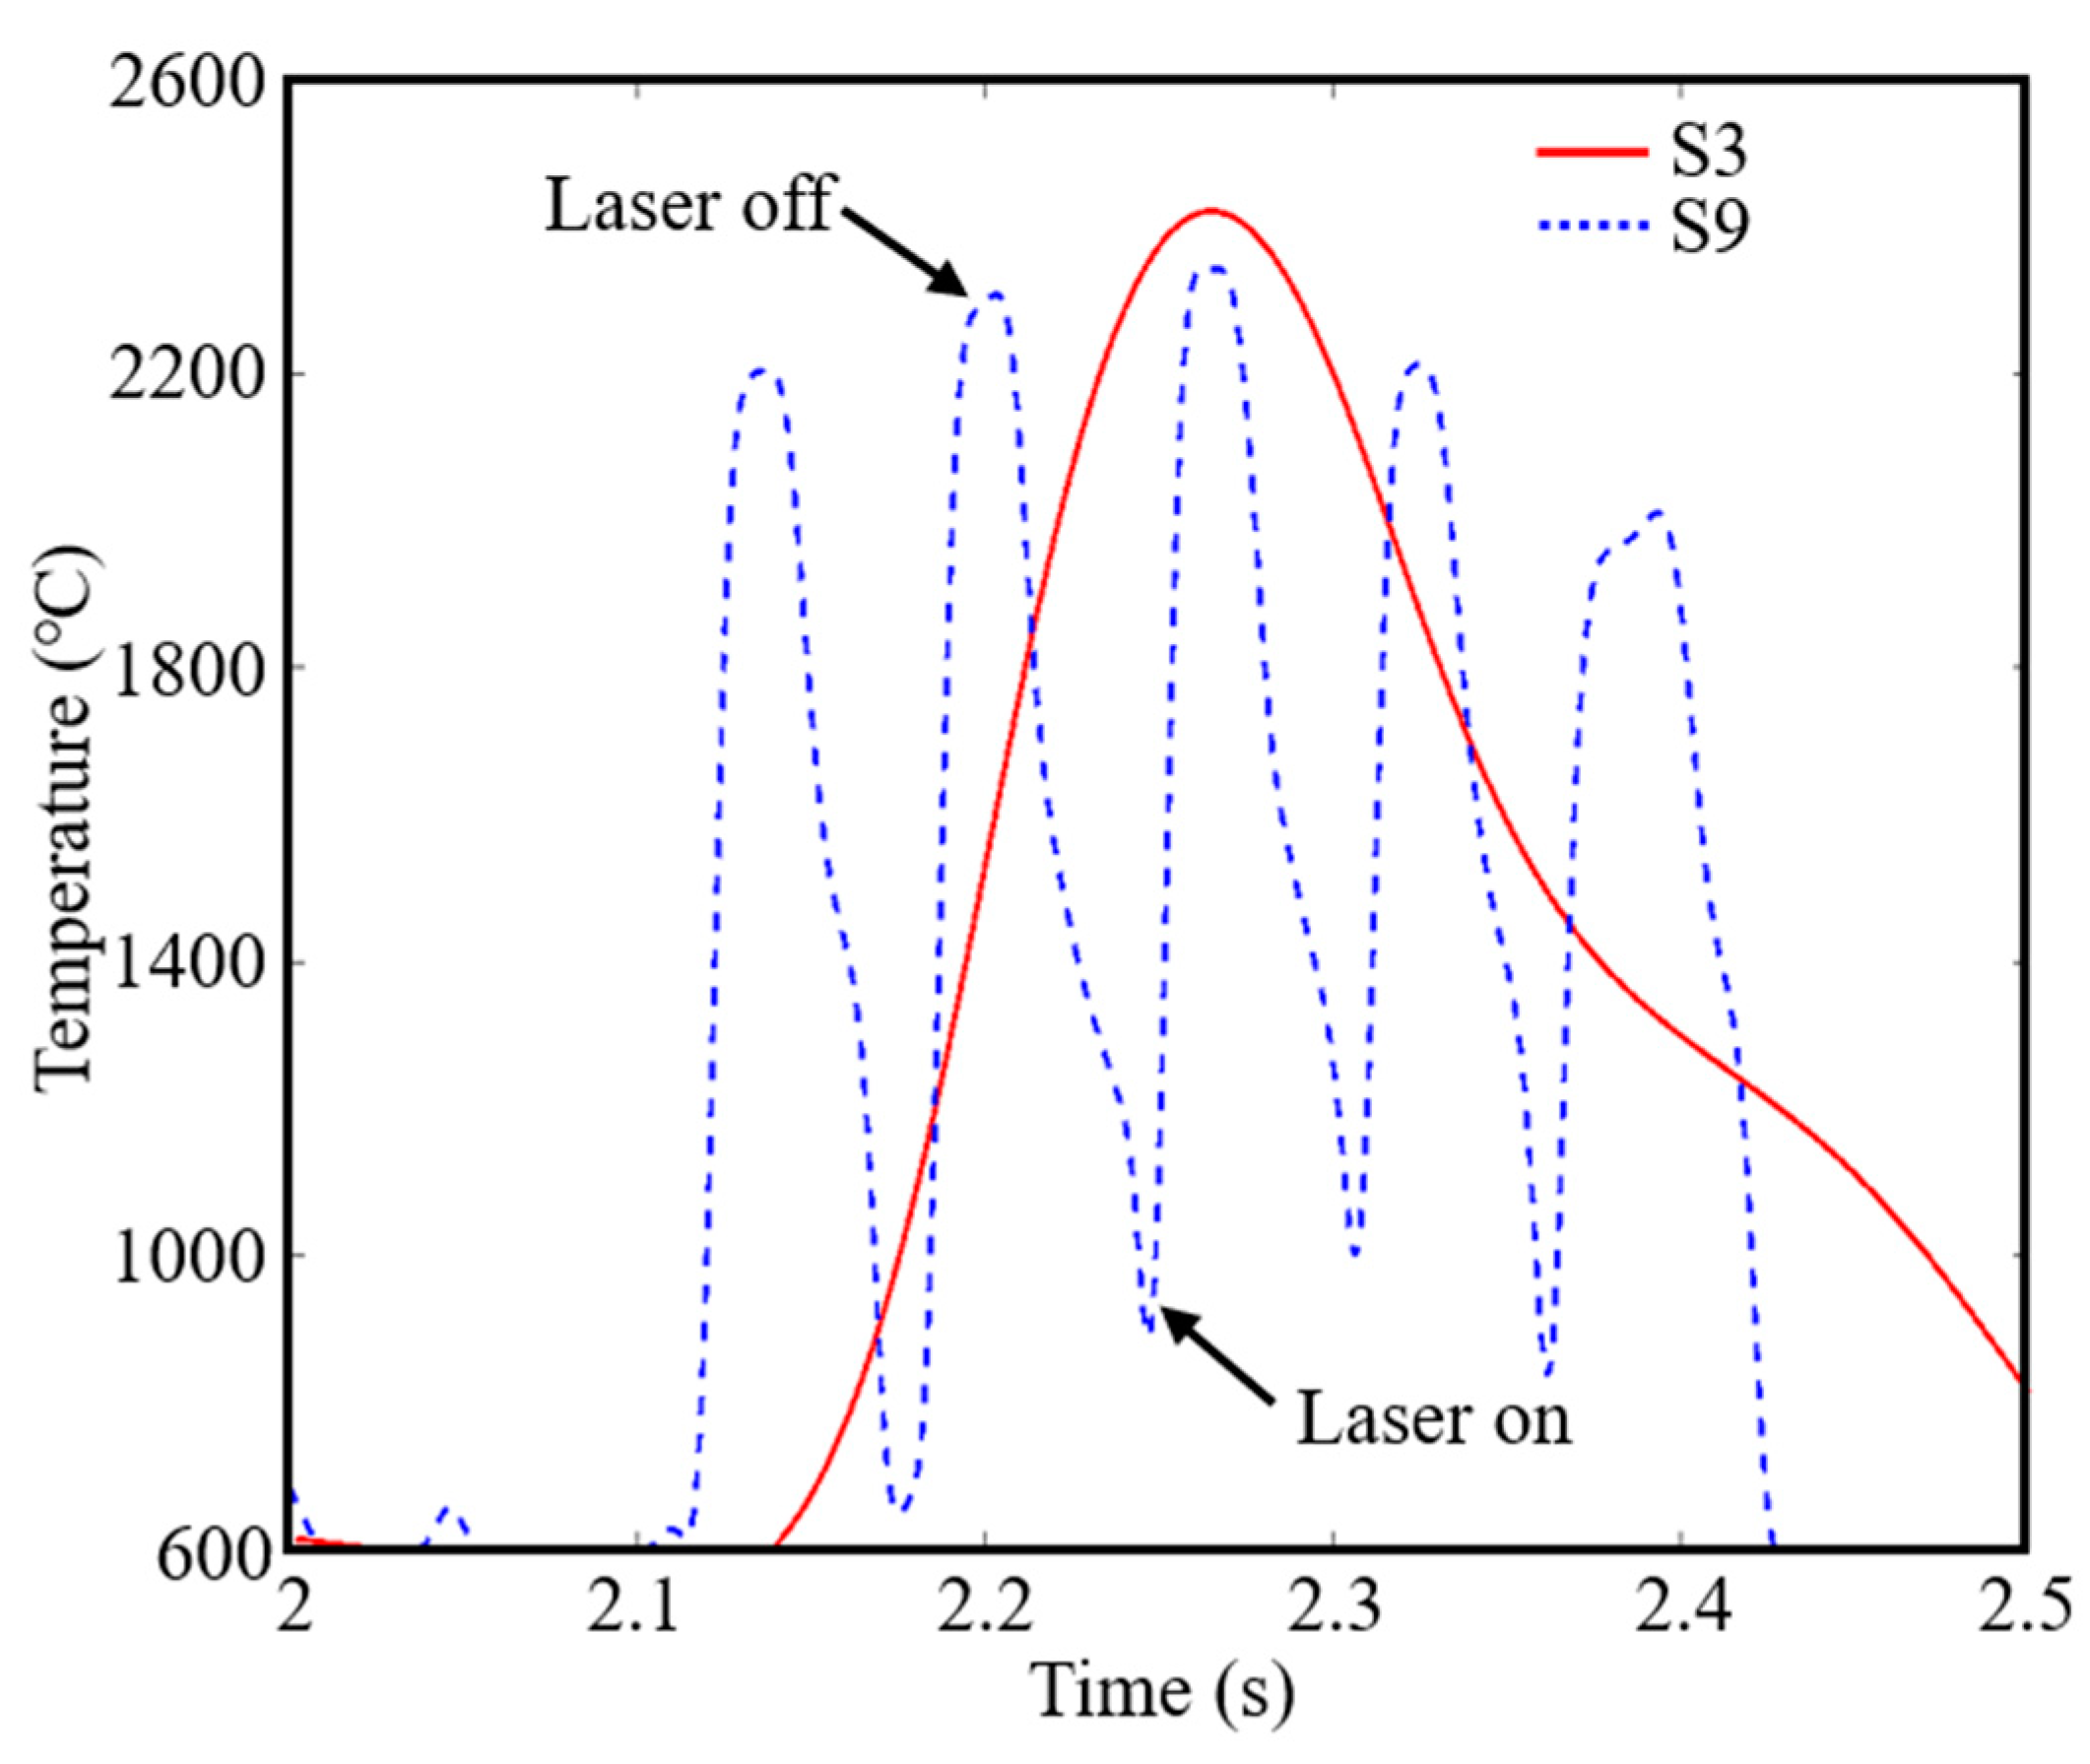
3.1. Temperature Gradient in Solid Region
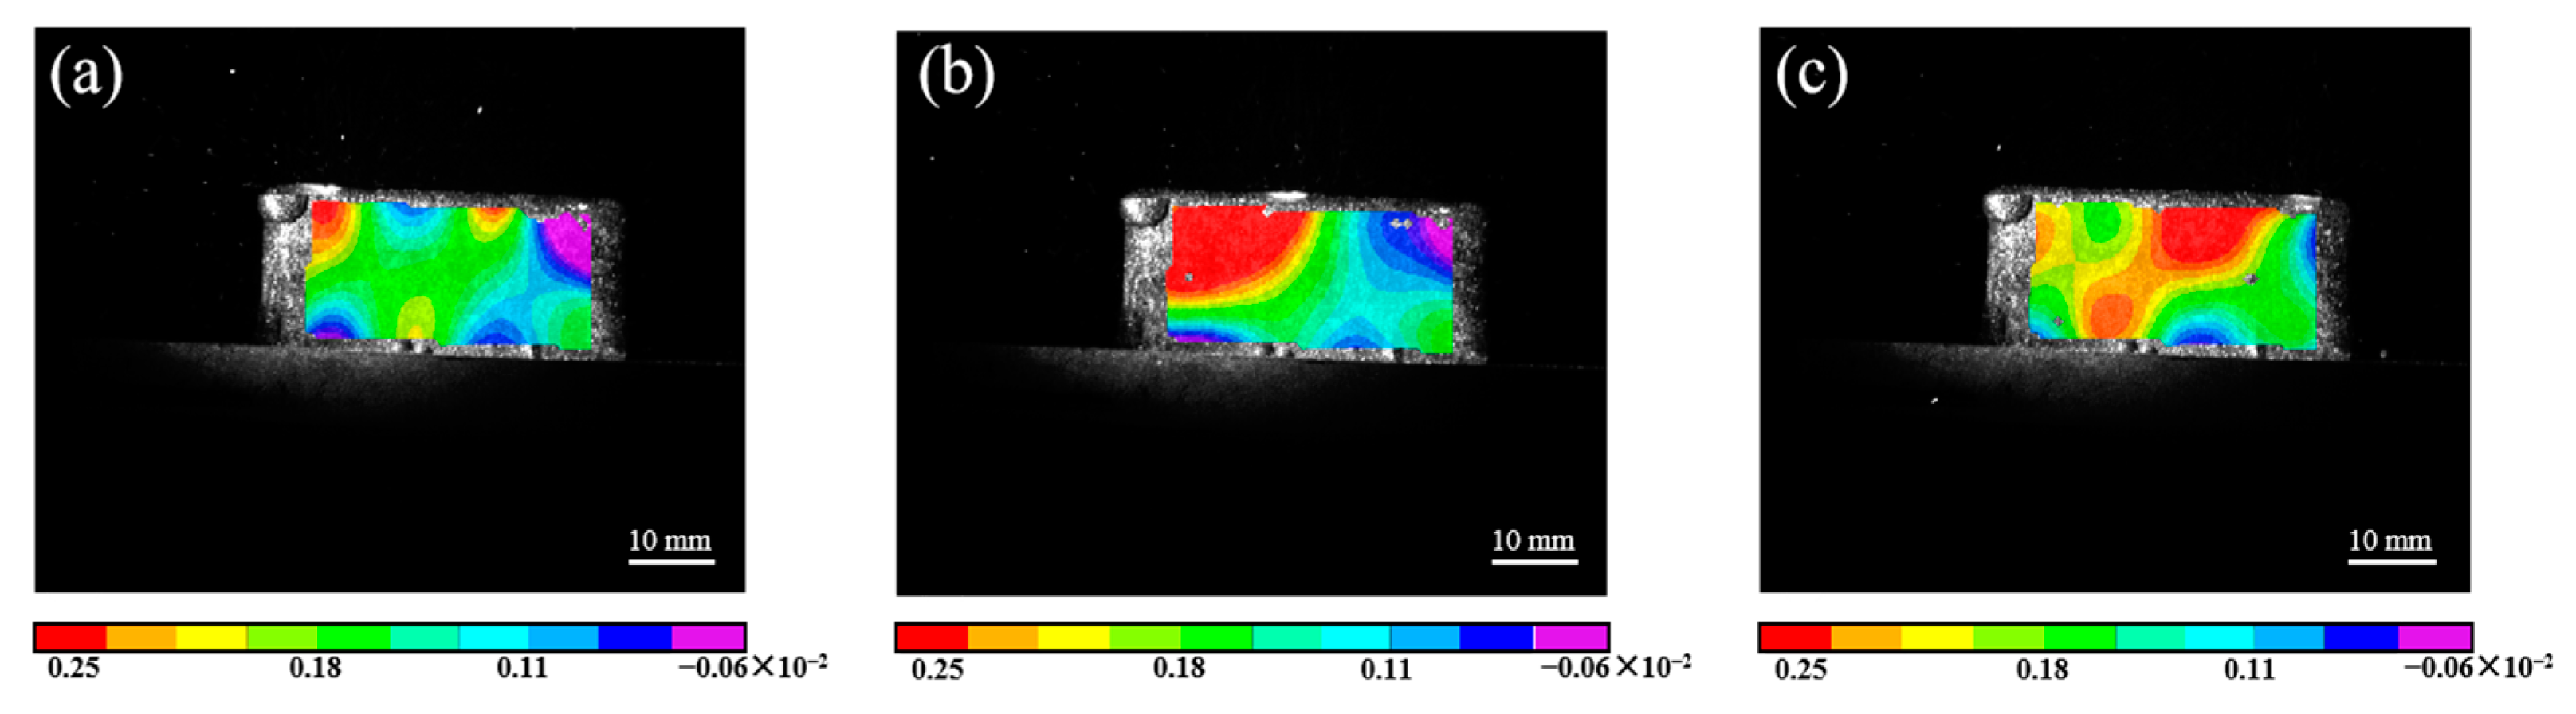
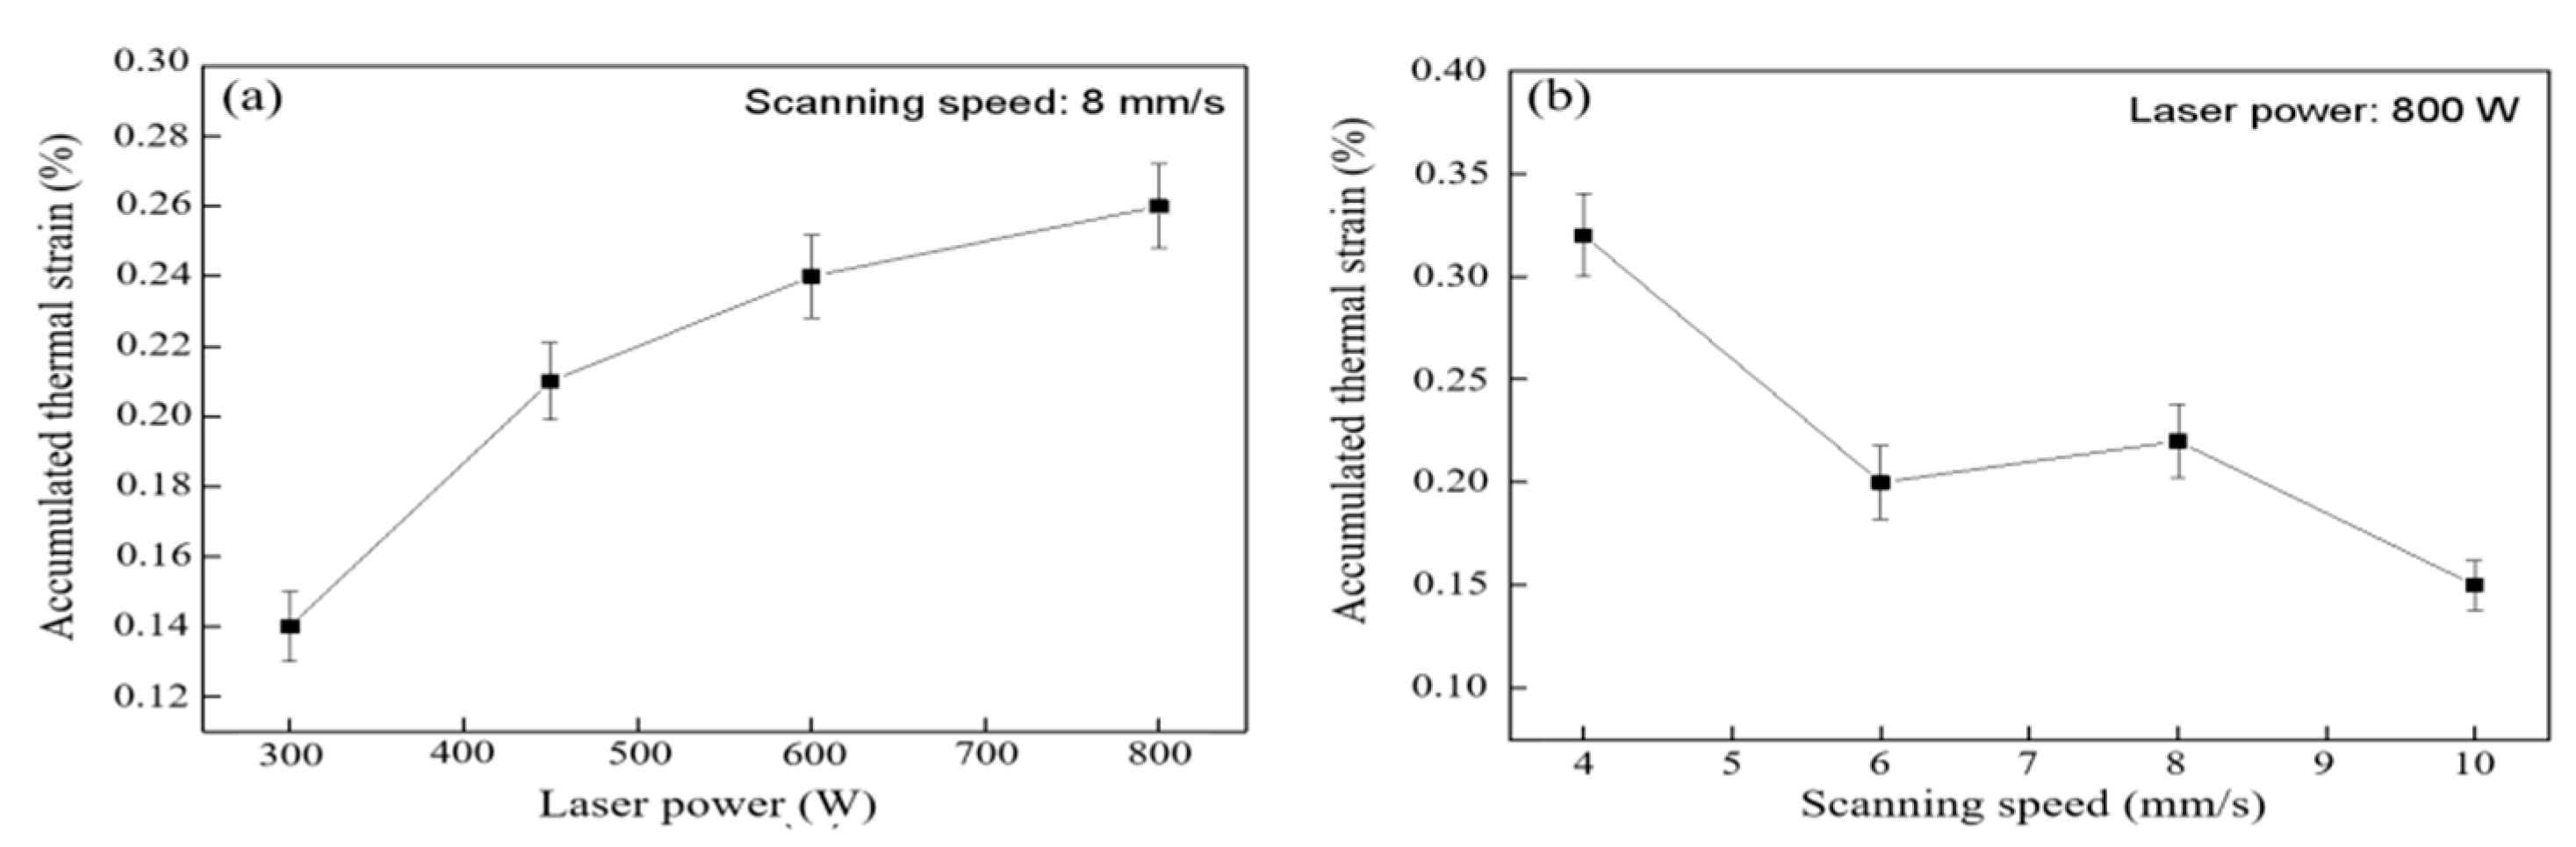
3.2. Thermal Strain
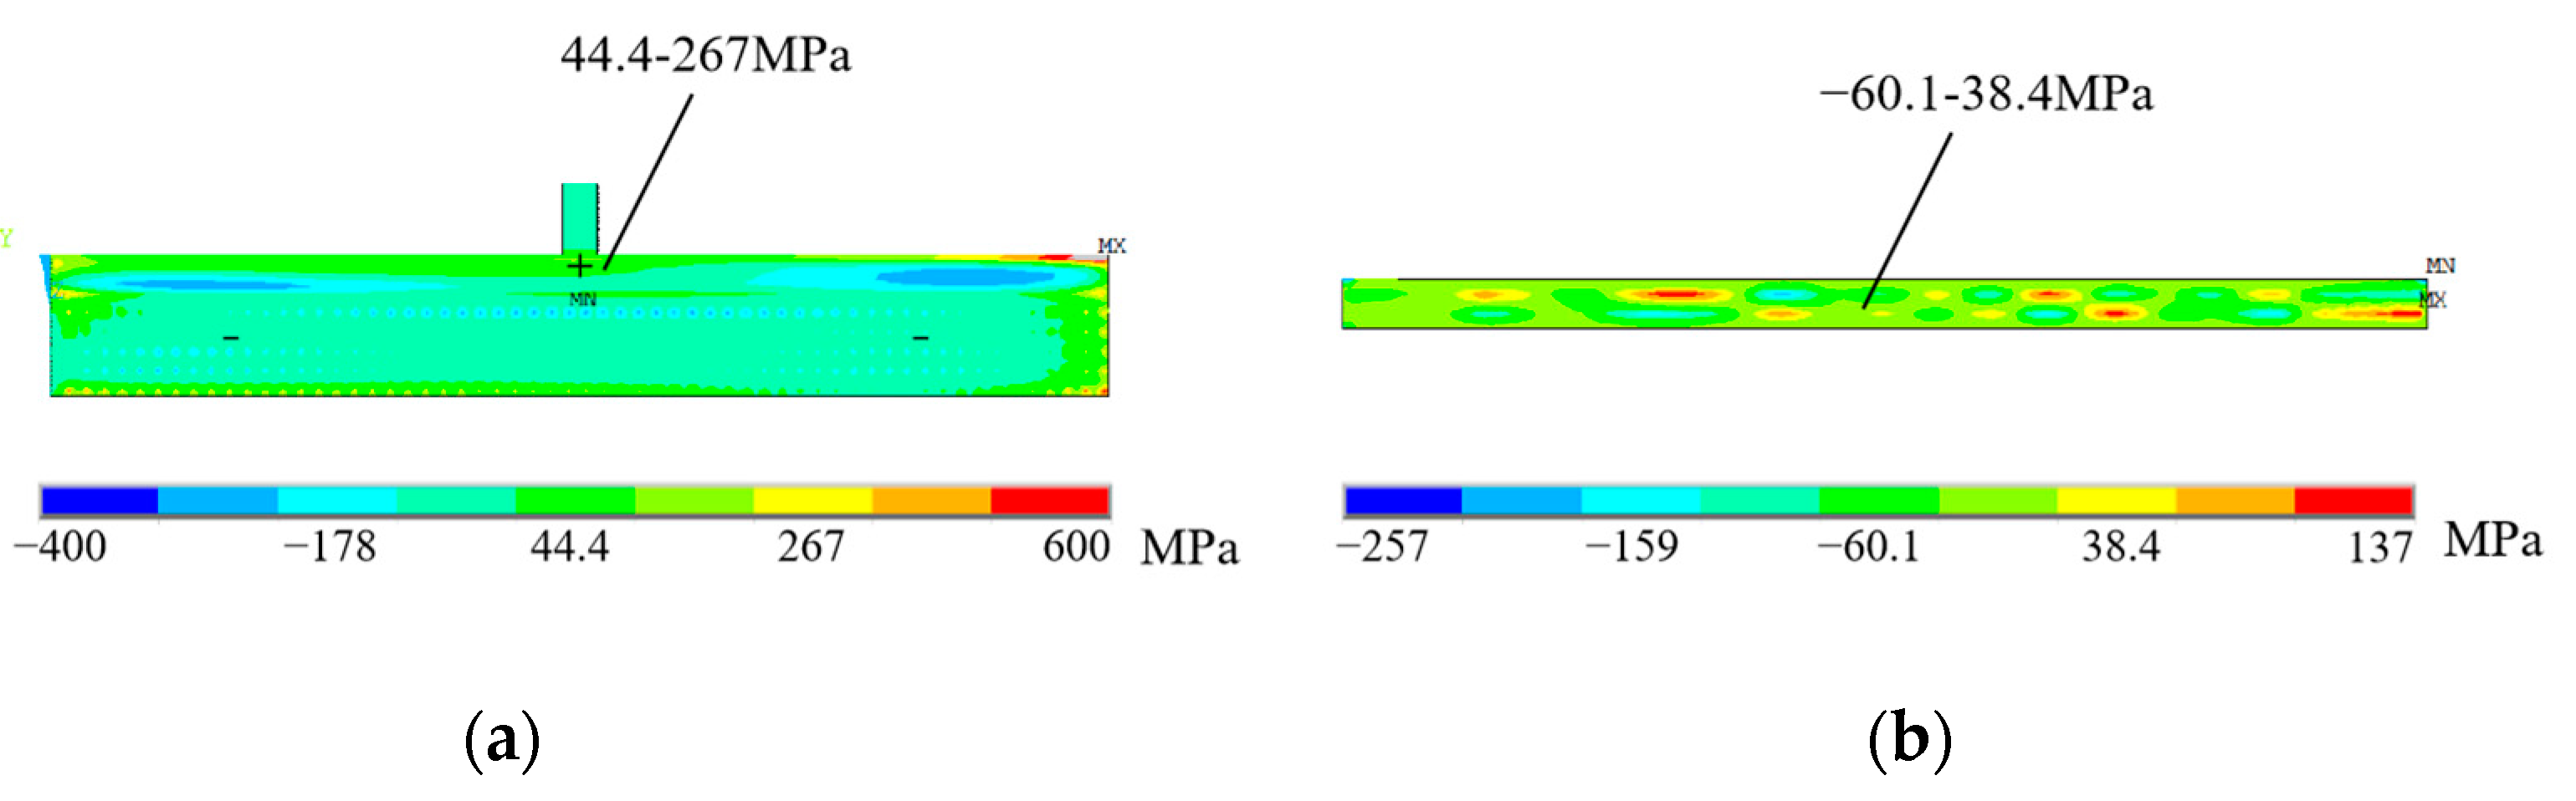
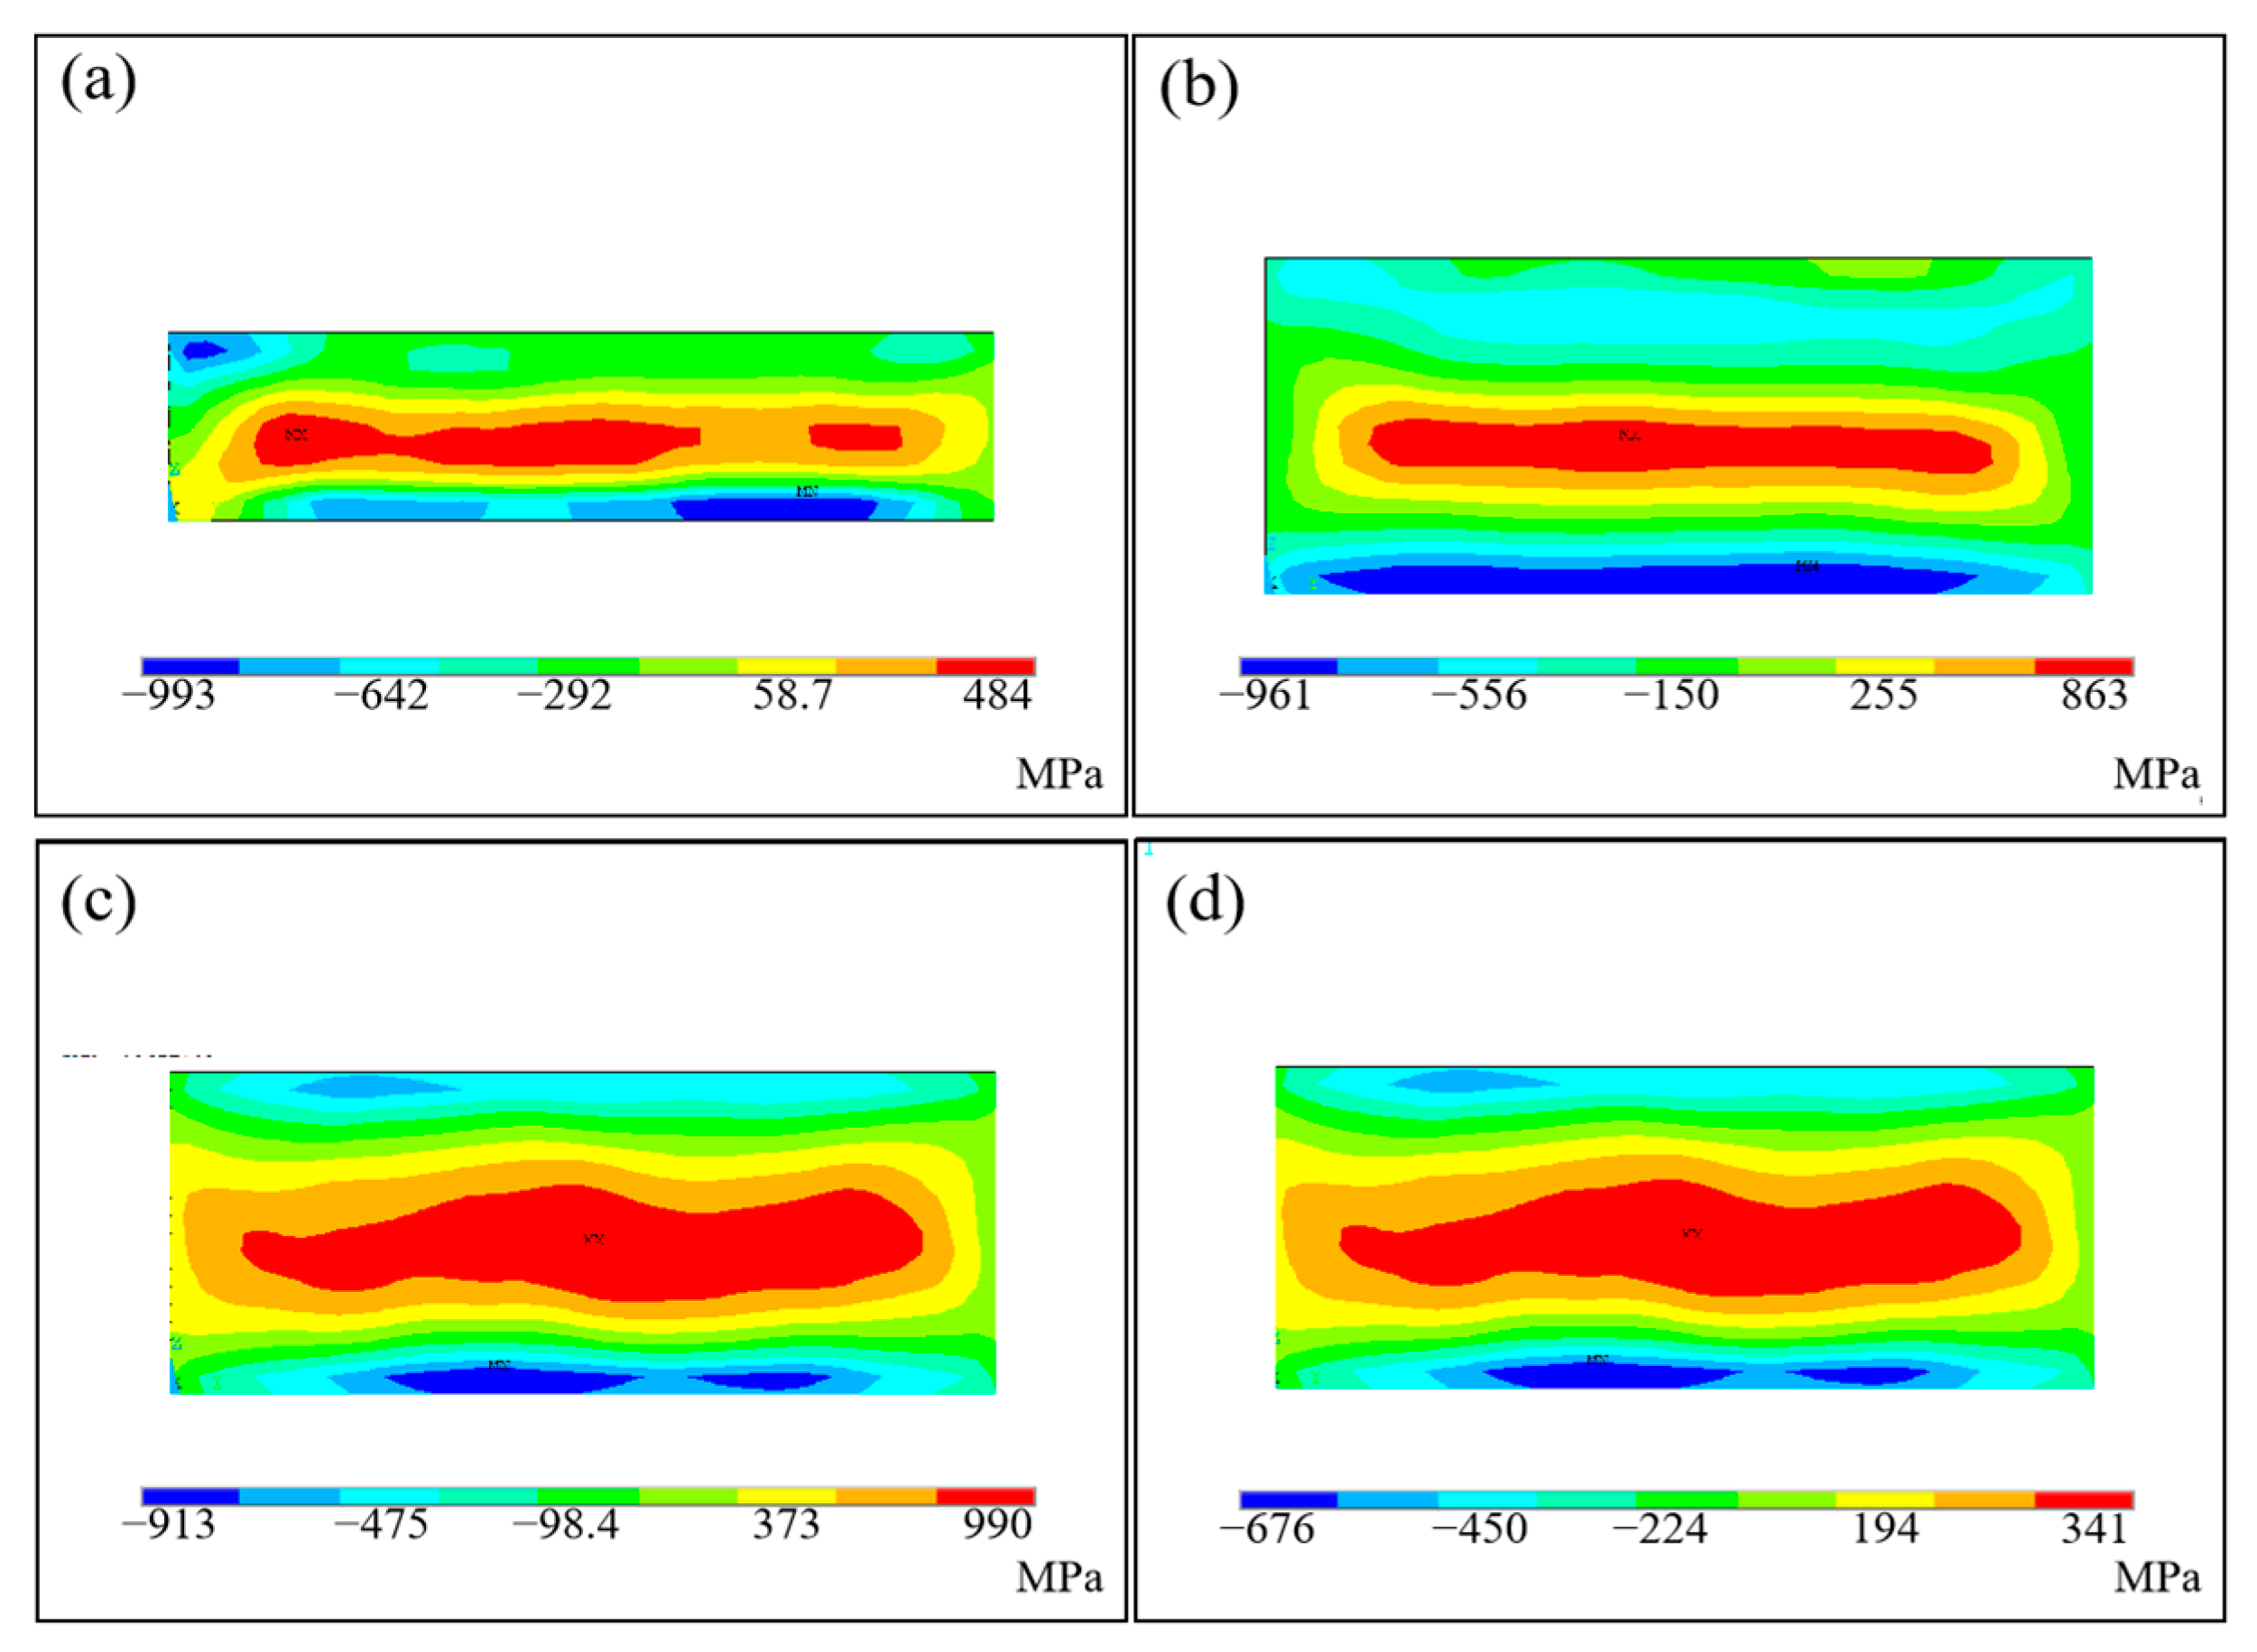
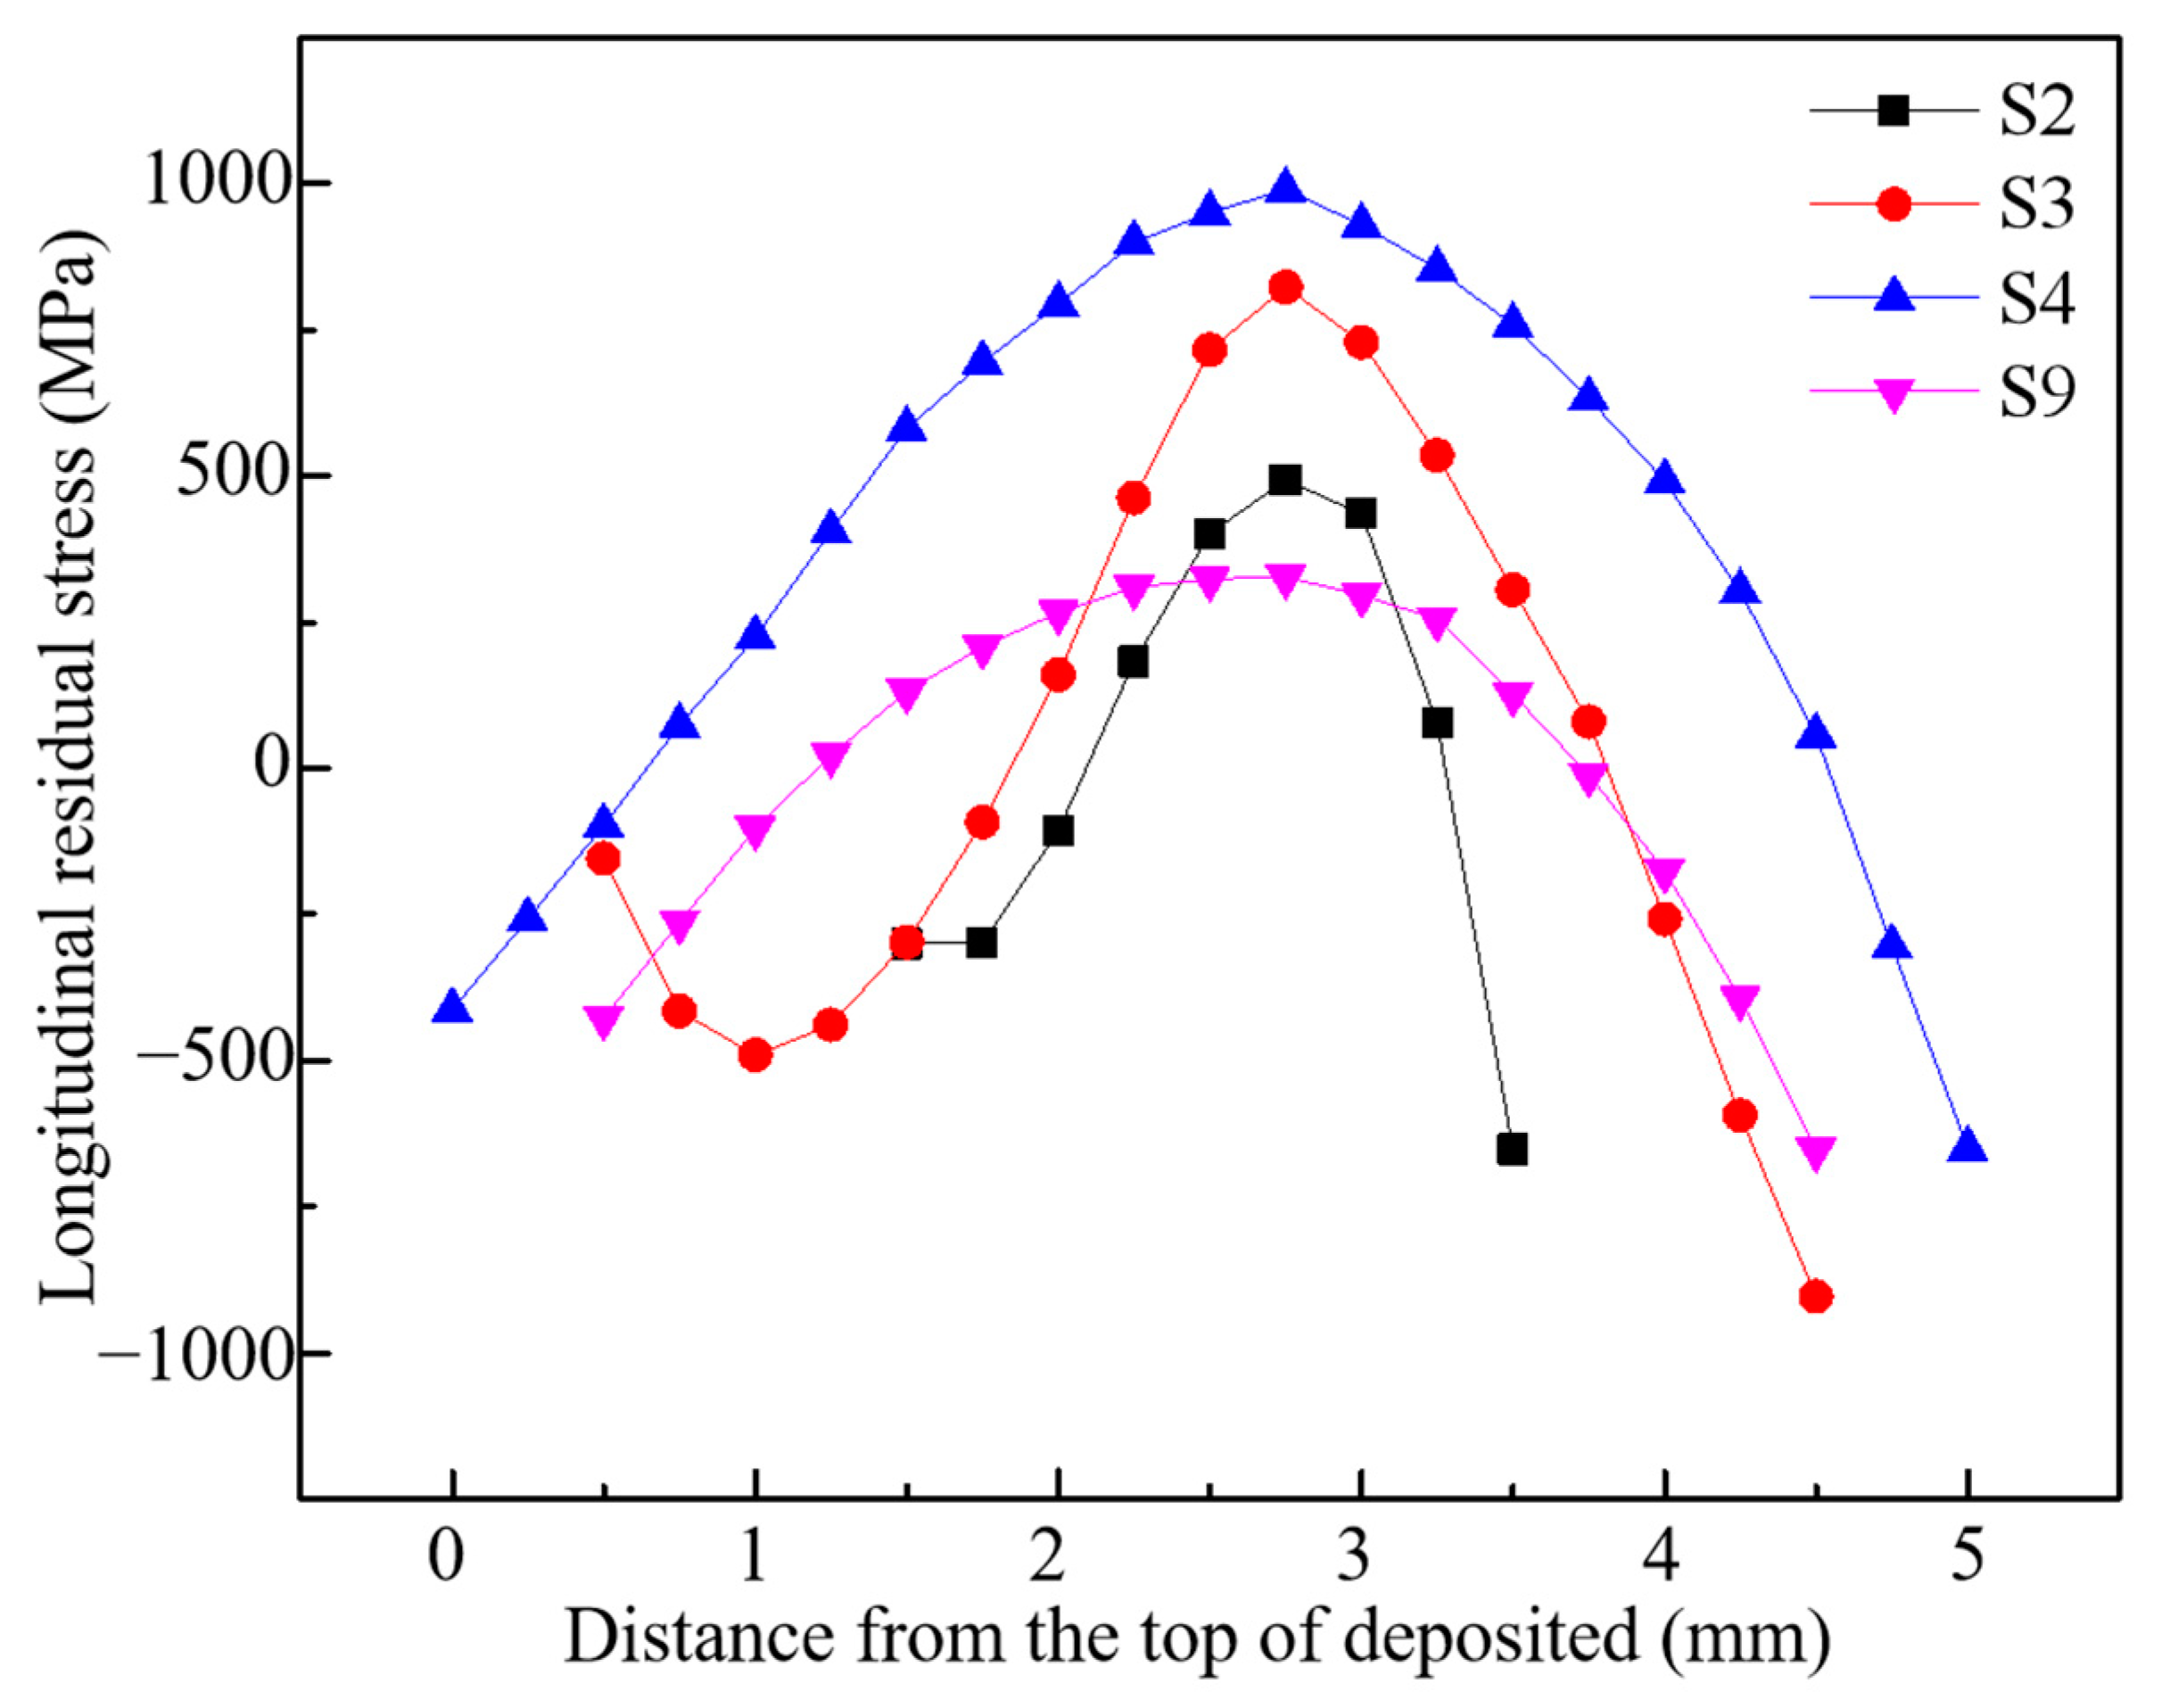
3.3. Residual Stress
3.3.1. Residual Stress of Thin-Walled Deposited Sample
3.3.2. Residual Stress of Block Deposited Sample
4. Discussions
4.1. Temperature Gradient in Solid Region
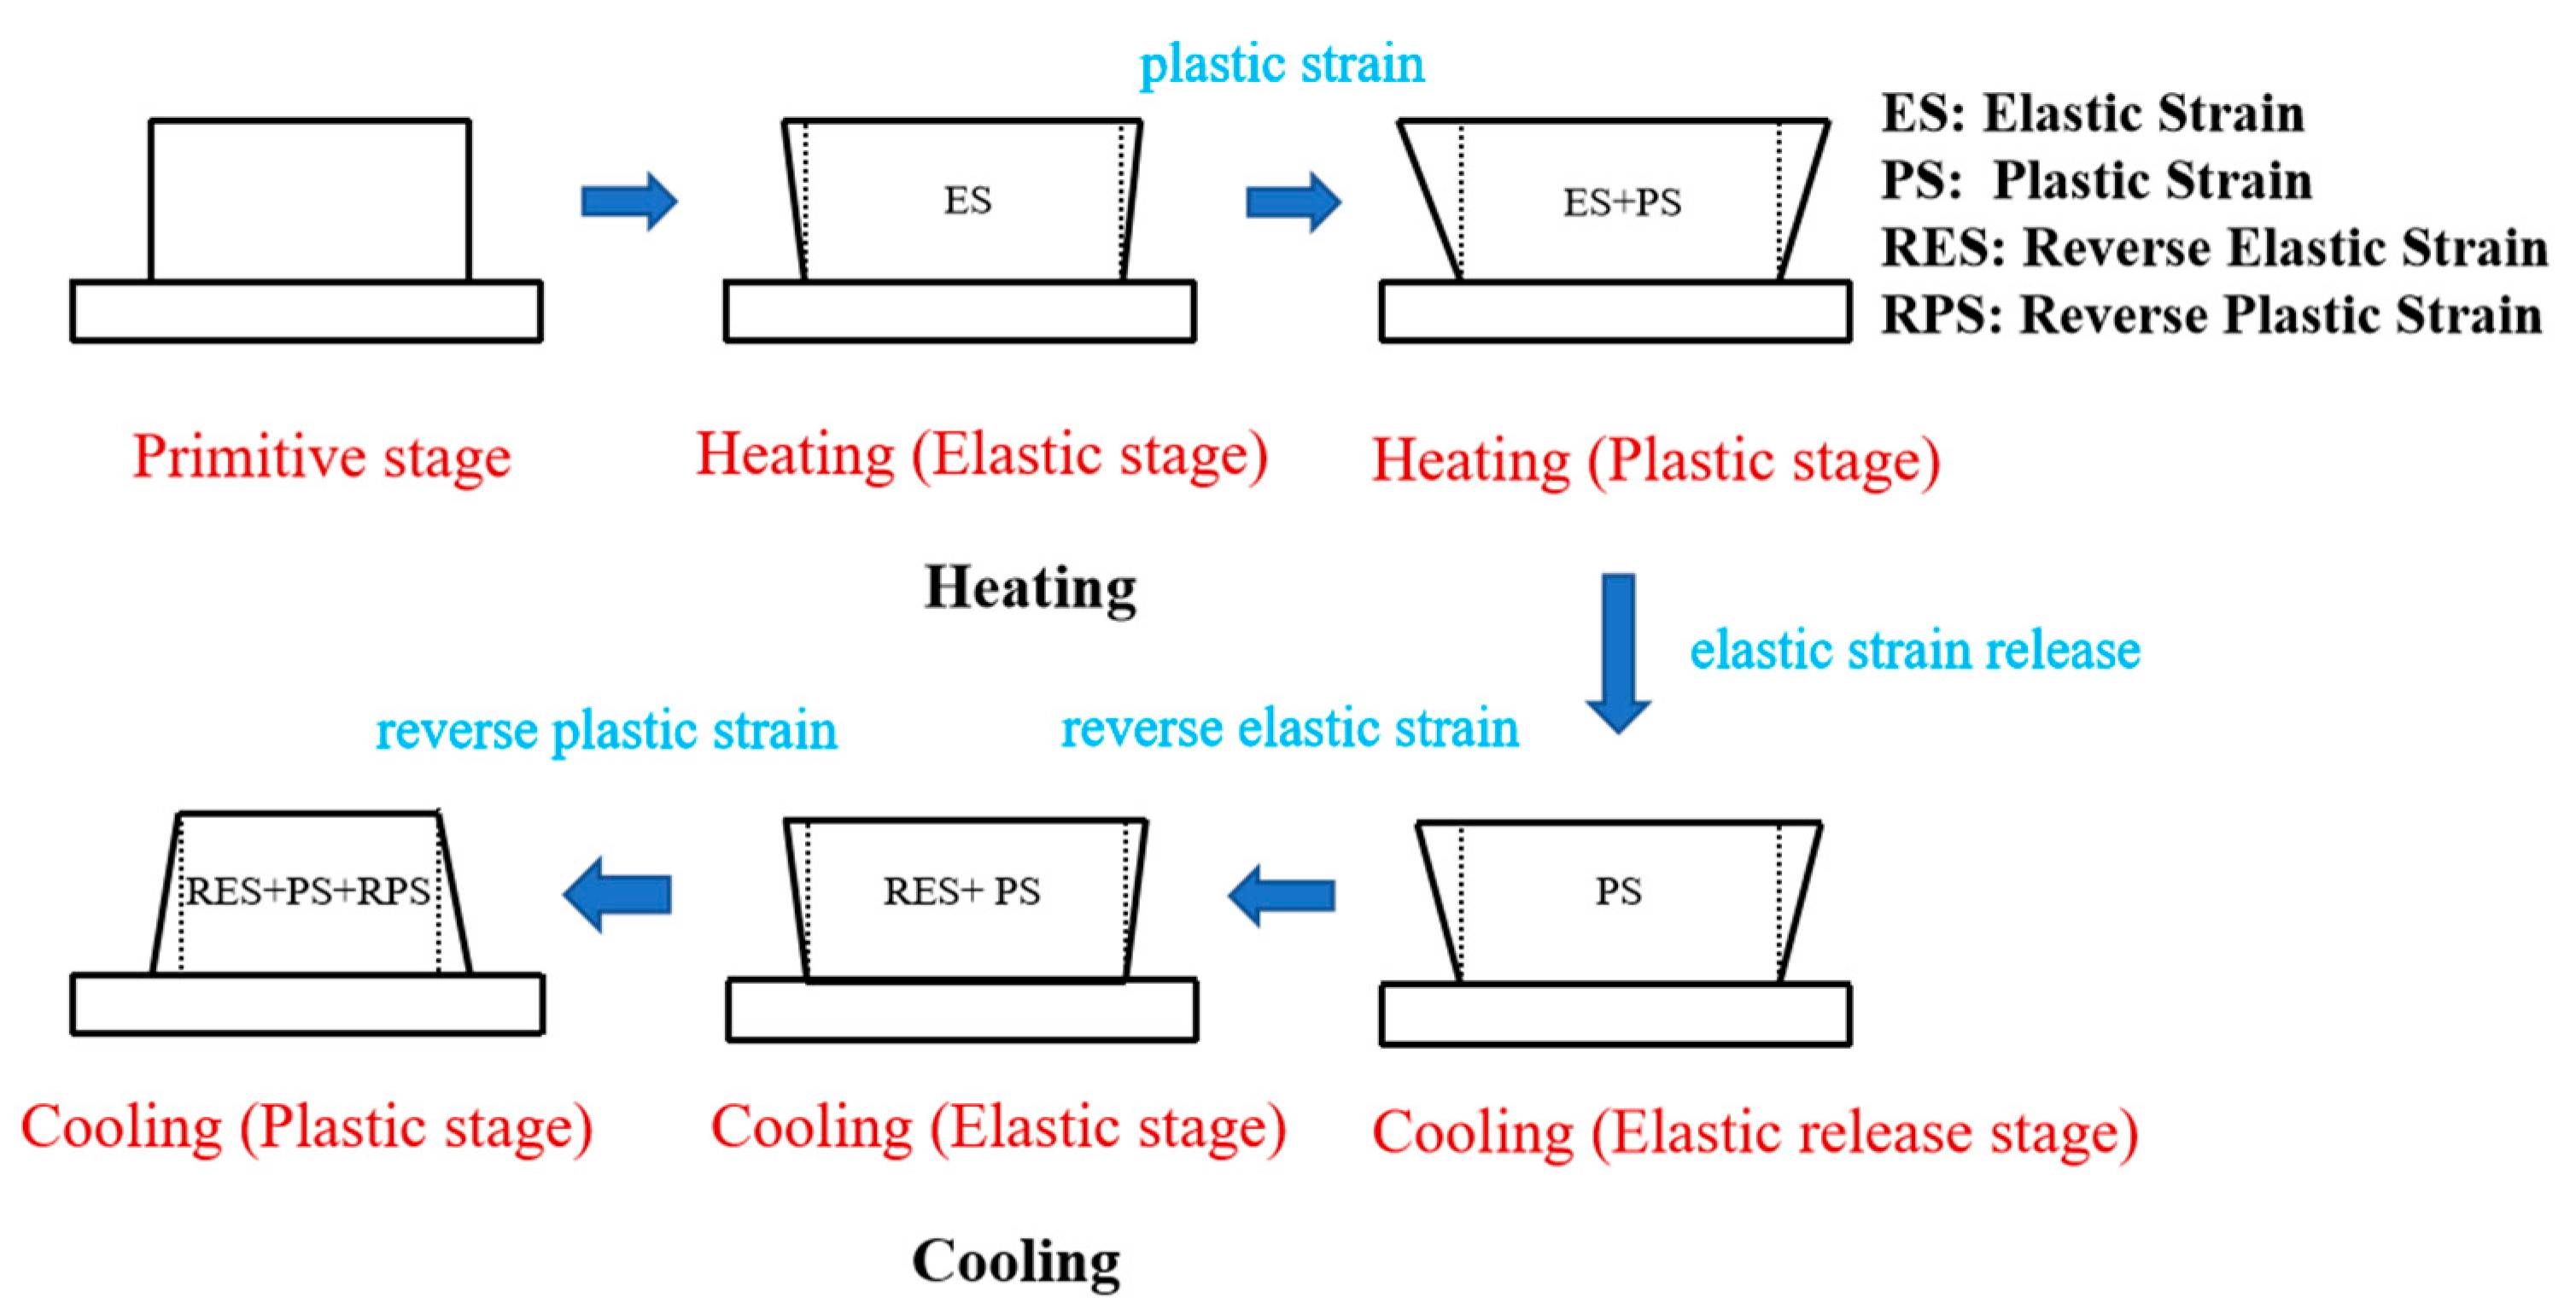
4.2. Stress Relaxation
5. Conclusions
- The temperature gradient and thermal strain during the processing can be reduced by optimizing process parameters, especially laser power, thereby reducing the residual stress of the deposited sample effectively.
- Although the method of changing process parameters can effectively reduce the residual stress of the deposited sample, it will bring about problems such as poor forming quality, low manufacturing efficiency and insufficient density.
- Using the PW laser mode can significantly reduce the residual stress of the deposited sample (about 73%) because of its periodic switching light characteristics, which causes a unique cyclic temperature history, resulting in small temperature gradients and stress relaxation. The forming quality, manufacturing efficiency and density is also consistent with the traditional CW laser mode.
Author Contributions
Funding
Institutional Review Board Statement
Informed Consent Statement
Data Availability Statement
Conflicts of Interest
References
- Svetlizky, D.; Zheng, B.; Vyatskikh, A.; Das, M.; Bose, S.; Bandyopadhyay, A.; Schoenung, J.M.; Lavernia, E.J.; Eliaz, N. Laser-based directed energy deposition (DED-LB) of advanced materials. Mater. Sci. Eng. A 2022, 840, 142967. [Google Scholar]
- Ismail, F.; Orkhan, H.; Mohammad, A.A.; Ali, M.A.; Alkunte, S.; Rajeshirke, M.; Gupta, A.; Hasanov, S.; Tantawi, K.; Yasa, E.; et al. Recent Inventions in Additive Manufacturing: Holistic Review. Materials 2023, 8, 103. [Google Scholar]
- Dortkasli, K.; Isik, M.; Demir, E. A thermal finite element model with efficient computation of surface heat fluxes for directed-energy deposition process and application to laser metal deposition of IN718. J. Manuf. Process. 2022, 79, 369–382. [Google Scholar] [CrossRef]
- Sahoo, S.; Chou, K. Phase-field simulation of microstructure evolution of Ti–6Al–4V in electron beam additive manufacturing process. Addit. Manuf. 2016, 9, 14–24. [Google Scholar] [CrossRef]
- Shih, H.H.; Lin, C.K. Thermo-Mechanical Analysis of Laser Additive Manufacturing for Metals. Key Eng. Mater. 2019, 825, 7–12. [Google Scholar] [CrossRef]
- DebRoy, T.; Wei, H.L.; Zuback, J.S.; Mukherjee, T.; Elmer, J.W.; Milewski, J.O.; Beese, A.M.; Heid, A.W.; M De, A.; Zhang, W. Additive manufacturing of metallic components—Process, structure and properties. Prog. Mater. Sci. 2018, 92, 112–224. [Google Scholar] [CrossRef]
- Bartlett, J.L.; Li, X. An overview of residual stresses in metal powder bed fusion. Addit. Manuf. 2019, 27, 131–149. [Google Scholar] [CrossRef]
- Kayacan, M.Y.; Ozsoy, K.; Duman, B.; Yilmaz, N.; Kayacan, M.C. A study on elimination of failures resulting from layering and internal stresses in Powder Bed Fusion (PBF) additive manufacturing. Mater. Manuf. Process. 2019, 34, 1467–1475. [Google Scholar] [CrossRef]
- Romanenko, D.; Prakash, V.J.; Kuhn, T.; Moeller, C.; Hintze, W.; Emmelmann, C. Effect of DED process parameters on distortion and residual stress state of additively manufactured Ti-6Al-4V components during machining. Procedia CIRP 2022, 111, 271–276. [Google Scholar] [CrossRef]
- Levkulich, N.C.; Semiatin, S.L.; Gockel, J.E.; Middendorf, J.R.; Dewald, A.T.; Klingbeil, N.W. The Effect of Process Parameters on Residual Stress Evolution and Distortion in the Laser Powder Bed Fusion of Ti-6Al-4V. Addit. Manuf. 2019, 28, 475–484. [Google Scholar] [CrossRef]
- Vasinonta, A.; Beuth, J.; Griffith, M. Process Maps for Controlling Residual Stress and Melt Pool Size in Laser-Based SFF Processes. In Proceedings of the 2000 International Solid Freeform Fabrication Symposium, Austin, TX, USA, 8–10 August 2000; pp. 200–208. [Google Scholar]
- Wu, A.S.; Brown, D.W.; Kumar, M.; Gallegos, G.; King, W.E. An Experimental Investigation into Additive Manufacturing-Induced Residual Stresses in 316L Stainless Steel. Metall. Mater. Trans. A 2014, 45, 6260–6270. [Google Scholar] [CrossRef]
- Zaeh, M.F.; Branner, G. Investigations on residual stresses and deformations in selective laser melting. Prod. Eng. 2009, 4, 35–45. [Google Scholar] [CrossRef]
- Denlinger, E.R.; Heigel, J.C.; Michaleris, P.; Palmer, T.A. Effect of inter-layer dwell time on distortion and residual stress in additive manufacturing of titanium and nickel alloys. J. Mater. Process. Technol. 2015, 215, 123–131. [Google Scholar] [CrossRef]
- Aggarangsi, P.; Beuth, J.L. Localized preheating approaches for reducing residual stress in additive manufacturing. In Proceedings of the 2006 International Solid Freeform Fabrication Symposium, Austin, TX, USA, 14–16 August 2006; pp. 709–720. [Google Scholar]
- Shiomi, M.; Osakada, K.; Nakamura, K.; Yamashita, T.; Abe, F. Residual Stress within metallic model made by selective laser melting process. CIRP Ann. 2004, 53, 195–198. [Google Scholar] [CrossRef]
- Svetlizky, D.; Das, M.; Zheng, B.; Vyatskikh, A.L.; Bose, S.; Bandyopadhyay, A.; Schoenung, J.M.; Lavernia, E.J.; Noam, E. Directed energy deposition (DED) additive manufacturing: Physical characteristics, defects, challenges and applications. Mater. Today 2021, 49, 271–295. [Google Scholar] [CrossRef]
- Witzendorff, P.V.; Kaierle, S.; Suttmann, O.; Overmeyer, L. Using pulse shaping to control temporal strain development and solidification cracking in pulsed laser welding of 6082 aluminum alloys. J. Mater. Process. Technol. 2015, 225, 162–169. [Google Scholar] [CrossRef]
- Zhang, Y.; Ganguly, S.; Edwards, L.; Fitzpatrick, M.E. Cross-sectional mapping of residual stresses in a VPPA weld using the contour method. Acta Mater. 2004, 52, 5225–5232. [Google Scholar] [CrossRef]
- Prime, M.B. Cross-Sectional Mapping of Residual Stresses by Measuring the Surface Contour after a Cut. Trans. ASME 2001, 123, 162–168. [Google Scholar] [CrossRef]
- Prime, M.B.; Sebring, R.J.; Edwards, J.M.; Hughes, D.J.; Webster, P.J. Laser Surface-contouring and Spline Data-smoothing for Residual Stress Measurement. Exp. Mech. 2004, 44, 176–184. [Google Scholar] [CrossRef]
- Biegler, M.; Graf, B.; Rethmeier, M. In-situ distortions in LMD additive manufacturing walls can be measured with digital image correlation and predicted using numerical simulations. Addit. Manuf. 2018, 20, 101–110. [Google Scholar] [CrossRef]
- Xie, R.; Chen, G.; Zhao, Y.; Zhang, S.; Yan, W.; Lin, X.; Shi, Q. In-situ observation and numerical simulation on the transient strain and distortion prediction during 23. additive manufacturing. J. Manuf. Process. 2019, 38, 494–501. [Google Scholar] [CrossRef]
- Chen, J.; Yu, X.; Miller, R.G.; Feng, Z. In situ strain and temperature measurement and modelling during arc welding. Sci. Technol. Weld. Join. 2014, 20, 181–188. [Google Scholar] [CrossRef]
- Souza, R.C.; Silva, E.S.; Jorge, A.M.; Cabrera, J.M.; Balancin, O. Balancin, Dynamic recovery and dynamic recrystallization competition on a Nb- and N-bearing austenitic stainless steel biomaterial: Influence of strain rate and temperature. Mater. Sci. Eng. A 2013, 582, 96–107. [Google Scholar] [CrossRef]
- Fitzpatrick, M.E.; Fry, A.T.; Holdway, P.; Kandil, F.A.; Shackleton, J.; Suominen, L. Determination of Residual Stresses by X-Ray Diffraction—Issue 2; National Physical Laboratory: Teddington, UK, 2005; pp. 38–39. [Google Scholar]
- Fergani, O.; Berto, F.; Welo, T.; Liang, S.Y. Analytical modelling of residual stress in additive manufacturing. Fatigue Fract. Eng. Mater. Struct. 2017, 40, 971–978. [Google Scholar] [CrossRef]
- Webster, G.A.; Ezeilo, A.N. Residual stress distributions and their influence on fatigue lifetimes. Int. J. Fatigue 2001, 23 (Suppl. S1), 375–383. [Google Scholar] [CrossRef]
- Leggatt, R.H. Residual stresses in welded structures. Int. J. Press. Vessels Pip. 2008, 85, 144–151. [Google Scholar] [CrossRef]
- Yakout, M.; Elbestawi, M.A.; Veldhuis, S.C. Density and mechanical properties in selective laser melting of Invar 36 and stainless steel 316L. J. Mater. Process. Technol. 2019, 266, 397–420. [Google Scholar] [CrossRef]
- Mercelis, P.; Kruth, F.P. Residual stresses in selective laser sintering and selective laser melting. Rapid Prototyp. J. 2006, 12, 254–265. [Google Scholar] [CrossRef]
- Zou, X.; Chang, T.; Yan, Z.; Zhao, Z.; Pan, Y.; Liu, W.; Song, L. Control of thermal strain and residual stress in pulsed-wave direct_laser deposition. Opt. Laser Technol. 2023, 163, 109386. [Google Scholar] [CrossRef]
- Zhao, H.; Liu, Z.; Yu, C.; Liu, C.; Zhan, Y. Finite element analysis for residual stress of TC4/Inconel718 functionally gradient materials produced by laser additive manufacturing. Opt. Laser Technol. 2022, 152, 108146. [Google Scholar] [CrossRef]
- Theodore, J.; Couturier, L.; Girault, B.; Cabeza, S.; Pirling, T.; Frapier, R.; Bazin, G.; Courant, B. Relationship between microstructure, and residual strain and stress in stainless steels in-situ alloyed by double-wire arc additive manufacturing (D-WAAM) process. Materialia 2023, 30, 101850. [Google Scholar] [CrossRef]
- Chen, C.; Yin, J.; Zhu, H.; Xiao, Z.; Zhang, L.; Zeng, X. Effect of overlap rate and pattern on residual stress in selective laser melting. Int. J. Mach. Tools Manuf. 2019, 145, 103433. [Google Scholar] [CrossRef]
- Liu, F.; Lin, X.; Yang, G.; Song, M.; Chen, J.; Huang, W. Microstructure and residual stress of laser rapid formed Inconel 718 nickel-base superalloy. Opt. Laser Technol. 2011, 43, 208–213. [Google Scholar] [CrossRef]


| Sample No | Scanning Speed (mm/s) | Laser Power (W) | Laser Mode (mm) |
|---|---|---|---|
| S1 | 8 | 300 | CW |
| S2 | 8 | 450 | CW |
| S3 | 8 | 600 | CW |
| S4 | 8 | 800 | CW |
| S5 | 4 | 800 | CW |
| S6 | 6 | 800 | CW |
| S7 | 8 | 800 | CW |
| S8 | 10 | 800 | CW |
| S9 | 8 | 800 | PW |
| Sample | Deposition Morphology | Mass (g) | Volume (mm3) | Densification |
|---|---|---|---|---|
| S1 | 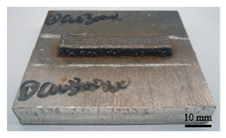 | 13.09 | 1800 | 92.24% |
| S2 |  | 17.54 | 2250 | 99.34% |
| S3 | 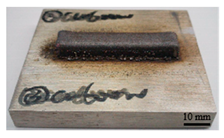 | 21.25 | 2720 | 99.52% |
| S4 | 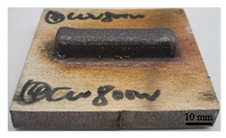 | 23.99 | 3060 | 99.85% |
| S9 | 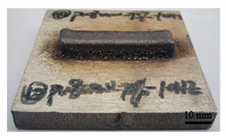 | 21.09 | 2690 | 99.87% |
Disclaimer/Publisher’s Note: The statements, opinions and data contained in all publications are solely those of the individual author(s) and contributor(s) and not of MDPI and/or the editor(s). MDPI and/or the editor(s) disclaim responsibility for any injury to people or property resulting from any ideas, methods, instructions or products referred to in the content. |
© 2023 by the authors. Licensee MDPI, Basel, Switzerland. This article is an open access article distributed under the terms and conditions of the Creative Commons Attribution (CC BY) license (https://creativecommons.org/licenses/by/4.0/).
Share and Cite
Cheng, M.; Zou, X.; Pan, Y.; Zhou, Y.; Liu, W.; Song, L. Residual Stress Control Using Process Optimization in Directed Energy Deposition. Materials 2023, 16, 6610. https://doi.org/10.3390/ma16196610
Cheng M, Zou X, Pan Y, Zhou Y, Liu W, Song L. Residual Stress Control Using Process Optimization in Directed Energy Deposition. Materials. 2023; 16(19):6610. https://doi.org/10.3390/ma16196610
Chicago/Turabian StyleCheng, Manping, Xi Zou, Yang Pan, Yan Zhou, Wenyang Liu, and Lijun Song. 2023. "Residual Stress Control Using Process Optimization in Directed Energy Deposition" Materials 16, no. 19: 6610. https://doi.org/10.3390/ma16196610
APA StyleCheng, M., Zou, X., Pan, Y., Zhou, Y., Liu, W., & Song, L. (2023). Residual Stress Control Using Process Optimization in Directed Energy Deposition. Materials, 16(19), 6610. https://doi.org/10.3390/ma16196610