Article

Strength Degradation of Foamed Lightweight Soil Due to Chemical Erosion and Wet-Dry Cycle and Its Empirical Model

1
Key Laboratory of Geotechnical and Underground Engineering of Ministry of Education, Department of Geotechnical Engineering, Tongji University, Shanghai 200092, China
2
Shanghai Baosteel New Building Materials Technology Co., Ltd., Shanghai 200942, China
*
Author to whom correspondence should be addressed.
Materials 2023, 16(19), 6505; https://doi.org/10.3390/ma16196505
Submission received: 10 August 2023 / Revised: 24 September 2023 / Accepted: 27 September 2023 / Published: 30 September 2023
(This article belongs to the Special Issue Advanced Geomaterials and Reinforced Structures)

Abstract

:
Foamed lightweight soils (FLS) have been extensively used as backfill material in the construction of transportation infrastructures. However, in the regions consisting of salt-rich soft soil, the earth structure made by FLS experiences both fluctuation of groundwater and chemical environment erosion, which would accelerate the deterioration of its long-term performance. This study conducted laboratory tests to explore the deterioration of FLS in strength after being eroded by sulfate attack and/or wet-dry cycling, where the influencing factors of FLS density, concentration of sulfate solution, and cation type (i.e., Na+ and Mg2+) were considered. An unconfined compressive test (UCT) was conducted, and the corrosion-resistant coefficient (CRC) was adopted to evaluate the erosion degree after the specimens experienced sulfate attack and/or dry-wet cycling for a certain period. The research results show that the erosion of the FLS specimen under the coupling effect of sulfate attack and dry-wet cycling was more remarkable than that only under chemical soaking, and Na2SO4 solution had a severe erosion effect as compared with MgSO4 solution when other conditions were kept constant. An empirical model is proposed based on the test results, and its reliability has been verified with other test results from the literature. The proposed model provides an alternative for engineers to estimate the strength deterioration of FLS on real structures in a preliminary design.

1. Introduction

FLS contains a large number of closed voids formed by a mixture of prefabricated foam, cement, and water, and sometimes clay or sand can be added to adjust its cost and performance [1]. Due to the adjustable density and strength of FLS, good engineering performance, and ease of construction [2], it has been increasingly used in practice, including abutment embankment, slope treatment, retaining wall backfilling, and pipeline backfilling [3,4].
The real service environment in which the FLS works is complex. The FLS will suffer rainfall infiltration, evaporation or fluctuation of the groundwater table, temperature change, freeze and thawing, salt solution erosion, and so on [5,6]. The existing studies have presented that such environmental conditions affect the long-term performance of FLS [4,7,8]. Thus, it is vital to investigate the mechanical performance of the FLS considering the real service environment. Indu and Ramamurthy [9] studied the effects of types of sulfate cation on the expansion of the FLS synthesized by two synthetic surfactants. The results showed that the FLS soaked in sodium sulfate had a higher expansion rate. Neramitkornburi et al. [10] found that the strength reduction in the FLS using fly ash and cement as cementitious materials under the dry-wet cycling was caused by the expansion and contraction of clay components, which in turn led to the development of cracks and the destruction of cementitious structures. Liu et al. [11] compared the strengths and mass change rates of cement FLS and geopolymer FLS under dry-wet cycling and found that the strength of geopolymer FLS reduced rapidly with the increasing number of dry-wet cycling and the degree of damage increased gradually, while there was no significant decrease in the strength of the cement FLS. Some studies further investigated the techniques to improve the erosion resistance of FLS. Mamun and Bindiganavile [12] studied the durability of plain and fiber-reinforced aerated FLS in sulfate solution. As the density increases, plain and fiber-reinforced aerated lightweight soil is more susceptible to sulfuric acid erosion, and the durability deteriorates with increasing immersion time. Wang et al. [13] pointed out that the addition of slag components improved the pore internal structure of FLS, further enhancing its corrosion resistance. Raj et al. [14] found the addition of polyvinyl alcohol fiber and coconut shell fiber in the FLS improved its durability than that that only with fiber. Othman et al. [15] noted that there was a certain enhancement in the resistance of FLS to sulfate corrosion when treated waste-bleaching clay was utilized as a component of FLS. Al-Shwaiter et al. [16] studied palm oil fuel ash as a substitute for sand components in FLS and revealed that the mechanical properties and microstructure of FLS were further improved with the varying contents of palm oil fuel ash. It should be noted that the above studies mainly focus on the performance of FLS under a single factor, such as chemical soaking in sulfate solution or wet-dry cycling. However, the FLS is affected by a coupling of several environmental conditions in service. In the regions consisting of salt-rich soft soil, such as coastal regions or saline-alkali areas, due to the higher salinity in groundwater and the fluctuation of the groundwater table, the earth structure made by FLS may simultaneously experience wet-dry cycles and salt solution attack during its service life. It is still a question of whether there is a coupling effect as compared with the condition under a single erosion effect.
Furthermore, it is of significance to predict the long-term strength performance of FLS in design. Liu et al. [17] combined the analytic hierarchy process with fuzzy comprehensive evaluation to establish a multi-level evaluation model for evaluating the durability of FLC in roadbed engineering. Rao et al. [18] developed a method for predicting the dynamic strength of FLS under cyclic loading. Nguyen et al. [19] predicted the compressive strength of FLS based on a deep neural network model. Zhang et al. [20] optimized the performance of FLS mixtures using a new multi-objective FA model. Pan et al. [21] developed a parameter feature extraction method based on principal component analysis and established a machine learning model for feature optimization of principal component analysis to predict the compressive strength of the FLS. However, there are few relevant strength degradation prediction models of FLS under chemical erosion and wet-dry cycles.
This paper conducted a series of tests to investigate the deterioration of mechanical properties of FLS specimens eroded by sulfate attack and wet-dry cycling. Twenty-two test groups were designed with considering the influences of FLS density (i.e., 0.8 g/cm3 and 0.9 g/cm3), SO42− concentration of sulfate solution (i.e., 0.338% and 3.38%), and cation type (i.e., Na+ and Mg2+). Based on the unconfined compressive test (UCT), the strength variation of the specimen was revealed. Furthermore, an empirical model was developed to predict the strength degradation of the FLS specimen under chemical erosion and wet-dry cycle. The proposed model was verified using a comparison with the reported studies.

2. Materials and Scheme of Test

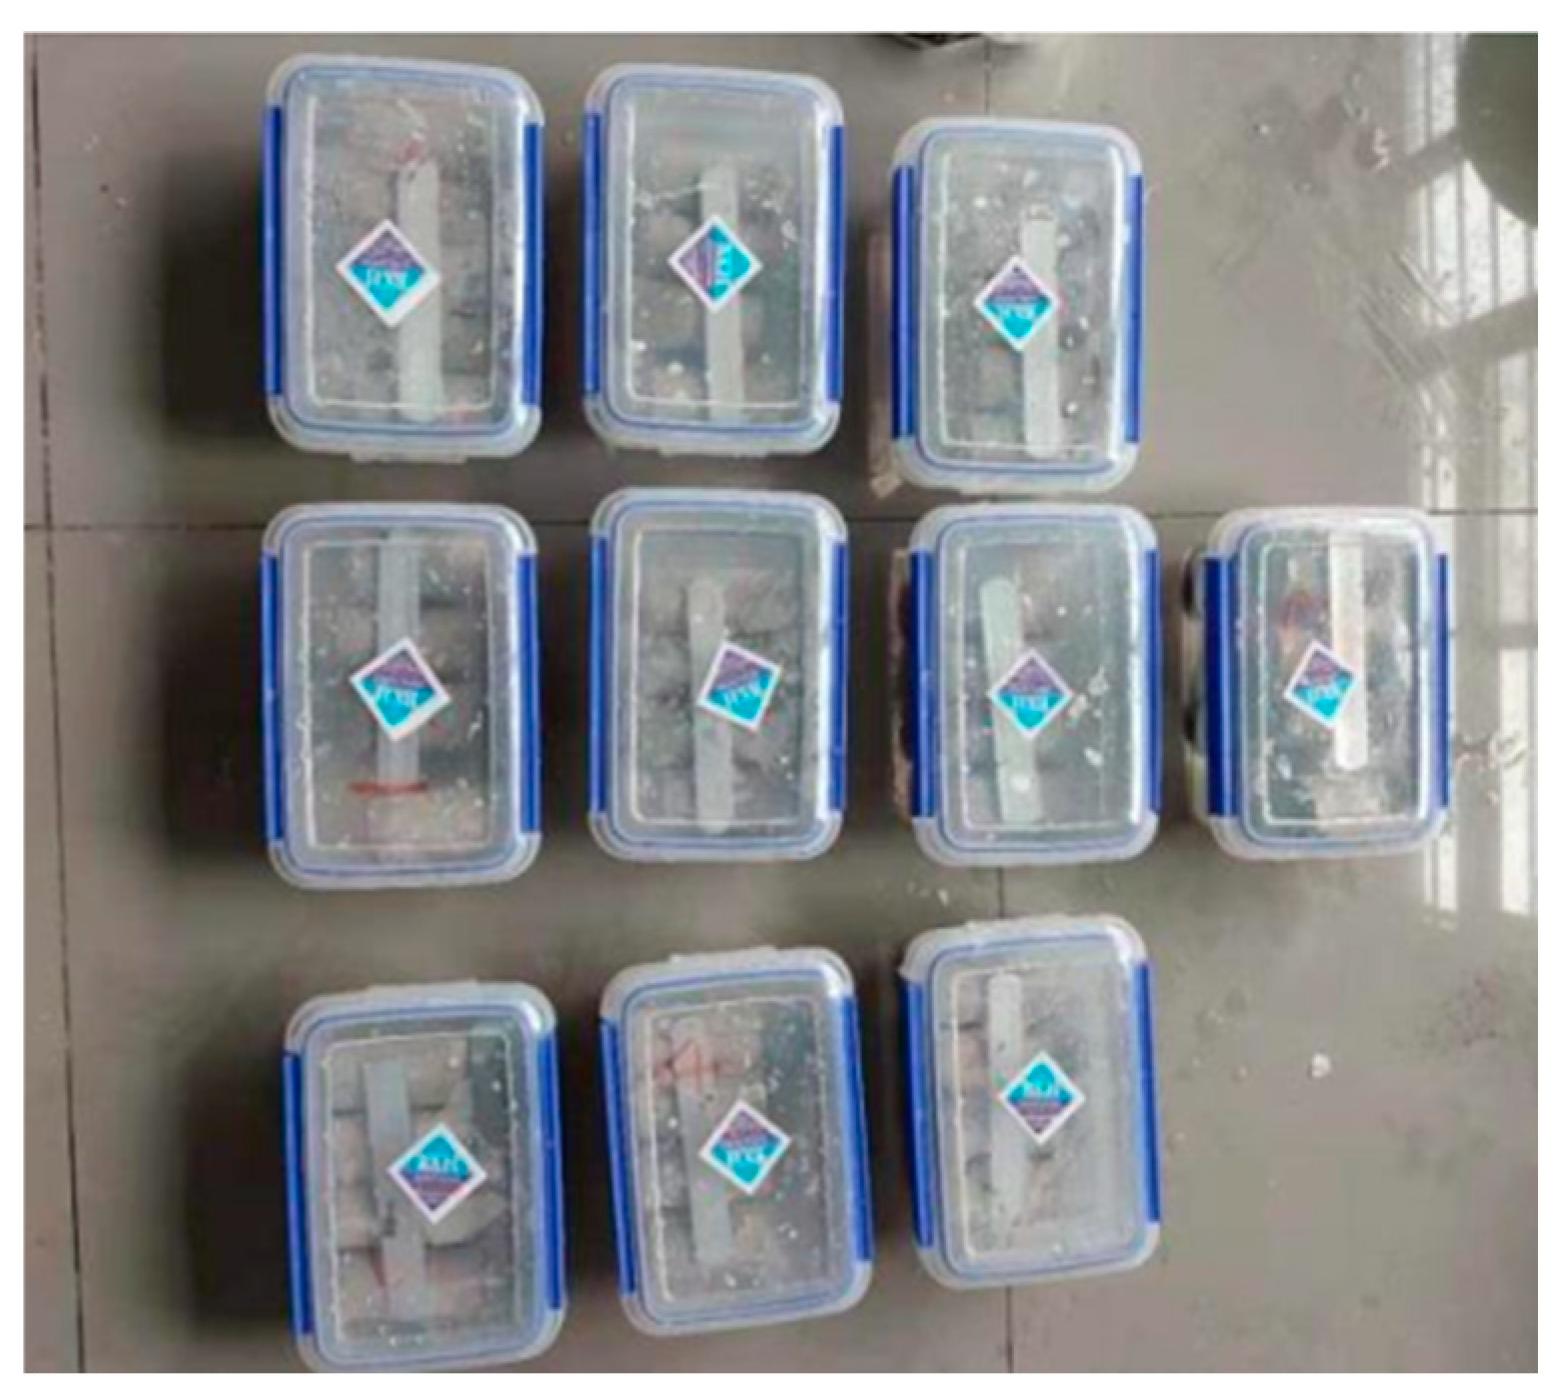
2.1. Test Materials and Specimen Preparation

The FLS in this experiment was mainly made of three components: cement, tap water, and foaming agent. In practical engineering applications, the FLS with a density of 500–1000 kg/m3 is usually used [4]. Therefore, specimens with densities of 800 and 900 kg/m3 were selected in this study. Over a series of trial tests, the relationship between foam volume ratio and density was obtained, as shown in Figure 1. It can be seen that with the increase in foam volume ratio, the density of foamed lightweight soils gradually decreased. As the target densities of the FLS specimen in this study were 800 kg/cm3 and 900 kg/cm3, the corresponding foam volume ratios were 4 and 3.5, respectively. The mix scheme of the specimen is shown in Table 1. The specimen has a diameter of 38 mm and a height of 80 mm. The preparation of the specimen referred to the Chinese industrial standard CJJ/T177 (2012) [22]. The foams were produced by mixing water, foaming agents, and compressed air together using a foam generator. Water and cement were thoroughly mixed and stirred to obtain a uniform cement slurry. The water-cement ratio was 0.45. Additionally, the prepared foams were mixed uniformly with the prepared cement slurry, and the density of the FLS was adjusted by controlling the volume of foam. The mixture of foamed cement slurry was poured into the mold. After cured for 24 h, the mold was removed and the specimens were maintained in an environment with a temperature of 25 °C and a humidity of 95% for 28 days.

2.2. Test Plan and Procedures

Considering a typical concentration range of sulfate solution in practice [9], the Na2SO4 solution with mass-to-mass concentrations of 0.5% and 5%, which corresponded to the SO42− concentration of 0.338% and 3.38%, respectively, and the MgSO4 solution with mass-to-mass concentration of 4.24%, were selected in this study. The MgSO4 solution had the same SO42− concentration as the 5% Na2SO4 solution. In the regions consisting of salt-rich soft soil, the FLS that are deeply under the groundwater level or the water level may be eroded by the sulfate immersion, while the FLS near the groundwater level or the water level may be eroded by both sulfate immersion and wet-dry cycling. Thus, two types of tests, i.e., sulfate immersion test and wet-dry cycle test combined with sulfate attack, were conducted. The UCT was conducted before the sulfate attack to obtain the initial strength of the specimens, which were used as reference values for analysis.
In the sulfate immersion test, the specimen was soaked in a sulfate solution (Na2SO4 or MgSO4) with a controlled concentration for 28 days and 56 days, respectively. For an ordinary project, the determination of properties of the FLS after 28-day and 56-day immersion is commonly required in design, while for some major projects, the immersion test for a longer period (e.g., 84 days or even 120 days) is needed. As the FLS is commonly adopted as a backfill material in roadway embankment projects, this study selected the immersion ages of 28 days and 56 days [9,11,15]. The solution should be changed once a week. After reaching the design age for immersion, the specimens were taken out for a compressive strength test.
For the wet-dry cycle test combined with sulfate attack, the specimens were placed in a prepared solution and soaked for 24 h (as shown in Figure 2). Additionally, the specimens were dried in an oven with the temperature of 40 °C for 24 h. The above test procedure was called one wet-dry cycle, and this procedure was repeated 5 cycles and 10 cycles in this study.
Table 2 summarizes the test groups in this study. Three specimens were prepared in each group. For conveniently presenting the test results, the test groups were denoted as Dx-CyNa/Mg-SA/DWz, in which Dx represents the specimen density x, CyNa/Mg represents the concentration y of the Na2SO4 or MgSO4 solution, SA/DWz represents the sulfate immersion test or the wet-dry cycle test combined with sulfate attack for a period or cycles of z, respectively. For example, D0.8-C0.5Na-SA28 denotes the sulfate attack test with a specimen of 0.8 g/cm3 in 0.5% Na2SO4 solution for 28 days. For comparison purposes, the control test groups without sulfate erosion were also conducted, which were denoted as D0.8 and D0.9. N/A indicates that no such operation has been performed.
After the specimens were eroded by the sulfate attack or the wet-dry cycling combined with the sulfate attack, the UCT was conducted to obtain the residual strength of the specimen. The UCT was carried out with reference to the Chinese industrial code GB/T50081(2002) [23]. During the loading phase, the loading rate of the universal testing machine was 0.2 mm/min. By recording the load at the time of specimen failure, the compressive strength of the FLS can be obtained, as shown in Figure 3.

3. Test Results and Analysis

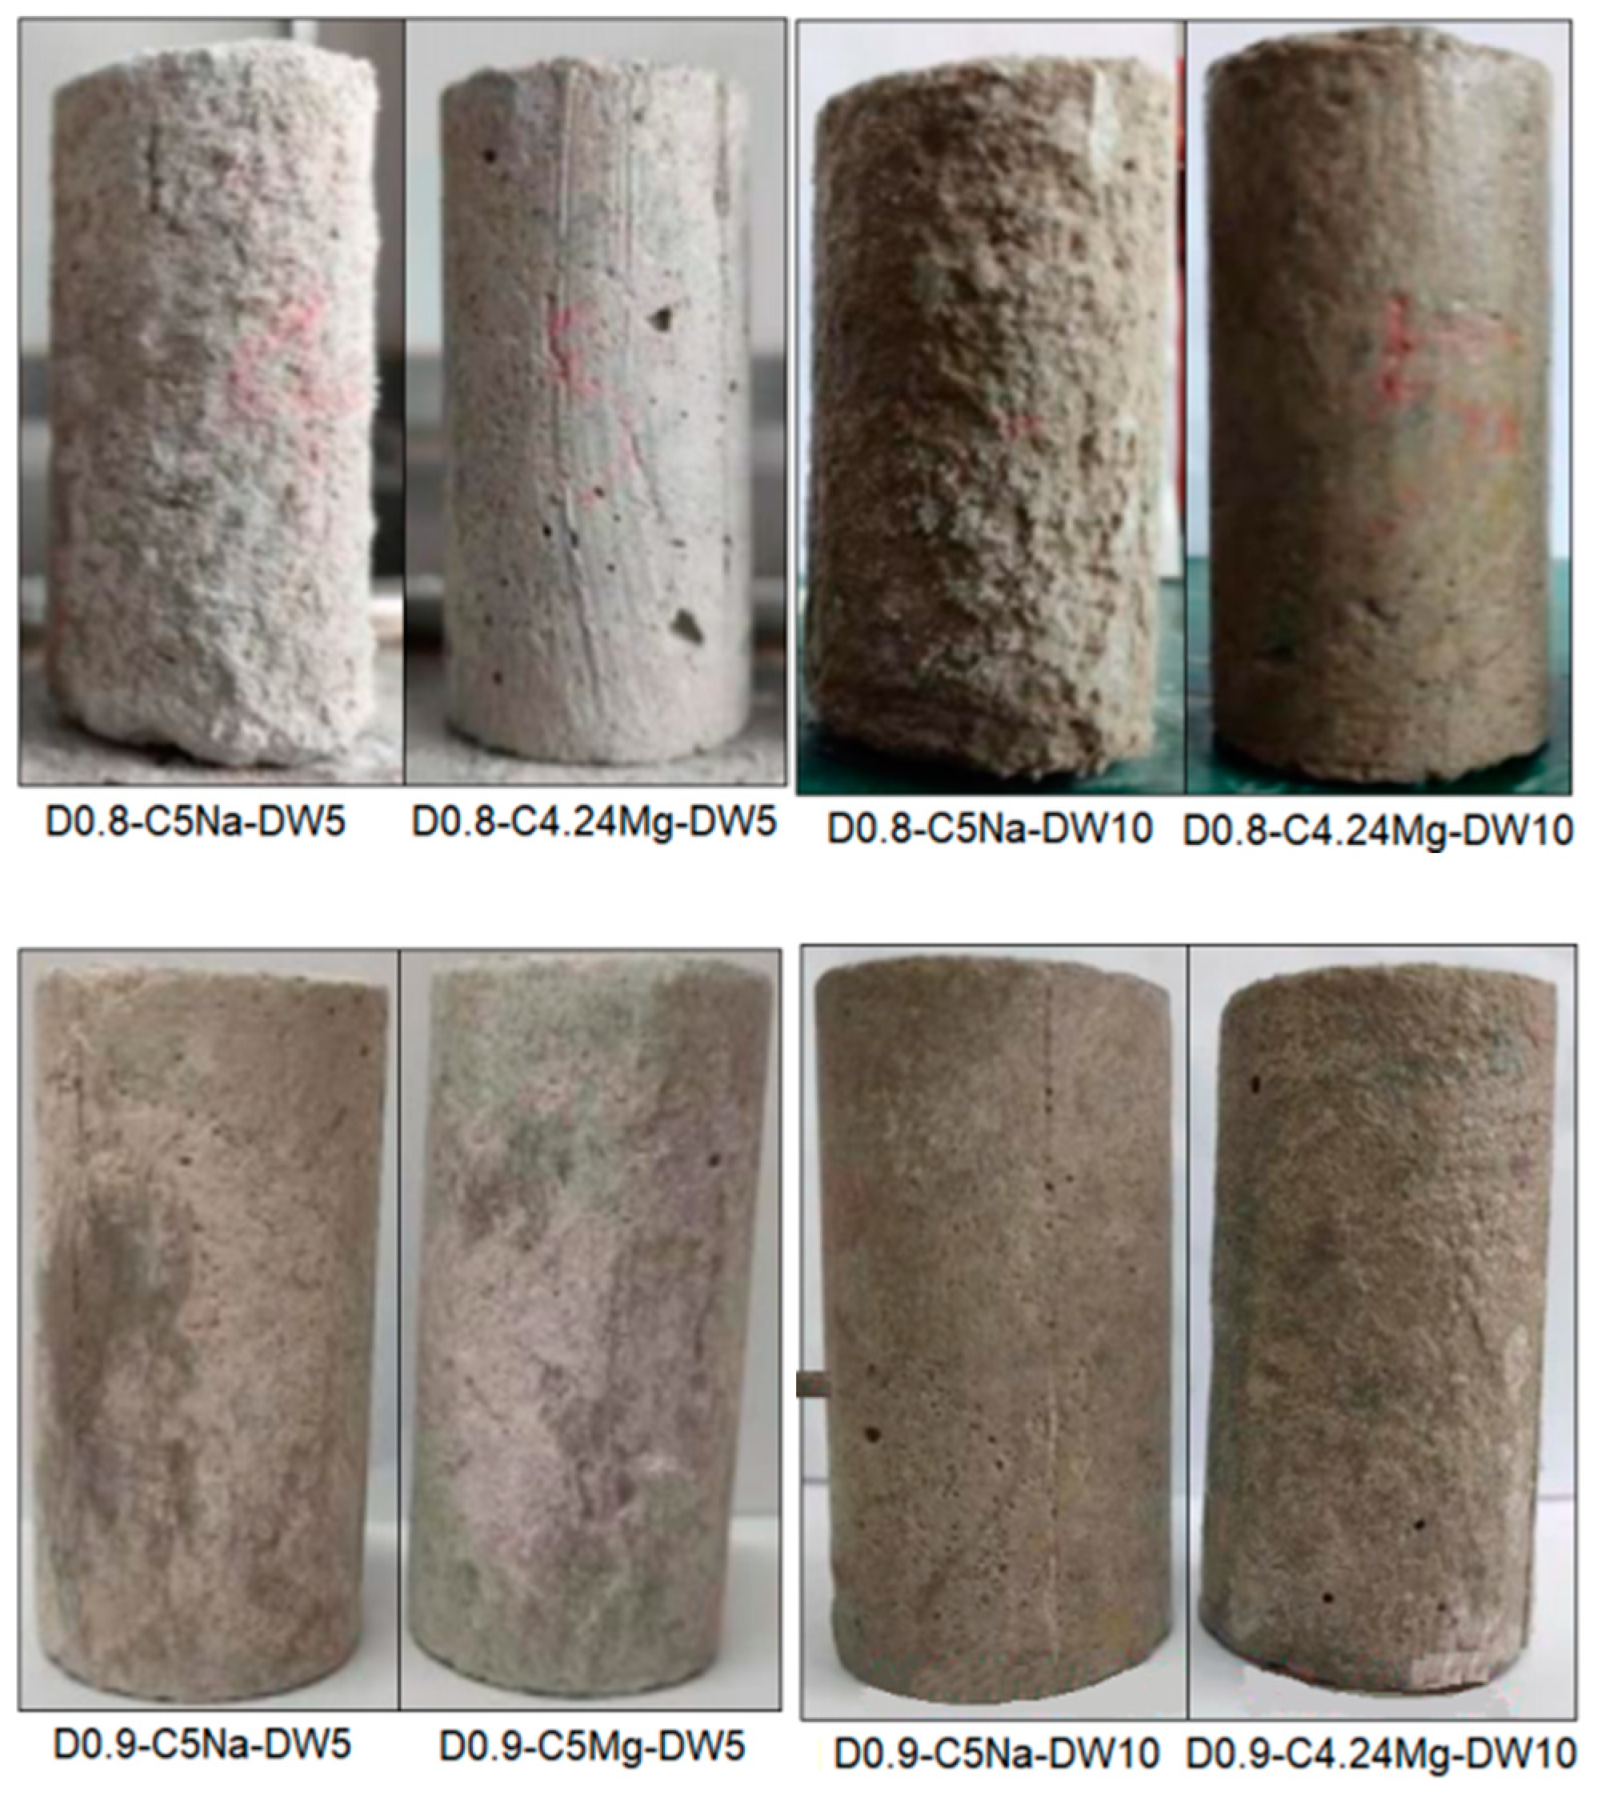
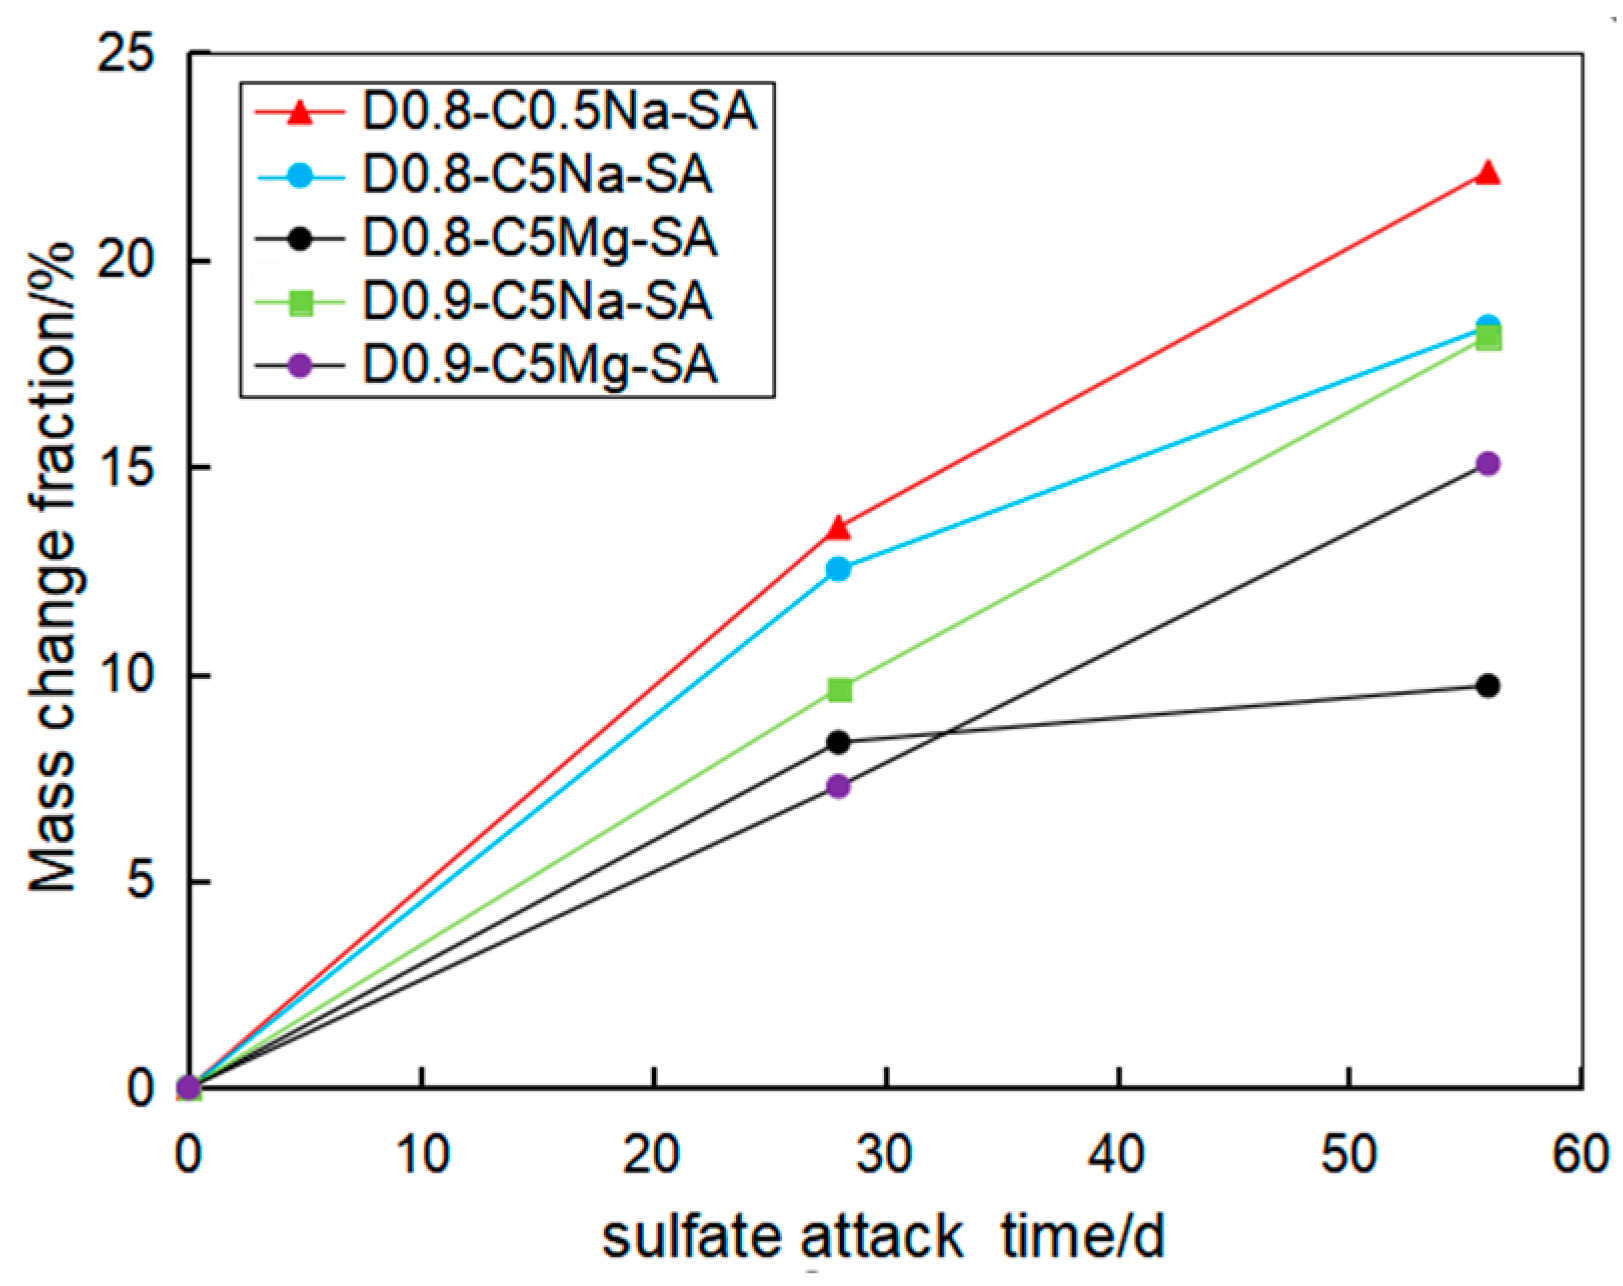
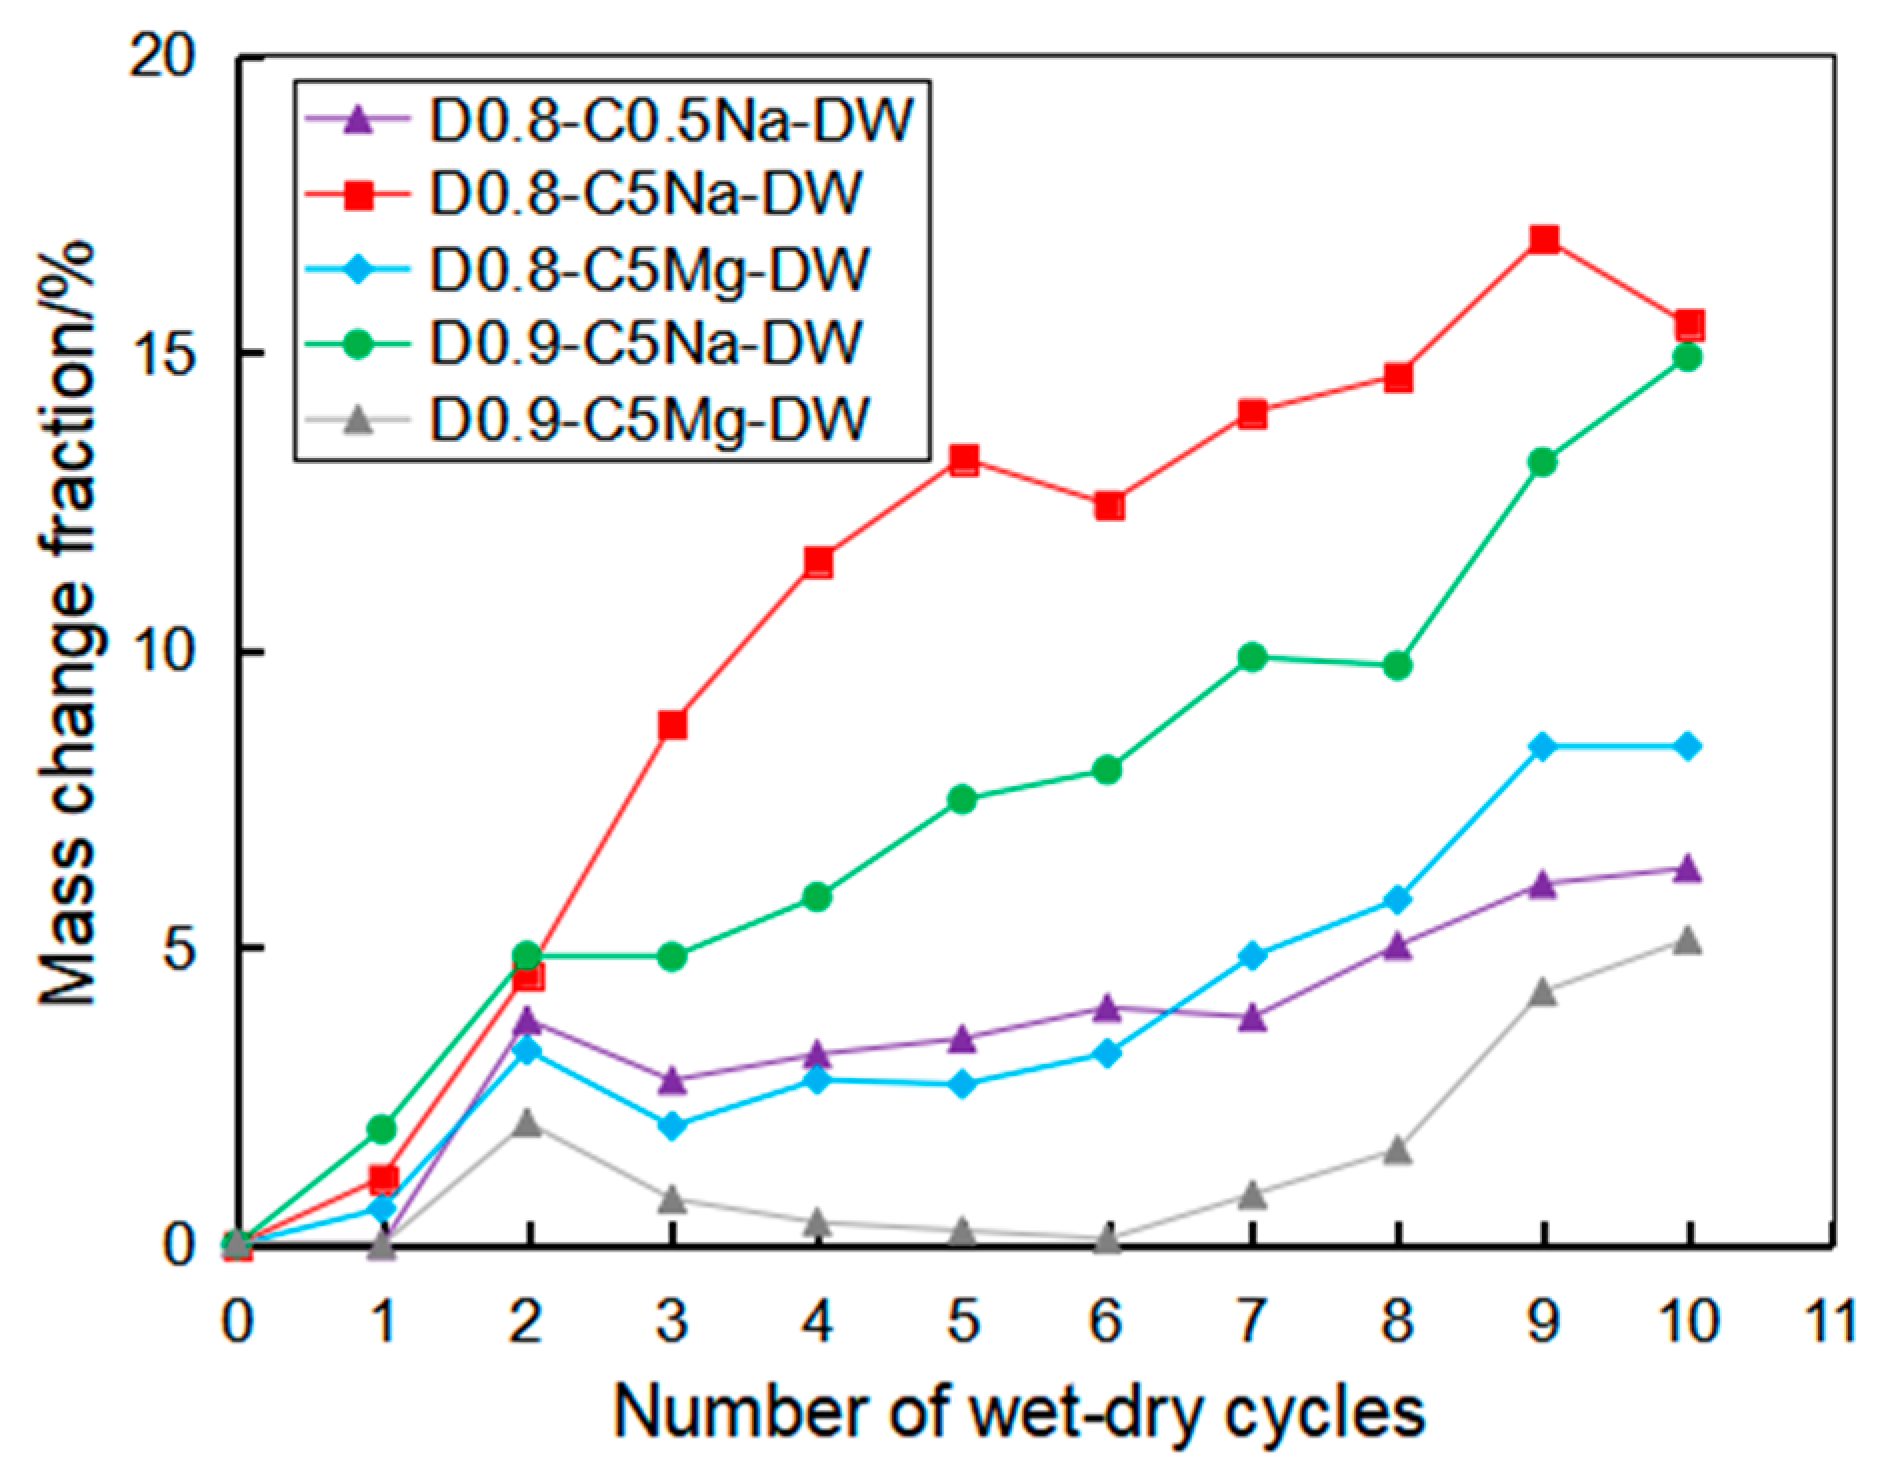
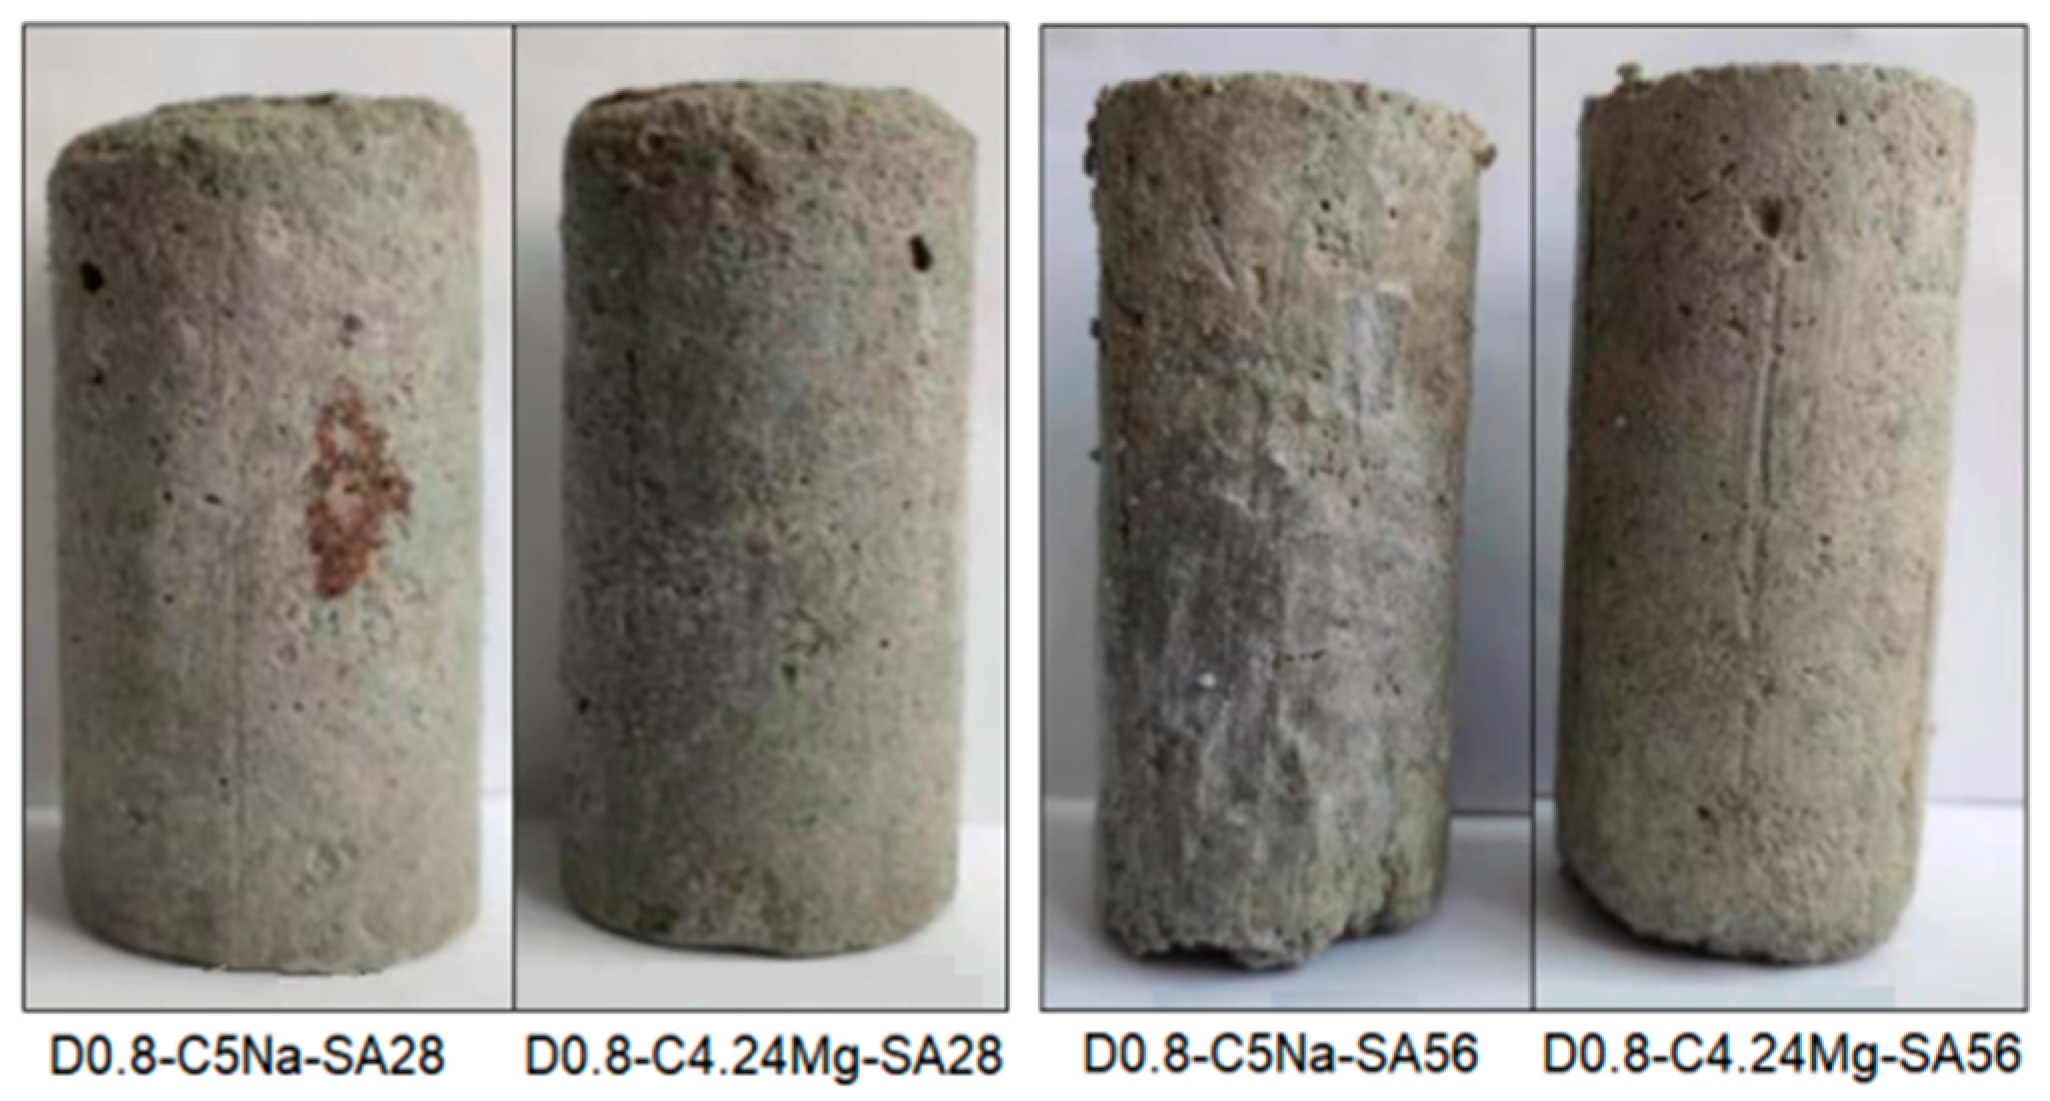
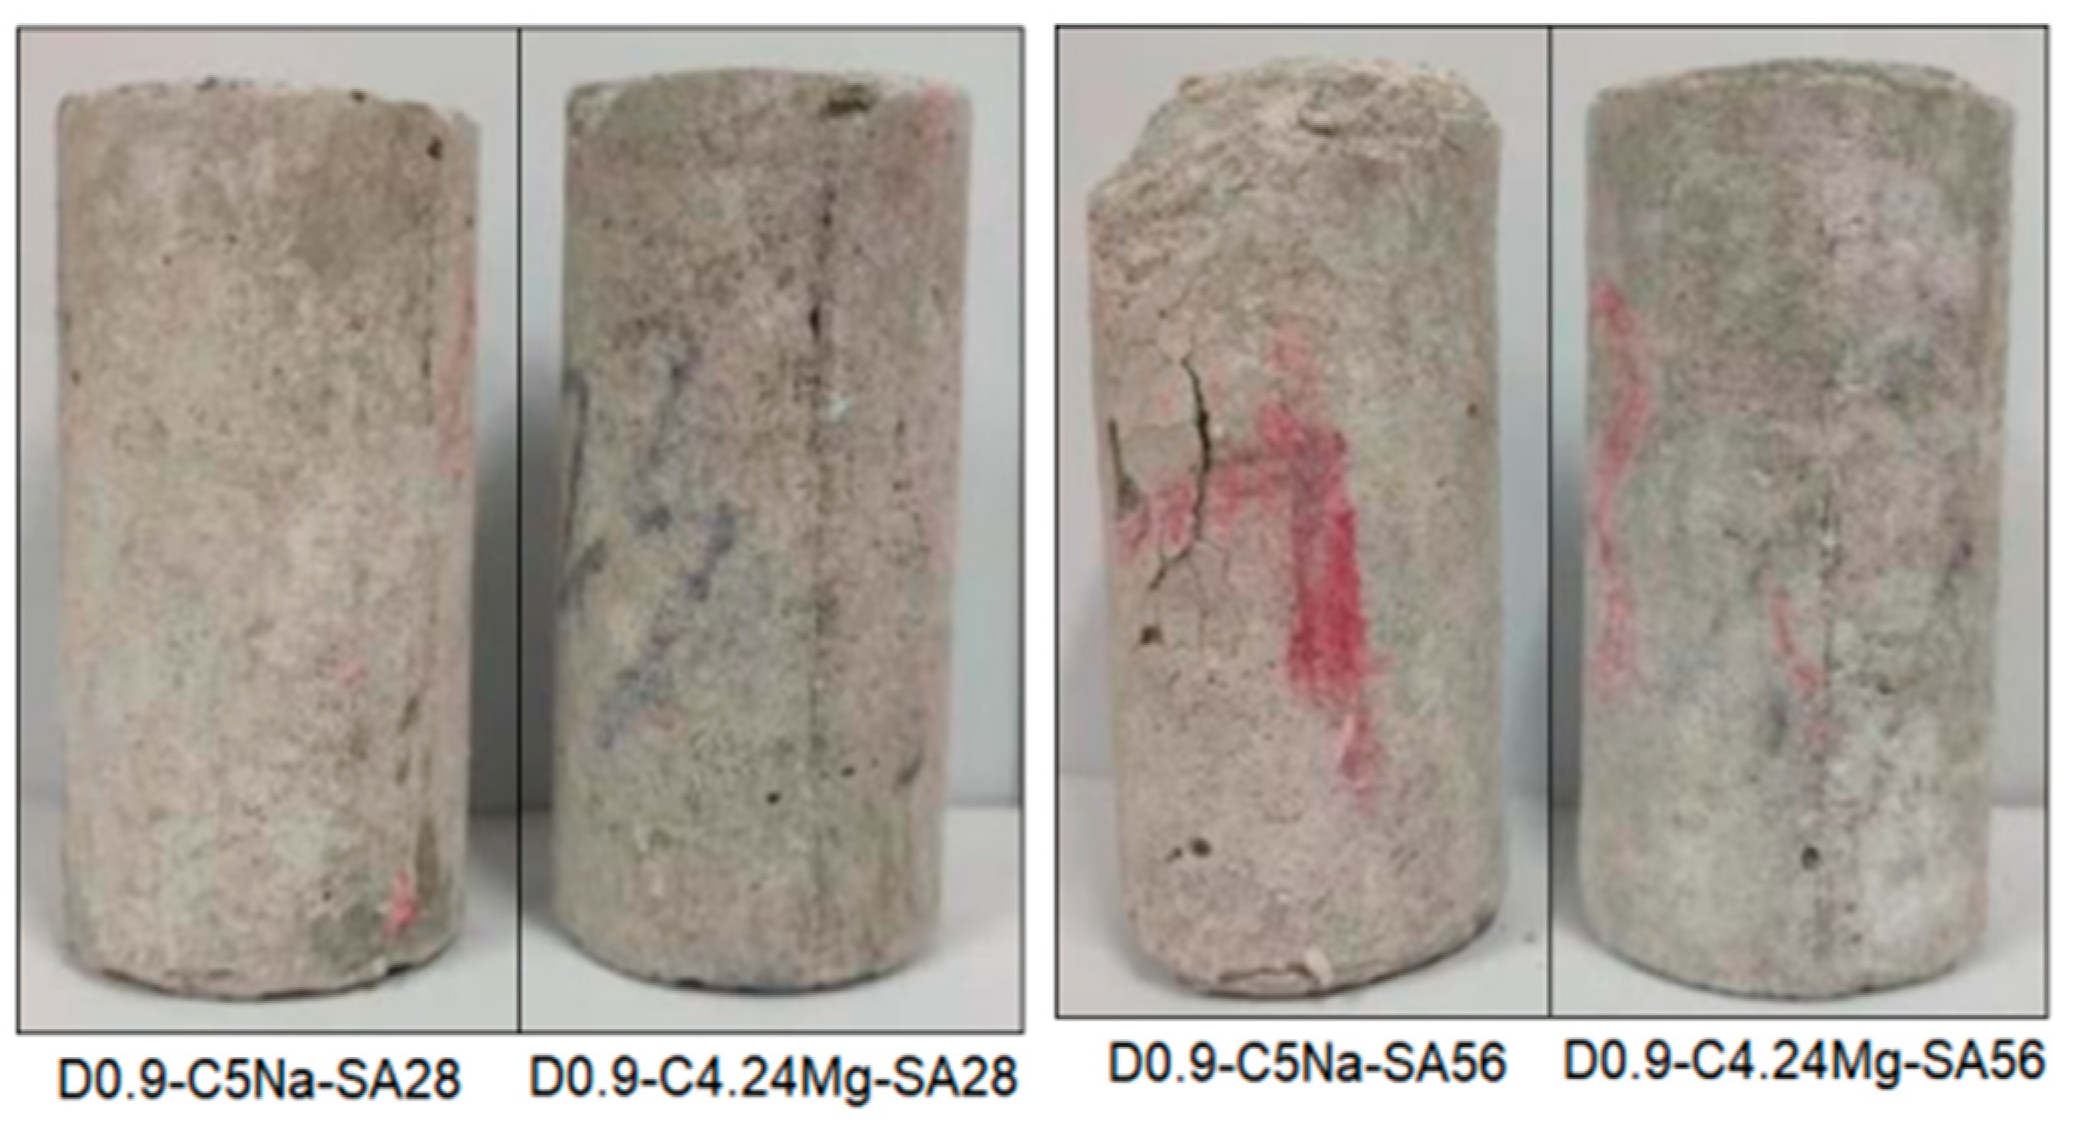
3.1. Appearances and Mass Change

Figure 4 and Figure 5 show the appearance of the specimens after erosion. It can be seen that the surfaces of the specimens were peeled, and some had cracks after erosion. The higher SO42− concentration of the sulfate solution (i.e., 3.38%) further intensified the corrosion of the specimens, as more spalling and cracks appeared. The main reason for this phenomenon was due to the reaction of the SO42− with hydration products such as calcium aluminate hydrate and calcium hydroxide to generate ettringite and gypsum [9], as well as the infiltration of the Na2SO4 solution into the specimen. Moreover, the Na2SO4 solution yielded a stronger erosion effect on the specimen as compared with the MgSO4 solution with the same SO42− concentration. This phenomenon was mainly caused by the chemical reaction between the MgSO4 solution and the FLS in the early stage of soaking; the generated Mg(OH)2 formed a protective film on the surface, preventing the infiltration of salt solution and the enrichment of hydration products in the specimen [9]. The specimens with the density of 0.9 g/cm3 had less spalling and cracks than the specimen of 0.8 g/cm3 under the same erosion condition.
Figure 6 displays the variation of the mass change rate of the FLS with densities of 0.8 and 0.9 g/cm3 with the immersion time. It can be seen that the mass of the FLS increased with the sulfate attack time. Indu and Ramamurthy [9] revealed that the mass increase in the FLS was caused by the reaction of sulfate with Calcium aluminates and Calcium hydroxide to generate ettringite and gypsum. Generally, the higher the concentration, the more ettringite and gypsum were generated; however, under the erosion of chemical solution in this study, the increase in mass of the specimen immersed in 0.5% Na2SO4 solution was greater than that in 5% Na2SO4 solution. This can be explained by the fact that the specimen surface had slag falling and block missing under the sulfate attack, resulting in a certain amount of mass loss (see Figure 5). Under the erosion of the same sulfate concentration, the mass increase in the 4.24% MgSO4 solution was less than that in the 5% Na2SO4 solution. Indu and Ramamurthy [9] indicated that the MgSO4 solution reacted with the FLS to generate Mg(OH)2 in the early stage of chemical immersion, forming a protective film on the surface, which prevented the infiltration of sulfate solution and the enrichment of hydration products in the specimen. By comparing the specimens of 0.8 g/cm3 and 0.9 g/cm3, it can be seen that the specimen with 0.9 g/cm3 exhibited relatively smaller mass growth than the specimen with 0.8 g/cm3 under the same condition. This indicates that the higher the density of the FLS, the stronger its ability to resist chemical solution erosion.
Figure 7 presents the variation of the mass change rate of the specimens under the coupling effect of chemical erosion and wet-dry cycle. The observations of the mass change were similar to those under the sulfate immersion. With the increase in the wet-dry cycles, the mass rate of the specimen gradually increased. The specimen in the 5% Na2SO4 solution led to a much more significant mass increase than that in the 0.5% Na2SO4 solution. By comparing the specimens of 0.8 and 0.9 g/cm3, the change in mass of the specimen with 0.9 g/cm3 was relatively small, indicating that the FLS with high density had a stronger ability to resist the coupling effect of chemical erosion and wet-dry cycle.

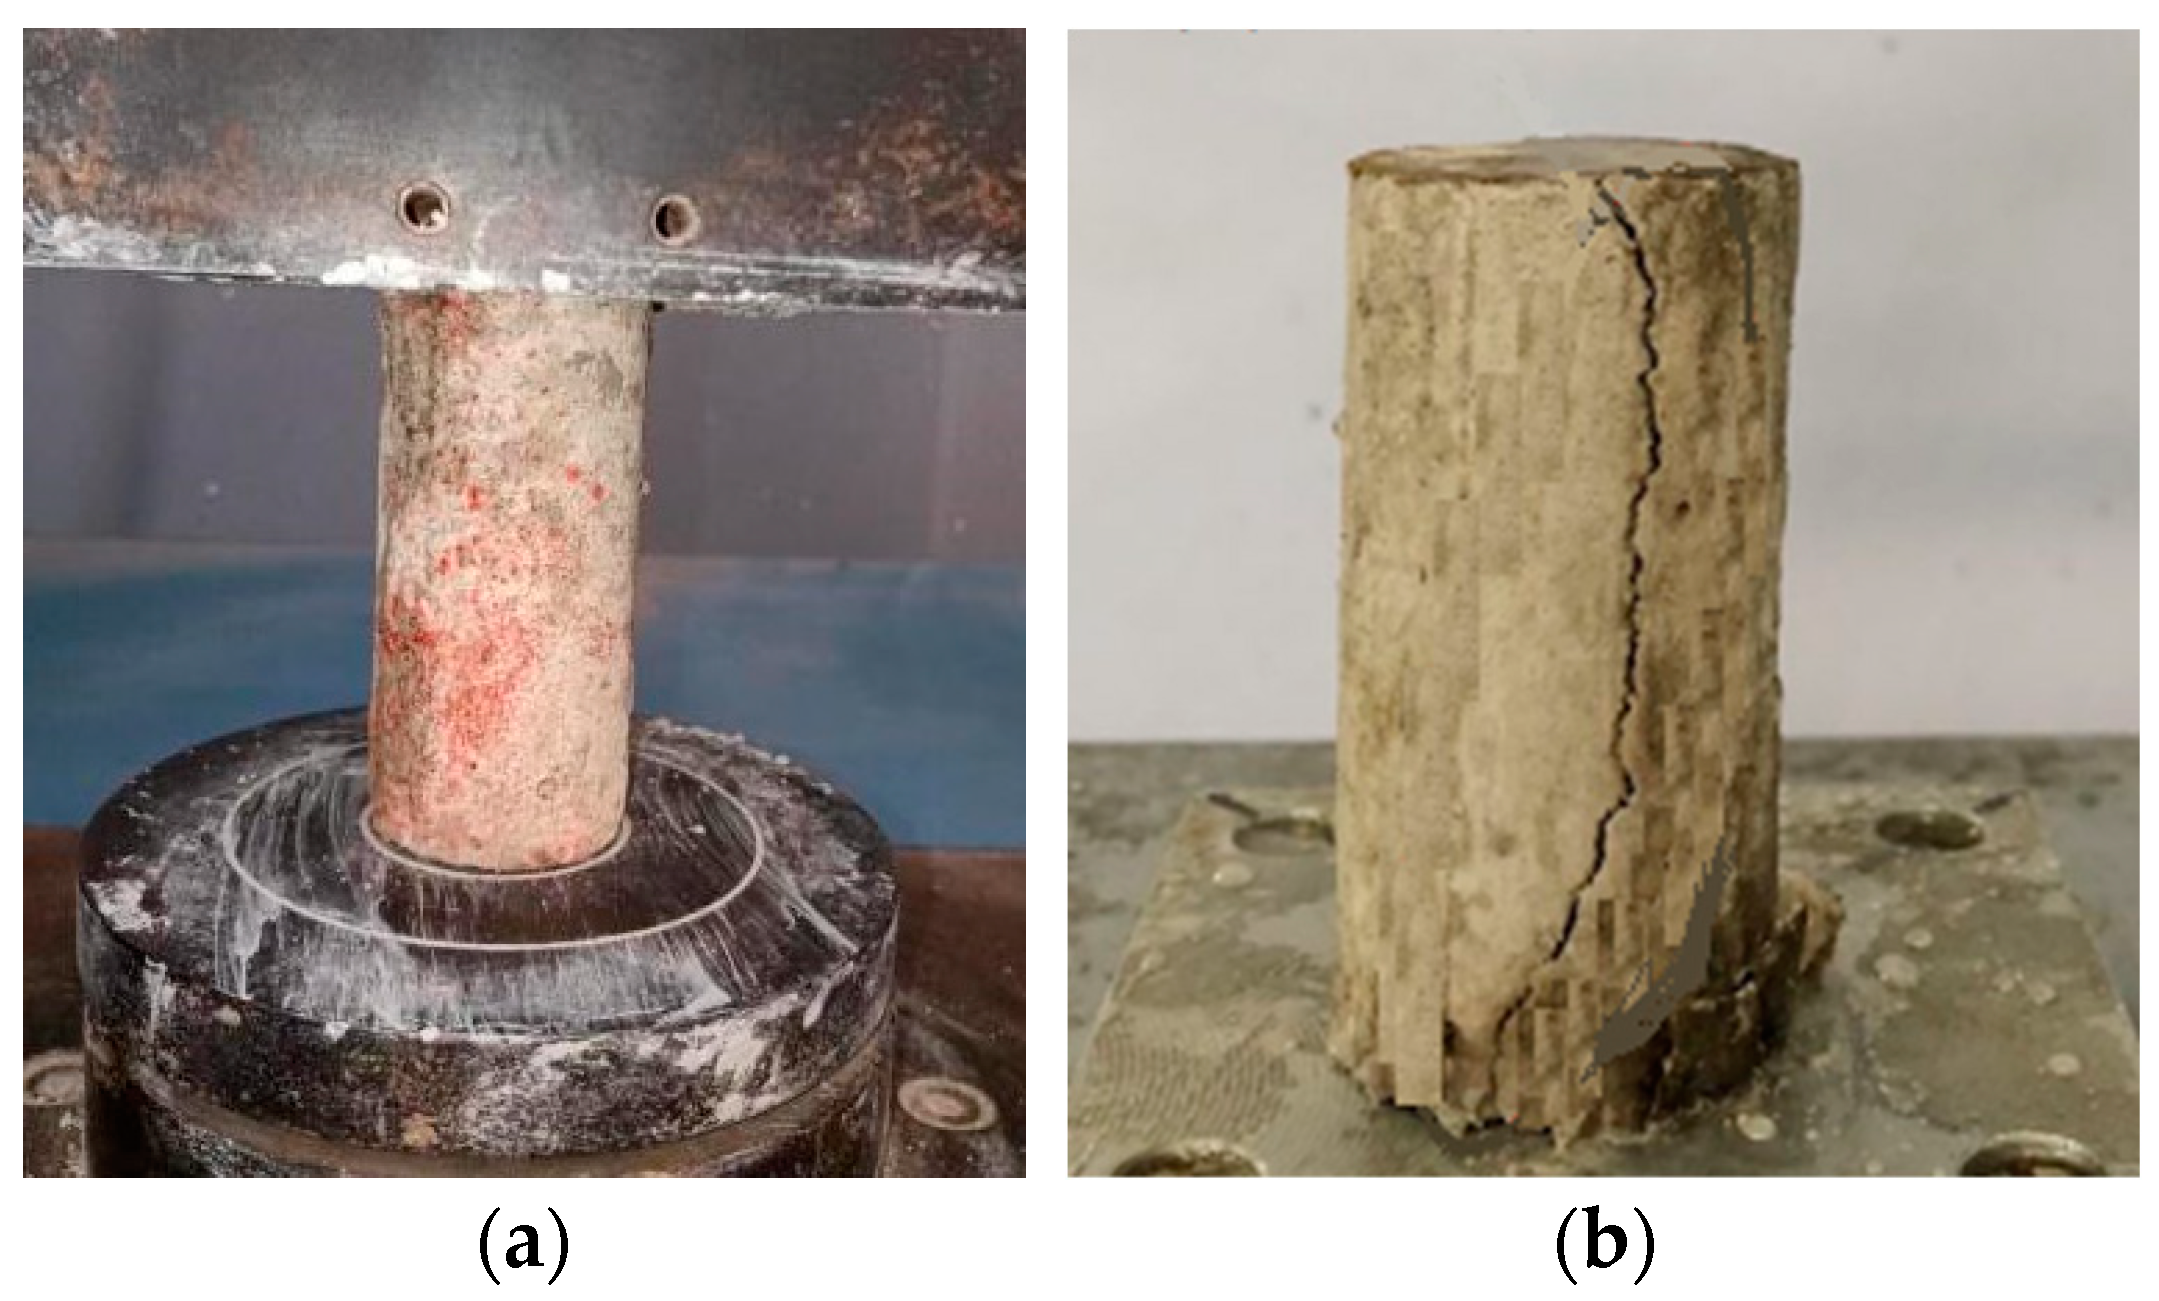
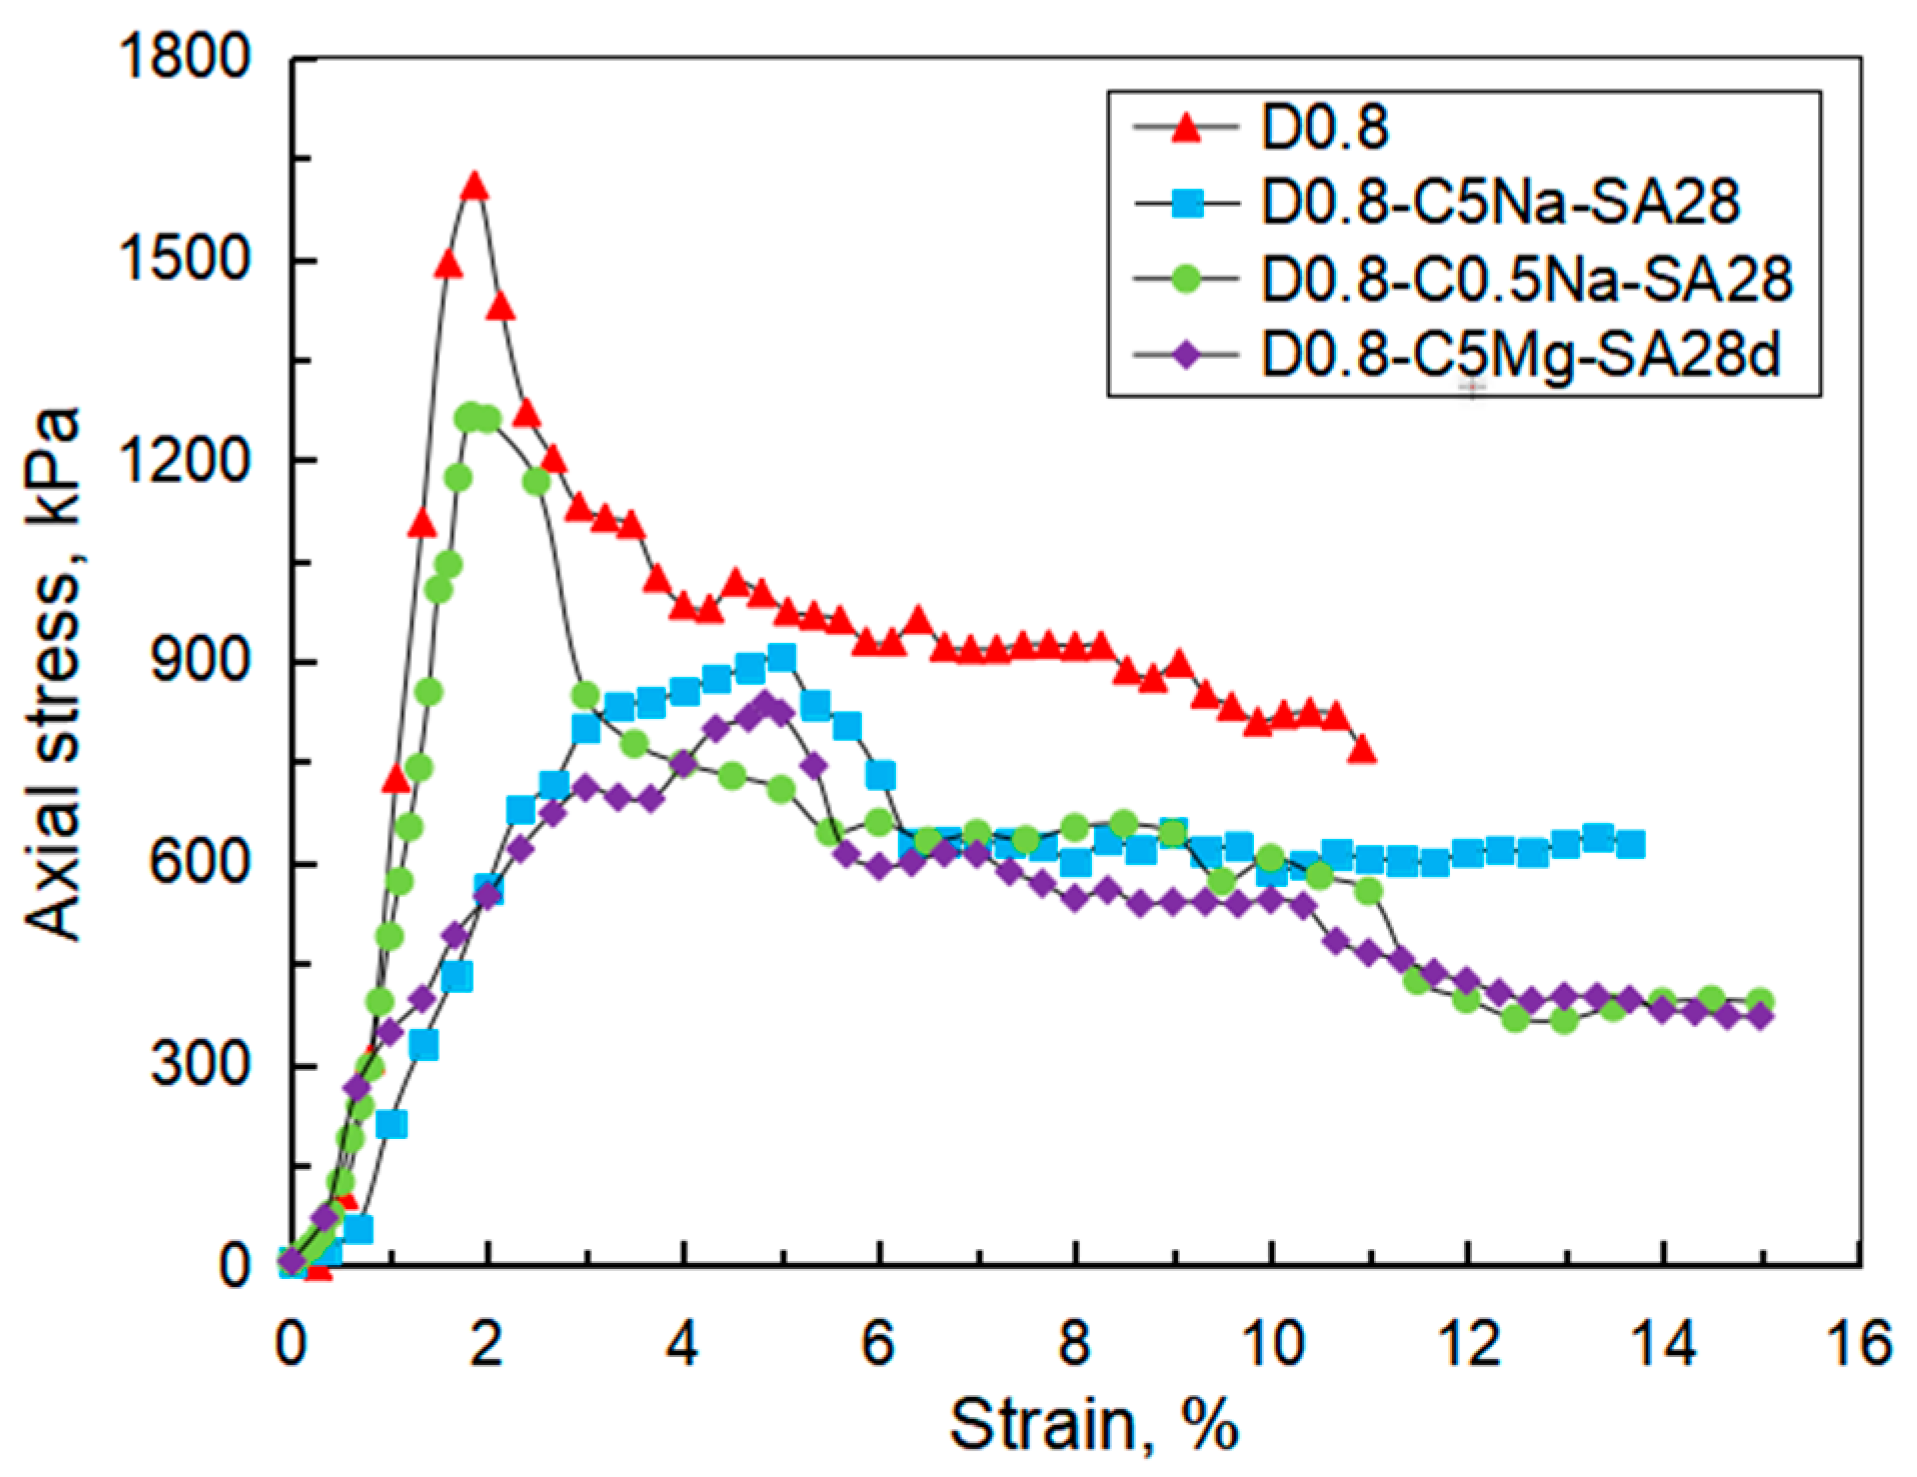
3.2. Stress vs. Strain Curve

As the stress–strain curves of FLS obtained from the UCT were similar, only the stress–strain curves of the specimens of 0.8 g/cm3 under 28-day sulfate immersion are shown in Figure 8. As the strain increased, the stress also rapidly increased in the initial stage and quickly reached its peak (i.e., also called unconfined compressive strength). Additionally, the stress decreased rapidly and stabilized at a constant value which is called residual strength.
Figure 8 also proves that the erosion condition significantly impacted the specimen strength. For the specimens soaked in the solutions of 0.5% Na2SO4, 5% Na2SO4, and 4.24% MgSO4, the unconfined compressive strengths were 1.26, 0.84, and 0.91 MPa, respectively. As compared with the specimen without the sulfate immersion, the unconfined compressive strength of the specimens after soaked by the three sulfate solutions decreased by 23.5%, 49.38%, and 45.2%, respectively. The sulfate solution with higher concentration had a greater impact on the reduction in the specimen strength. In addition, the Na2SO4 solution exhibited greater influence on the deterioration of the specimen strength than the MgSO4 solution with the same SO42− concentration. Figure 9 summarizes the unconfined compressive strength of the specimens under different test conditions. Clearly, the unconfined compressive strength of the specimens decreased with the increasing immersion age or wet-dry cycles. The corrosion resistance of the FLS specimen under sulfate attack will be analyzed in the next section.

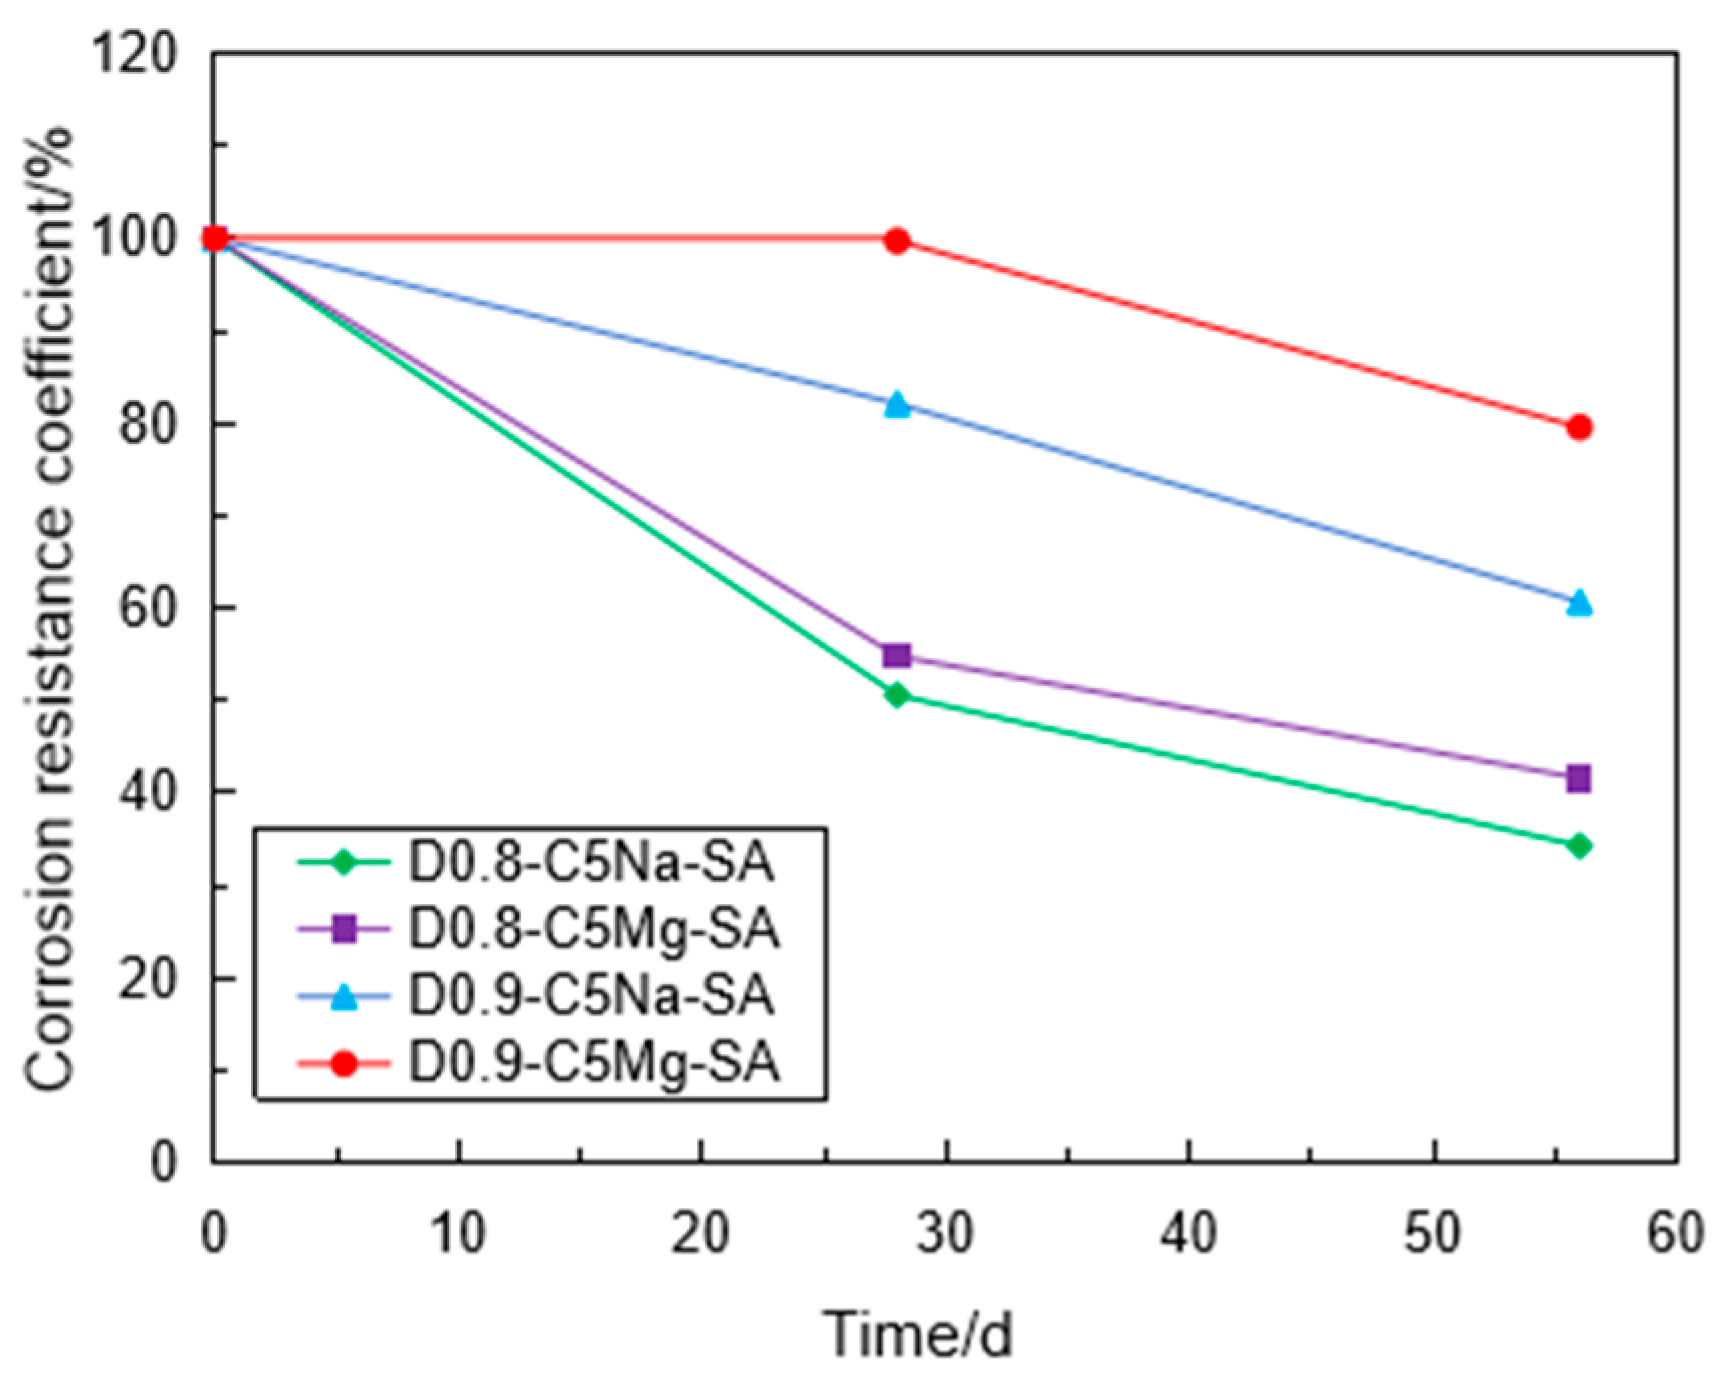
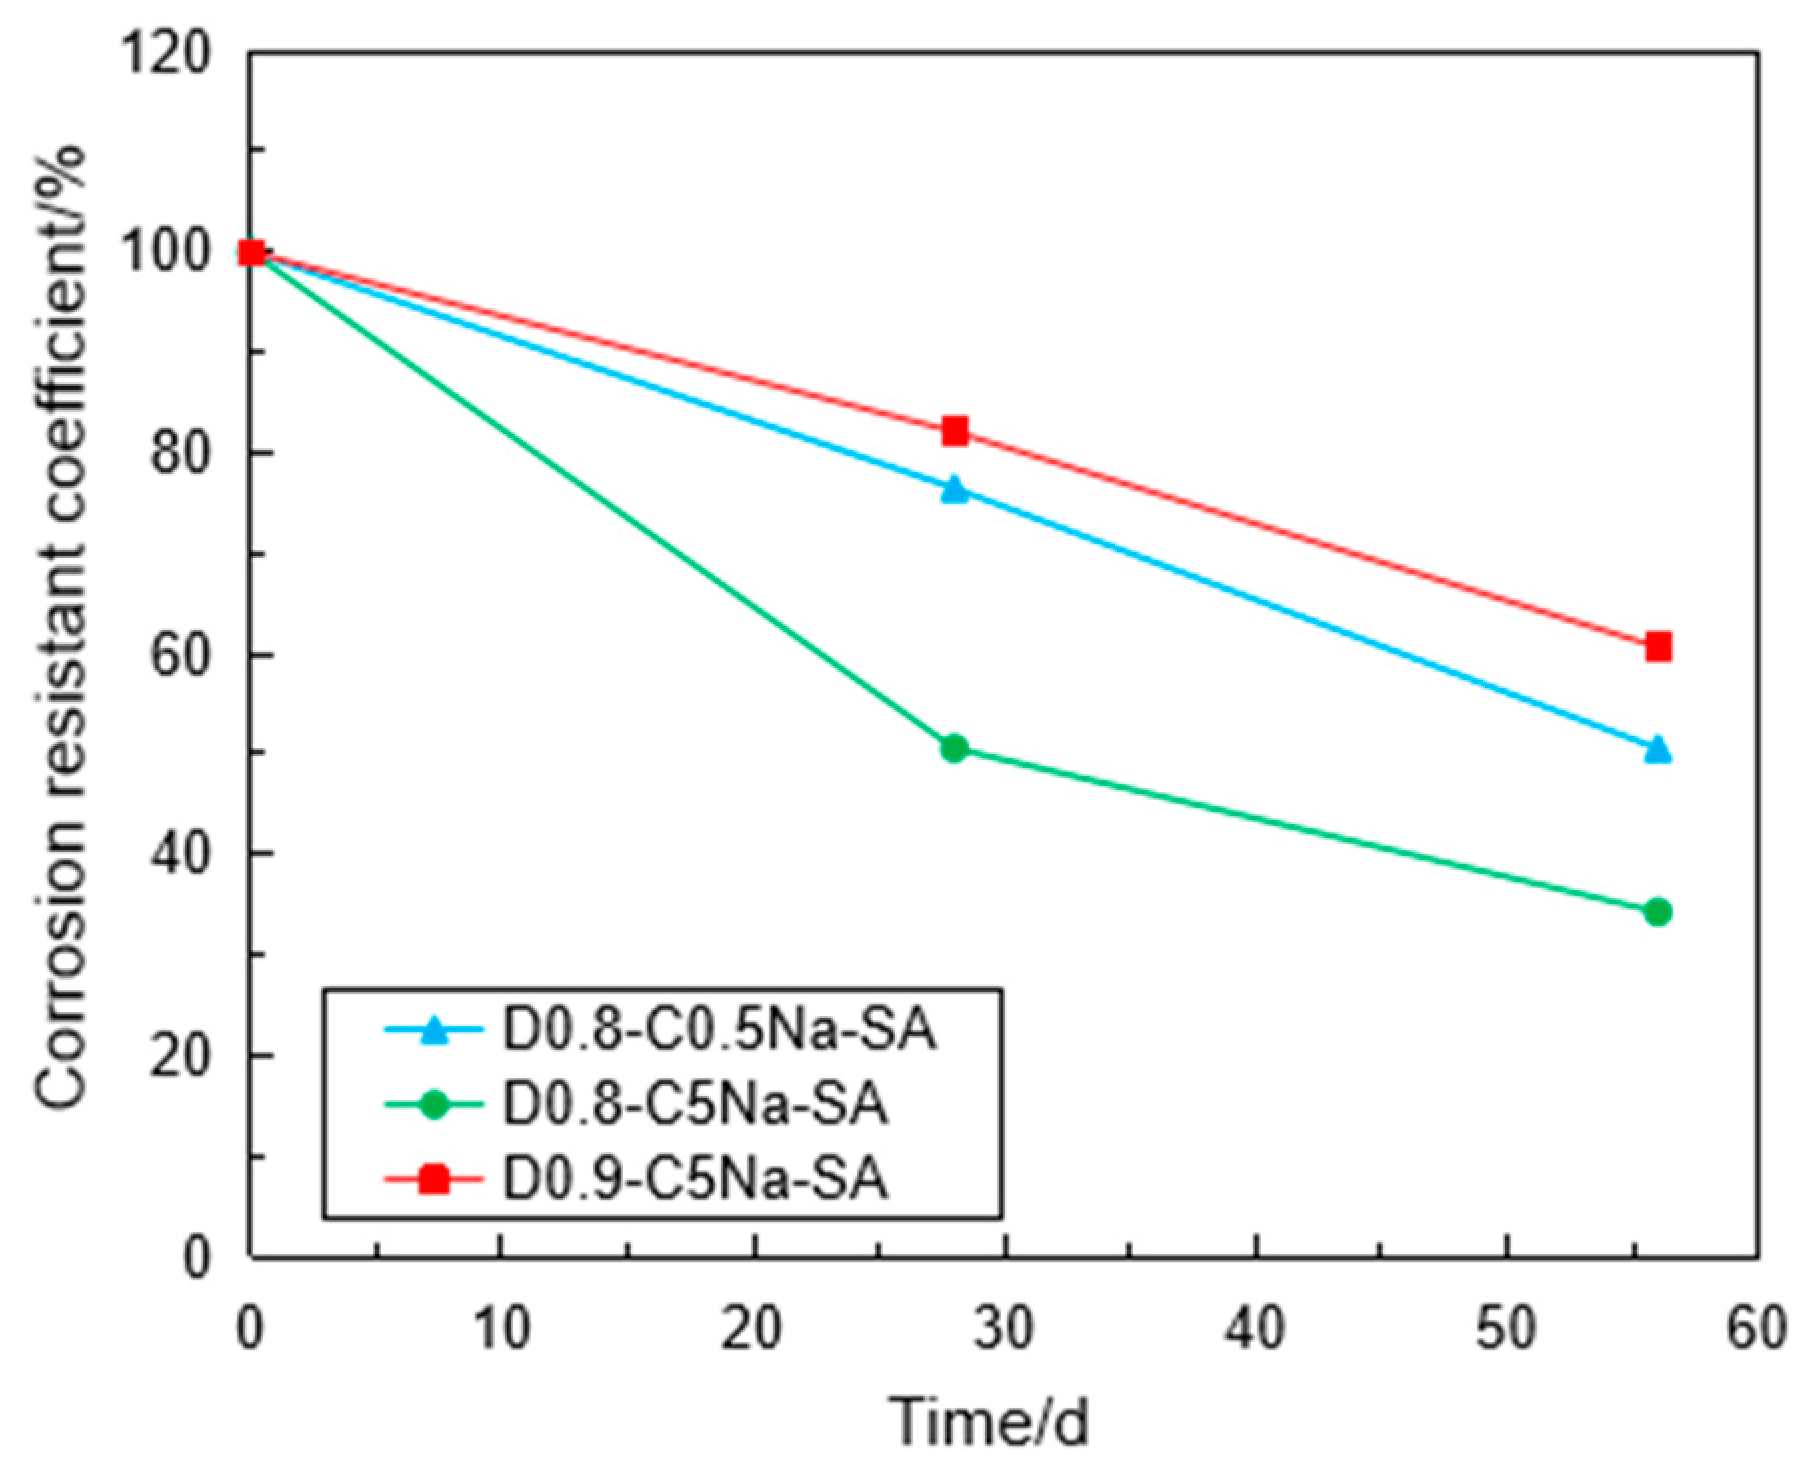
3.3. Corrosion Resistance of the Specimen under Sulfate Attack

To evaluate the corrosion resistance of the specimen due to the sulfate attack, the corrosion resistant coefficient (CRC) is introduced, which is defined as the residual unconfined compressive strength of the specimen after sulfate solution erosion divided by its initial unconfined compressive strength. The value of the corrosion-resistant coefficient is between 0 and 100%, while the value close to 100% indicates a stronger corrosion resistance.
CRC = P r P i × 100 %
where CRC is the corrosion-resistant coefficient, Pr is the remaining unconfined compressive strength of the specimen after sulfate solution erosion, and Pi is the initial unconfined compressive strength.
Figure 10 shows the variation of the CRC with the immersion time in the Na2SO4 solution. The CRC values were reduced with the immersion time regardless of the concentration of the Na2SO4 solution and the density of the specimen. It is clear that the higher concentration of the Na2SO4 solution had a significant influence on the strength reduction in the specimen when the densities of the specimen were the same. The CRC of the specimen of 0.9 g/cm3 was 60.7% after sulfate attack for 56 days, while the CRC of the specimen of 0.8 g/cm3 was 34.3% under the same immersion condition. This indicates that the high-density FLS had stronger erosion resistance under the same Na2SO4 concentration. This can be explained by the fact that high-density FLS specimens had strong cementation structures due to the high content of cement matrix [15].
Figure 11 shows the variation of the CRC with the immersion time in different sulfate solutions. The CRC values of the specimens with 0.8 g/cm3 after sulfate immersion in 5% Na2SO4 solution were 51% and 34.3% for 28 days and 56 days, respectively, while the CRC values of the specimens in 4.24% MgSO4 solution were 54.8% and 41.6%, respectively. For the sulfate solution with the same SO42− concentration, the FLS specimen was eroded more seriously in the Na2SO4 solution than in the MgSO4 solution. This phenomenon was more obvious for the specimen with 0.9 g/cm3. When the FLS specimen was immersed in the MgSO4 solution, a film of Mg(OH)2 was produced on the surface of the specimen, preventing the specimen from further erosion [9].

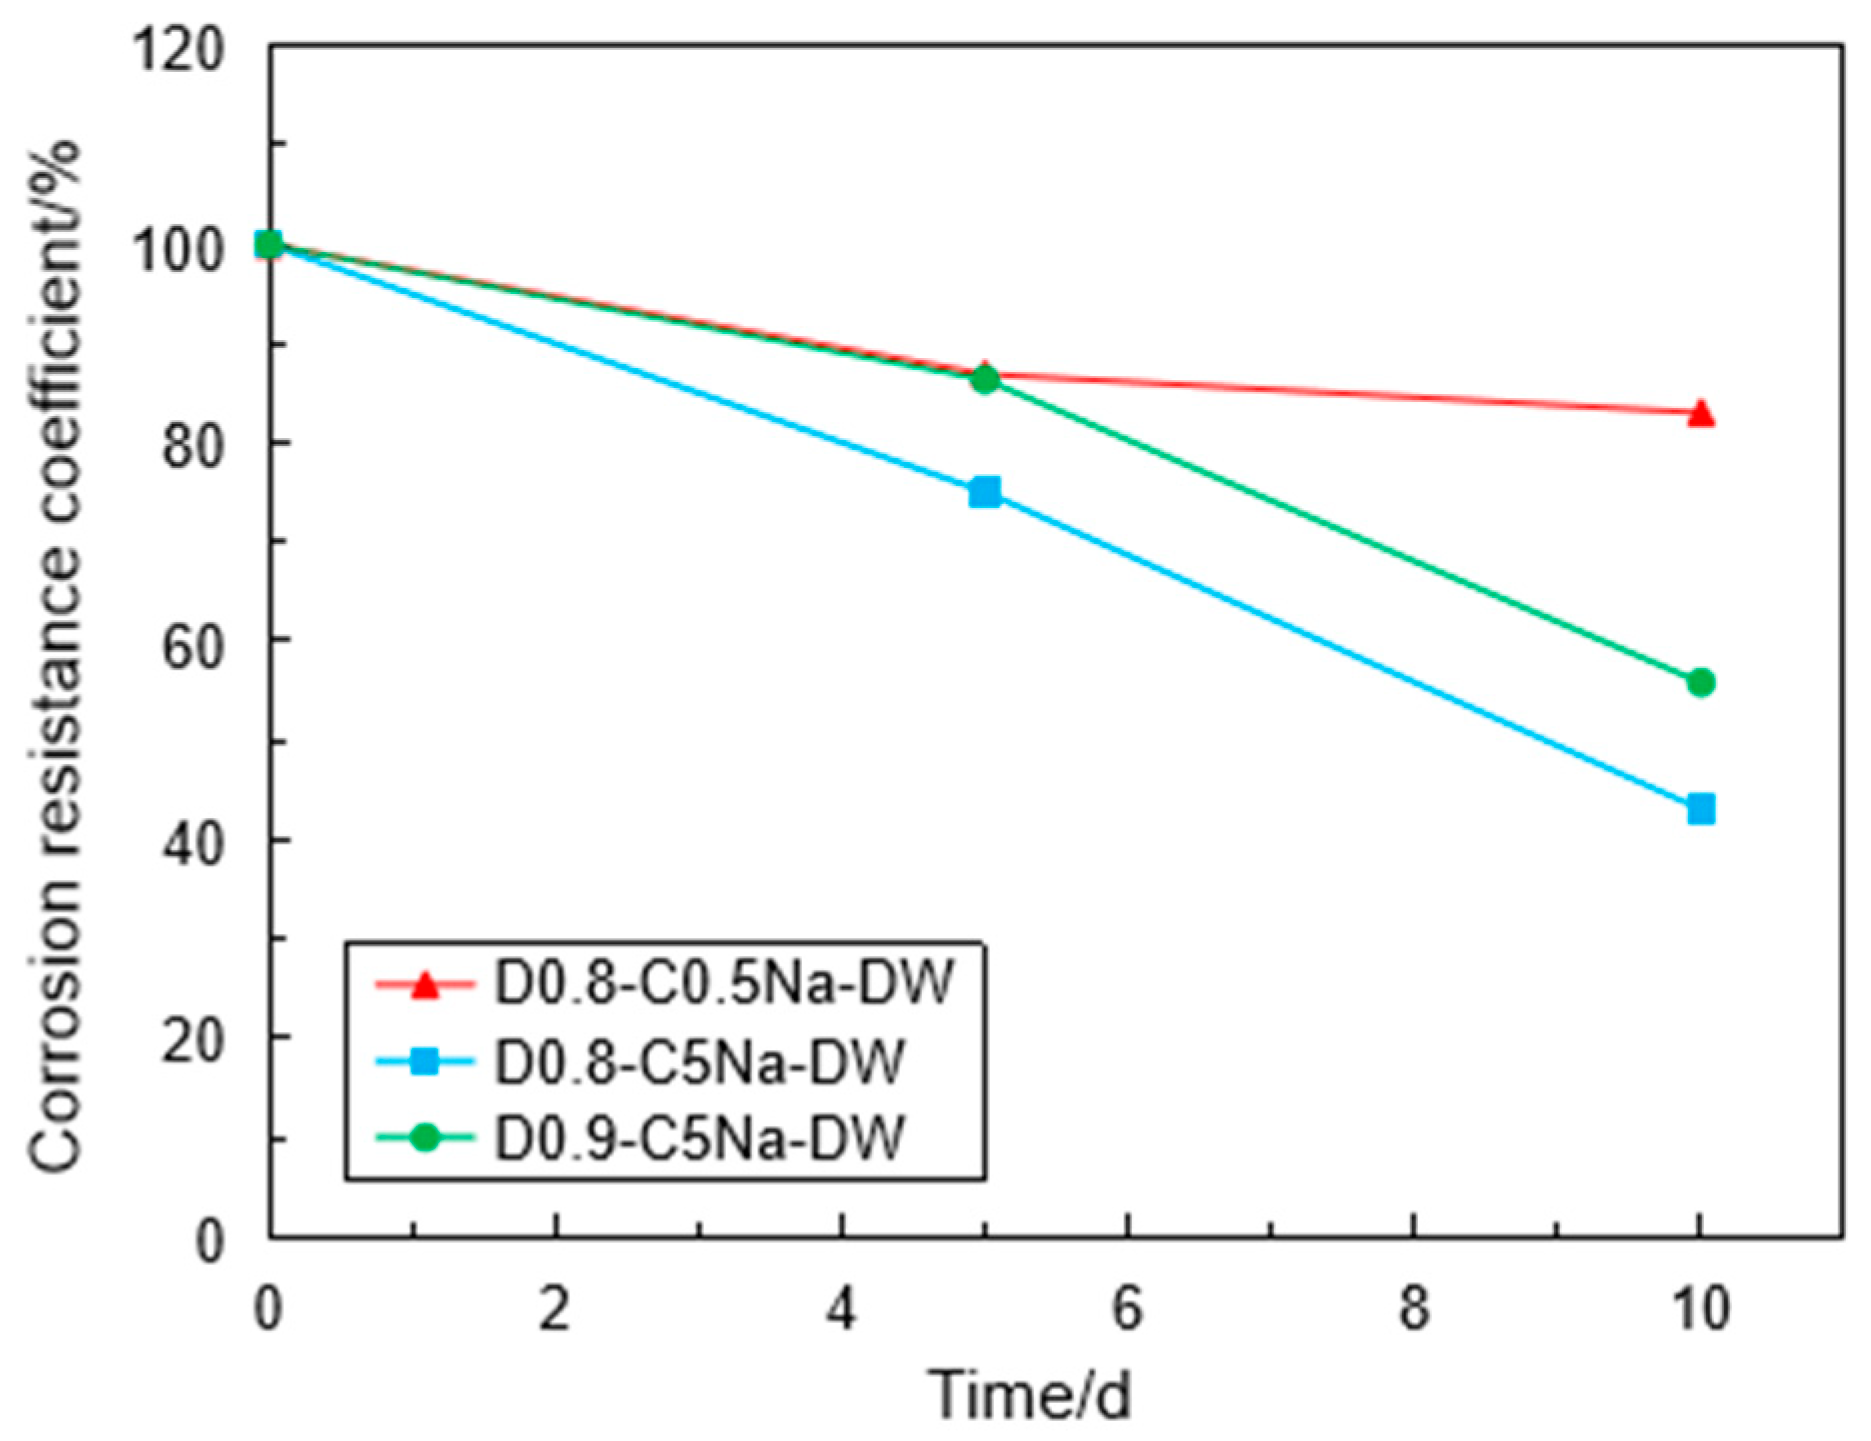
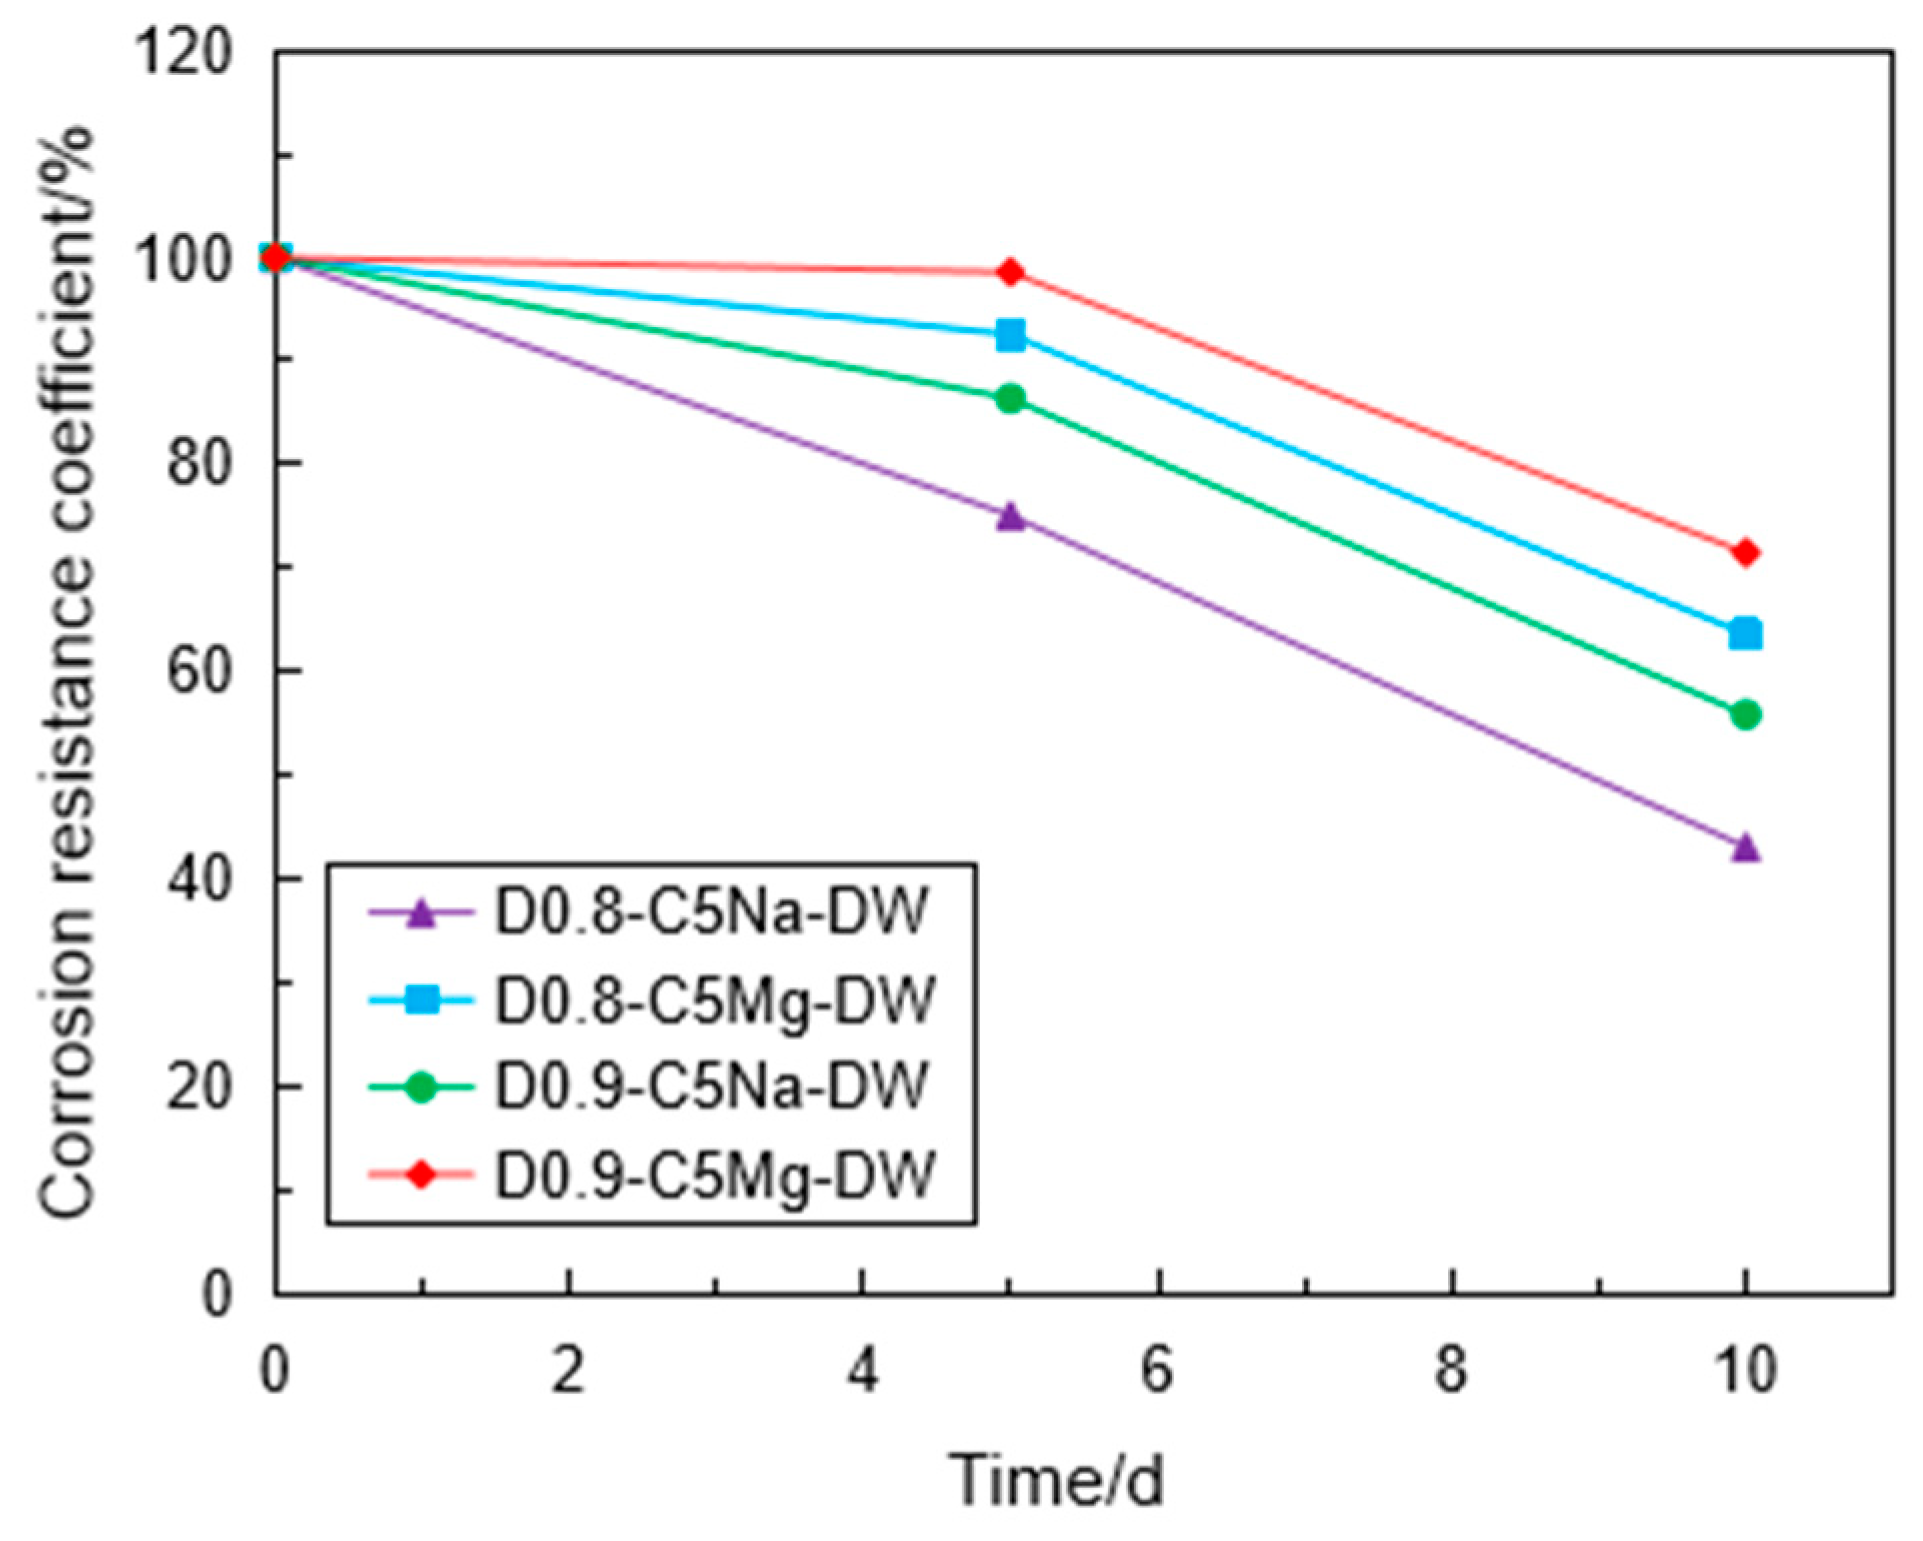
3.4. Corrosion Resistance of the Specimen under Coupling Effect

Figure 12 shows the variation of the CRC under the coupling effect in the Na2SO4 solution. The CRC values reduced with the increase in the wet-dry cycles regardless of solution concentration and specimen density. For the specimen with 0.8 g/cm3 after 10 cycles, the CRC was 43.1% in the 5% Na2SO4 solution, while the CRC was 83.1% in the 0.5% Na2SO4 solution. As expected, the erosion of the FLS specimen is more serious in the sulfate solution of high concentration under the coupling effect. Compared with the specimen of 0.8 g/cm3, the CRC of the specimen of 0.9 g/cm3 reduced slowly, indicating that the high-density FLS specimen had strong erosion resistance against the coupling effect when other conditions were kept constant. Figure 13 shows the variation of the CRC with the dry-wet cycles in the different cation types (i.e., Na+ and Mg2+). Under the coupling effect, the CRC of the FLS specimen in the Na2SO4 solution reduced significantly than that in the MgSO4 solution with the increase in dry-wet cycles.

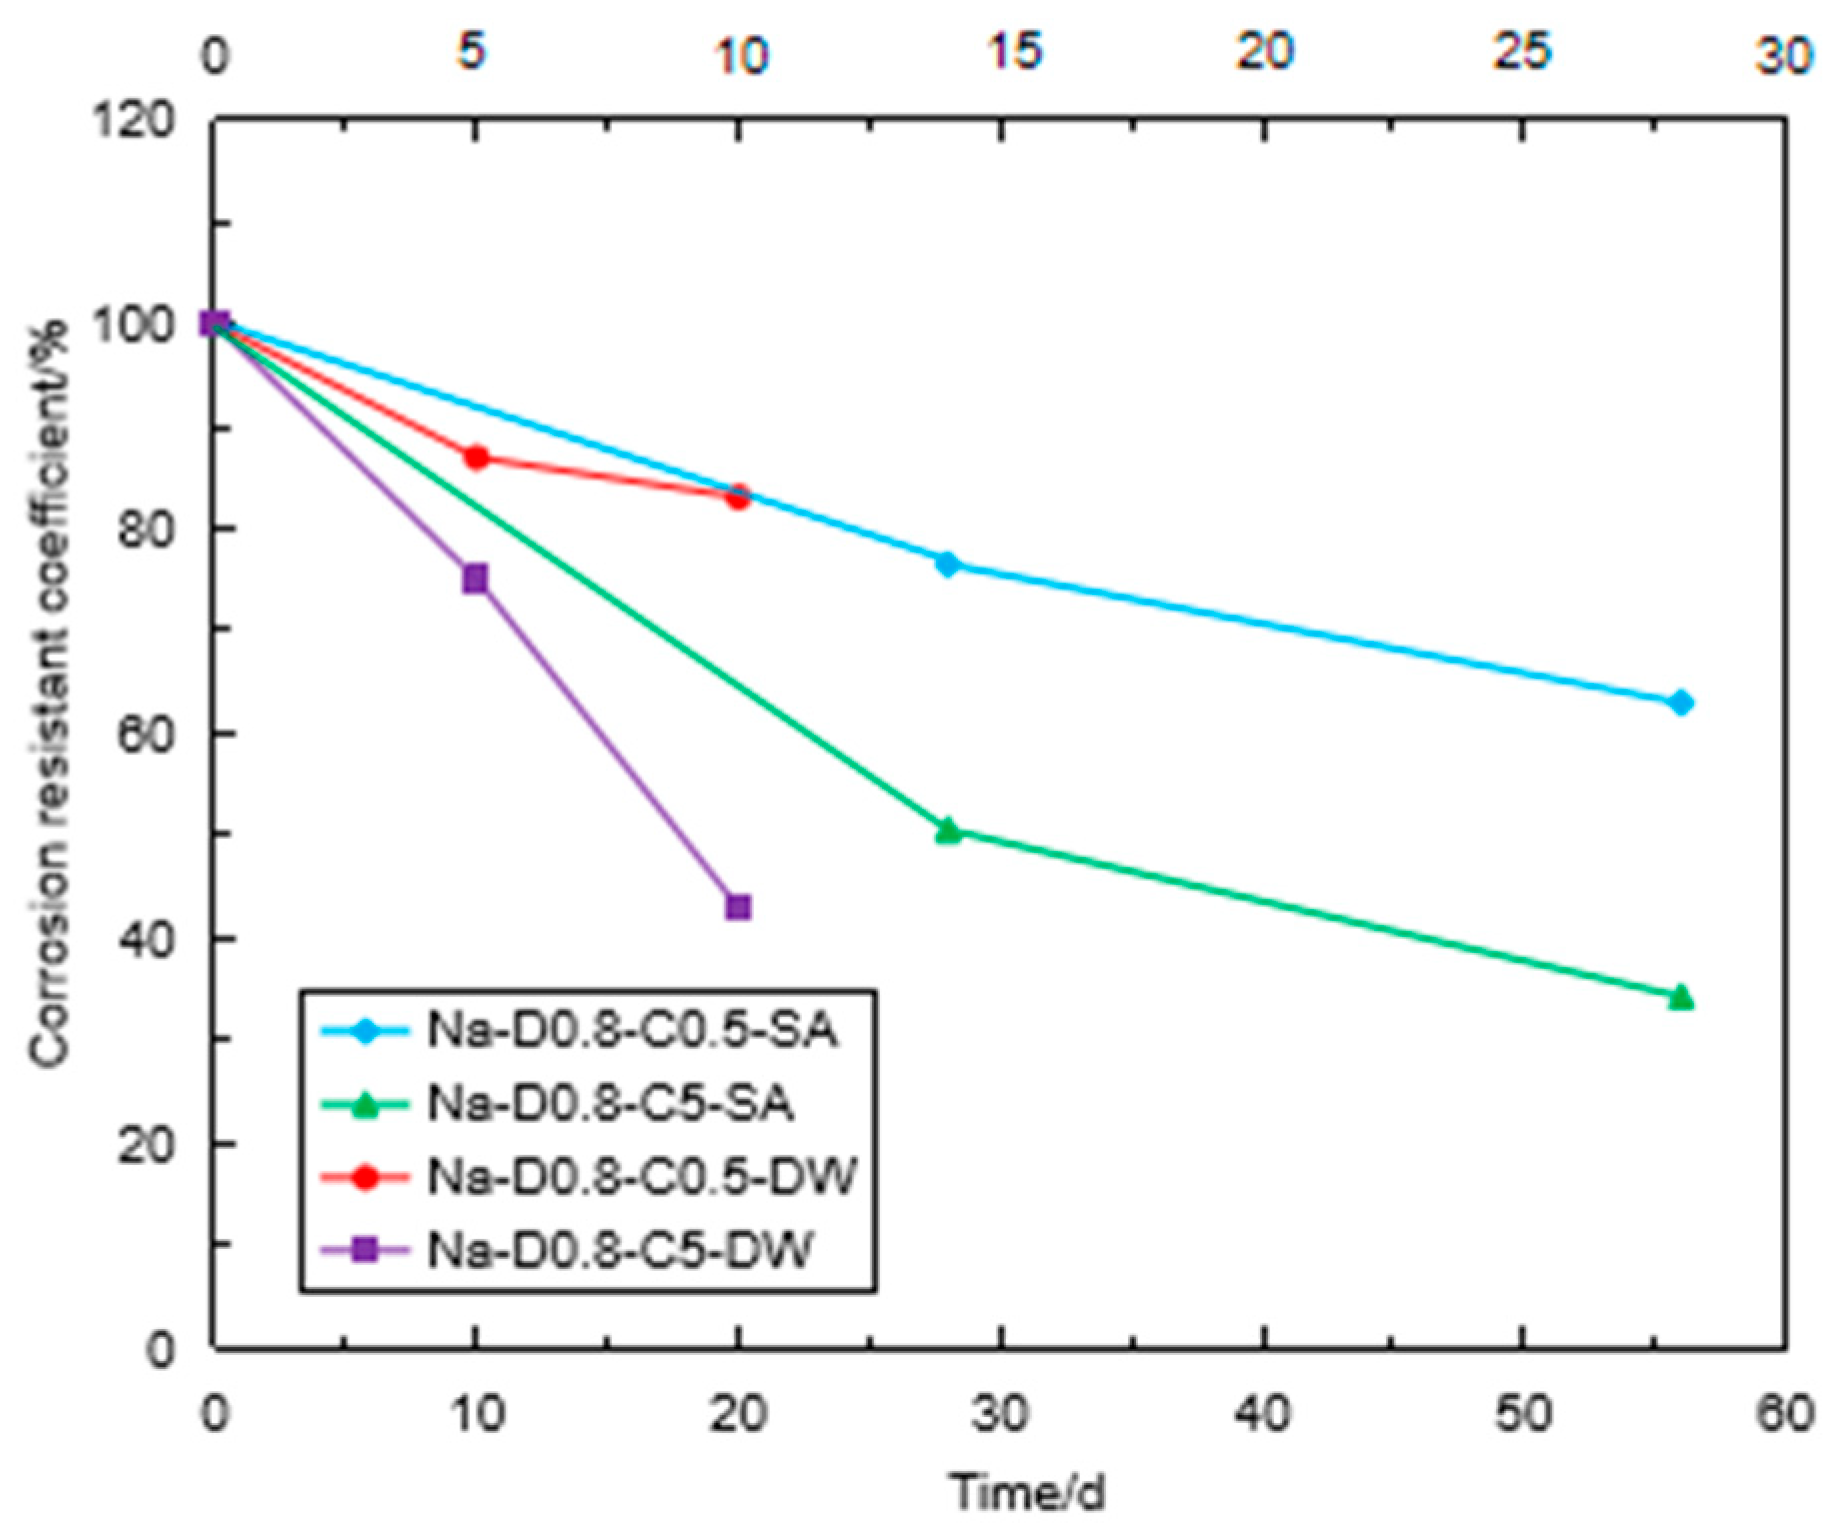
3.5. Comparison of Sulfate Immersion and Coupling Effect

The former section confirmed that the strength of the FLS specimen was reduced due to the sulfate immersion and the coupling effect of chemical erosion and the wet-dry cycle. To compare the influence of these two erosion conditions, Figure 14 shows the CRC of the FLS specimens under two erosion conditions. Eroded by the Na2SO4 solution with the same concentration, the coupling effect accelerated the reduction in the specimen strength. In the 0.5% Na2SO4 solution, the CRC curve of the specimen under the coupling effect was slightly below those under the sulfate immersion. However, when the specimens were eroded by the 5% Na2SO4 solution, the CRC of the specimen under the coupling effect decreased faster than that under the sulfate immersion, and the gap was further widened with the increase in the erosion age. From a practical point of view, more attention must be paid when the backfilled FLS faced both the chemical erosion and wet-dry cycle, as the strength reduction in FLS due to the coupling effect was more significant.

4. Empirical Method for Predicting the CRC of FLS

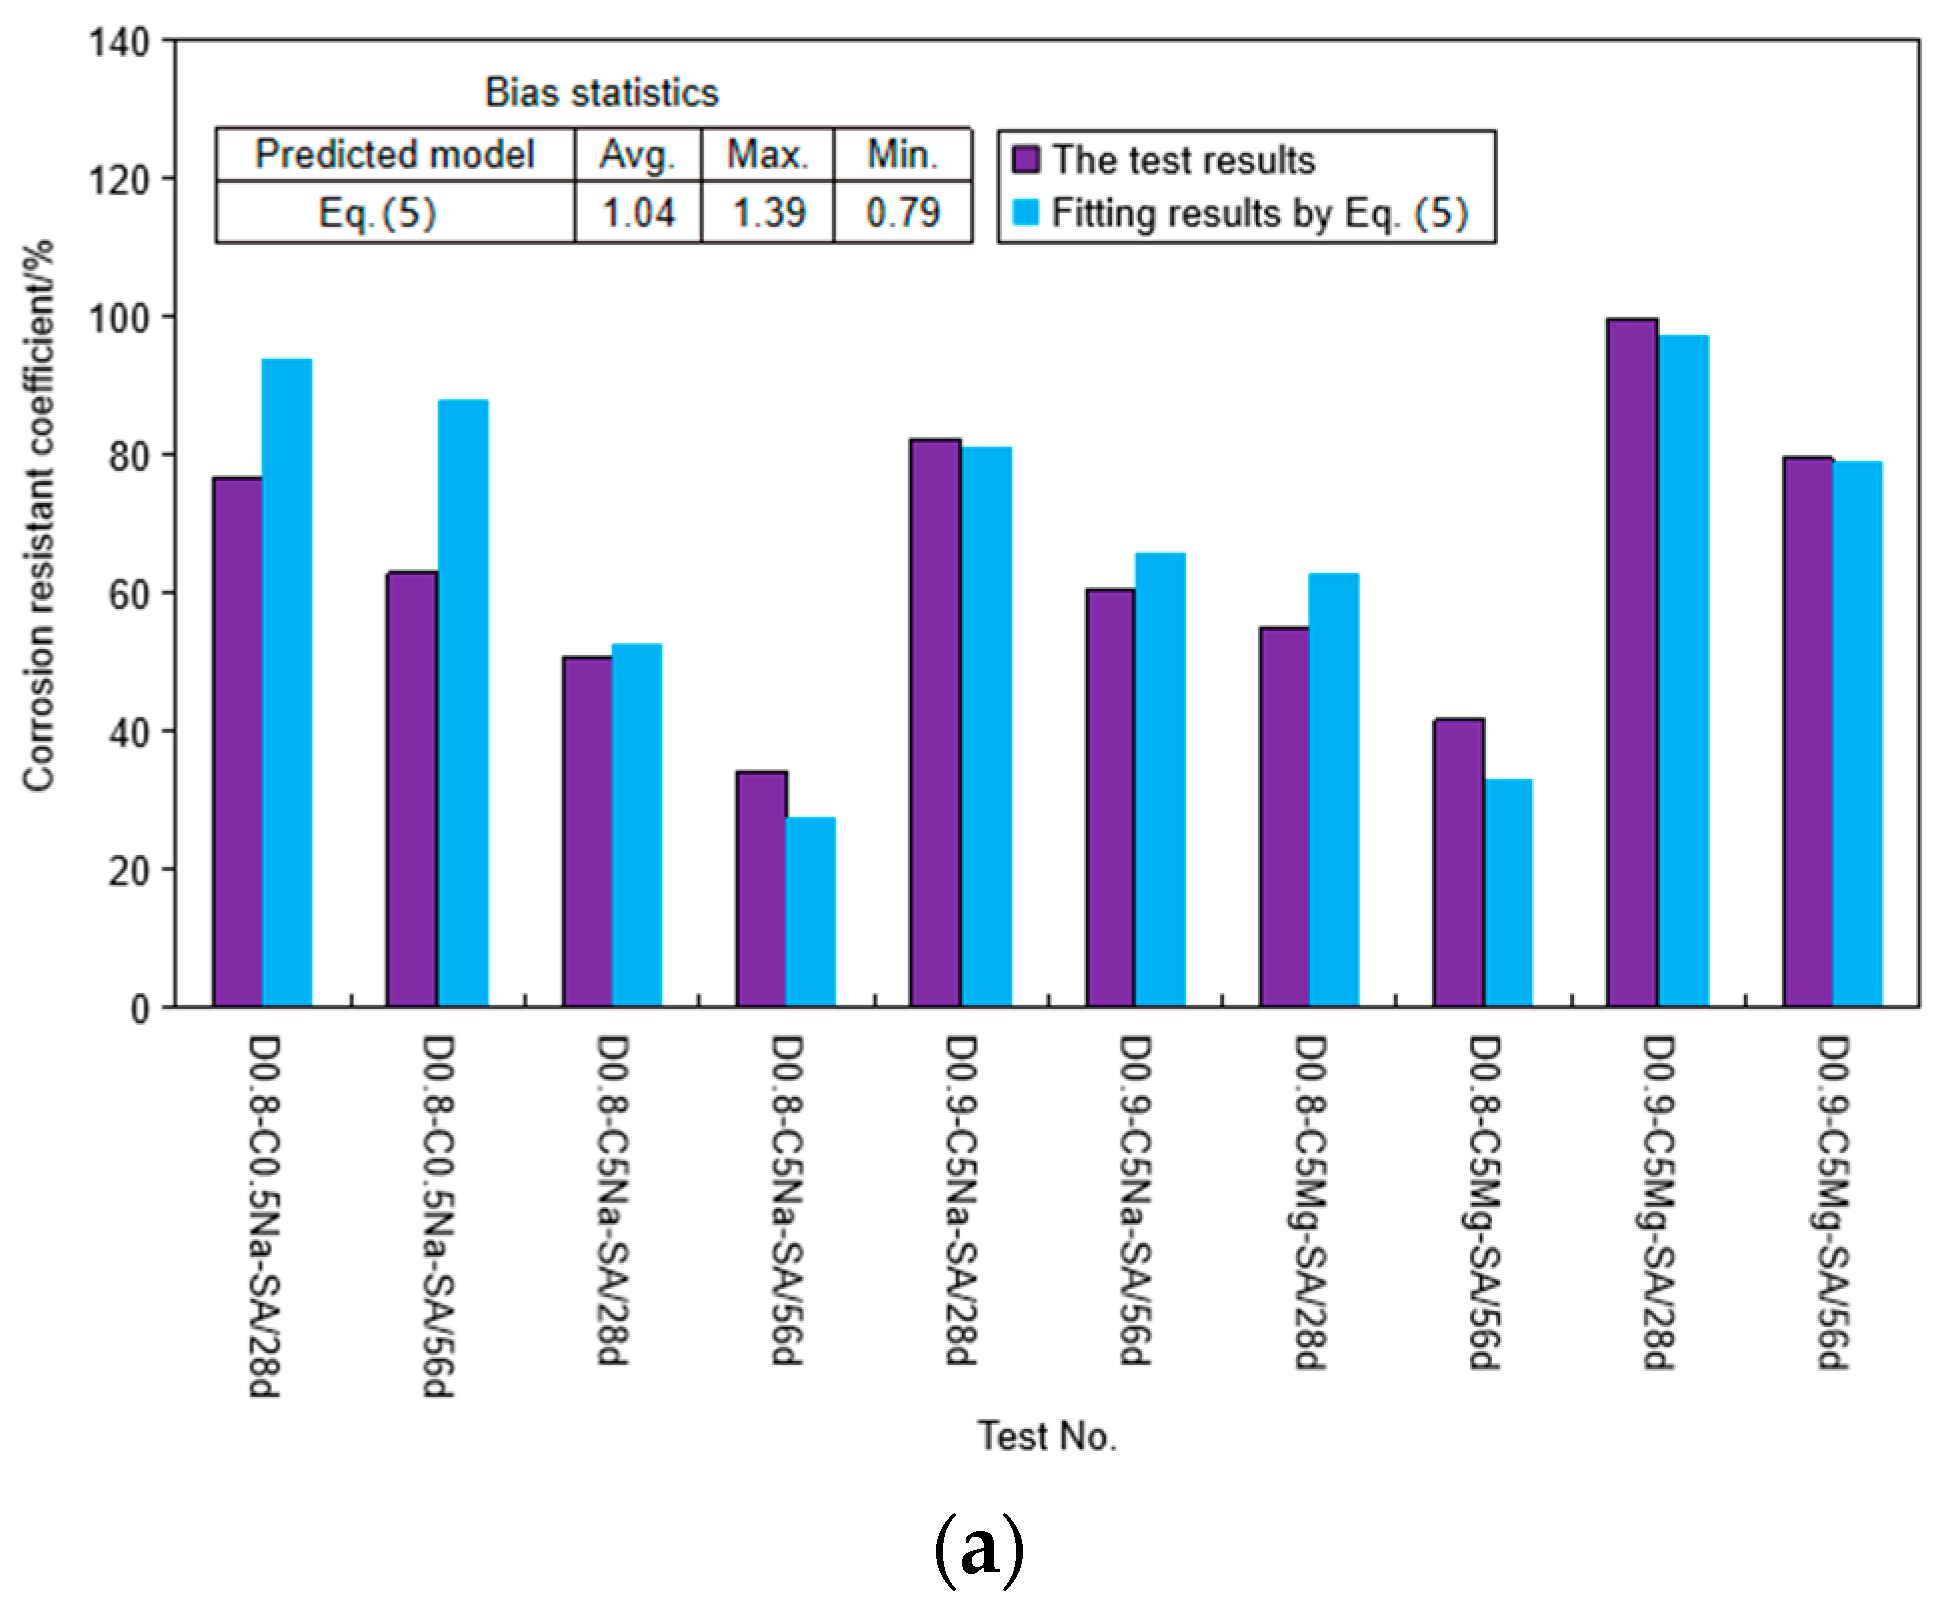
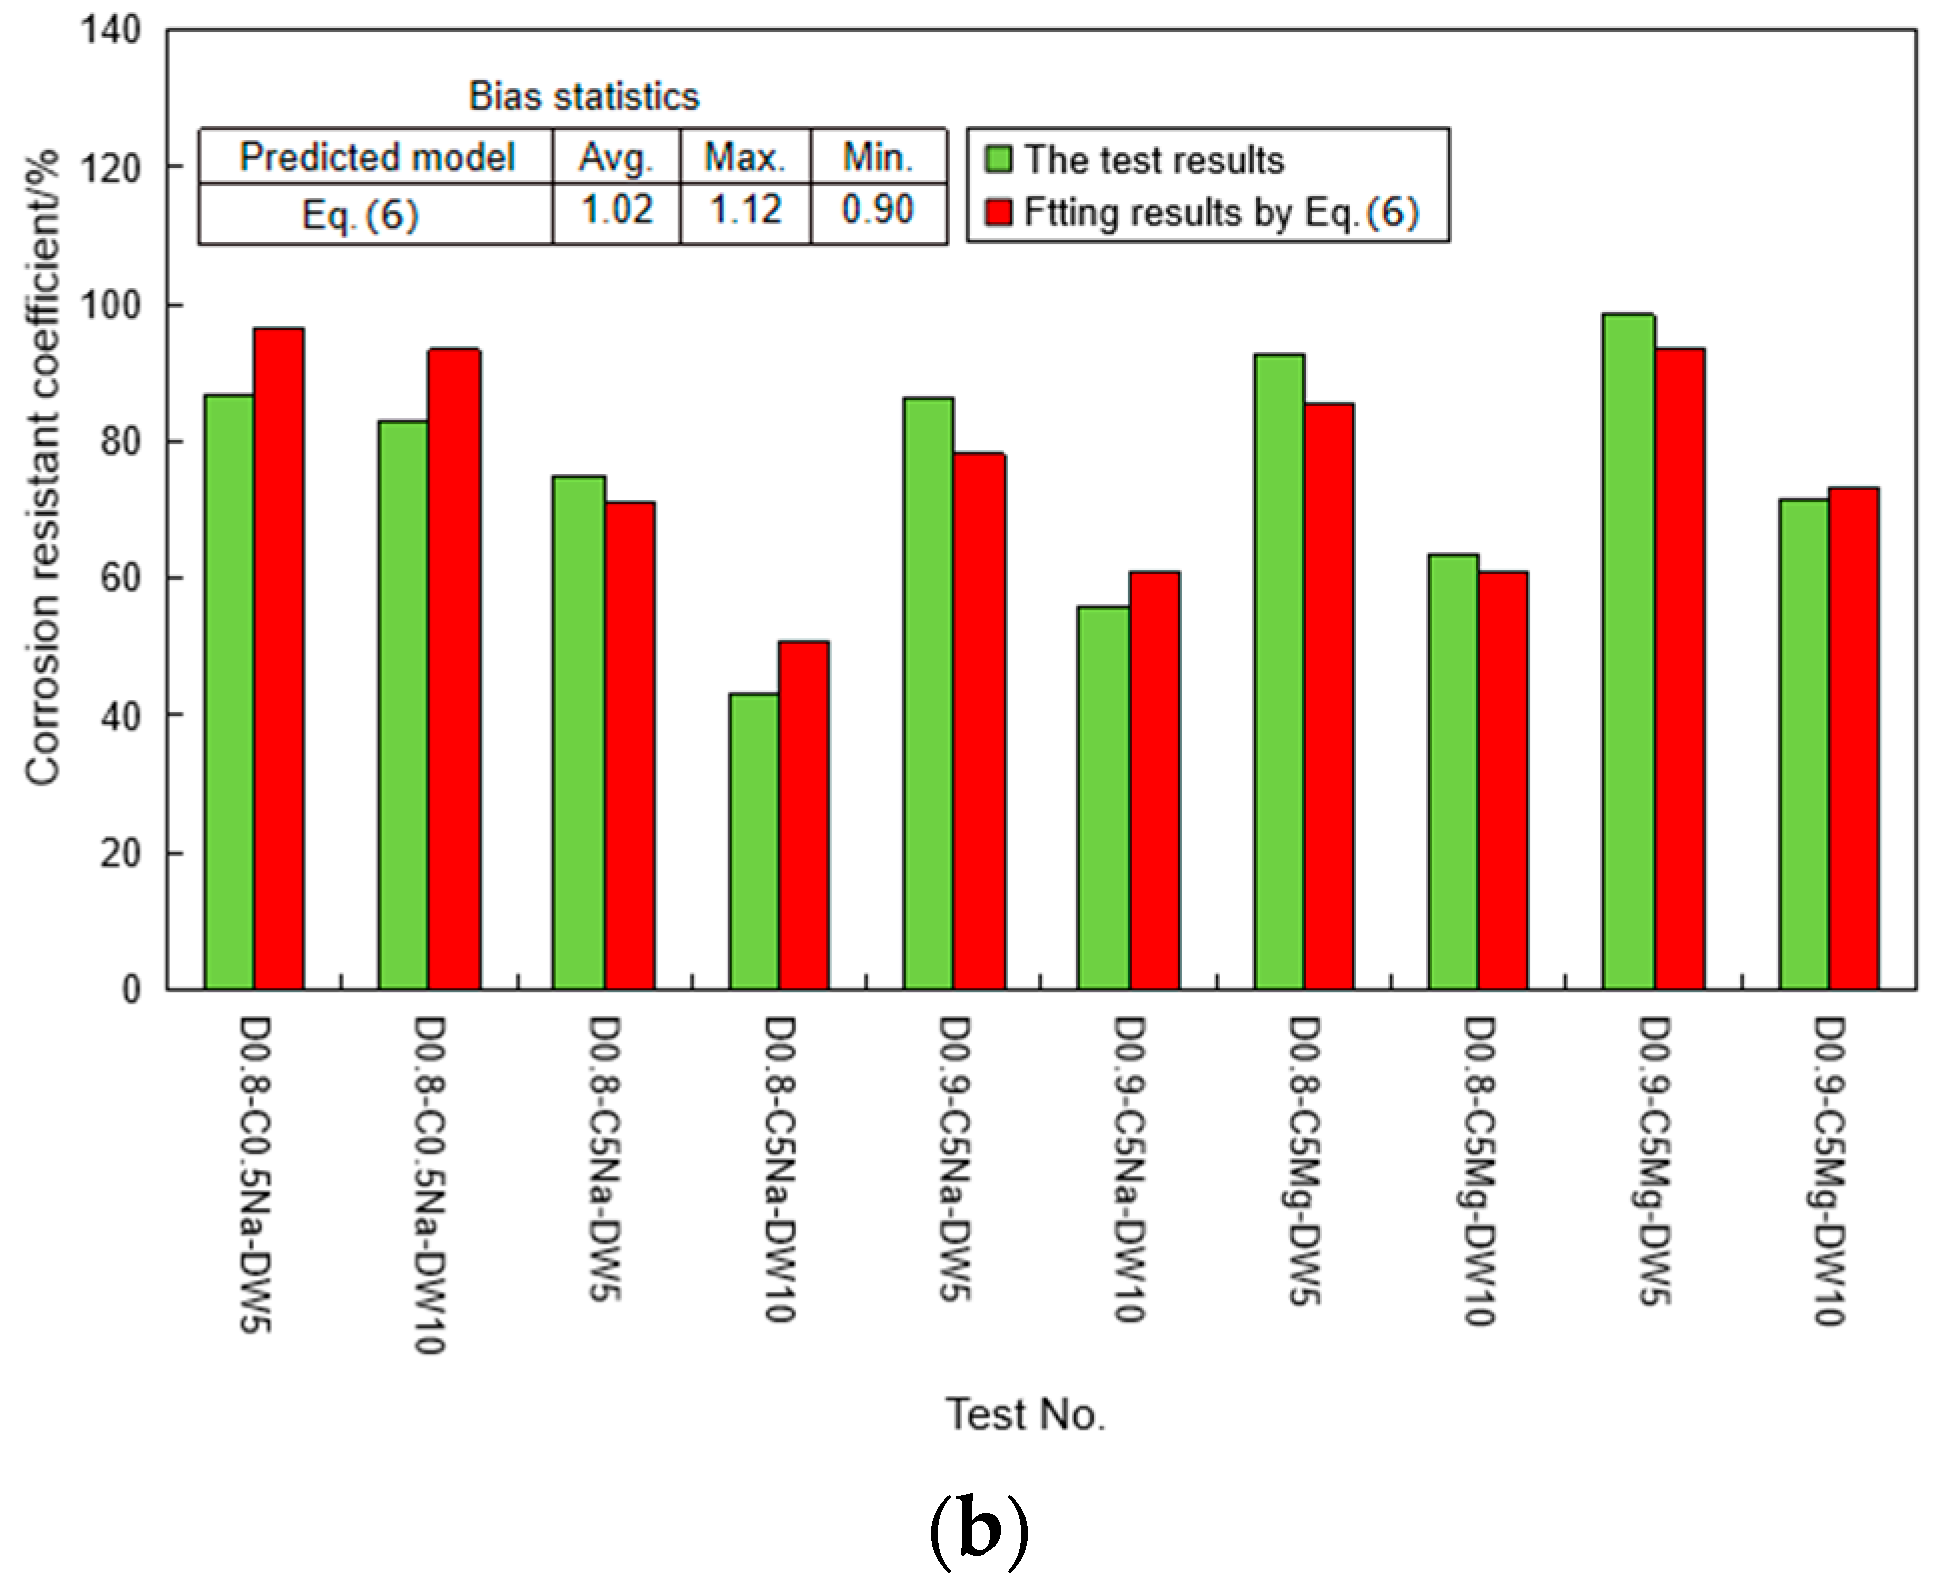
4.1. Strength Degradation Model

It is confirmed that the strength of the FLS decreased with erosion age due to the sulfate attack regardless of the solution concentration and sulfate type. Other studies also revealed similar results [9,11,24]. Thus, an exponential function was selected to build the strength degradation model,
R t = λ R 0 e β T
where R0 is the initial compressive strength of FLS without sulfate attack; Rt is the compressive strength of FLS after eroded by sulfate solution for a period of T; λ and β are undetermined coefficients related to the influencing factors of concentration and type of sulfate solution, density of FLS, and so on. As CRC equals to Rt/R0, Equation (2) can be rewritten as:
C R C = λ e β T
The influencing factors, including the concentration and type of sulfate solution, as well as the density of FLS, were discussed in this study. Based on the variable separation method, Equation (2) is rebuilt in the following form:
C R C = λ e β 1 ( c ) β 2 ( p ) T
where β1(c) and β2(ρ) are the functions related to the concentration of sulfate solution and density of FLS, respectively; λ is the factor considering the type of sulfate solution.

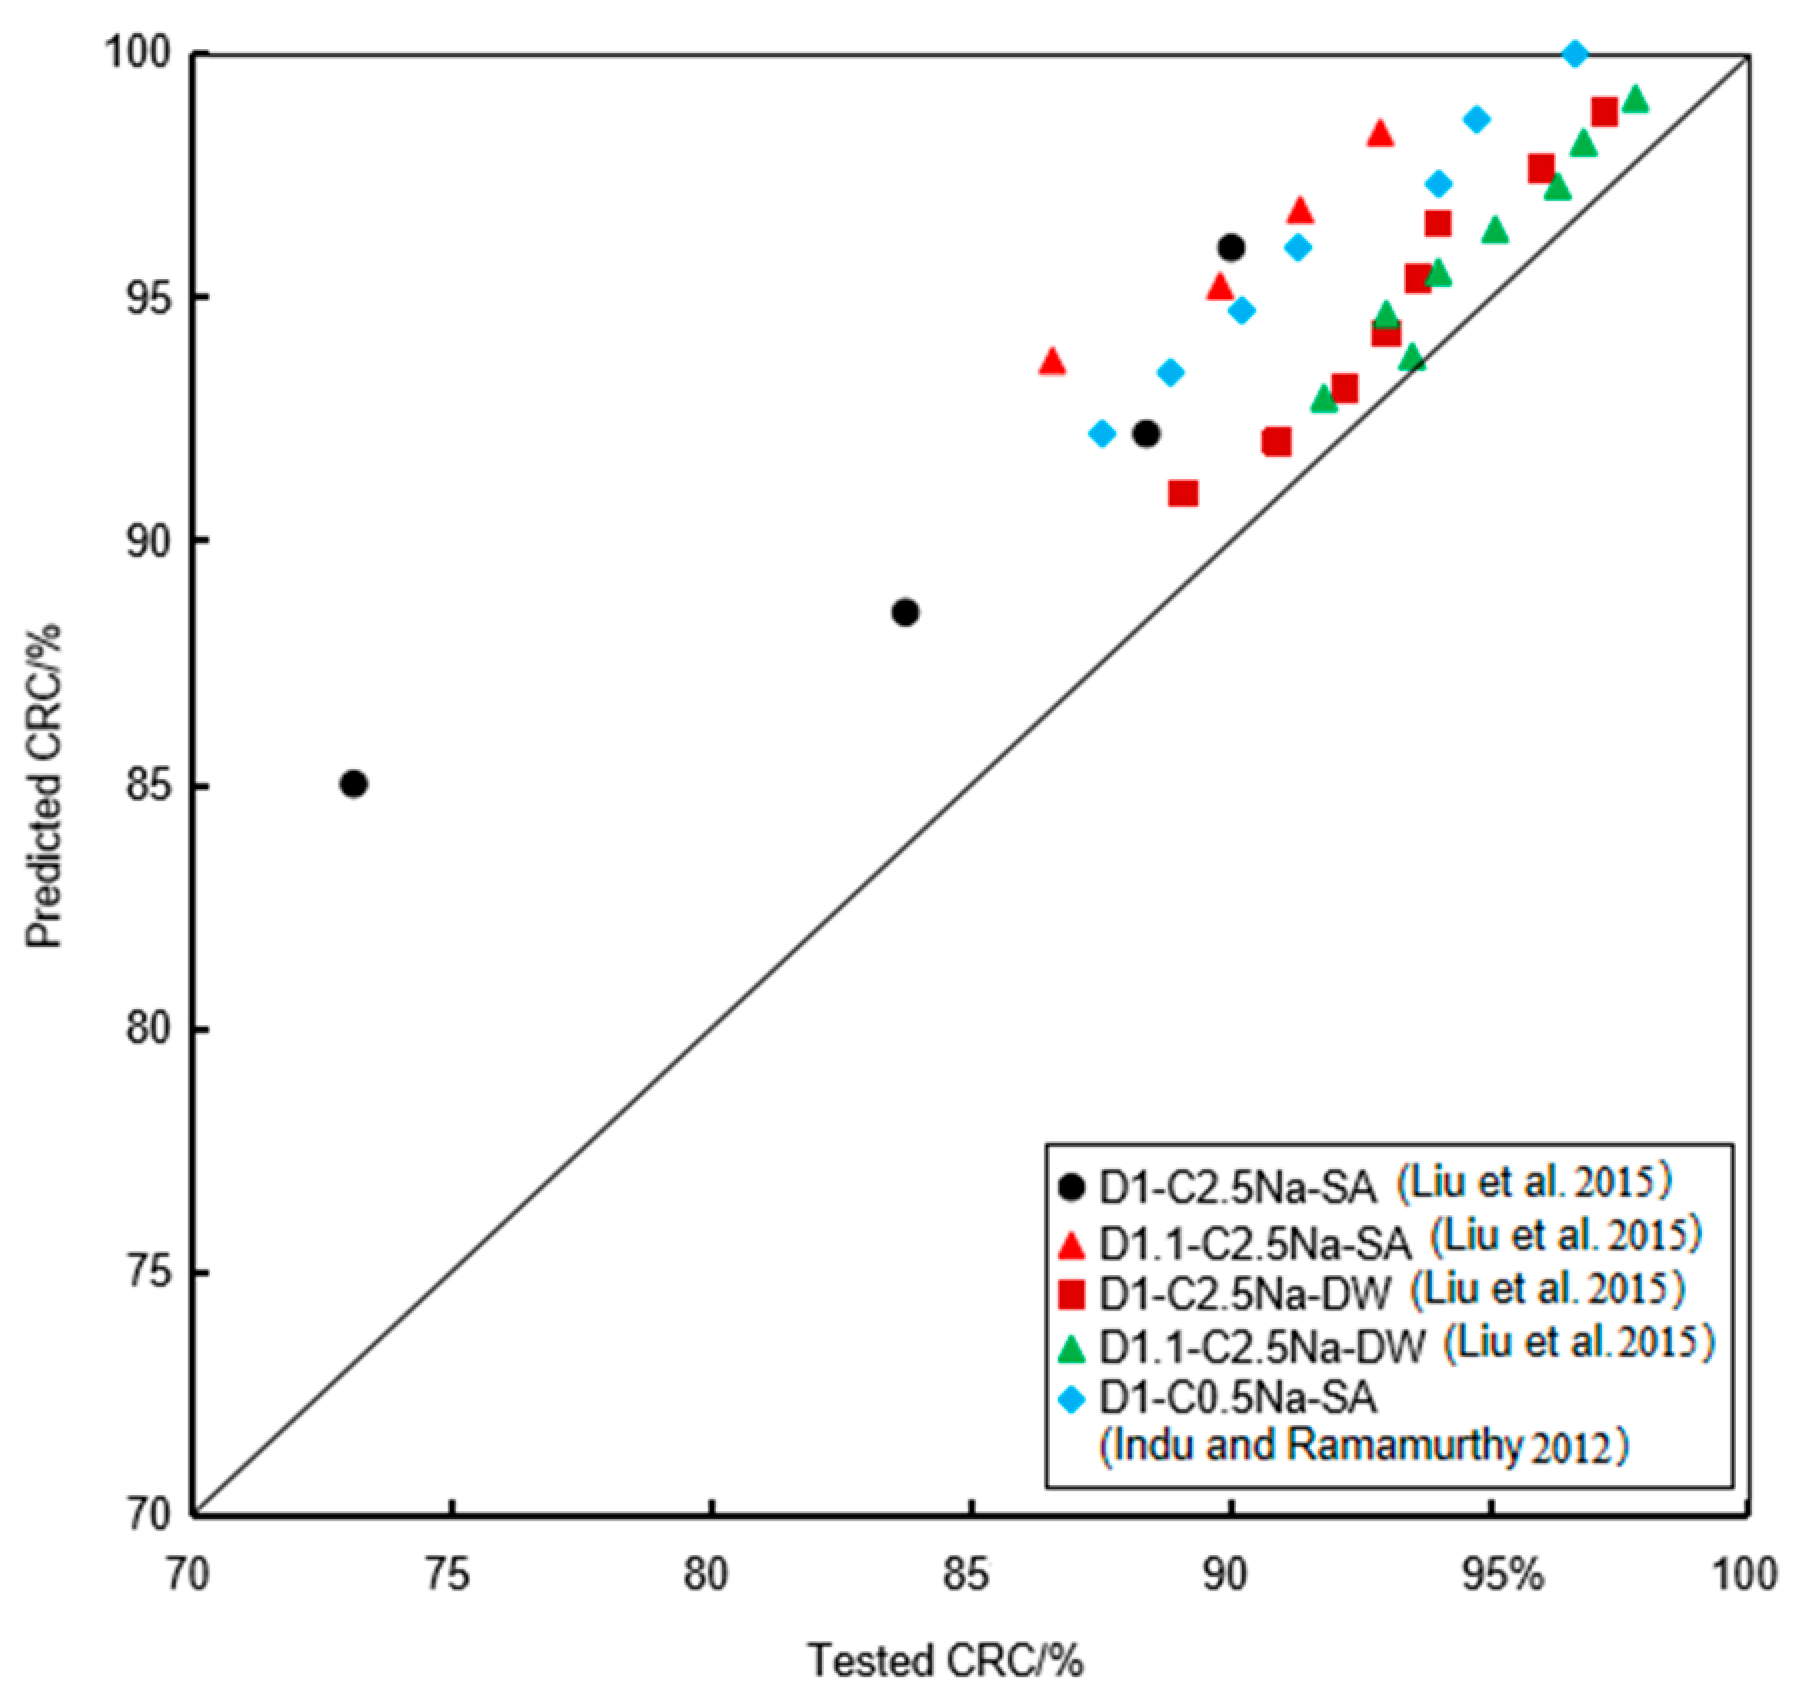
4.2. Determination and Verification of the Proposed Model

The multivariable modeling was adopted to determine the proposed model based on the test results. The average fitting results of Equations (5) and (6) were 4% and 2% higher than the test values (Figure 14), respectively, further demonstrating the high confidence of the proposed prediction model for strength prediction of the FLS. The proposed model is presented as follows:
C R C = λ e 0.0008 R c R ρ 9.6 T
Under the coupling effect of sulfate attack and wet-dry cycle,
C R C = λ e 0.0011 R c R ρ 2.7 T
where Rc is the concentration ratio of SO42− solution (%); and Rρ is the relative density of FLS, which is the FLS density divided by the density of water; λ is 1.0 and 1.2 for Na2SO4 solution and MgSO4 solution, respectively. T equals the days of sulfate immersion ages when the FLS is under sulfate immersion or equals the days equivalent to the wet-dry cycles. The average fitting results of Equations (5) and (6) were 4% and 2% higher than the test values (Figure 15), respectively, demonstrating the good agreement of the proposed prediction model.
The results from the literature were selected to verify the proposed empirical model. Liu et al. [11] conducted a series of tests on the FLS specimens with the densities of 1 g/cm3 and 1.1 g/cm3 eroded by 2.5% Na2SO4 solution for 120 days, as well as a coupling erosion of chemical attack and wet-dry cycle. Indu and Ramamurthy [9] conducted a series of tests with the FLS specimens with densities of 1 g/cm3 eroded by 0.5% Na2SO4 solution for 350 days. Figure 16 shows the comparison of the tested CRC and the corresponding predicted CRC. It can be seen that the tested CRC and the predicted CRC were near a 45° straight line, showing a reasonable agreement with the test results, either by sulfate immersion or by coupling effect of chemical attack and wet-dry cycle.

4.3. Sensitivity Analysis of Influencing Factors

To quantitatively characterize the sensitivity of the influence factors (i.e., SO42− concentration and FLS density) on strength degradation of FLS, the orthogonal experiments and range analysis were conducted in this section [25]. The density of the FLS generally ranges from 0.6 to 1.6 g/cm3 in practice [4,26]. The SO42− concentration in the underground water near the coastal region is commonly within the range of 0.338% to 3.38% [27]. Table 3 shows the orthogonal experimental tables for the influencing factors of SO42− concentration and FLS density. Each influencing factor was divided into three levels, labeled A, B, and C. The SO42− concentration was set at three concentrations, namely, A = 0.338%, B = 1.69%, and C = 3.38%, respectively. Similarly, the densities were set at levels of A = 0.6 g/cm3, B = 1.1 g/cm3, and C = 1.6 g/cm3, respectively. The proposed empirical model was adopted to predict the CRC of FLS after one year.
Under sulfate immersion, the range values of SO42− concentration and FLS density were 0.096 and 0.995, respectively. This indicated that the FLS density had a more significant influence than the CRC of FLS as compared with SO42− concentration under sulfate immersion. The range values of SO42− concentration and FLS density were 0.429 and 0.430, respectively, under the coupling effect of chemical attack and wet-dry cycle. The impact of concentration and density on CRC became similar under the coupling effect of chemical attack and wet-dry cycle. The strength degradation was sensitive to the FLS density. The FLS density needs to be carefully selected when the FLS would suffer a sulfate attack from a practical point of view.

4.4. Discussion and Limitation

Based on the test results, under sulfate immersion, the sulfate attack had a greater impact on the reduction in the specimen strength; under coupling effect of chemical attack and wet-dry cycle, the erosion of the FLS specimen is more seriously in the sulfate solution with high concentration, the FLS specimen with high density has strong erosion resistance. Other research results [9,11,24] have also shown that high concentrations of sodium sulfate have a stronger corrosiveness to the FLS than low concentrations of sodium sulfate. The Na2SO4 solution had a serious erosion effect as compared with the MgSO4 solution when other conditions were kept constant, indicating that sodium sulfate has stronger corrosiveness. Moreover, the erosion of the FLS specimen under the coupling effect is more significant than that only under chemical soaking.
Taking into account factors of FLS density, sulfate solution concentration, and sulfate solution type, an empirical method was proposed to predict the strength degradation of FLS under sulfate immersion or under the coupling effect of sulfate attack and wet-dry cycle. Although the comparison with the results from Indu and Ramamurthy [9] and Liu et al. [11] shows good agreement, due to the size effect of the specimen in this study, further verification is necessary to see whether the test results can be extrapolated for practical use on real structures.
In addition, the FLS in the actual application could differ from the FLS in this experiment. The FLS sometimes adds some additives, such as fly ash, dredging soil, olive oil industrial waste, soft clay, etc. [28,29,30,31,32,33,34], to improve its various properties. Thus, there may be deviations in the predictions when using this empirical method in practice. It is noted that chemical erosion and wet-dry cycle tests on real structures are always time-consuming and costly. The proposed model provides an alternative for engineers to roughly estimate the strength deterioration of FLS on real structures in a preliminary design.

5. Conclusions

This study conducted a series of tests to investigate the strength deterioration of FLS specimens eroded by sulfate attack and wet-dry cycling. Based on the test results and analyses, the following conclusions can be drawn:
(1)
The mass of the FLS increased with the sulfate attack time caused by the reaction of sulfate with Calcium aluminates and Calcium hydroxide to generate ettringite and gypsum. Under the erosion of the same sulfate concentration, the increase in mass caused by the MgSO4 solution was less than that by the Na2SO4 solution with the same SO42− concentration. The specimen with 0.9 g/cm3 had relatively smaller mass growth than the specimen with 0.8 g/cm3 under the same condition.
(2)
Using the UCT, it can be found that the sulfate attack had a greater impact on the reduction in the specimen strength. For chemical attack, the FLS specimen underwent more serious erosion in the high-concentration sulfate solution, and the high-density FLS specimen had strong erosion resistance. The Na2SO4 solution provided a more severe erosion effect compared to the MgSO4 solution when other conditions were kept constant. However, the erosion of the FLS specimen under the coupling effect of sulfate attack and dry-wet cycling was more significant than that only under chemical soaking.
(3)
An empirical model was developed based on the test results to predict the strength degradation of FLS under sulfate immersion and under the coupling effect of chemical attack and wet-dry cycle, and it was further verified using a comparison with the reported studies. The sensitivity analysis indicated that the strength degradation was sensitive to the FLS density.

Author Contributions

Conceptualization, Z.Z.; Data curation, G.Y. and H.S.; Funding acquisition, G.Y.; Methodology, Y.Z.; Resources, G.Y.; Validation, Z.Z., S.Z. and Y.C.; Writing—original draft, Z.Z.; Writing—review and editing, Y.Z. and G.Y. All authors have read and agreed to the published version of the manuscript.

Funding

The authors appreciate the financial support provided by the National Natural Science Foundation of China (NSFC) (Grant Nos. 42377165) and the Shanghai Science and Technology Development Funds (Grant Nos. 22ZR1466600 and 22DZ2201200).

Institutional Review Board Statement

Not applicable.

Informed Consent Statement

Not applicable.

Data Availability Statement

The data that support the findings of this study are available from the corresponding author, Guanbao Ye, upon reasonable request.

Conflicts of Interest

No potential conflict of interest was reported by the authors.

References

  1. Zhou, G.Z.; Su, R.K.L. A review on durability of foam concrete. Buildings 2023, 13, 1880. [Google Scholar] [CrossRef]
  2. Raj, A.; Sathyan, D.; Mini, K.M. Physical and functional characteristics of foam concrete: A review. Constr. Build. Mater. 2019, 221, 787–799. [Google Scholar] [CrossRef]
  3. Shi, X.; Huang, J.; Su, Q. Experimental and numerical analyses of lightweight foamed concrete as filler for widening embankment. Constr. Build. Mater. 2020, 250, 118897. [Google Scholar] [CrossRef]
  4. Zhang, Z.; Rao, F.; Ye, G.; Liu, J. Mechanical performance and void structure change of foamed cement paste subjected to static and cyclic loading under plane strain conditions. Materials 2022, 15, 1711. [Google Scholar] [CrossRef] [PubMed]
  5. Xu, J.; Luo, Y.; Wang, Y.; Yan, C.; Zhang, L.; Yin, L.; Yang, X.; Qiu, Y.; Lan, H. Triaxial axis shear mechanical properties of fiber-reinforced foamed lightweight soil. J. Mater. Civ. Eng. 2021, 33. [Google Scholar] [CrossRef]
  6. Do, J. Optimization and design guideline of lightweight foamed soil reinforced with waste fishing net. Geomech. Eng. 2022, 29, 657–666. [Google Scholar]
  7. Yu, X.G.; Huang, H.K.; Lin, L.; Xu, H.C. Study of the density control of the low density sulphate aluminium cement (SAC) foam concrete. Adv. Mater. Res. 2013, 608–609, 1786–1789. [Google Scholar]
  8. Tian, W.; Han, N. Experiment analysis of concrete’s mechanical property deterioration suffered sulphate attack and drying-wetting cycles. Adv. Mater. Sci. Eng. 2017, 2017, 5673985. [Google Scholar] [CrossRef]
  9. Indu Siva Ranjani, G.; Ramamurthy, K. Behaviour of foam concrete under sulphate environments. Cem. Concr. Compos. 2012, 34, 825–834. [Google Scholar] [CrossRef]
  10. Neramitkornburi, A.; Horpibulsuk, S.; Shen, S.L.; Chinkulkijniwat, A.; Arulrajah, A.; Disfani, M.M. Durability against wetting-drying cycles of sustainable lightweight cellular cemented construction material comprising clay and fly ash wastes. Constr. Build. Mater. 2015, 77, 41–49. [Google Scholar] [CrossRef]
  11. Liu, K.; Li, R.M.; Du, Y.; Wei, M. Durability experimental study of lightweight soil subjected to wetting-drying cycles and sodium sulfate soaking. Rock Soil Mech. 2015, 36, 362–366. [Google Scholar]
  12. Mamun, M.; Bindiganavile, V. Sulphate resistance of fibre reinforced cement-based foams. Constr. Build. Mater. 2011, 25, 3427–3442. [Google Scholar] [CrossRef]
  13. Wang, X.Y.; Han, P.J.; Bai, X.H.; Li, X. Influences of slag on properties of lightweight cement-treated soils subjected to sulfate corrosion. Constr. Build. Mater. 2019, 205, 511–518. [Google Scholar]
  14. Raj, B.; Sathyan, D.; Madhavan, M.K.; Raj, A. Mechanical and durability properties of hybrid fiber reinforced foam concrete. Constr. Build. Mater. 2020, 245, 118373. [Google Scholar] [CrossRef]
  15. Othman, R.; Muthusamy, K.; Duraisamy, Y.; Sulaiman, M.A.; Jaya, R.P.; Ghani, N.A.A.A.; Mangi, S.A. Evaluation of the sulphate resistance of foamed concrete containing processed spent bleaching earth. Eur. J. Environ. Civ. Eng. 2022, 26, 3632–3647. [Google Scholar] [CrossRef]
  16. Al-Shwaiter, A.; Awang, H.; Khalaf, M.A. Performance of sustainable lightweight foam concrete prepared using palm oil ash as a sand replacement. Constr. Build. Mater. 2022, 322, 126482. [Google Scholar] [CrossRef]
  17. Liu, X.; Ni, C.; Zhang, L.; Sheng, K.; Hong, B. Durability assessment of lightweight cellular concrete in subgrade by the method of analytic hierarchy process combined with fuzzy comprehensive evaluation. Math. Probl. Eng. 2019, 2019, 4915870. [Google Scholar] [CrossRef]
  18. Rao, F.; Zhang, Z.; Ye, G.; Liu, J. Mechanical behavior and assessment of foamed cement paste under staged cyclic loading. Mater. Struct. 2021, 54, 182–193. [Google Scholar] [CrossRef]
  19. Nguyen, T.; Kashani, A.; Ngo, T.; Bordas, S. Deep neural network with high-order neuron for the prediction of foamed concrete strength. Comput. Aided Civ. Infrastruct. Eng. 2019, 34, 316–332. [Google Scholar] [CrossRef]
  20. Zhang, J.; Huang, Y.; Ma, G.; Yuan, Y.; Nener, B. Automating the mixture design of lightweight foamed concrete using multi-objective firefly algorithm and support vector regression. Cem. Concr. Compos. 2021, 121, 104103. [Google Scholar] [CrossRef]
  21. Pan, P.; Yang, W.; Zhang, Y.; Li, P.-P. Optimized strength modelling of foamed concrete using principal component analysis featurized regressors. Structures 2023, 48, 1730–1745. [Google Scholar] [CrossRef]
  22. CJJ/T177(2012); Technical Specification for Filling Engineering of Bubble Mixed Lightweight Soil. Industry Standards of the People’s Republic of China: Beijing, China, 2012.
  23. GB/T50081(2022); The Standard for Test Methods of Mechanical Properties of Ordinary Concrete. Industry standards of the People’s Republic of China: Beijing, China, 2002.
  24. Tian, X.; Zhu, N. Durability prediction method of concrete soil based on deep belief network. Adv. Civ. Eng. 2022, 2022, 38306. [Google Scholar] [CrossRef]
  25. Liu, X.F.; Mei, G.D.; Li, J.X.; Lun, Y.X. Orthogonal test of flexural toughness for hybrid fiber reinforced concretes. Adv. Mater. Res. 2011, 239–242, 2006–2010. [Google Scholar]
  26. Liu, H.L.; Deng, A.; Chu, J. Effect of different mixing ratios of polystyrene pre-puff beads and cement on the mechanical behaviour of lightweight fill. Geotext. Geomembr. 2006, 24, 331–338. [Google Scholar] [CrossRef]
  27. Gomis-Yagues, V.; Boluda-Botella, N.; Ruiz-Bevia, F. Gypsum precipitation/ dissolution as an explanation of the decrease of sulphate concentration during seawater intrusion. J. Hydrol. 2000, 28, 48–55. [Google Scholar] [CrossRef]
  28. Kearsley, E.P.; Wainwright, P.J. The effect of high fly ash content on the compressive strength of foamed concrete. Cem. Concr. Res. 2001, 31, 105–112. [Google Scholar] [CrossRef]
  29. Park, H.I.; Kim, Y.T. Prediction of strength of reinforced lightweight soil using an artificial neural network. Eng. Comput. 2011, 28, 600–615. [Google Scholar] [CrossRef]
  30. Neramitkornburi, A.; Horpibulsuk, S.; Shen, S.; Arulrajah, A.; Disfani, M.M. Engineering properties of lightweight cellular cemented clay-fly ash material. Soils Found. 2015, 55, 471–483. [Google Scholar] [CrossRef]
  31. La Rubia-García, M.D.; Yebra-Rodríguez, Á.; Eliche-Quesada, D.; Corpas-Iglesias, F.A.; López-Galindo, A. Assessment of olive mill solid residue (pomace) as an additive in lightweight brick production. Constr. Build. Mater. 2012, 36, 495–500. [Google Scholar] [CrossRef]
  32. Teerawattanasuk, C.; Voottipruex, P.; Horpibulsuk, S. Mix design charts for lightweight cellular cemented bangkok clay. Appl. Clay Sci. 2015, 104, 318–323. [Google Scholar] [CrossRef]
  33. Mydin, M.A.O. Investigating the effect of sisal fibre content on durability properties of lightweight foamed concrete. Adv. Sci. Technol. Res. J. 2022, 16, 141–149. [Google Scholar] [CrossRef] [PubMed]
  34. Gencel, O.; Bayraktar, O.Y.; Kaplan, G. Lightweight foam concrete containing expanded perlite and glass sand: Physico-mechanical, durability, and insulation properties. Constr. Build. Mater. 2022, 320, 126187. [Google Scholar] [CrossRef]
Figure 1. The variation curve of density of foamed lightweight soils with foam volume ratio.
Materials 16 06505 g001
Figure 2. Sulfate solution immersion operation of the FLS in the immersion box.
Materials 16 06505 g002
Figure 3. Photos during and after compression test. (a) Photos during compression test. (b) Photos during and after compression test.
Materials 16 06505 g003
Figure 4. Appearances of the specimens after sulfate immersion test.
Materials 16 06505 g004aMaterials 16 06505 g004b
Figure 5. Appearances of the specimens after the wet-dry cycle test combined with sulfate attack.
Materials 16 06505 g005
Figure 6. Mass change of the specimens of 0.8 and 0.9 g/cm3 after sulfate immersion test.
Materials 16 06505 g006
Figure 7. Mass change of the specimens of 0.8 and 0.9 g/cm3 after the wet-dry cycle test combined with sulfate attack.
Materials 16 06505 g007
Figure 8. Stress–strain curves of the specimens of 0.8 g/cm3 under sulfate immersion for 28 days.
Materials 16 06505 g008
Figure 9. Unconfined compressive strength of the specimens.
Materials 16 06505 g009
Figure 10. Variation of CRC of the specimen with the immersion time.
Materials 16 06505 g010
Figure 11. Variation of CRC of the specimen with the immersion time in the different sulfate solutions.
Materials 16 06505 g011
Figure 12. Variation of CRC of the specimen with the wet-dry cycles.
Materials 16 06505 g012
Figure 13. Variation of CRC of the specimen in the different sulfate solutions with the wet-dry cycles.
Materials 16 06505 g013
Figure 14. Comparison of the CRC under sulfate immersion and coupling effect.
Materials 16 06505 g014
Figure 15. Test and fitting results: (a) under sulfate immersion; (b) under coupling effect of chemical attack and wet-dry cycle.
Materials 16 06505 g015aMaterials 16 06505 g015b
Figure 16. The comparison of the test results and predicted results under sulfate immersion and coupling effect of chemical attack and wet-dry cycle.
Materials 16 06505 g016
Table 1. The mix scheme of the FLS specimen.
Density of the FLS
(g/cm3)
Water-Cement RatioCement Quality (kg)Water Quality
(kg)
Foam Volume (L)Foam Volume Ratio (Vfoam/Vwater)
8000.454.4284
9000.454.4273.5
Table 2. Test program.
Test No.ρ/g/cm3mc/%p/dN
D0.80.8N/AN/AN/AN/A
D0.90.9N/AN/AN/AN/A
D0.8-C0.5Na-SA28/560.8Na2SO40.528, 560
D0.8-C5Na-SA28/560.8Na2SO45.028, 560
D0.8-C4.24Mg-SA28/560.8MgSO44.2428, 560
D0.9-C5Na-SA28/560.9Na2SO45.028, 560
D0.9-C4.24Mg-SA28/560.9MgSO45.028, 560
D0.8-C0.5Na-DW5/100.8Na2SO40.5N/A5, 10
D0.8-C5Na-DW5/100.8Na2SO45.0N/A5, 10
D0.8-C4.24Mg-DW5/100.8MgSO44.24N/A5, 10
D0.9-C5Na-DW5/100.9Na2SO45.0N/A5, 10
D0.9-C4.24Mg-DW5/100.9MgSO44.24N/A5, 10
Note: ρ is the specimen density; m is the sulfate medium; c is the concentration of the sulfate solution; p is the soaking age; N is the number of dry-wet cycles; N/A indicates that no such operation has been performed.
Table 3. Orthogonal test and range analysis results.
Test No.c/%ρ/g/cm3CRC Prediction
Equation (5)Equation (6)
1A(0.338)A(0.6)00.068
2A(0.338)B(1.1)0.9630.592
3A(0.338)C(1.6)0.9990.826
4B(1.69)A(0.6)00
5B(1.69)B(1.1)0.8270.073
6B(1.69)C(1.6)0.9950.385
7C(3.38)A(0.6)00
8C(3.38)B(1.1)0.6850.050
9C(3.38)C(1.6)0.9900.148
Rs0.0960.995N/AN/A
Rc0.4290.430N/AN/A
Note: Rs and Rc represent the range values under sulfate immersion and under coupling effect of chemical attack and wet-dry cycle, respectively. N/A indicates no numerical value.
Disclaimer/Publisher’s Note: The statements, opinions and data contained in all publications are solely those of the individual author(s) and contributor(s) and not of MDPI and/or the editor(s). MDPI and/or the editor(s) disclaim responsibility for any injury to people or property resulting from any ideas, methods, instructions or products referred to in the content.

