
Cracking in Reinforced Concrete Cross-Sections Due to Non-Uniformly Distributed Corrosion


Abstract
:1. Introduction
2. Simulation Framework
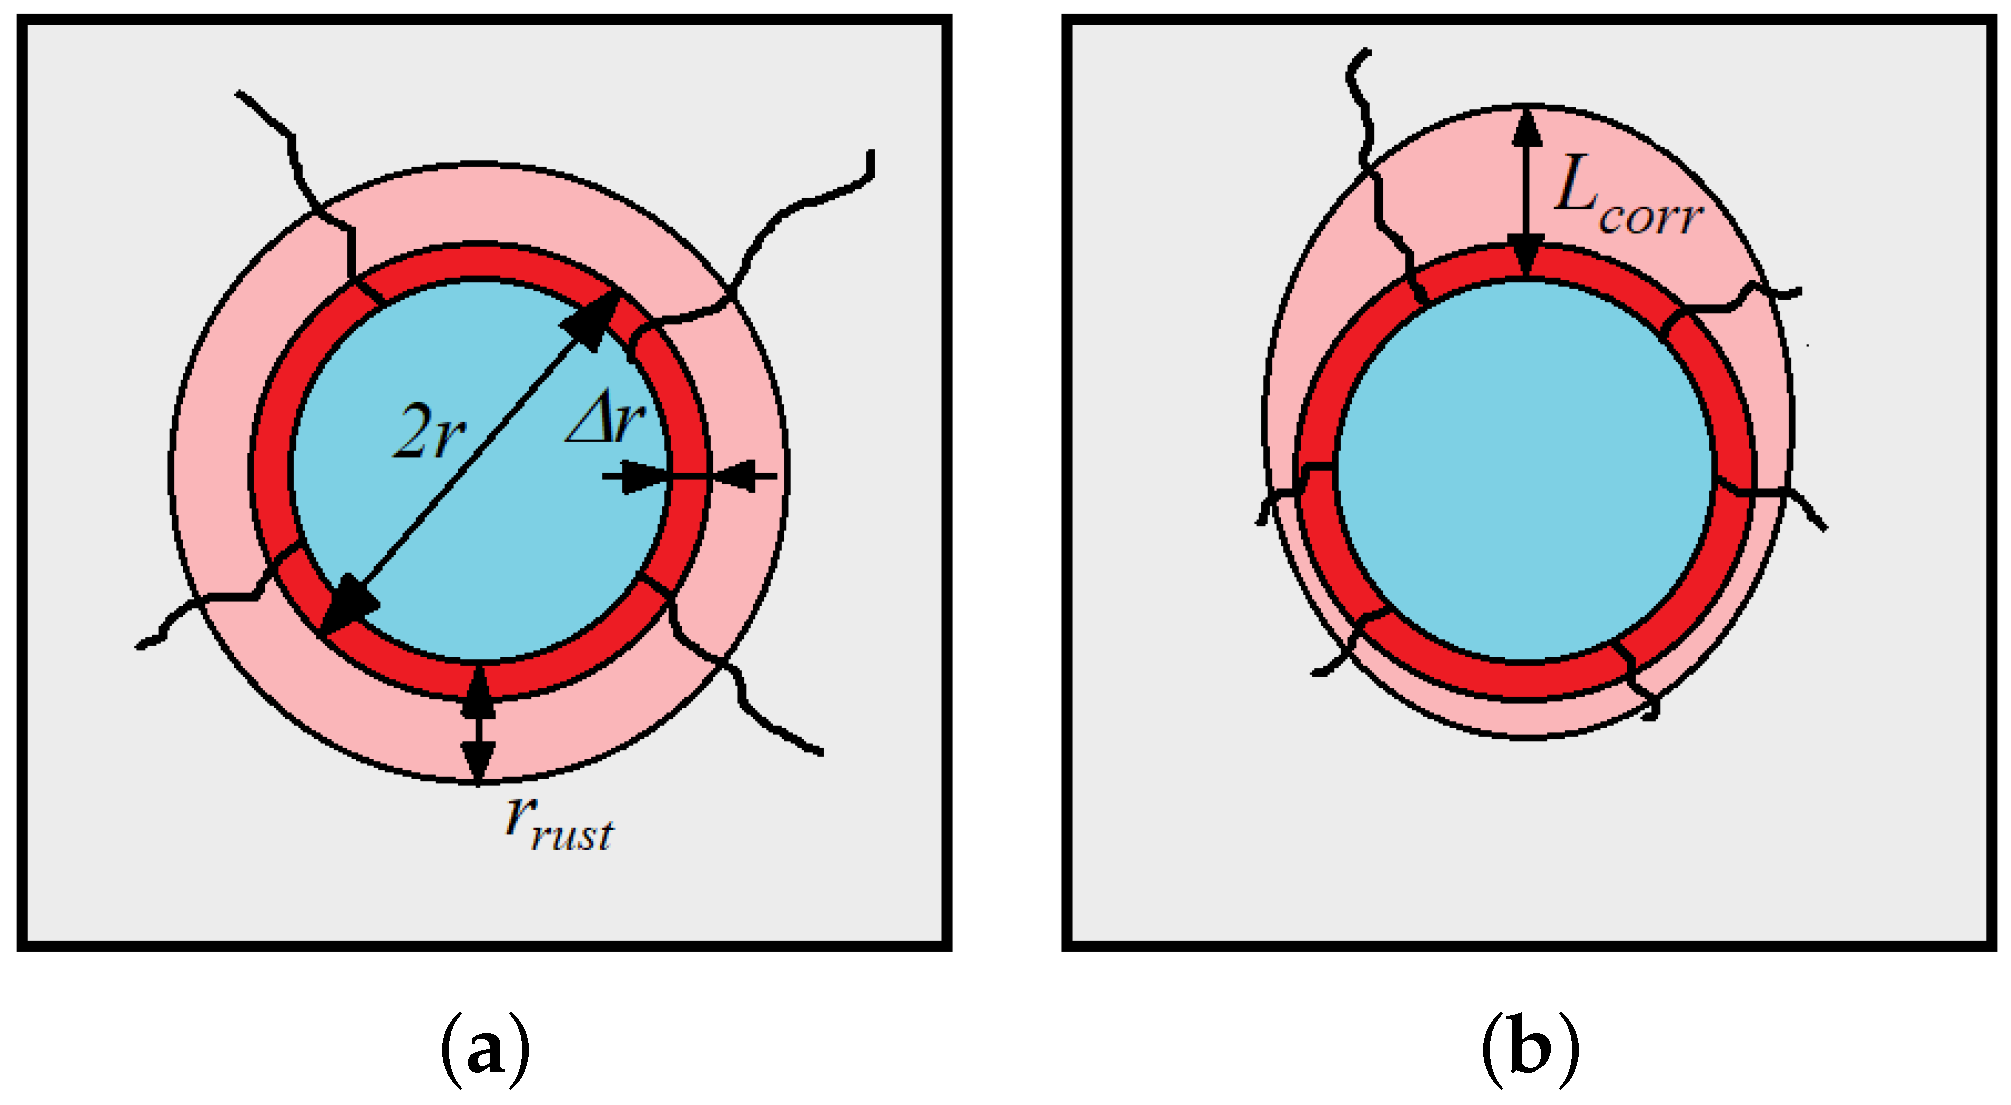
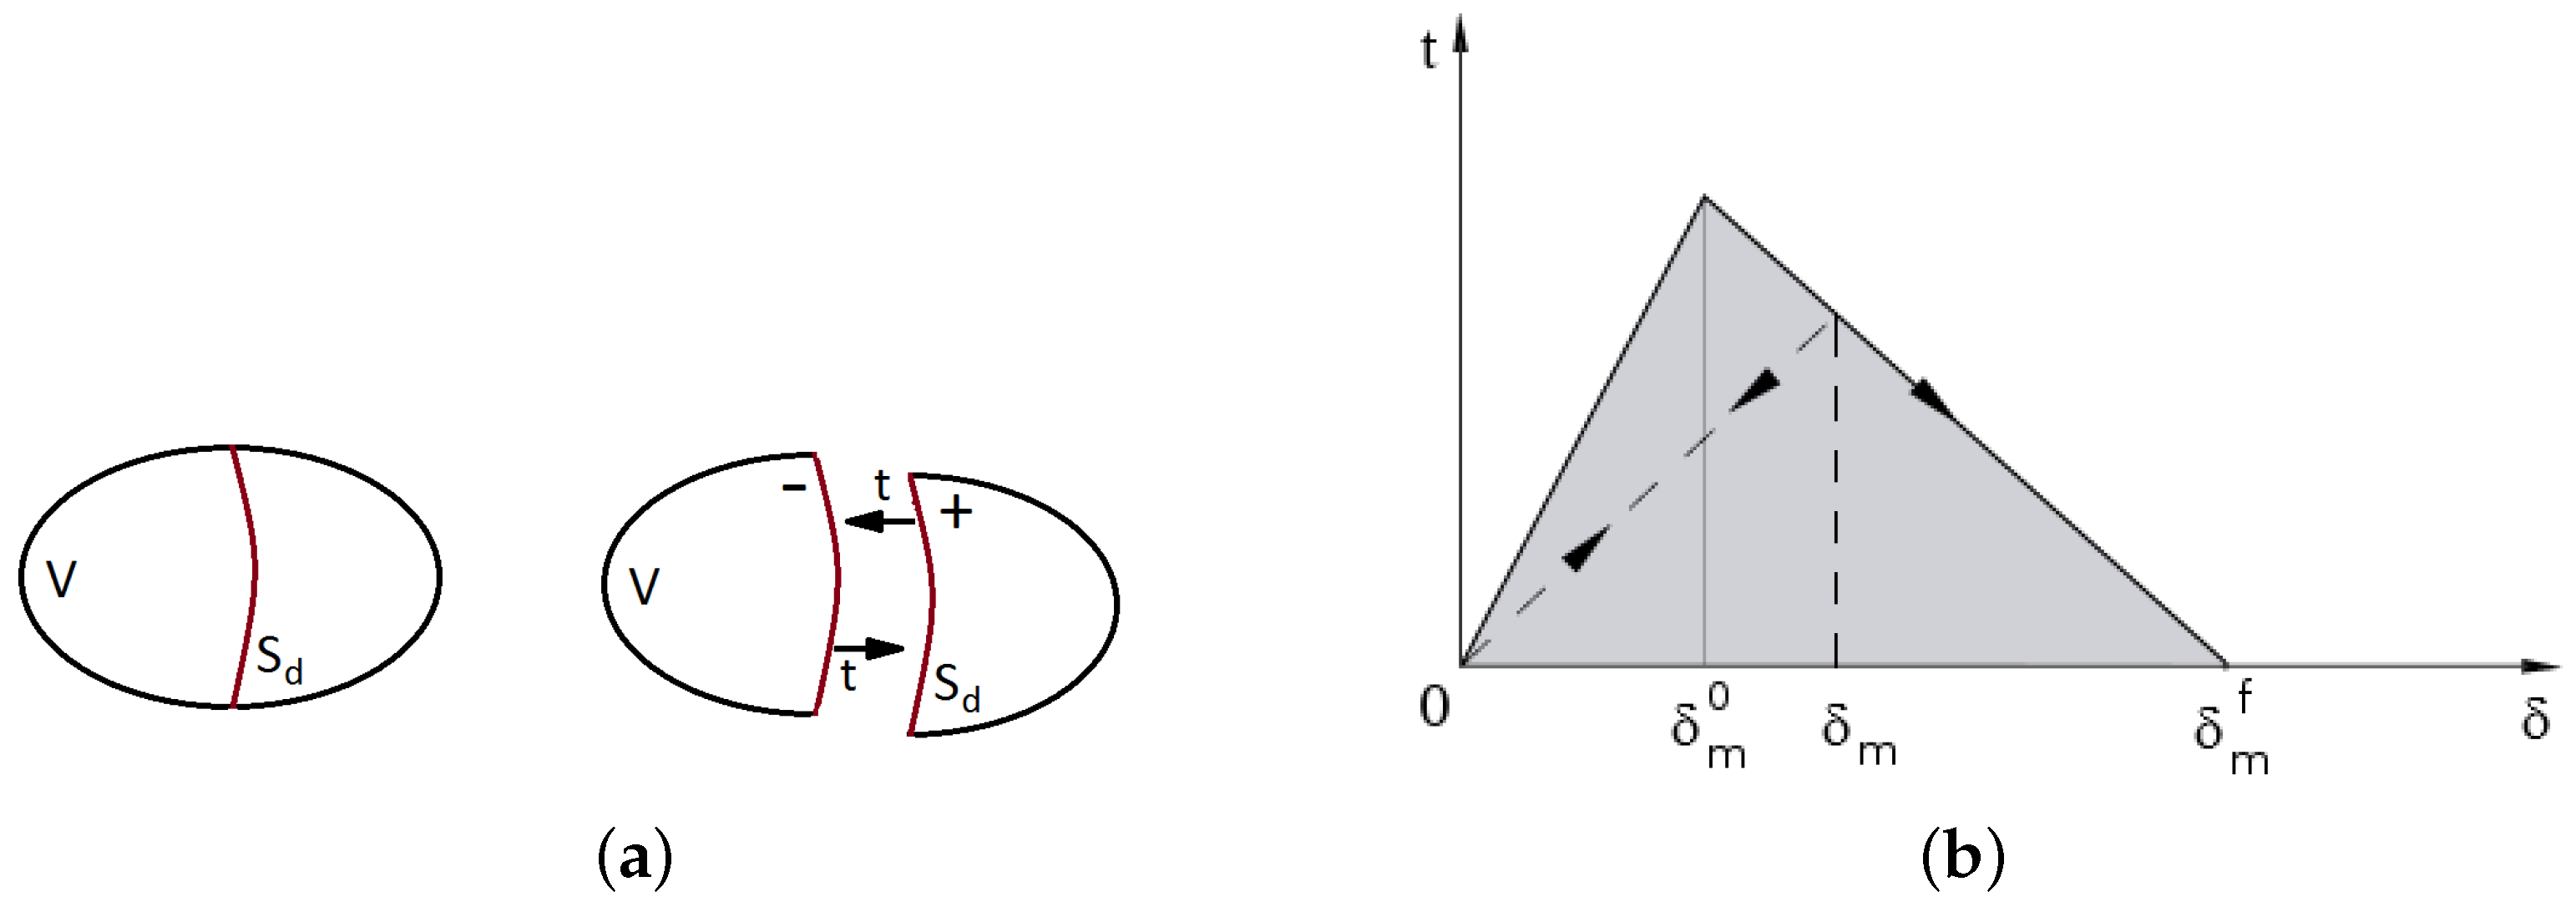
2.1. Rust Interface Model
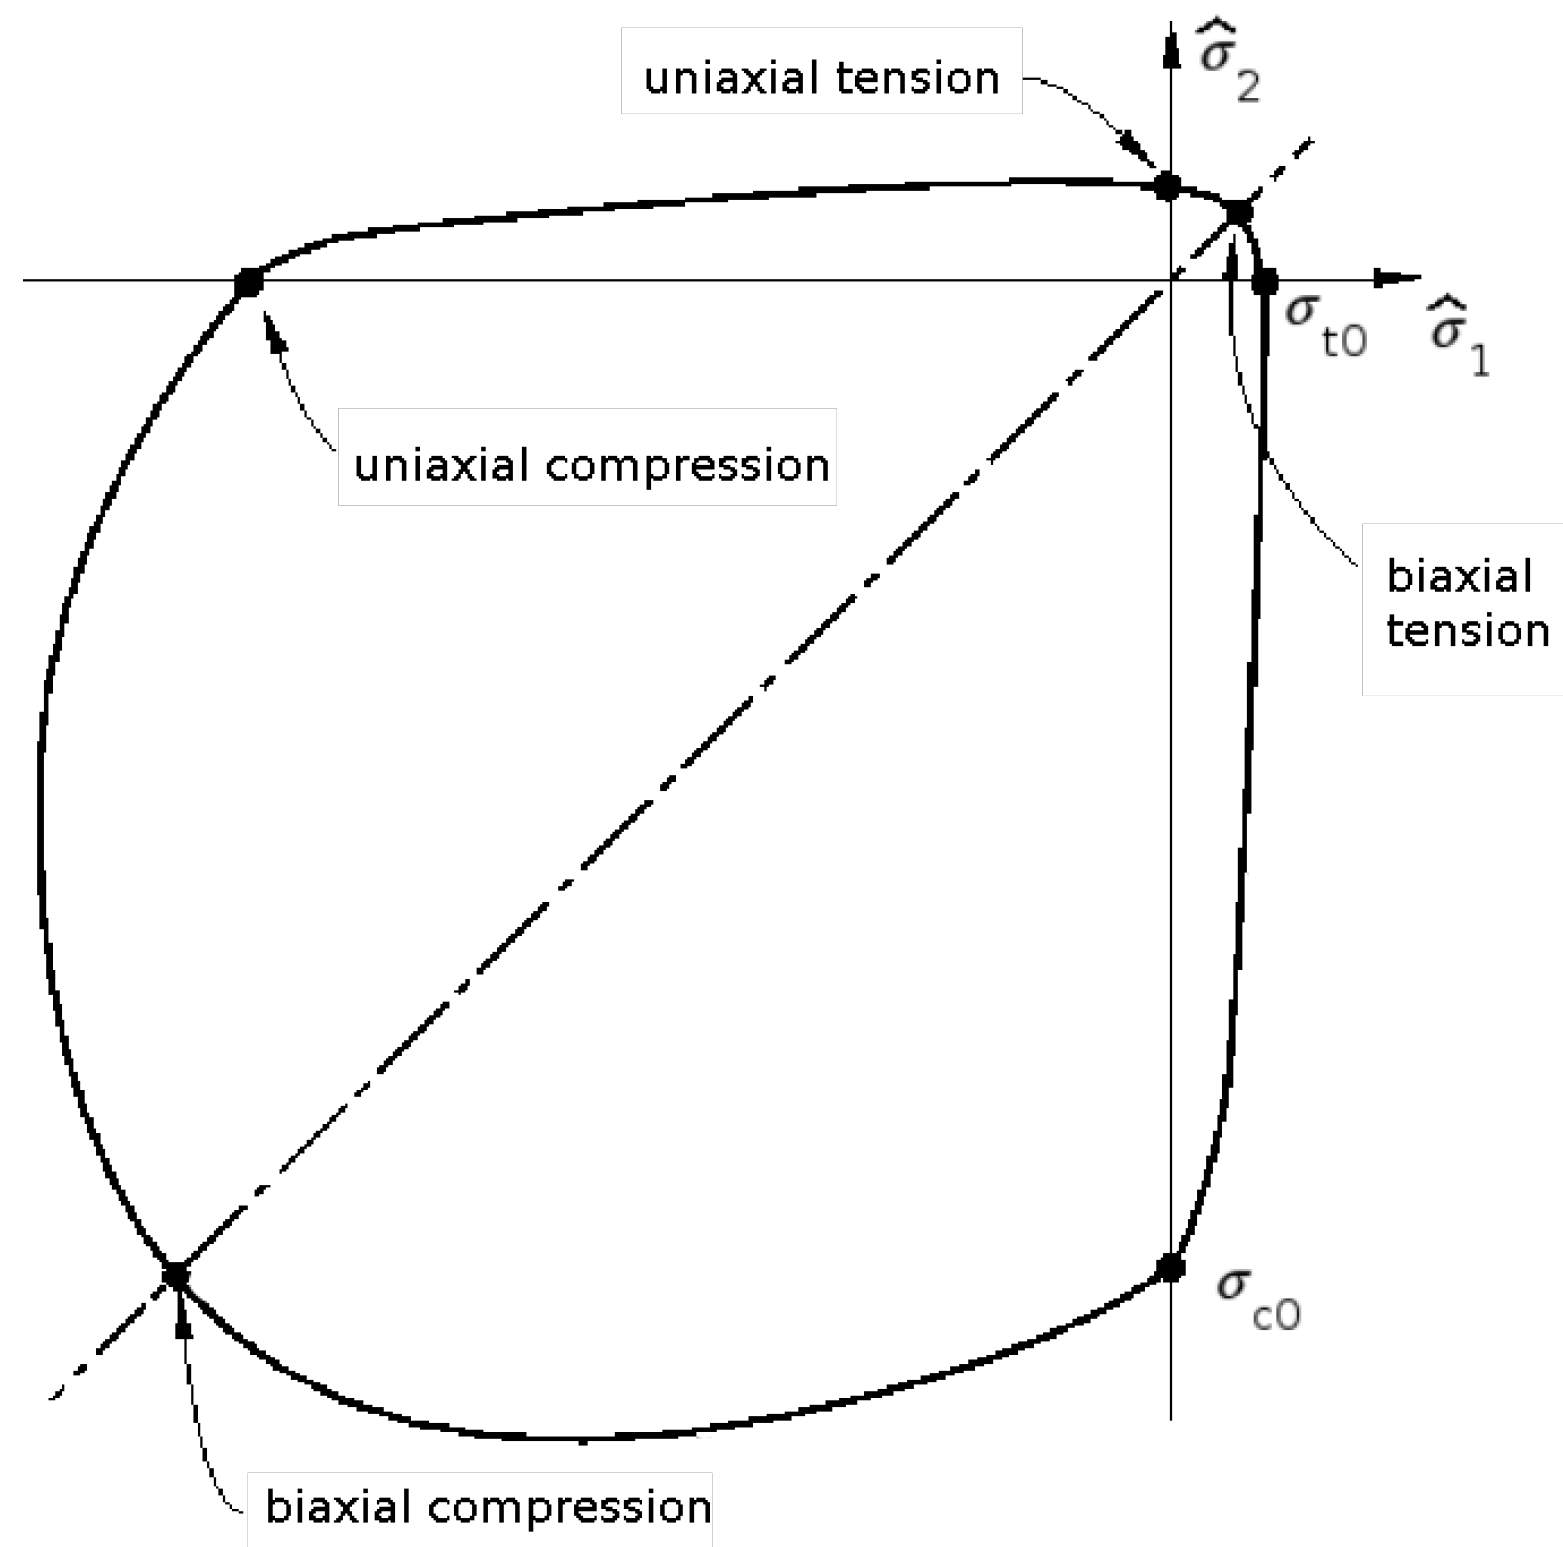
2.2. Concrete and Steel Continuum Models
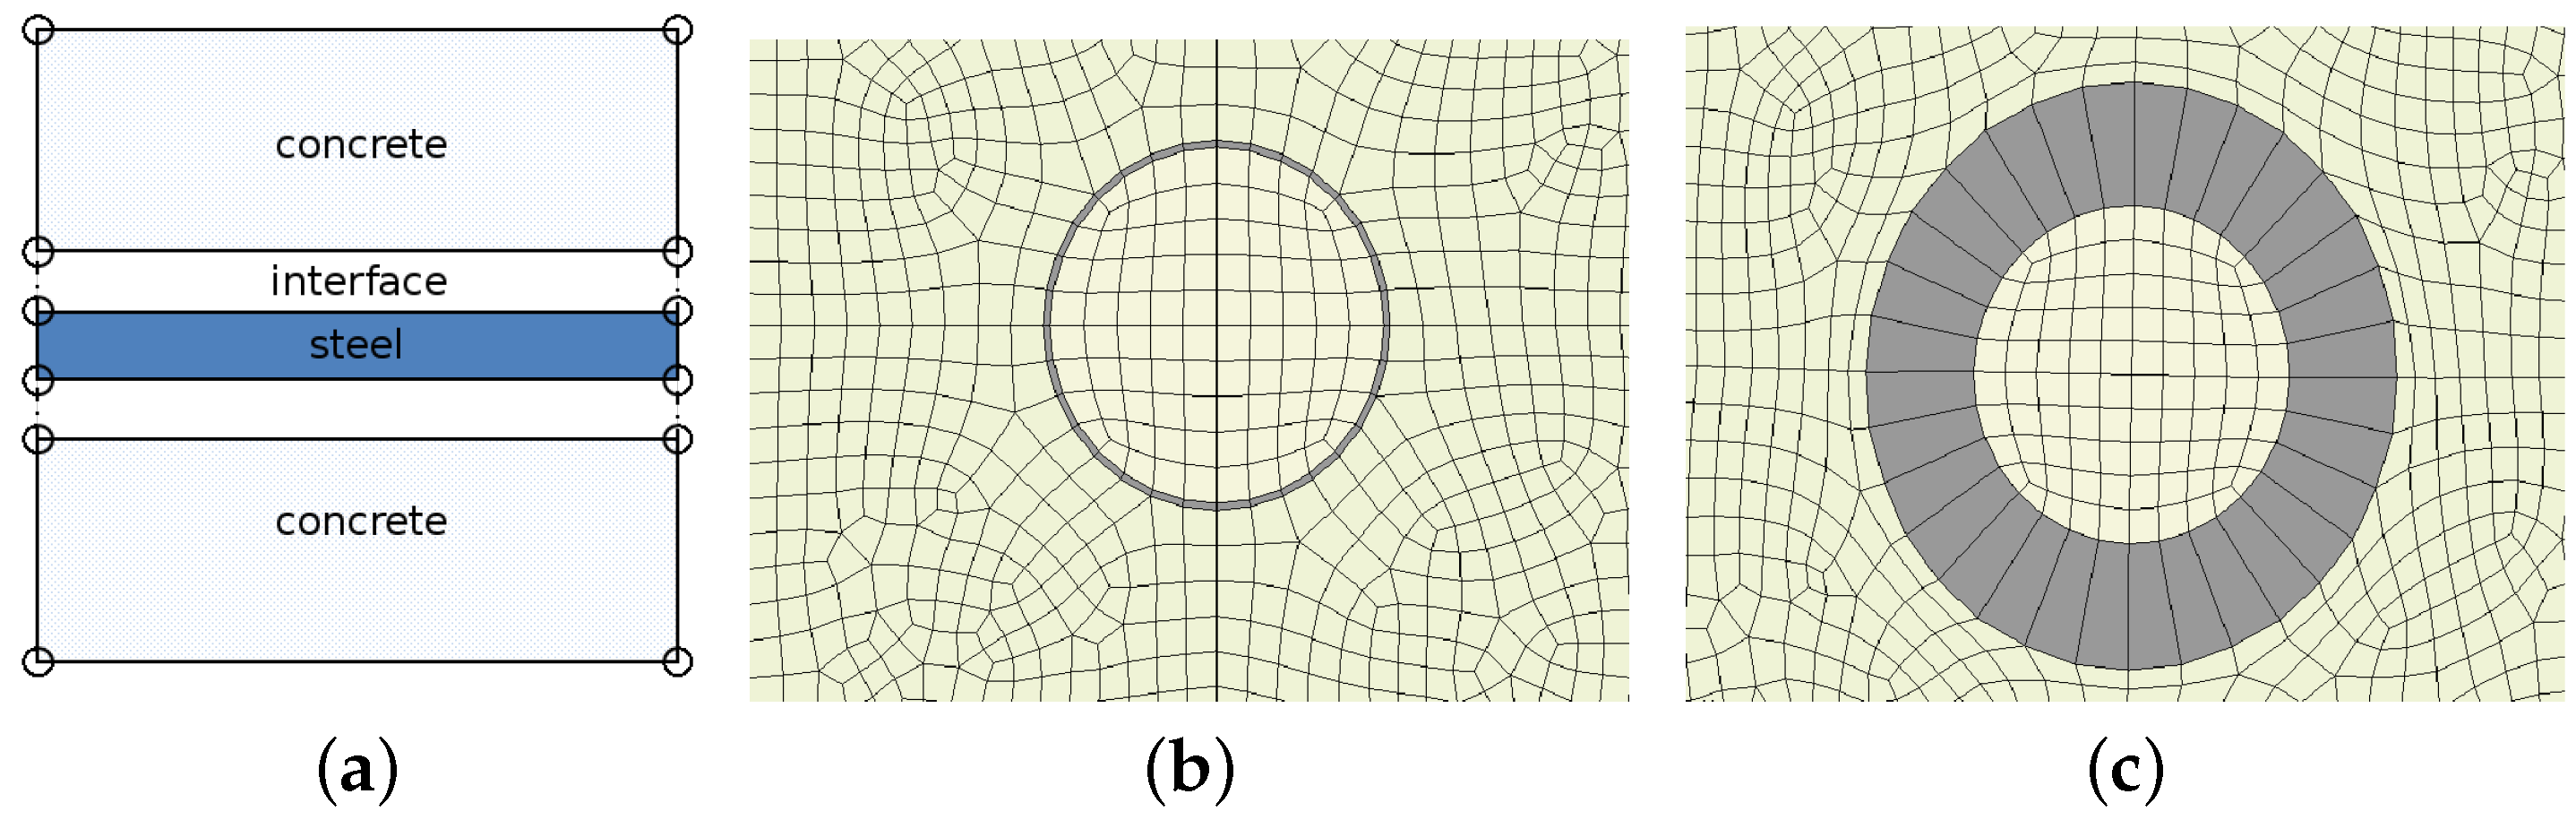
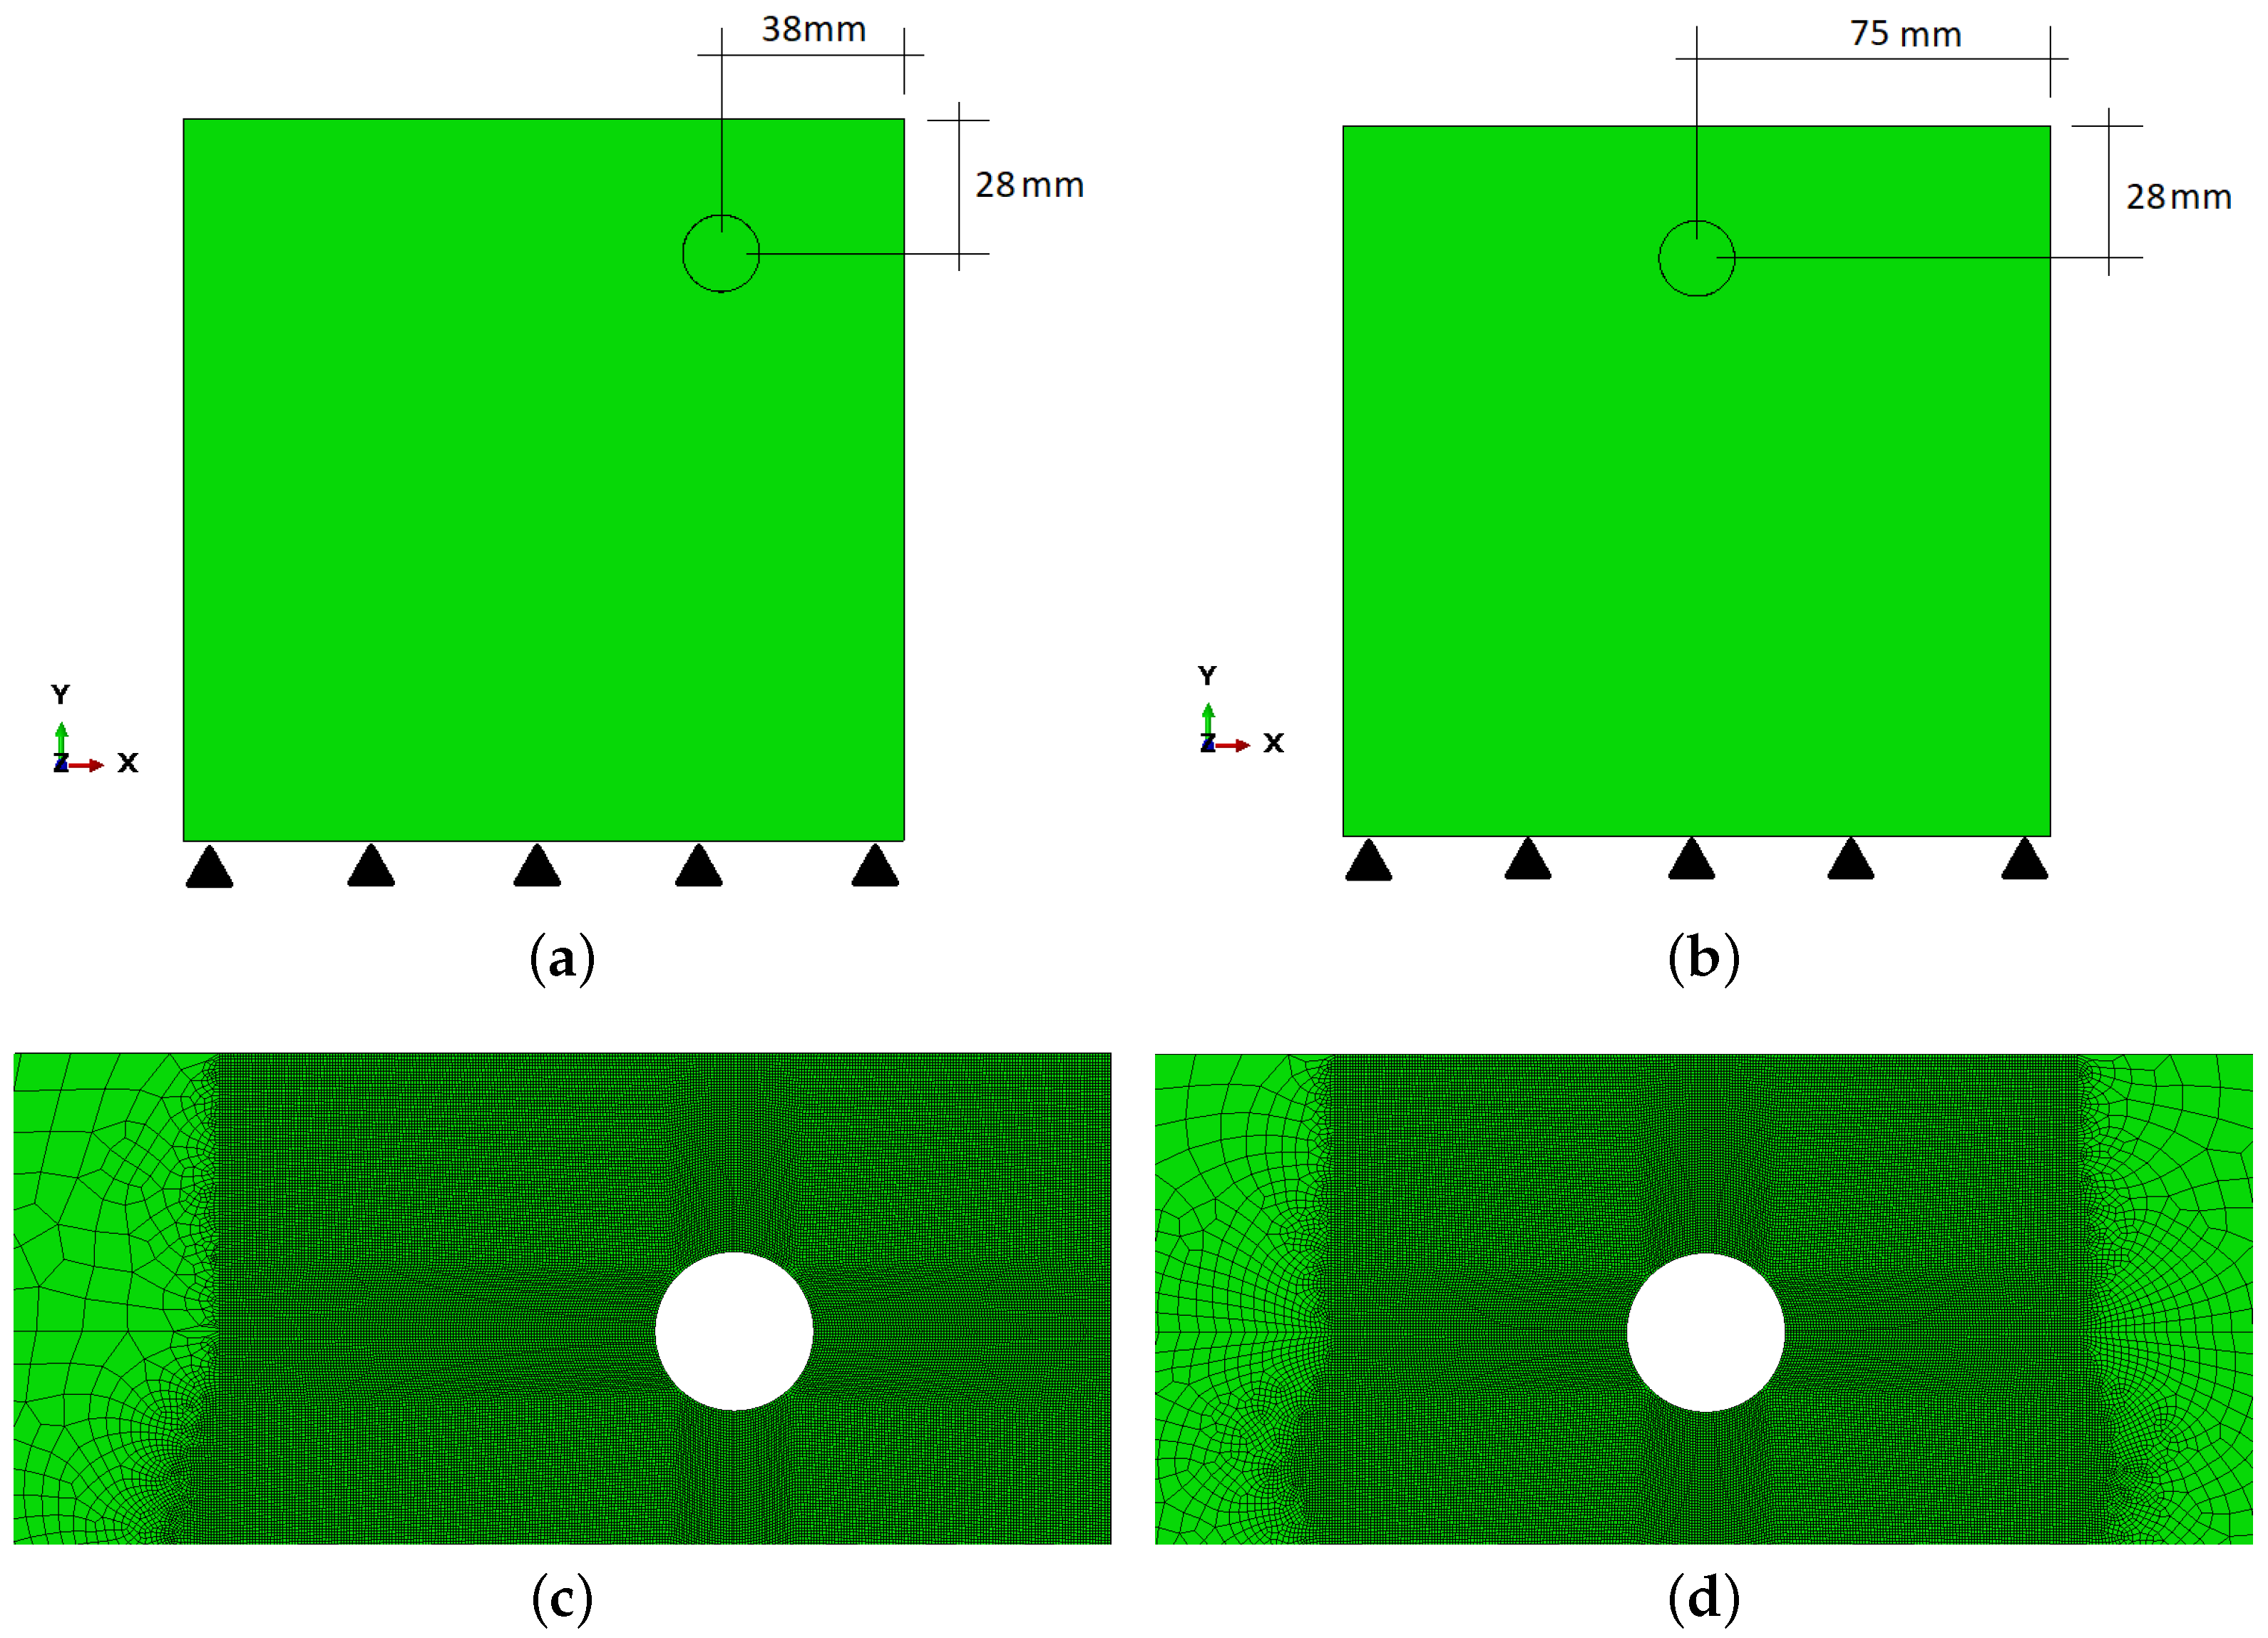
2.3. Numerical Model
3. Initial Simulations
4. Cross-Section Analysis—Multi-Rebar Simulation
5. Non-Uniform Corrosion Distribution
6. Conclusions
Author Contributions
Funding
Institutional Review Board Statement
Informed Consent Statement
Data Availability Statement
Conflicts of Interest
Abbreviations
| RC | Reinforced concrete |
| FE | Finite element |
| CDP | Concrete damage–plasticity |
| PEEQT | Tensile equivalent plastic strain |
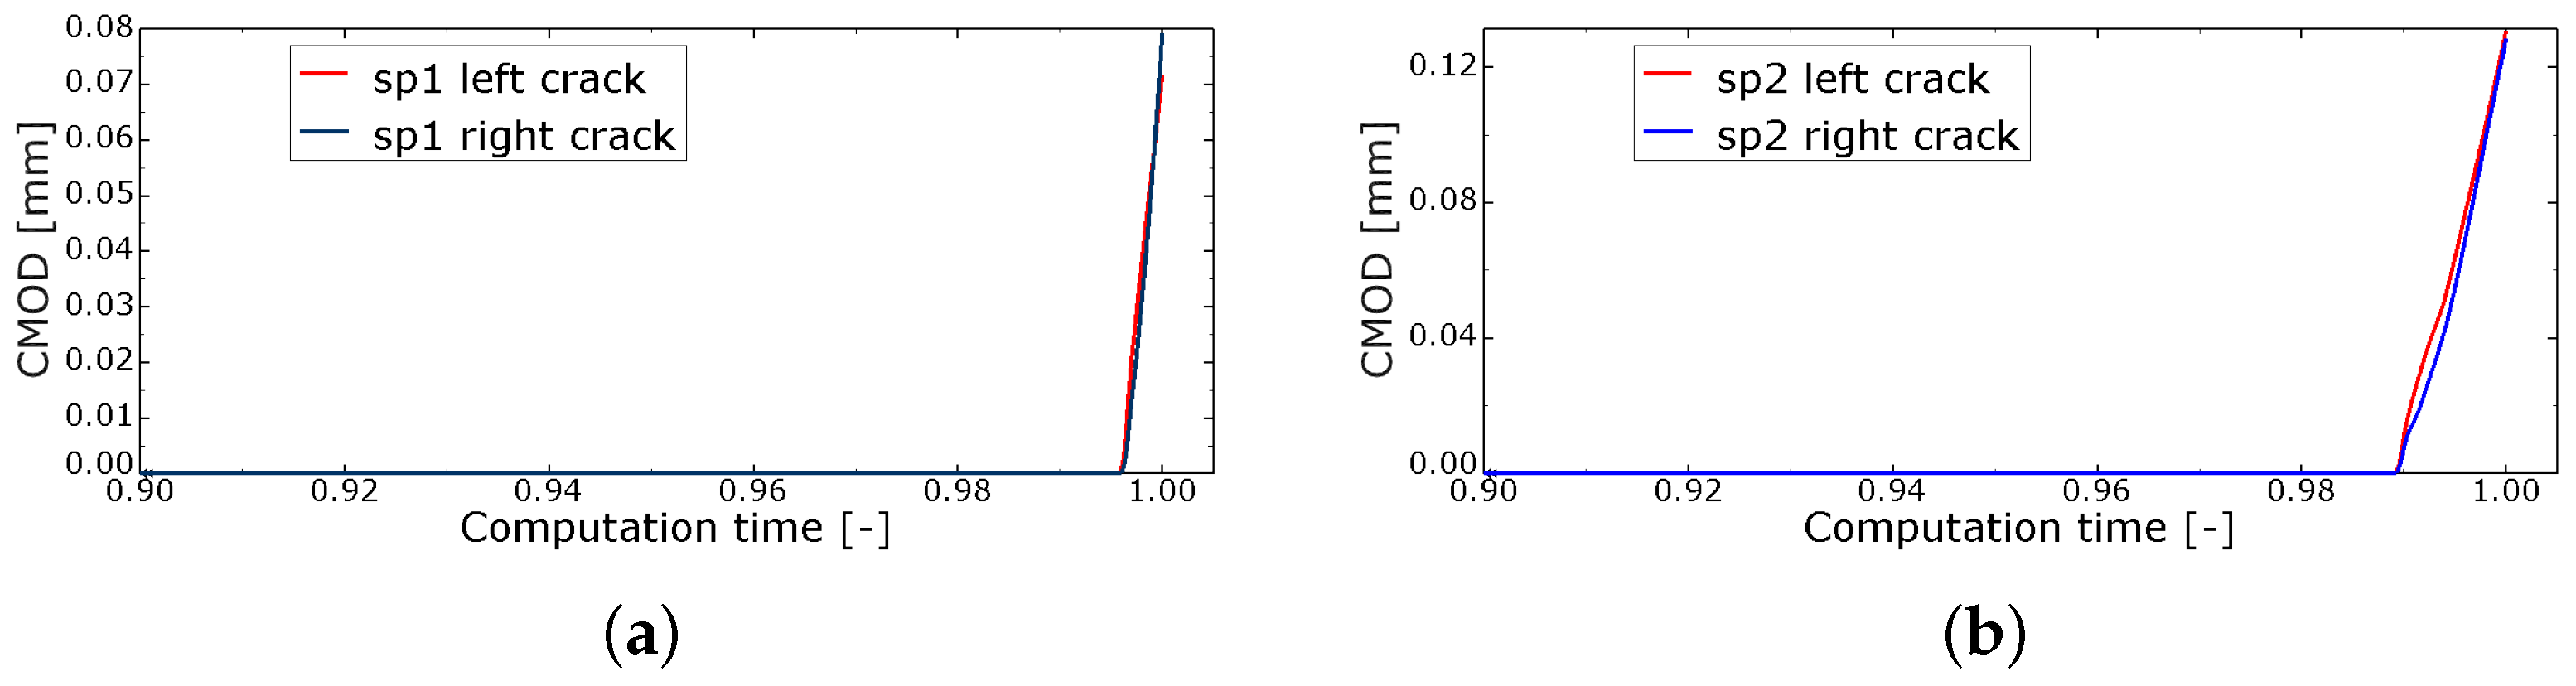
| CMOD | Crack mouth opening displacement |
References
- Andrade, C.; Alonso, C.; Molina, F. Cover cracking as a function of bar corrosion: Part I—Experimental test. Mater. Struct. 1993, 26, 453–464. [Google Scholar] [CrossRef]
- Martin-Perez, B. Service Life Modelling of RC Highway Structures Exposed to Chlorides. Ph.D. Thesis, University of Toronto, Toronto, ON, Canada, 1999. [Google Scholar]
- Ozbolt, J.; Balabanic, G.; Kuster, M. 3D Numerical modelling of steel corrosion in concrete structures. Corros. Sci. 2011, 53, 4166–4177. [Google Scholar] [CrossRef]
- Krykowski, T. Modeling of Concrete Cover Damage Caused by Rebar Corrosion in Reinforced Concrete; Polish Academy of Sciences, Committee on Civil Engineering: Warsaw, Poland, 2012. (In Polish) [Google Scholar]
- Pantazopoulou, S.; Papoulia, K. Modelling cover-cracking due to reinforced corrosion in RC structures. J. Eng. Mech. 2001, 4, 4133–4145. [Google Scholar] [CrossRef]
- Zhang, Y.; Su, R.K.L. Corner cracking model for non-uniform corrosion-caused deterioration of concrete covers. Constr. Build. Mater. 2020, 234, 117410. [Google Scholar] [CrossRef]
- Chen, J.; Zhang, W.; Gu, X. Modeling time-dependent circumferential non-uniform corrosion of steel bars in concrete considering corrosion-induced cracking effects. Eng. Struct. 2019, 201, 109766. [Google Scholar] [CrossRef]
- Zybura, A.; Jaśniok, M.; Jaśniok, T. Diagnostics of Reinforced Concrete Structures; Wydawnictwo Naukowe PWN: Warsaw, Poland, 2011. (In Polish) [Google Scholar]
- Guzman, S.; Galvez, J.; Sancho, J. Modelling of corrosion-induced cover cracking in reinforced concrete by an embedded cohesive crack finite element. Eng. Fract. Mech. 2012, 93, 92–107. [Google Scholar] [CrossRef]
- Wang, H.; Zhu, W.; Qin, S.; Tan, Y. Numerical simulation of steel corrosion in chloride environment based on random aggregate concrete microstructure model. Constr. Build. Mater. 2022, 331, 127323. [Google Scholar] [CrossRef]
- Chen, J.; Zhang, W.; Tang, Z.; Huang, Q. Experimental and numerical investigation of chloride-induced reinforcement corrosion and mortar cover cracking. Cem. Concr. Compos. 2020, 111, 103620. [Google Scholar] [CrossRef]
- Poursaee, A.; Ross, B. The Role of Cracks in Chloride-Induced Corrosion of Carbon Steel in Concrete—Review. Corros. Mater. Degrad. 2022, 3, 258–269. [Google Scholar] [CrossRef]
- Pedrosa, F.; Andrade, C. Corrosion induced cracking: Effect of different corrosion rates on crack width evolution. Constr. Build. Mater. 2017, 133, 525–533. [Google Scholar] [CrossRef]
- Van Nguyen, C.; Hieu Bui, Q.; Lambert, P. Experimental and numerical evaluation of the structural performance of corroded reinforced concrete beams under different corrosion schemes. Structures 2022, 45, 2318–2331. [Google Scholar] [CrossRef]
- Zhang, Y.; Wang, M.; Yu, L.; Guo, X.; Wang, Z.; Li, C. Experimental and numerical research on the influence of steel arch frame corrosion on security of supporting system in subsea tunnel. Tunn. Undergr. Space Technol. 2022, 120, 104253. [Google Scholar] [CrossRef]
- Yu, A.P.; Zhao, Y.L.; Diwakar, K.C.; Naqvi, M.W.; Hu, L.B. An experimental and numerical study of corrosion distribution dependent bond–slip relationship of reinforced concrete. Structures 2022, 46, 1268–1279. [Google Scholar] [CrossRef]
- Aldellaa, I.; Havlásek, P.; Jirásek, M.; Grassl, P. Effect of creep on corrosion-induced cracking. Eng. Fract. Mech. 2022, 264, 108310. [Google Scholar] [CrossRef]
- Zhu, X.; Meng, Z.; Liu, L.; Xu, L. An equivalent smeared layer method for simulating the non-uniform corrosion-induced damage of concrete. Eng. Fract. Mech. 2020, 224, 106791. [Google Scholar] [CrossRef]
- Zhu, X.; Zi, G. A 2D mechano-chemical model for the simulation of reinforcement corrosion and concrete damage. Constr. Build. Mater. 2017, 137, 330–344. [Google Scholar] [CrossRef]
- Chauhan, A.; Sharma, U.K. Crack propagation in reinforced concrete exposed to non-uniform corrosion under real climate. Eng. Fract. Mech. 2021, 248, 107719. [Google Scholar] [CrossRef]
- Chauhan, A.; Desai, Y.M.; Banerjee, S.; Sharma, U.K. 3D simulation of non-uniform corrosion induced damage in reinforced concrete exposed to real climate. Structures 2023, 56, 104852. [Google Scholar] [CrossRef]
- Zhang, Y.; Su, R.K.L. Concrete cover delamination model for non-uniform corrosion of reinforcements. Constr. Build. Mater. 2019, 223, 329–340. [Google Scholar] [CrossRef]
- Wang, Y.; Zhao, Y.; Gong, F.; Dong, J.; Maekawa, K. Developing a three-dimensional finite element analysis approach to simulate corrosion-induced concrete cracking in reinforced concrete beams. Eng. Struct. 2022, 257, 114072. [Google Scholar] [CrossRef]
- German, M. Modelling of Chloride Corrosion and Resultant Fracture in RC Elements. Ph.D. Thesis, Cracow University of Technology, Cracow, Poland, 2016. [Google Scholar]
- Pluciński, P. Numerical Analysis of Mechanical Effects of Rebar Corrosion in Concrete Structures. Ph.D. Thesis, Cracow University of Technology, Cracow, Poland, 2008. (In Polish). [Google Scholar]
- German, M.; Pamin, J. Numerical Simulation of Non-Uniformly Distributed Corrosion in Reinforced Concrete Cross-Section. Materials 2021, 14, 3975. [Google Scholar] [CrossRef] [PubMed]
- Liu, Y. Modeling the Time-to-Corrosion Cracking of the Cover Concrete in Chloride Contaminated Reinforced Concrete Structures. Ph.D. Thesis, Virginia Polytechnic Institute and State University, Blacksburg, VA, USA, 1996. [Google Scholar]
- Balafas, I.; Burgoyne, C. Environmental effects on cover cracking due to corrosion. Cem. Concr. Res. 2010, 40, 1429–1440. [Google Scholar] [CrossRef]
- Liu, T.; Weyers, R. Modeling the dynamic corrosion process in chloride contaminated concrete structures. Cem. Concr. Res. 1998, 28, 365–379. [Google Scholar] [CrossRef]
- Montemor, M.; Simões, A.; Ferreira, M. Chloride-induced corrosion on reinforcing steel: From the fundamentals to the monitoring techniques. Cem. Concr. Compos. 2003, 25, 491–502. [Google Scholar] [CrossRef]
- Wu, R.J.; Xia, J.; Cheng, X.; Liu, K.H.; Chen, K.Y.; Liu, Q.F.; Jin, W.L. Effect of random aggregate distribution on chloride-induced corrosion morphology of steel in concrete. Constr. Build. Mater. 2022, 322, 126378. [Google Scholar] [CrossRef]
- Kenny, A.; Katz, A. Steel-concrete interface influence on chloride threshold for corrosion—Empirical reinforcement to theory. Constr. Build. Mater. 2020, 244, 118376. [Google Scholar] [CrossRef]
- Bezuidenhout, S.; van Zijl, G. Corrosion propagation in cracked reinforced concrete, toward determining residual service life. Struct. Concr. 2019, 20, 2183–2193. [Google Scholar] [CrossRef]
- Geiker, M.; Danner, T.; Michel, A.; Belda Revert, A.; Linderoth, O.; Hornbostel, K. 25 years of field exposure of pre-cracked concrete beams: Combined impact of spacers and cracks on reinforcement corrosion. Constr. Build. Mater. 2021, 286, 122801. [Google Scholar] [CrossRef]
- Michel, A.; Sørensen, H.; Geiker, M. 5 years of in situ reinforcement corrosion monitoring in the splash and submerged zone of a cracked concrete element. Constr. Build. Mater. 2021, 285, 122923. [Google Scholar] [CrossRef]
- Krykowski, T.; Zybura, A. FEM modelling of concrete degradation caused by rebar corrosion in reinforced concrete. Archit. Civ. Eng. Environ. 2009, 4, 71–80. [Google Scholar]
- Krykowski, T.; Jaśniok, T.; Recha, F.; Karolak, M. A Cracking Model for Reinforced Concrete Cover, Taking Account of the Accumulation of Corrosion Products in the ITZ Layer, and Including Computational and Experimental Verification. Materials 2020, 13, 5375. [Google Scholar] [CrossRef] [PubMed]
- Xu, W.; Zhang, C.; Liu, H.; Yang, J.; Wang, X.; Tian, W.; Cao, K.; Zhang, T. Simulation and analysis of corrosion fracture of reinforced concrete based on phase field method. Case Stud. Constr. Mater. 2022, 17, e01366. [Google Scholar] [CrossRef]
- Avadh, K.; Jiradilok, P.; Bolander, J.E.; Nagai, K. 3D mesoscale simulation of the influence of corrosion on loss of tension stiffening in reinforced concrete. Constr. Build. Mater. 2022, 339, 127684. [Google Scholar] [CrossRef]
- Sharanbaswa Vishwanath, B.; Banerjee, S. Three-dimensional corrosion propagation in steel rebars of RC columns with early-age cracks. Constr. Build. Mater. 2022, 336, 127335. [Google Scholar] [CrossRef]
- Hong, S.; Chen, D.; Dong, B. Numerical simulation and mechanism analysis of GPR-based reinforcement corrosion detection. Constr. Build. Mater. 2022, 317, 125913. [Google Scholar] [CrossRef]
- Ma, J.; Yu, L.; Li, B.; Yu, B. Stress–strain model for confined concrete in rectangular columns with corroded transverse reinforcement. Eng. Struct. 2022, 267, 114710. [Google Scholar] [CrossRef]
- Bazant, Z. Physical model for steel corrosion in concrete sea structures–theory. J. Struct. Div. 1979, 105, 1137–1153. [Google Scholar] [CrossRef]
- Balafas, I.; Burgoyne, C. Modeling the structural effects of rust in concrete cover. J. Eng. Mech. 2011, 137, 175–185. [Google Scholar] [CrossRef]
- Guzman, S.; Galvez, J.; Sancho, J. Cover cracking of reinforced concrete due to rebar corrosion induced by chloride penetration. Cem. Concr. Res. 2011, 41, 893–902. [Google Scholar] [CrossRef]
- Zhu, W.; Yu, K.; Xu, Y.; Zhang, K.; Cai, X. A Prediction Model of the Concrete Cracking Induced by the Non-Uniform Corrosion of the Steel Reinforcement. Materials 2020, 13, 830. [Google Scholar] [CrossRef]
- Zhang, P.; Dai, J.G.; Sekhar Das, C.; Zheng, J.J. A fully coupled meso-scale electro-chemo-mechanical phase field method for corrosion-induced fracture in concrete. Int. J. Solids Struct. 2023, 267, 112165. [Google Scholar] [CrossRef]
- Fang, X.; Pan, Z.; Chen, A.; Tian, H.; Ma, R. Phase-field method for modeling non-uniform corrosion-induced cracking in concrete. Eng. Fract. Mech. 2023, 281, 109131. [Google Scholar] [CrossRef]
- Zhu, P.; Liu, M. Non-uniform Corrosion Mechanism and residual life forecast of marine engineering concrete reinforcement. J. Eng. Res. 2023, 11, 100053. [Google Scholar] [CrossRef]
- Berrocal, C.G.; Fernandez, I.; Rempling, R. The interplay between corrosion and cracks in reinforced concrete beams with non-uniform reinforcement corrosion. Mater. Struct. 2022, 55, 120. [Google Scholar] [CrossRef]
- SIMULIA. Abaqus Theory Manual (6.10); Dassault Systemes: Providence, RI, USA, 2010. [Google Scholar]
- Winnicki, A. Viscoplastic and Internal Discontinuity Models in Analysis of Structural Concrete; Series Civil Engineering; Cracow University of Technology: Cracow, Poland, 2007. [Google Scholar]
- De Borst, R.; Crisfield, M.; Remmers, J.; Verhoosel, C. Non-Linear Finite Element Analysis of Solids and Structures, 2nd ed.; Wiley: Hoboken, NJ, USA, 2012. [Google Scholar]
- German, M.; Pamin, J. Three-dimensional FE simulation of pullout test of corroded bar from RC specimen. In Computational Modelling of Concrete Structures; Bicanic, N., Ed.; Taylor & Francis: London, UK, 2014; pp. 967–976. [Google Scholar]
- German, M.; Pamin, J. Two-dimensional FE simulation of cracking caused by expansion of corrosion products. Recent advances in computational mechanics. In Proceedings of the 20th International Conference on Computer Methods in Mechanics (CMM 2013), Poznan, Poland, 27–31 August 2013; Łodygowski, T., Rakowski, J., Litewka, P., Eds.; CRC Press: Boca Raton, FL, USA; Balkema: Rotterdam, The Netherlands, 2014; pp. 139–148. [Google Scholar]
- Lubliner, J.; Oliver, J.; Oller, S.; Oñate, E. A plastic-damage model for concrete. Int. J. Solids Struct. 1989, 25, 299–326. [Google Scholar] [CrossRef]
- Lee, J.; Fenves, G. Plastic-damage model for cyclic loading of concrete structures. J. Eng. Mech. 1998, 124, 892–900. [Google Scholar] [CrossRef]
- Wosatko, A.; Winnicki, A.; Polak, M.A.; Pamin, J. Role of dilatancy angle in plasticity-based models of concrete. Arch. Civ. Mech. Eng. 2019, 19, 1268–1283. [Google Scholar] [CrossRef]


| Concrete | Steel | ||
|---|---|---|---|
| Parameter | Value | Parameter | Value |
| E [GPa] | 36 | E [GPa] | 210 |
| [-] | 0.2 | [-] | 0.3 |
| Dilation angle [°] | 25 | Yield stress [MPa] | 350 |
| Eccentricity | 0.1 | ||
| Comp. yield stress [MPa] | 40 | ||
| Inelastic strain | 0.015 | ||
| Tens. yield stress [MPa] | 3.55 | ||
| Cracking strain | 0.02 | ||
| Viscosity parameter [s] | 10 × 10−6 | ||
| Parameter | |||||||
|---|---|---|---|---|---|---|---|
| Value [MPa] | 120 | 50 | 50 | 91 | 355 | 17 | 17 |
| CS1 | CS2; S = 43 mm | CS3; S = 59 mm |
 |  |  |
| CS4; S = 75 mm | CS5; S = 91 ;mm | CS6; S = 43 mm |
 |  |  |
| Point | Step 1 | Step 2 | Step 3 | Step 4 | Step 5 |
|---|---|---|---|---|---|
| NE (side) | 0.0476 | 0.2252 | 0.3328 | 0.4068 | 0.6146 |
| N, E (side) | - | 0.1789 | 0.2969 | 0.3757 | 0.5919 |
| NW, SE (side) | - | 0.1576 | 0.2803 | 0.3616 | 0.5817 |
| W, S (side) | - | - | 0.1353 | 0.2422 | 0.5018 |
| SW (side) | - | - | - | 0.1115 | 0.4249 |
| N, NW, NE (middle) | - | - | 1353 | 0.2422 | 0.5018 |
| W, E (middle) | - | - | - | - | 0.3533 |
Disclaimer/Publisher’s Note: The statements, opinions and data contained in all publications are solely those of the individual author(s) and contributor(s) and not of MDPI and/or the editor(s). MDPI and/or the editor(s) disclaim responsibility for any injury to people or property resulting from any ideas, methods, instructions or products referred to in the content. |
© 2023 by the authors. Licensee MDPI, Basel, Switzerland. This article is an open access article distributed under the terms and conditions of the Creative Commons Attribution (CC BY) license (https://creativecommons.org/licenses/by/4.0/).
Share and Cite
German, M.; Pamin, J. Cracking in Reinforced Concrete Cross-Sections Due to Non-Uniformly Distributed Corrosion. Materials 2023, 16, 6331. https://doi.org/10.3390/ma16186331
German M, Pamin J. Cracking in Reinforced Concrete Cross-Sections Due to Non-Uniformly Distributed Corrosion. Materials. 2023; 16(18):6331. https://doi.org/10.3390/ma16186331
Chicago/Turabian StyleGerman, Magdalena, and Jerzy Pamin. 2023. "Cracking in Reinforced Concrete Cross-Sections Due to Non-Uniformly Distributed Corrosion" Materials 16, no. 18: 6331. https://doi.org/10.3390/ma16186331
APA StyleGerman, M., & Pamin, J. (2023). Cracking in Reinforced Concrete Cross-Sections Due to Non-Uniformly Distributed Corrosion. Materials, 16(18), 6331. https://doi.org/10.3390/ma16186331