

Crystal Lattice Defects in Deuterated Zr in Presence of O and C Impurities Studied by PAS and XRD for Electron Screening Effect

 , ,
, ,  , , ,
, , ,
Abstract
:
1. Introduction
2. Materials and Methods
2.1. Sample Preparation
2.2. Irradiation
2.2.1. For PAS Measurements
2.2.2. For XRD Analysis
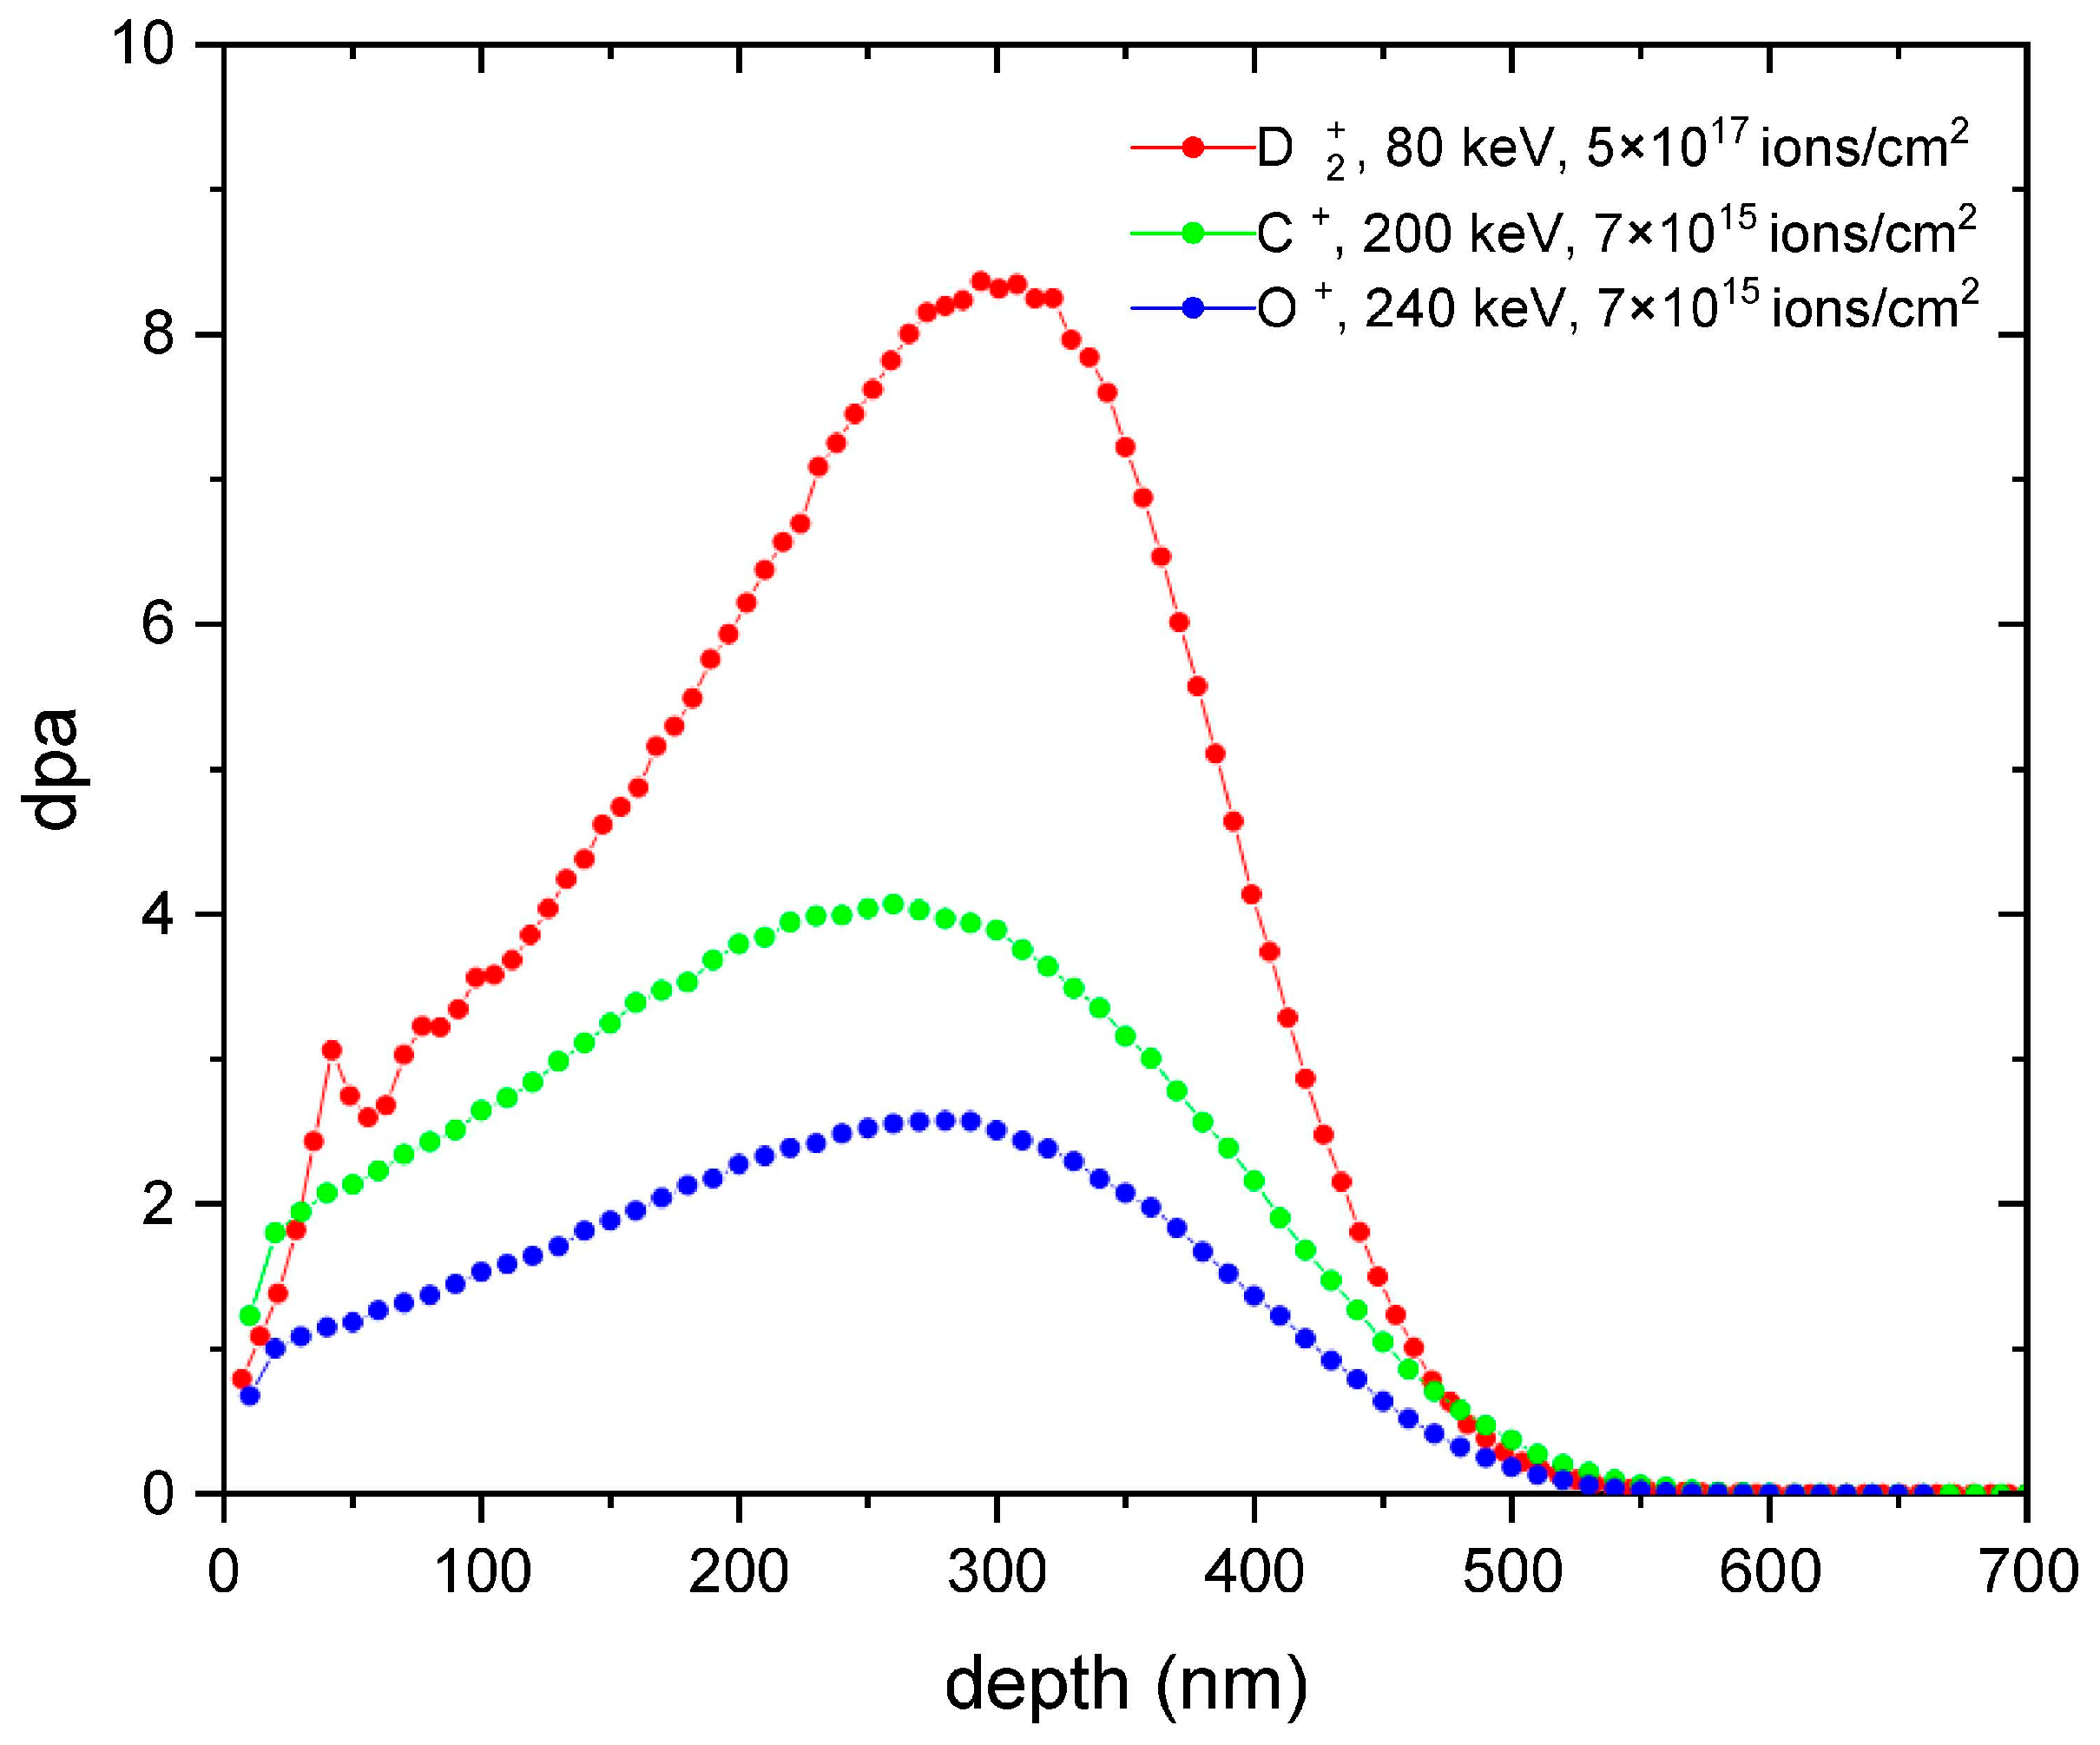
2.3. TRIM/SRIM Simulations and Dpa Calculations
2.4. Positron Annihilation Spectroscopy and XRD
2.4.1. Positron Annihilation Lifetime Spectroscopy (PALS)
2.4.2. Variable Energy Positron Beam (VEP)
2.4.3. XRD
3. Results
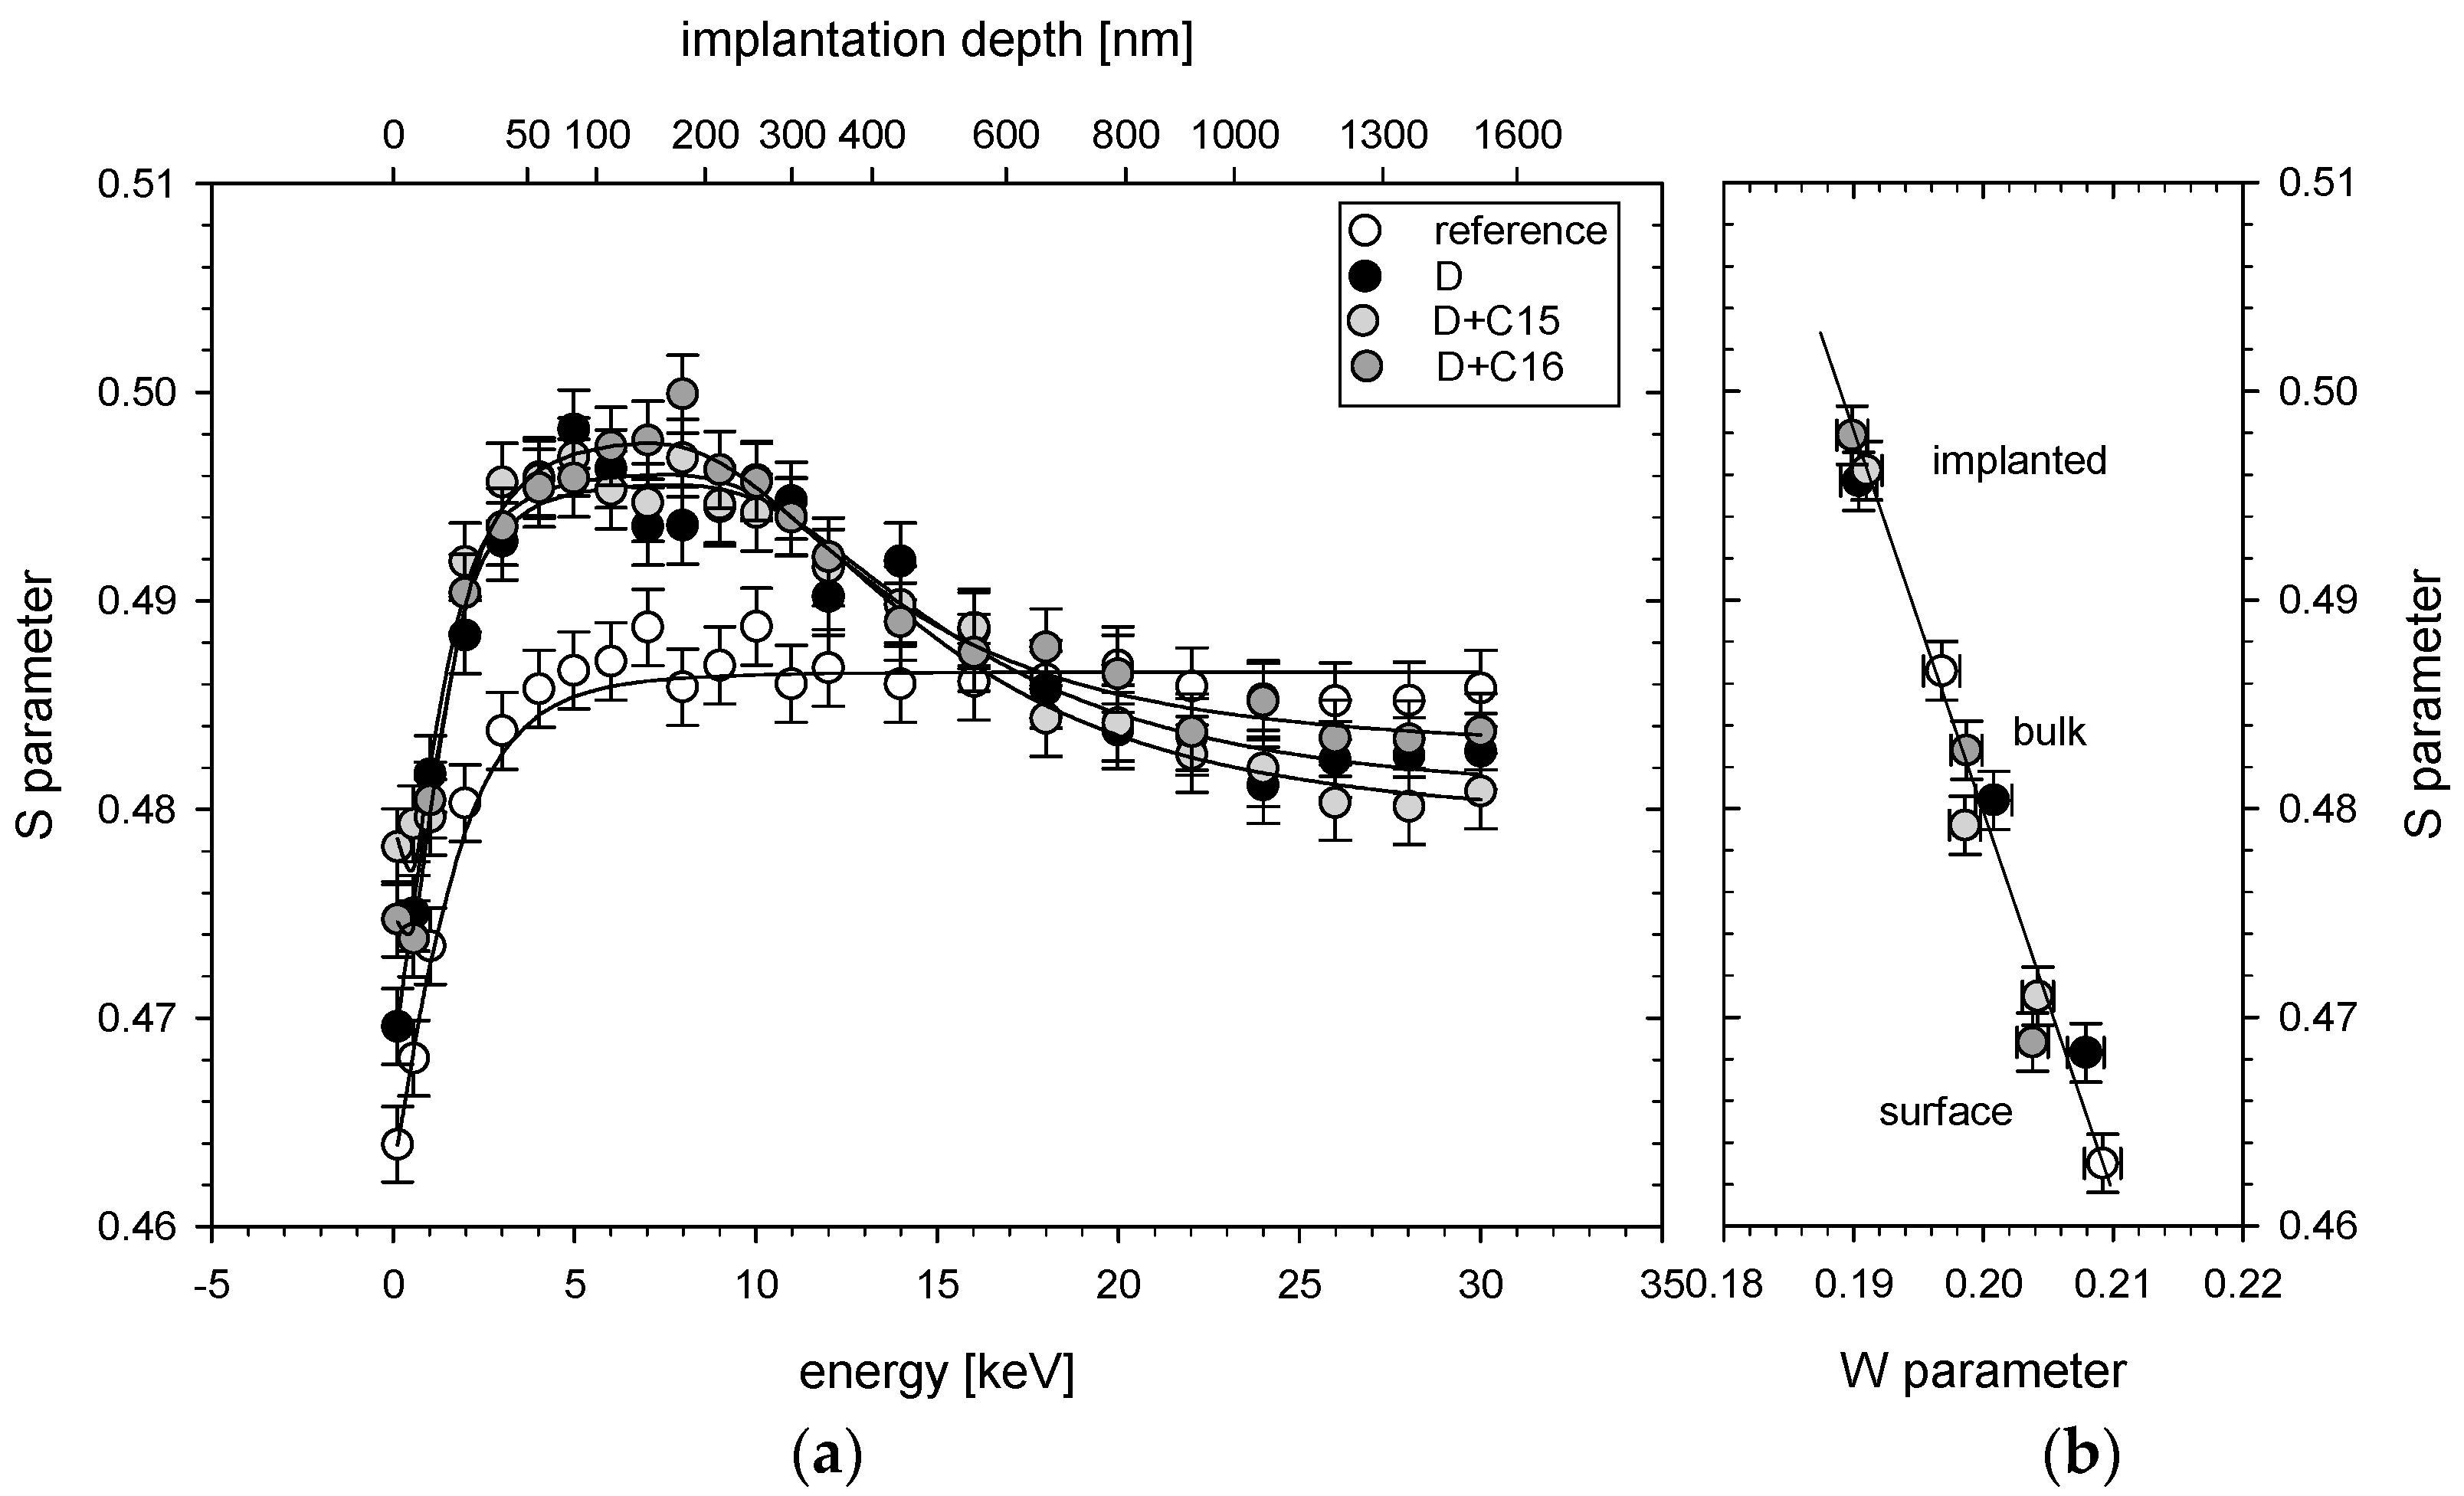
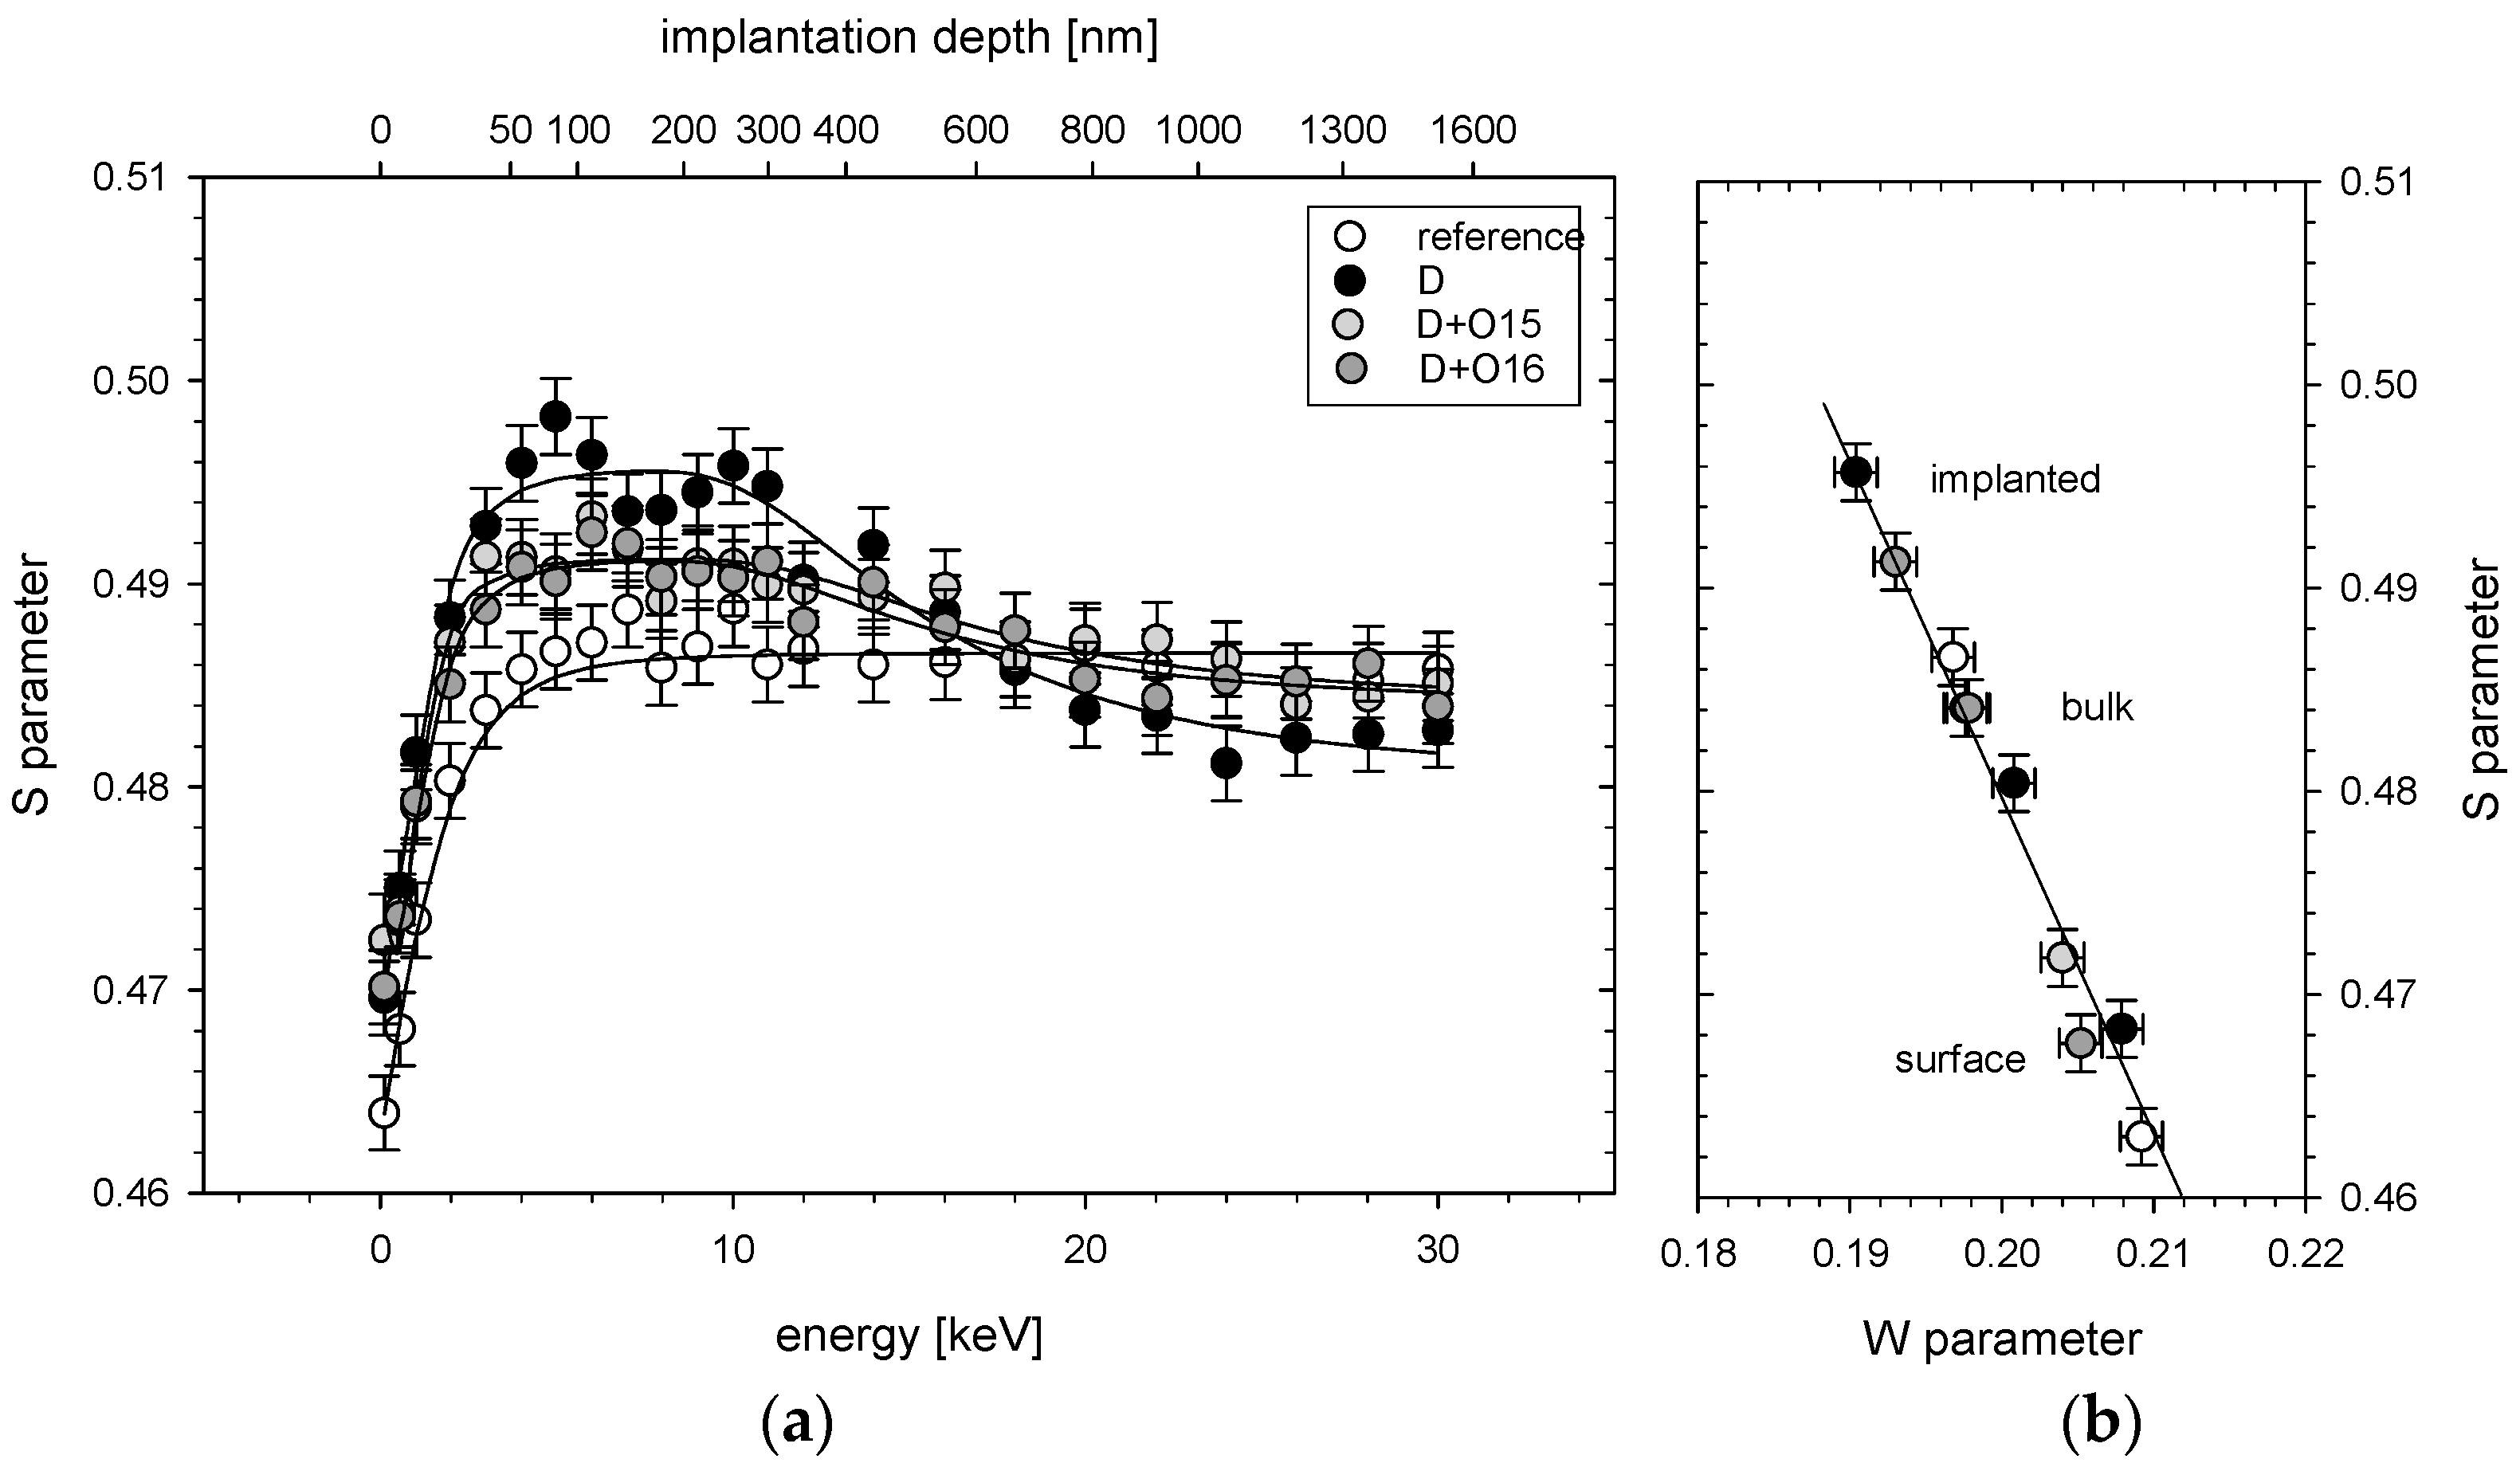
3.1. PALS Results
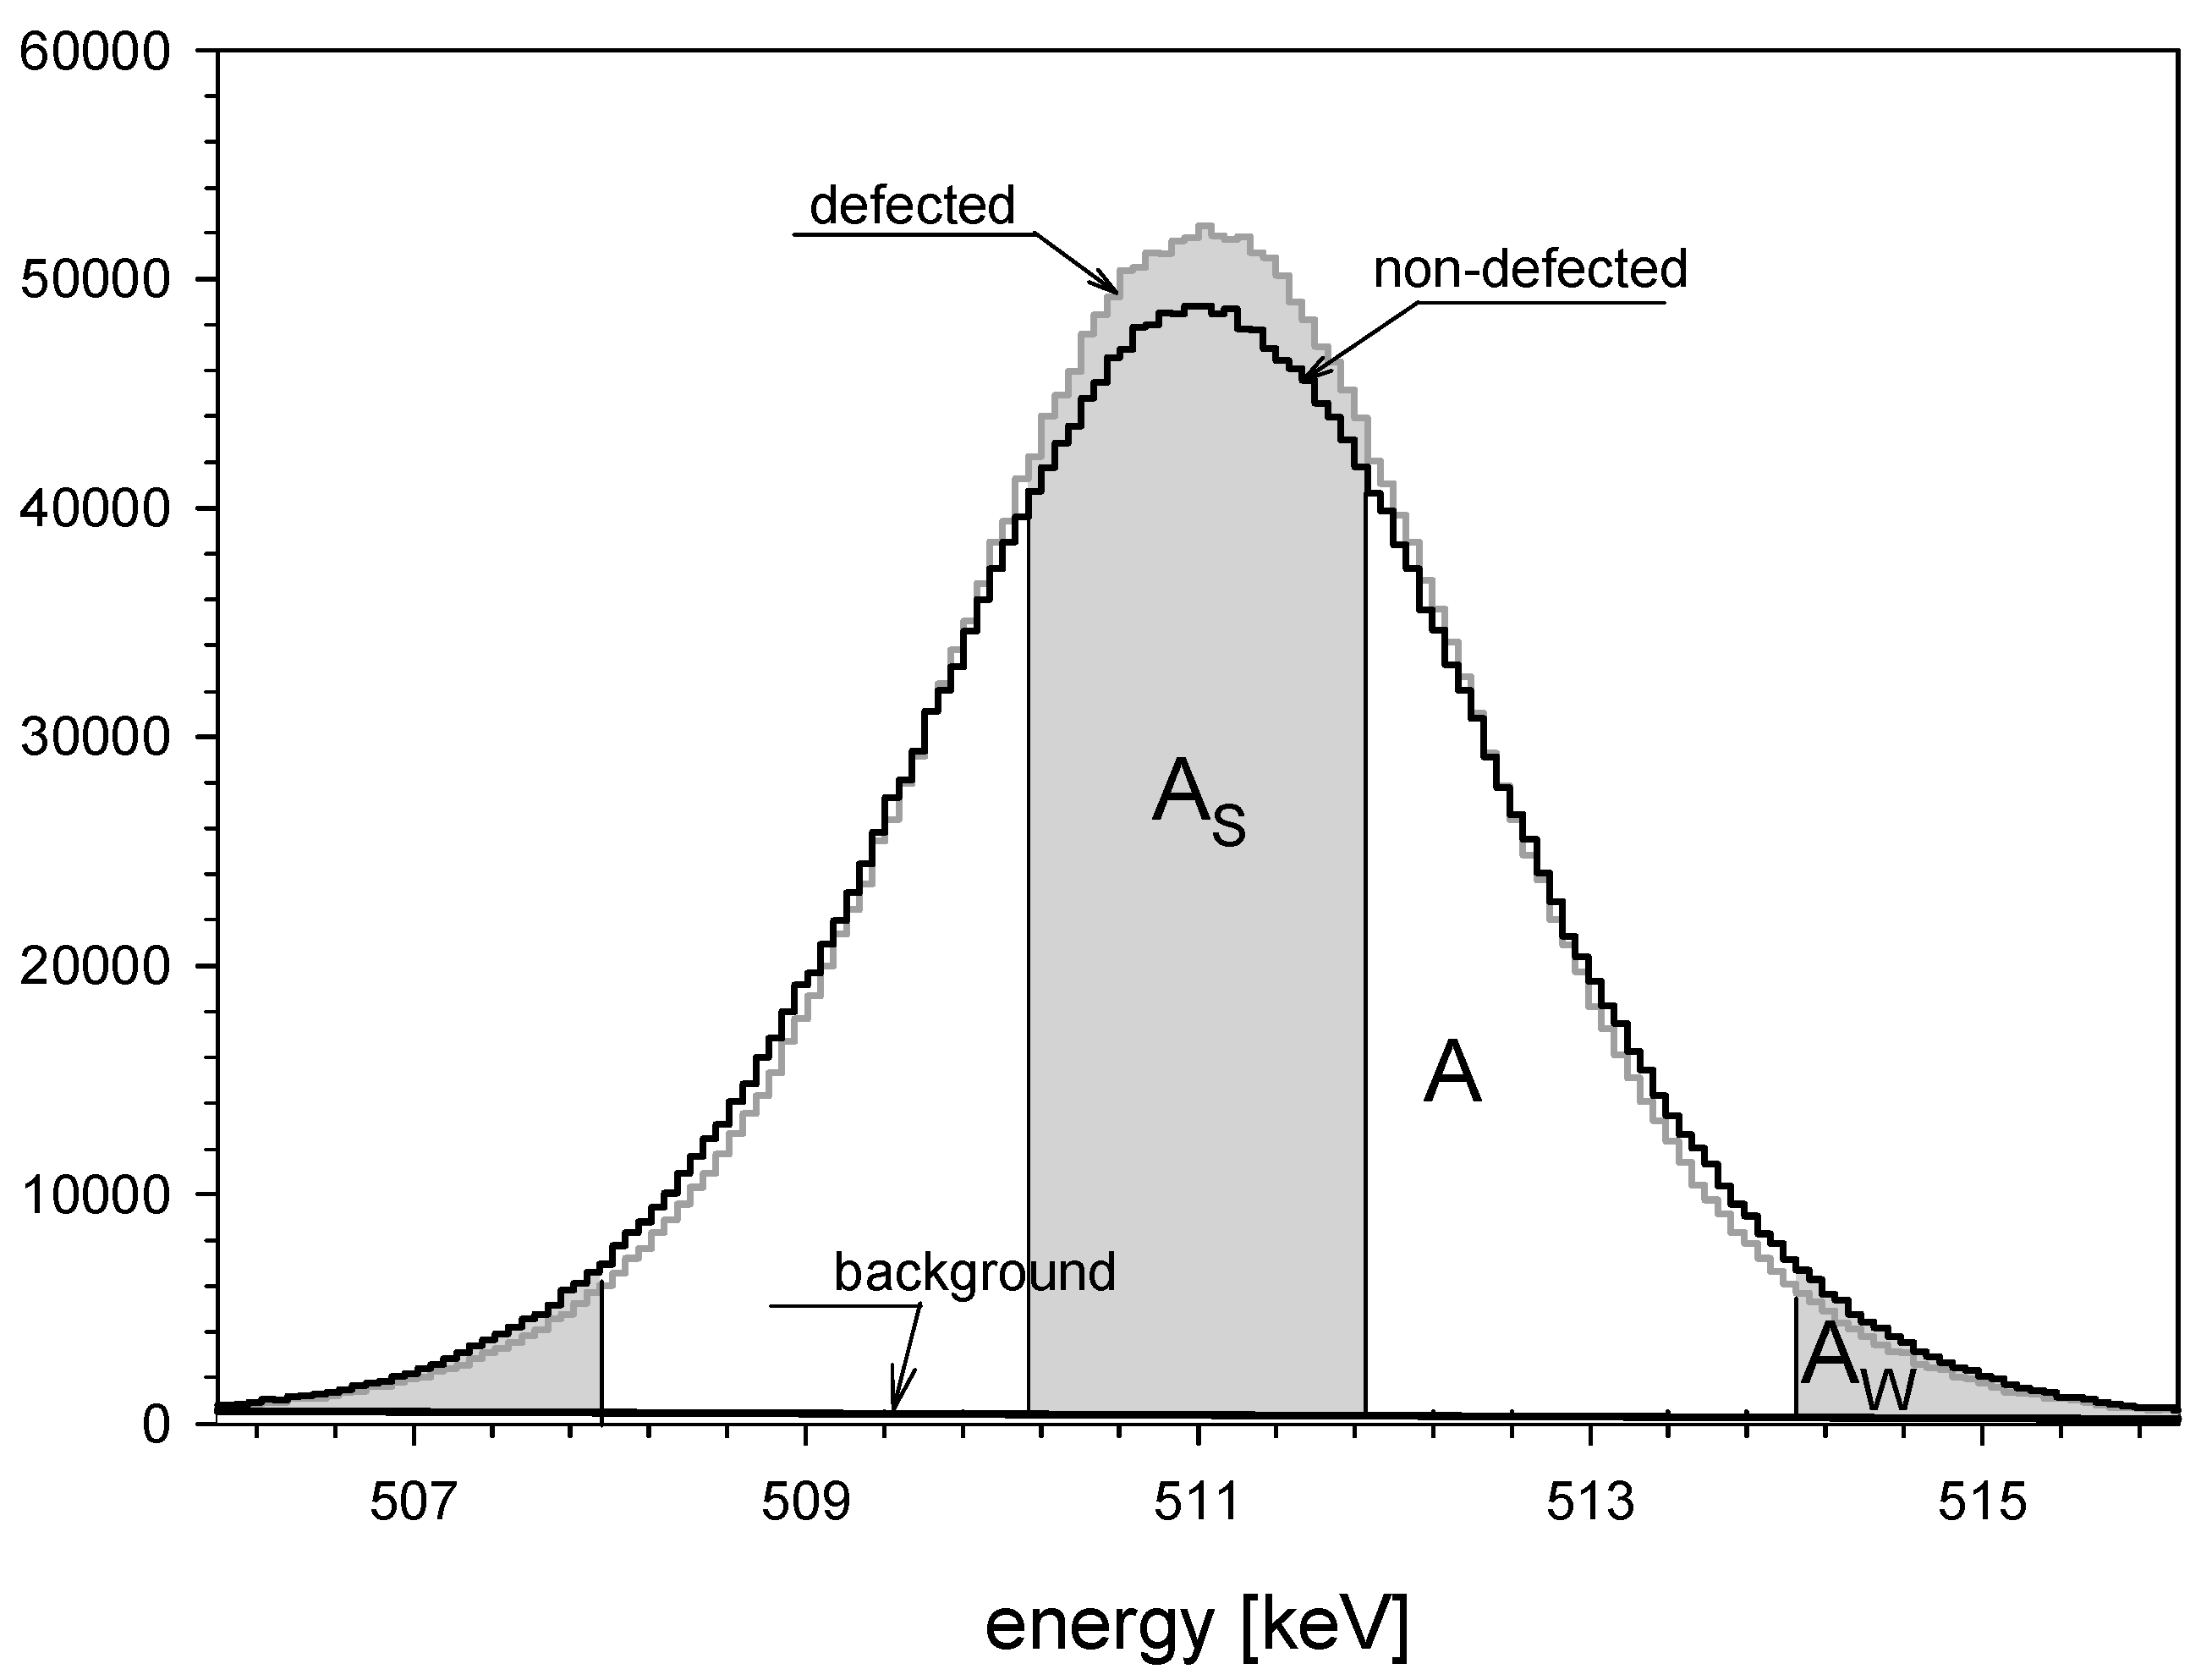
3.2. VEP Results
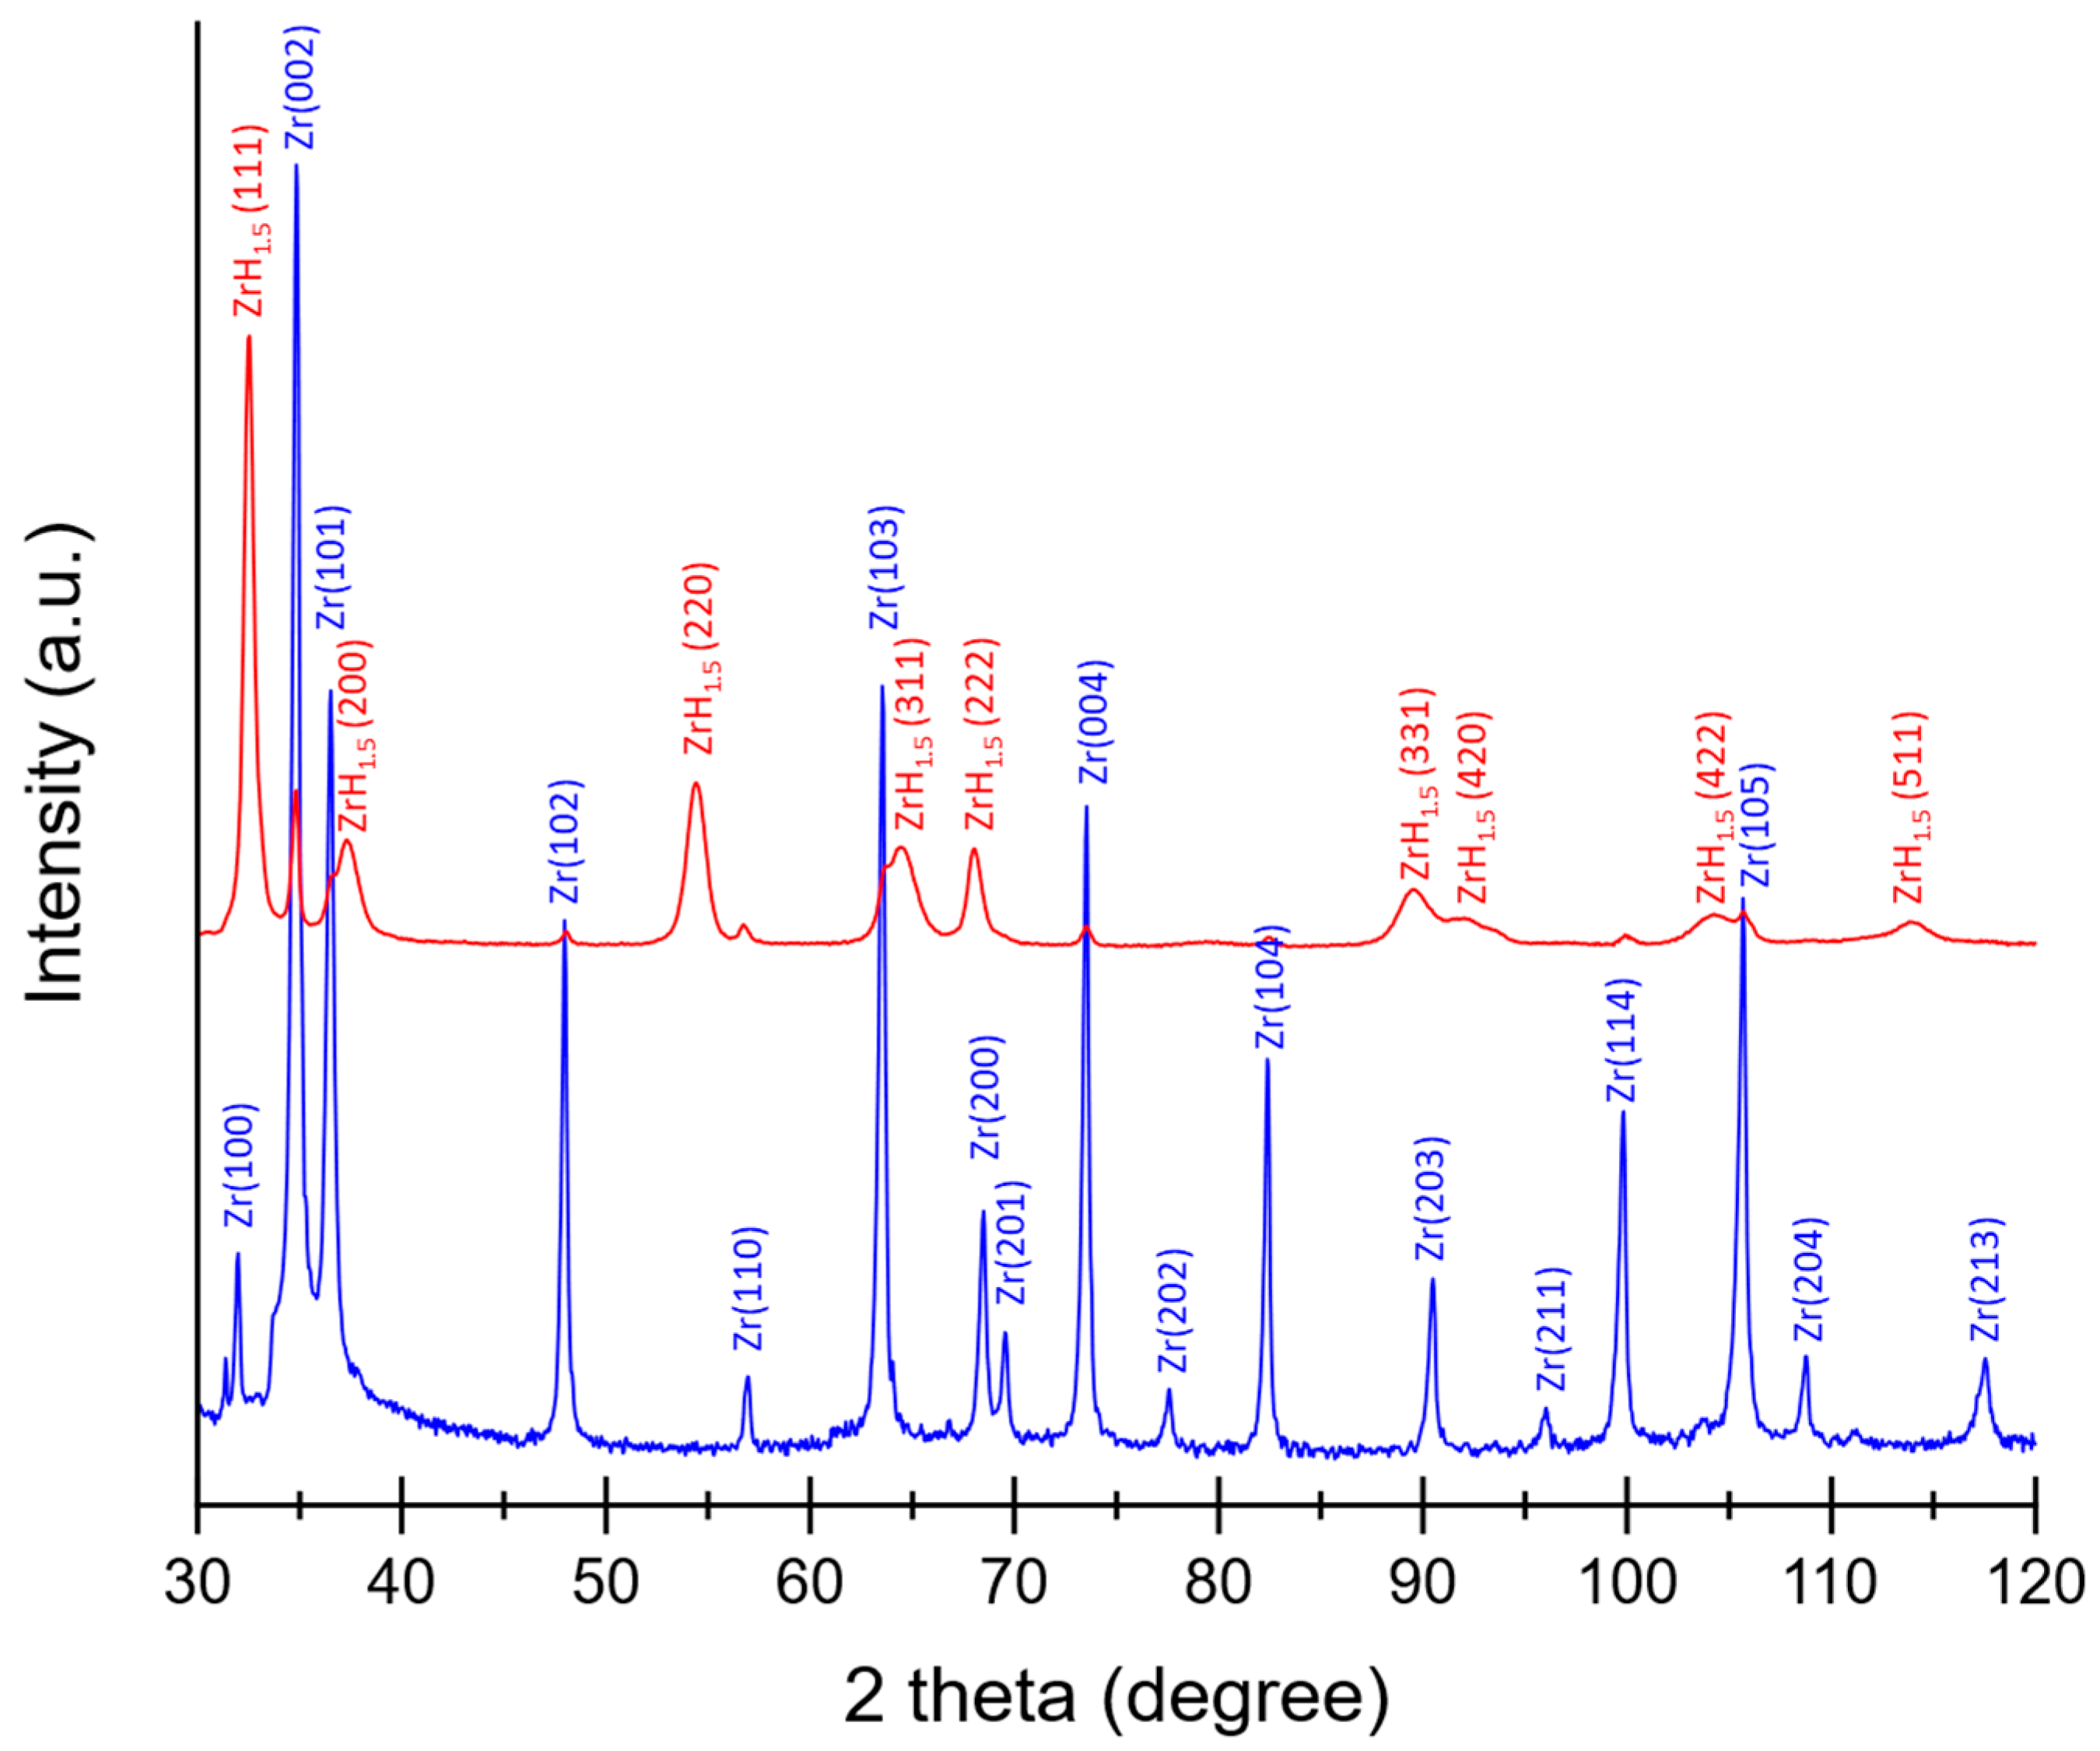
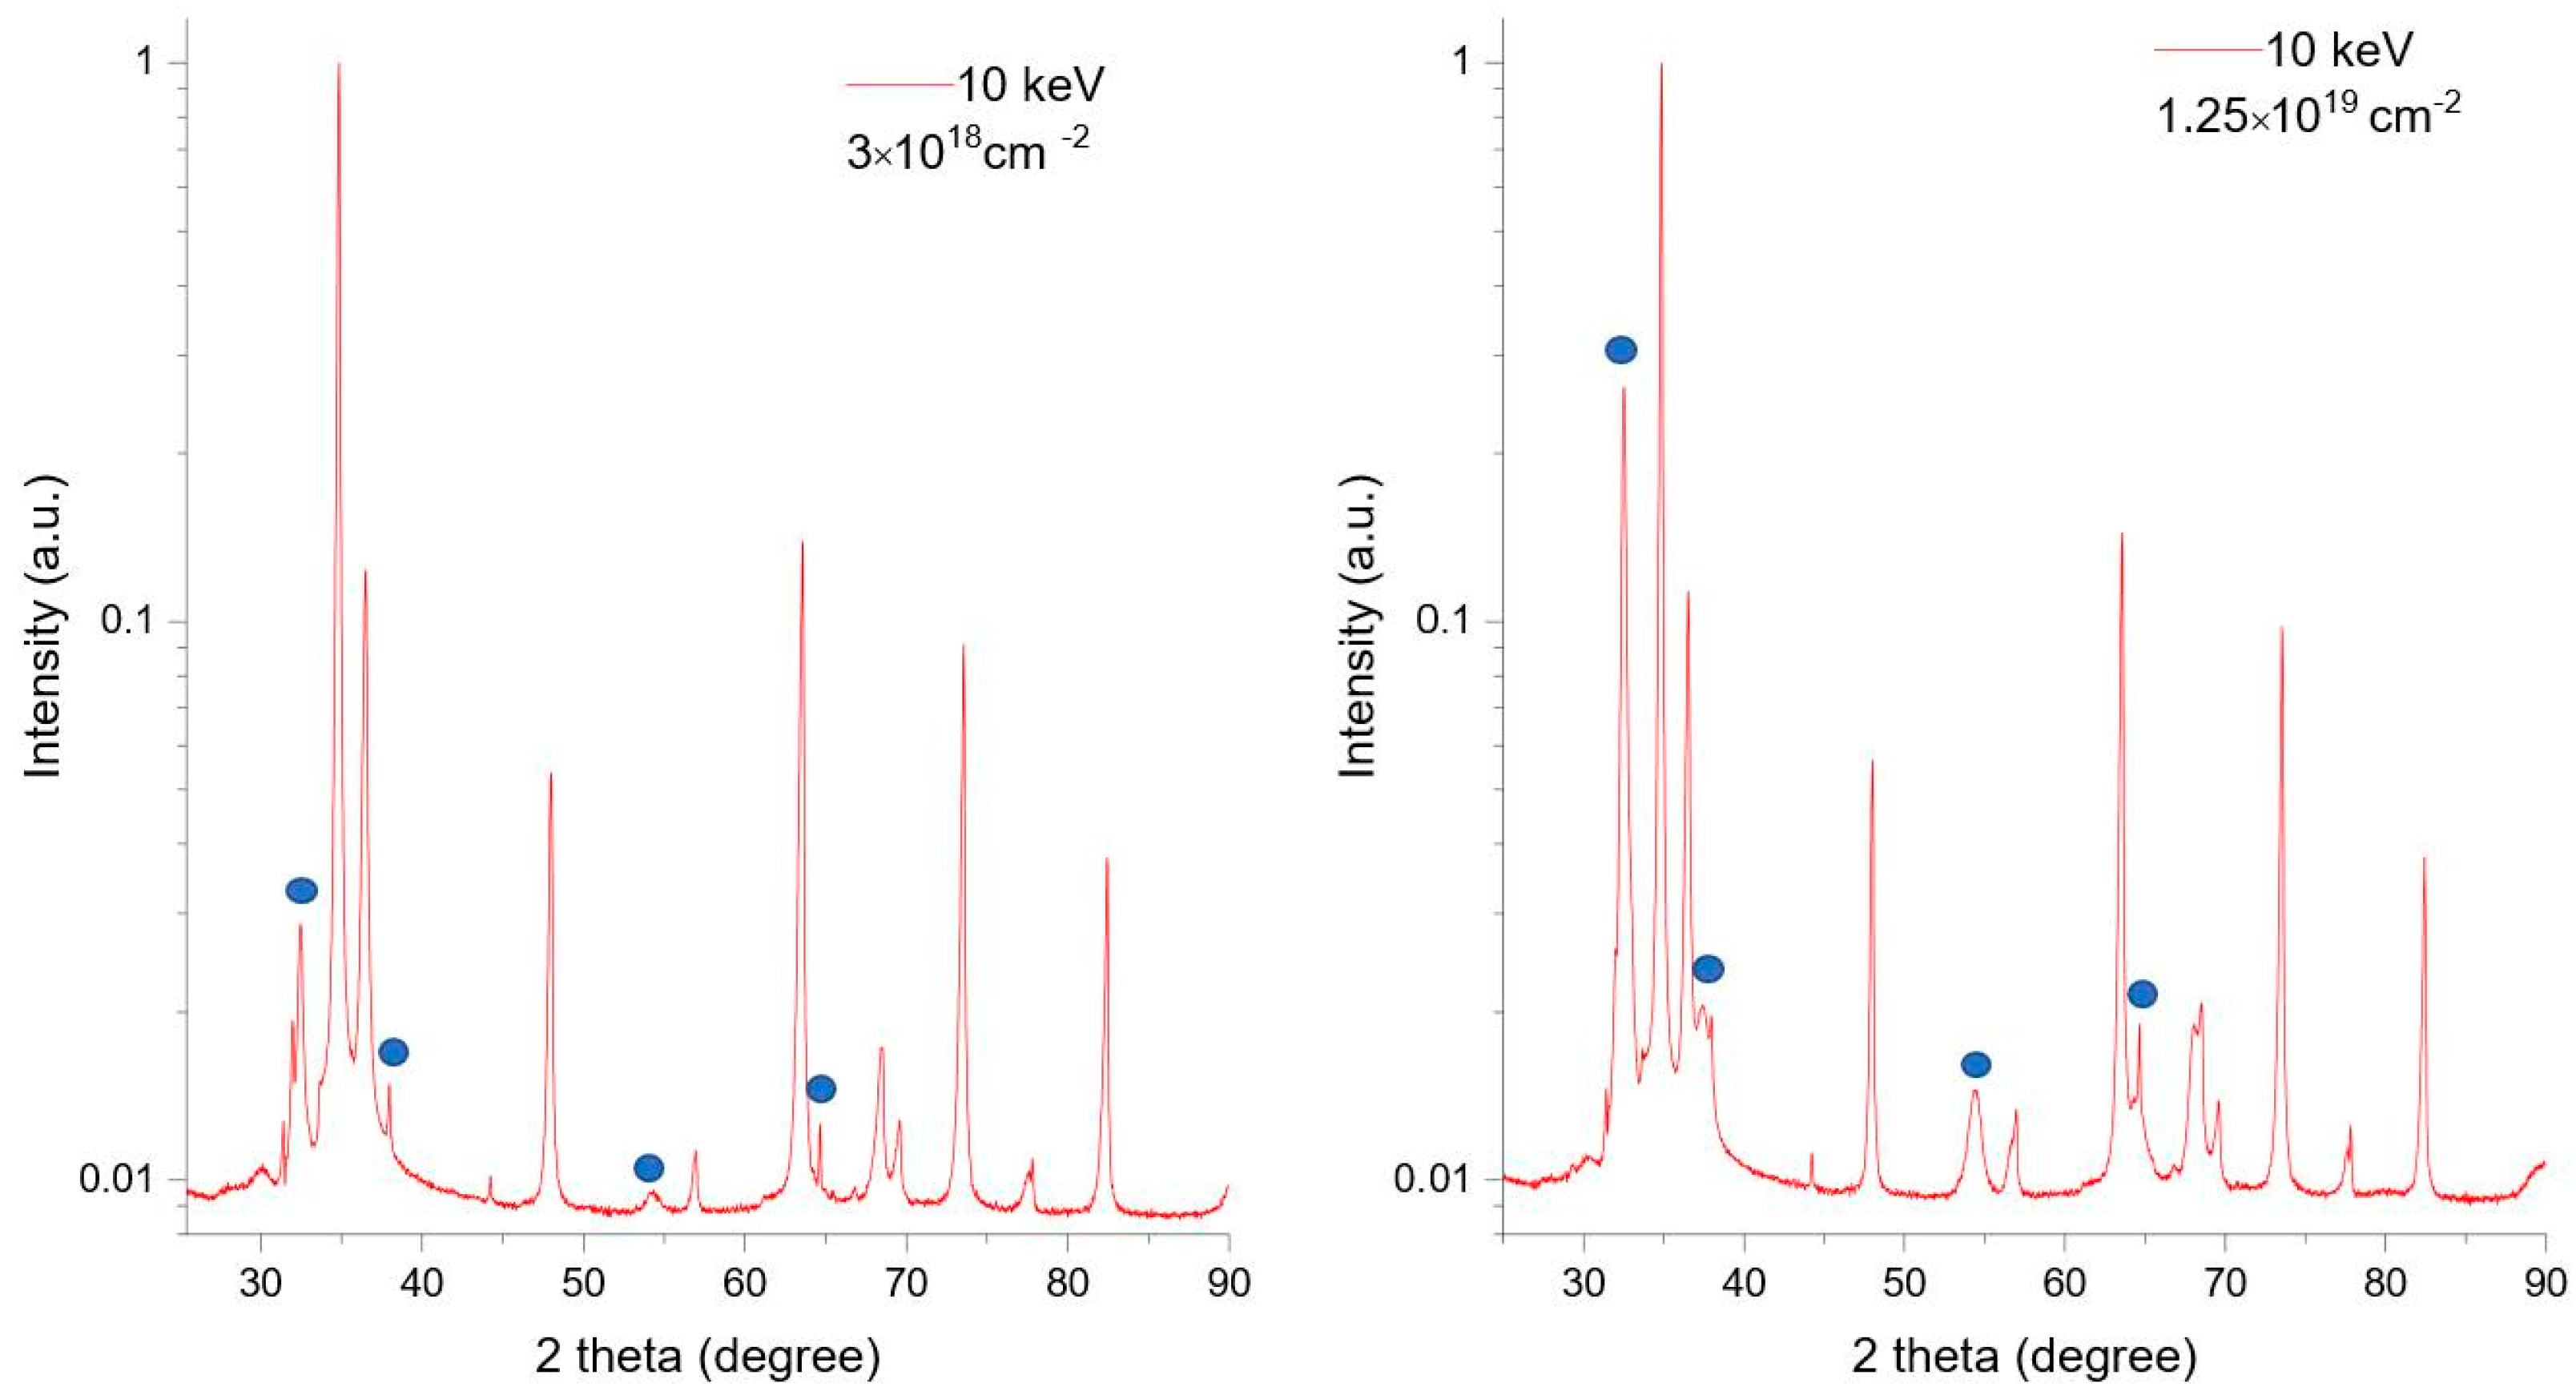
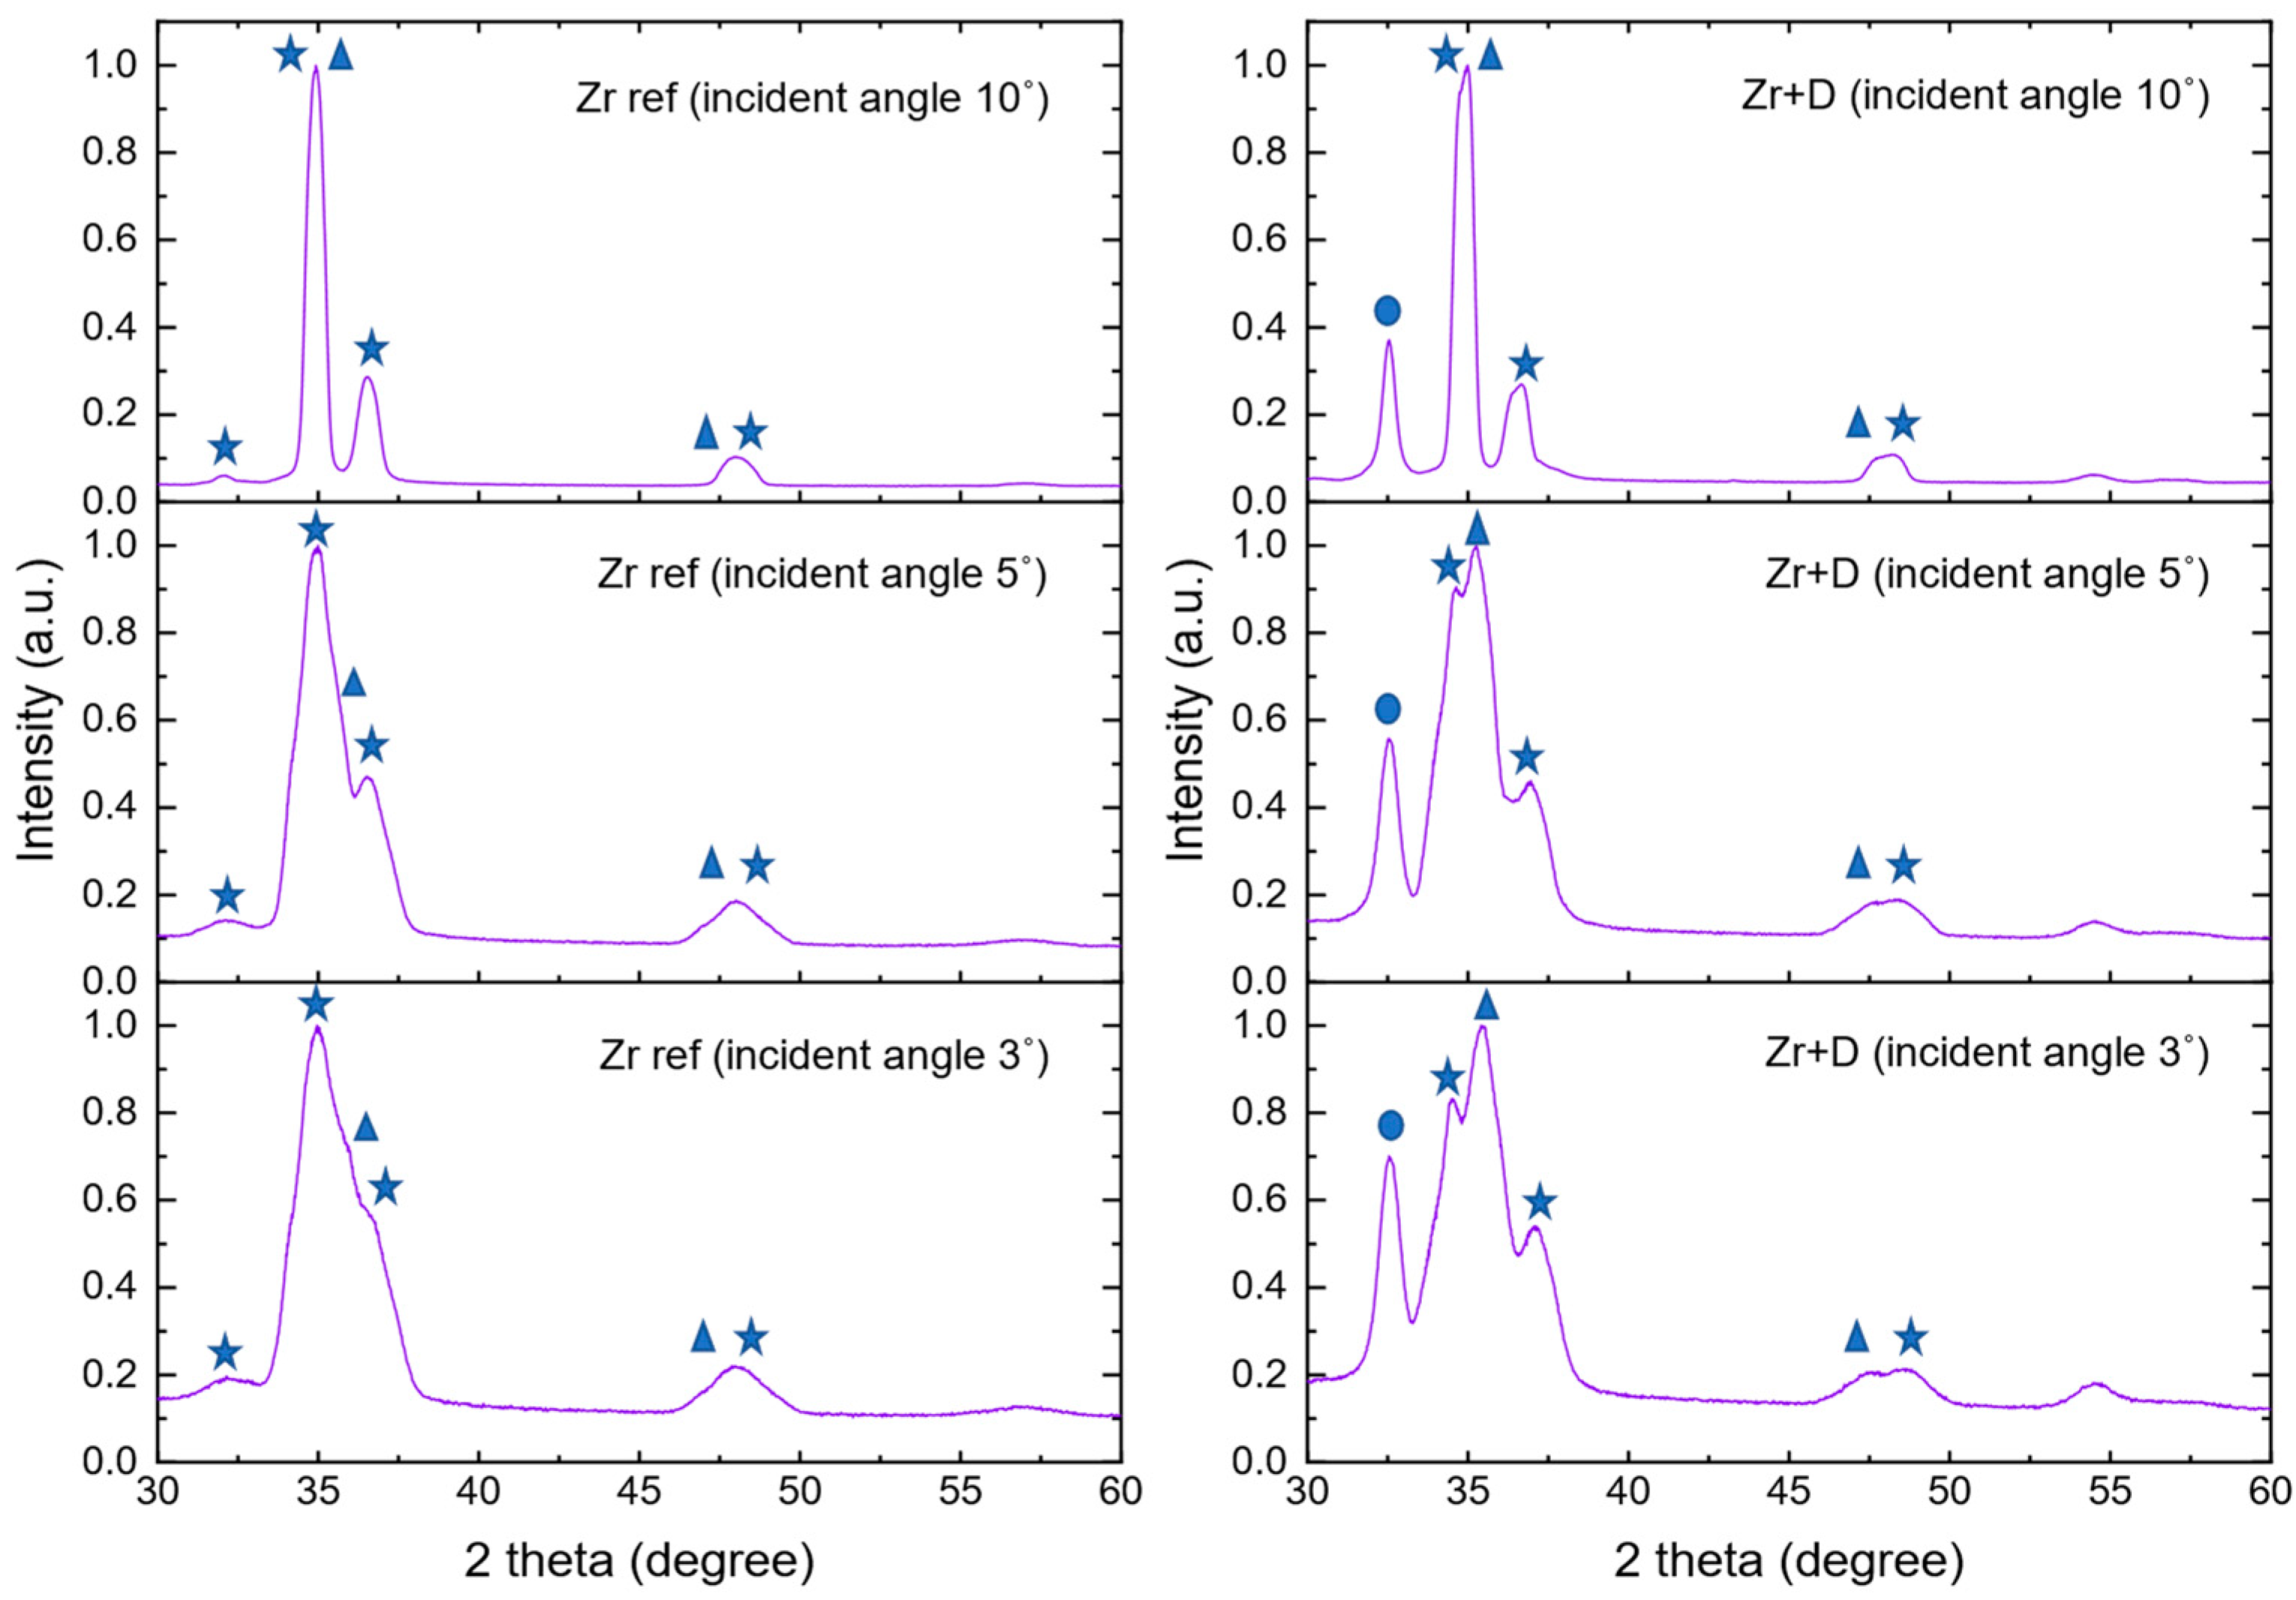
3.3. XRD Results
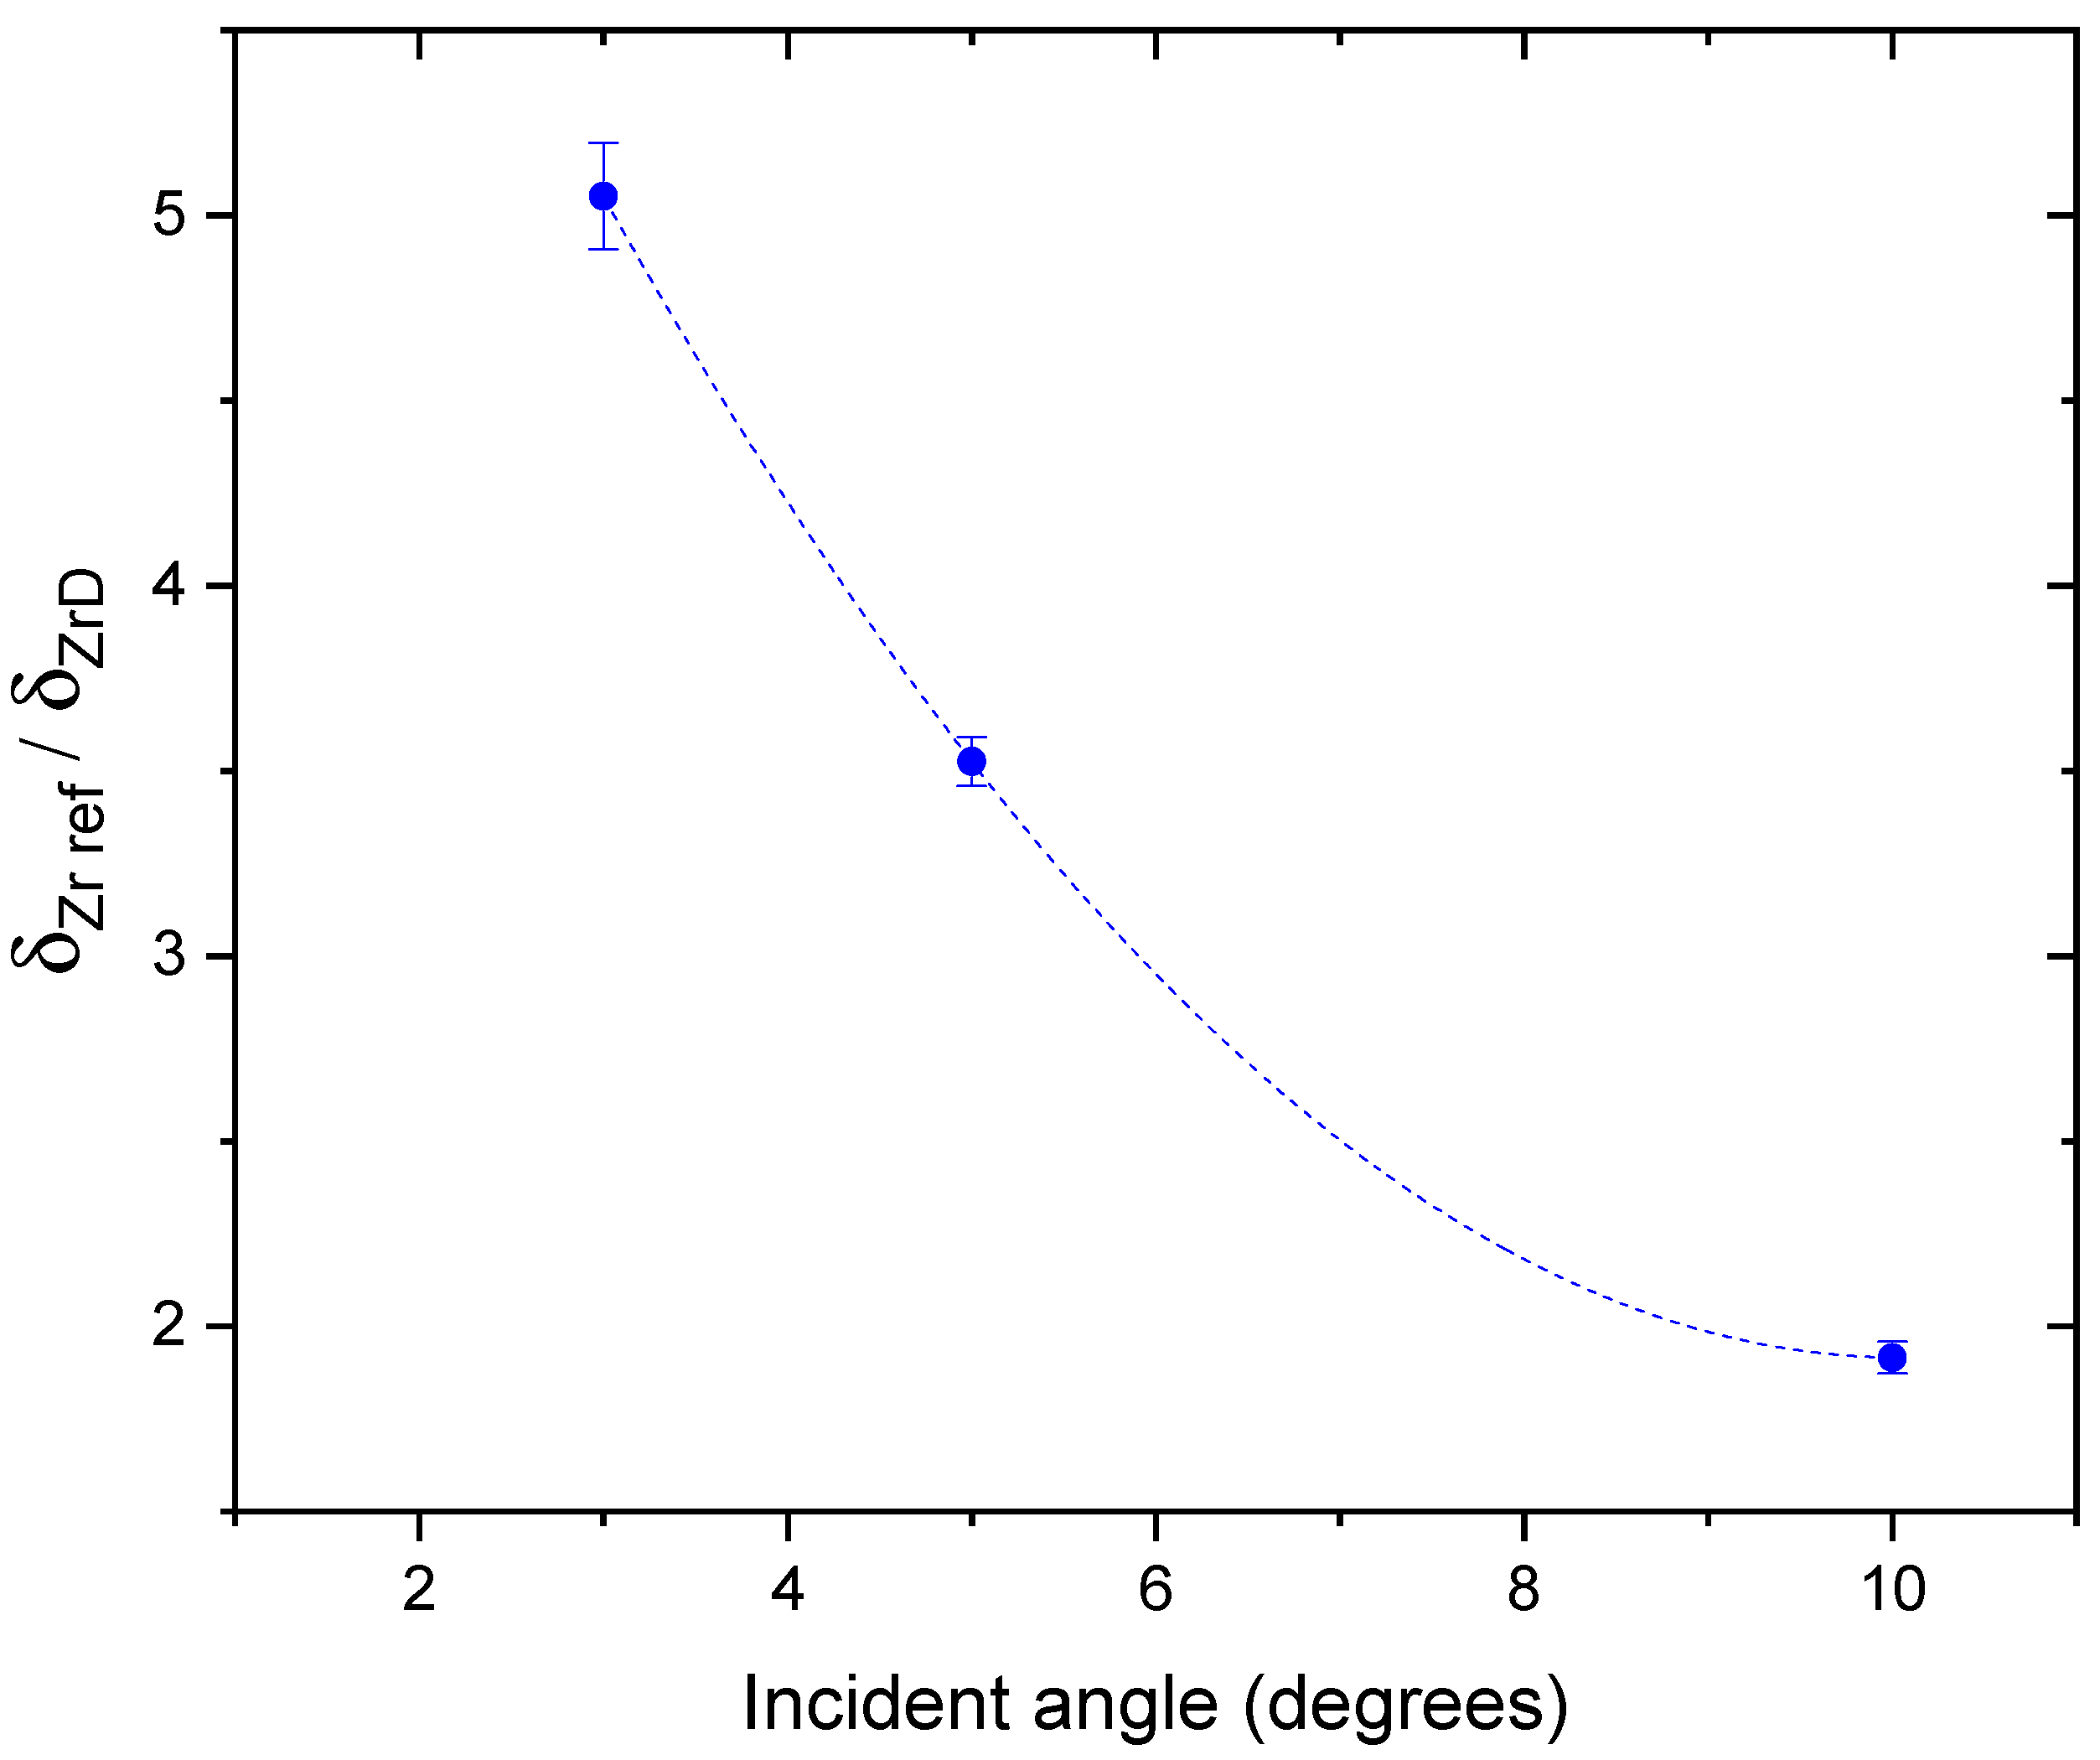
4. Discussion and Conclusions
Author Contributions
Funding
Data Availability Statement
Conflicts of Interest
References
- Czerski, K.; Huke, A.; Biller, A.; Heide, P.; Hoeft, M.; Ruprecht, G. Enhancement of the electron screening effect for d + d fusion reactions in metallic environments. Europhys. Lett. 2001, 54, 449–455. [Google Scholar] [CrossRef]
- Czerski, K.; Huke, A.; Heide, P.; Ruprecht, G. The 2H(d, p)3H reaction in metallic media at very low energies. Europhys. Lett. 2004, 68, 363–369. [Google Scholar] [CrossRef]
- Huke, A.; Czerski, K.; Heide, P.; Ruprecht, G.; Targosz, N.; Żebrowski, W. Enhancement of deuteron-fusion reactions in metals and experimental implications. Phys. Rev. C 2008, 78, 015803. [Google Scholar] [CrossRef]
- Bystritsky, V.M.; Bystritskii, V.M.; Dudkin, G.N.; Filipowicz, M.; Gazi, S.; Huran, J.; Kobzev, A.P.; Mesyats, G.A.; Nechaev, B.A.; Padalko, V.N.; et al. Investigation of temperature dependence of neutron yield and electron screening potential for the d(d,n)3He reaction proceeding in deuterides ZrD2 and TiD2. Phys. At. Nucl. 2012, 75, 913–922. [Google Scholar] [CrossRef]
- Czerski, K.; Weissbach, D.; Kilic, A.I.; Ruprecht, G.; Huke, A.; Kaczmarski, M.; Targosz-Ślęczka, N.; Maass, K. Screening and resonance enhancements of the 2H(d, p)3H reaction yield in metallic environments. Europhys. Lett. 2016, 113, 22001. [Google Scholar] [CrossRef]
- Czerski, K. Deuteron-deuteron nuclear energies at extremely low energies. Phys. Rev. C 106 2022, 106, L011601. [Google Scholar] [CrossRef]
- Czerski, K.; Dubey, R.; Kaczmarski, M.; Kowalska, A.; Targosz-Sleczka, N.; Das Haridas, G.; Valat, M. First observation of e-e+ pair emission from the DD threshold resonance. arXiv 2023, arXiv:2305.17101. [Google Scholar]
- Kittel, C. Chapter 20: Point defects. and Chapter 21: Dislocations. In Introduction to Solid State Physics, 8th ed.; Stuart, J., Ed.; John Wiley & Sons: New York, NY, USA, 2005; pp. 583–618. [Google Scholar]
- Grosso, G.; Parravicini, G.P. Solid State Physics, 2nd ed.; Academic Press: Oxford, UK, 2014. [Google Scholar]
- Zhang, J.; McIlroy, N.D.; Dowben, P.A. Correlation between screening and electron effective mass across the nonmetal-metal transition in ultrathin films. Phys. Rev. B 1995, 52, 11380. [Google Scholar] [CrossRef]
- Cvetinović, A.; Đeorđić, D.; Guardo, G.; Kelemen, M.; La Cognata, M.; Lamia, L.; Markelj, S.; Mikac, U.; Pizzone, R.; Schwarz-Selinger, T.; et al. Electron Screening in Palladium. Phys. Lett. B 2023, 838, 137684. [Google Scholar] [CrossRef]
- Cventovic, A.; Lipoglavsek, M.; Markelj, S.; Vesic, J. Molecular Screening in nuclear reactions. Phys. Rev. C 2015, 92, 065801. [Google Scholar]
- Kasagi, J.; Yuki, H.; Baba, T.; Noda, T.; Ohtsuki, T.; Lipson, A.G. Strongly Enhanced DD Fusion Reaction in Metals Observed for keV D+ Bombardment. J. Phys. Soc. Jpn. 2002, 71, 2881. [Google Scholar] [CrossRef]
- Fukai, Y. The Metal-Hydrogen System: Basic Bulk Properties, 2nd ed.; Springer: Berlin/Heidelberg, Germany, 2005. [Google Scholar]
- Prados-Estévez, F.M.; Subashiev, A.S.; Nee, H.H. Strong screening by lattice confinement and resultant fusion reaction rates in fcc metals. Nucl. Instrum. Methods Phys. Res. B 2017, 407, 67–72. [Google Scholar] [CrossRef]
- Feng, M.; Liu, G.; Liu, Z.; Hu, W.; He, X.; Deng, H. Interaction between impurity elements (C, N, and O) and hydrogen in hcp-Zr: A first-principle study. Model. Simul. Mater. Sci. Eng. 2020, 28, 085007. [Google Scholar] [CrossRef]
- Čížek, J. Characterization of lattice defects in metallic materials by positron annihilation spectroscopy: A review. J. Mater. Sci. Technol. 2018, 34, 577–598. [Google Scholar] [CrossRef]
- Fukai, Y.; Okuma, N. Formation of Superabundant Vacancies in Pd Hydride under High Hydrogen Pressures. Phys. Rev. Lett. 1994, 73, 1640–1643. [Google Scholar] [CrossRef]
- Fukai, Y.; Okuma, N. Evidence of Copious Vacancy Formation in Ni and Pd under a High Hydro gen Pressure. Jpn. J. Appl. Phys. A 1993, 32, 1256–1259. [Google Scholar] [CrossRef]
- Fukai, Y. Formation of Superabundant Vacancies in M–H Alloys and Some of Its Consequences: A Review. J. Alloys Compd. 2003, 356, 263–269. [Google Scholar] [CrossRef]
- You, D.; Ganorkar, S.; Joo, M.; Park, D.; Kim, S.; Kang, K.; Lee, D. Ab Initio Study of H, B, C, N, O, and Self-Interstitial Atoms in Hcp-Zr. J. Alloys Compd. 2019, 787, 631–637. [Google Scholar] [CrossRef]
- Selim, F.A. Positron annihilation spectroscopy of defects in nuclear irradiated materials—A review. Mater. Charact. 2022, 174, 110952. [Google Scholar] [CrossRef]
- Ziegler, J.F. The Stopping and Range of Ions in Solids, 2nd ed.; Academic Press: New York, NY, USA, 1988. [Google Scholar]
- Norgett, M.J.; Robinson, M.T.; Torrens, I.M. A proposed method of calculating displacement dose rates. Nucl. Eng. Des. 1975, 33, 50–54. [Google Scholar] [CrossRef]
- Griffiths, M. Displacement energies for Zr measured in a HVEM. J. Nucl. Mater. 1989, 165, 315–317. [Google Scholar] [CrossRef]
- Stoller, R.E.; Toloczko, M.B.; Was, G.S.; Certain, A.G.; Dwaraknath, S.; Garner, F.A. On the use of SRIM for computing radiation damage exposure. Nucl. Instrum. Methods Phys. Res. B 2013, 310, 75–80. [Google Scholar] [CrossRef]
- Kansy, J. Microcomputer program for analysis of positron annihilation lifetime spectra. Nucl. Instrum. Methods Phys. Res. A 1996, 374, 235–244. [Google Scholar] [CrossRef]
- Horodek, P. Application of Positron Annihilation Spectroscopy Techniques for the long Range Effect Detection. Acta Phys. Pol. A 2019, 136, 361–364. [Google Scholar] [CrossRef]
- Siemek, K.; Horodek, P.; Skuratov, V.; Waliszewski, J.; Sohatsky, A. Positron Annihilation studies of irradiation induced defects in nanostructured titanium. Vacuum 2021, 190, 110282. [Google Scholar] [CrossRef]
- Puska, M.J.; Nieminen, R.M. Theory of positrons in solids and on solid surfaces. Rev. Mod. Phys. 1994, 66, 841–899. [Google Scholar] [CrossRef]
- Robles, J.C.; Ogando, E.; Plazaola, F. Positron Lifetime Calculation of the Elements of the Periodic Table. J. Condens. Matter Phys. 2007, 19, 17622. [Google Scholar] [CrossRef]
- Shpotyuk, M.; Ingram, A. Characterization of radiation-induced effects in amorphous arsenic sulfides by positron annihilation lifetime spectroscopy. J. Mater. Res. 2015, 30, 1422–1429. [Google Scholar] [CrossRef]
- Vehanen, A.; Saarinen, K.; Hautojärvi, P.; Huomo, H. Profiling multilayer structures with monoenergetic positrons. Phys. Rev. B 1987, 35, 4606. [Google Scholar] [CrossRef]
- Maxwell, C.; Pencer, J.; Torres, E. Atomistic simulation study of clustering and evolution of irradiation induced defects in zirconium. J. Int. Mater. 2020, 531, 151979. [Google Scholar] [CrossRef]
- Christiaen, B.; Domain, C.; Thuinet, L.; Ambard, A.; Legris, A. Influence of vacancy diffusional anisotropy: Understanding the growth of zirconium alloys under irradiation and their microstructure evolution. Acta Mater. 2020, 195, 631–644. [Google Scholar] [CrossRef]
- Van Veen, A.; Schut, H.; Clement, M.; de Nijs, J.; Kruseman, A.; Ijpma, M. VEPFIT applied to depth profiling problems. Appl. Surf. Sci. 1995, 85, 216–224. [Google Scholar] [CrossRef]
- Paulin, R.; Ripon, R.; Brandt, W. Diffusion constant and surface states of positrons in metals. Appl. Phys. 1974, 4, 343–347. [Google Scholar] [CrossRef]
- Malvern Pananalytical. Available online: https://www.malvernpanalytical.com/ (accessed on 17 April 2023).
- Bespalov, I.; Datler, M.; Buhr, S.; Drachsel, W.; Rupprechter, G.; Suchorski, Y. Initial stages of oxide formation on the Zr surface at low oxygen pressure: An in situ FIM and XPS study. Ultramicroscopy 2015, 159, 147–151. [Google Scholar] [CrossRef] [PubMed]
- Lyapin, A.; Jeurgens, L.P.H.; Mittemeijer, E.J. Effect on temperature on the initial, thermal oxidation of zirconium. Acta Mater. 2005, 53, 2925–2935. [Google Scholar] [CrossRef]
- Chang, Y.-Q.; Guo, Q.; Zhang, J.; Chen, L.; Long, Y.; Wan, F.-R. Irradiation effects on nanocrystalline materials. Front. Mater. Sci. 2013, 7, 143–155. [Google Scholar] [CrossRef]
- Mohamed, W.; Miller, B.; Porter, D.; Murty, K. The role of grain size on neutron irradiation response of nanocrystalline copper. Materials 2016, 9, 144. [Google Scholar] [CrossRef]
- Czerski, K.; Huke, A.; Martin, L.; Targosz, N.; Blauth, D.; Górska, A.; Heide, P.; Winter, H. Measurements of enhanced electron screening in d+d reactions under UHV conditions. J. Phys. B 2008, 35, 014012. [Google Scholar] [CrossRef]


| Target | Reference | D2+ | D2+ + C15 | D2+ + C16 | D2+ + O15 | D2+ + O16 |
|---|---|---|---|---|---|---|
| Thickness of defected the layer [nm] | - | 504 ± 42 | 572 ± 50 | 530 ± 48 | 576 ± 60 | 541 ± 57 |
| L+ [nm] | 19 ± 4 | 9 ± 3 | 10 ± 3 | 10 ± 3 | 10 ± 3 | 11 ± 3 |
Disclaimer/Publisher’s Note: The statements, opinions and data contained in all publications are solely those of the individual author(s) and contributor(s) and not of MDPI and/or the editor(s). MDPI and/or the editor(s) disclaim responsibility for any injury to people or property resulting from any ideas, methods, instructions or products referred to in the content. |
© 2023 by the authors. Licensee MDPI, Basel, Switzerland. This article is an open access article distributed under the terms and conditions of the Creative Commons Attribution (CC BY) license (https://creativecommons.org/licenses/by/4.0/).
Share and Cite
Kowalska, A.; Czerski, K.; Horodek, P.; Siemek, K.; Kaczmarski, M.; Targosz-Ślęczka, N.; Valat, M.; Dubey, R.; Pyszniak, K.; Turek, M.; et al. Crystal Lattice Defects in Deuterated Zr in Presence of O and C Impurities Studied by PAS and XRD for Electron Screening Effect. Materials 2023, 16, 6255. https://doi.org/10.3390/ma16186255
Kowalska A, Czerski K, Horodek P, Siemek K, Kaczmarski M, Targosz-Ślęczka N, Valat M, Dubey R, Pyszniak K, Turek M, et al. Crystal Lattice Defects in Deuterated Zr in Presence of O and C Impurities Studied by PAS and XRD for Electron Screening Effect. Materials. 2023; 16(18):6255. https://doi.org/10.3390/ma16186255
Chicago/Turabian StyleKowalska, Agata, Konrad Czerski, Paweł Horodek, Krzysztof Siemek, Mateusz Kaczmarski, Natalia Targosz-Ślęczka, Mathieu Valat, Rakesh Dubey, Krzysztof Pyszniak, Marcin Turek, and et al. 2023. "Crystal Lattice Defects in Deuterated Zr in Presence of O and C Impurities Studied by PAS and XRD for Electron Screening Effect" Materials 16, no. 18: 6255. https://doi.org/10.3390/ma16186255
APA StyleKowalska, A., Czerski, K., Horodek, P., Siemek, K., Kaczmarski, M., Targosz-Ślęczka, N., Valat, M., Dubey, R., Pyszniak, K., Turek, M., Droździel, A., Słowik, J., & Baranowska, J. (2023). Crystal Lattice Defects in Deuterated Zr in Presence of O and C Impurities Studied by PAS and XRD for Electron Screening Effect. Materials, 16(18), 6255. https://doi.org/10.3390/ma16186255