


Influence of Preheating Temperature on the Microstructure and Mechanical Properties of 6061/TA1 Composite Plates Fabricated by AFSD


Abstract
:1. Introduction
2. Experimental Section
3. Results
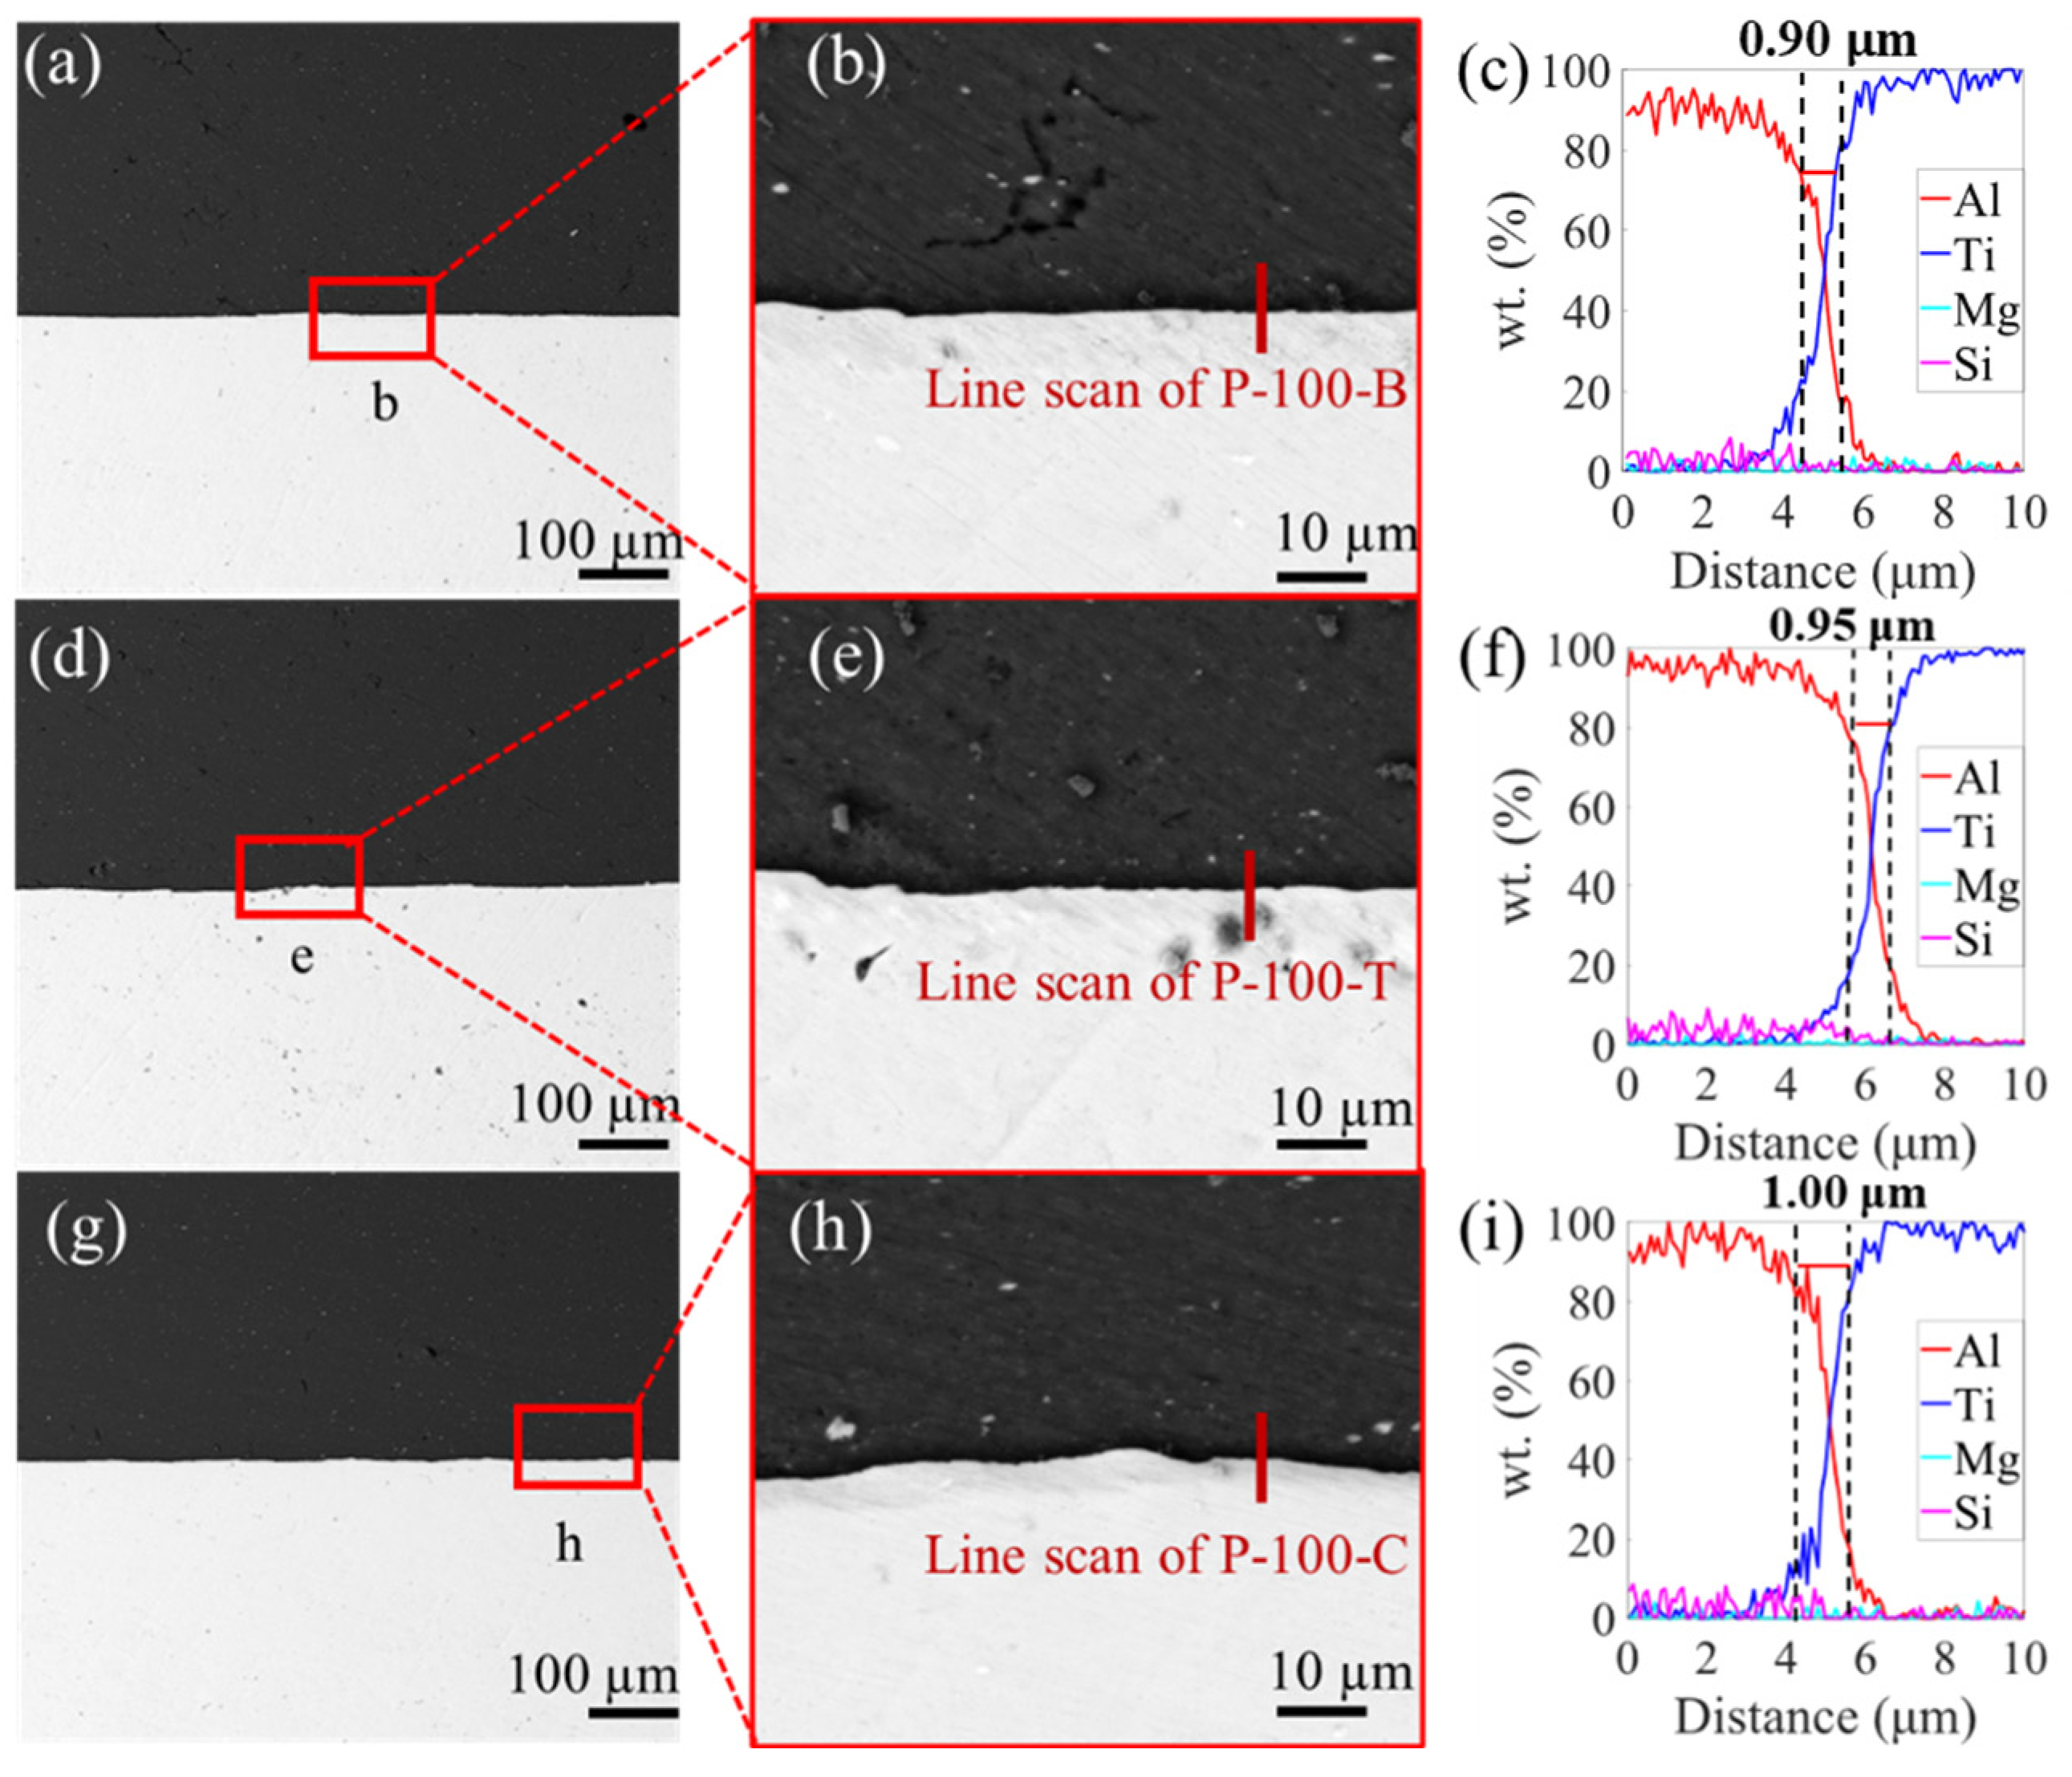
3.1. Microstructure
3.2. Mechanical Behavior
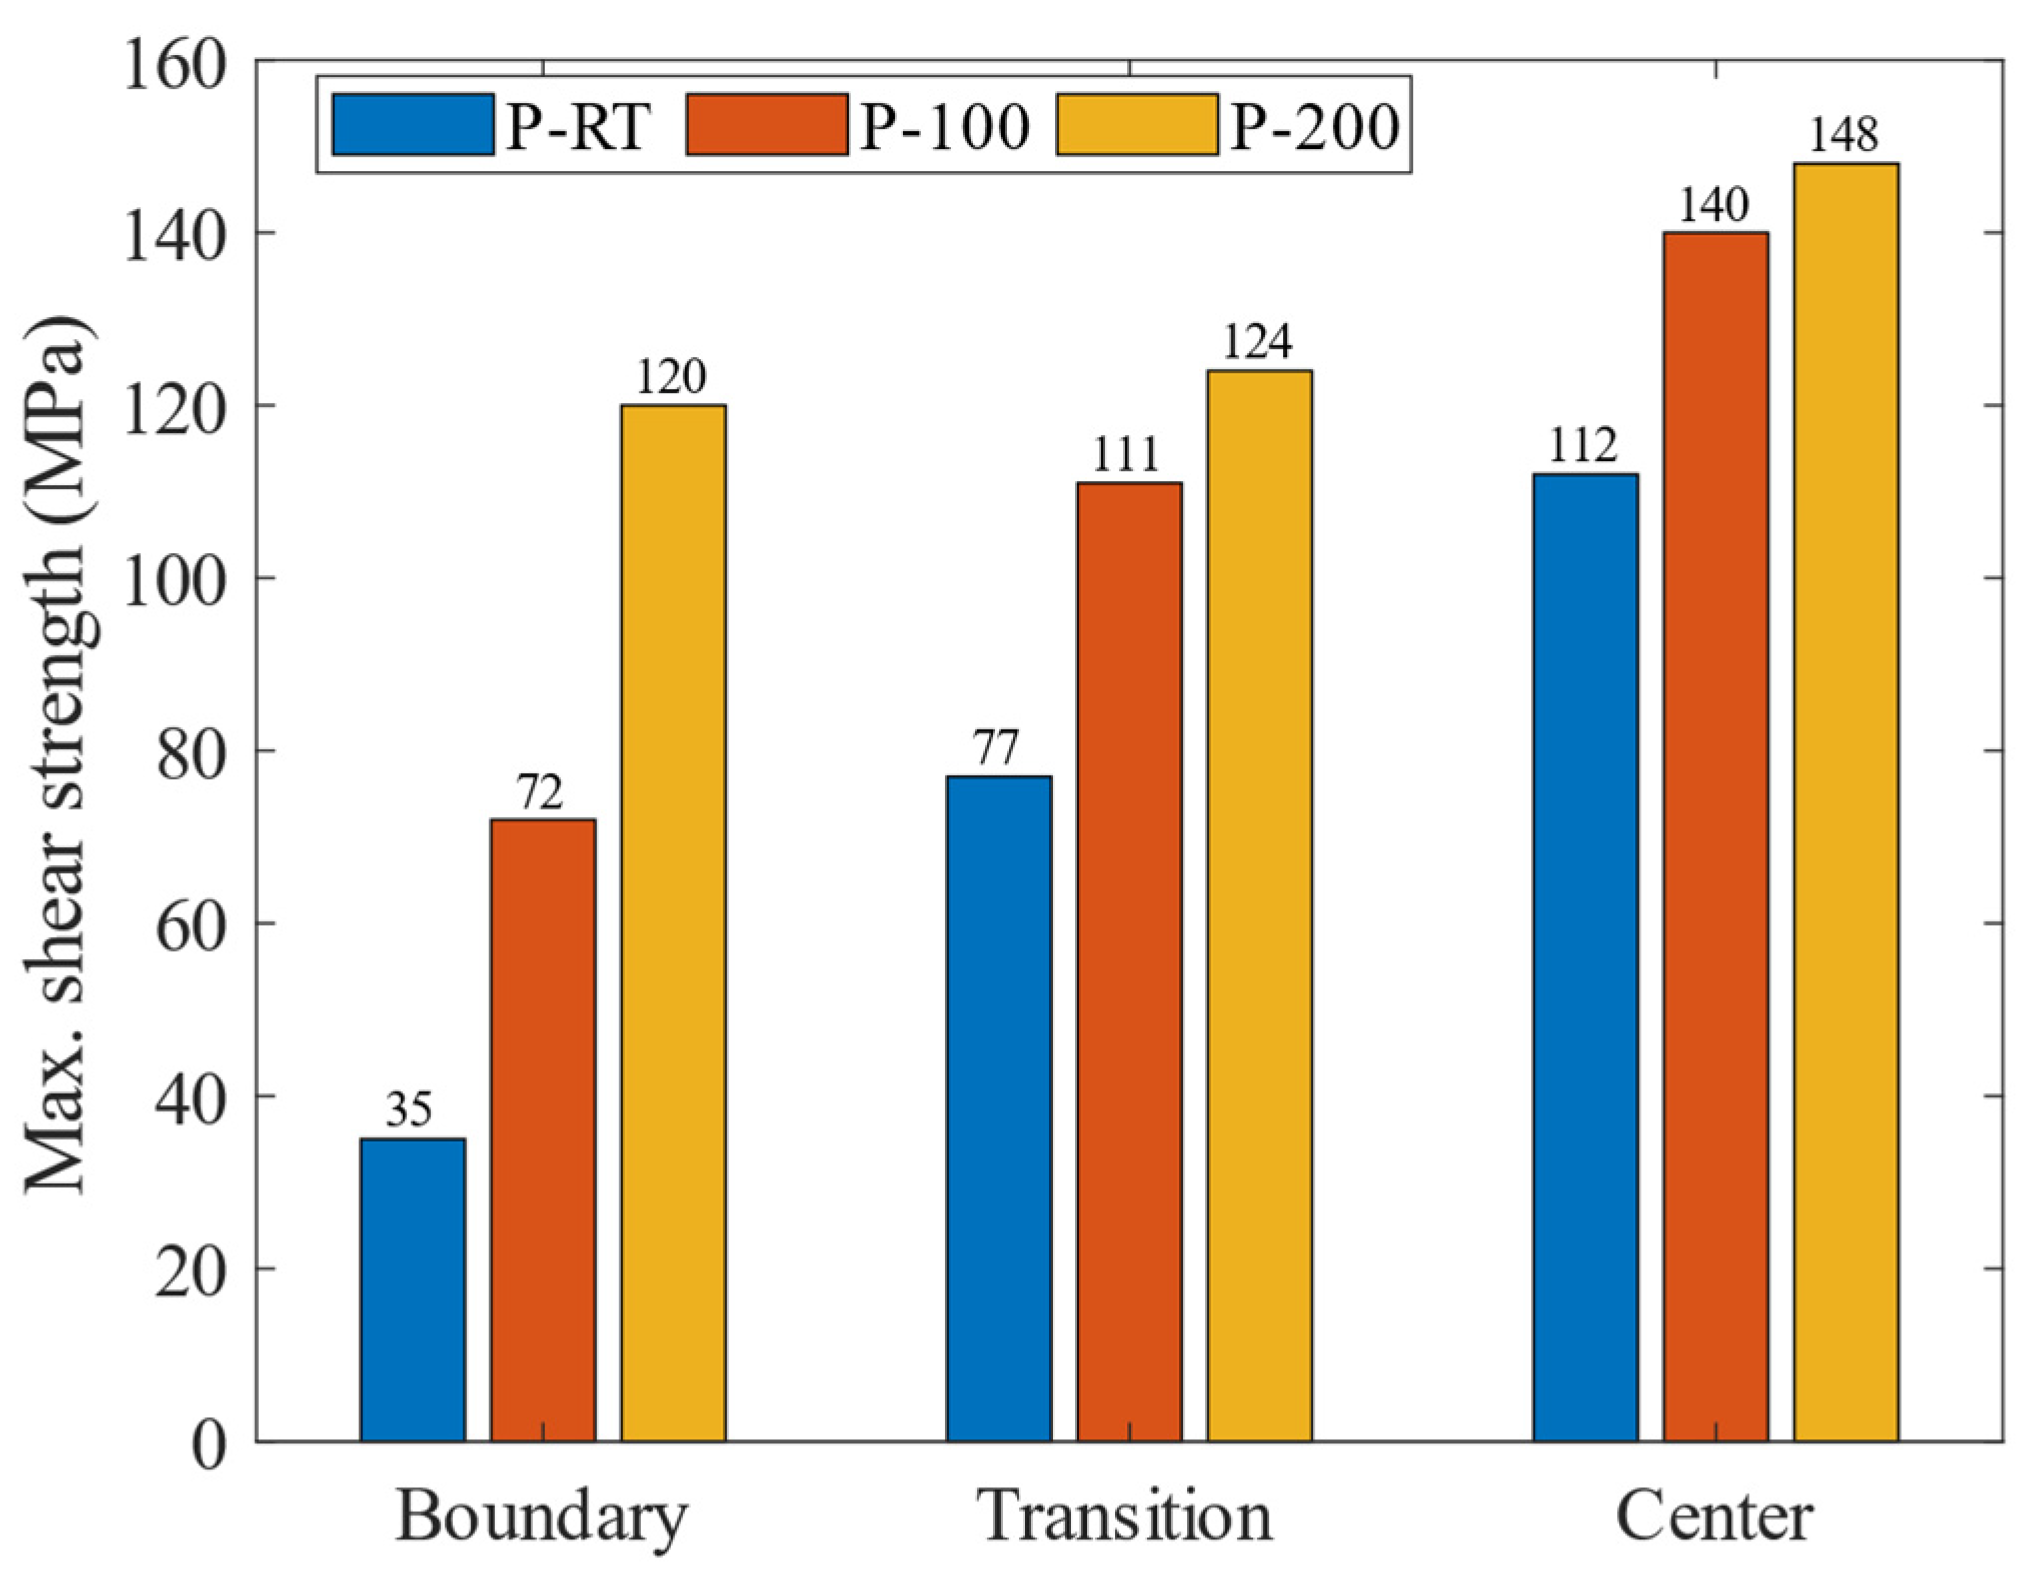
3.2.1. Bonding Strength
3.2.2. Three-Points Bending
3.2.3. Microhardness
4. Discussion
4.1. Temperature Field Simulation
4.2. Correlation among Preheating Temperature, Microstructure, and Mechanical Strength
5. Conclusions
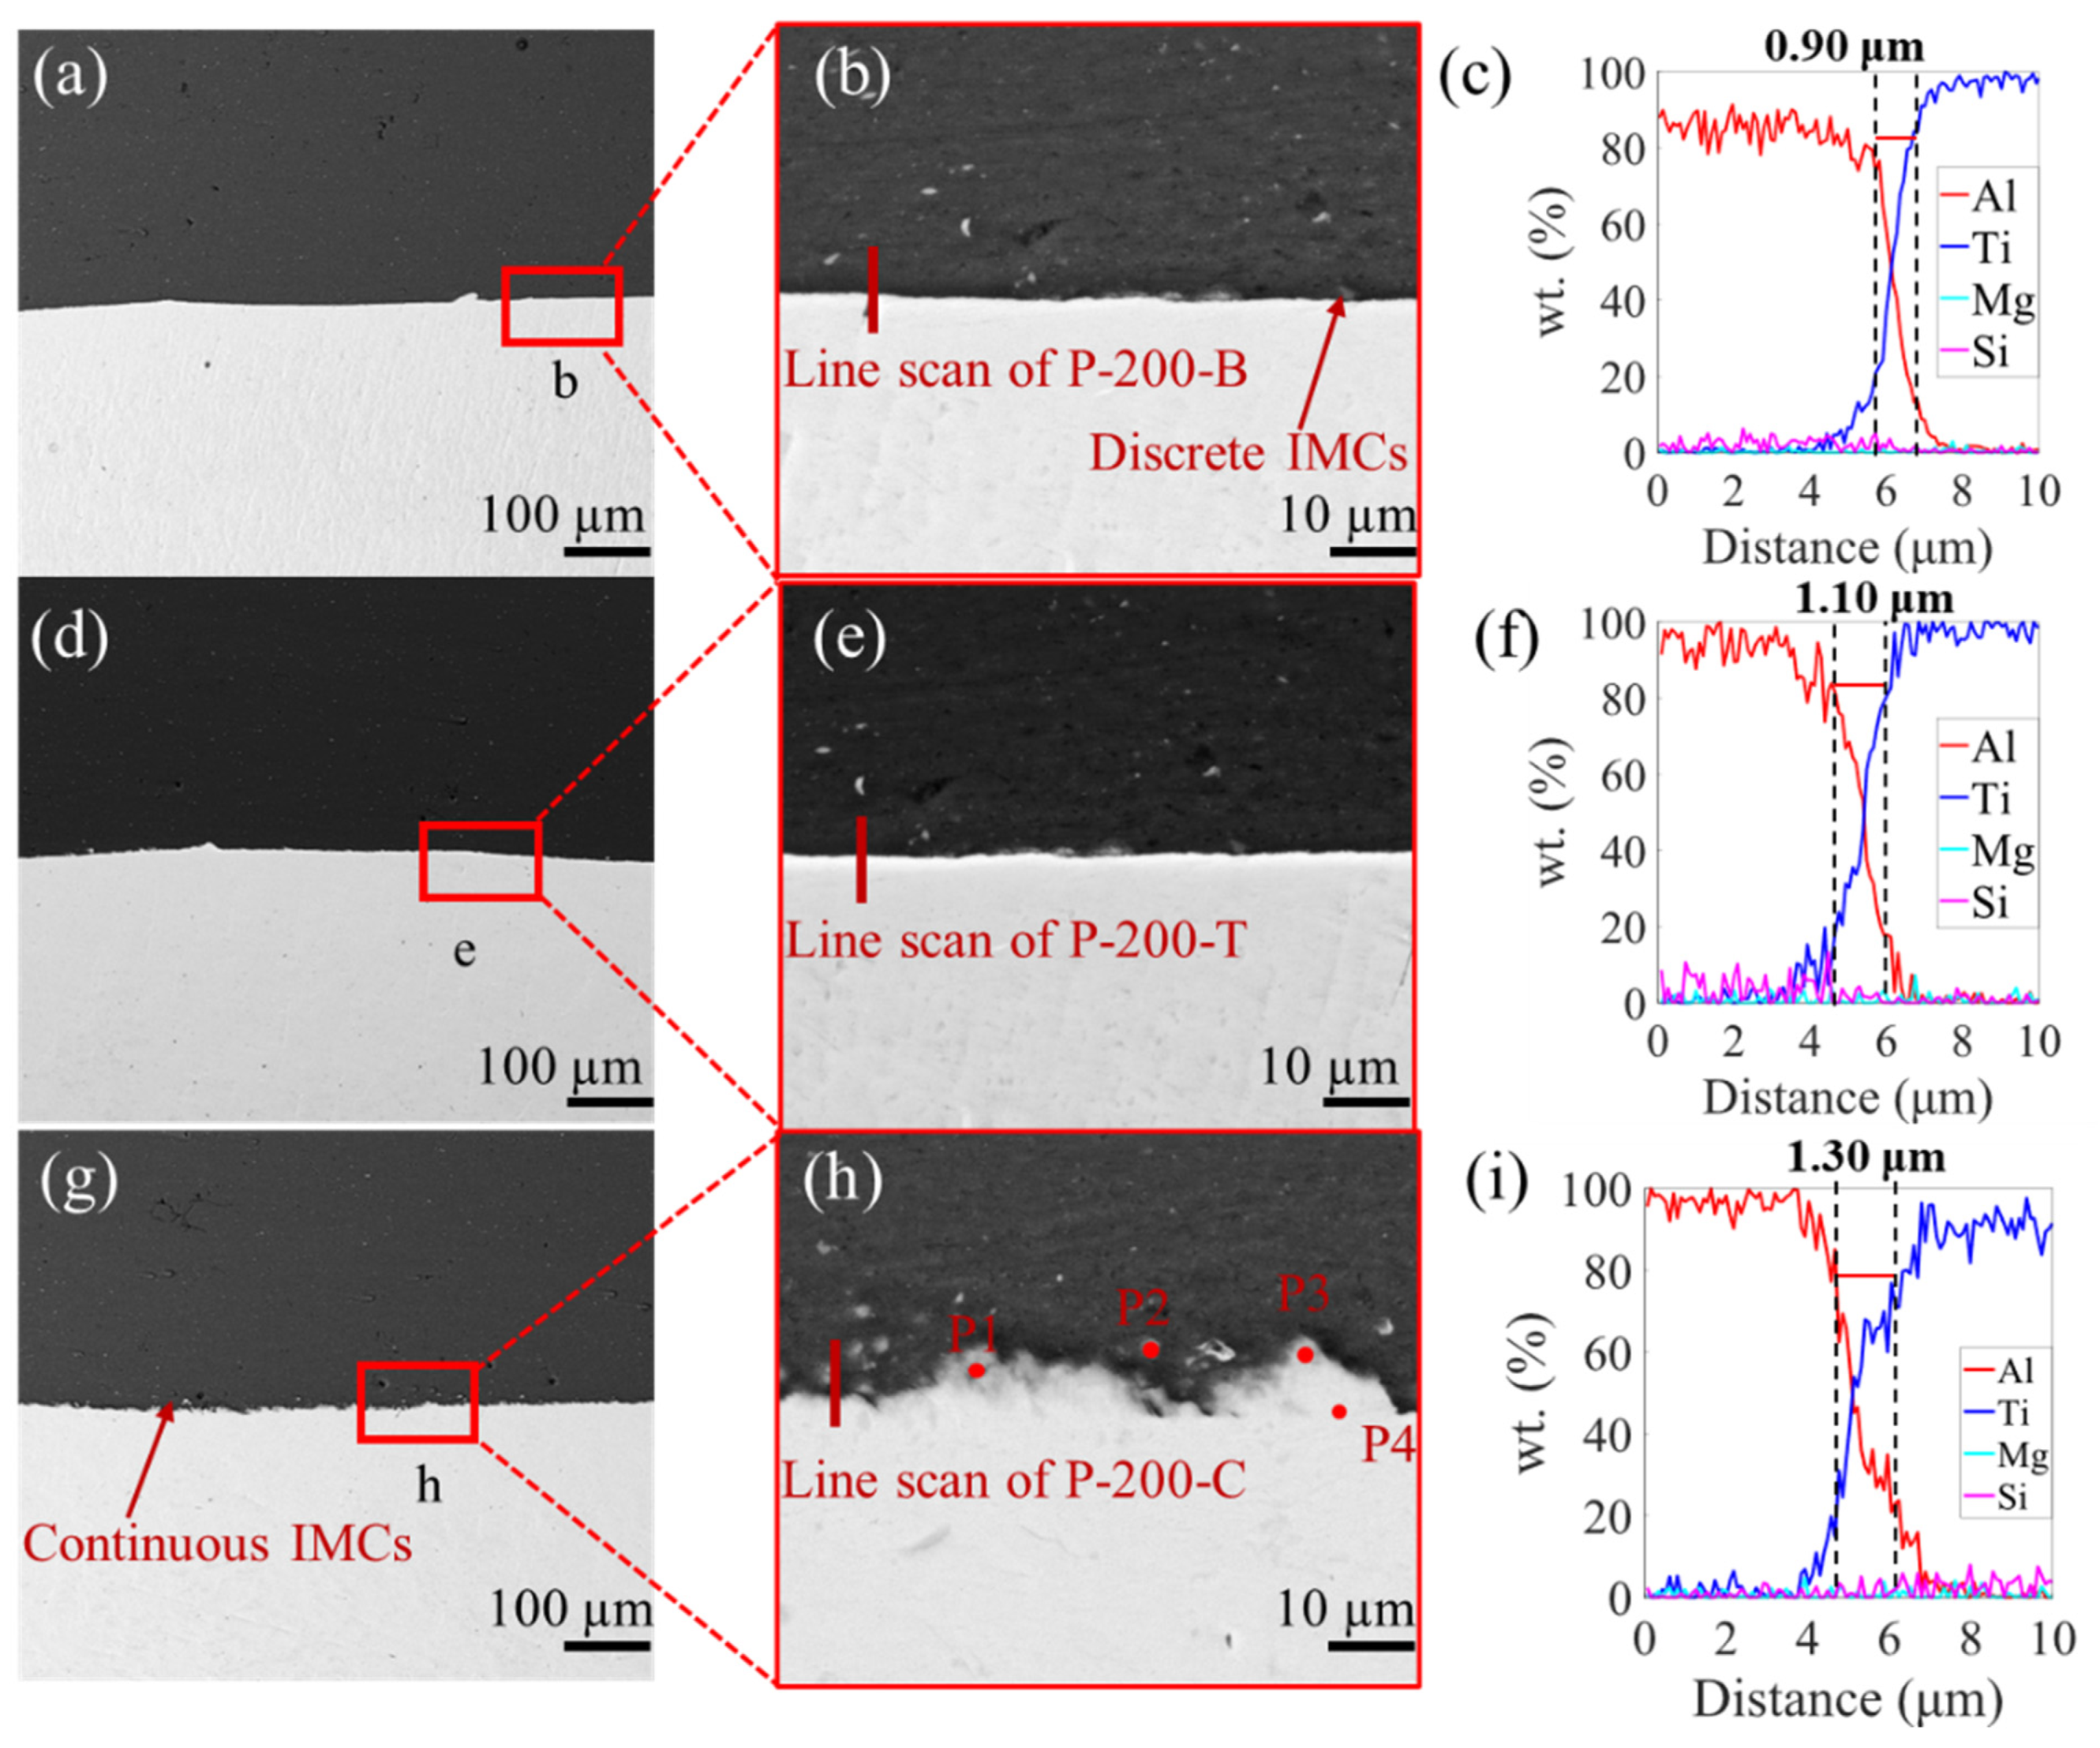
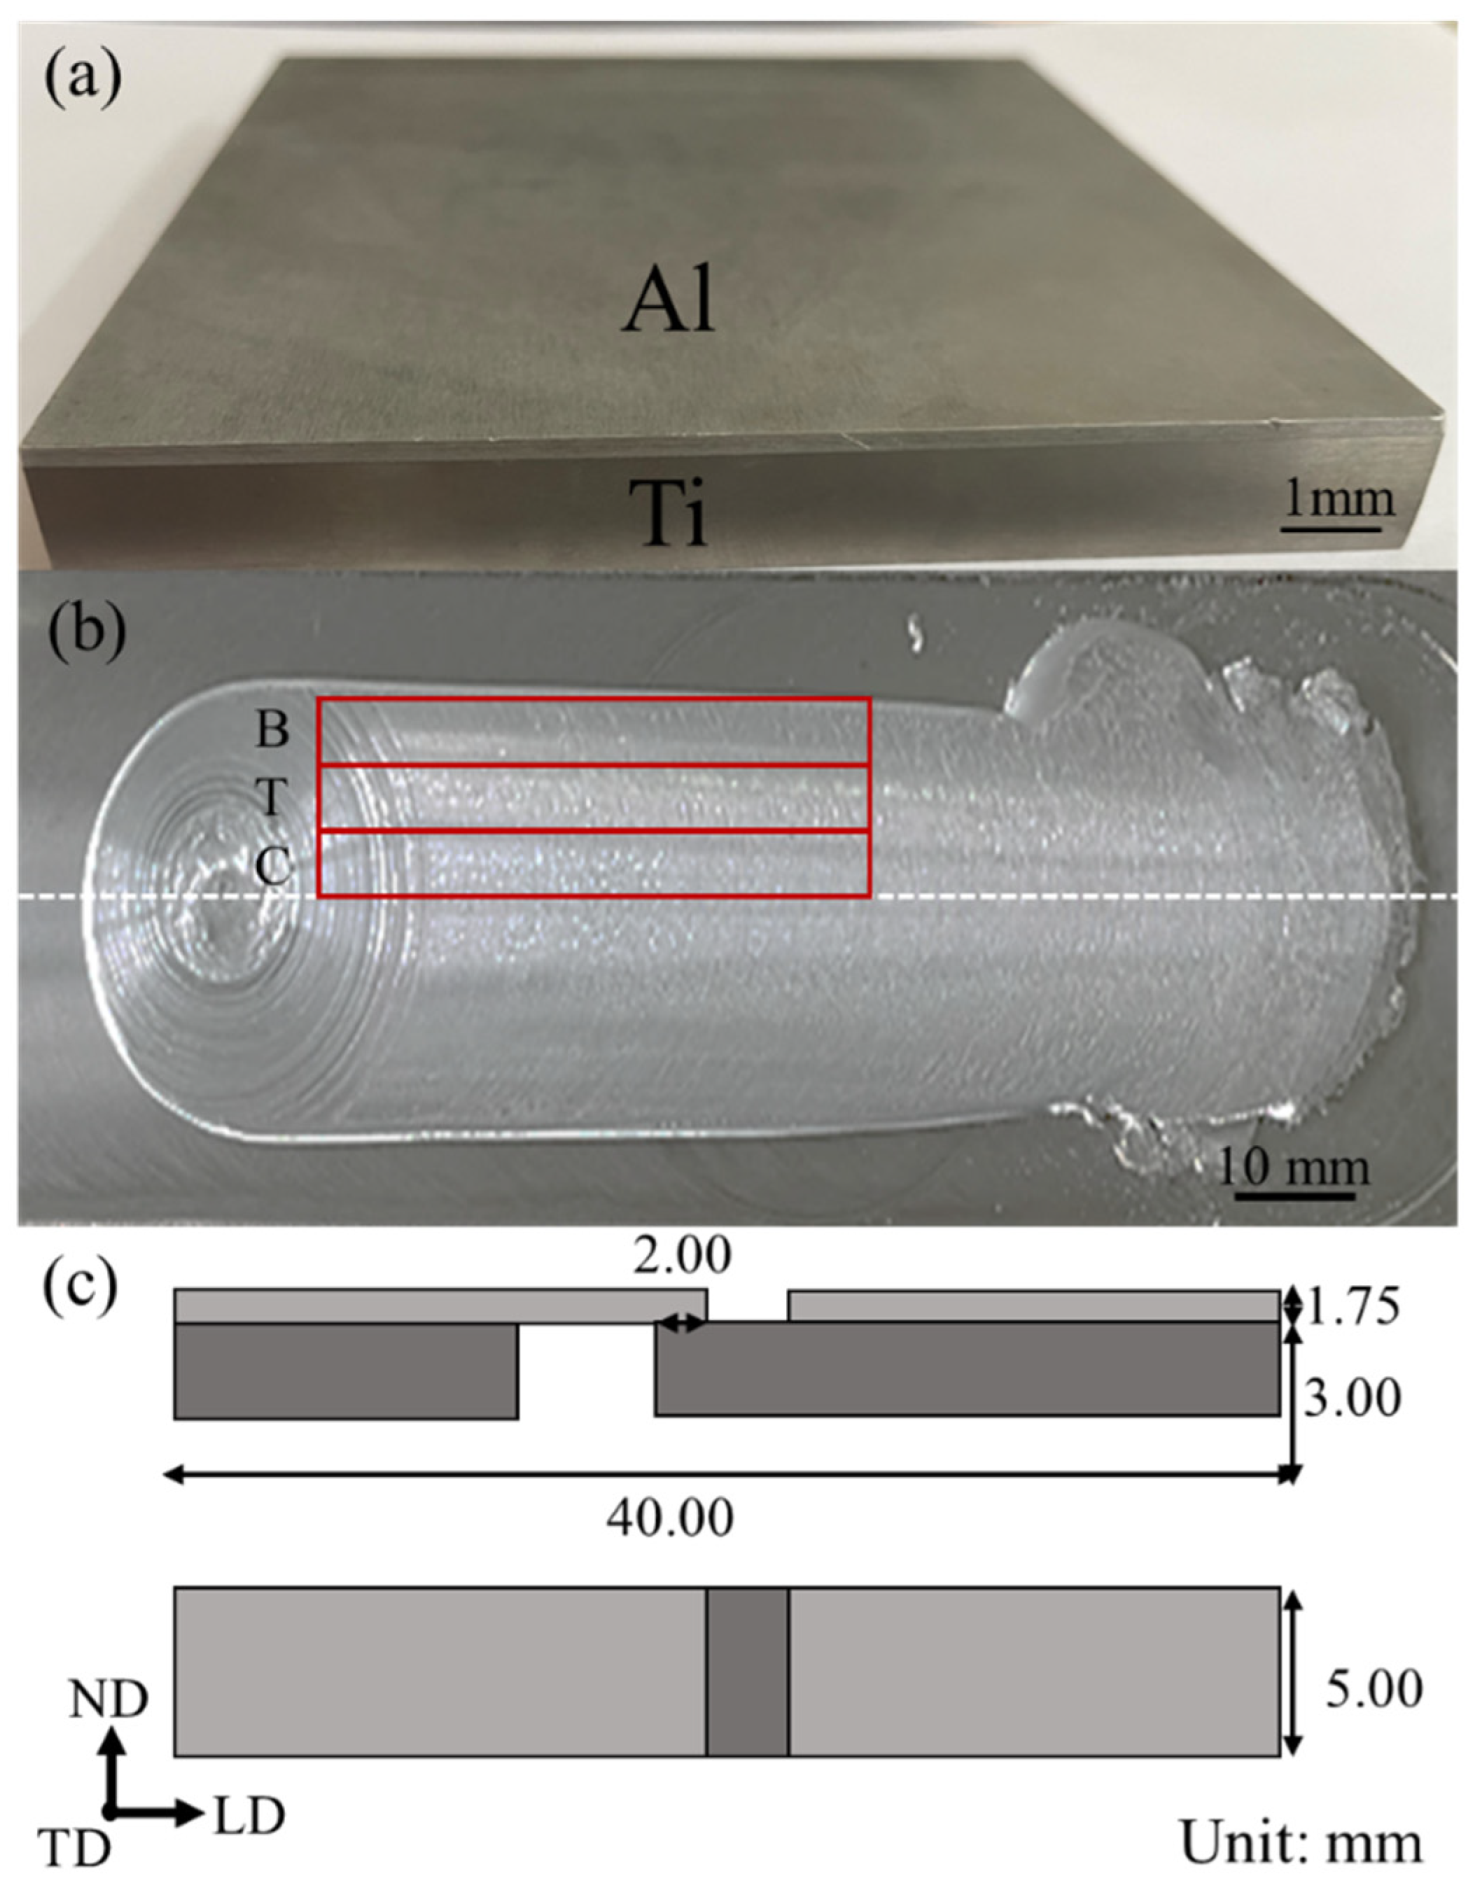
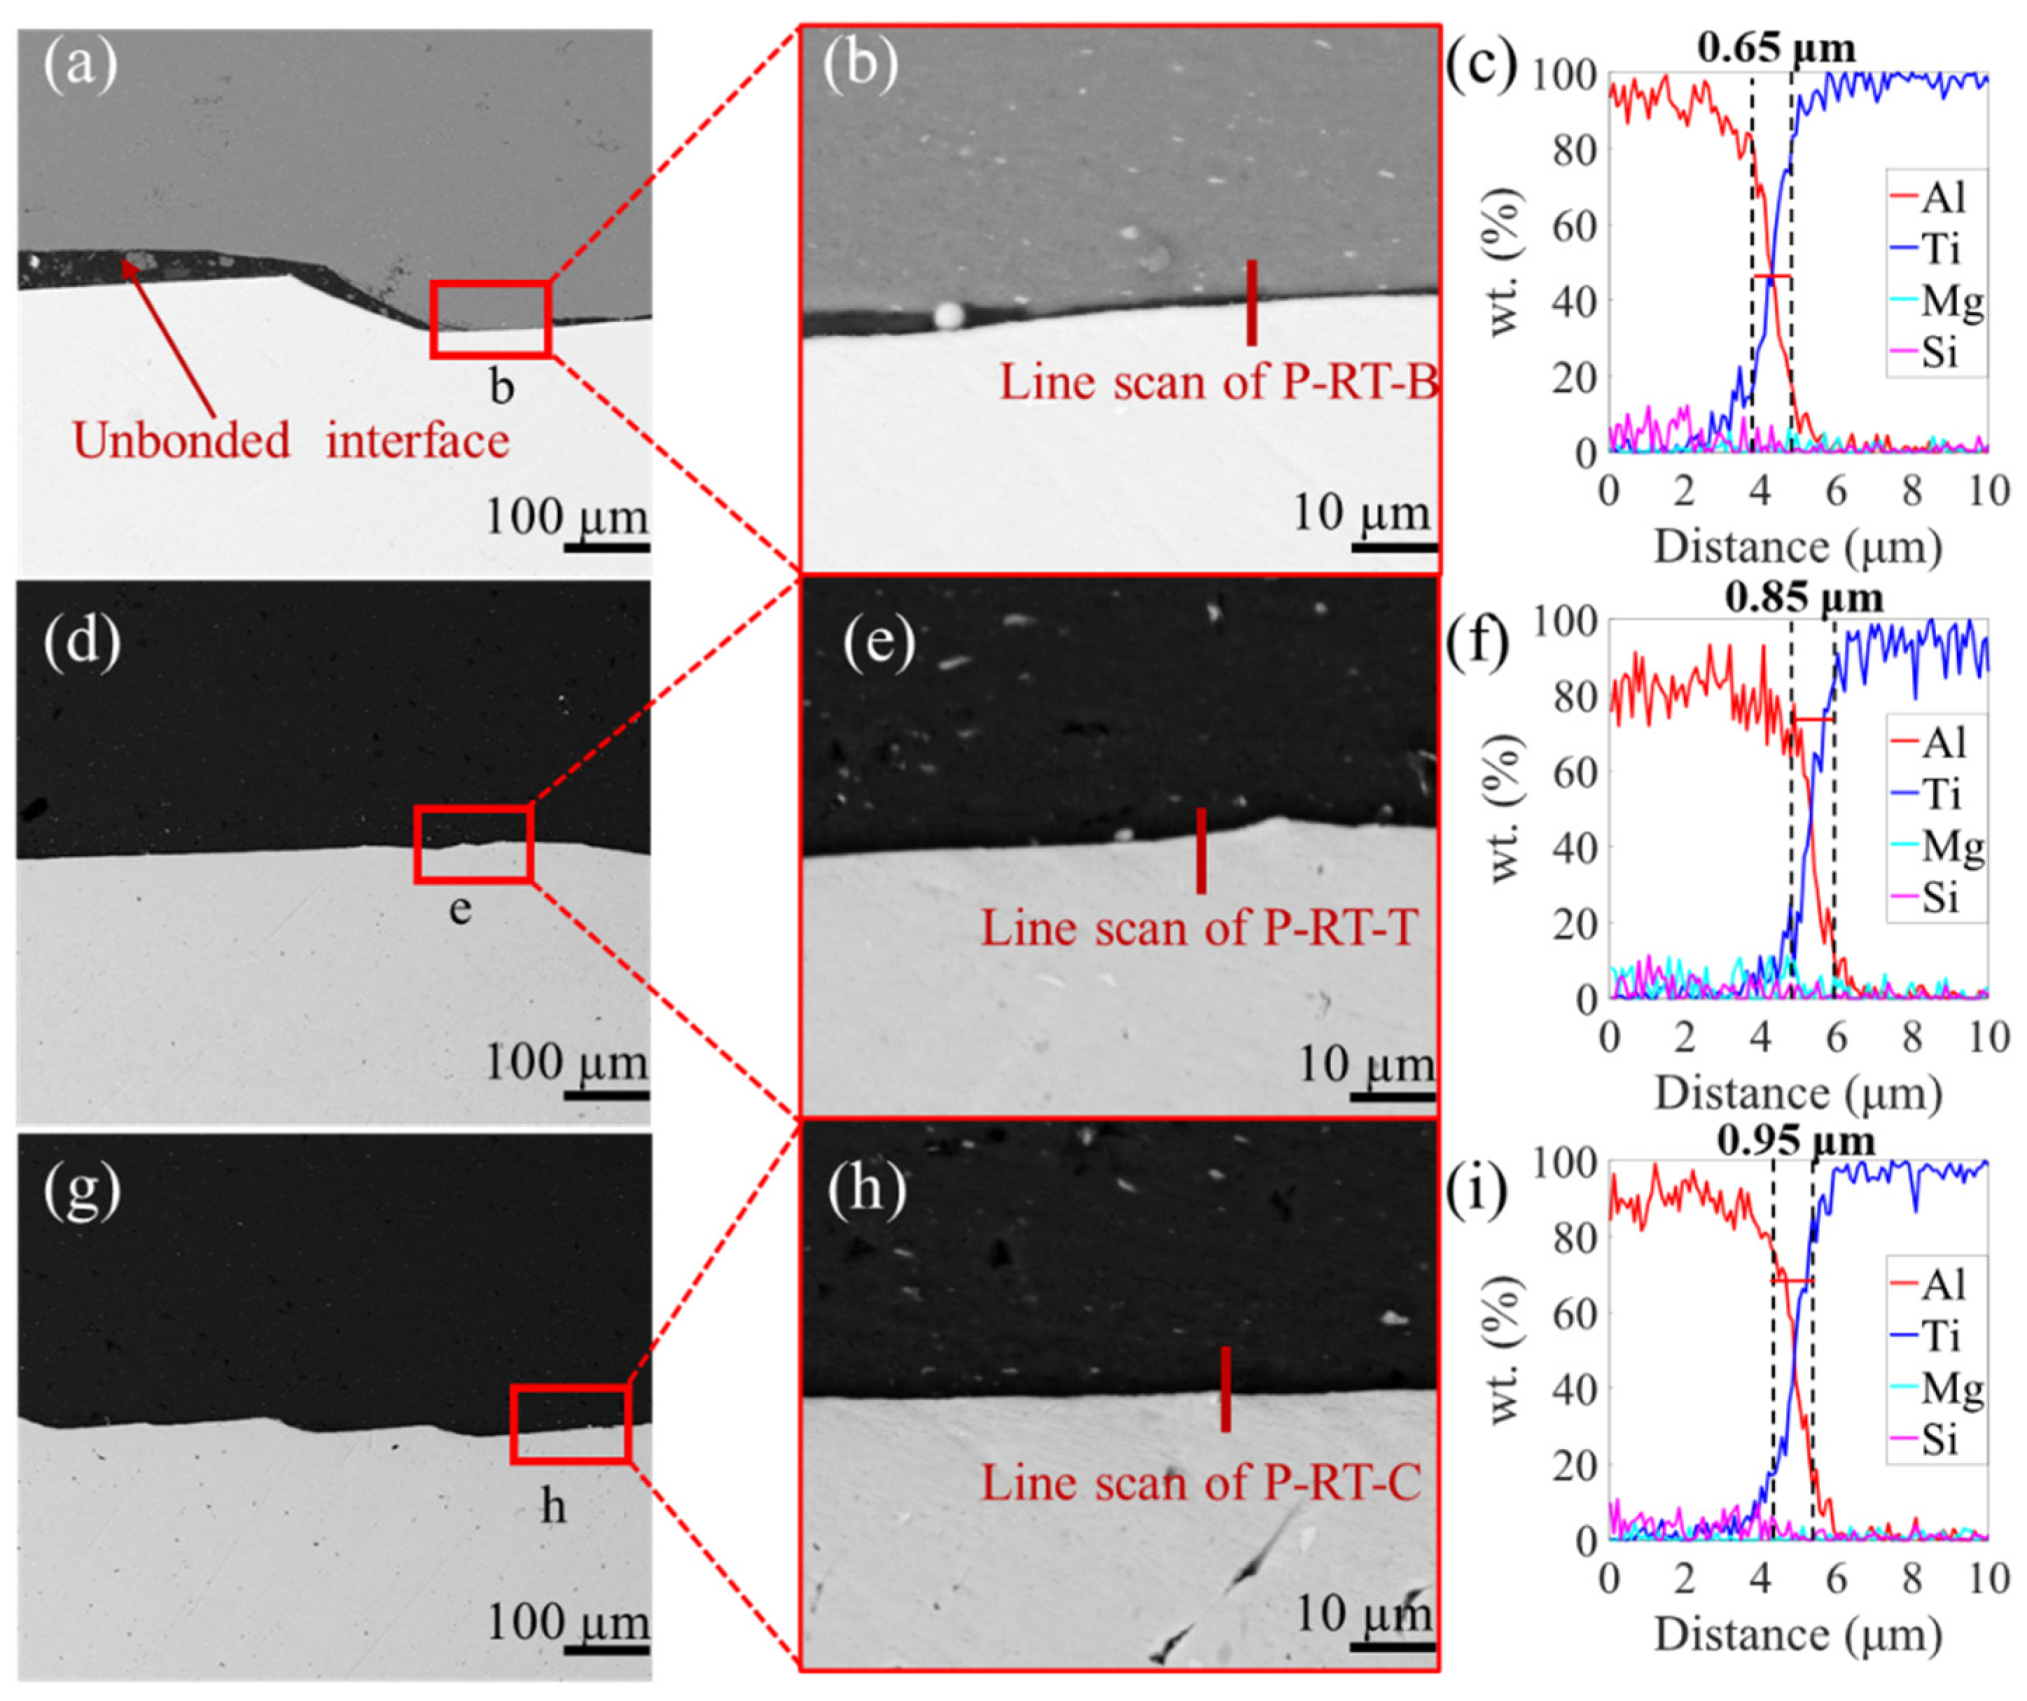
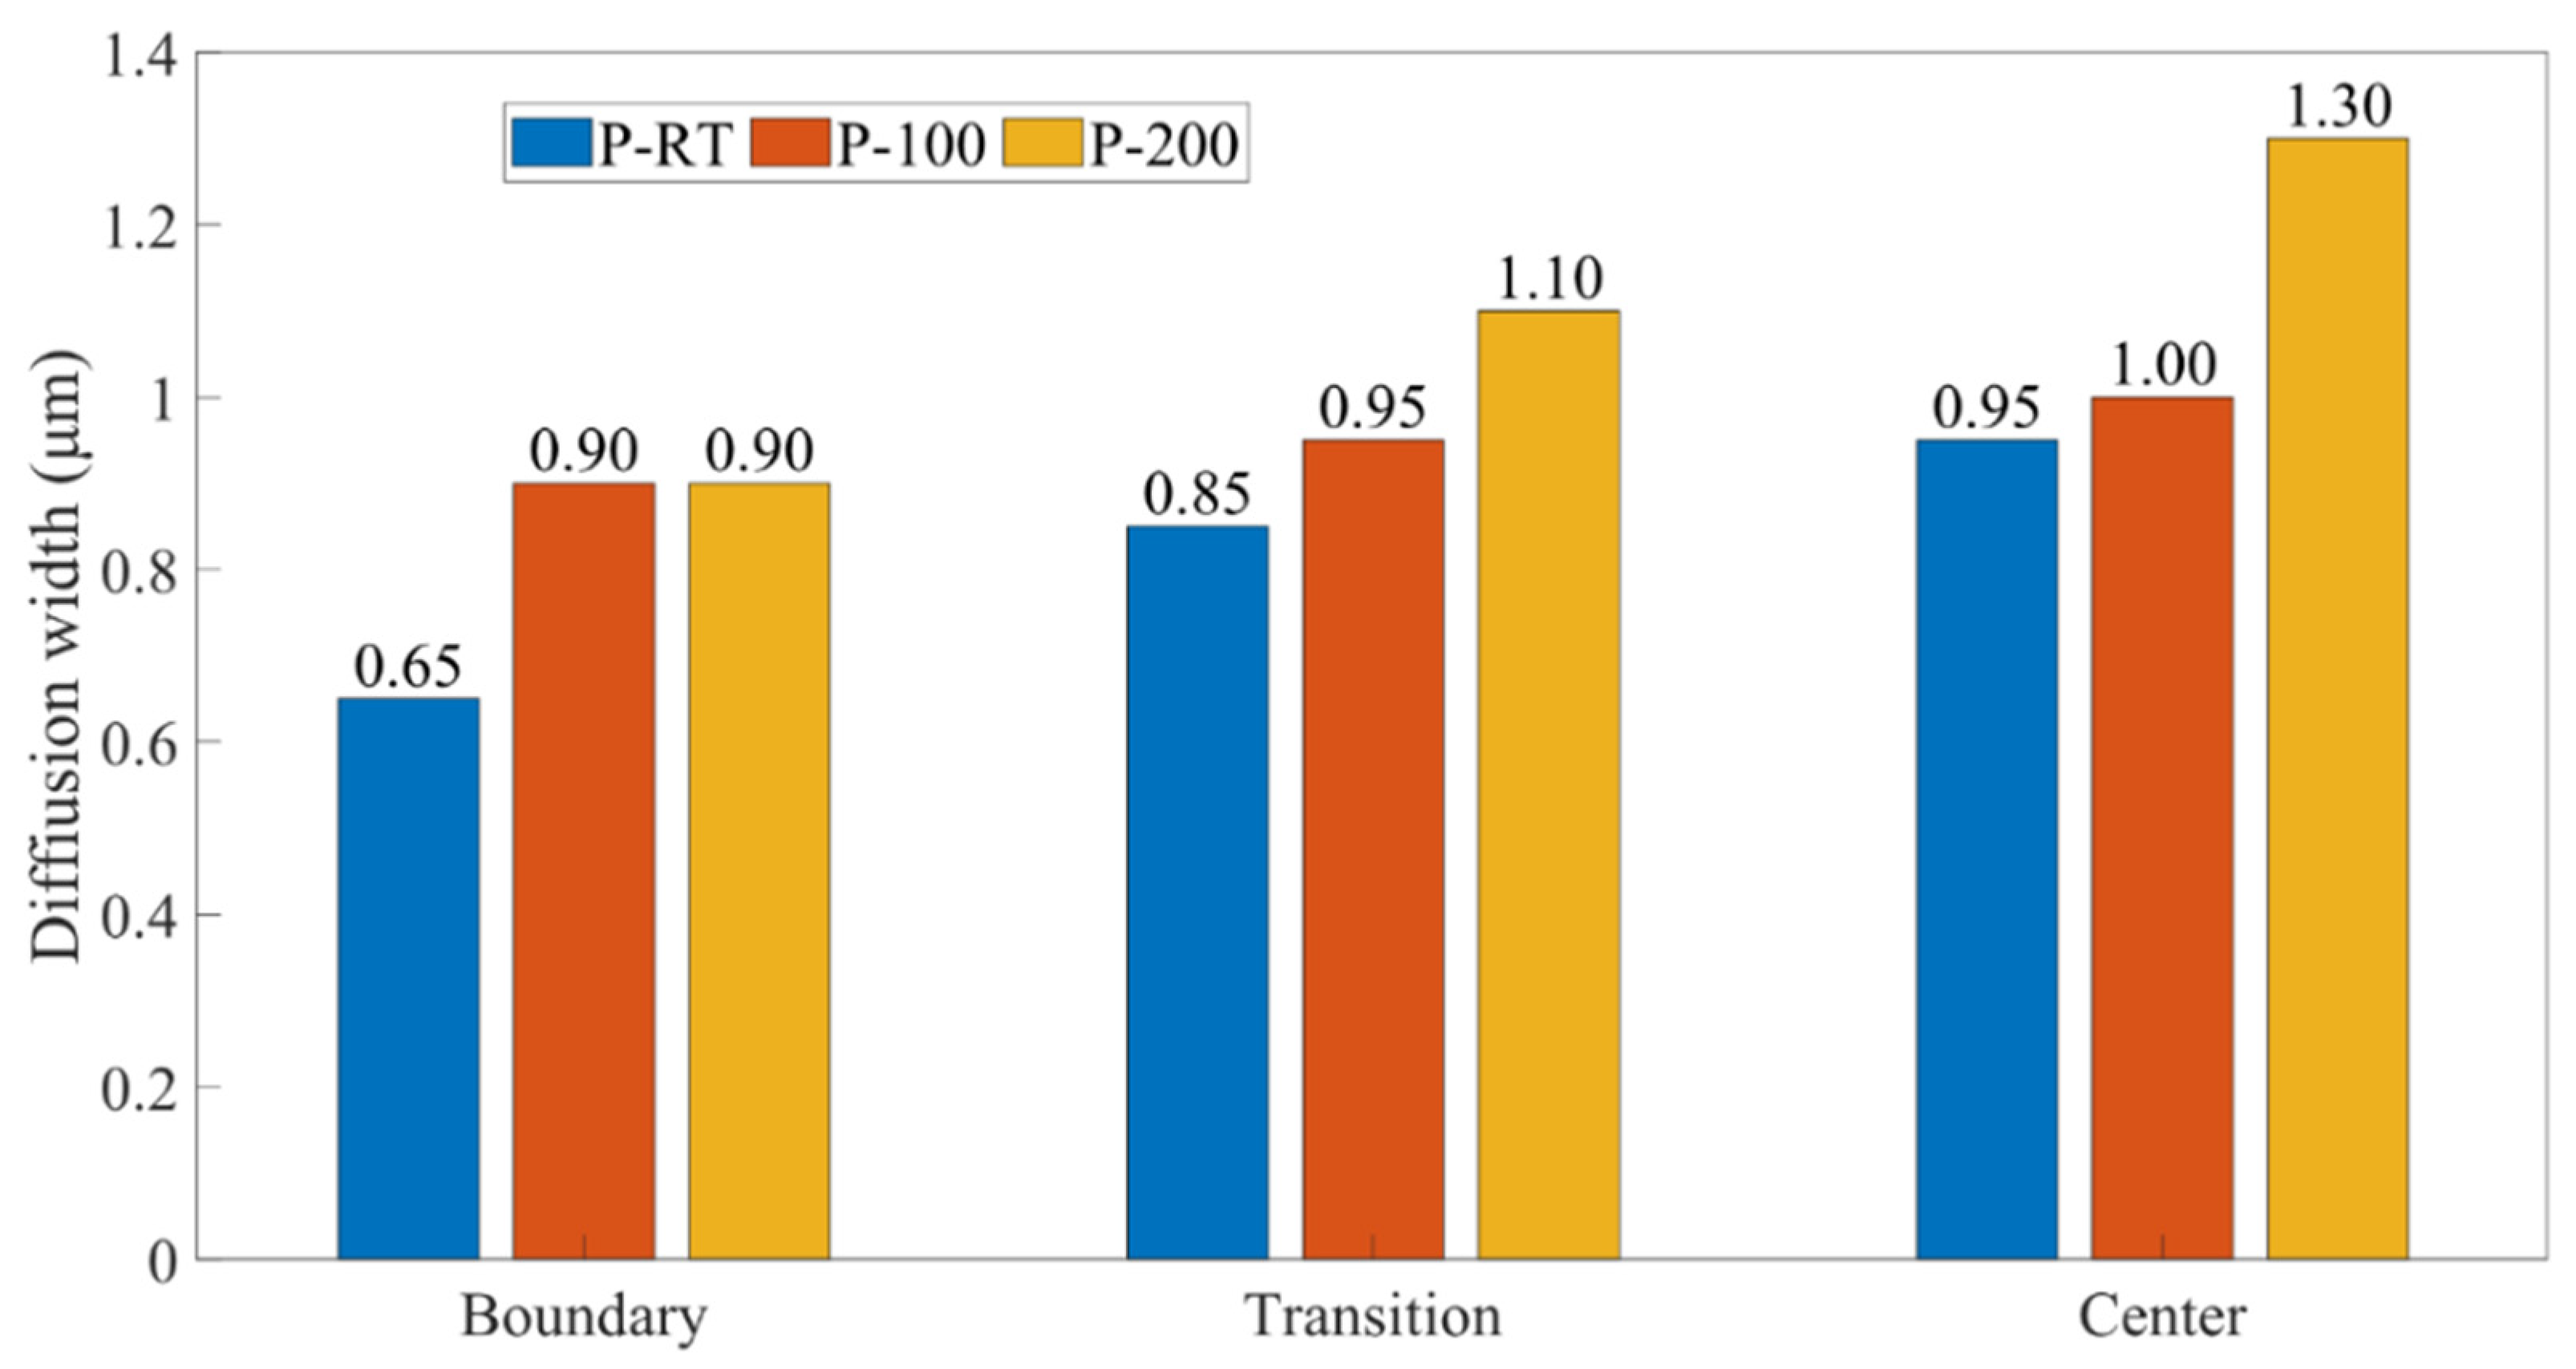
- Both the diffusion width of the Al/Ti interface and the resultant bonding shear strength increase with the increase in the preheating temperature, and also as the zone progresses from the boundary to the center of the deposit. And, the center sample prepared at the preheating temperature of 200 °C exhibits the largest diffusion width as well as the highest bonding strength. A positive correlation between the diffusion width of the interface and the bonding shear strength is found.
- In terms of the bonding mechanism, in P-RT, it is the mechanical bonding in the boundary zone that dominates, while in the other samples, the combined mechanical and metallurgy bonding dominates.
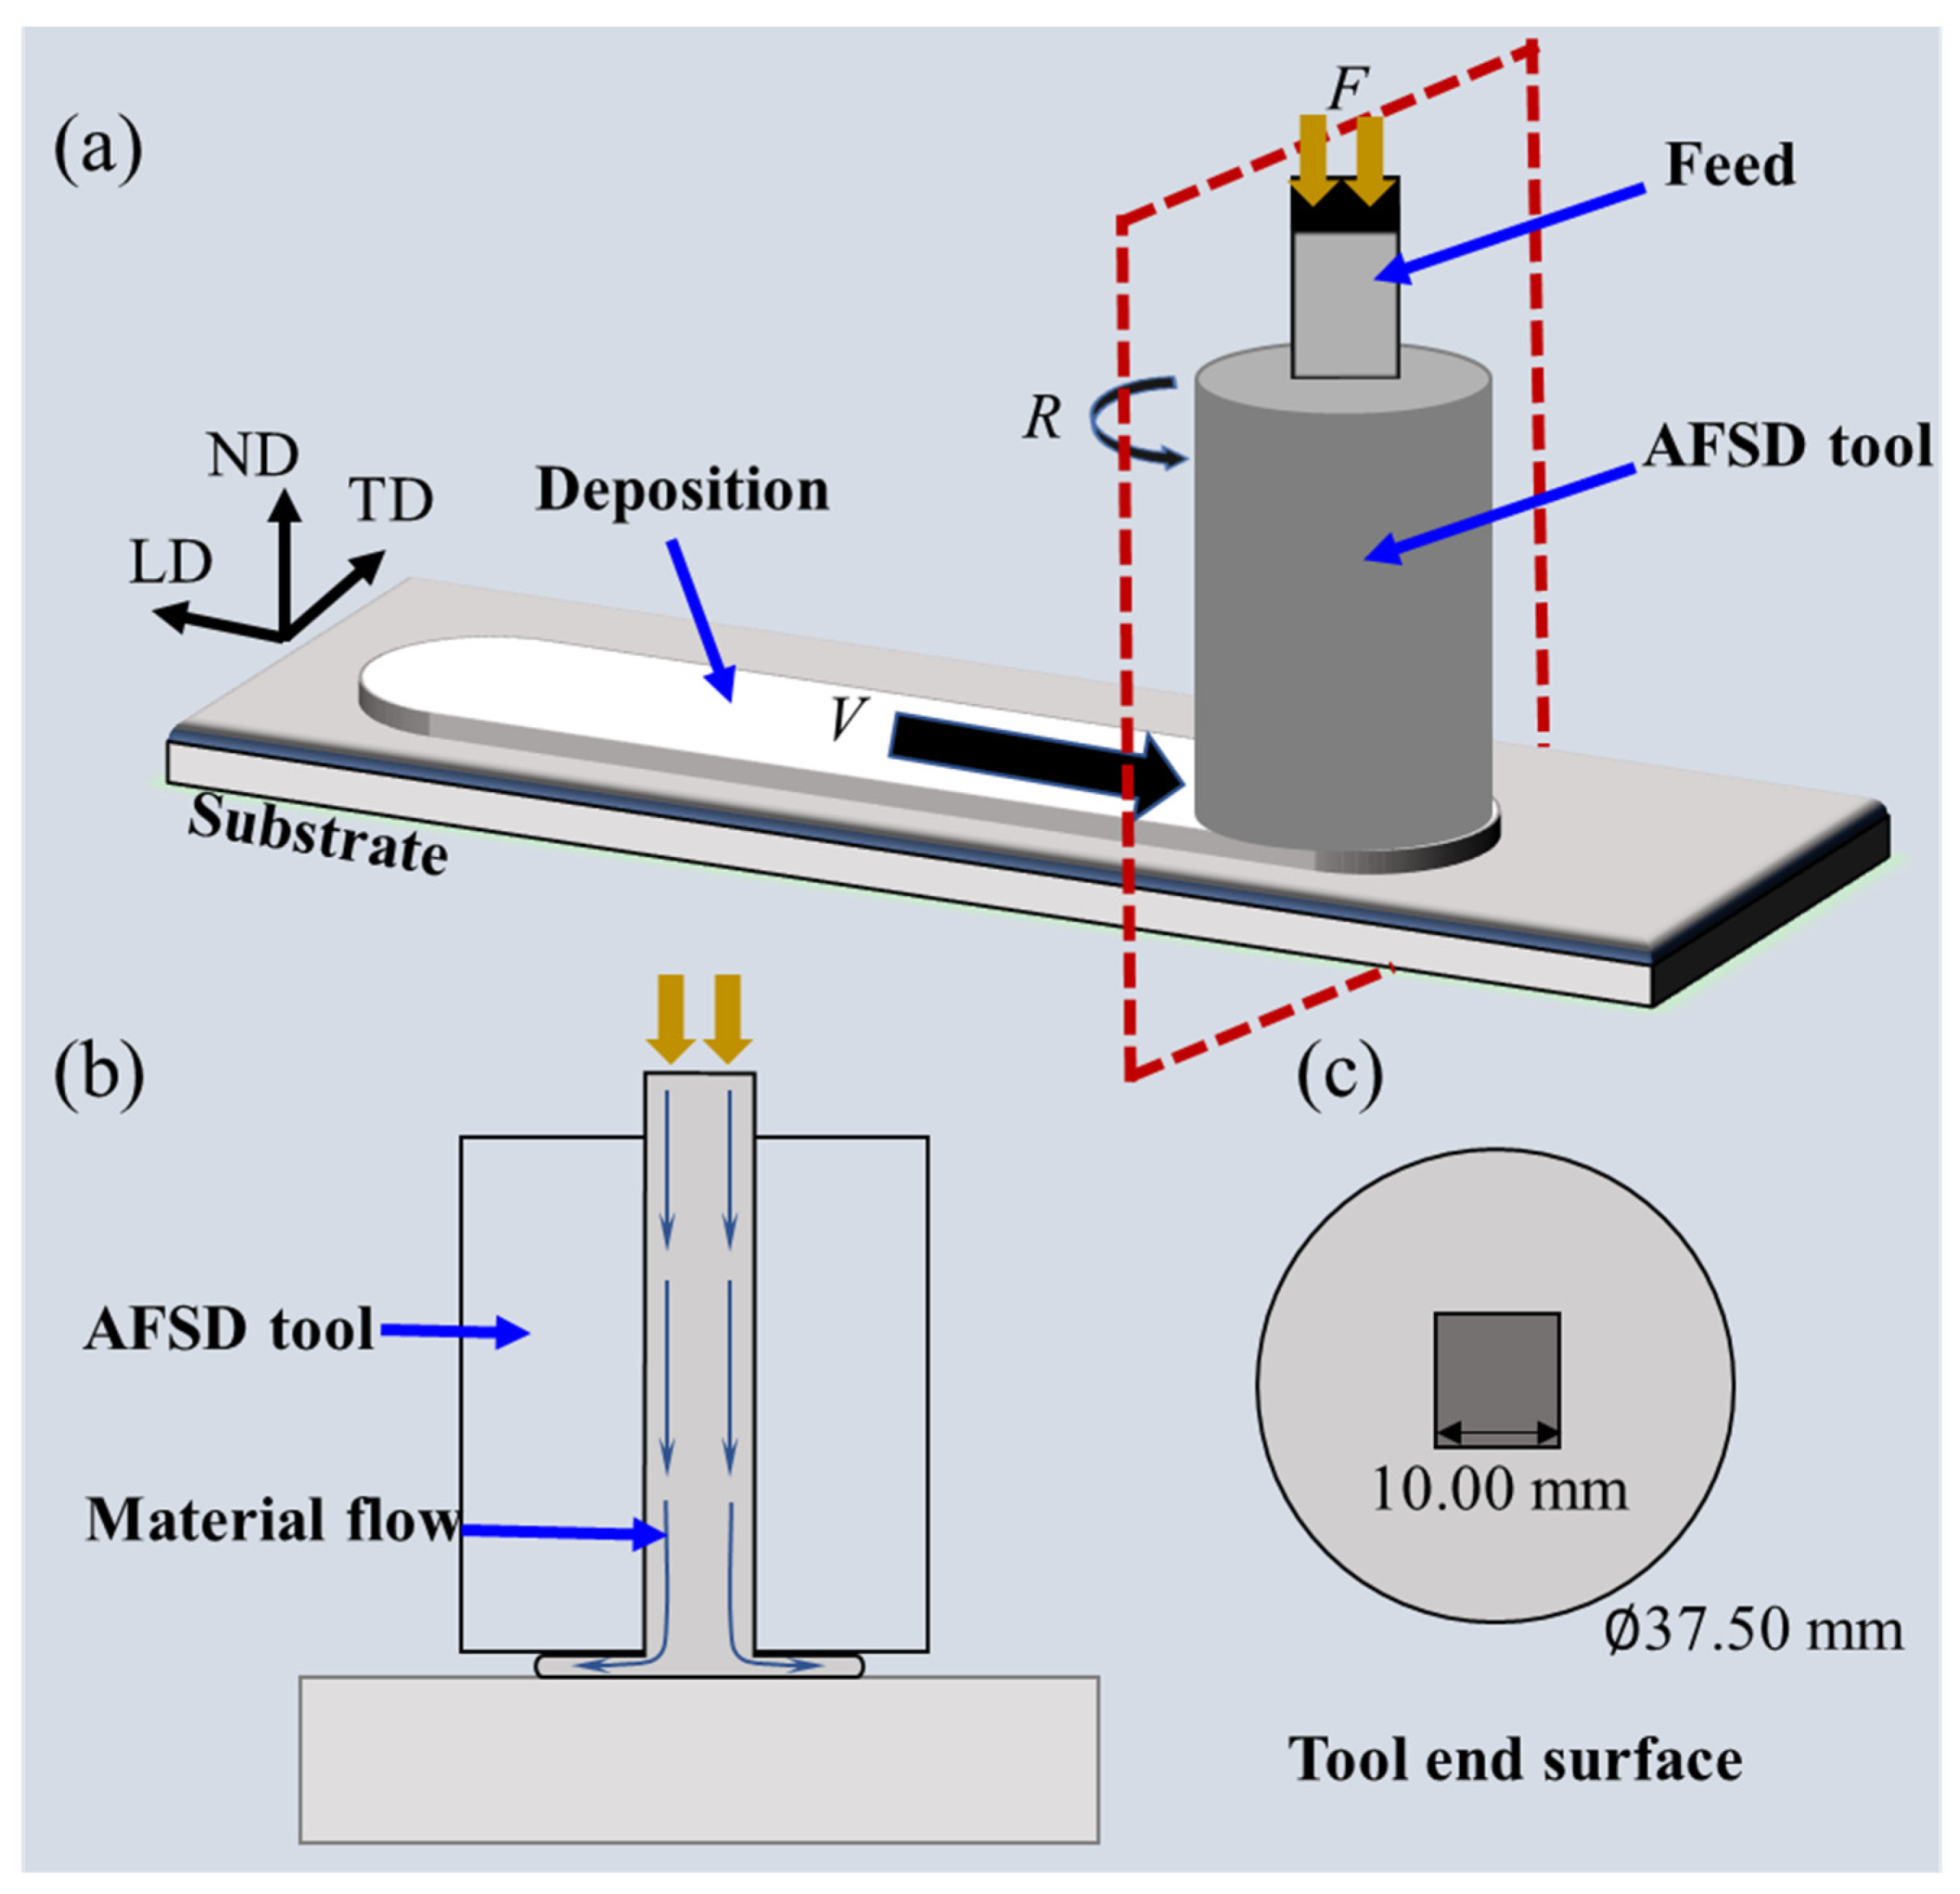
- The simulated temperature field distribution of AFSD between Al and Ti reveals that during the deposition process, the temperature constantly changes from the center to the edge. This accounts for the different widths of the elemental mixture distance and the difference of the shear strength in different zones.
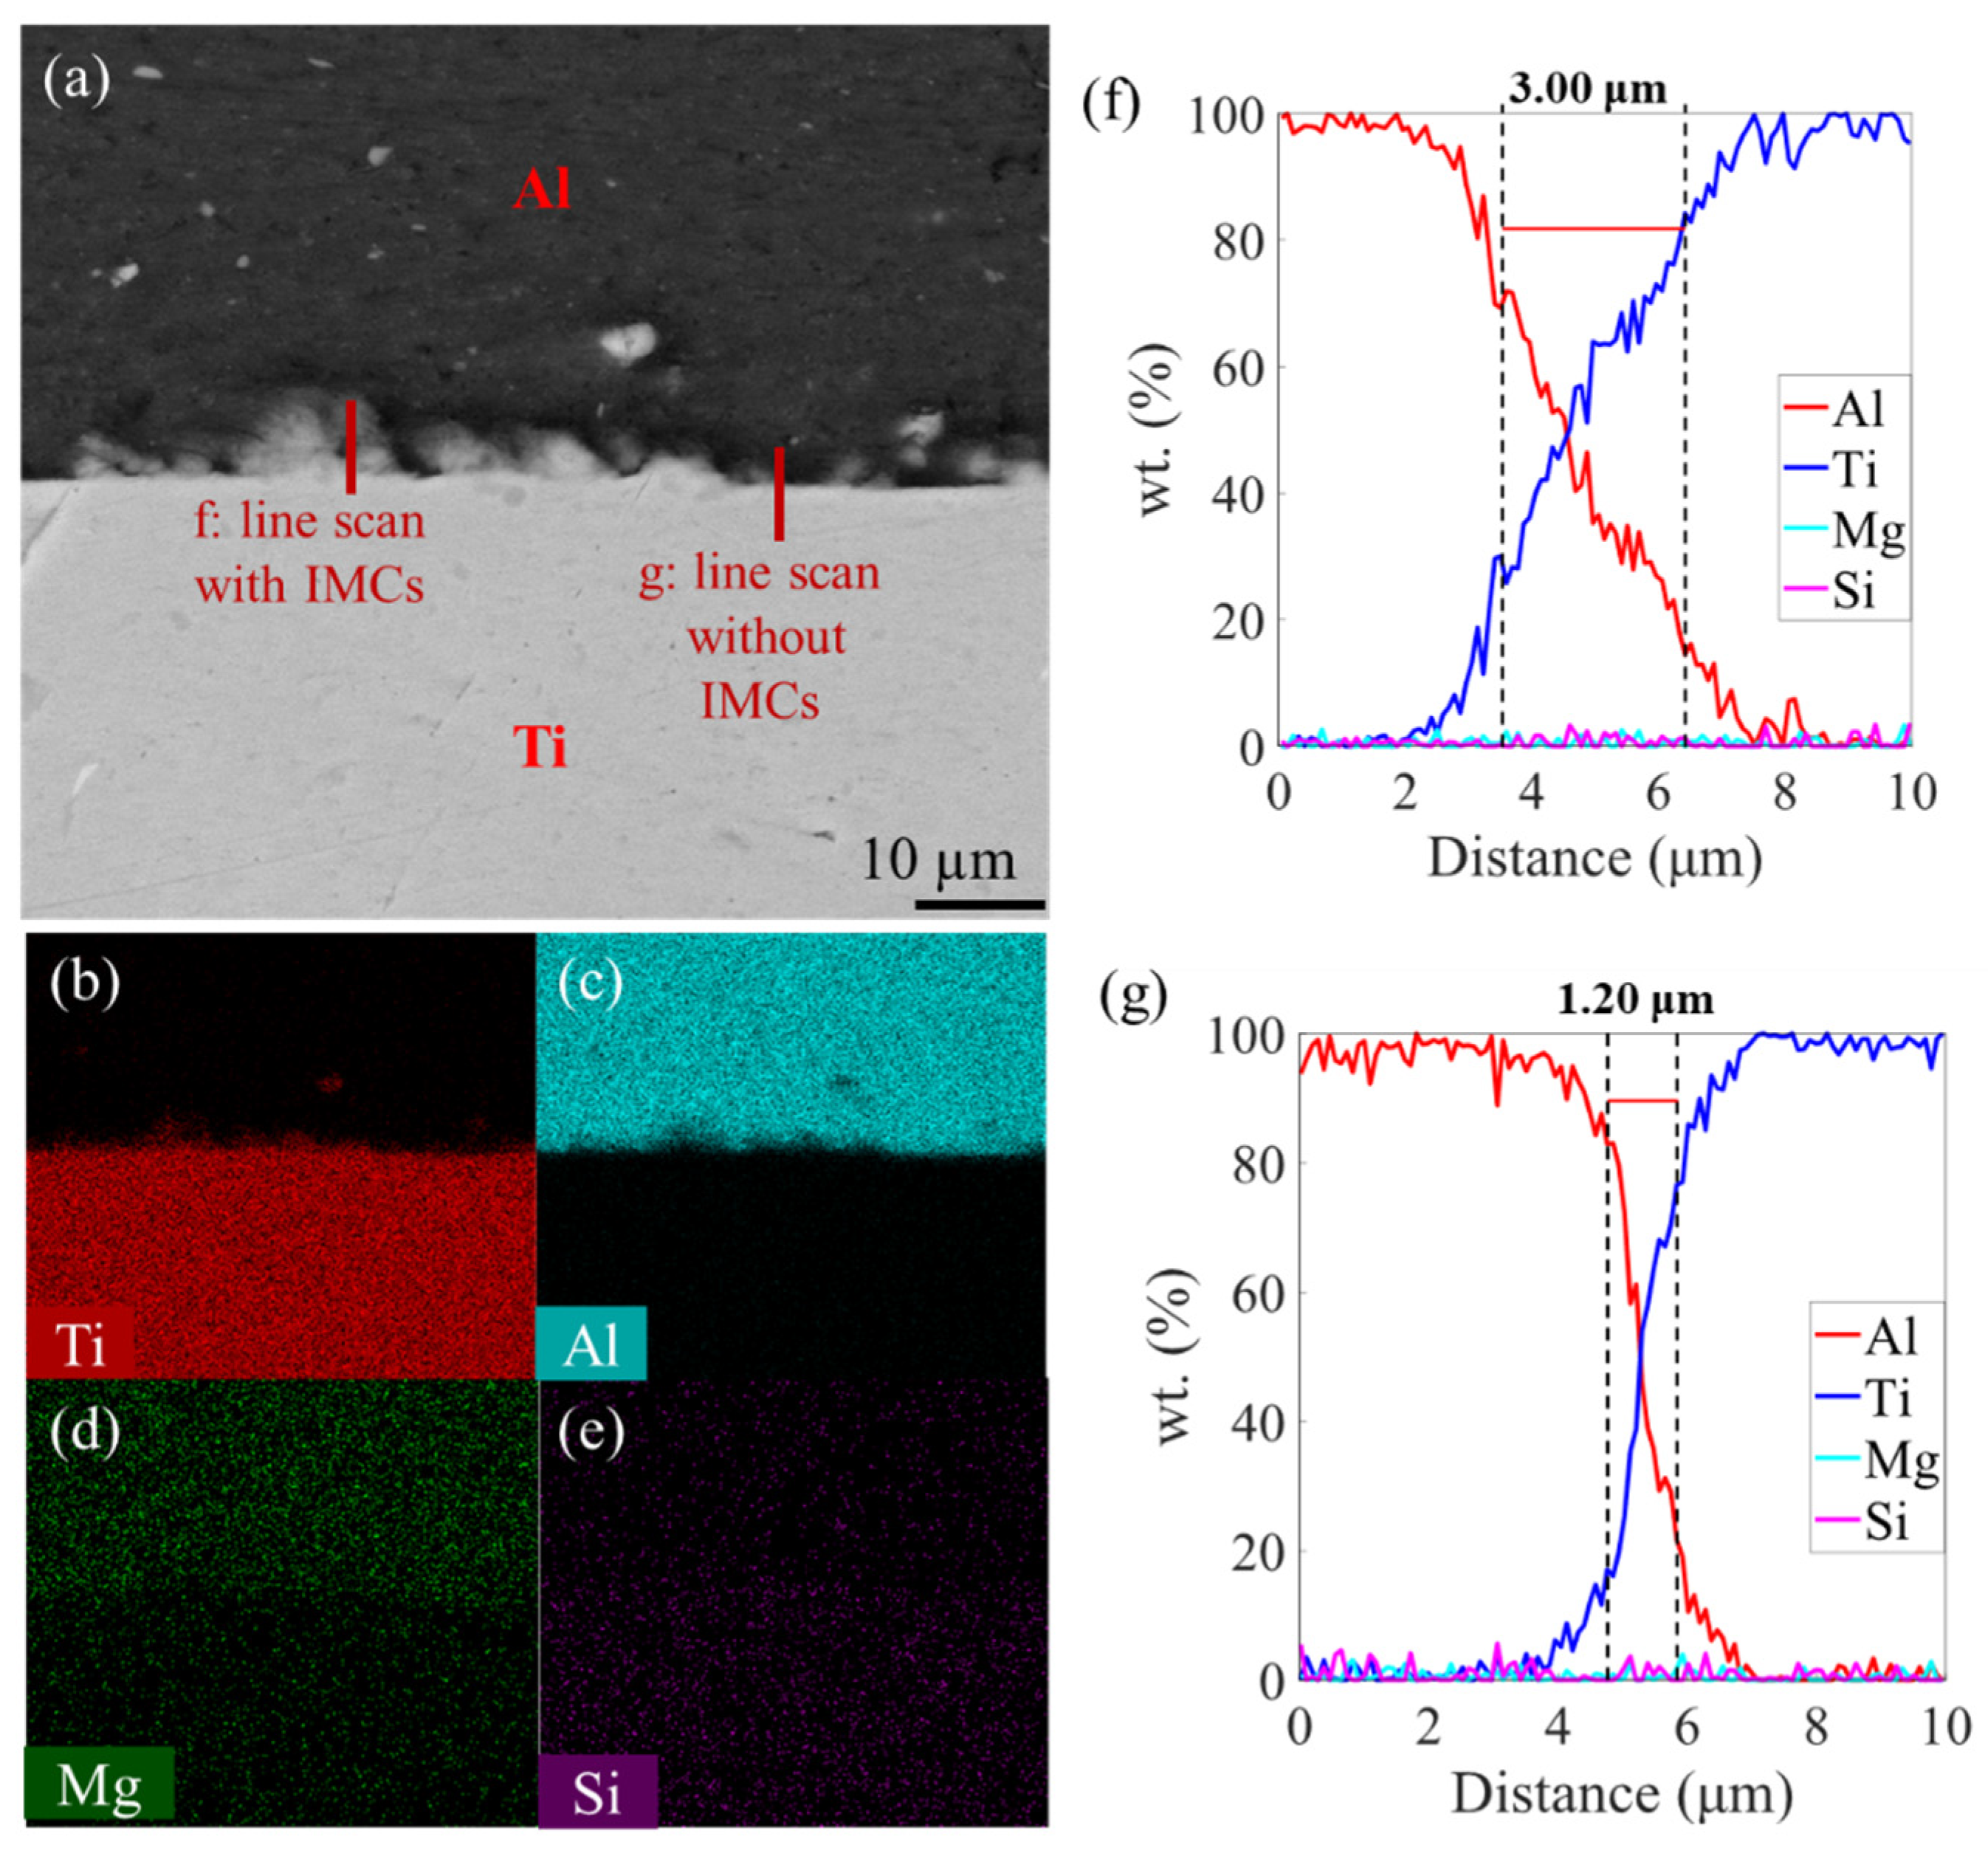
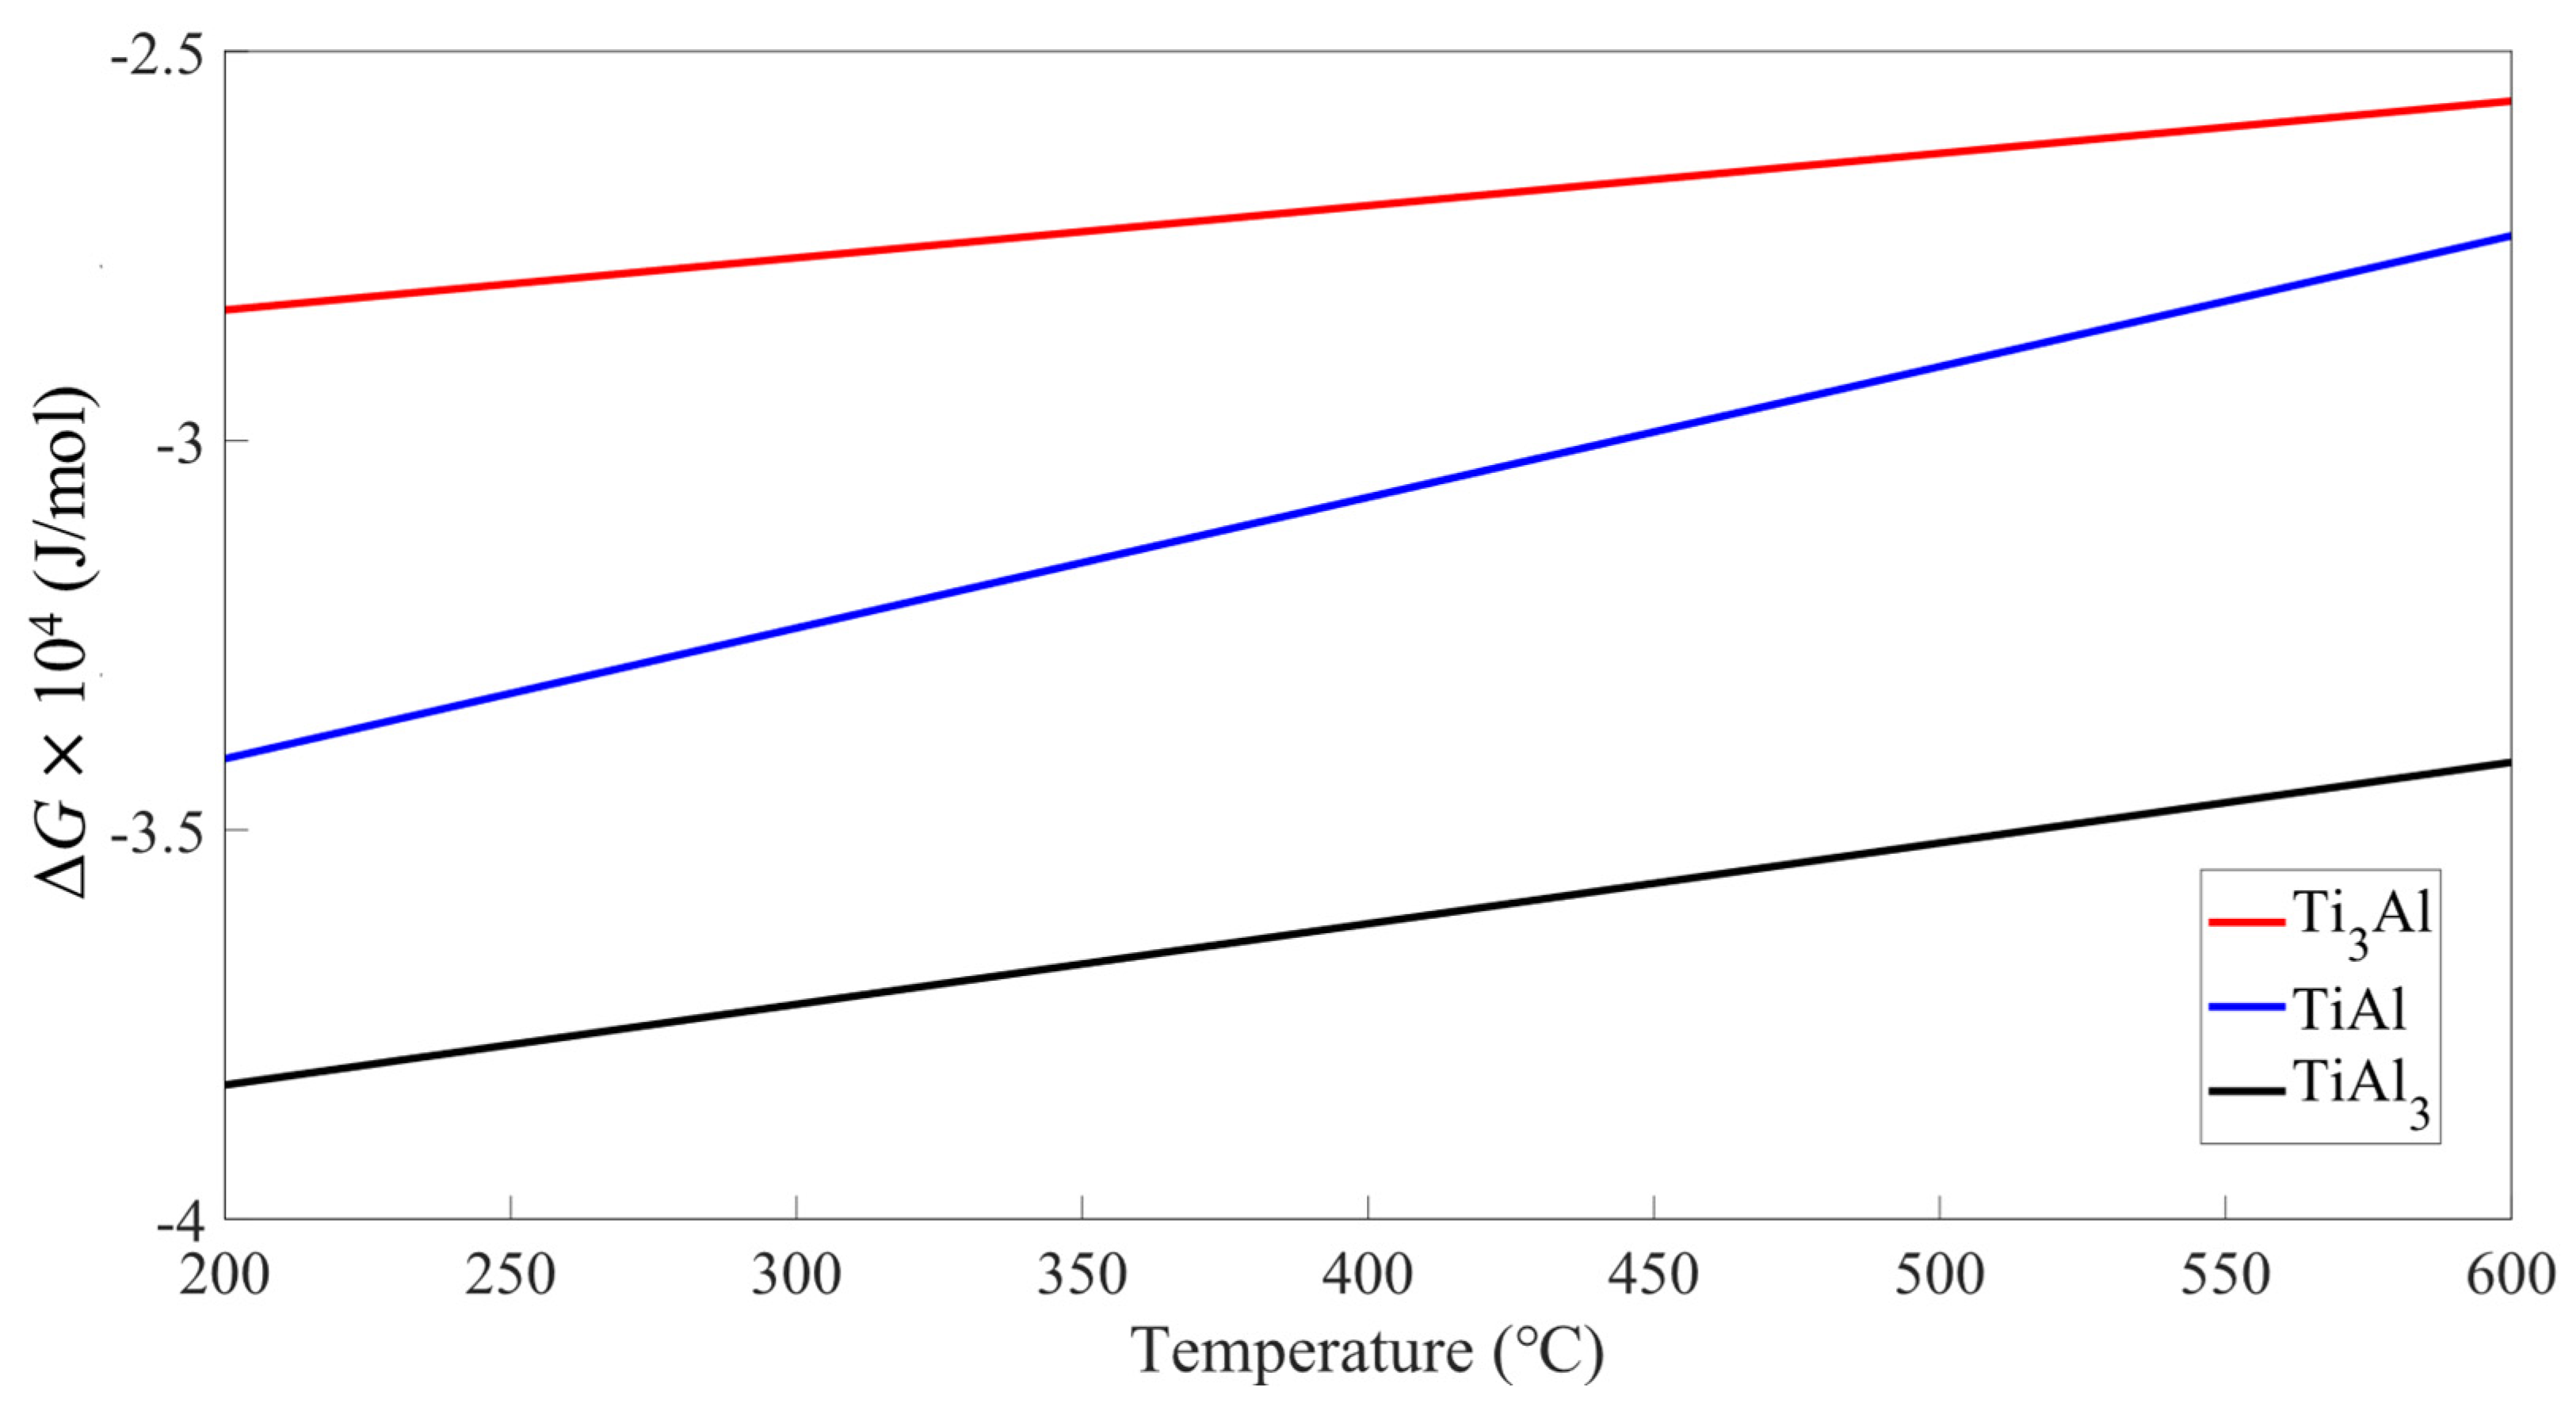
- The appearance of interfacial intermetallic compounds (IMCs) could be ascribed to the high temperature near the center zone, high preheating temperature, and low Gibbs free energy of TiAl3. Due to the dispersed characteristic of IMCs, their presence increases the shear strength of the Al/Ti composite plate.
Supplementary Materials
Author Contributions
Funding
Institutional Review Board Statement
Informed Consent Statement
Data Availability Statement
Conflicts of Interest
References
- Kulkarni, P.; Dhoble, A.; Padole, P. A review of research and recent trends in analysis of composite plates. Sādhanā 2018, 43, 96. [Google Scholar] [CrossRef]
- Currey, J.D. Hierarchies in Biomineral Structures. Science 2005, 309, 253–254. [Google Scholar] [CrossRef] [PubMed]
- Zhang, L.; Xu, H.; Wang, Z.; Li, Q.; Wu, J. Mechanical properties and corrosion behavior of Al/SiC composites. J. Alloys Compd. 2016, 678, 23–30. [Google Scholar] [CrossRef]
- Alizadeh, M.; Samiei, M. Fabrication of nanostructured Al/Cu/Mn metallic multilayer composites by accumulative roll bonding process and investigation of their mechanical properties. Mater. Des. 2014, 56, 680–684. [Google Scholar] [CrossRef]
- Fan, M.; Domblesky, J.; Jin, K.; Qin, L.; Cui, S.; Guo, X.; Kim, N.; Tao, J. Effect of original layer thicknesses on the interface bonding and mechanical properties of Ti Al laminate composites. Mater. Des. 2016, 99, 535–542. [Google Scholar] [CrossRef]
- Du, Y.; Fan, G.; Yu, T.; Hansen, N.; Geng, L.; Huang, X. Laminated Ti-Al composites: Processing, structure and strength. Mater. Sci. Eng. A 2016, 673, 572–580. [Google Scholar] [CrossRef]
- Tian, X.; Wang, X.; Ding, X.; Peng, Y.; Zhou, R.; Luo, H. Research Progress of Explosive Welding Technology for Ti/Al Clad Plates. Titan. Ind. Prog. 2020, 37, 34–40. [Google Scholar]
- Ma, M.; Meng, X.; Liu, W.C. Microstructure and Mechanical Properties of Ti/Al/Ti Laminated Composites Prepared by Hot Rolling. J. Mater. Eng. Perform. 2017, 26, 3569–3578. [Google Scholar] [CrossRef]
- Miao, L.; Lu, X.; Wei, Z.; Zhang, Y.; Zhang, Y.; Liu, J. Enhanced mechanical strength in hot-rolled La-Fe-Si/Fe magnetocaloric composites by microstructure manipulation. Acta Mater. 2023, 245, 118635. [Google Scholar] [CrossRef]
- Li, P.Y.; Li, X.N.; Dong, Z.Y.; Liu, Z.Y.; Chen, L.Q.; Xiao, B.L.; Ma, Z.Y. Microstructure evolution and strength-ductility improving mechanism change of heterogeneous CNT/2009Al composite after hot rolling. J. Alloys Compd. 2023, 948, 169764. [Google Scholar] [CrossRef]
- Zhou, Q.; Lu, H.; Lan, X.; Guo, Y.; Liu, K.; Huang, G.; Jia, B.; Chen, P. Anisotropy in microstructure and shear properties of TA2/Q235 explosive welding interfaces. J. Mater. Res. Technol. 2023, 25, 6472–6491. [Google Scholar] [CrossRef]
- Xunzhong, G.; Minyu, F.; Zhongli, L.; Fuye, M.; Liuan, W.; Jie, T. Explosive Cladding and Hot Pressing of Ti/Al/Ti Laminates. Rare Met. Mater. Eng. 2017, 46, 1192–1196. [Google Scholar] [CrossRef]
- Pei, Y.; Huang, T.; Chen, F.; Pang, B.; Guo, J.; Xiang, N.; Song, Z.; Zhang, Y. Microstructure and fracture mechanism of Ti/Al layered composite fabricated by explosive welding. Vacuum 2020, 181, 109596. [Google Scholar] [CrossRef]
- Wei, Y.; Aiping, W.; Guisheng, Z.; Jialie, R. Formation process of the bonding joint in Ti/Al diffusion bonding. Mater. Sci. Eng. A 2008, 480, 456–463. [Google Scholar] [CrossRef]
- Yu, J.; Fan, Y.; Zhang, H.; Cao, W.; Zhang, H.; Su, Z.; Gao, J. Interfacial Evolution of Thermo-compensated Resistance Diffusion Welding of Al/Steel Joint with Ni Interlayer via Resistance Seam Welding. J. Mater. Eng. Perform. 2023. [CrossRef]
- Guo, H.; Rao, M.; Zhang, J.; Wang, X.; Luo, G.; Shen, Q. Electromigration-enhanced Kirkendall effect of Cu/Ti direct diffusion welding by sparking plasma sintering. J. Mater. Process. Technol. 2023, 315, 117933. [Google Scholar] [CrossRef]
- Shehabeldeen, T.A.; Yin, Y.; Ji, X.; Shen, X.; Zhang, Z.; Zhou, J. Investigation of the microstructure, mechanical properties and fracture mechanisms of dissimilar friction stir welded aluminium/titanium joints. J. Mater. Res. Technol. 2021, 11, 507–518. [Google Scholar] [CrossRef]
- Rabiezadeh, A.; Salafzon, A.; Mostafavi, N. Dissimilar welding of AA5083/AA7039 by self-reacting friction stir welding. J. Adhes. Sci. Technol. 2023, 1–22. [Google Scholar] [CrossRef]
- Muhammad, N.A.; Geng, P.; Wu, C.; Ma, N. Unravelling the ultrasonic effect on residual stress and microstructure in dissimilar ultrasonic-assisted friction stir welding of Al/Mg alloys. Int. J. Mach. Tools Manuf. 2023, 186, 104004. [Google Scholar] [CrossRef]
- Thiyaneshwaran, N.; Sivaprasad, K.; Ravisankar, B. Characterization based analysis on TiAl3 intermetallic phase layer growth phenomenon and kinetics in diffusion bonded Ti/TiAl3/Al laminates. Mater. Charact. 2021, 174, 110981. [Google Scholar] [CrossRef]
- Yu, H.Z.; Mishra, R.S. Additive friction stir deposition: A deformation processing route to metal additive manufacturing. Mater. Res. Lett. 2020, 9, 71–83. [Google Scholar] [CrossRef]
- Gotawala, N.; Hang, Z.Y. Material flow path and extreme thermomechanical processing history during additive friction stir deposition. J. Manuf. Process. 2023, 101, 114–127. [Google Scholar] [CrossRef]
- Zhu, N.; Avery, D.Z.; Chen, Y.; An, K.; Jordon, J.B.; Allison, P.G.; Brewer, L.N. Residual Stress Distributions in AA6061 Material Produced by Additive Friction Stir Deposition. J. Mater. Eng. Perform. 2022, 32, 5535–5544. [Google Scholar] [CrossRef]
- Agrawal, P.; Haridas, R.S.; Yadav, S.; Thapliyal, S.; Dhal, A.; Mishra, R.S. Additive friction stir deposition of SS316: Effect of process parameters on microstructure evolution. Mater. Charact. 2023, 195, 112470. [Google Scholar] [CrossRef]
- Stubblefield, G.G.; Fraser, K.A.; Robinson, T.W.; Zhu, N.; Kinser, R.P.; Tew, J.Z.; Cordle, B.T.; Jordon, J.B.; Allison, P.G. A computational and experimental approach to understanding material flow behavior during additive friction stir deposition (AFSD). Comput. Part. Mech. 2023. [Google Scholar] [CrossRef]
- Khodabakhshi, F.; Gerlich, A.P. Potentials and strategies of solid-state additive friction-stir manufacturing technology: A critical review. J. Manuf. Process. 2018, 36, 77–92. [Google Scholar] [CrossRef]
- Gopan, V.; Wins, K.L.D.; Surendran, A. Innovative potential of additive friction stir deposition among current laser based metal additive manufacturing processes: A review. CIRP J. Manuf. Sci. Technol. 2021, 32, 228–248. [Google Scholar] [CrossRef]
- Hartley, W.D.; Garcia, D.; Yoder, J.K.; Poczatek, E.; Forsmark, J.H.; Luckey, S.G.; Dillard, D.A.; Yu, H.Z. Solid-state cladding on thin automotive sheet metals enabled by additive friction stir deposition. J. Mater. Process. Technol. 2021, 291, 117045. [Google Scholar] [CrossRef]
- Chen, G.; Wu, K.; Wang, Y.; Zhu, Z.; Nie, P.; Hu, F. Effect of rotational speed and feed rate on microstructure and mechanical properties of 6061 aluminum alloy manufactured by additive friction stir deposition. Int. J. Adv. Manuf. Technol. 2023, 127, 1165–1176. [Google Scholar] [CrossRef]
- Cui, J.; Guo, X.; Hao, S.; Guo, X.; Xu, R. Achieving high strength-ductility properties of wire-arc additive manufactured Al-Mg-Sc aluminum alloy via friction stir processing post-treatment and high temperature aging treatment. Mater. Lett. 2023, 350, 134913. [Google Scholar] [CrossRef]
- Li, B.; Shen, Y.; Lei, L.; Hu, W. Fabrication and Evaluation of Ti3Alp/Ti–6Al–4V Surface Layer via Additive Friction-Stir Processing. Mater. Manuf. Process. 2014, 29, 412–417. [Google Scholar] [CrossRef]
- Agrawal, P.; Haridas, R.S.; Yadav, S.; Thapliyal, S.; Gaddam, S.; Verma, R.; Mishra, R.S. Processing-structure-property correlation in additive friction stir deposited Ti-6Al-4V alloy from recycled metal chips. Addit. Manuf. 2021, 47, 102259. [Google Scholar] [CrossRef]
- Metz, P.C.; Arwood, Z.; Franz, C.; Heikkenen, E.; Chawla, V.; Babu, S.S.; Penumadu, D.; Page, K. Non-uniform plastic deformation in additive friction stir deposited Ti-6Al-4V. Materialia 2023, 30, 101799. [Google Scholar] [CrossRef]
- Aziz, S.B.; Dewan, M.W.; Huggett, D.J.; Wahab, M.A.; Okeil, A.M.; Liao, T.W. Impact of Friction Stir Welding (FSW) Process Parameters on Thermal Modeling and Heat Generation of Aluminum Alloy Joints. Acta Met. Sin. (Engl. Lett.) 2016, 29, 869–883. [Google Scholar] [CrossRef]
- Garcia, D.; Hartley, W.D.; Rauch, H.A.; Griffiths, R.J.; Wang, R.; Kong, Z.J.; Zhu, Y.; Yu, H.Z. In situ investigation into temperature evolution and heat generation during additive friction stir deposition: A comparative study of Cu and Al-Mg-Si. Addit. Manuf. 2020, 34, 101386. [Google Scholar] [CrossRef]
- Phillips, B.J.; Avery, D.Z.; Liu, T.; Rodriguez, O.L.; Mason, C.J.T.; Jordon, J.B.; Brewer, L.N.; Allison, P.G. Microstructure-deformation relationship of additive friction stir-deposition Al–Mg–Si. Materialia 2019, 7, 100387. [Google Scholar] [CrossRef]
- Li, Y.; Yang, B.; Zhang, M.; Wang, H.; Gong, W.; Lai, R.; Li, Y.; Teng, J. The corrosion behavior and mechanical properties of 5083 Al-Mg alloy manufactured by additive friction stir deposition. Corros. Sci. 2023, 213, 110972. [Google Scholar] [CrossRef]
- GB/T 6396-2008; Clad Steel Plates-Mechanical and Technological Test. Standardization Administration of China: Beijing, China.
- YB/T 5349-2014; Metallic Materials-Determinantion of Bending Mechanical Properties. Standardization Administration of China: Beijing, China.
- Song, M.; Darsell, J.; Jana, S. Amorphization and alloying in Al-Ti system through friction extrusion method. J. Mater. Sci. 2022, 57, 12055–12063. [Google Scholar] [CrossRef]
- Schmidt, H.; Hattel, J.; Wert, J. An analytical model for the heat generation in friction stir welding. Model. Simul. Mater. Sci. Eng. 2003, 12, 143–157. [Google Scholar] [CrossRef]
- Edwards, G.A.; Stiller, K.; Dunlop, G.L.; Couper, M.J. The precipitation sequence in Al–Mg–Si alloys. Acta Mater. 1998, 46, 3893–3904. [Google Scholar] [CrossRef]
- Park, S.K.; Hong, S.T.; Park, J.H.; Park, K.Y.; Kwon, Y.J.; Son, H.J. Effect of material locations on properties of friction stir welding joints of dissimilar aluminium alloys. Sci. Technol. Weld. Join. 2013, 15, 331–336. [Google Scholar] [CrossRef]
- Dong, P.; Li, H.; Sun, D.; Gong, W.; Liu, J. Effects of welding speed on the microstructure and hardness in friction stir welding joints of 6005A-T6 aluminum alloy. Mater. Des. 2013, 45, 524–531. [Google Scholar] [CrossRef]
- Stubblefield, G.; Fraser, K.; Phillips, B.; Jordon, J.; Allison, P. A meshfree computational framework for the numerical simulation of the solid-state additive manufacturing process, additive friction stir-deposition (AFS-D). Mater. Des. 2021, 202, 109514. [Google Scholar] [CrossRef]
- Cui, X.Y.; Li, Z.C.; Feng, H.; Feng, S.Z. Steady and transient heat transfer analysis using a stable node-based smoothed finite element method. Int. J. Therm. Sci. 2016, 110, 12–25. [Google Scholar] [CrossRef]
- Wang, X.; Gao, Y.; Liu, X.; McDonnell, M.; Feng, Z. Tool-workpiece stick-slip conditions and their effects on torque and heat generation rate in the friction stir welding. Acta Mater. 2021, 213, 116969. [Google Scholar] [CrossRef]
- Zhang, Z.; Zhang, H.W. Solid mechanics-based Eulerian model of friction stir welding. Int. J. Adv. Manuf. Technol. 2014, 72, 1647–1653. [Google Scholar] [CrossRef]
- Neto, D.M.; Neto, P. Numerical modeling of friction stir welding process: A literature review. Int. J. Adv. Manuf. Technol. 2012, 65, 115–126. [Google Scholar] [CrossRef]
- Shen, Z.; Zhang, M.; Li, D.; Liu, X.; Chen, S.; Hou, W.; Ding, Y.; Sun, Z.; Su, Y.; Li, W.; et al. Microstructural characterization and mechanical properties of AlMg alloy fabricated by additive friction stir deposition. Int. J. Adv. Manuf. Technol. 2023, 125, 2733–2741. [Google Scholar] [CrossRef]
- Chen, S.; Ke, F.; Zhou, M.; Bai, Y. Atomistic investigation of the effects of temperature and surface roughness on diffusion bonding between Cu and Al. Acta Mater. 2007, 55, 3169–3175. [Google Scholar] [CrossRef]
- Chen, C.Q.; Scott, W.; Barker, T.M. Effect of metal surface topography on mechanical bonding at simulated total hip stem-cement interfaces. J. Biomed. Mater. Res. 1999, 48, 440–446. [Google Scholar] [CrossRef]
- Li, P.; Lei, Z.; Zhang, X.; Liu, J.; Chen, Y. Effects of laser power on the interfacial intermetallic compounds and mechanical properties of dual-spot laser welded–brazed Ti/Al butt joint. Opt. Laser Technol. 2019, 124, 105987. [Google Scholar] [CrossRef]
- Zhao, H.; Yu, M.; Jiang, Z.; Zhou, L.; Song, X. Interfacial microstructure and mechanical properties of Al/Ti dissimilar joints fabricated via friction stir welding. J. Alloys Compd. 2019, 789, 139–149. [Google Scholar] [CrossRef]


| Al | Mg | Si | Ti | Fe | Mn | Cu | Zn | |
|---|---|---|---|---|---|---|---|---|
| 6061 | Bal. | 1 | 0.8 | 0.1 | 0.7 | 0.1 | 0.2 | 0.2 |
| TA1 | - | - | - | Bal. | 0.2 | - | - | - |
| Preheating at Room Temperature | Preheating at 100 °C | Preheating at 200 °C | |
|---|---|---|---|
| Center | P-RT-C | P-100-C | P-200-C |
| Transition | P-RT-T | P-100-T | P-200-T |
| Boundary | P-RT-B | P-100-B | P-200-B |
| P1 | P2 | P3 | P4 | |
|---|---|---|---|---|
| Ti (wt.%) | 28.8 | 15.9 | 36.2 | 32.4 |
| Al (wt.%) | 70.3 | 83.4 | 62.9 | 66.0 |
| Mg (wt.%) | 0.5 | 0.5 | 0.5 | 0.9 |
| Si (wt.%) | 0.4 | 0.2 | 0.4 | 0.7 |
Disclaimer/Publisher’s Note: The statements, opinions and data contained in all publications are solely those of the individual author(s) and contributor(s) and not of MDPI and/or the editor(s). MDPI and/or the editor(s) disclaim responsibility for any injury to people or property resulting from any ideas, methods, instructions or products referred to in the content. |
© 2023 by the authors. Licensee MDPI, Basel, Switzerland. This article is an open access article distributed under the terms and conditions of the Creative Commons Attribution (CC BY) license (https://creativecommons.org/licenses/by/4.0/).
Share and Cite
Gong, W.; Li, Y.; Zhang, M.; Wang, H.; Liu, Q.; Zeng, Z.; Ma, K.; Yang, B.; Lai, R.; Li, Y. Influence of Preheating Temperature on the Microstructure and Mechanical Properties of 6061/TA1 Composite Plates Fabricated by AFSD. Materials 2023, 16, 6018. https://doi.org/10.3390/ma16176018
Gong W, Li Y, Zhang M, Wang H, Liu Q, Zeng Z, Ma K, Yang B, Lai R, Li Y. Influence of Preheating Temperature on the Microstructure and Mechanical Properties of 6061/TA1 Composite Plates Fabricated by AFSD. Materials. 2023; 16(17):6018. https://doi.org/10.3390/ma16176018
Chicago/Turabian StyleGong, Wei, Yidi Li, Ming Zhang, Hui Wang, Qinglin Liu, Ziming Zeng, Kuo Ma, Biaobiao Yang, Ruilin Lai, and Yunping Li. 2023. "Influence of Preheating Temperature on the Microstructure and Mechanical Properties of 6061/TA1 Composite Plates Fabricated by AFSD" Materials 16, no. 17: 6018. https://doi.org/10.3390/ma16176018
APA StyleGong, W., Li, Y., Zhang, M., Wang, H., Liu, Q., Zeng, Z., Ma, K., Yang, B., Lai, R., & Li, Y. (2023). Influence of Preheating Temperature on the Microstructure and Mechanical Properties of 6061/TA1 Composite Plates Fabricated by AFSD. Materials, 16(17), 6018. https://doi.org/10.3390/ma16176018