Article

Understanding the Microstructure Evolution of 8Cr4Mo4V Steel under High-Dose-Rate Ion Implantation

1
State Key Laboratory of Advanced Welding and Joining, Harbin Institute of Technology, Harbin 150001, China
2
School of Materials Science and Engineering, Harbin Institute of Technology, Harbin 150001, China
3
CETC Academy of Chips Technology, Chongqing 401332, China
4
MIIT Key Laboratory of Aerospace Bearing Technology and Equipment, Harbin Institute of Technology, Harbin 150001, China
5
AECC Harbin Bearing Co., Ltd., Harbin 150001, China
*
Authors to whom correspondence should be addressed.
Materials 2023, 16(17), 5876; https://doi.org/10.3390/ma16175876
Submission received: 16 July 2023 / Revised: 9 August 2023 / Accepted: 23 August 2023 / Published: 28 August 2023
(This article belongs to the Section Metals and Alloys)

Abstract

:
In this study, the effect of microstructure under various dose rates of plasma immersion ion implantation on 8Cr4Mo4V steel has been investigated for crystallite size, lattice strain and dislocation density. The phase composition and structure parameters including crystallite size, dislocation density and lattice strain have been investigated by X-ray diffraction (XRD) measurements and determined from Scherrer’s equation and three different Williamson–Hall (W-H) methods. The obtained results reveal that a refined crystallite size, enlarged microstrain and increased dislocation density can be obtained for the 8Cr4Mo4V steel treated by different dose rates of ion implantation. Compared to the crystallite size (15.95 nm), microstrain (5.69 × 10⁻³) and dislocation density (8.48 × 10¹⁵) of the dose rate of 2.60 × 10¹⁷ ions/cm2·h, the finest grain size, the largest microstrain and the highest dislocation density of implanted samples can be achieved when the dose rate rises to 5.18 × 10¹⁷ ions/cm2·h, the effect of refining is 26.13%, and the increment of microstrain and dislocation density are 26.3% and 45.6%, respectively. Moreover, the Williamson–Hall plots are fitted linearly by taking βcosθ along the y-axis and 4sinθ or 4sinθ/Yhkl or 4sinθ(2/Yhkl)1/2 along the x-axis. In all of the W-H graphs, it can be observed that some of the implanted samples present a negative and a positive slope; a negative and a positive slope in the plot indicate the presence of compressive and tensile strain in the material.

1. Introduction

The aero-engine main-shaft bearing is a crucial structure component in the aerospace industry; the stability and reliability will directly affect the in-service safety of the whole airplane [1]. The exceptional comprehensive performance includes factors such as a high strength at elevated temperature, high hardness, good wear resistance, excellent inherent anticorrosion resistance and extended fatigue life time [2,3,4]. As a promising bearing material, 8Cr4Mo4V steel has become increasingly popular and has been widely used in industrial and aerospace applications [5,6,7,8,9,10,11]. In recent years, with the rapid development of industrial and aerospace field, the more stringent requirements are put forward under the complex and harsh service environmental conditions. Extensive research has revealed that the bearing surface often exhibits failure such as the pitting, erosion and fatigue spalling which often occurs on the outermost surface of materials, thus bringing out the mechanical and physical properties’ decrease [12,13,14,15]. It will enable us to sustain a great economic loss and serious accidents, hence it is highly essential to improve the material comprehensive properties to meet the service requirements.
In this regard, in order to further enlarge the real applications of 8Cr4Mo4V bearing steel and meet their needs in severe working conditions, surface modification is necessary to improve the properties including the hardness, fatigue strength, wear and corrosion resistance [16,17,18,19,20,21,22]. Most of the surface-modification methods applied for bearing materials are based on the inner physical and chemical interactive reactions that produce optimized structures in order to improve their own performance [23,24,25,26,27,28,29,30]. Among the existing surface-modification methods, plasma immersion ion implantation is one of the environmentally friendly heat treatment and promising techniques [31,32,33,34,35]. Plasma immersion ion implantation has attracted increasing interest in recent decades both as a tool for basic materials research and as a novel technology for modifying the near-surface composition, structure and properties of materials and keeping the original properties of matrix materials. The ability to treat complex geometries’ parts is also an important point to be extensively applied for plasma immersion ion implantation. However, the existing plasma immersion ion implantation generally takes a much longer duration to achieve the required properties, thus causing the disadvantages of energy consumption and low implantation efficiency [36,37,38].
The nanoscale modified layer treated by ion implantation was determined by the implantation energy, dose and dose rate. Previous studies have revealed that the nanoscale modified layer differs from the bulk particles due to its unique physical and chemical properties [39,40,41]. In order to obtain a satisfied nanoscale modified layer, a high implantation dose range from 1017 to 1019 /cm2 is required during implantation process [42,43,44,45]. The higher the implantation dose required, the faster the implantation efficiency caused, the better the properties achieved and the lower the production cost. Hence, it is reasonable to infer that the high dose ion implantation process for bearing applications could be widely accepted in future real applications. The high-dose-rate plasma immersion ion implantation is developed based on plasma-based ion implantation and is conducted in this research. During high-dose-rate plasma immersion ion implantation, the high ion current density is applied to the samples; the implementation of high-dose ion implantation and the formation of the nanoscale modified layer occur in a much shorter time as compared to traditional plasma immersion ion implantation, thus leading to a significant increasing implantation efficiency and reducing energy consumption, and holding the potential for efficient industrial applications. Concurrently, the energy deposition elevates the substrate temperature and deepens the injection layer in the treating process. Yet the injection temperature influences how the dose rate affects the material’s microstructure and properties, leading to a peak. How to optimize the injection parameters and balance the efficiency and performance represents one of the current problems.
It is well known that the defects in microstructure are able to cause the full-width at the half of the maximum peak’s broadening and shift the Bragg’s angle peaks of the X-ray diffraction data as well [46,47,48]. For a comprehensive understanding of the influence of nanoscale modified layer properties, the lattice parameters need to be calculated properly. A relatively simple and powerful way to predict the crystallite size based on the width of the diffraction peak is using Scherrer equation according to the current understanding of X-ray diffraction patterns. The full-width at the half of the maximum peak’s broadening is considered as a result of the increase in lattice distortions and the decrease in crystallite size [49,50,51]. X-ray diffraction pattern analysis is a convenient and practical tool to measure the lattice parameters including crystallite size and microstrain; nonetheless, there are other useful methods to calculate the lattice parameters including TEM, size–strain plot and Williamson–Hall (W-H) models but not limited to them [52,53,54,55]. Among them, the Williamson–Hall approach is a reliable method to consider the effect of crystallite size and microstrain formation produced by the peak’s broadening of XRD [56,57,58]. It still holds an irreplaceable position in determining the crystallite size and dislocation distribution compared to other available methods.
After going through the extensive literature, it is observed that limited research can be found for analyzing the grain size, dislocation density distribution and microstrain of 8Cr4Mo4V steel by high-dose-rate plasma immersion ion implantation. Hence, the high-dose-rate treatment on plasma immersion ion implantation with nitrogen ions is conducted on 8Cr4Mo4V bearing steel, and the detailed XRD analysis is investigated by using Scherrer’s equation, and three various Williamson–Hall models are employed for estimating crystallite size, dislocation density and microstrain to determine the microstructural properties comprehensively. In this work, the authors have applied the three Williamson–Hall models on the 8Cr4Mo4V steel sample treated by high-dose-rate ion implantation, and these models hold more referenced and practical value in the present study; they are able to offer the experimental reference and theoretical guidance for more different materials. The current work exposes these approaches significantly in investigating the implanted crystallite size, lattice strain and dislocation density, and the experimental results will be useful for structural scientists and engineers and prompt the practical application of plasma immersion ion implantation in intelligent manufacturing.

2. Experimental

The material employed in this study is 8Cr4Mo4V bearing steel, with its chemical composition detailed in Table 1, supplied by Fushun Special Steel Co., Ltd, Fushun, China.
Before ion implantation, the 8Cr4Mo4V bearing steel was sectioned into flat-like samples with dimensions of 16.5 mm in diameter and 4.5 mm in thickness for structure analysis. The as-received samples were mechanically polished with a series of SiC abrasive papers with grits of 180# to 2000# and polished with diamond grit paste to a mirror finish. The samples were cleaned ultrasonically with acetone for 30 min before loading onto a sample holder in the DLZ-01 PIII facility which was described elsewhere [59]. The body of the chamber is connected with the grounded potential, and it acts as an anode. The sample holder is connected with the power supply, which acts as a cathodic plate. The oscilloscope and computer are connected with the equipment, which is able to monitor the voltage and current in the treating process in real time. The vacuum system was evacuated to a base pressure below 2.0 × 10⁻³ Pa and then back-filled with nitrogen to the working pressure of 0.3 Pa with a gas flow rate of 30 sccm. Ultimately, nitrogen ion implantations were conducted at ambient temperature and an acceleration energy of 20 keV at the same implantation dose (1.215 × 10²⁰ ions/cm2, high dose) with various high dose rates (2.60 × 10¹⁷, 5.18 × 10¹⁷, 7.85 × 10¹⁷ and 1.04 × 10¹⁷ ions/cm2·h). In keeping with the premise of the same nitrogen ion implantation dose, we are able to control the dose rate through changes in the experimental parameters, including but not limited to the pulse width and frequency. The schematic diagram of the high-dose-rate plasma immersion ion implantation process is shown in Figure 1.
X-ray diffraction (XRD) with Cu-Kα radiation (λ = 1.54056 Å) was employed to investigate the phase composition of the nanoscale modified layer induced by nitrogen ion implantation.

3. Results and Discussion

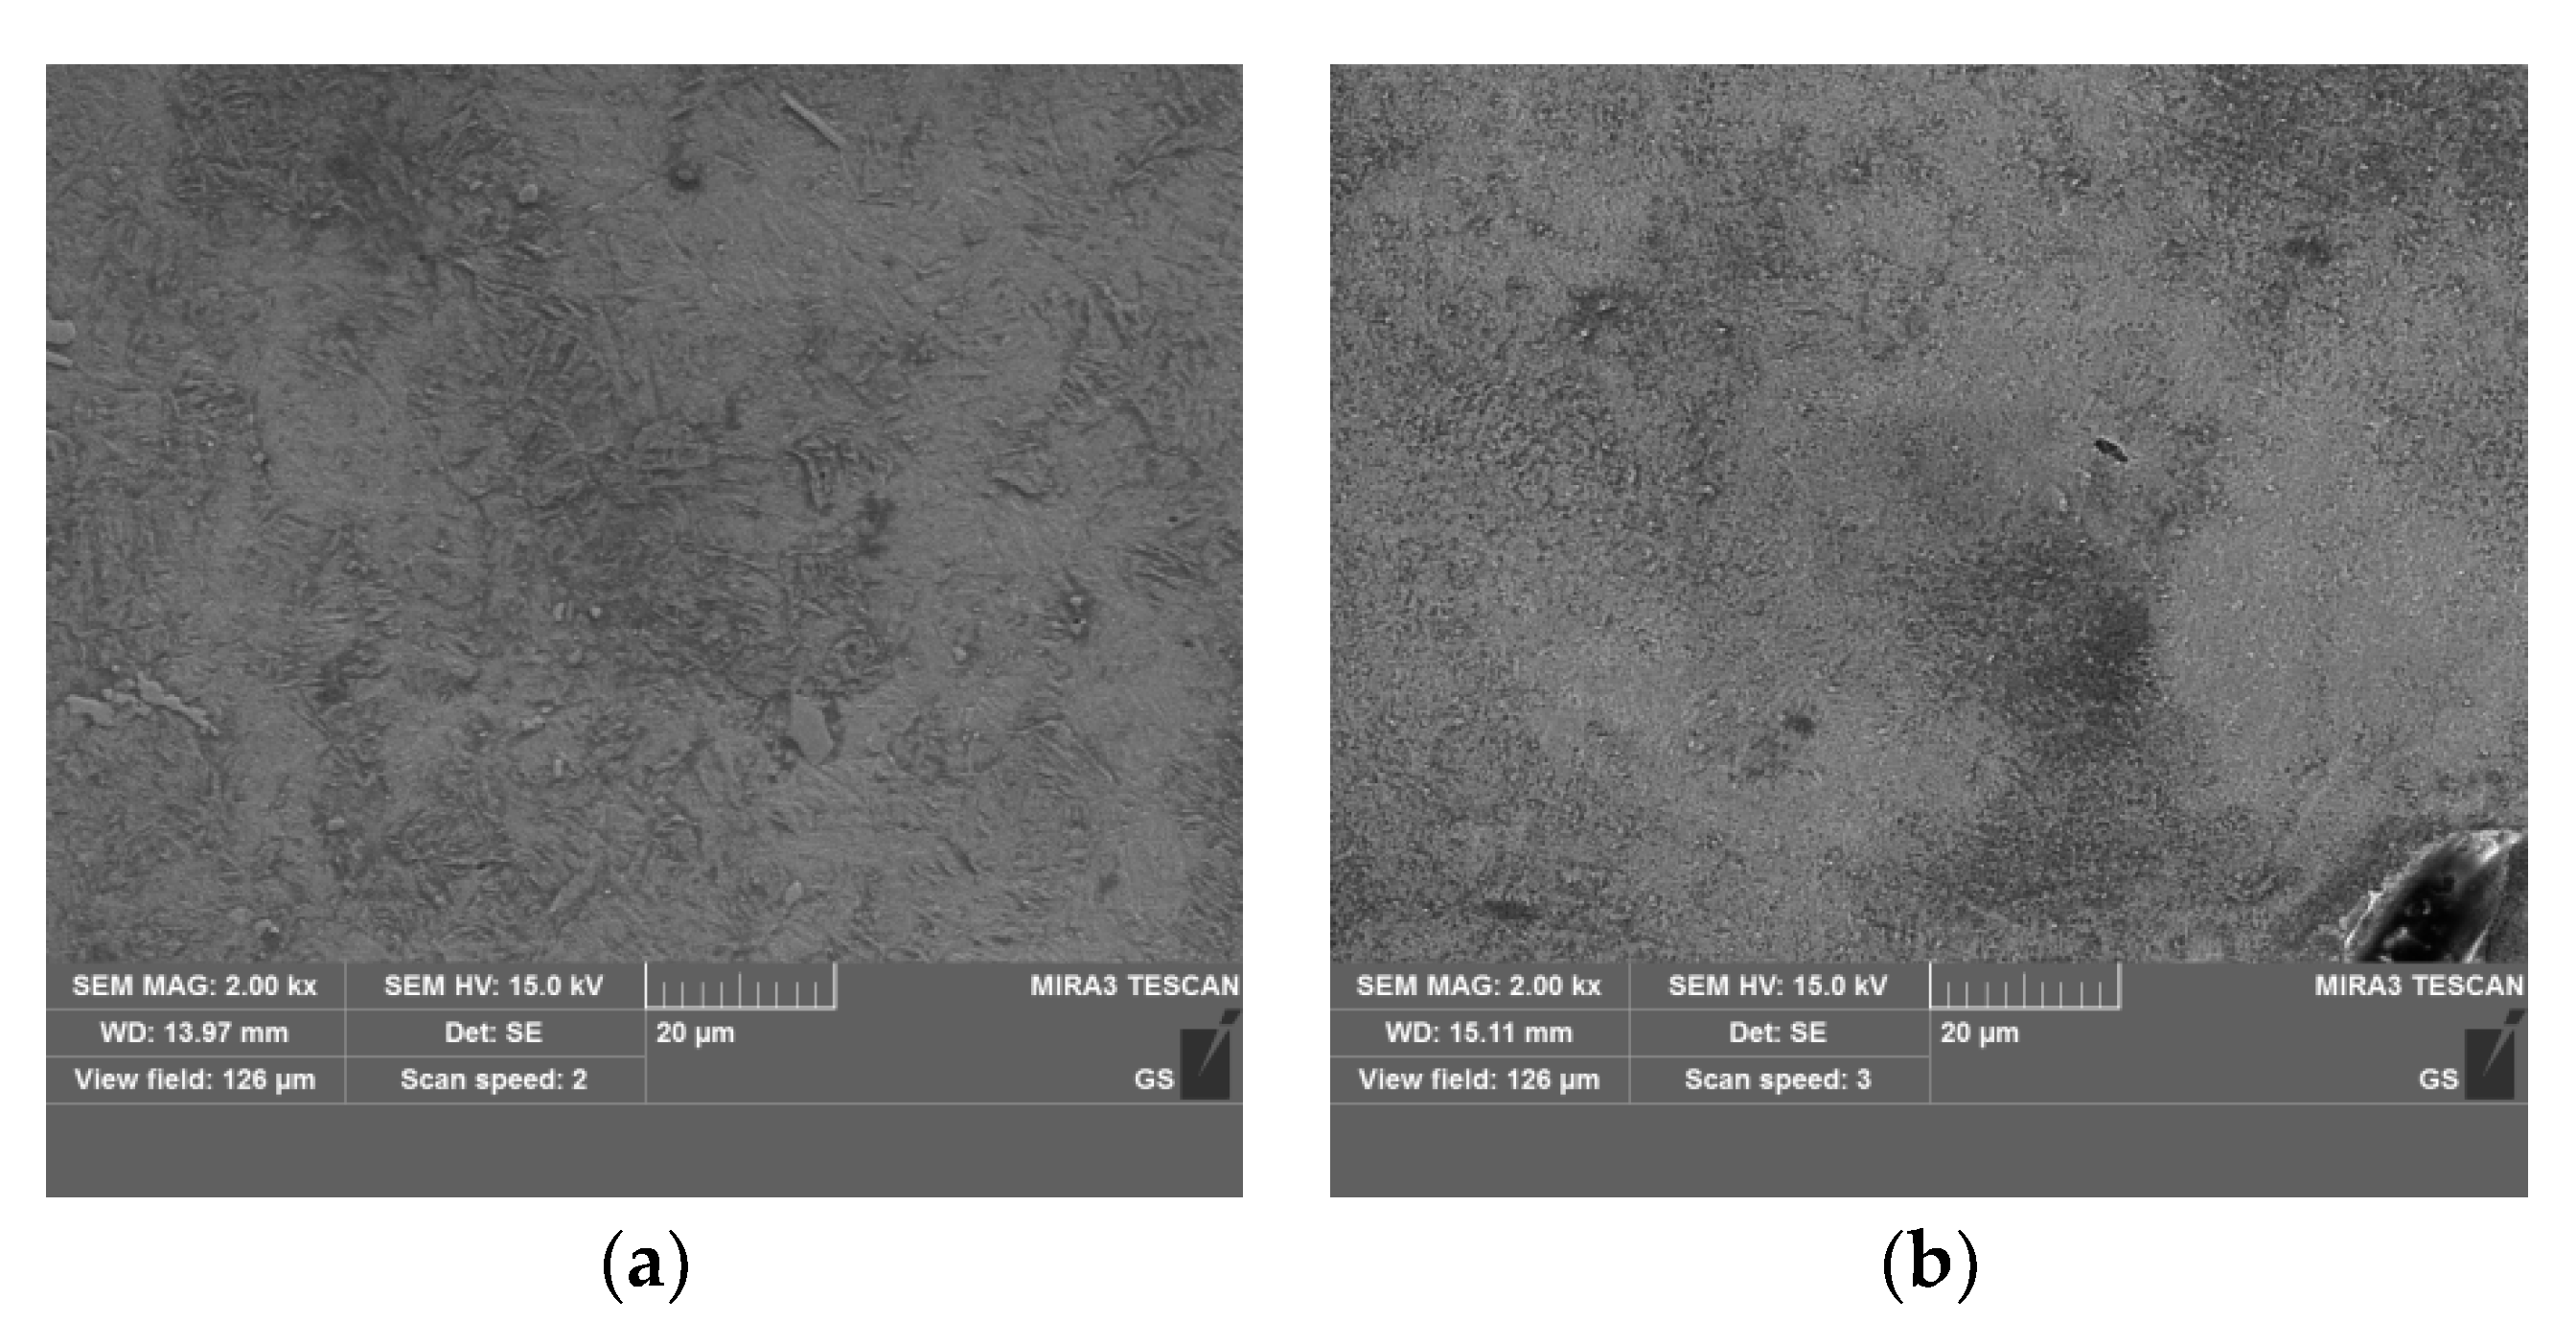
3.1. SEM Images of the Modified Layer by High-Dose-Rate Ion Implantation

The SEM images of a nanoscale modified layer treated under various implantation dose rates are shown in Figure 2. It can be clearly observed that the samples implanted with a dose rate of 2.60 × 10¹⁷ ions/cm2·h exhibit a relatively smooth surface, while the implanted particles and holes from the SEM image are captured after implantation with a high dose rate of 1.04 × 10¹⁸ ions/cm2·h. This could be due to an additive increase in the elements’ sputtering coefficient with an increased number of atoms in the bombarding clusters during high-dose-rate plasma immersion ion implantation.

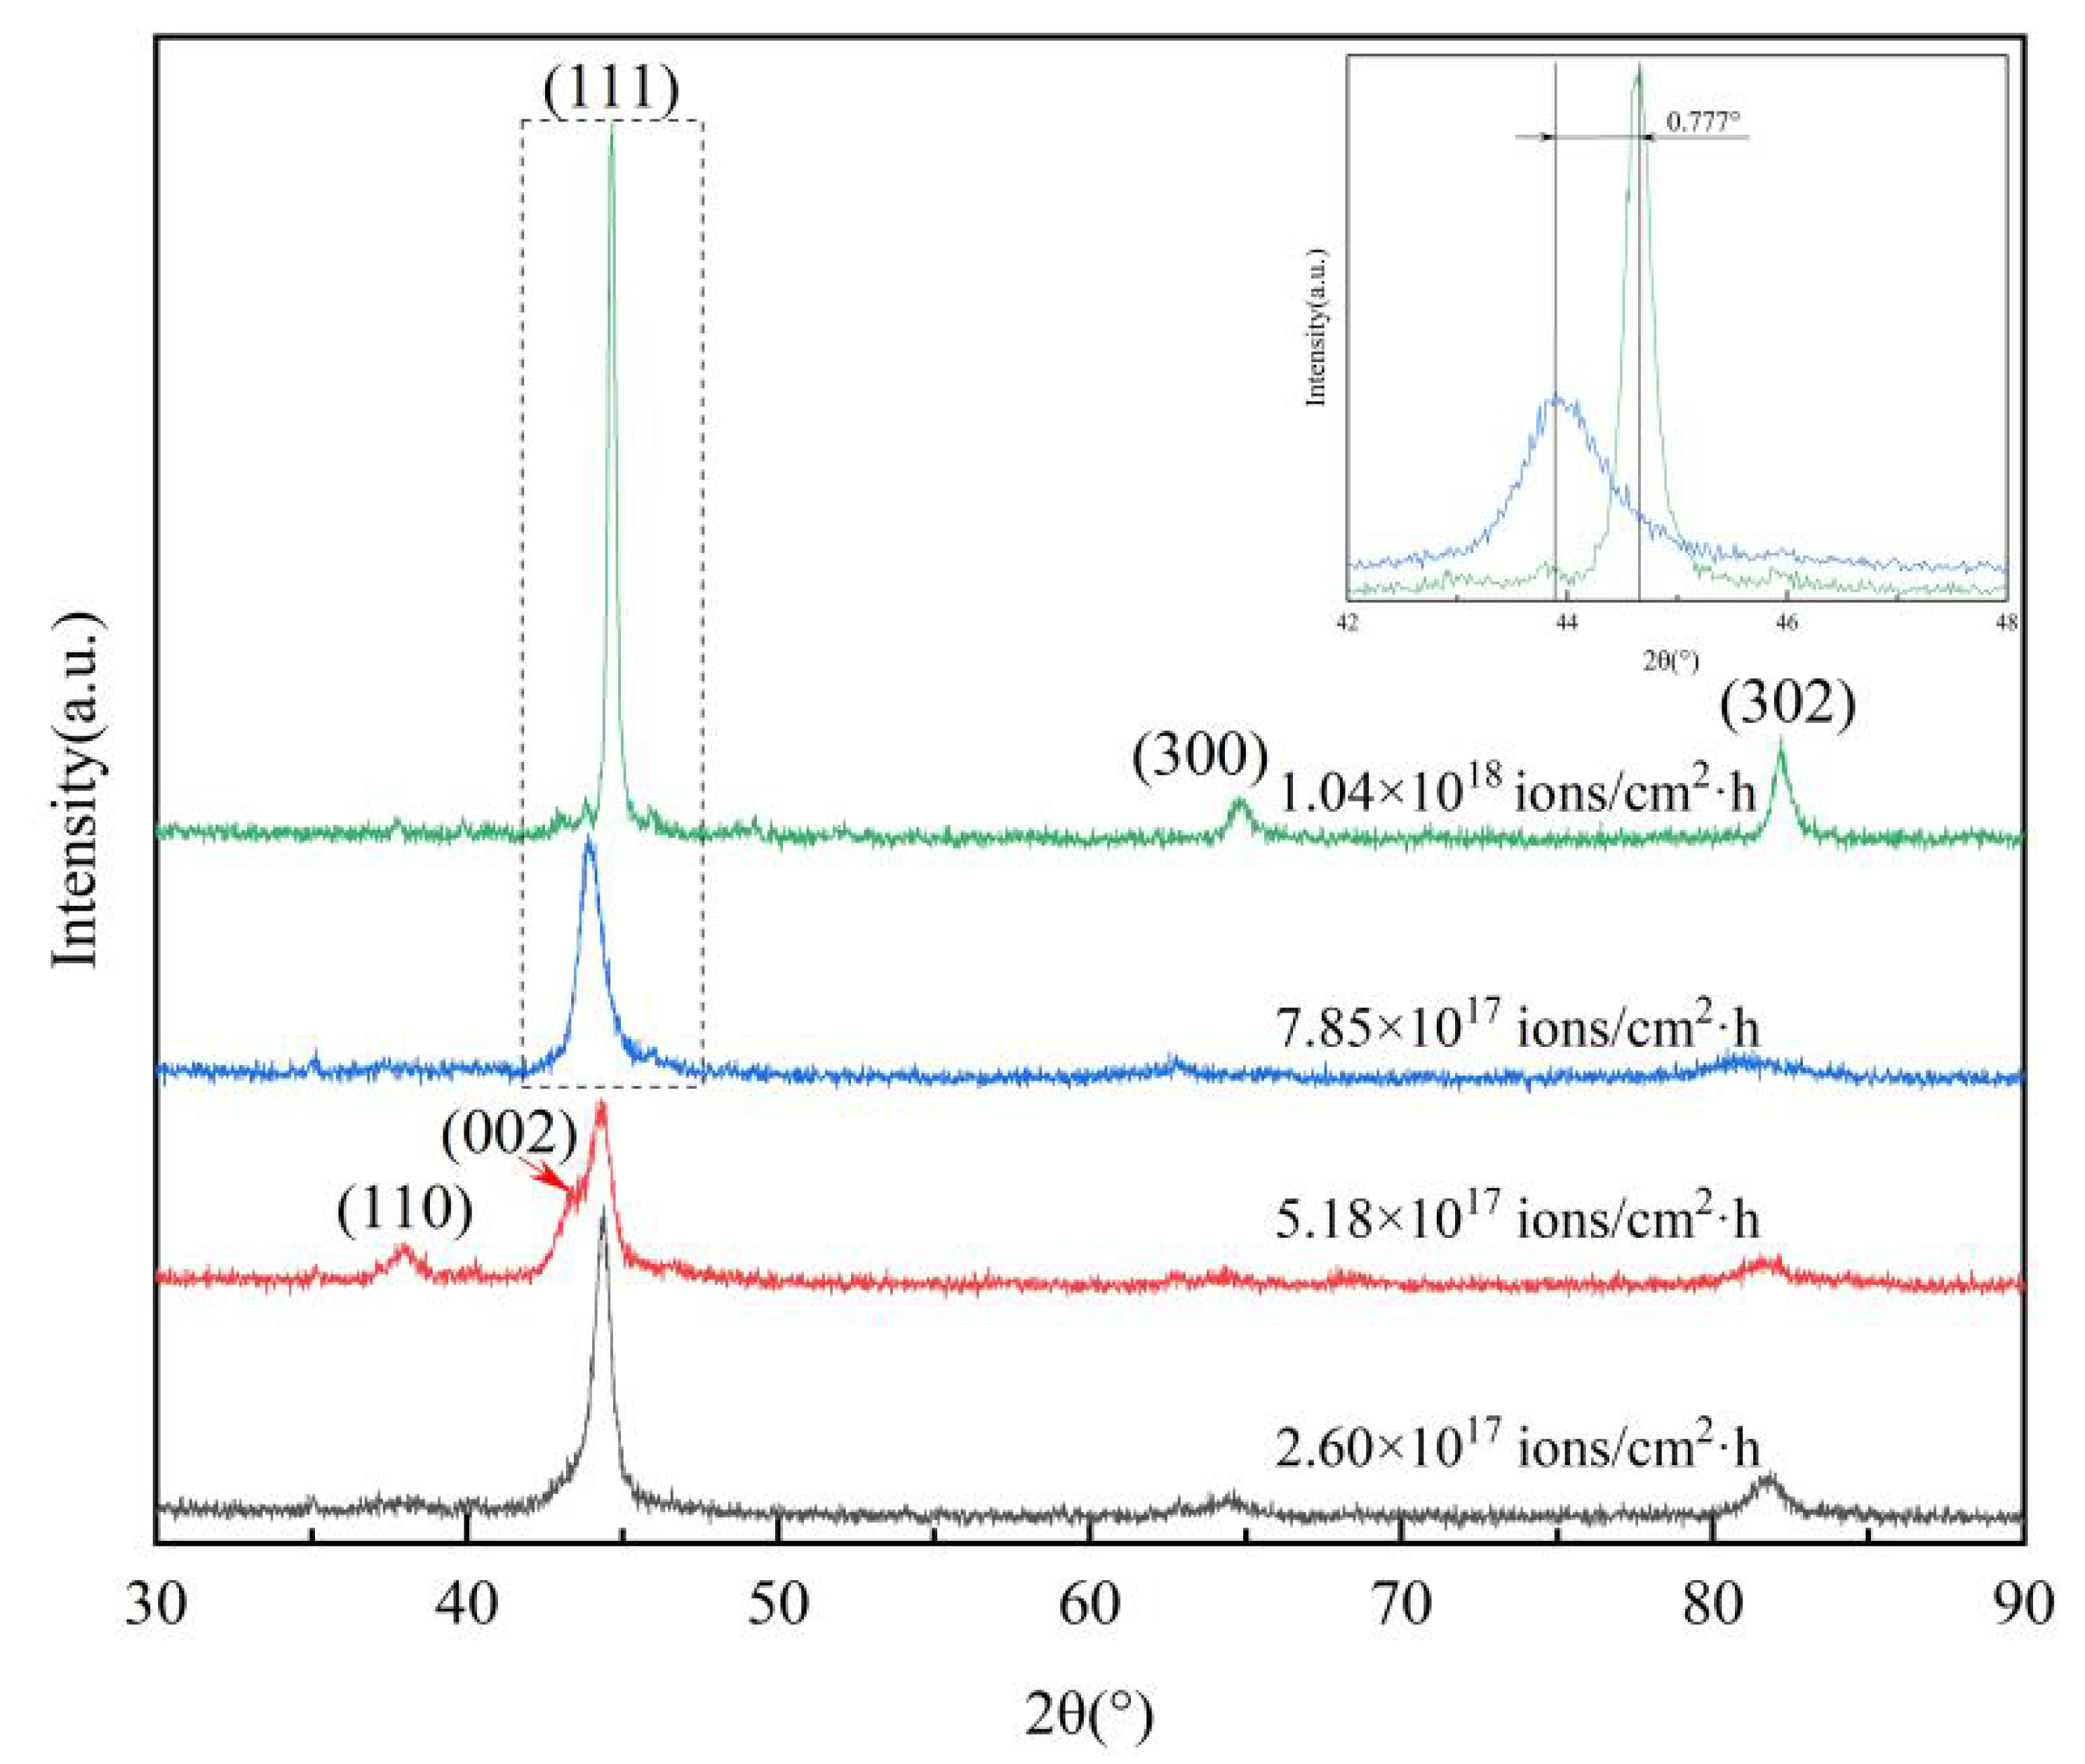
3.2. XRD Analysis of the Modified Layer by High-Dose-Rate Ion Implantation

The XRD patterns of a nanoscale modified layer treated under various implantation dose rates are shown in Figure 3. As can be observed from Figure 2, all of the implantation dose rates have three peaks, namely (111), (300) and (302), apart from the dose rate of 5.18 × 10¹⁷ ions/cm2·h which causes the formation of two extra peaks in the outermost implanted surface layer, as a consequence of the incorporation of iron and nitrogen atoms towards the matrix in a nonhomogeneous way, and forms the iron nitride compound phase. Meanwhile, the peaks corresponding to the implanted samples with a dose rate from 2.60 × 10¹⁷ to 7.85 × 10¹⁷ ions/cm2·h broadened and shifted slightly to the left by 0.777° compared with that of the implanted samples with a dose rate of 1.04 × 10¹⁸ ions/cm2·h, indicating that high-dose-rate ion implantation results in the fractional substitution of nitrogen ions at the iron site and causes an increase in lattice distortion in the implanted surface layer. The low peak shifting can also be ascribed to the fact that during the replacement of C with N, the crystallite size decreases, leading to a difference in the ionic radii of N and C. Peak shifting indicates a volume expansion of the unit cell; the lattice parameter for different dose rates has different values. Lattice expansion due to increased lattice parameters resulted in peak-shifting towards a lower angle, which indicates the lattice expansion of iron in 8Cr4Mo4V bearing steel due to N supersaturation, which was also confirmed by an increase in the lattice parameters as shown in Figure 4 [60]. For the samples implanted at the same dose, in addition to the inherent influence of ion implantation, the implantation dose rate plays an critical role in causing differences in the phase constituents as well. The higher-dose-rate implantation might act as a driving force for the broadening and shifting of diffraction peaks and the formation of phases to some extent.

3.3. Determination of Crystallite Size by Scherrer Analysis

The appearance of XRD peak broadening is due to both the sample and instrumental common effects, while the increase in lattice size and microstrain is due to the dislocation [48,49]. To better understand their individual contributions, it is essential to collect a standard material diffraction pattern to determine the instrumental broadening precisely [61,62]. The corrected instrumental broadening βhkl corresponds to the diffraction peak of the nanoscale modified layer can be measured by using the following equation [61,63]:
β hkl = β measured 2 β instrumental 2
where βmeasured and βinstrumental represent the measured and instrumental broadening, respectively. Generally, the crystallite size of the nanoscale modified layer is able to be estimated based on the XRD peak width through the following Scherrer equation [64,65,66,67]. The lattice strain and dislocation density induced in the modified layer are due to the crystal imperfection and distortion, which can be estimated by using the following formula [66,68]:
D = k λ β hkl cos θ
ε = β 4 tan θ
δ = 16 . 1 ε 2 b 2
where D represents the crystallite size (nm); k represents the shape factor, which here is 0.89; λ represents the wavelength of incident Cu-Kα, which here equals to 1.54056 Ǻ; β represents the peak width at half-maxima intensity; θ represents the peak position; ε is the microstrain; δ is dislocation density; and b is the Burgers vector.
The microstructural parameters containing the crystallite size, microstrain and dislocation density distribution of samples treated under various implantation dose rates are shown in Figure 4. It can be observed that the trend in crystallite size initially decreases and then tends to increase with the increase in dose rate. At the same time, it can be observed that the microstrain and dislocation density of the samples display the same regularities, namely they initially increase and then tend to decrease with the dose rate. At the dose rate of 5.18 × 10¹⁷ ions/cm2·h, both the microstrain and dislocation density reach the highest level of 7.716 × 10⁻³ and 1.559 × 10¹⁶ /m2, respectively.
The reason for this phenomenon is the incident nitrogen ions releasing energy into the samples and towards the matrix via sputtering and implanting, then the atoms begin the dynamic equilibrium in the implanted layer during the ion implantation process, which is shown vividly in Figure 1. Thus, the difference in the d-spacing of the crystal lattice planes results in the variation in the diffraction intensity [69]. It can be noticed that the transferred ion implantation energy reduces the microstrain along with the increase in crystallite size of the 8Cr4Mo4V steel sample at the cost of the grain boundaries [70]. As the crystallite size increases, its contribution to the observed peak width becomes smaller, which is demonstrated in X-ray diffraction analysis. The lattice distortions in the implanted 8Cr4Mo4V steel surface layer are another source of diffraction peak broadening. These can derive from the microstrain induced by compressive and tensile forces during high-dose-rate ion implantation, or they can arise from elements’ concentration gradients in the sample [71].

3.4. Estimation of Crystallite Size and Microstrain by Uniform Deformation Model (UDM)

From Equations (2) and (3), it can be clearly seen that the diffraction peaks’ broadening can be attributed to the crystallite size, and the broadening contributes to the microstrain. The relationship between the diffraction peaks’ broadening and lattice strain is given as Equation (5) [71,72]:
β hkl = k λ D cos θ + 4 ε tan θ
On rearranging Equation (5), we can obtain the following Equation (6) equivalently:
β hkl cos θ = k λ D + 4 ε sin θ
The above Equation (6) is an equation of a straight line and is regarded as a Williamson–Hall equation, which consider the isotropic nature of the crystals. In a Williamson–Hall-UDM model, the crystallite size and microstrain are assumed to be independent of each other. The Williamson–Hall–UDM plots of 8Cr4Mo4V steel for various dose rates are shown in Figure 5. As shown in Figure 4, it can be clearly seen that the plots are drawn with 4sinθ along the x-axis and βhklcosθ along the y-axis, and the lines are in good accordance with Equation (6). The slope of the plotted straight line offers the lattice strain value, whereas the intercept gives the value of the crystallite size. The calculated slope of the line increases with the dose rate, and the slope value is greater for the implanted sample dose rate of 1.04 × 10¹⁸ ions/cm2·h than for the dose rate of 2.60 × 10¹⁷ ions/cm2·h. It is clear that there exists the same trend of initial increase then decrease in the lattice strain with increasing implantation dose rate, which corresponds well with the Scherrer results. Moreover, the negative and positive slope of Williamson–Hall-UDM plots can been found, which infers the presence of compressive and tensile strain in the modified layer of 8Cr4Mo4V steel under high-dose-rate nitrogen ion implantation.

3.5. Estimation of Crystallite Size and Lattice Deformation Stress by Uniform Stress Deformation Model (USDM)

The Williamson–Hall-UDM method is based on the valid assumption that the samples are homogeneous and isotropic in nature, which is not satisfied in many cases and therefore a new anisotropic method is proposed [67]. In the modified Williamson–Hall-USDM model, the lattice deformation stress is assumed to be uniform and the microstrain is assumed to be small enough [66,67,68].
According to the Hooke’s law equation, lattice deformation stress and microstrain can be expressed as σ = εYhkl, where σ represents stress, ε represents microstrain and Yhkl is the anisotropic Young’s modulus. The modified Williamson–Hall equation is given as follows [73,74,75]:
β hkl cos θ = k λ D + 4 σ sin θ Y hkl
where Yhkl represents the Young’s modulus in the direction perpendicular to the set of the miller plane (hkl) and the equation for the cubic crystal lattice is given in Equation (8) [61,67,76]:
1 Y hkl = S 11 2 ( S 11 S 12 ) 1 2 S 44 h 2 k 2 + k 2 l 2 + h 2 l 2 h 2 + k 2 + l 2
where S11, S12 and S44 show the elastic compliances of the cubic iron nitrides layer and their values are 13.2 × 10⁻¹² Pa−1, −6 × 10⁻¹² Pa−1 and 9.5 × 10⁻¹² Pa−1, respectively.
The typical plots of 8Cr4Mo4V steel for various dose rates between βhklcosθ and 4sinθ/Yhkl are given in Figure 6. The slope of the plotted straight line offers the value of the lattice deformation stress, whereas the intercept of the y-axis provides the average crystallite size of the nanoscale modified layer. As can be easily seen from the Williamson–Hall-USDM graph, it can be found that the stress calculated from the slope of the line is slightly smaller for the implanted sample with a dose rate of 1.04 × 10¹⁸ ions/cm2·h than for the dose rate of 2.60 × 10¹⁷ ions/cm2·h, and the slope of the line reaches its highest for the implanted sample with a dose rate of 7.85 × 10¹⁷ ions/cm2·h. The higher the increase in the slope of the approximating straight line, the sharper the increase in the magnitude of the microdistortions. The results observed herein are consistent with the observation from the Williamson–Hall-UDM model.

3.6. Estimation of Deformation Energy Density by Uniform Deformation Energy Density Model (UDEDM)

The lattice strain is assumed to be isotropic in the UDM model, whereas the deformation stress and strain is assumed to be anisotropic in the USDM model. Unfortunately, the linear relation between deformation stress and strain can be regarded as invalid due to the existence of crystal imperfections, dislocations and different defects. As a result, the strain energy density is assumed to be uniform and it is considered that the energy density is the source of anisotropic microstrain in the Uniform Deformation Energy Density Model (UDEDM).
According to Hooke’s law for the calculation of energy (u = ε2Yhkl/2), where u represents the deformation energy density, ε represents the lattice strain and Yhkl is the anisotropic Young’s modulus. Substituting u into Equation (7) will obtain the modified Williamson–Hall equation to represent the UDEDM [52,68,74,75,76]:
β hkl cos θ = k λ D + 4 sin θ 2 u Y hkl 1 / 2
The plots of 8Cr4Mo4V steel for various dose rates between 4sinθ(2/Yhkl)1/2 (x-axis) and βhklcosθ (y-axis) are given in Figure 7. As can clearly be seen from Figure 6, the crystallite size and anisotropic deformation energy density are determined by the intercept of the y-axis and the strain by the slope of the x-axis. By using the above-mentioned equation, the values of deformation energy density, crystallite size and lattice strain can be calculated at the same time. It can be observed that the slope value of the line is much smaller for the implanted sample with a dose rate of 2.60 × 10¹⁷ ions/cm2·h than for the dose rate of 1.04 × 10¹⁸ ions/cm2·h, and the slope value reaches its highest for the implanted sample with a dose rate of 7.85 × 10¹⁷ ions/cm2·h. Furthermore, it is worth noting that there exists a negative and positive slope in the plots, which indicates the presence of compressive and tensile strain in the modified layer of 8Cr4Mo4V steel under high-dose-rate nitrogen ion implantation [53,68,77]. The combined increase in lattice distortion at different positions in the implanted surface layer resulted in the diffraction peak broadening. The three various Williamson–Hall models have been proven to be the effective methods for understanding the microstructure evolution of 8Cr4Mo4V steel under high-dose-rate ion implantation and estimating the lattice parameters of materials.

4. Conclusions

In the present study, an attempt to understand the influence of plasma immersion ion implantation on the modified layer of 8Cr4Mo4V bearing steel in various dose rates of 2.60 × 10¹⁷, 5.18 × 10¹⁷, 7.85 × 10¹⁷ and 1.04 × 10¹⁸ ions/cm2·h has been investigated. The main conclusions obtained are drawn as follows:
(1)
X-ray diffraction analysis suggests that the peaks corresponding to the implanted samples with a dose rate from 2.60 × 10¹⁷ to 7.85 × 10¹⁷ ions/cm2·h broadened and slightly shift to left by 0.777° towards, when compared with that of the implanted samples with a dose rate of 1.04 × 10¹⁸ ions/cm2·h.
(2)
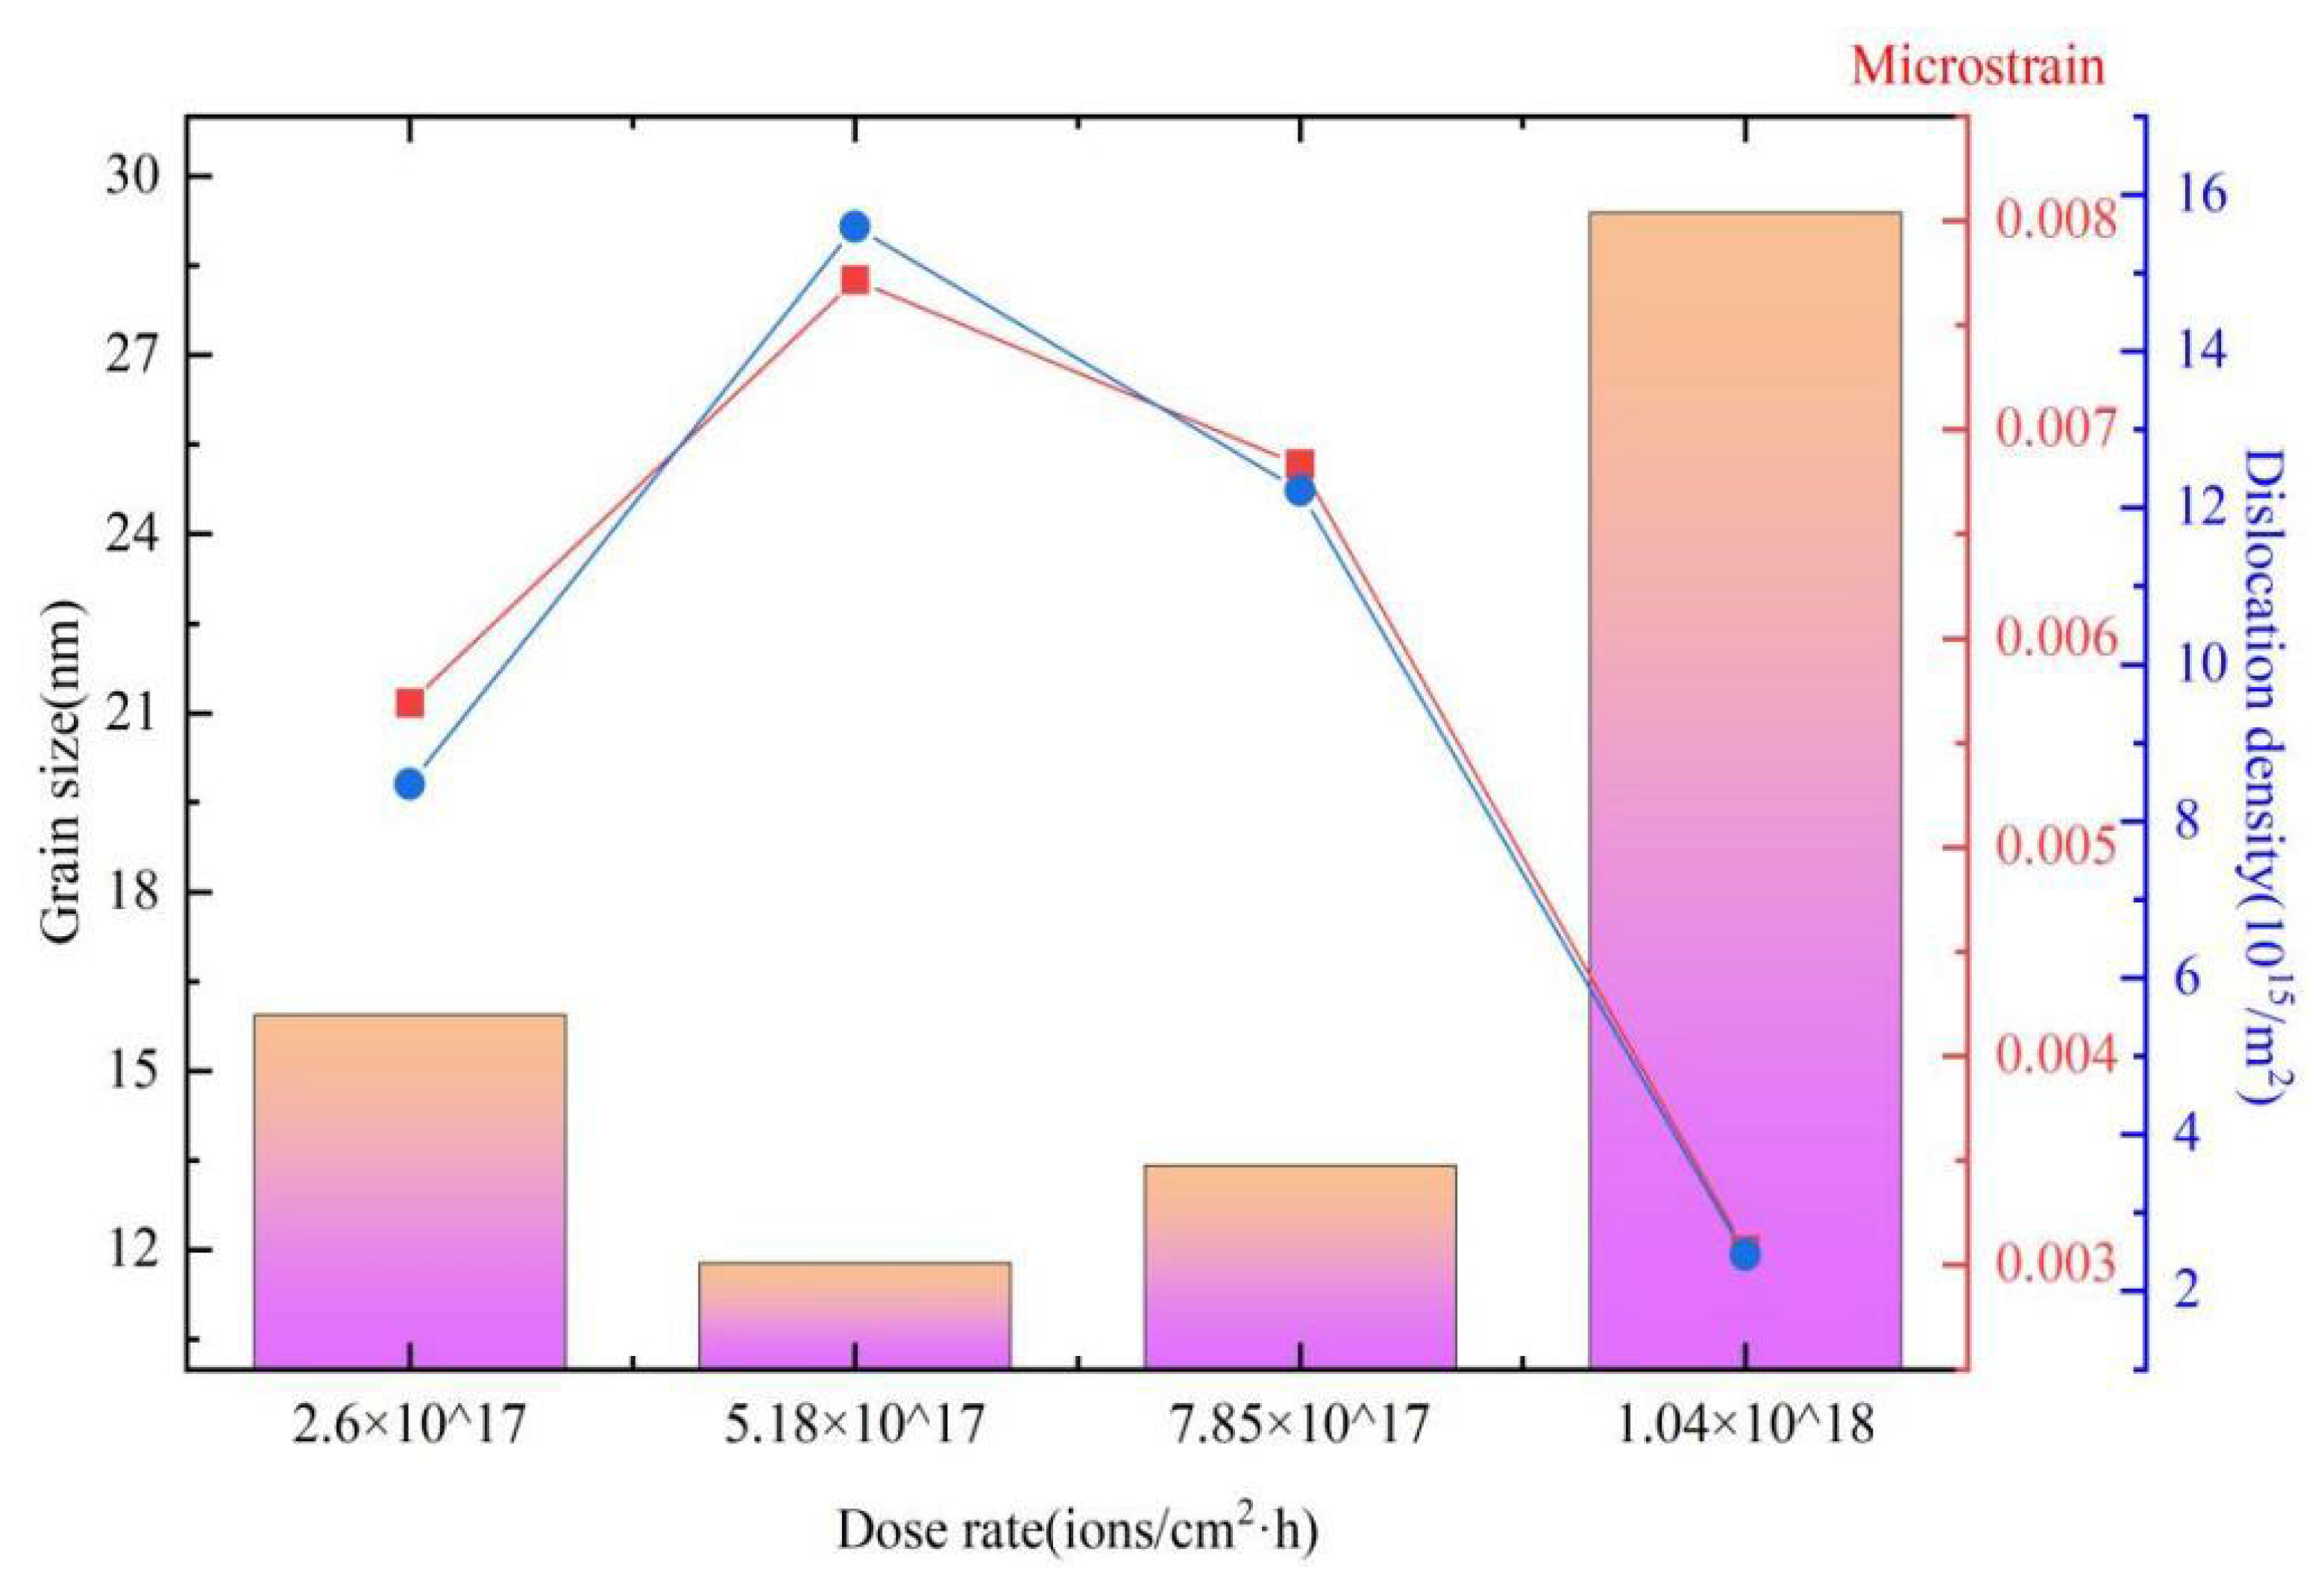
The crystallite size initially decreased and then tended to increase; the microstrain and dislocation density initially increased and then tended to decrease with the increasing of dose rate. The microstrain and dislocation density reached the highest level of 7.716 × 10⁻³ and 1.559 × 10¹⁵ /m2, respectively, at the dose rate of 5.18 × 10¹⁷ ions/cm2·h.
(3)
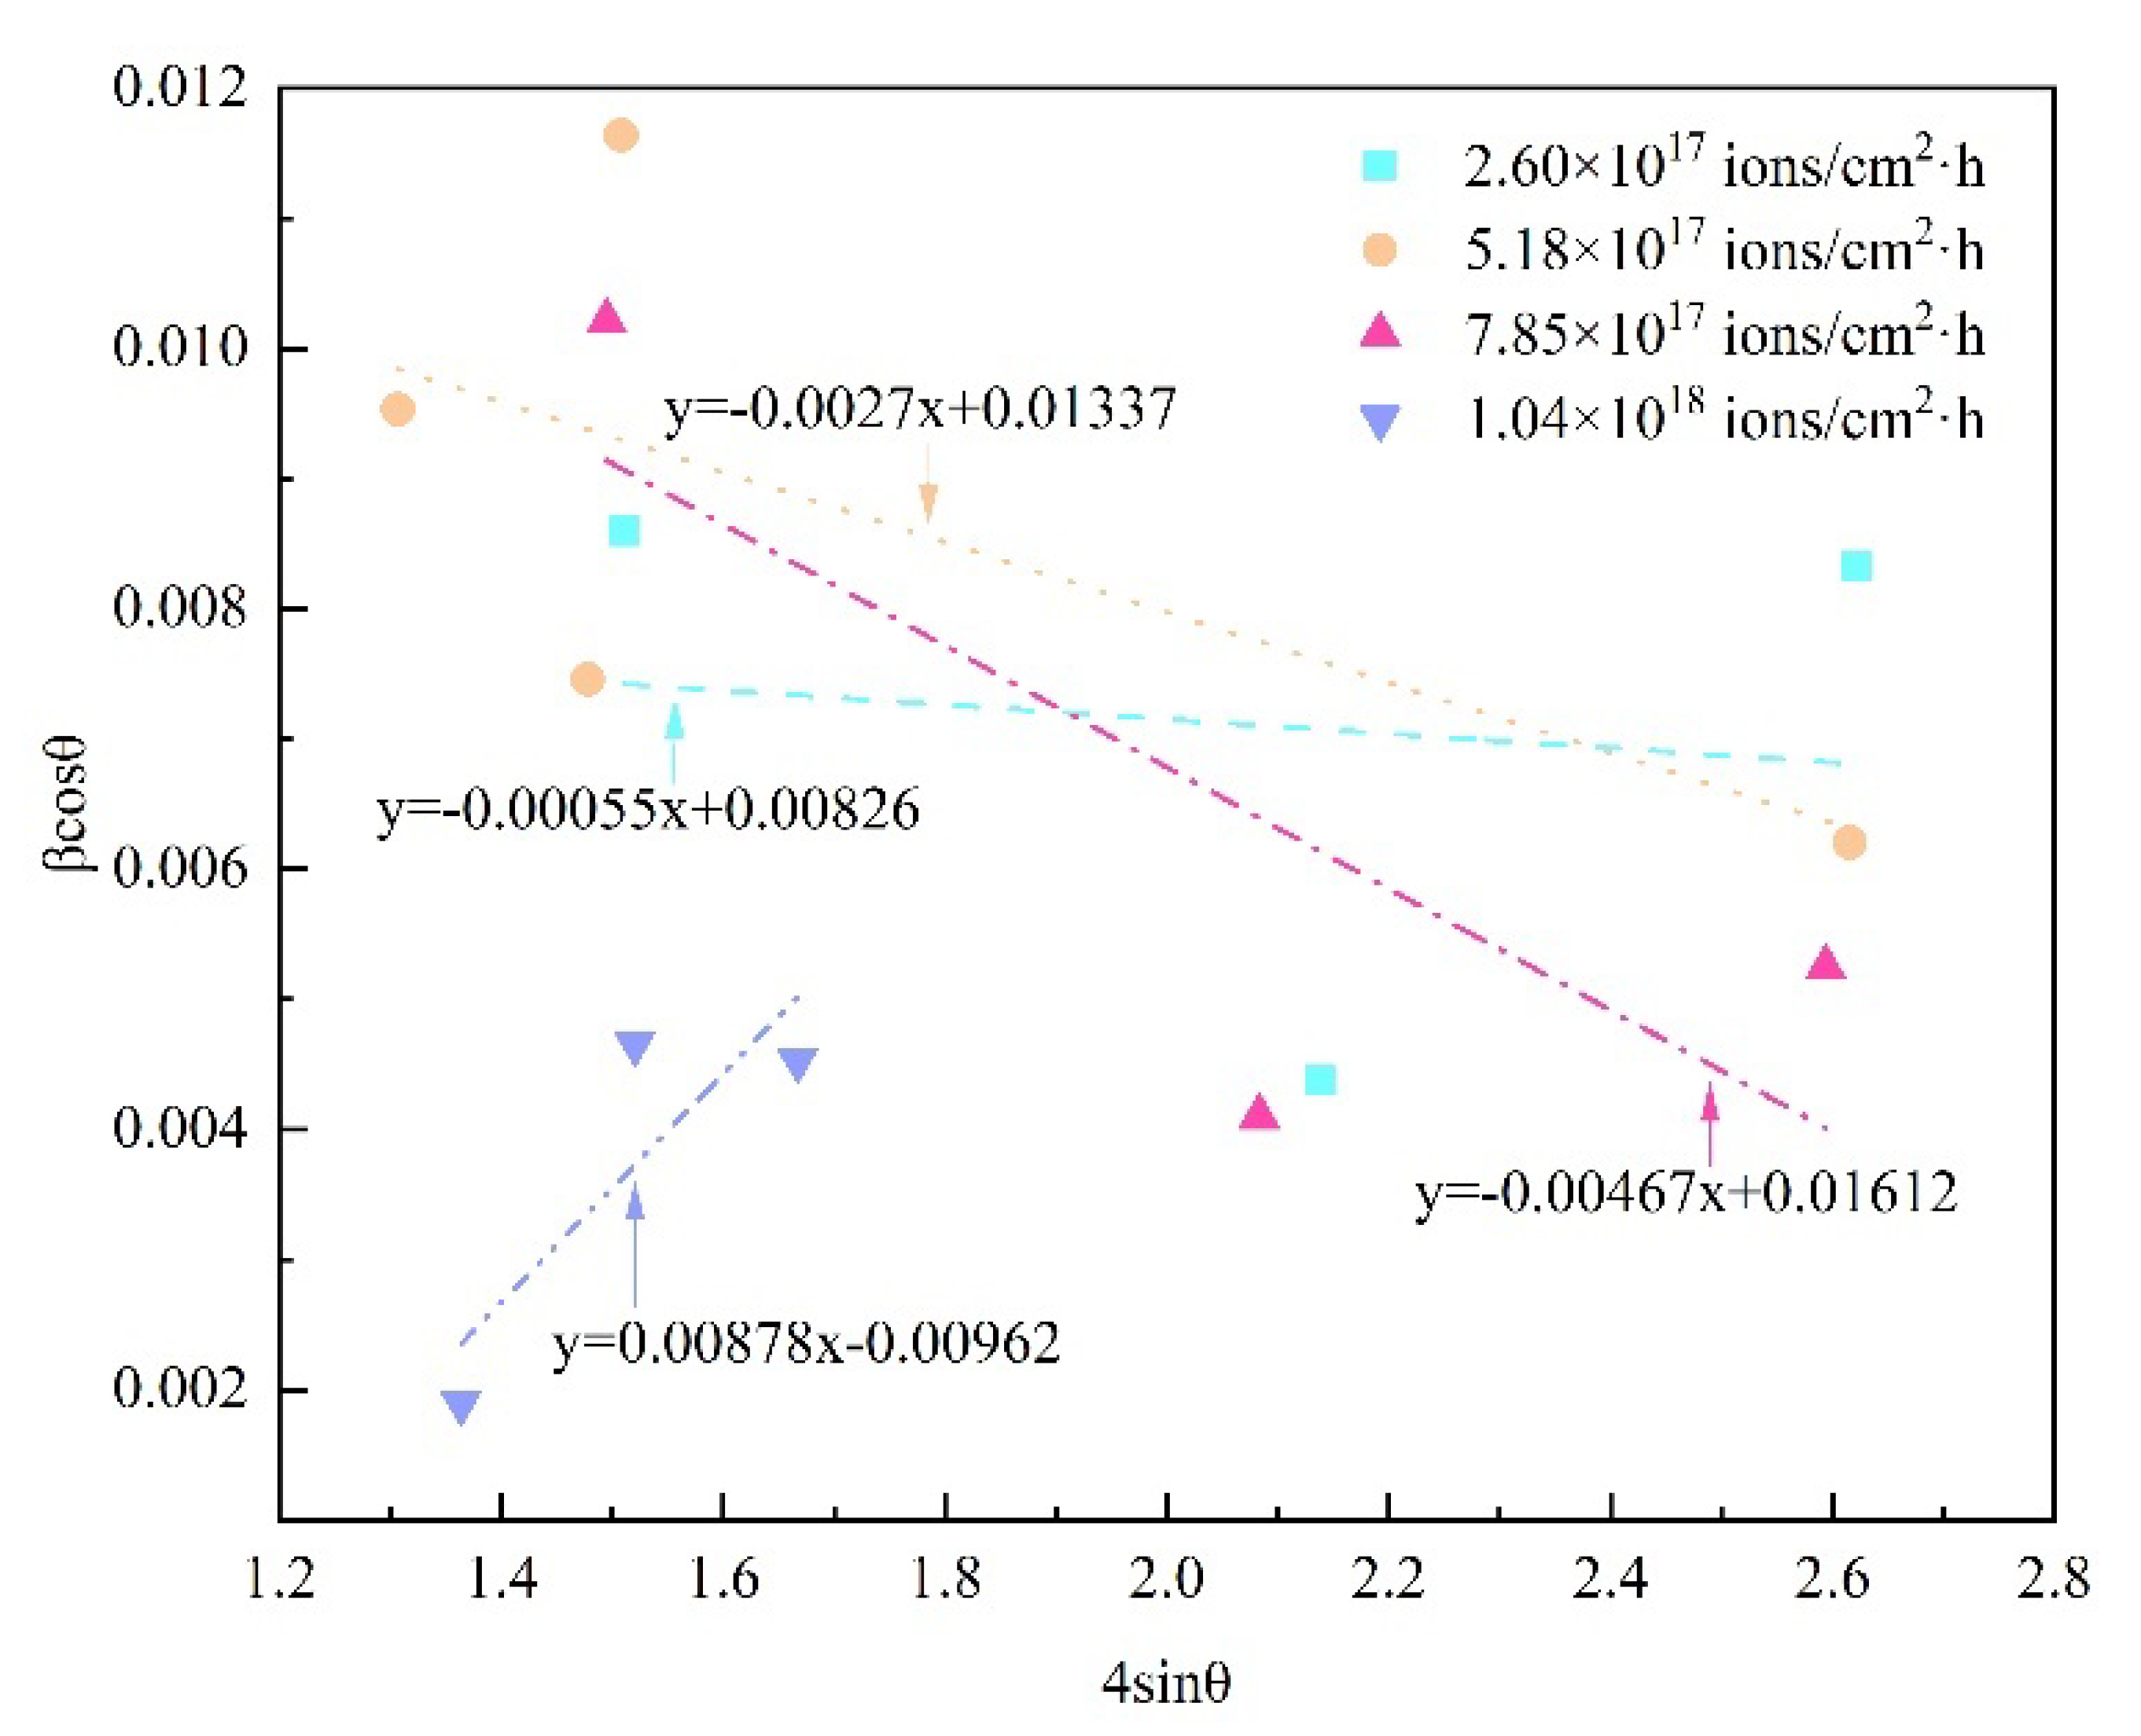
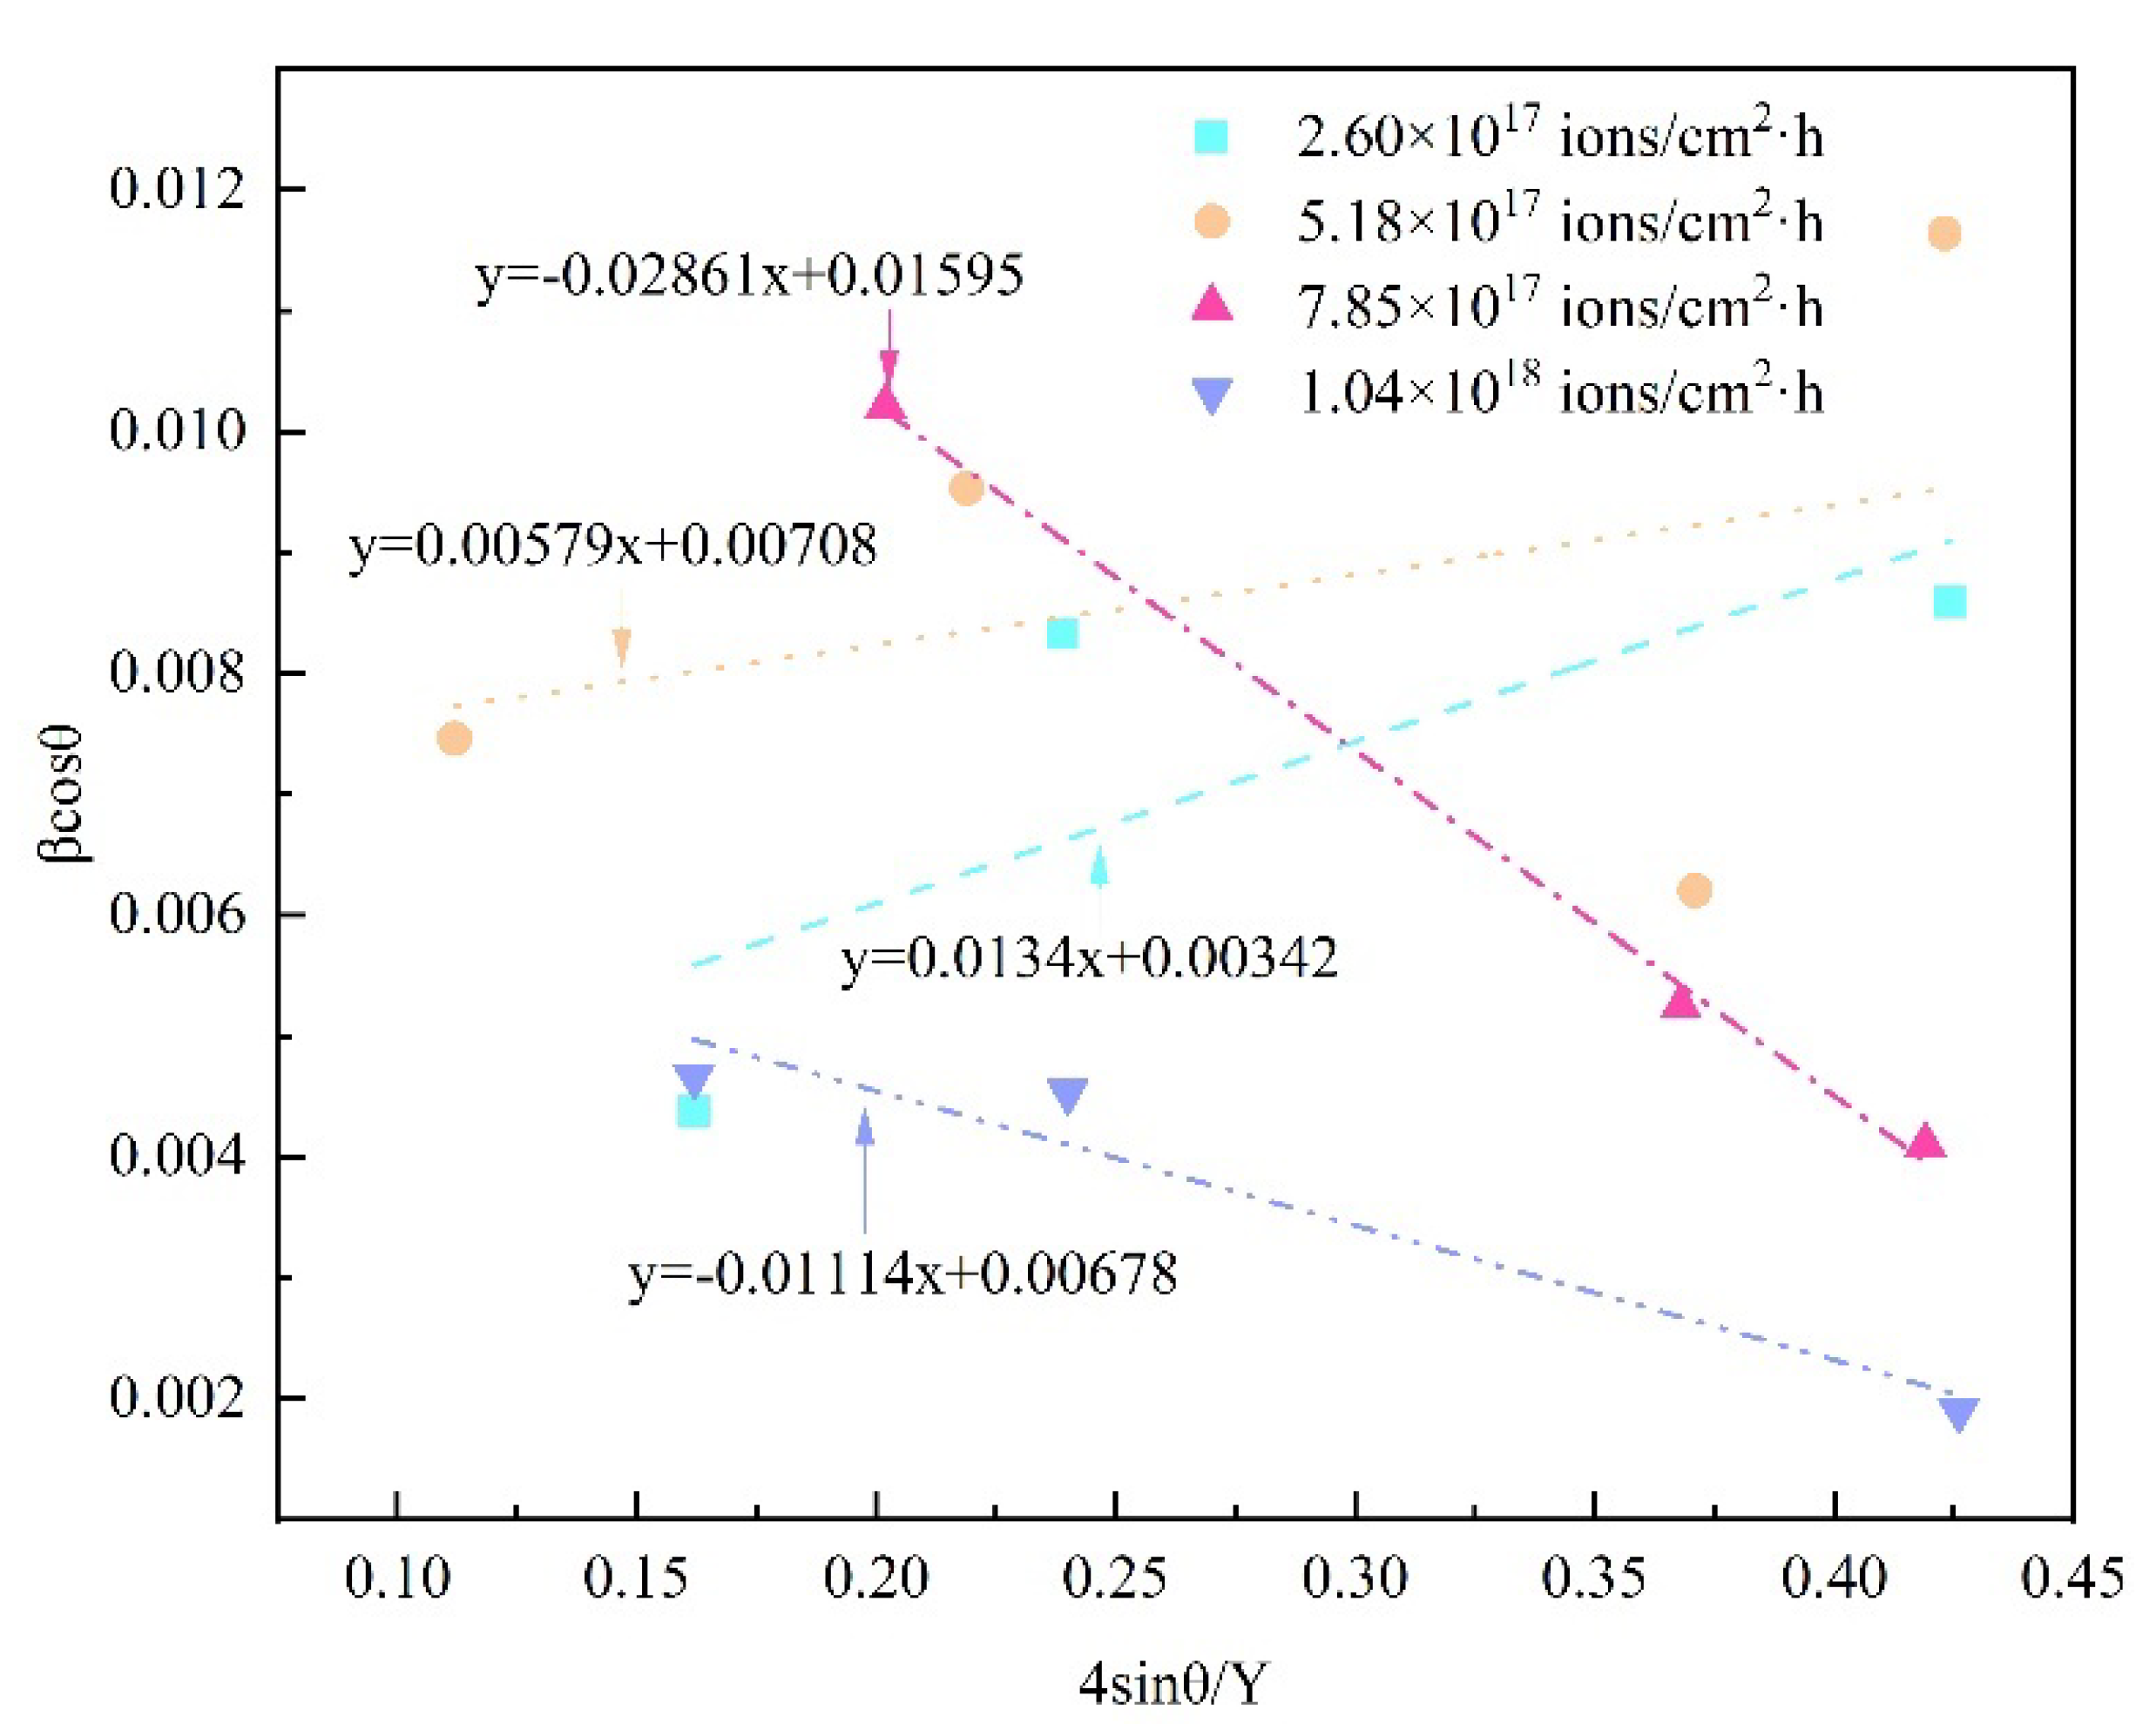
In all of the Williamson–Hall graphs, the slope of the line reveals the different angle and values, which implies that the higher the increase in the slope of the approximating straight line, the sharper the increase in the magnitude of the microdistortions.
(4)
Williamson–Hall methods reveal that there exist a negative and positive slope in various orientations, indicating a compressive and tensile strain induced in 8Cr4Mo4V steel by various high dose rates during plasma immersion ion implantation.
(5)
The Williamson–Hall methods in this work demonstrate the feasibility of calculating lattice parameters and provide a further application for different materials to estimate the crystallite size, microstrain and dislocation density.

Author Contributions

B.M.: conceptualization, validation, writing—original draft, investigation, writing—review and editing. J.Z.: validation, investigation. J.G.: methodology. X.M.: supervision, conceptualization, funding acquisition, writing—review and editing. L.W.: supervision, funding acquisition. X.Z.: methodology, investigation. All authors have read and agreed to the published version of the manuscript.

Funding

This research was funded by National Science and Technology Major Project (2017-VII-0003-0096); Basic Research Project (2020-JCJQ-ZD-155-12).

Institutional Review Board Statement

Not applicable.

Informed Consent Statement

Not applicable.

Data Availability Statement

The datasets used and/or analyzed during the current study available from the corresponding author on reasonable request.

Acknowledgments

The authors acknowledge the financial support of the National Science and Technology Major Project (No. 2017-VII-0003-0096) and Basic Research Project (No. 2020-JCJQ-ZD-155-12).

Conflicts of Interest

The authors declare that they have no known competing financial interests or personal relationships that could have appeared to influence the work reported in this paper.

References

  1. Liu, D.; Liu, D.; Zhang, X.; He, G.; Ma, A.; Wu, G. Plain fatigue and fretting fatigue behaviors of 17-4PH steel subjected to ultrasonic surface rolling process: A comparative study. Surf. Coat. Technol. 2020, 399, 126196. [Google Scholar] [CrossRef]
  2. Bhadeshia, H. Steels for bearings. Prog. Mater. Sci. 2012, 57, 268–435. [Google Scholar] [CrossRef]
  3. Zaretsky, E.V. Rolling bearing steels—A technical and historical perspective. Mater. Sci. Technol. 2013, 28, 58–69. [Google Scholar] [CrossRef]
  4. Wei, Y.; Yu, X.; Su, Y.; Shen, X.; Xia, Y.; Yang, W. Effect of residual stress and microstructure evolution on size stability of M50 bearing steel. J. Mater. Res. Technol. 2021, 10, 651–661. [Google Scholar] [CrossRef]
  5. Li, Z.; Li, K.; Qian, C.; Wang, D.; Ji, W.; Wu, Y.; Cai, Z.; Liu, Q. Effect of pulsed magnetic field on retained austenite of quenched 8Cr4Mo4V steel under cryogenic condition. J. Mater. Res. Technol. 2023, 23, 5004–5015. [Google Scholar] [CrossRef]
  6. Su, Y.; Li, P.; Wang, S.; Yang, S.; Wu, J.; Yu, X.; Liu, H. Influence of vacuum graded austempering treatment on microstructure and mechanical properties of M50 steel. J. Mater. Res. Technol. 2022, 21, 2721–2729. [Google Scholar] [CrossRef]
  7. Niu, J.; Zhang, X.; Ma, X.; Liu, Y.; Wang, L.; Wu, T. Characterization of vein-like structures formed in nitrided layers during plasma nitriding of 8Cr4Mo4V steel. Materialia 2022, 22, 101378. [Google Scholar] [CrossRef]
  8. Niu, J.; Qureshi, M.W.; Ding, Z.; Ma, X.; He, Y. Effect of nitriding on the transformation of alloy carbides (VC and Mo2C) in 8Cr4Mo4V steel. Appl. Surf. Sci. 2023, 610, 155561. [Google Scholar] [CrossRef]
  9. Miao, B.; Zhang, X.; Ma, X.X. Effects of microstructure and nanohardness of the 8Cr4Mo4V steel under high-dose-rate N-PIII. Trans. IMF 2023, in press. [Google Scholar] [CrossRef]
  10. Jiang, H.; Shan, D.; Guo, B.; Zong, Y. Effect of fibrous macrostructure on mechanical properties, anisotropy and fracture mechanism of roller bearing ring. Mat. Sci. Eng. A. 2021, 816, 141311. [Google Scholar] [CrossRef]
  11. Jiang, H.; Song, Y.; Wu, Y.; Shan, D.; Zong, Y. Macrostructure, microstructure and mechanical properties evolution during 8Cr4Mo4V steel roller bearing inner ring forging process. Mater. Sci. Eng. A 2020, 798, 140196. [Google Scholar] [CrossRef]
  12. Haolin, L.; Huiqin, S.; Chen, M.; Qifa, Y.; Qiu, X.; Deguang, X.; Tianyou, Z. Effects of B, N, Cr and Mo ion implantation on the corrosion resistance of pure iron and its alloys (GCr15 and Cr4Mo4V). Vacuum 1989, 39, 187–189. [Google Scholar] [CrossRef]
  13. Wang, F.; Zhou, C.; Zheng, L.; Zhang, H. Corrosion resistance of carbon ion-implanted M50NiL aerospace bearing steel. Prog. Nat. Sci. 2017, 27, 615–621. [Google Scholar] [CrossRef]
  14. Yu, X.; Wei, Y.; Zheng, D.; Shen, X.; Su, Y.; Xia, Y.; Liu, Y. Effect of nano-bainite microstructure and residual stress on friction properties of M50 bearing steel. Tribol. Int. 2022, 165, 107285. [Google Scholar] [CrossRef]
  15. Jiang, T.; Zhang, Q. Bearing failure impulse enhancement method using multiple resonance band centre positioning and envelope integration. Measurement 2022, 200, 111623. [Google Scholar] [CrossRef]
  16. Qian, D.; Liu, Y.; Ren, H.; Wang, F.; Wu, M.; Deng, S. Microstructure and mechanical properties evolution of aviation M50 steel fabricated by the multiple electro-assisted rolling. J. Mater. Res. Technol. 2022, 20, 496–507. [Google Scholar] [CrossRef]
  17. Yue, X.; Hu, S.; Wang, X.; Liu, Y.; Yin, F.; Hua, L. Understanding the nanostructure evolution and the mechanical strengthening of the M50 bearing steel during ultrasonic shot peening. Mater. Sci. Eng. A 2022, 836, 142721. [Google Scholar] [CrossRef]
  18. Hou, X.-Q.; Zhang, Z.; Liu, C.-K.; Tao, C.-H. Formation mechanism and influence of white etching area on contact fatigue spalling of M50 bearing steel. Eng. Fail. Anal. 2022, 139, 106273. [Google Scholar] [CrossRef]
  19. Wang, C.; Zhang, C.; Gu, L.; Bi, M.; Hou, P.; Zheng, D.; Wang, L. Analysis on surface damage of M50 steel at impact-sliding contacts. Tribol. Int. 2020, 150, 106384. [Google Scholar] [CrossRef]
  20. Xie, X.; Chen, C.; Luo, J.; Xu, J. The microstructure and tribological properties of M50 steel surface after titanium ion implantation. Appl. Surf. Sci. 2021, 564, 150349. [Google Scholar] [CrossRef]
  21. Dodd, A.; Kinder, J.; Torp, B.; Nielsen, B.; Rangel, C.; da Silva, M. The effect of ion implantation on the fatigue life and corrosion resistance of M50 steel bearings. Surf. Coatings Technol. 1995, 74–75, 754–759. [Google Scholar] [CrossRef]
  22. Rangel, C.; Simplicio, M.; Consiglieri, A.; Nielsen, B.; Torp, B.; Teixeira, N.; Alves, J.; Silva, M.; Soares, J.; Dodd, A.; et al. The effect of the angle of incidence on the aqueous corrosion of ion implanted M50 steel substrates. Surf. Coat. Technol. 1992, 51, 483–488. [Google Scholar] [CrossRef]
  23. Du, N.; Liu, H.; Cao, Y.; Fu, P.; Sun, C.; Liu, H.; Li, D. In situ investigation of the fracture of primary carbides and its mechanism in M50 steel. Mater. Charact. 2022, 186, 111822. [Google Scholar] [CrossRef]
  24. Wang, F.; Qian, D.; Hua, L.; Mao, H.; Xie, L.; Song, X.; Dong, Z. Effect of high magnetic field on the microstructure evolution and mechanical properties of M50 bearing steel during tempering. Mater. Sci. Eng. A 2020, 771, 138623. [Google Scholar] [CrossRef]
  25. Wang, F.; Qian, D.; Hua, L.; Lu, X. The effect of prior cold rolling on the carbide dissolution, precipitation and dry wear behaviors of M50 bearing steel. Tribol. Int. 2019, 132, 253–264. [Google Scholar] [CrossRef]
  26. Wang, Y.; Clayton, C.; Hubler, G.; Lucke, W.; Hirvonen, J. Applications of ion implantation for the improvement of localized corrosion resistance of M50 bearing steel. Thin Solid Films 1979, 63, 11–18. [Google Scholar] [CrossRef]
  27. Kang, Q.; Wei, K.; Fan, H.; Liu, X.; Hu, J. Ultra-high efficient novel plasma aluminum-nitriding methodology and performances analysis. Scr. Mater. 2022, 220, 114902. [Google Scholar] [CrossRef]
  28. Yang, L.; Xue, W.; Gao, S.; Liu, H.; Cao, Y.; Duan, D.; Li, D.; Li, S. Study on sliding friction and wear behavior of M50 bearing steel with rare earth addition. Tribol. Int. 2022, 174, 107725. [Google Scholar] [CrossRef]
  29. Ma, H.; Wei, K.; Zhao, X.; Liu, X.; Hu, J. Performance enhancement by novel plasma boron-nitriding for 42CrMo4 steel. Mater. Lett. 2021, 304, 130709. [Google Scholar] [CrossRef]
  30. Daroonparvar, M.; Bakhsheshi-Rad, H.R.; Saberi, A.; Razzaghi, M.; Kasar, A.K.; Ramakrishna, S.; Menezes, P.L.; Misra, M.; Ismail, A.F.; Sharif, S.; et al. Surface modification of magnesium alloys using thermal and solid-state cold spray processes: Challenges and latest progresses. J. Magnes. Alloy. 2022, 10, 2025–2061. [Google Scholar] [CrossRef]
  31. Cisternas, M.; Bhuyan, H.; Retamal, M.; Casanova-Morales, N.; Favre, M.; Volkmann, U.; Saikia, P.; Diaz-Droguett, D.; Mändl, S.; Manova, D.; et al. Study of nitrogen implantation in Ti surface using plasma immersion ion implantation & deposition technique as biocompatible substrate for artificial membranes. Mater. Sci. Eng. C 2020, 113, 111002. [Google Scholar] [CrossRef]
  32. Chu, P.K. Progress in direct-current plasma immersion ion implantation and recent applications of plasma immersion ion implantation and deposition. Surf. Coat. Technol. 2013, 229, 2–11. [Google Scholar] [CrossRef]
  33. Anders, A. Metal plasma immersion ion implantation and deposition: A review. Surf. Coat. Technol. 1997, 93, 158–167. [Google Scholar] [CrossRef]
  34. Shanaghi, A.; Chu, P.K. Enhancement of mechanical properties and corrosion resistance of NiTi alloy by carbon plasma immersion ion implantation. Surf. Coat. Technol. 2019, 365, 52–57. [Google Scholar] [CrossRef]
  35. Xu, C.; Wang, X.; Zhang, B.; Luo, X.; Tang, Z.; Dai, S. Effect of the Pre-Shot Peening and Nitrogen Ion Implantation Combined Surface Treatments on the Surface Structure and Properties of Gear Steel 16Cr3NiWMoVNbE. Metals 2022, 12, 1509. [Google Scholar] [CrossRef]
  36. Chiu, S.; Lee, S.; Wang, C.; Tai, F.; Chu, C.; Gan, D. Electrical and mechanical properties of DLC coatings modified by plasma immersion ion implantation. J. Alloy. Compd. 2008, 449, 379–383. [Google Scholar] [CrossRef]
  37. Ziegler, J.F. Ion Implantation Science and Technology; Yorktown Heights: New York, NY, USA, 1988. [Google Scholar] [CrossRef]
  38. Fernandes, B.; Mändl, S.; Oliveira, R.; Ueda, M. Mechanical properties of nitrogen-rich surface layers on SS304 treated by plasma immersion ion implantation. Appl. Surf. Sci. 2014, 310, 278–283. [Google Scholar] [CrossRef]
  39. Zhu, Z.; Tian, X.; Wang, Z.; Gong, C.; Yang, S.; Fu, R.K.; Chu, P.K. Uniformity enhancement of incident dose on concave surface in plasma immersion ion implantation assisted by beam-line ion source. Surf. Coat. Technol. 2011, 206, 2021–2024. [Google Scholar] [CrossRef]
  40. Rajkumar, R.; Kumar, M.; George, P.; Mukherjee, S.; Chari, K. Dose- and energy-dependent behaviour of silicon nitride films produced by plasma immersion ion implantation. Surf. Coat. Technol. 2002, 156, 272–275. [Google Scholar] [CrossRef]
  41. Koval, N.; Ryabchikov, A.; Sivin, D.; Lopatin, I.; Krysina, O.; Akhmadeev, Y.; Ignatov, D. Low-energy high-current plasma immersion implantation of nitrogen ions in plasma of non-self-sustained arc discharge with thermionic and hollow cathodes. Surf. Coat. Technol. 2018, 340, 152–158. [Google Scholar] [CrossRef]
  42. Ueda, M.; Reuther, H.; Gunzel, R.; Beloto, A.; Abramof, E.; Berni, L. High dose nitrogen and carbon shallow implantation in Si by plasma immersion ion implantation. Nucl. Instruments Methods Phys. Res. Sect. B Beam Interact. Mater. Atoms 2001, 175–177, 715–720. [Google Scholar] [CrossRef]
  43. Nikmah, A.; Rudyardjo, D.I.; Ady, J.; Taufiq, A. Studies on Density, Corrosion Rate and Hardness Characteristics of Stainless Steel Implanted by Nitrogen Ion. IOP Conf. Ser. Mater. Sci. Eng. 2019, 515, 012018. Available online: https://iopscience.iop.org/article/10.1088/1757-899X/515/1/012018 (accessed on 1 April 2019). [CrossRef]
  44. Yan, X.; Meng, J.; Gao, K.; Pang, X.; Volinsky, A.A. Tribo-corrosion and Albumin Attachment of Nitrogen Ion-Implanted CoCrMo Alloy During Friction Onset. J. Mater. Eng. Perform. 2019, 28, 363–371. [Google Scholar] [CrossRef]
  45. Jin, J.; Wang, W.; Chen, X. Microstructure and Mechanical Properties of Ti + N Ion Implanted Cronidur30 Steel. Materials 2019, 12, 427. [Google Scholar] [CrossRef] [PubMed]
  46. Bouras, M.; Boumaiza, A.; Ji, V.; Rouag, N. XRD peak broadening characterization of deformed microstructures and heterogeneous behavior of carbon steel. Theor. Appl. Fract. Mech. 2012, 61, 51–56. [Google Scholar] [CrossRef]
  47. Zhang, H.; Wang, W.; Yuan, L.; Wei, Z.; Zhang, H.; Zhang, W. Quantitative phase analysis of Ti-3Al-5Mo-4.5 V dual phase titanium alloy by XRD whole pattern fitting method. Mater. Charact. 2022, 187, 111854. [Google Scholar] [CrossRef]
  48. Nakamura, Y.; Oguro, K.; Uehara, I.; Akiba, E. X-ray diffraction peak broadening and lattice strain in LaNi5-based alloys. J. Alloy. Compd. 2000, 298, 138–145. [Google Scholar] [CrossRef]
  49. Venkateswarlu, K.; Bose, A.C.; Rameshbabu, N. X-ray peak broadening studies of nanocrystalline hydroxyapatite by Williamson–Hall analysis. Phys. B Condens. Matter 2010, 405, 4256–4261. [Google Scholar] [CrossRef]
  50. Basak, M.; Rahman, L.; Ahmed, F.; Biswas, B.; Sharmin, N. The use of X-ray diffraction peak profile analysis to determine the structural parameters of cobalt ferrite nanoparticles using Debye-Scherrer, Williamson-Hall, Halder-Wagner and Size-strain plot: Different precipitating agent approach. J. Alloy. Compd. 2021, 895, 162694. [Google Scholar] [CrossRef]
  51. Khoshkhoo, M.S.; Scudino, S.; Thomas, J.; Surreddi, K.; Eckert, J. Grain and crystallite size evaluation of cryomilled pure copper. J. Alloy. Compd. 2011, 509, S343–S347. [Google Scholar] [CrossRef]
  52. Gürakar, S.; Serin, T. Comprehensive structural analysis and electrical properties of (Cu, Al and In)-doped SnO2 thin films. Mater. Sci. Eng. B 2019, 251, 114445. [Google Scholar] [CrossRef]
  53. Sivakami, R.; Dhanuskodi, S.; Karvembu, R. Estimation of lattice strain in nanocrystalline RuO2 by Williamson–Hall and size–strain plot methods. Spectrochim. Acta Part A Mol. Biomol. Spectrosc. 2016, 152, 43–50. [Google Scholar] [CrossRef] [PubMed]
  54. Aly, K.A.; Khalil, N.; Algamal, Y.; Saleem, Q.M. Lattice strain estimation for CoAl2O4 nano particles using Williamson-Hall analysis. J. Alloy. Compd. 2016, 676, 606–612. [Google Scholar] [CrossRef]
  55. Brandstetter, S.; Derlet, P.; Van Petegem, S.; Van Swygenhoven, H. Williamson–Hall anisotropy in nanocrystalline metals: X-ray diffraction experiments and atomistic simulations. Acta Mater. 2008, 56, 165–176. [Google Scholar] [CrossRef]
  56. Borbély, A. The modified Williamson-Hall plot and dislocation density evaluation from diffraction peaks. Scr. Mater. 2022, 217, 114768. [Google Scholar] [CrossRef]
  57. Kibasomba, P.M.; Dhlamini, S.; Maaza, M.; Liu, C.-P.; Rashad, M.M.; Rayan, D.A.; Mwakikunga, B.W. Strain and grain size of TiO2 nanoparticles from TEM, Raman spectroscopy and XRD: The revisiting of the Williamson-Hall plot method. Results Phys. 2018, 9, 628–635. [Google Scholar] [CrossRef]
  58. Das Bakshi, S.; Sinha, D.; Chowdhury, S.G. Anisotropic broadening of XRD peaks of α′-Fe: Williamson-Hall and Warren-Averbach analysis using full width at half maximum (FWHM) and integral breadth (IB). Mater. Charact. 2018, 142, 144–153. [Google Scholar] [CrossRef]
  59. Ma, X.; Jiang, S.; Sun, Y.; Tang, G.; Sun, M. Elevated temperature nitrogen plasma immersion ion implantation of AISI 302 austenitic stainless steel. Surf. Coat. Technol. 2007, 201, 6695–6698. [Google Scholar] [CrossRef]
  60. Irshad, M.; Kousar, N.; Hanif, M.B.; Tabish, A.N.; Ghaffar, A.; Rafique, M.; Siraj, K.; Aslam, Z.; Assiri, M.A.; Imran, M.; et al. Investigating the microstructural and electrochemical performance of novel La0.3Ba0.7Zr0.5X0.3Y0.2 (X = Gd, Mn, Ce) electrolytes at intermediate temperature SOFCs. Sustain. Energy Fuels 2022, 6, 5384–5391. [Google Scholar] [CrossRef]
  61. Francis, M.; Kuruvilla, A.; Lakshmi, M. Effect of annealing on chemically deposited Cu2Se thin films. Mater. Chem. Phys. 2022, 292, 126845. [Google Scholar] [CrossRef]
  62. Rogers, K.; Daniels, P. An X-ray diffraction study of the effects of heat treatment on bone mineral microstructure. Biomaterials 2002, 23, 2577–2585. [Google Scholar] [CrossRef] [PubMed]
  63. Akl, A.A.; Mahmoud, S.A.; Al-Shomar, S.; Hassanien, A. Improving microstructural properties and minimizing crystal imperfections of nanocrystalline Cu2O thin films of different solution molarities for solar cell applications. Mater. Sci. Semicond. Process. 2018, 74, 183–192. [Google Scholar] [CrossRef]
  64. Hull, D.; Bacon, D.J. Introduction to Dislocations; Butterworth–Heinemann: Oxford, UK, 2011. [Google Scholar] [CrossRef]
  65. Lim, D.J.; Marks, N.A.; Rowles, M.R. Universal Scherrer equation for graphene fragments. Carbon 2020, 162, 475–480. [Google Scholar] [CrossRef]
  66. Pandya, S.G.; Corbett, J.P.; Jadwisienczak, W.M.; Kordesch, M.E. Structural characterization and X-ray analysis by Williamson–Hall method for Erbium doped Aluminum Nitride nanoparticles, synthesized using inert gas condensation technique. Phys. E Low-Dimens. Syst. Nanostructures 2016, 79, 98–102. [Google Scholar] [CrossRef]
  67. Nath, D.; Singh, F.; Das, R. X-ray diffraction analysis by Williamson-Hall, Halder-Wagner and size-strain plot methods of CdSe nanoparticles- a comparative study. Mater. Chem. Phys. 2019, 239, 122021. [Google Scholar] [CrossRef]
  68. Gupta, T.R.; Sidhu, S.S.; Katiyar, J.K.; Payal, H. Measurements of lattice strain in cold-rolled CR4 steel sheets using X-ray diffraction. Mater. Sci. Eng. B 2020, 264, 114930. [Google Scholar] [CrossRef]
  69. Panchal, S.; Chauhan, R. Krypton ion implantation effect on selenium nanowires. Phys. Lett. A 2017, 381, 2636–2642. [Google Scholar] [CrossRef]
  70. Khatter, J.; Chauhan, R. Impact of argon ion implantation on CdS nanorod mesh. Mater. Lett. 2022, 307, 131082. [Google Scholar] [CrossRef]
  71. Burton, A.W.; Ong, K.; Rea, T.; Chan, I.Y. On the estimation of average crystallite size of zeolites from the Scherrer equation: A critical evaluation of its application to zeolites with one-dimensional pore systems. Microporous Mesoporous Mater. 2009, 117, 75–90. [Google Scholar] [CrossRef]
  72. Bensouyad, H.; Sedrati, H.; Dehdouh, H.; Brahimi, M.; Abbas, F.; Akkari, H.; Bensaha, R. Structural, thermal and optical characterization of TiO2:ZrO2 thin films prepared by sol–gel method. Thin Solid Films 2010, 519, 96–100. [Google Scholar] [CrossRef]
  73. Adachi, S. Handbook on Physical Properties of Semiconductors; Springer: New York, NY, USA, 2004. [Google Scholar] [CrossRef]
  74. Zhang, J.-M.; Zhang, Y.; Xu, K.-W.; Ji, V. General compliance transformation relation and applications for anisotropic hexagonal metals. Solid State Commun. 2006, 139, 87–91. [Google Scholar] [CrossRef]
  75. Shahmoradi, Y.; Souri, D. Growth of silver nanoparticles within the tellurovanadate amorphous matrix: Optical band gap and band tailing properties, beside the Williamson-Hall estimation of crystallite size and lattice strain. Ceram. Int. 2019, 45, 7857–7864. [Google Scholar] [CrossRef]
  76. Huang, J.; Zou, S.; Xiao, W.; Liu, X.; Tang, D. Sputtering parameters effect on microstructural parameters of TiN coating via the Williamson-Hall analysis. Mater. Res. Express 2020, 7, 106402. [Google Scholar] [CrossRef]
  77. Senthilkumar, V.; Vickraman, P.; Jayachandran, M.; Sanjeeviraja, C. Structural and electrical studies of nano structured Sn1−x Sbx O2 (x = 0.0, 1, 2.5, 4.5 and 7 at%) prepared by co-precipitation method. J. Mater. Sci. Mater. Electron. 2010, 21, 343–348. [Google Scholar] [CrossRef]
Figure 1. The schematic diagram of plasma immersion ion implantation process.
Materials 16 05876 g001
Figure 2. SEM images of a nanoscale modified layer treated under various implantation dose rates: (a) 2.60 × 10¹⁷ ions/cm2·h, (b) 1.04 × 10¹⁸ ions/cm2·h.
Materials 16 05876 g002
Figure 3. XRD patterns of samples treated under different implantation dose rates. (black: 2.60 × 10¹⁷ ions/cm2·h; red: 5.18 × 10¹⁷ ions/cm2·h; blue: 7.85 × 10¹⁷ ions/cm2·h; green: 1.04 × 10¹⁸ ions/cm2·h).
Materials 16 05876 g003
Figure 4. The plots of variation in crystallite size and microstrain dislocation density of samples treated under different implantation dose rates. (square: Grain size; red line: Microstrain; blue line: Dislocation).
Materials 16 05876 g004
Figure 5. Williamson–Hall-UDM plots of 8Cr4Mo4V steel for various dose rates.
Materials 16 05876 g005
Figure 6. Williamson–Hall-USDM plots of 8Cr4Mo4V steel for various dose rates.
Materials 16 05876 g006
Figure 7. Williamson–Hall-UDEDM plots of 8Cr4Mo4V steel for various dose rates.
Materials 16 05876 g007
Table 1. Chemical composition of 8Cr4Mo4V steel (wt.%).
CCrMoVNiMnSiCoWFe
0.8~0.854.0~4.254.0~4.50.9~1.1≤0.150.15~0.35≤0.25≤0.25≤0.25Bal.
Disclaimer/Publisher’s Note: The statements, opinions and data contained in all publications are solely those of the individual author(s) and contributor(s) and not of MDPI and/or the editor(s). MDPI and/or the editor(s) disclaim responsibility for any injury to people or property resulting from any ideas, methods, instructions or products referred to in the content.

