
The Influence of Heat Aging Treatments on the Cavitation Erosion Behavior of a Type 6082 Aluminum Alloy

Abstract
:1. Introduction
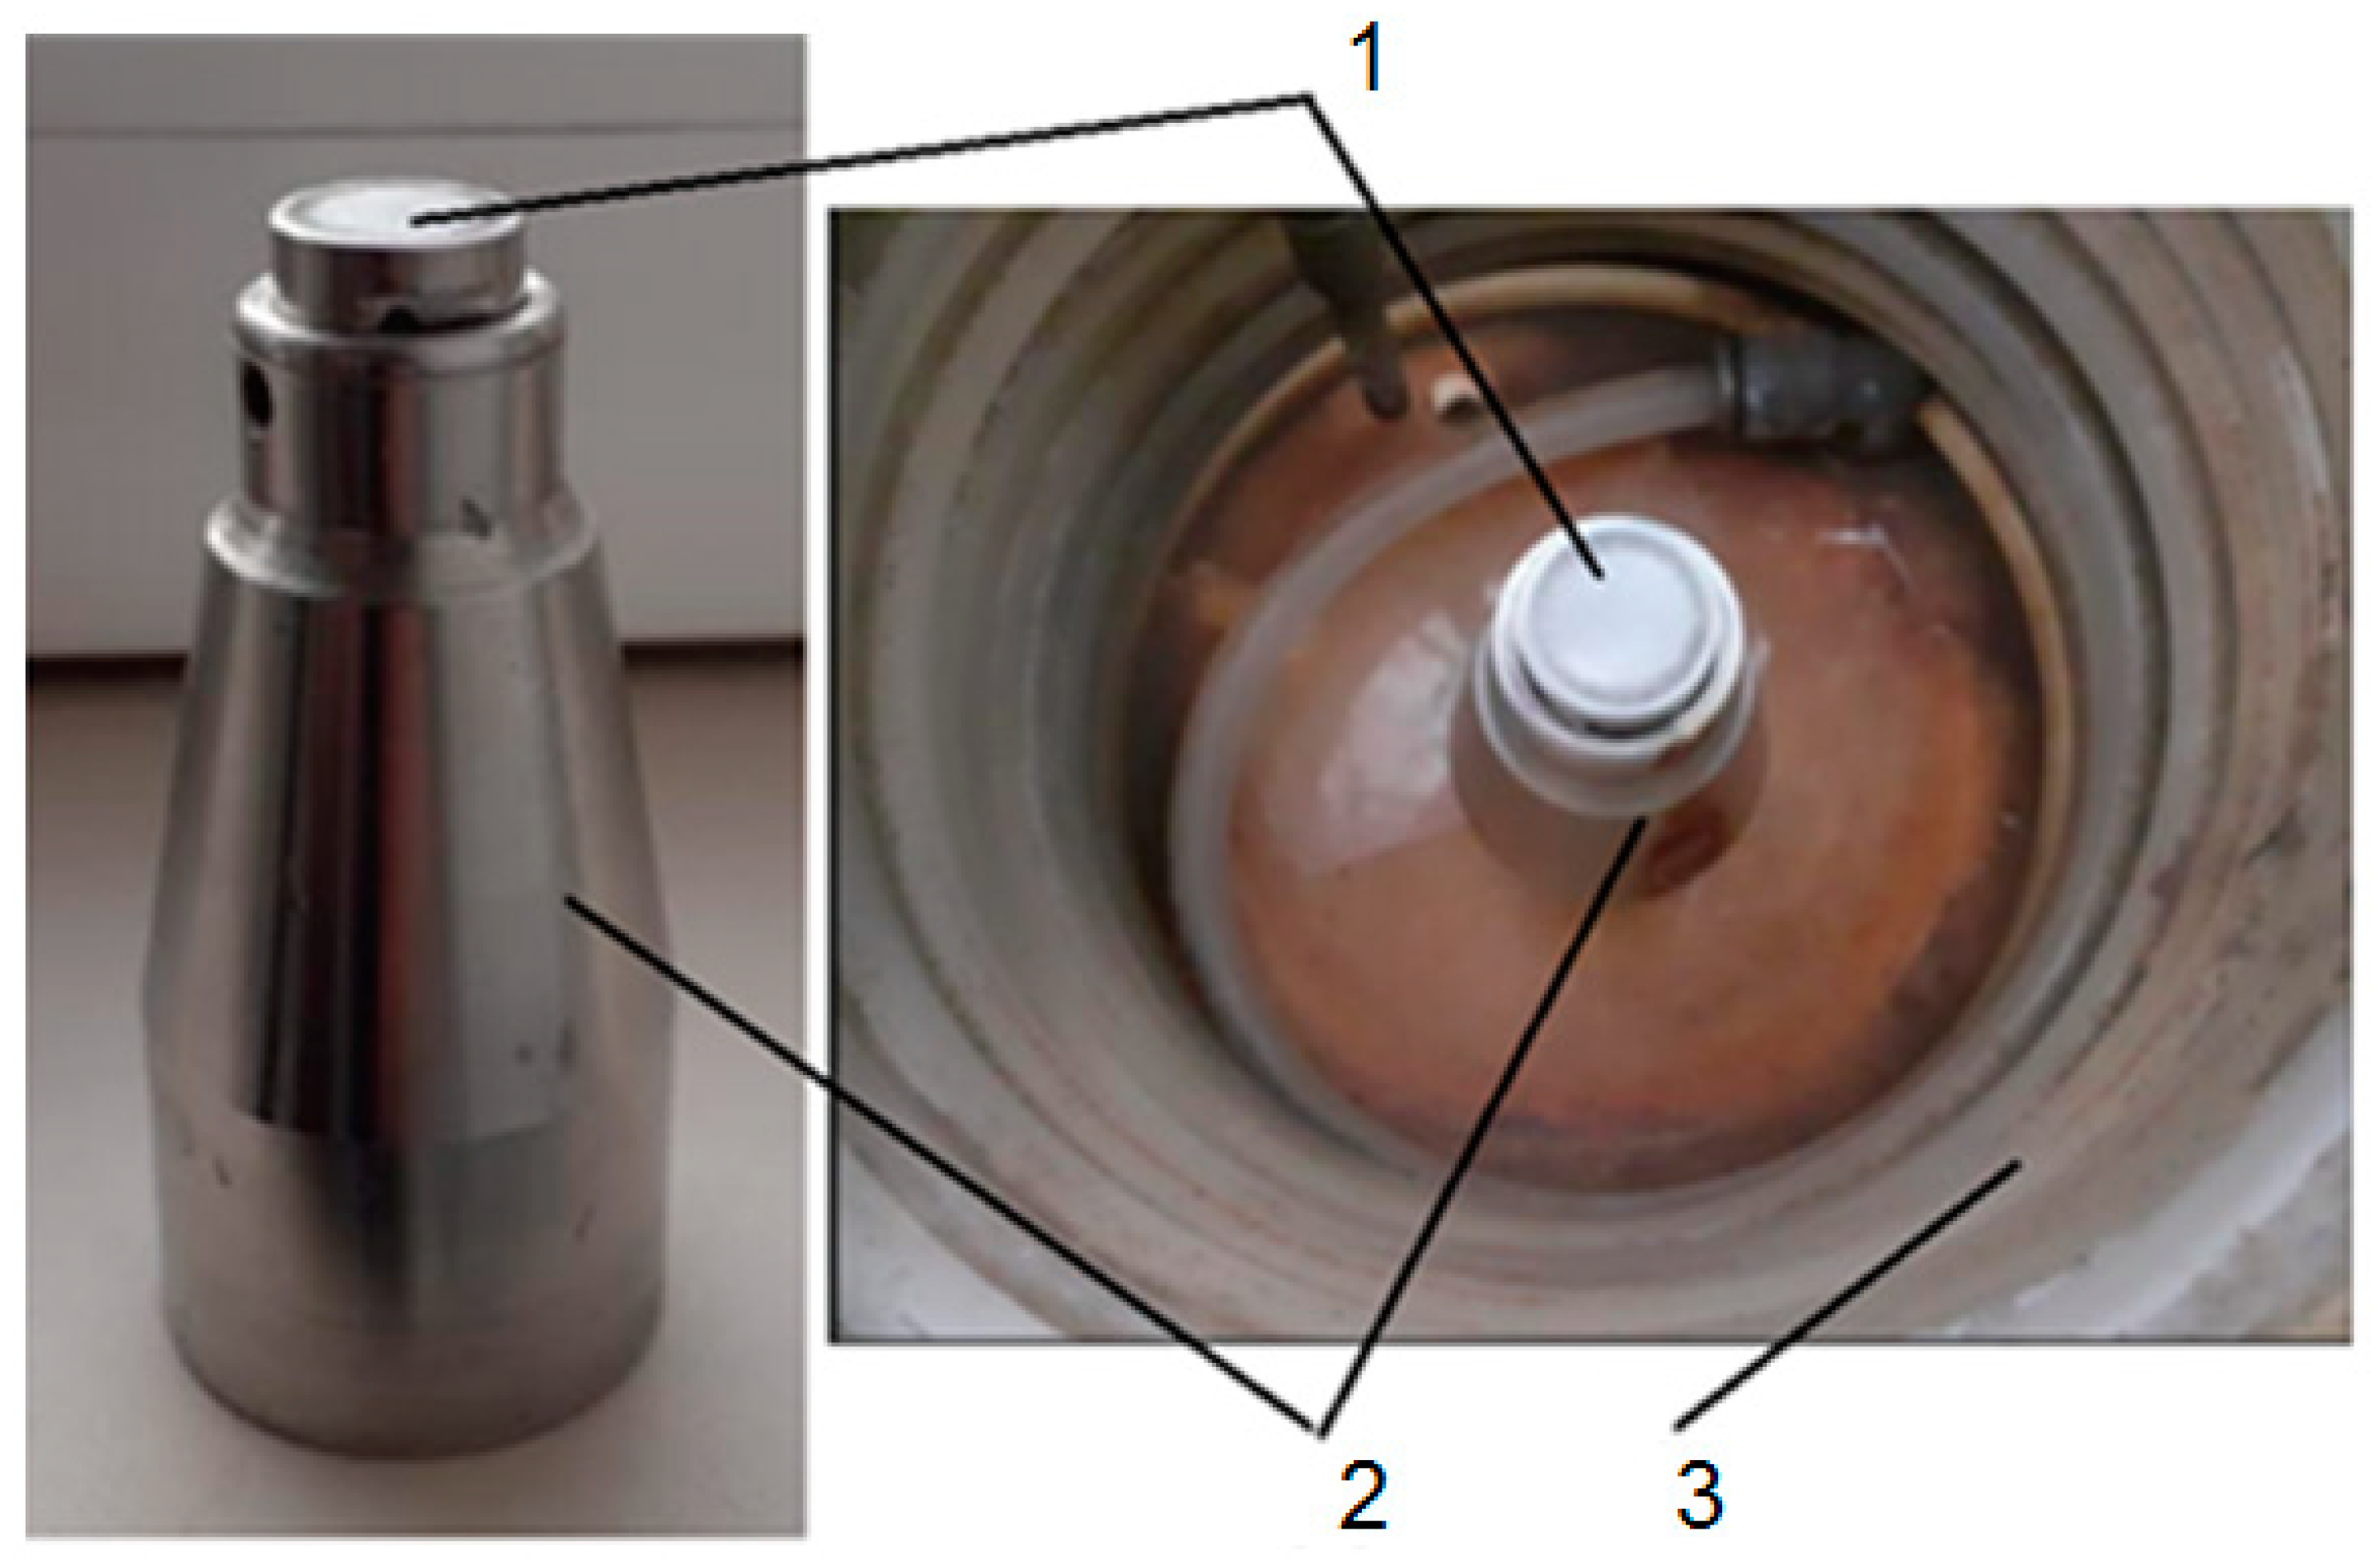
2. Materials and Methods
- Double vibration amplitude = 50 µm;
- Vibration frequency = 20,000 ± 1% Hz;
- The power of the electric ultrasound generator = 500 W;
- Liquid medium = double distilled water;
- Liquid temperature = 22 ± 1 °C.
3. Experimental Results, Interpretation, and Discussions
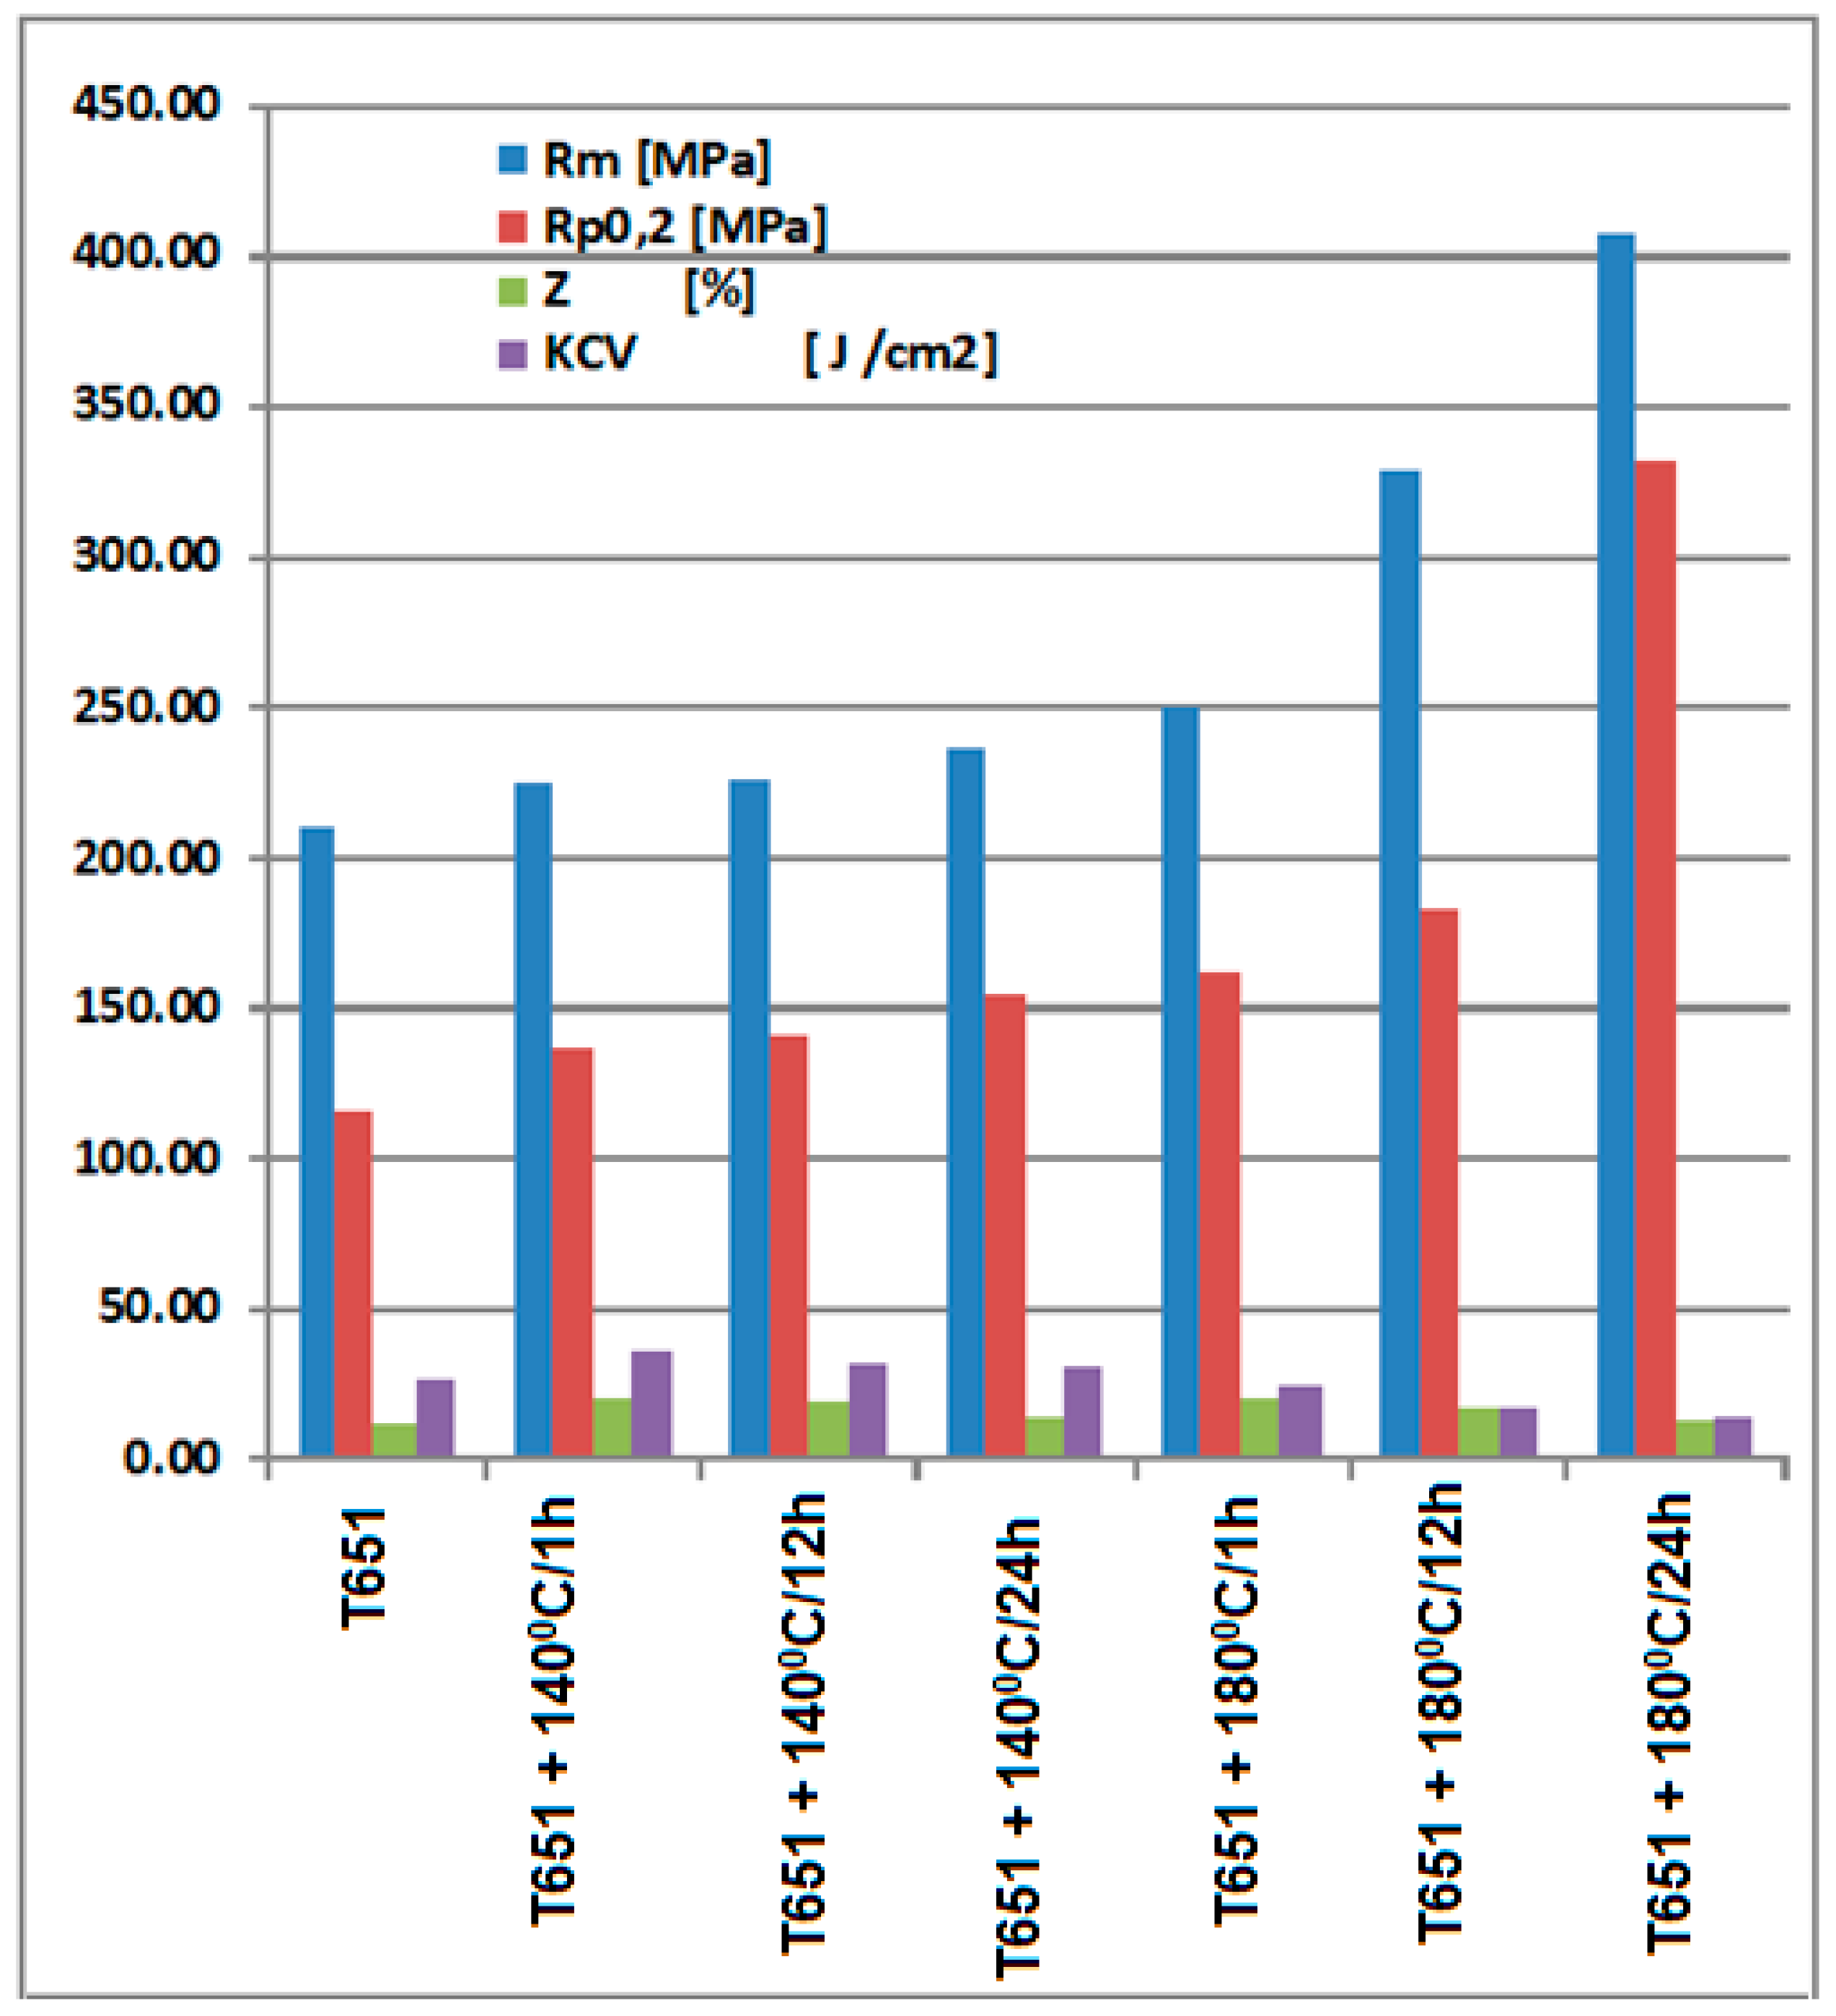
3.1. The Mechanical Behavior of the Experimental Samples
3.2. The Cavitational Erosion Behavior of the Experimental Specimens
- -
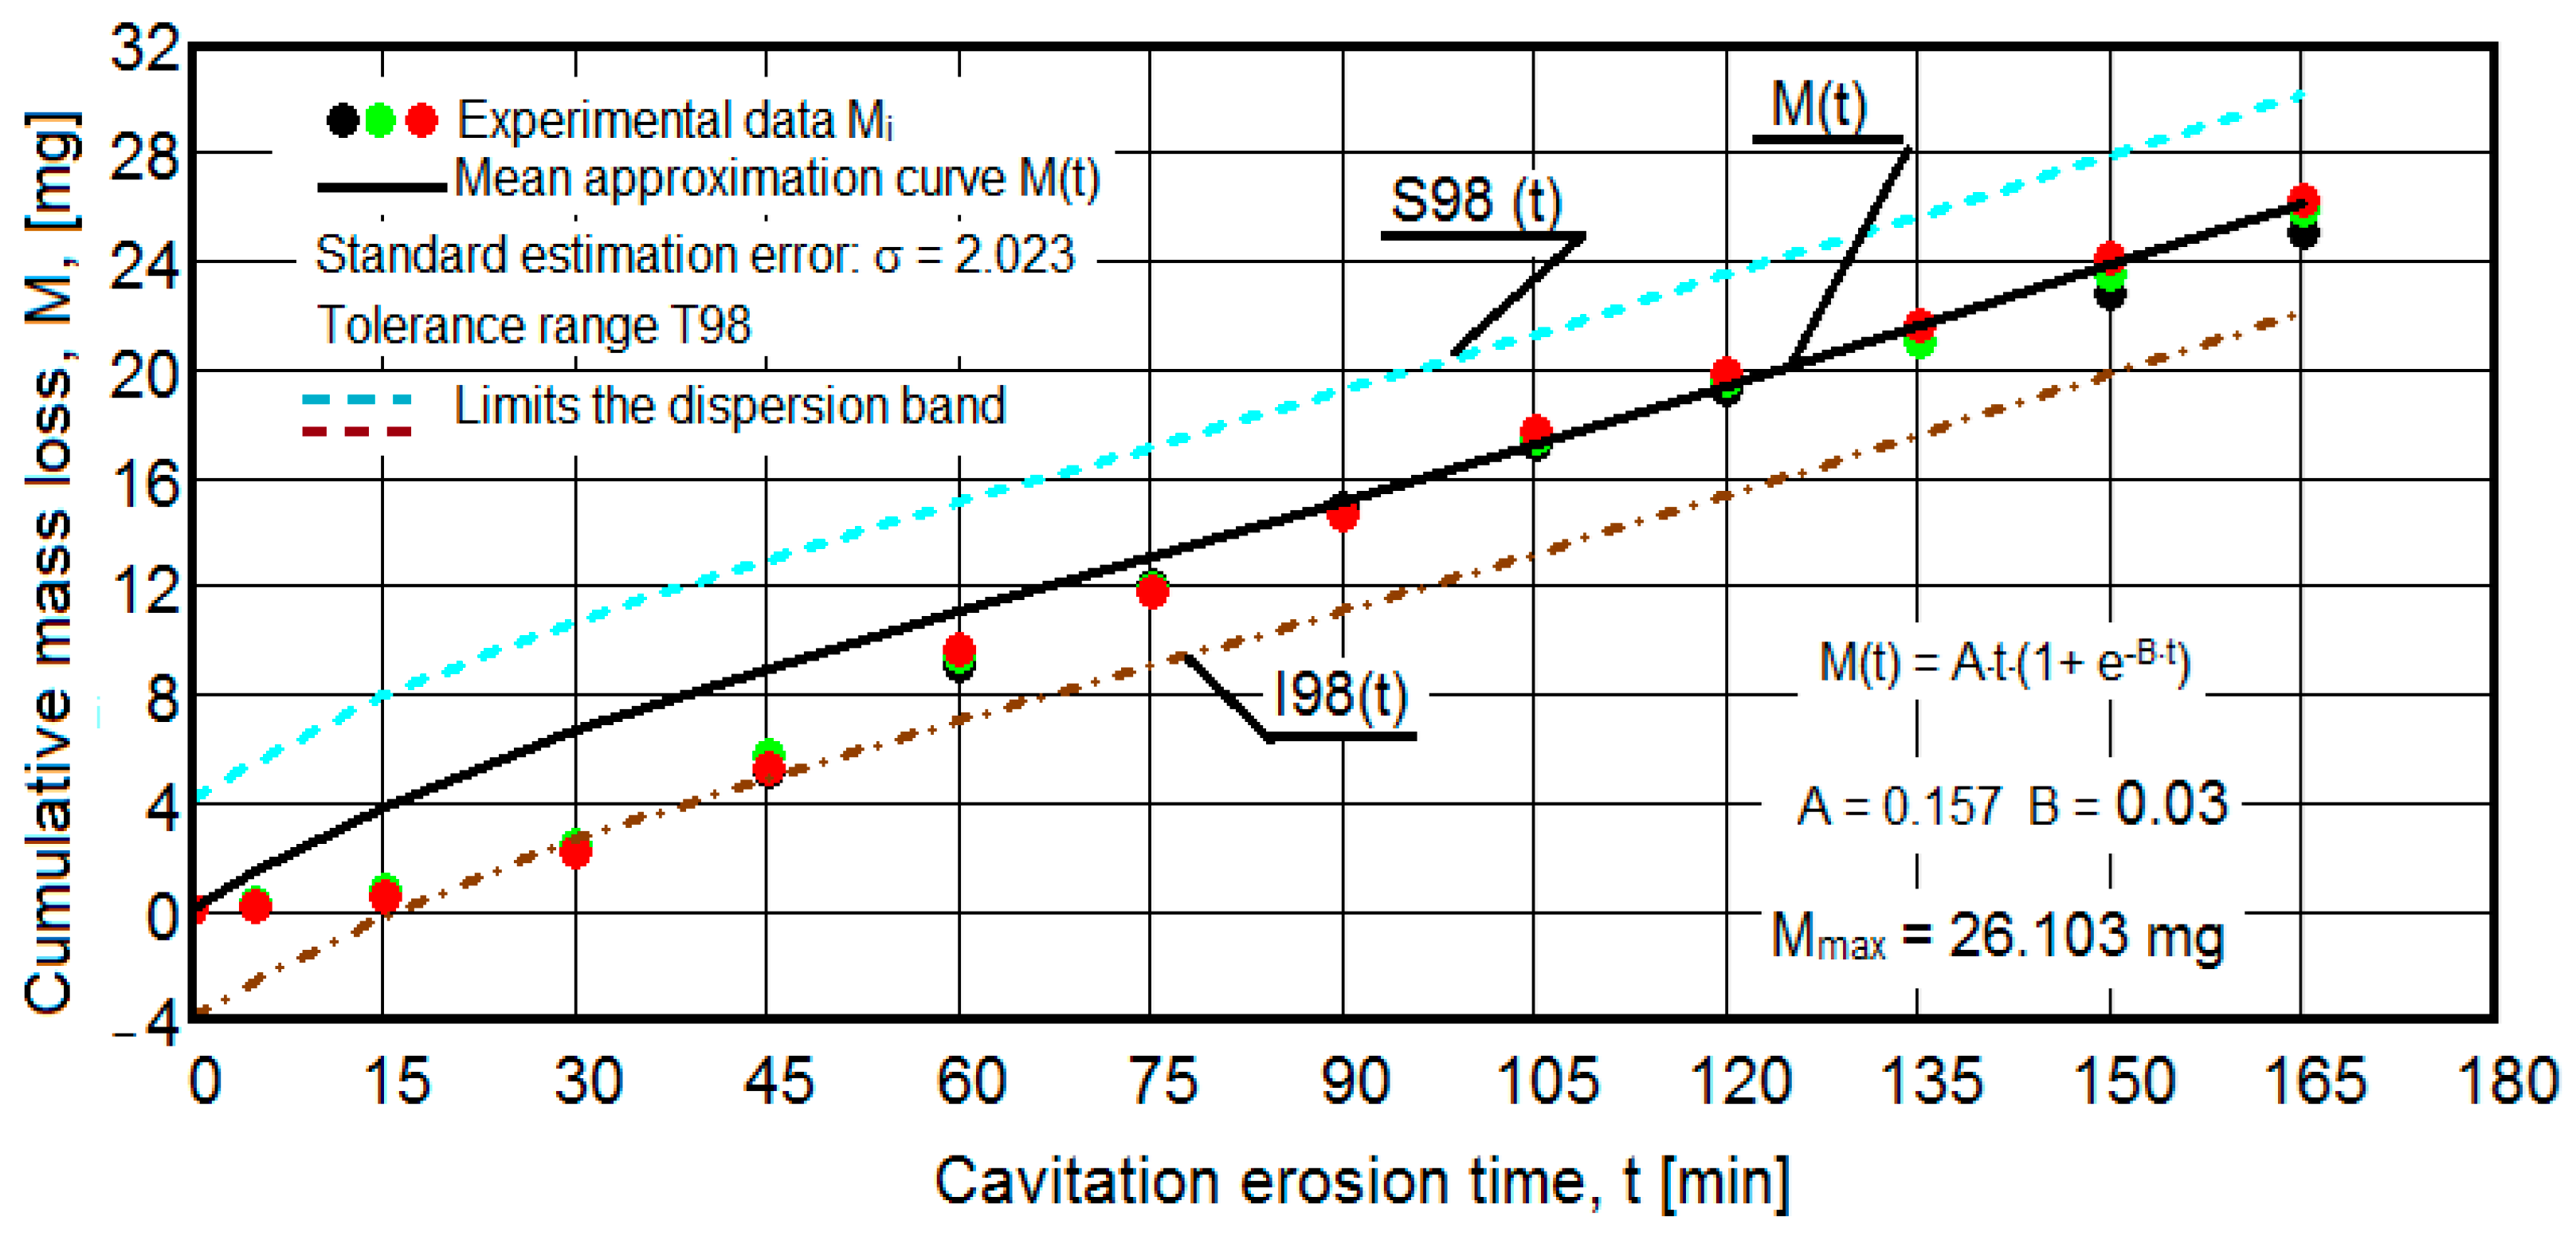
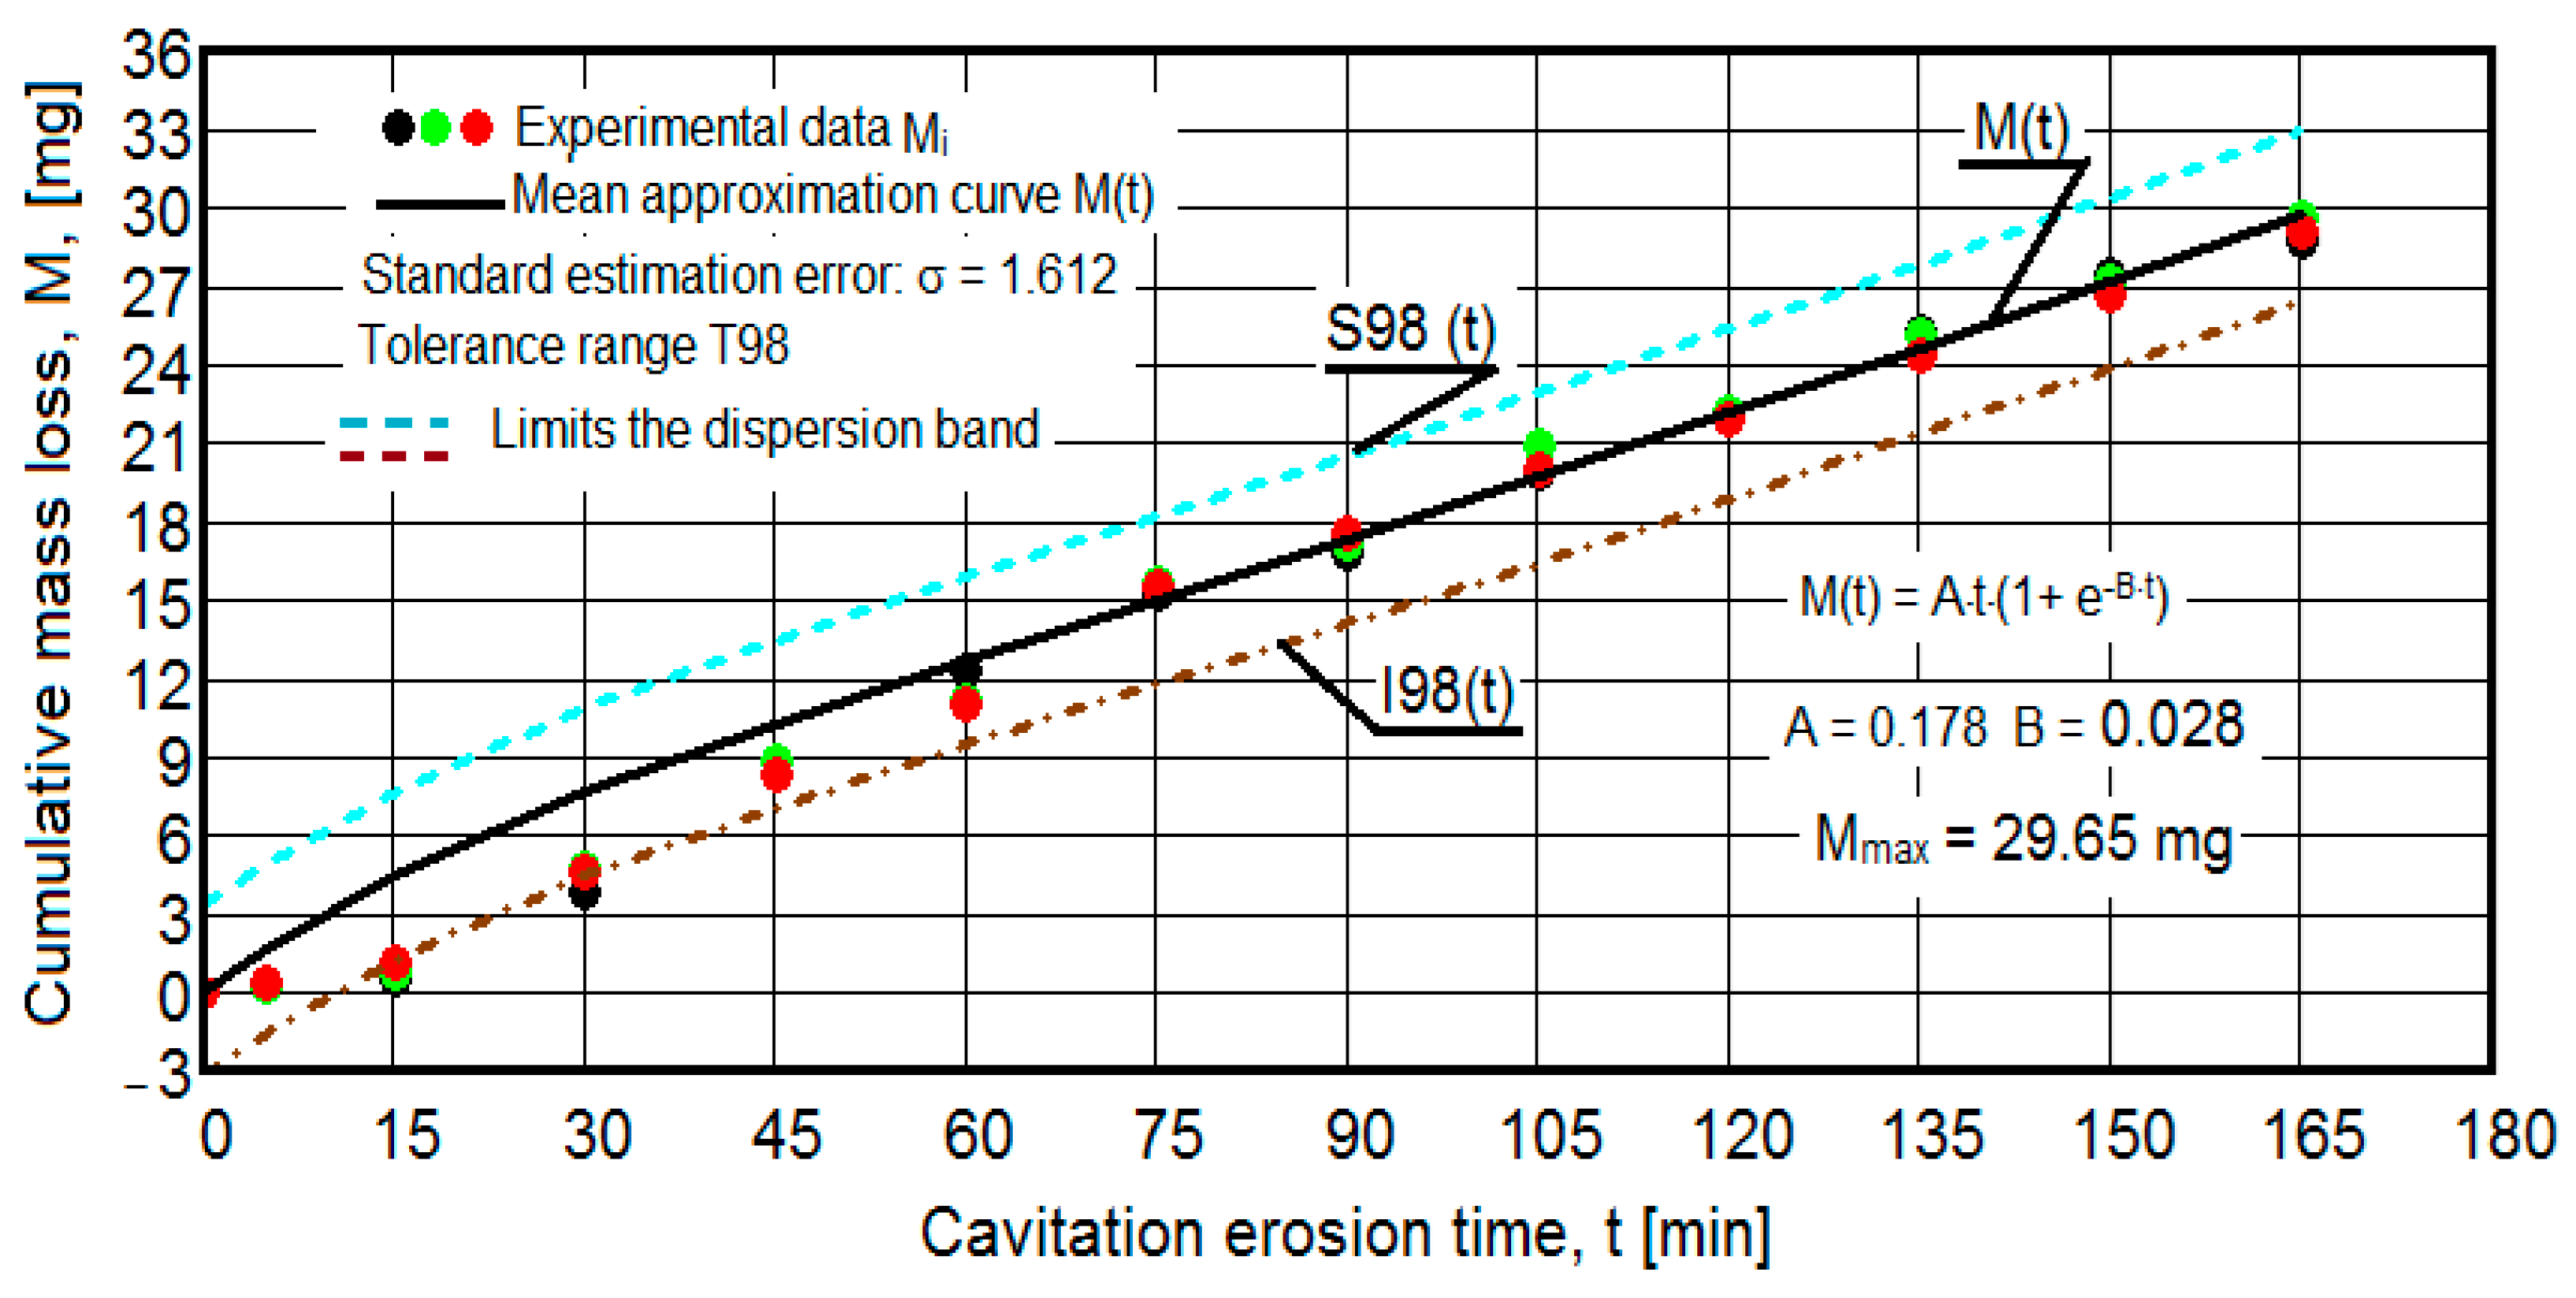
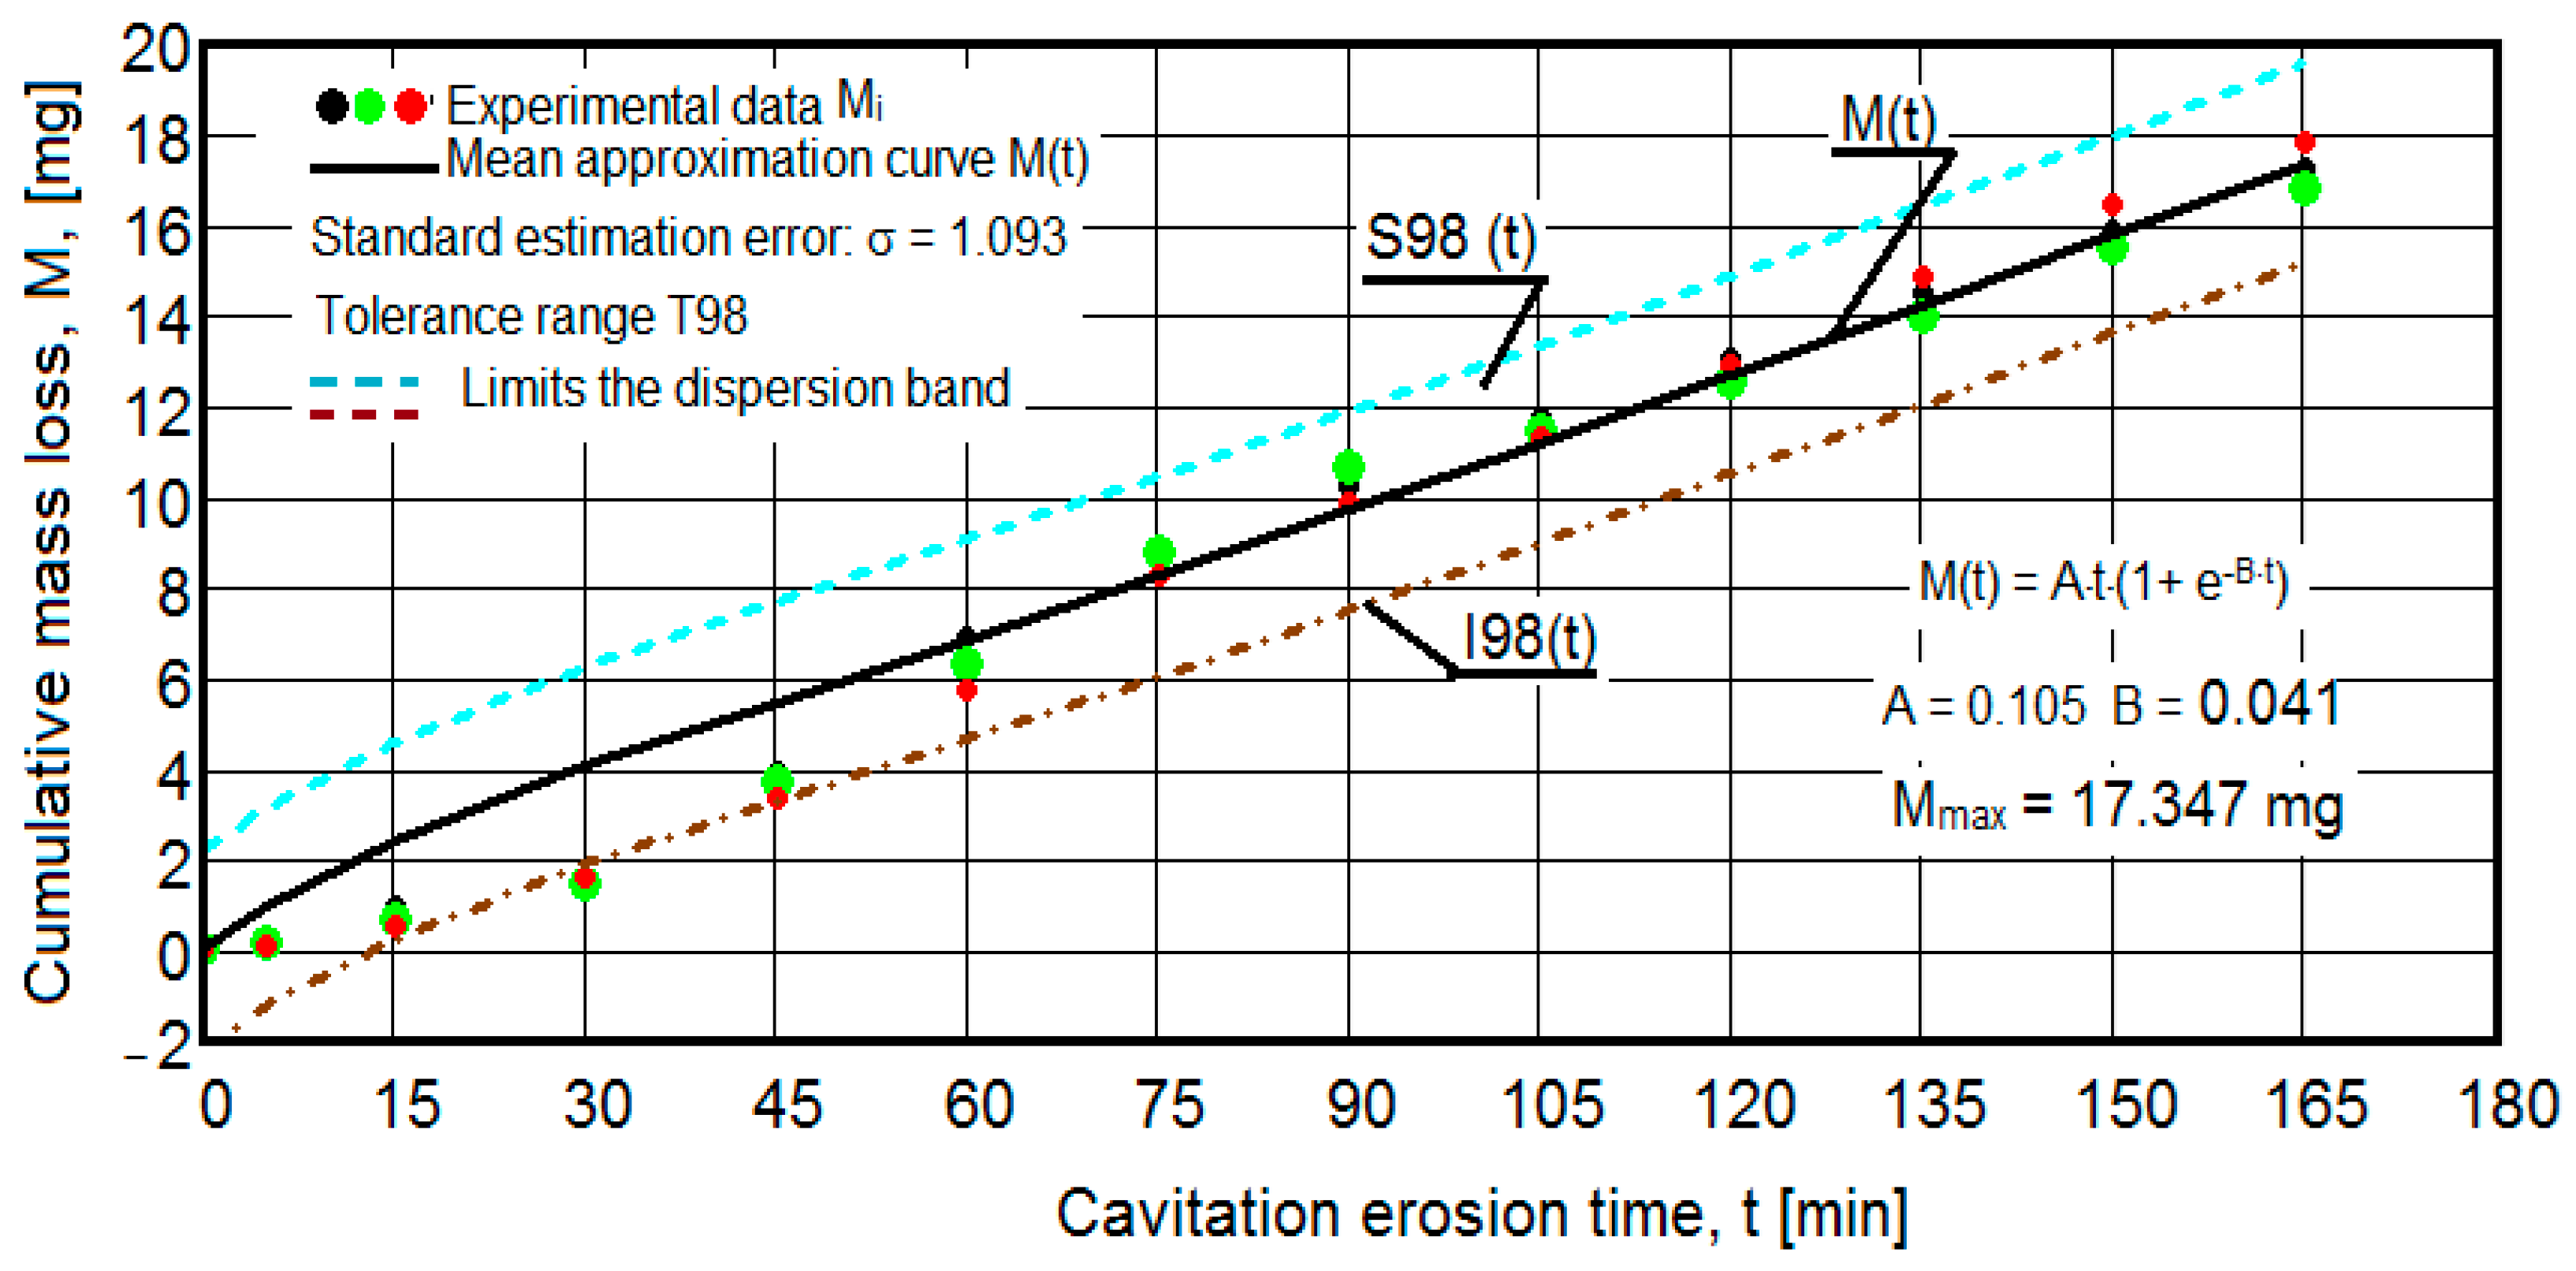
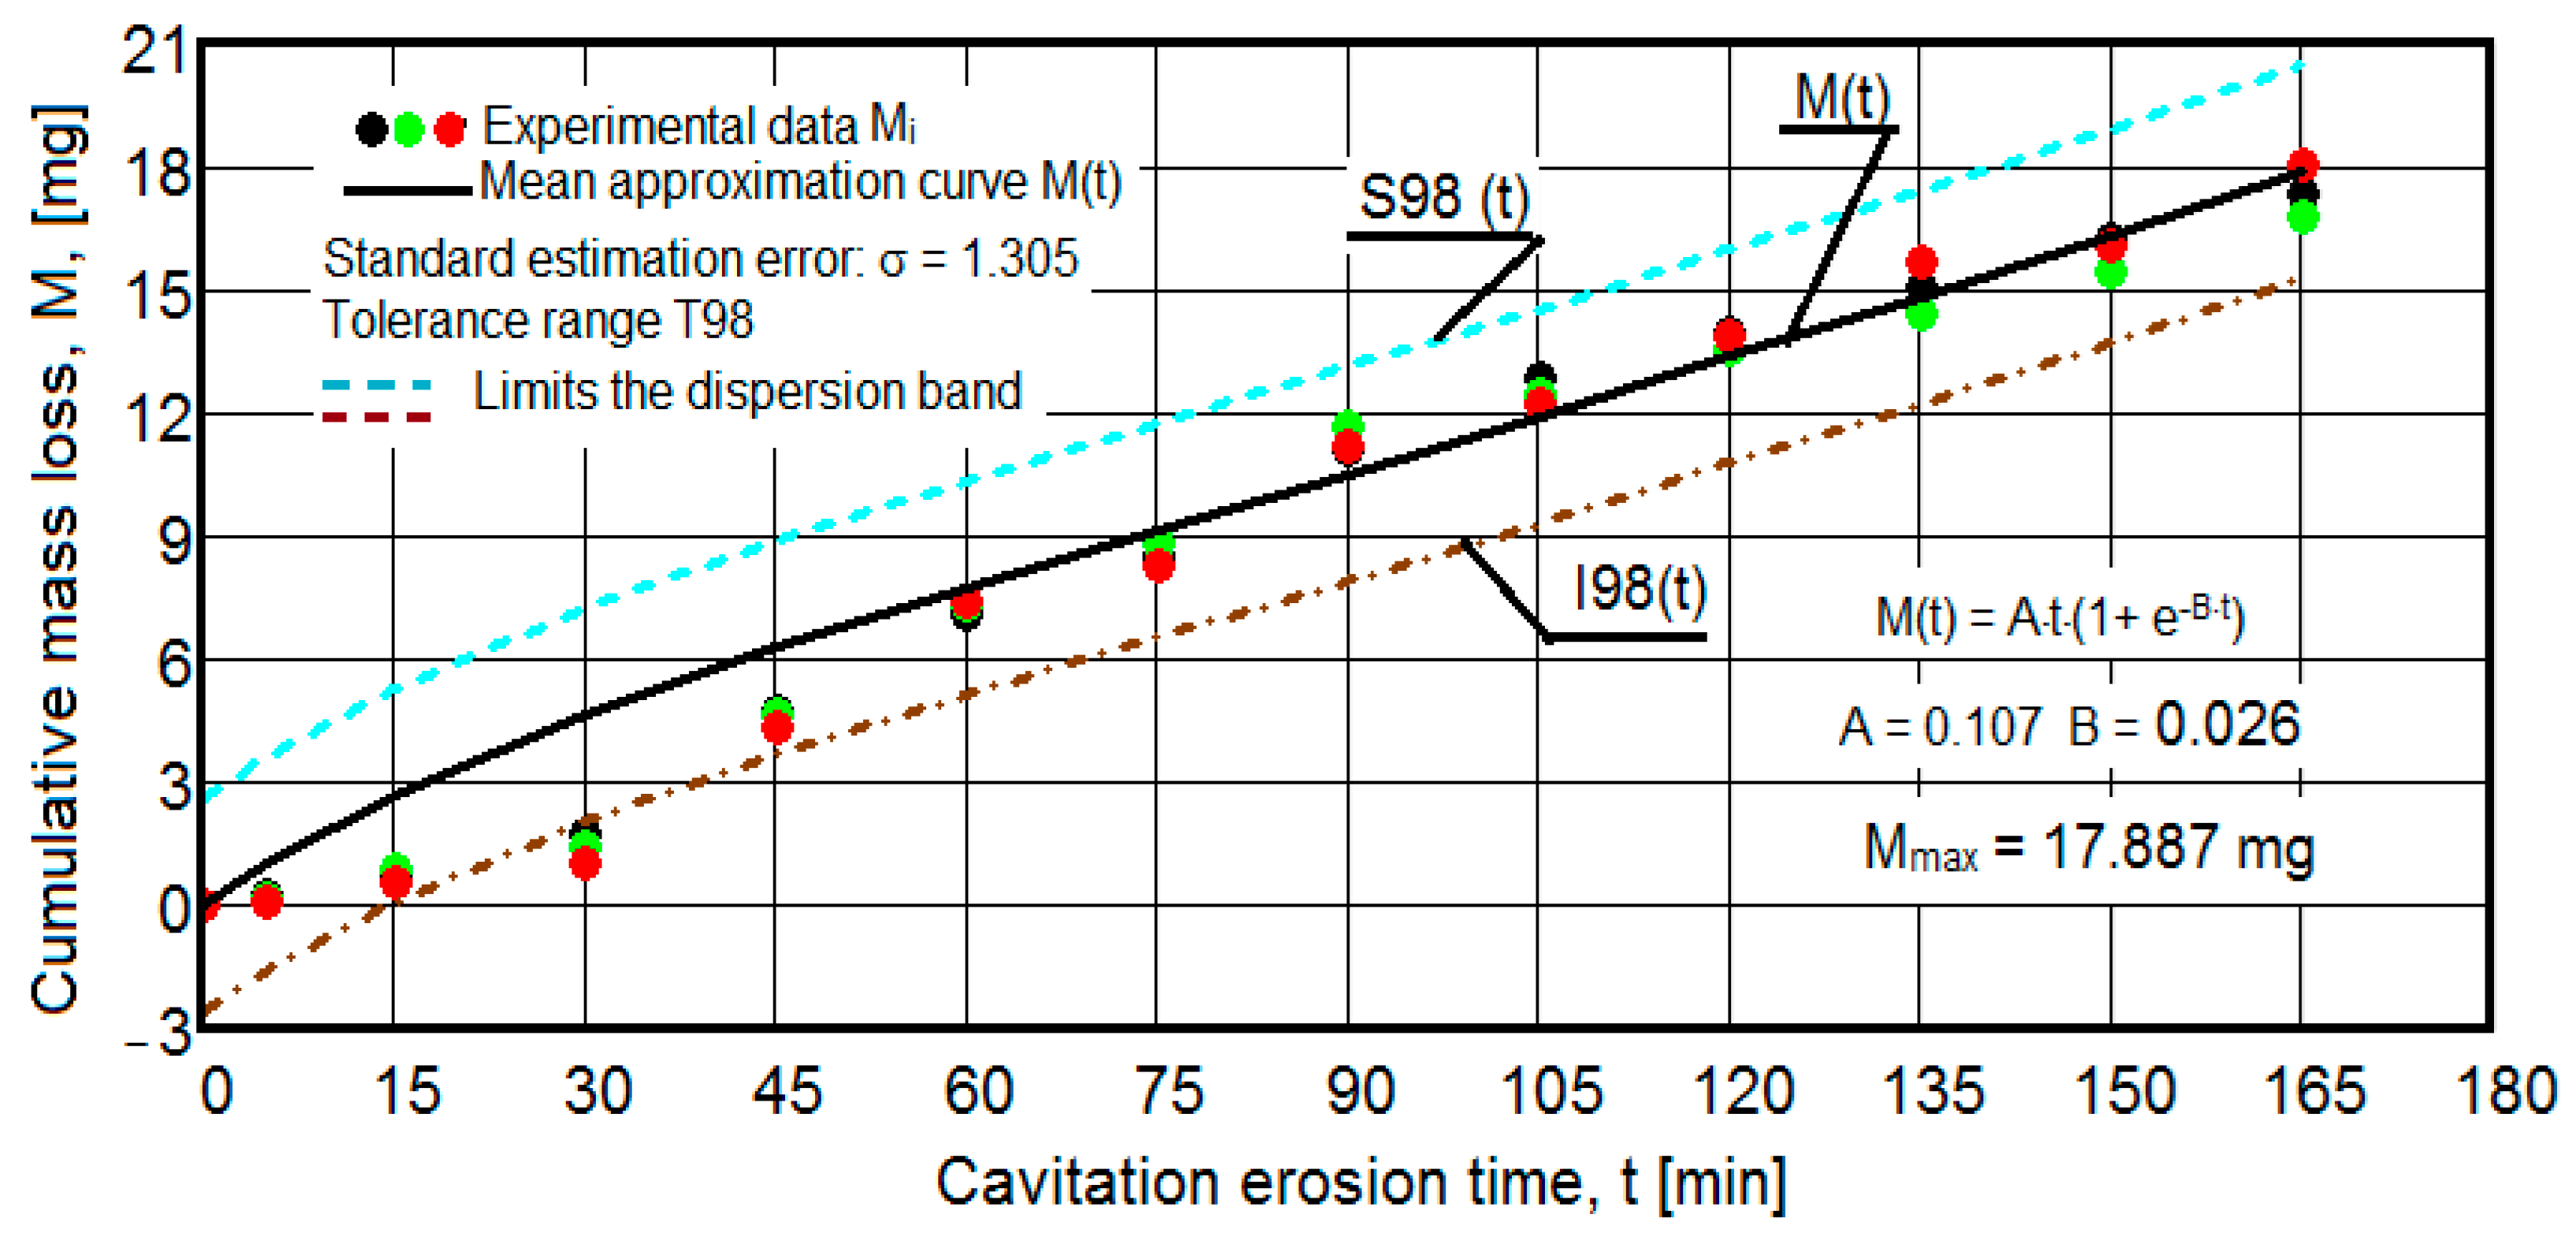
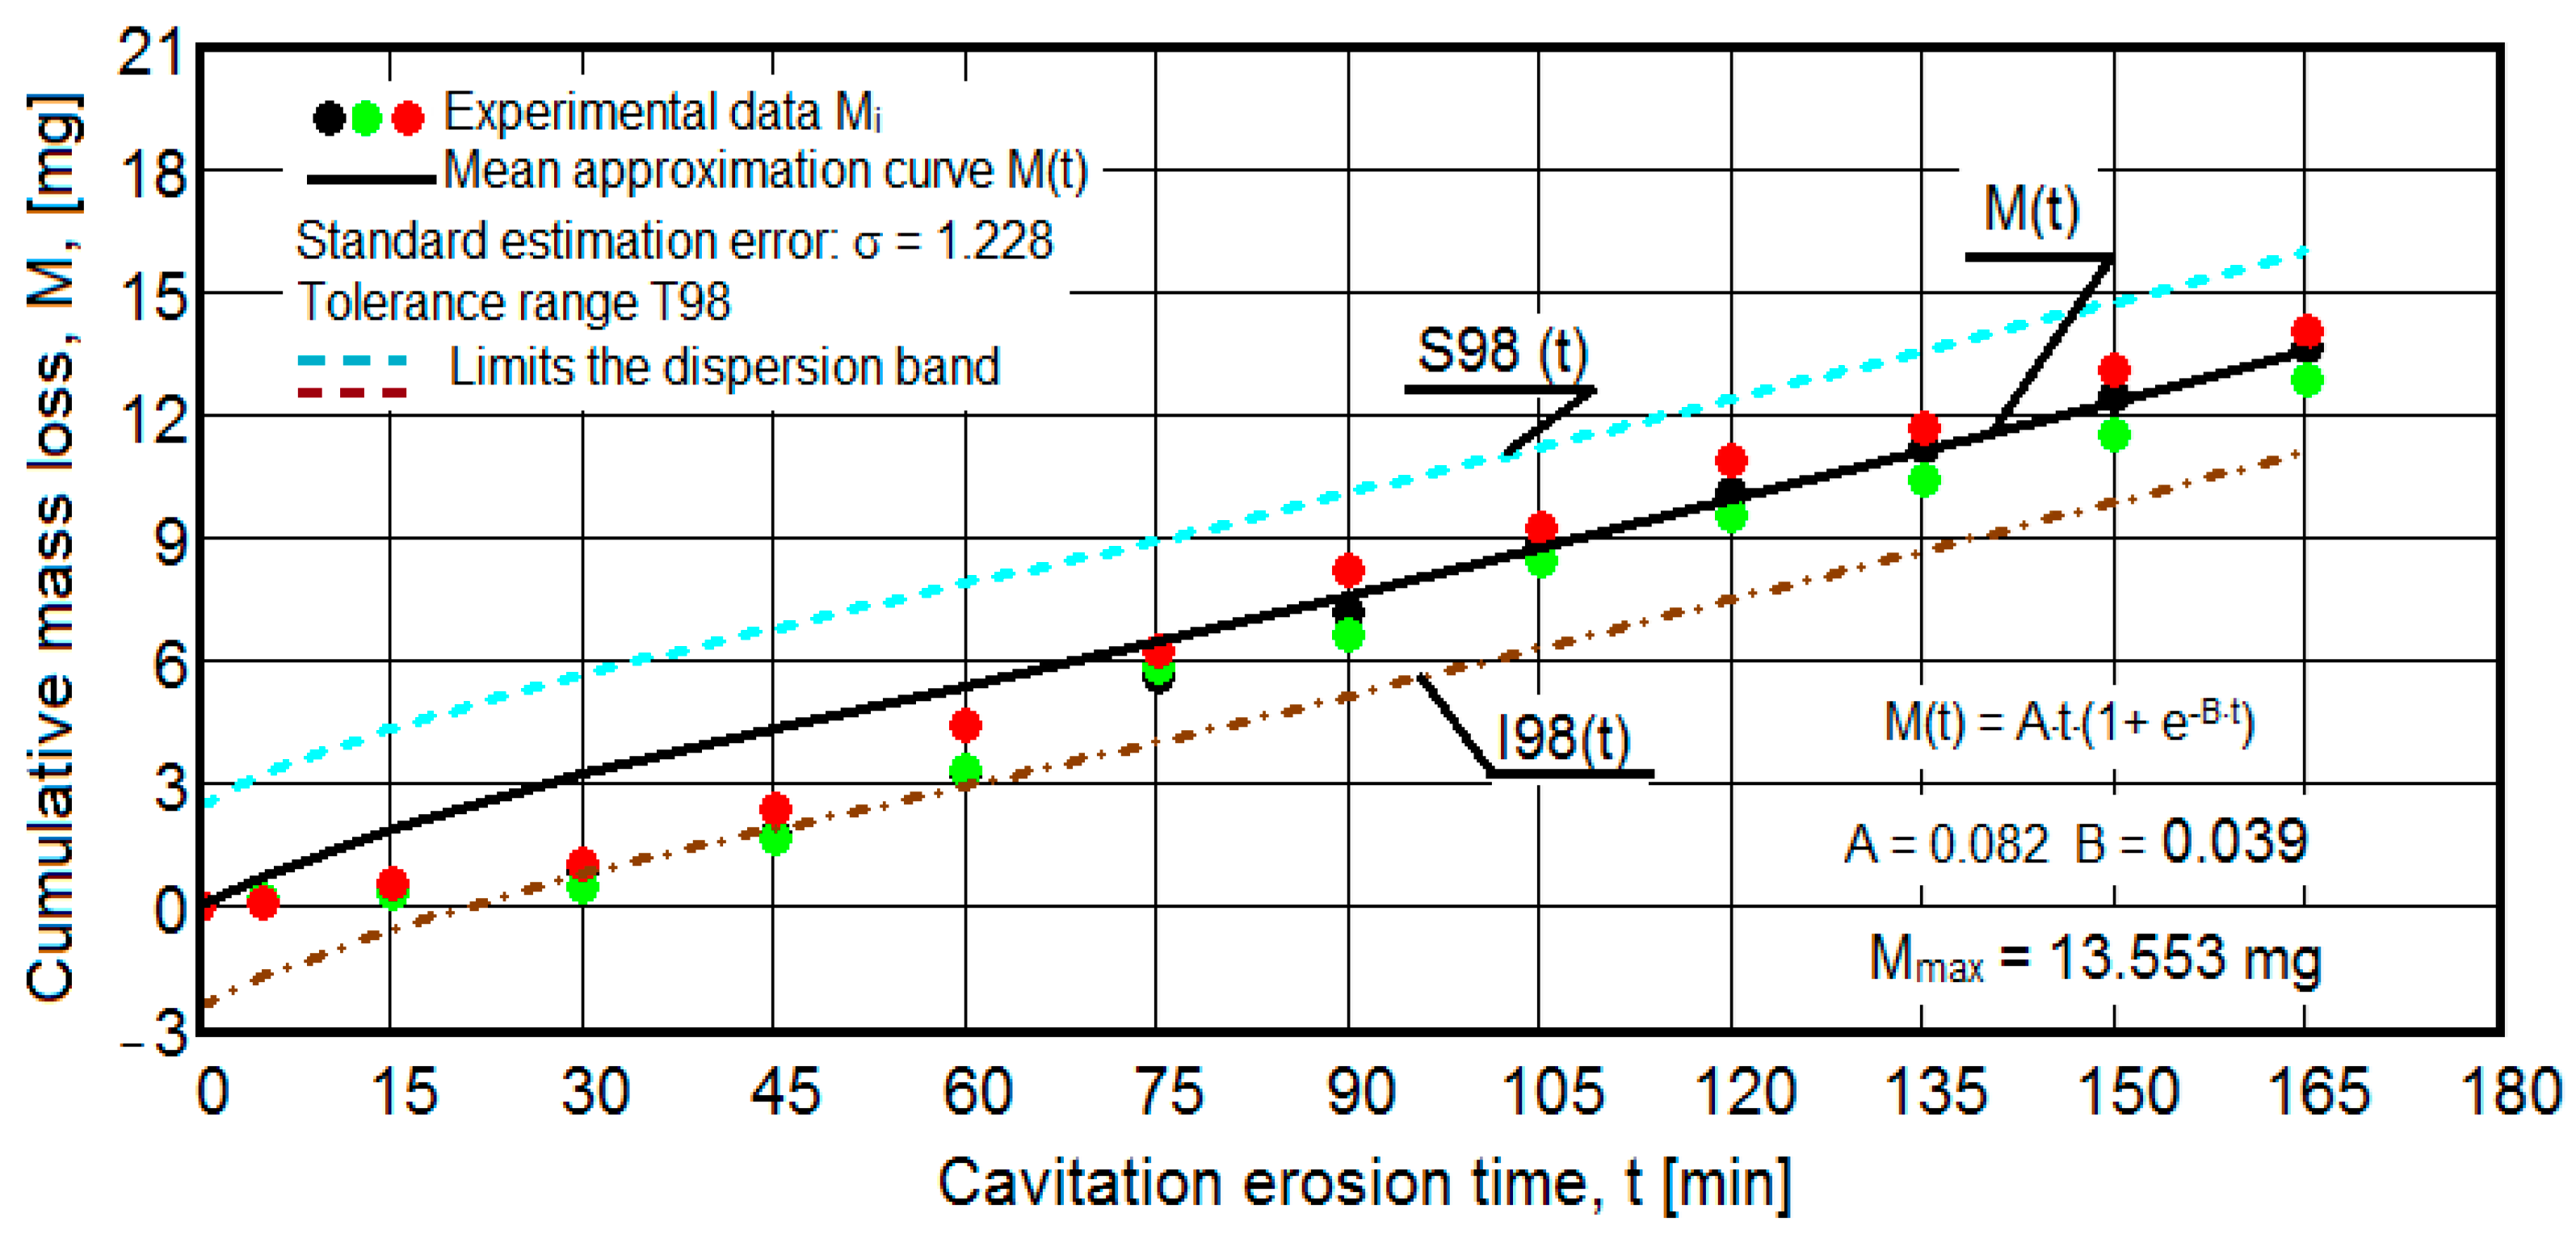
- For the cumulative eroded mass:
- -
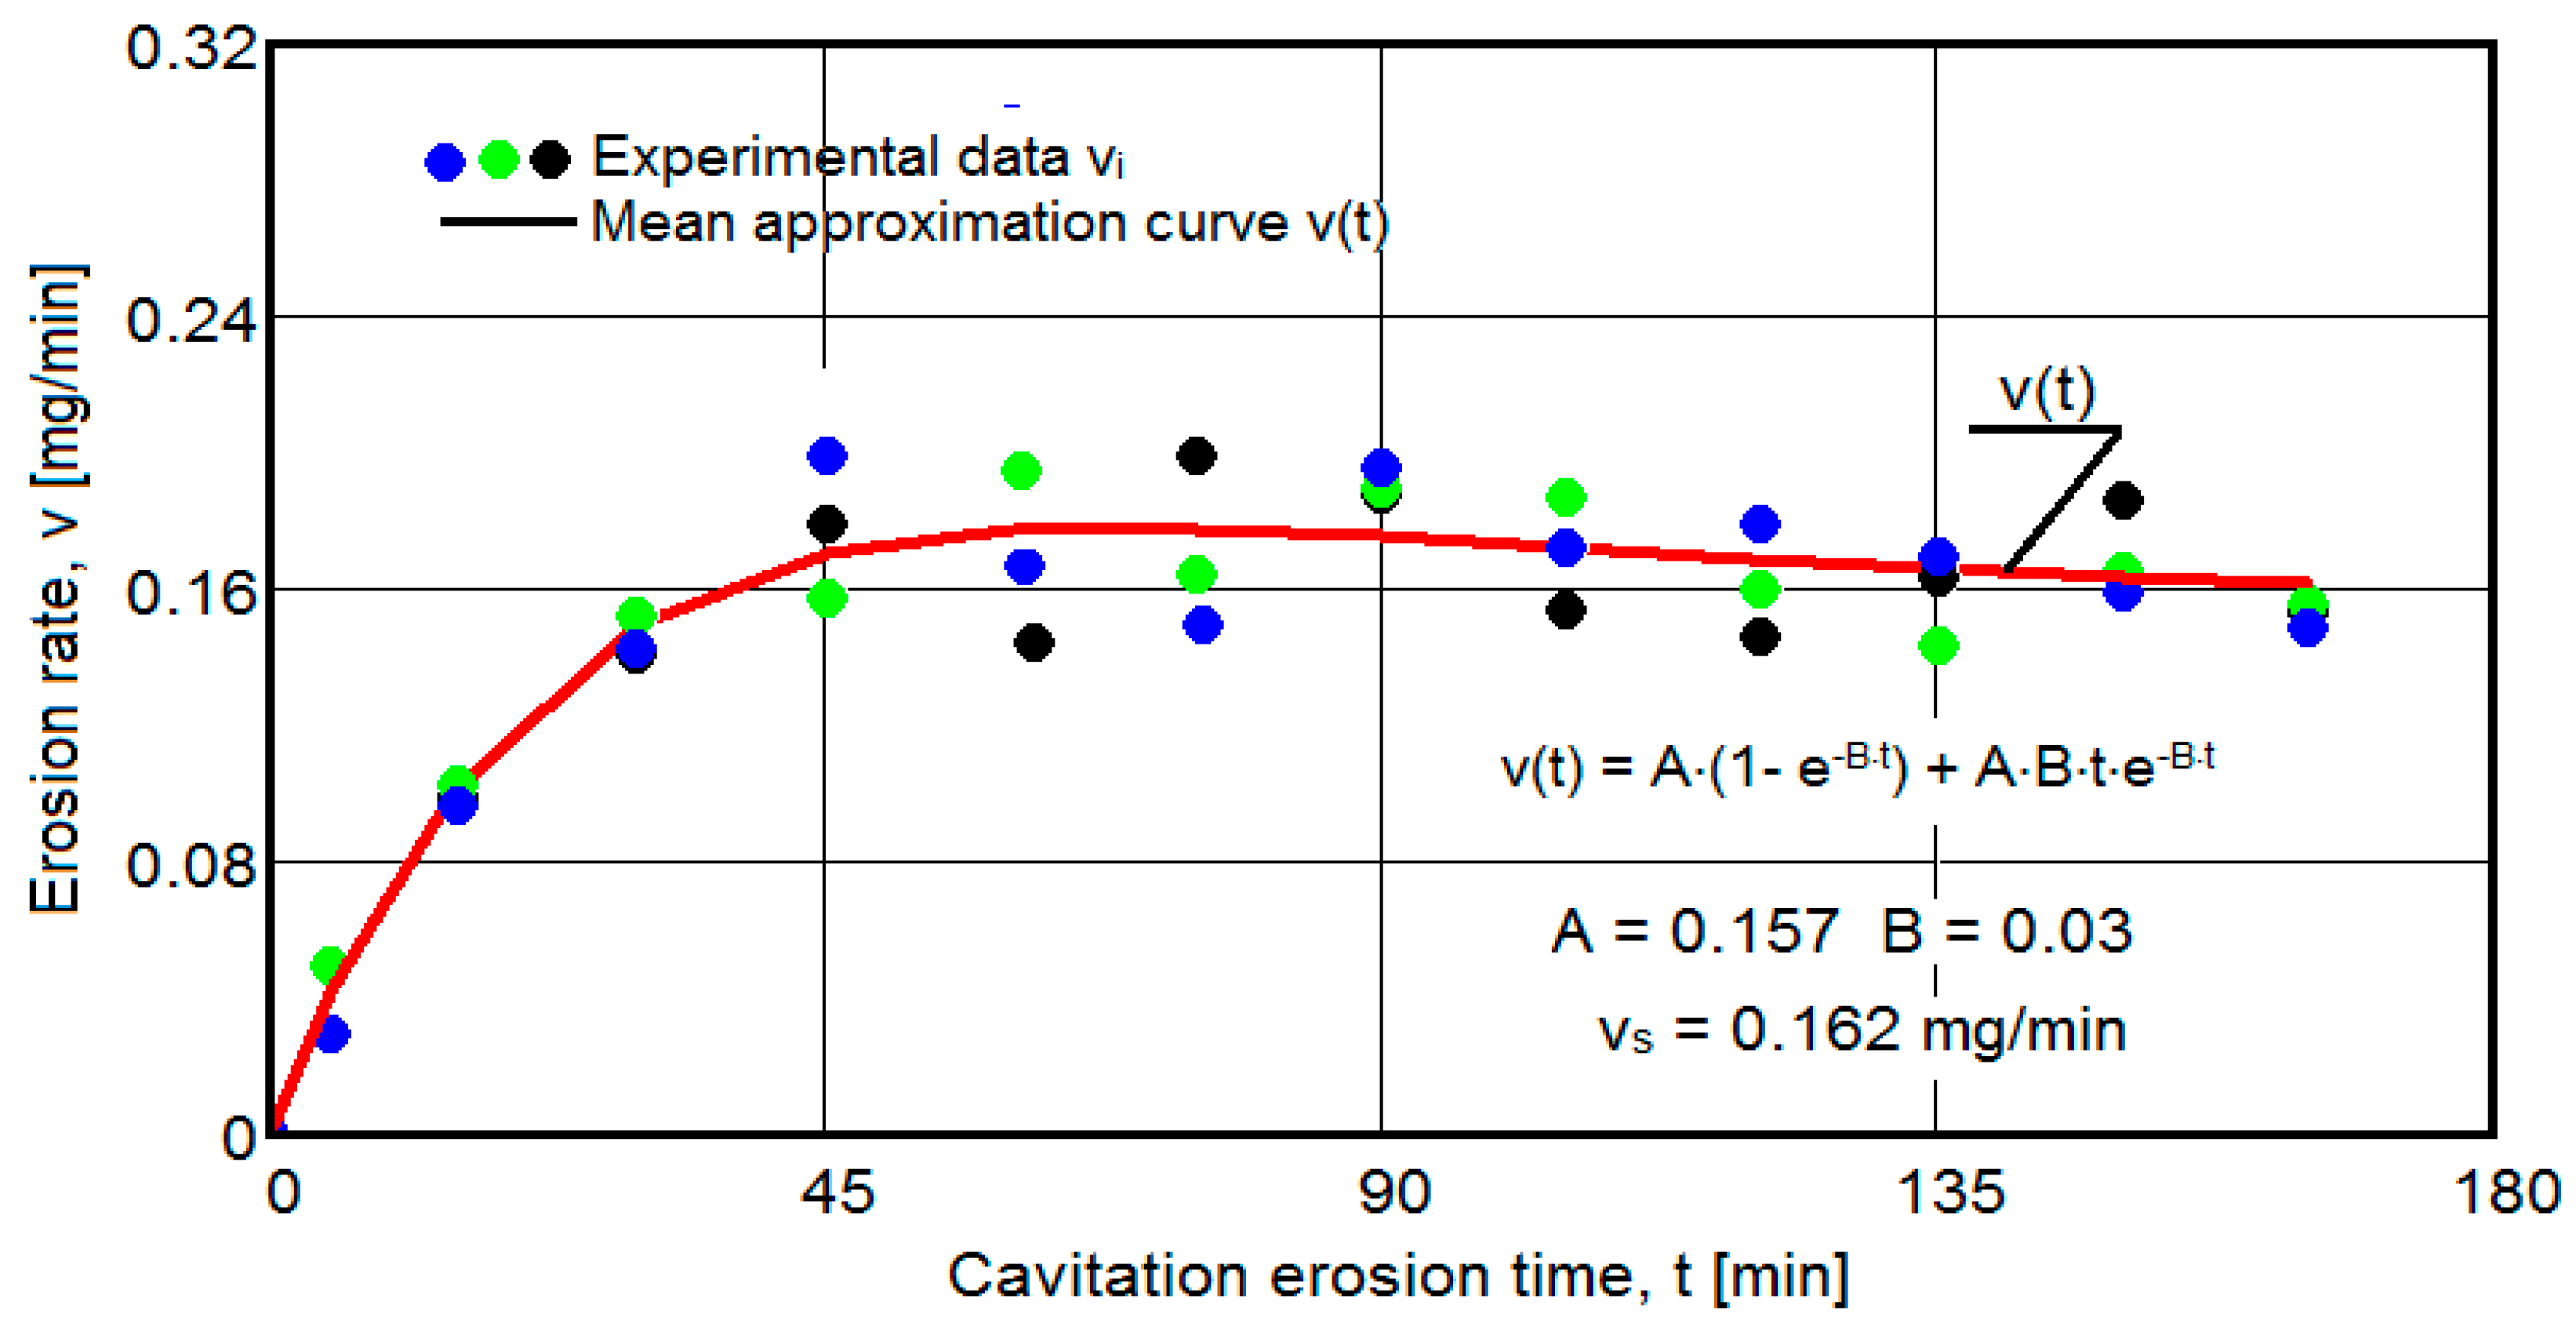
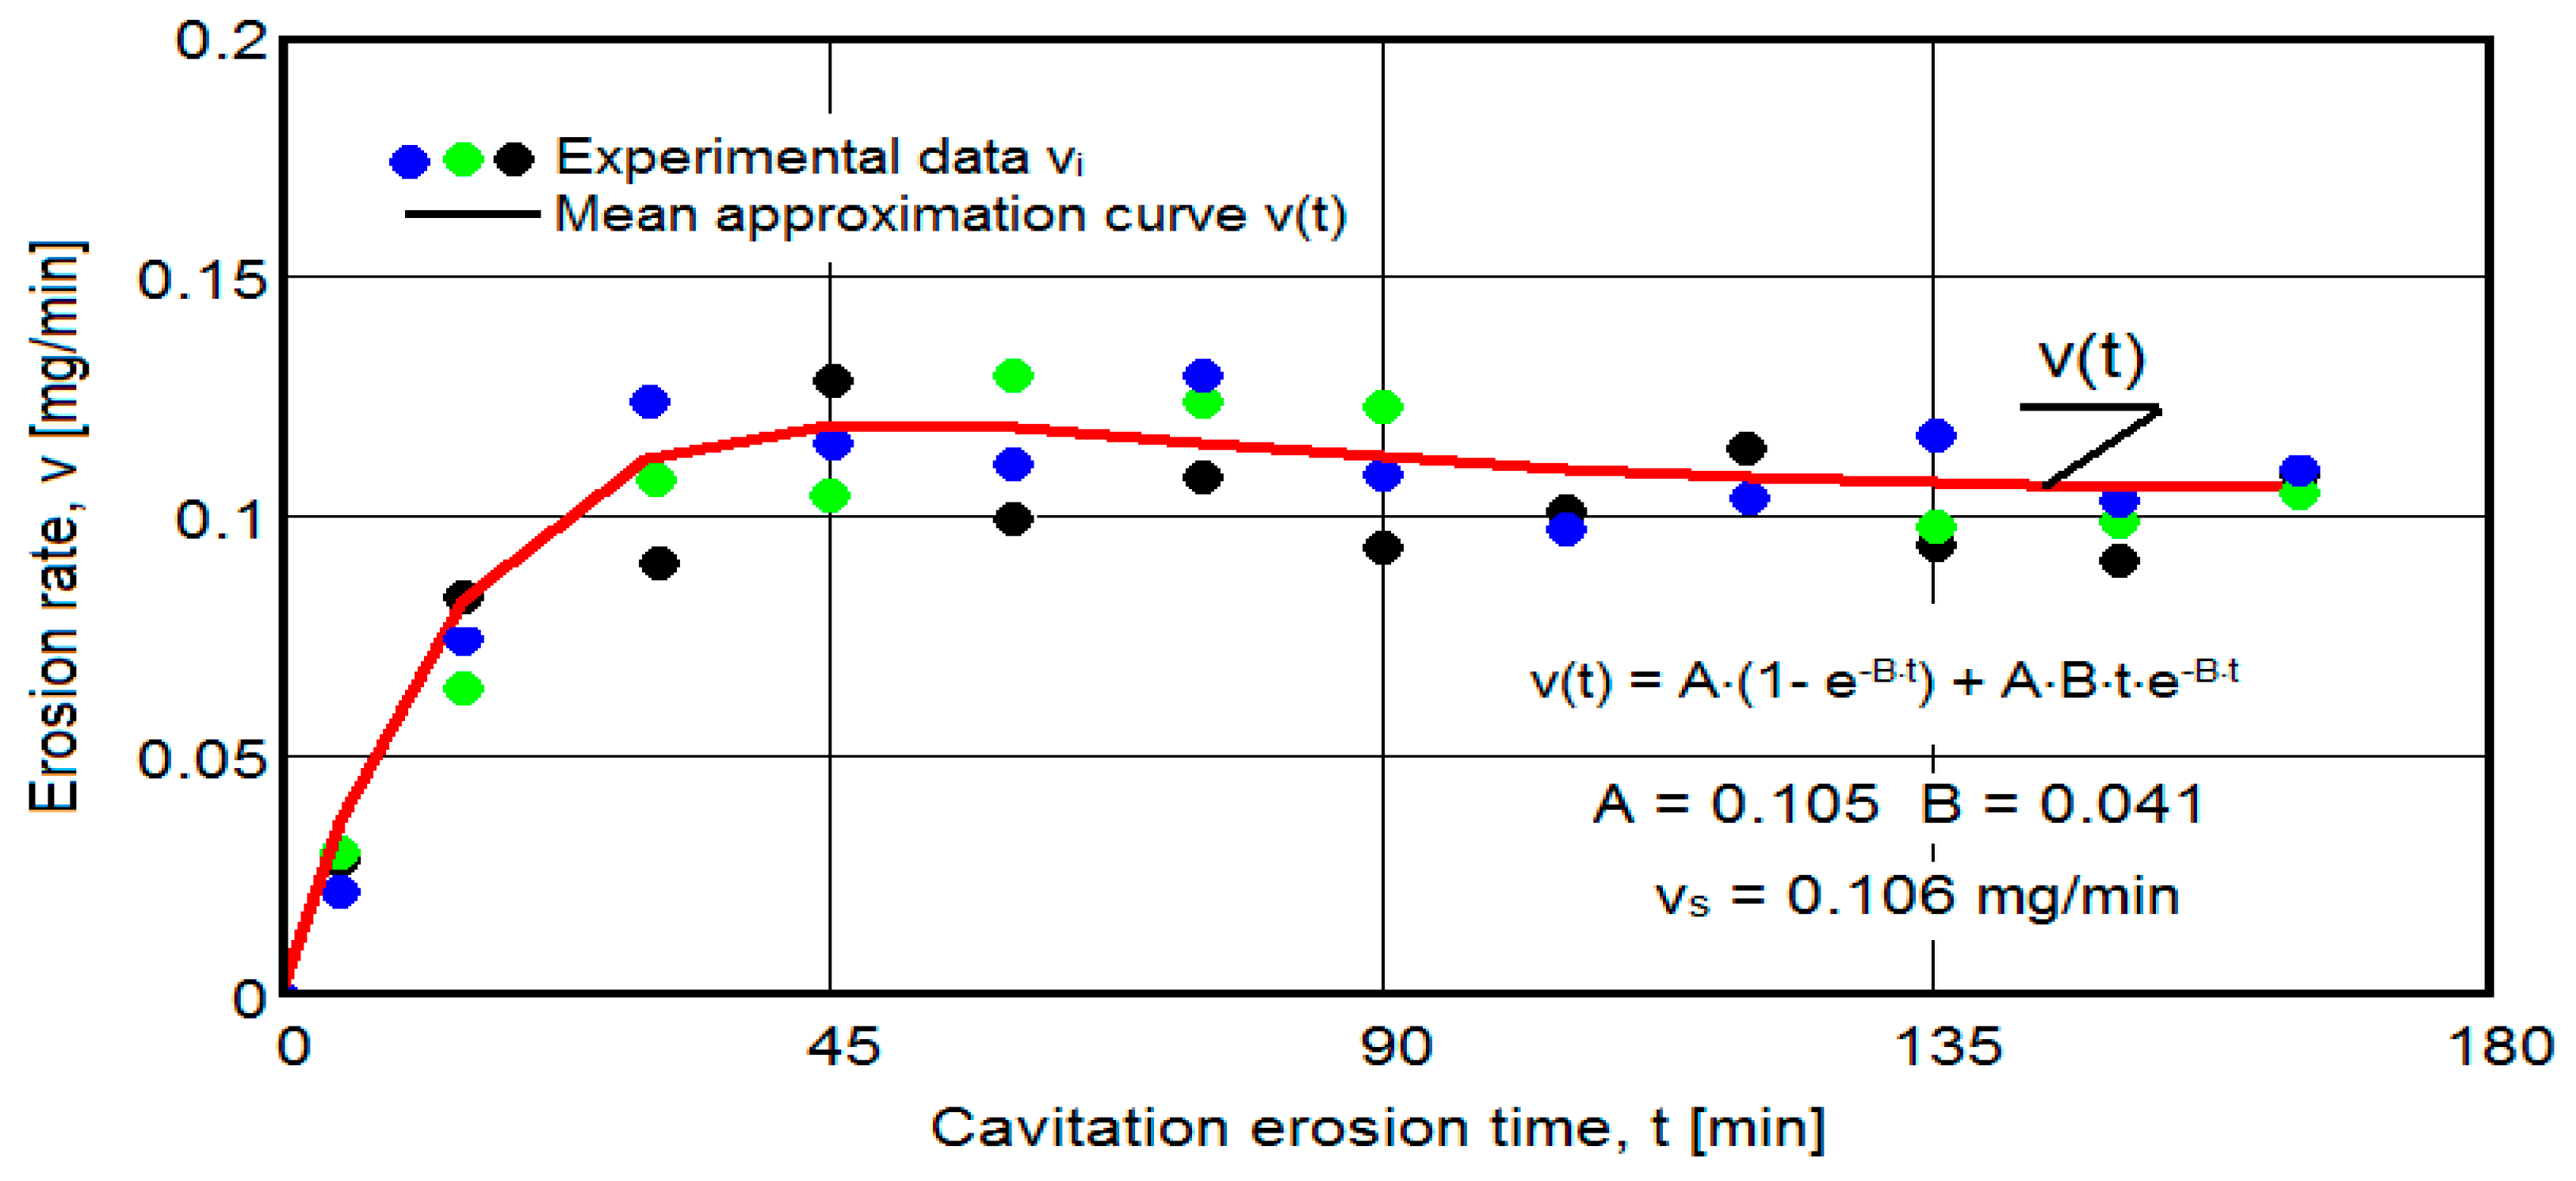
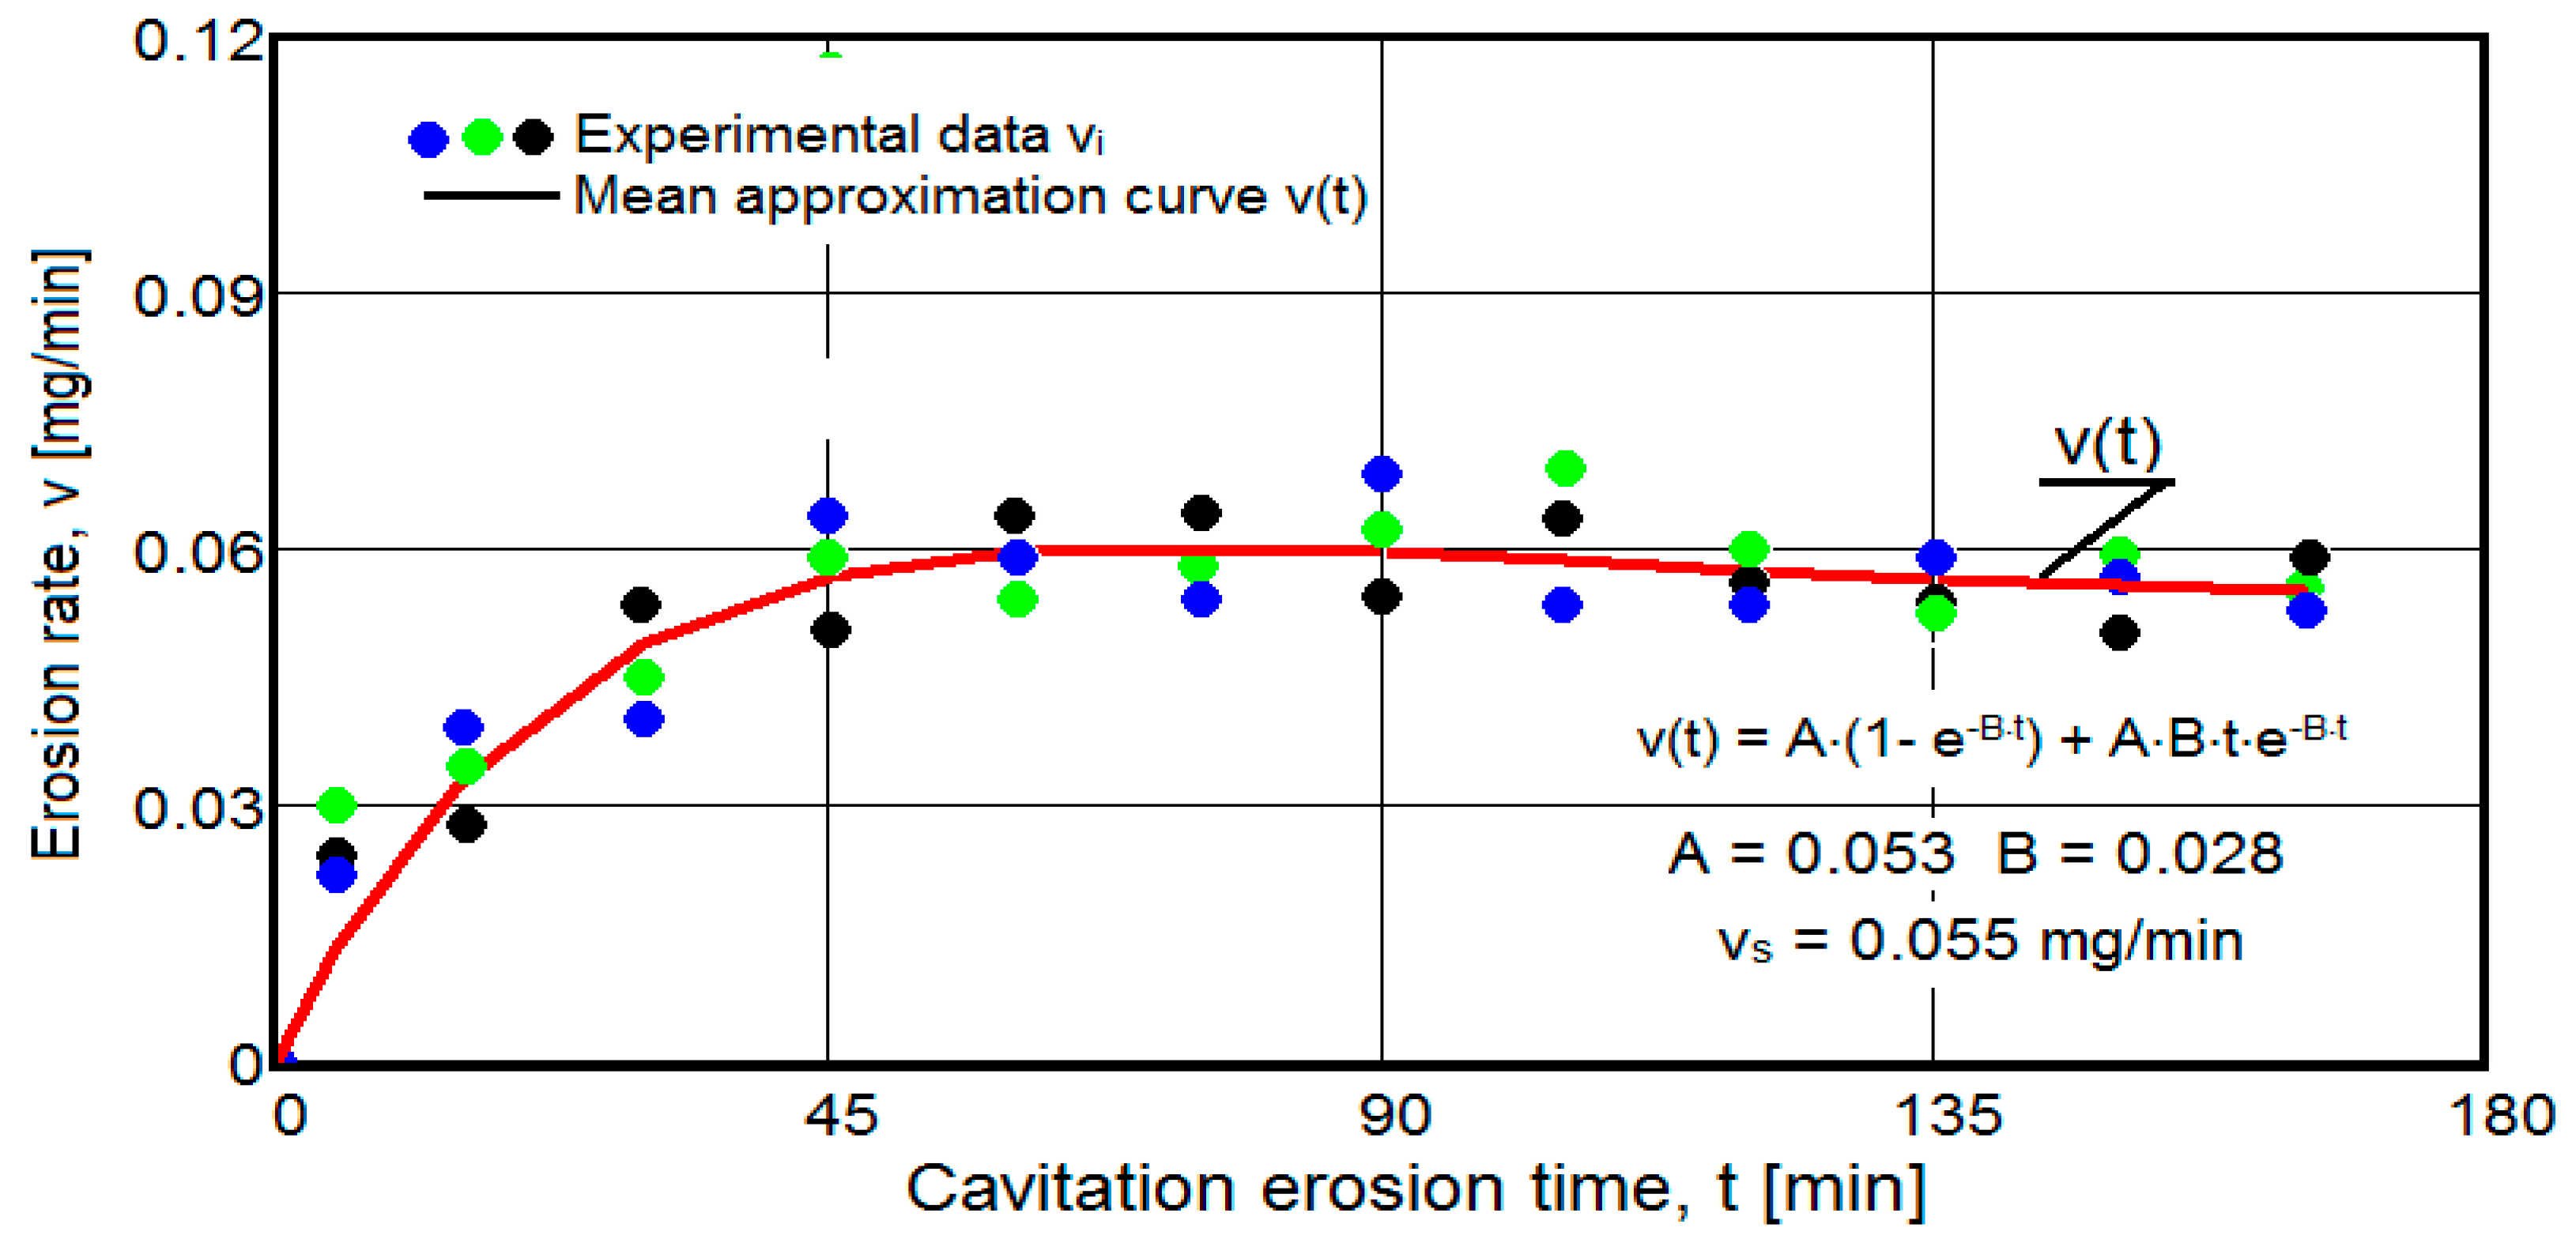
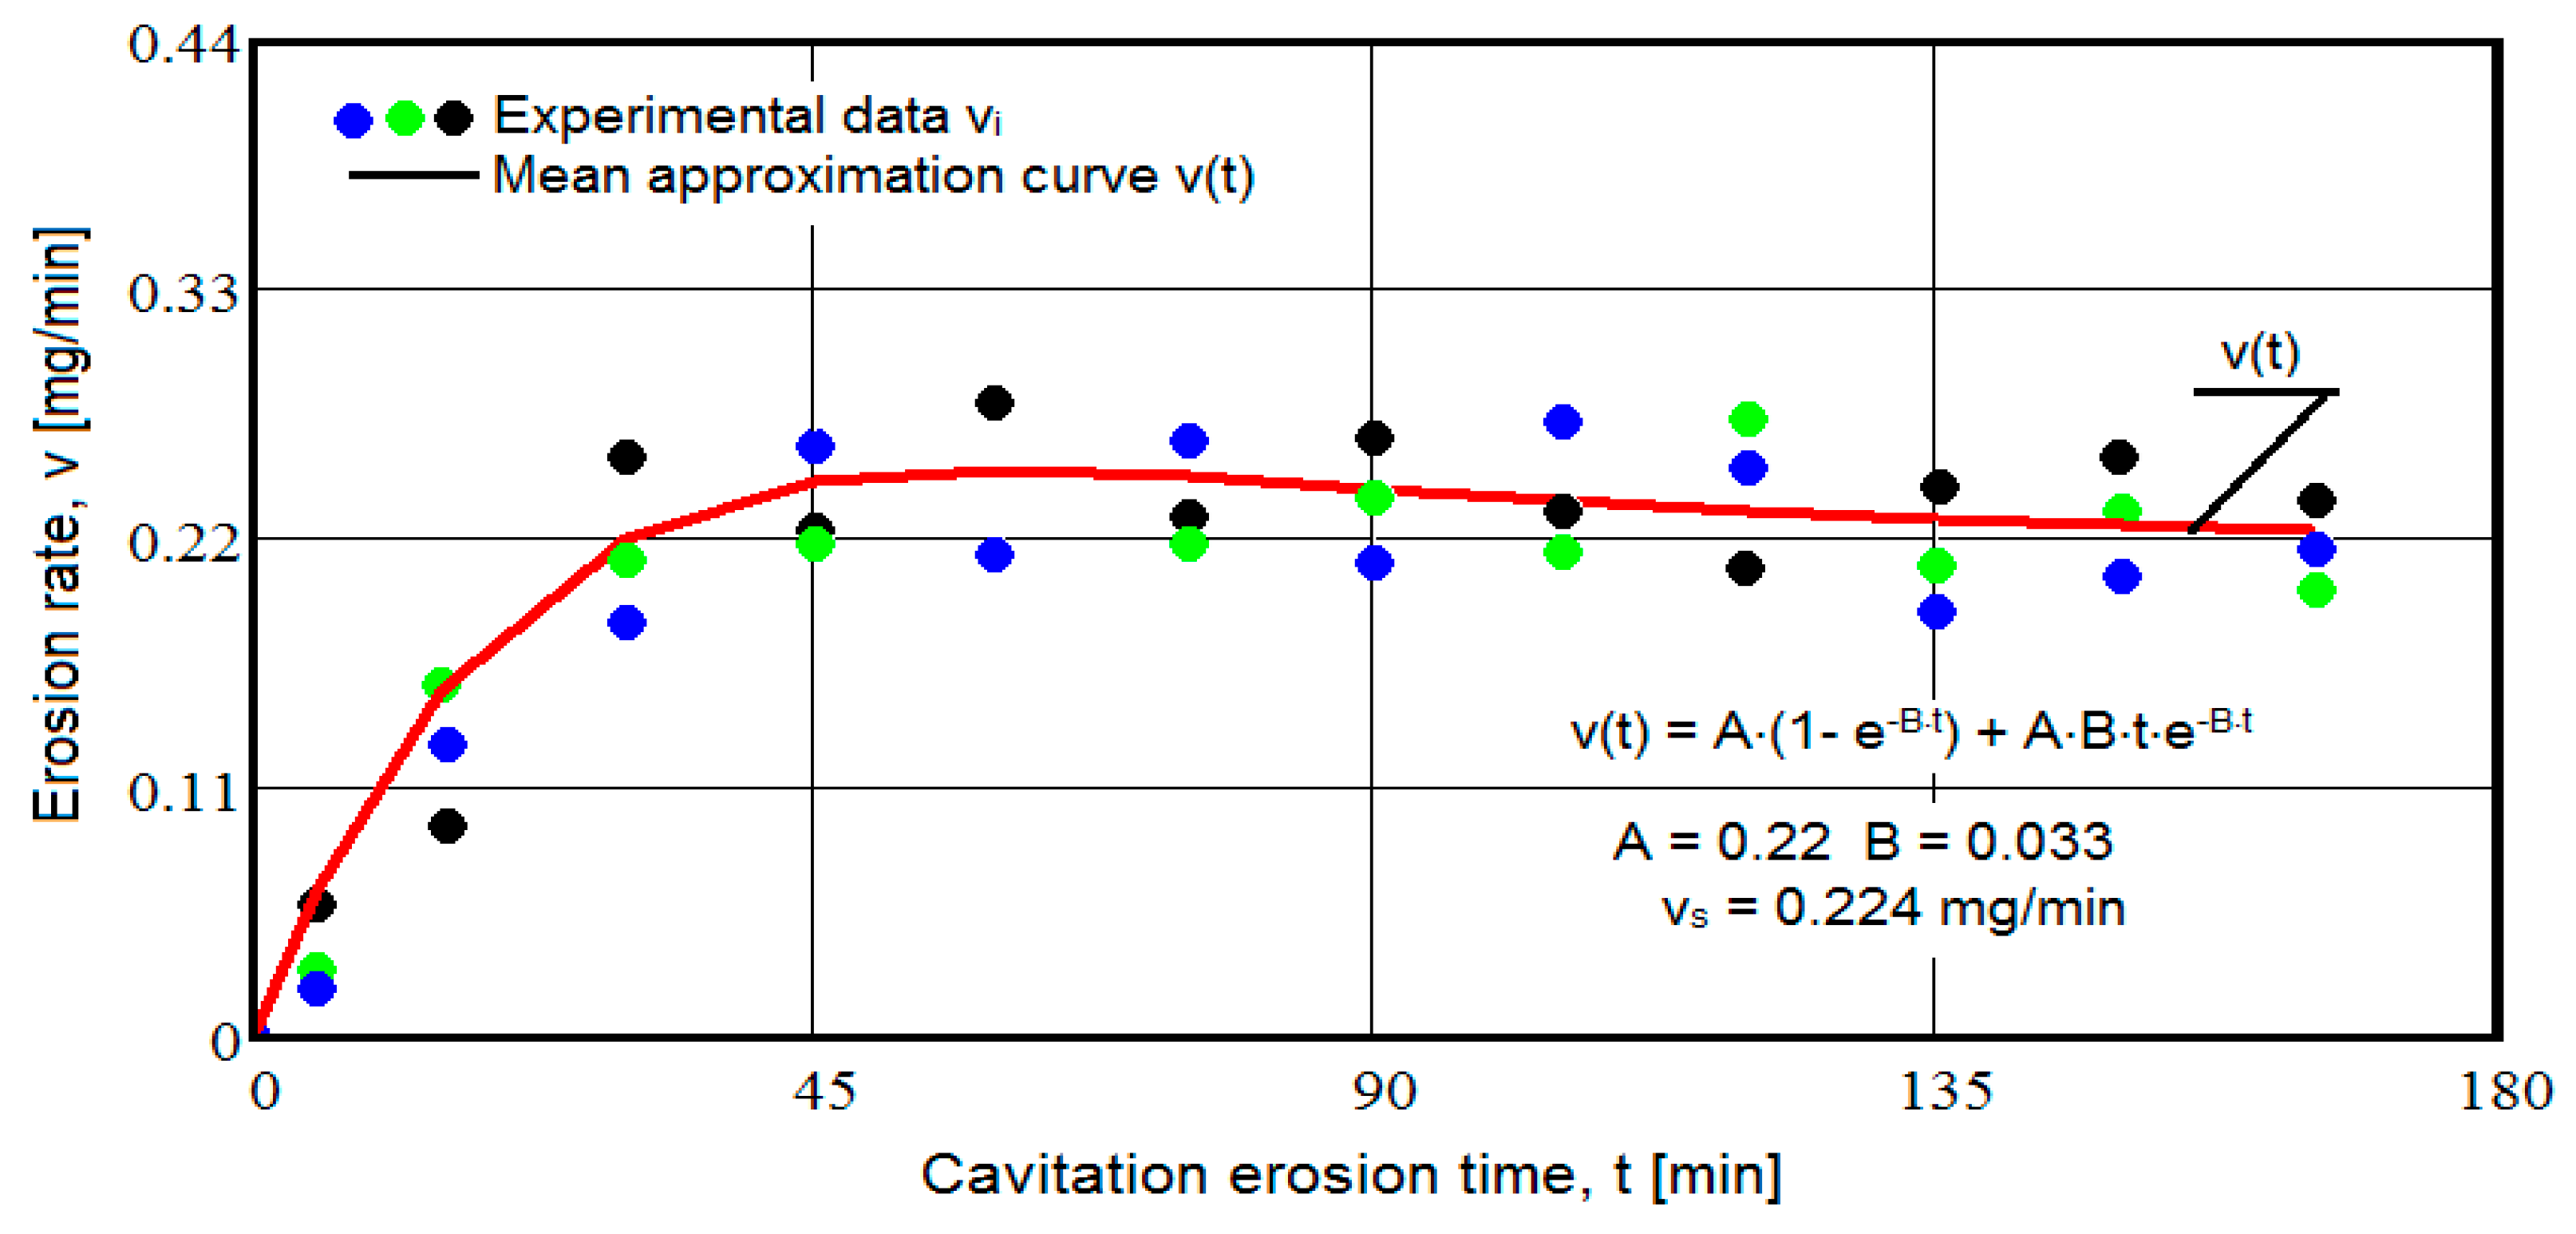
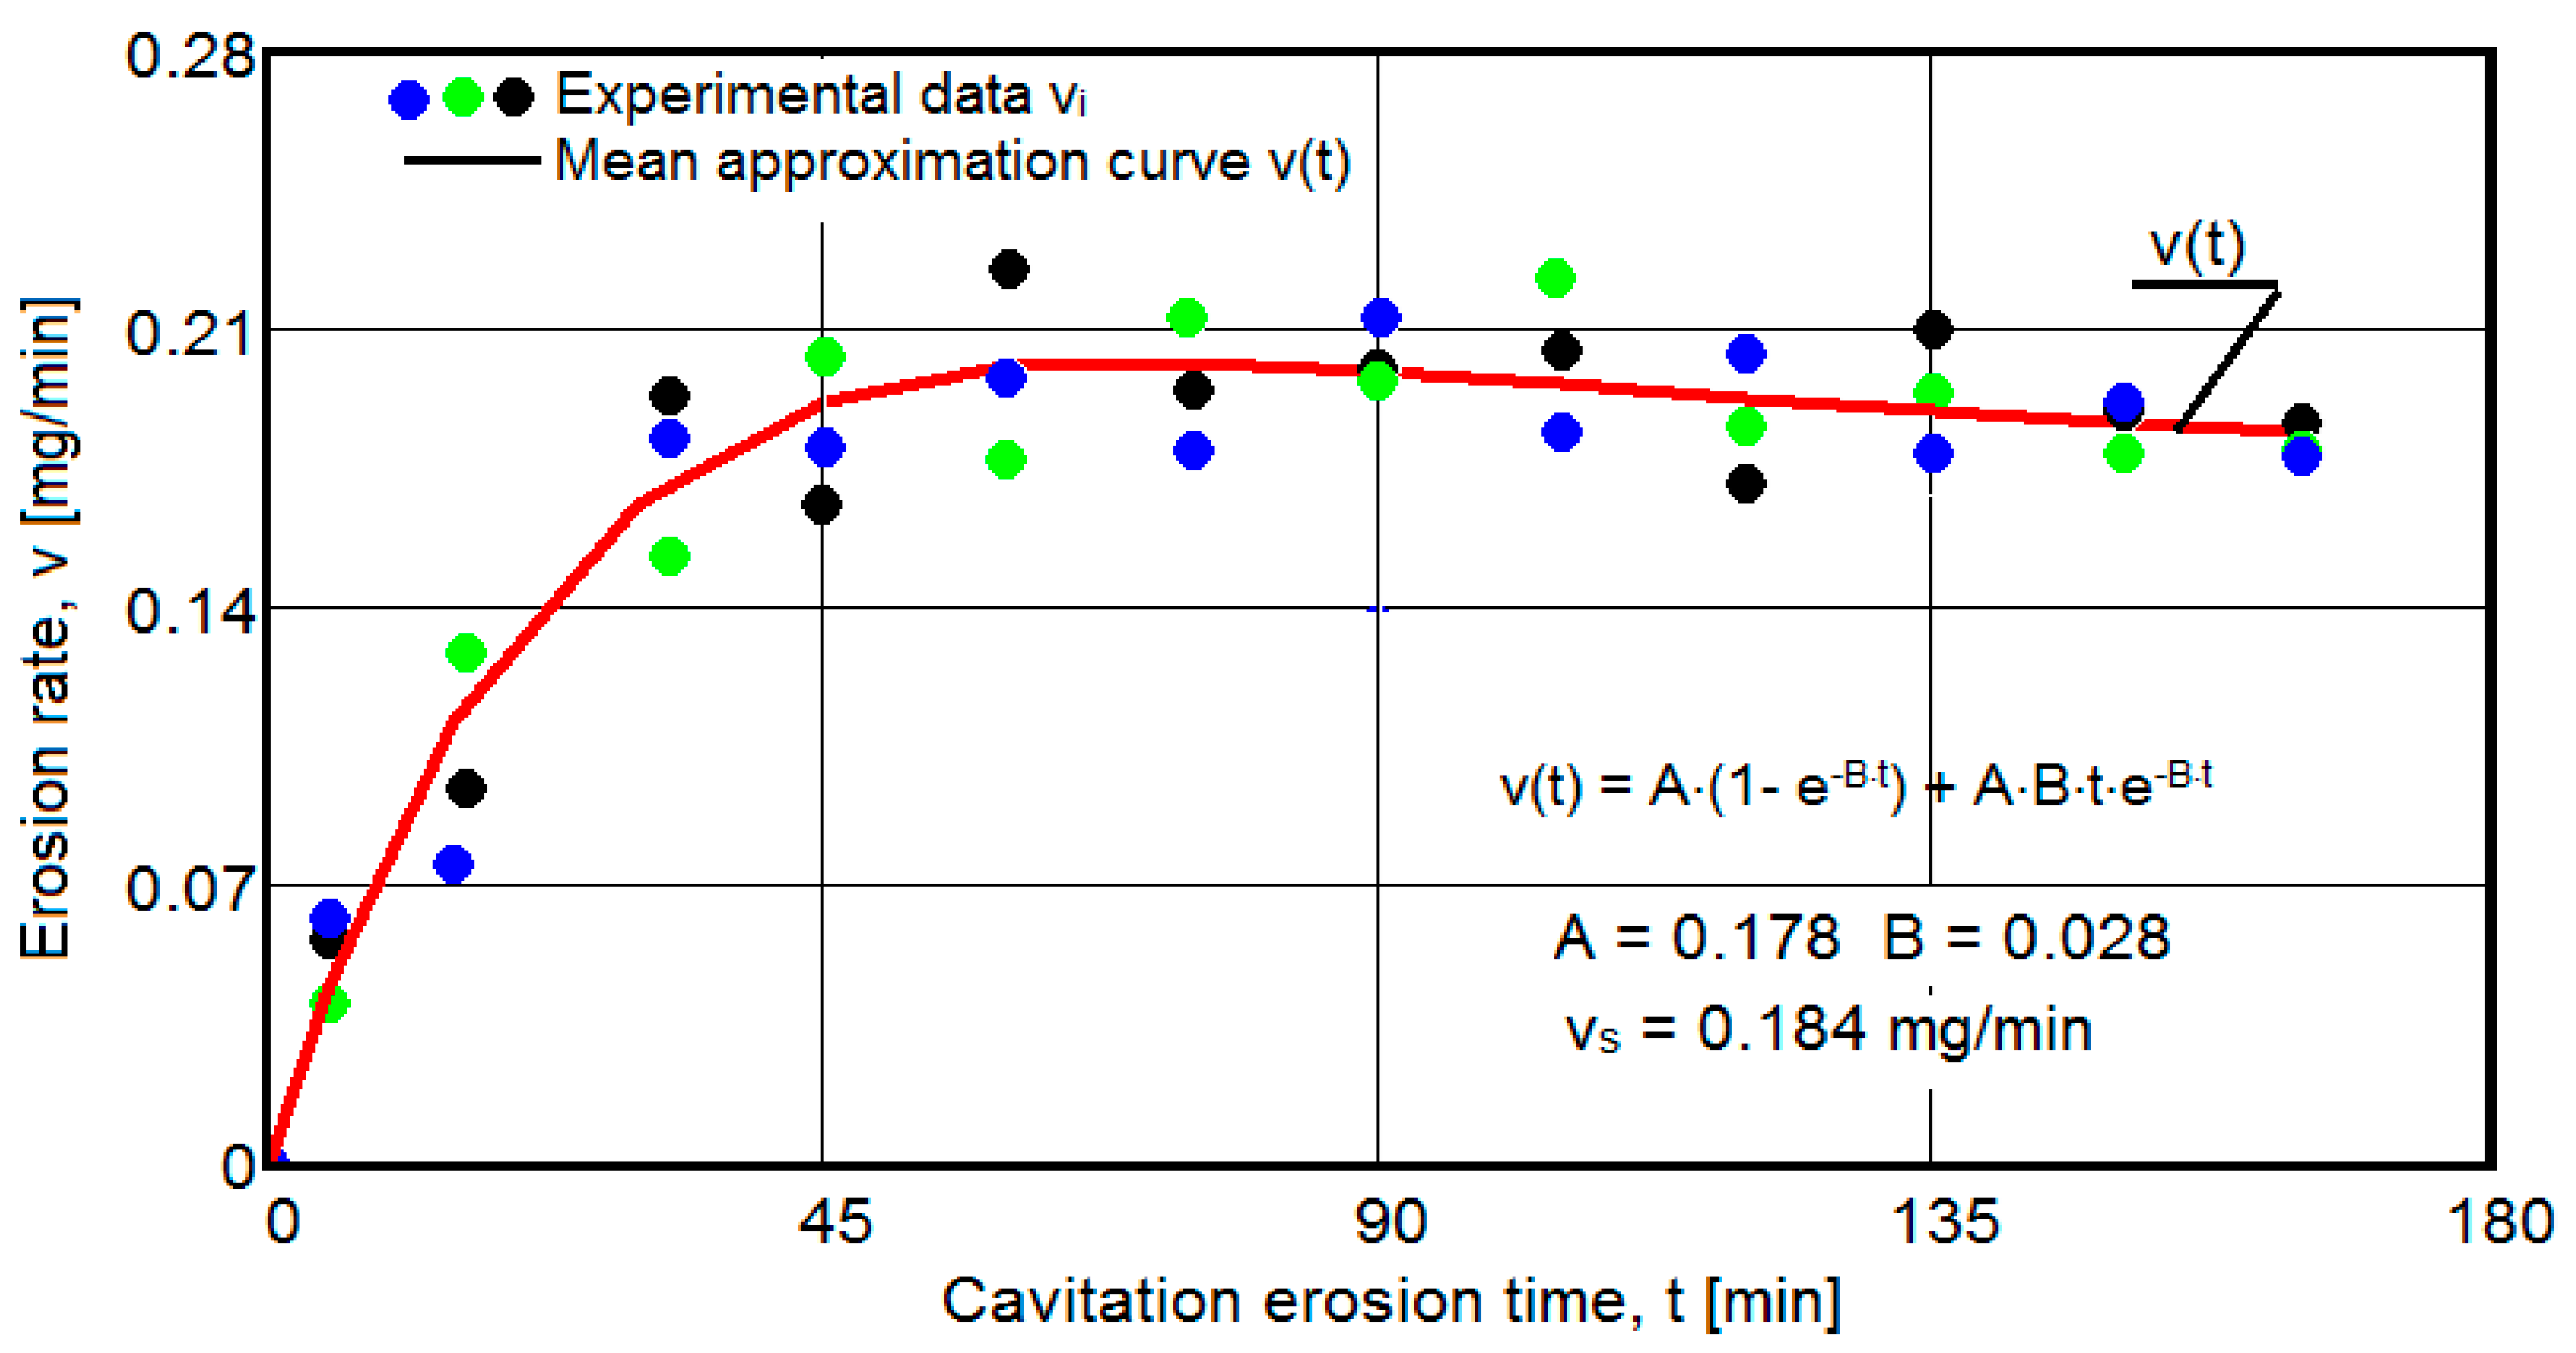
- For the average erosion rate:
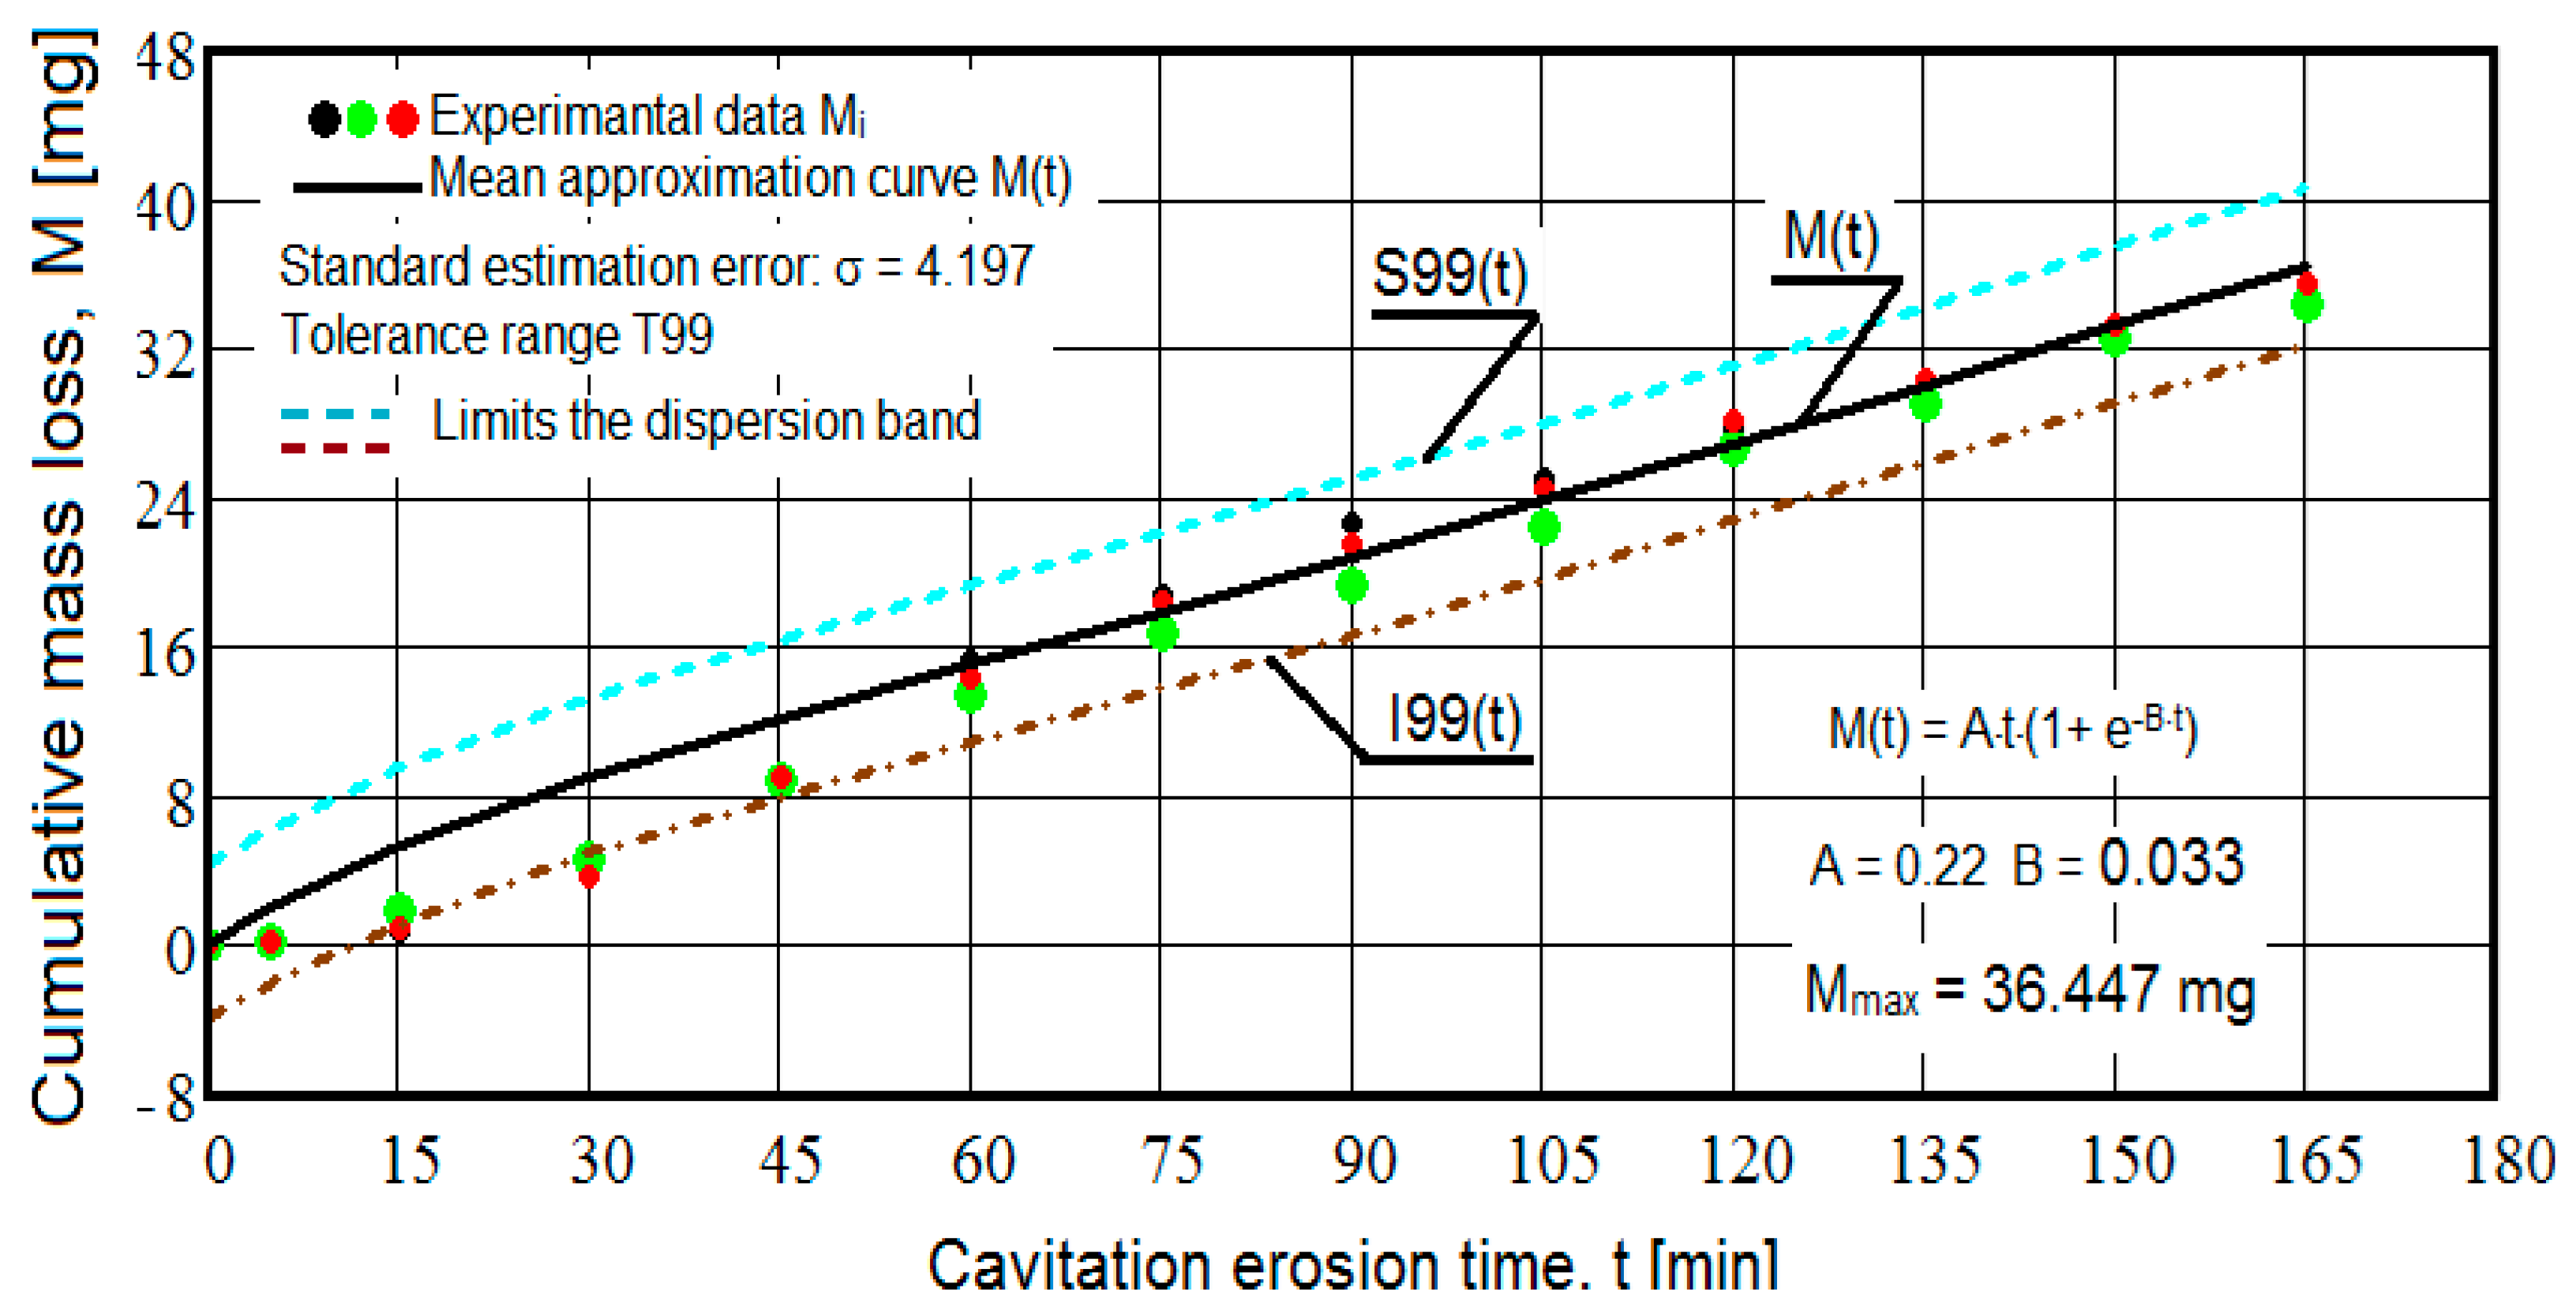
- A is the scale parameter, established from the condition that the deviations of the experimental points from the curve are minimal;
- B is the shape parameter of the curve.
- -
- the equation of the exponential regression curve (rel.1);
- -
- standard error of estimation:
- -
- M(t)i is the mass of material lost through erosion defined by the averaging curve (rel. 1) at time ti;
- -
- Mi is the average experimental value of the values obtained by experiment at time ti, on the three samples.
- -
- for the 99% tolerance interval:
- -
- for the 90% tolerance interval:
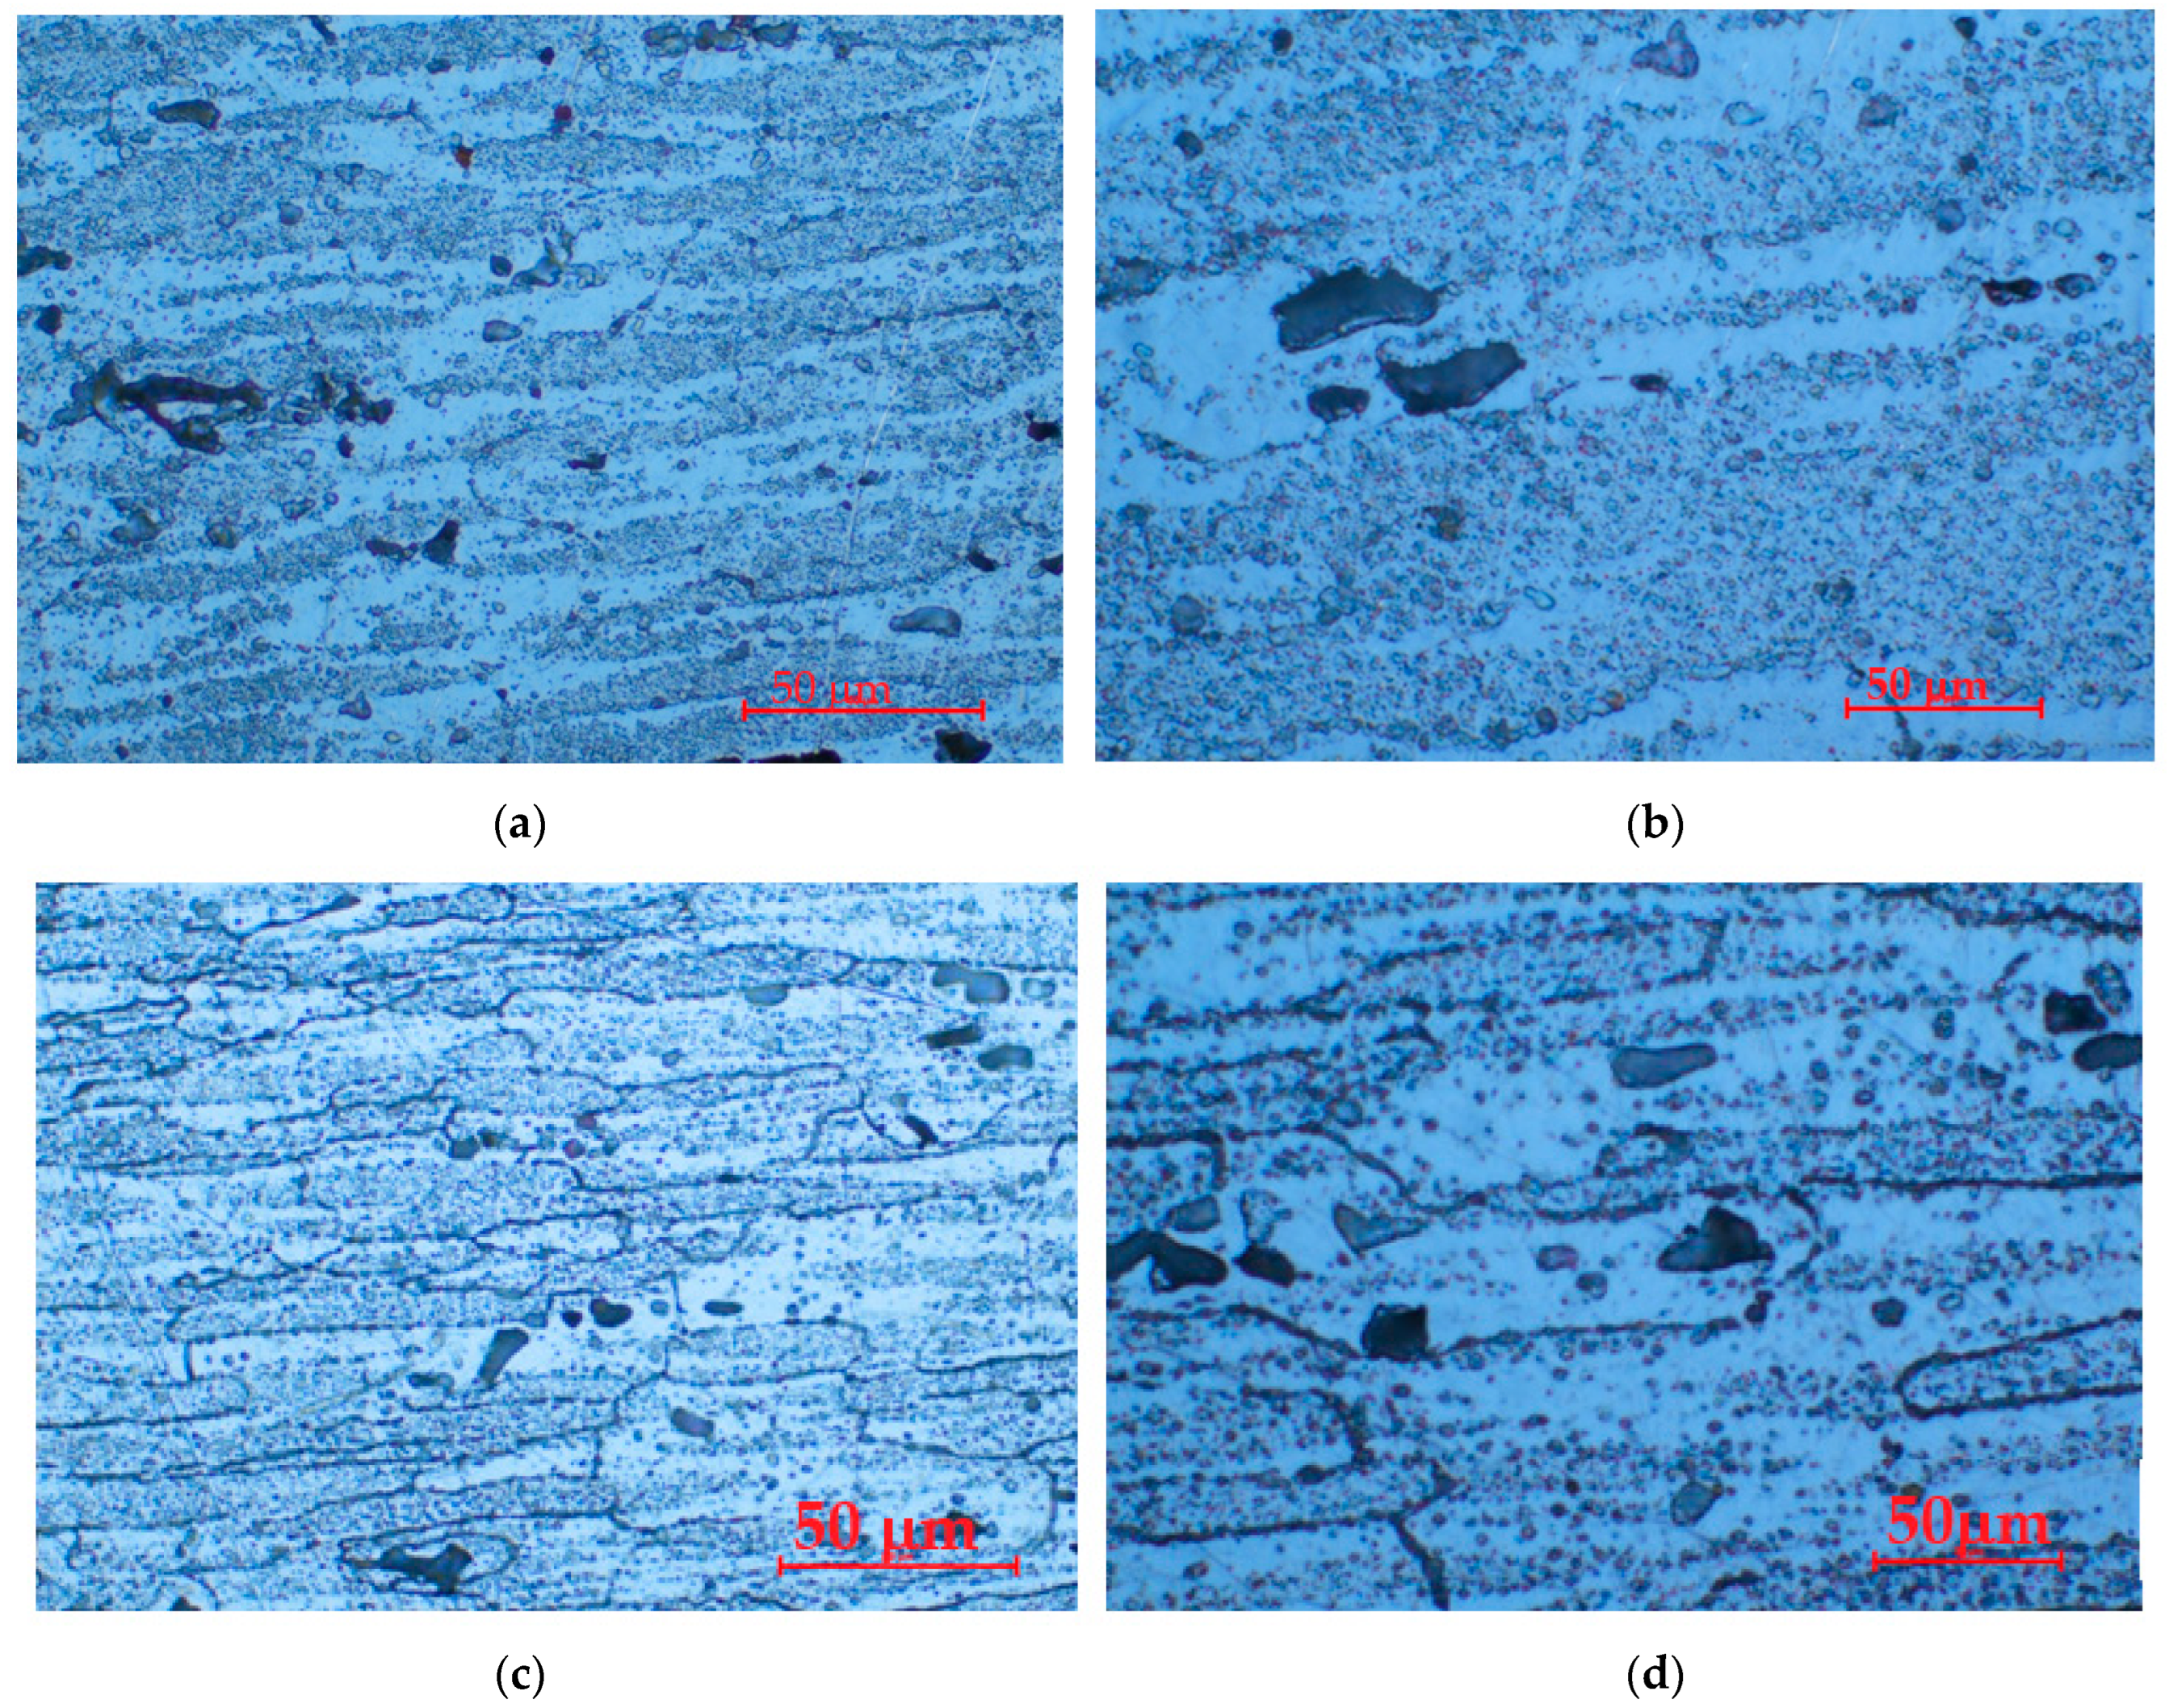
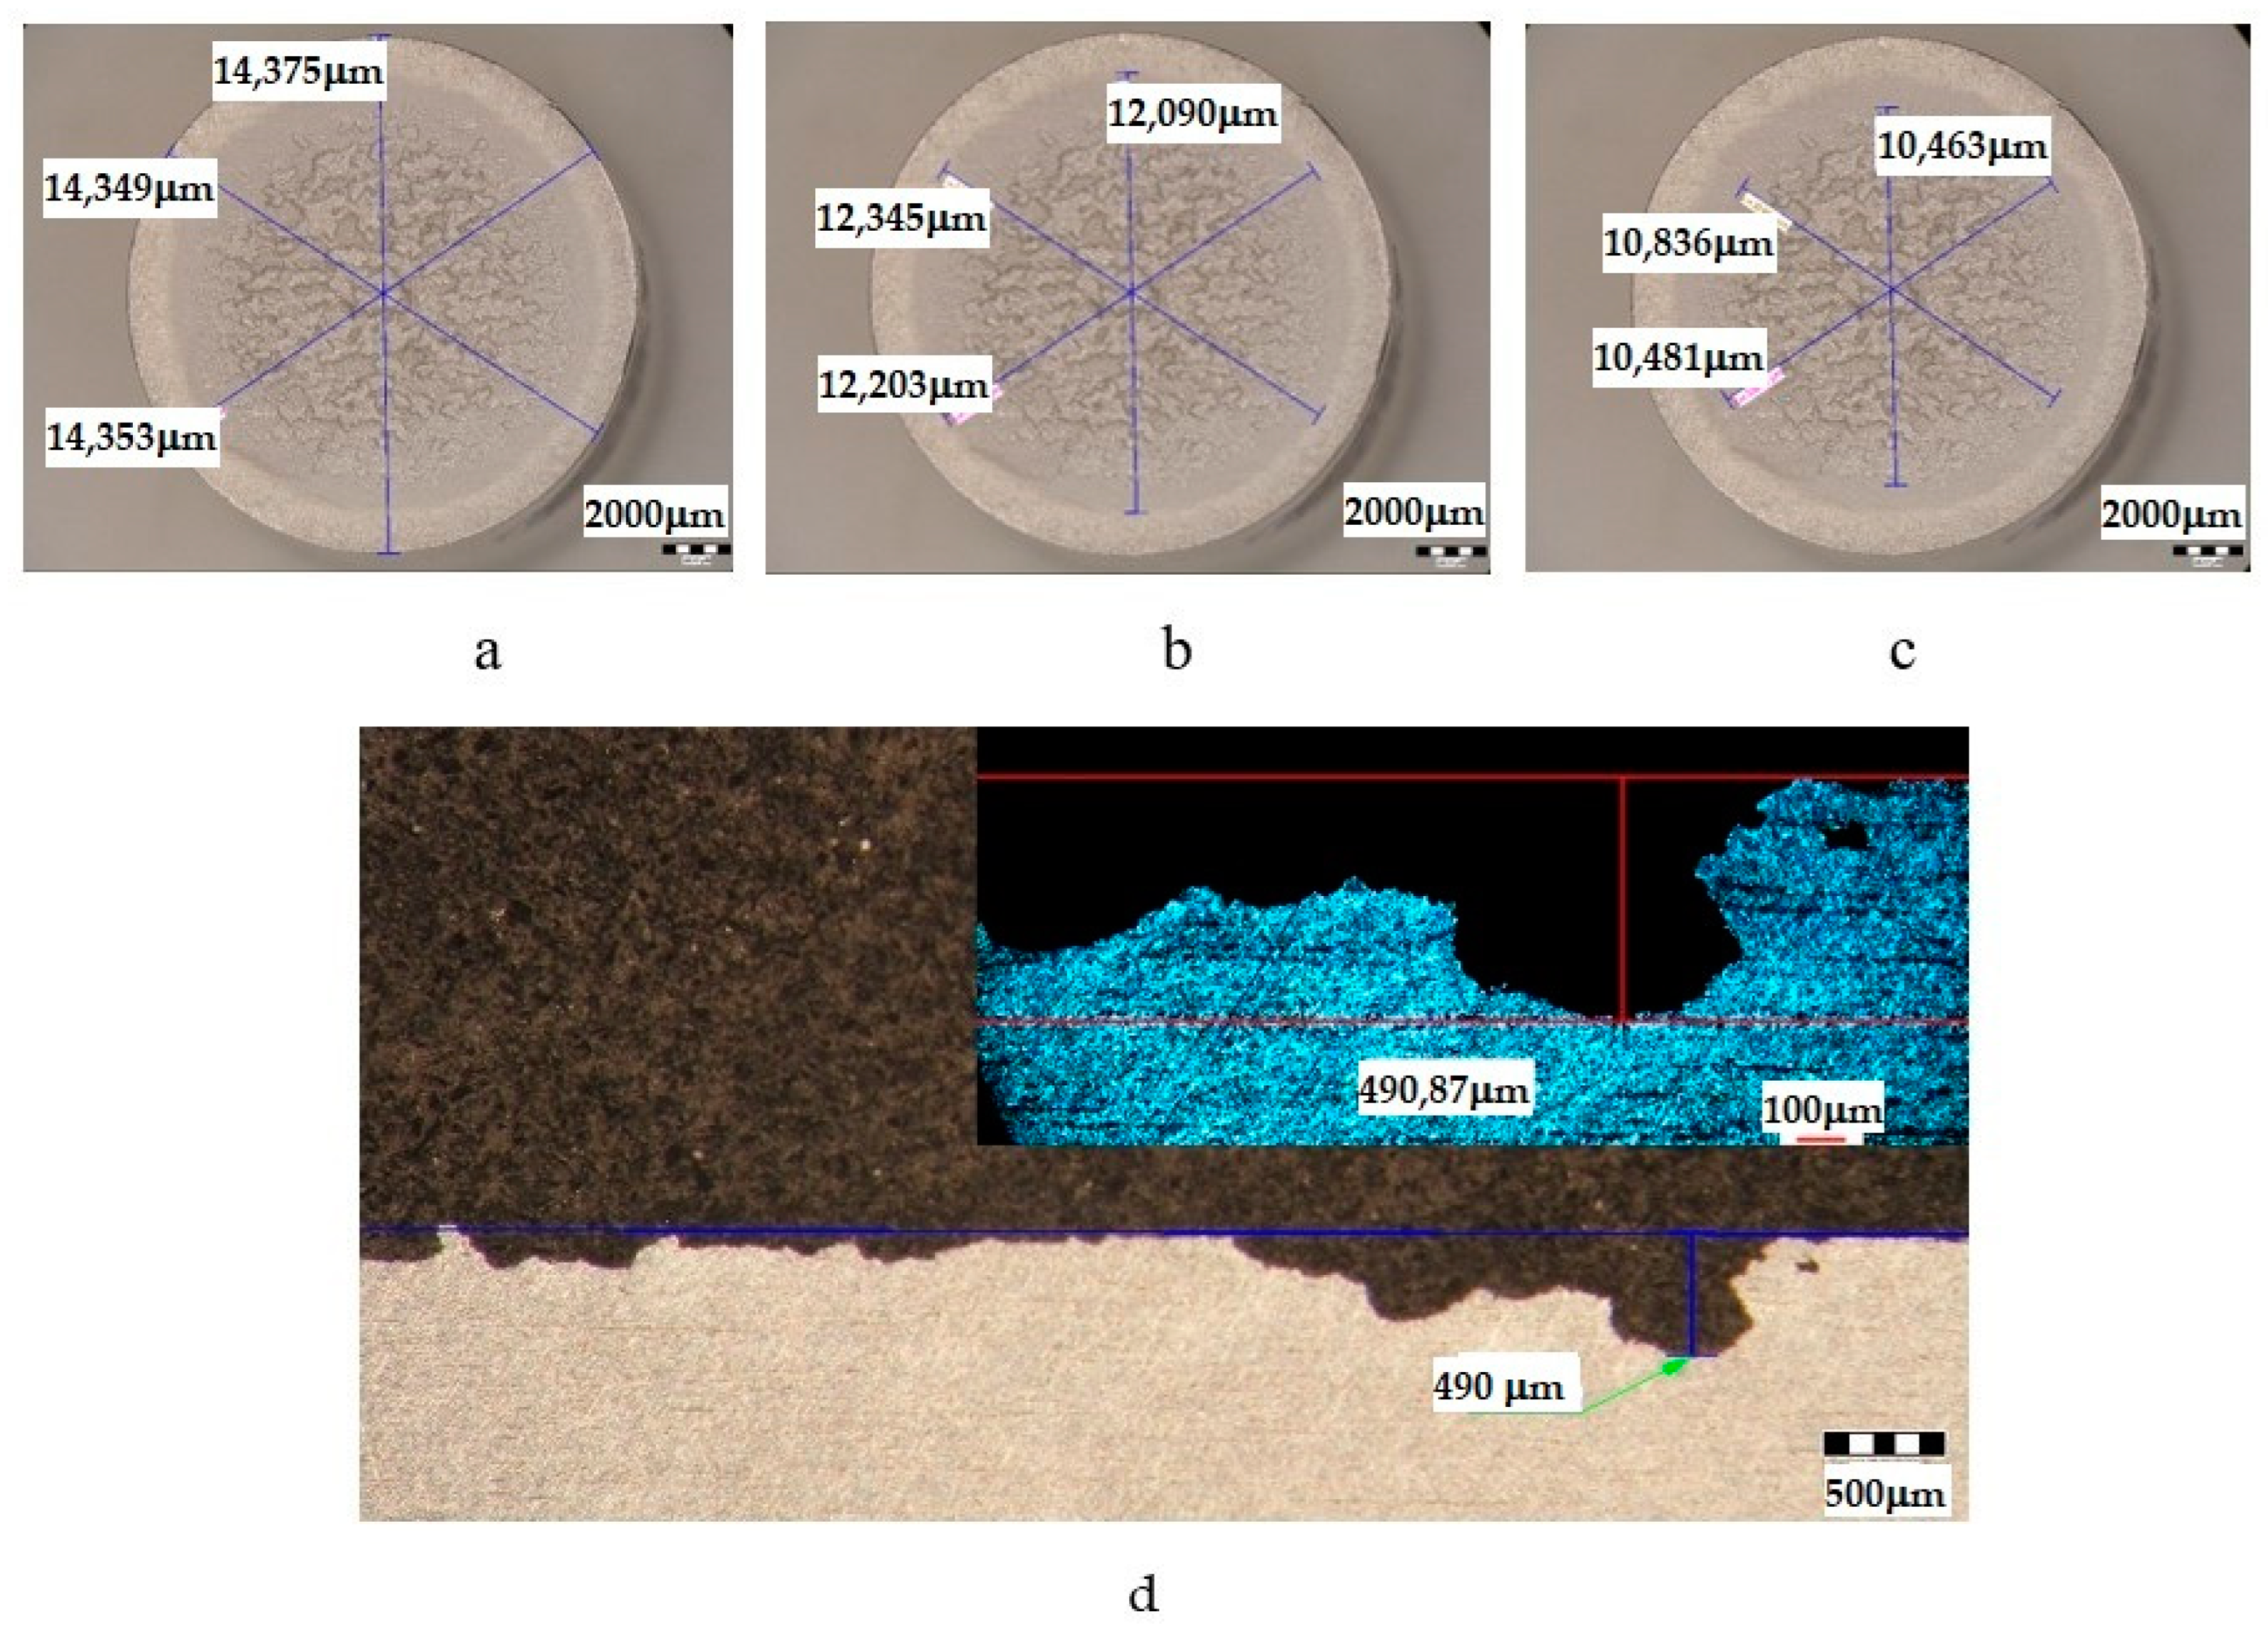
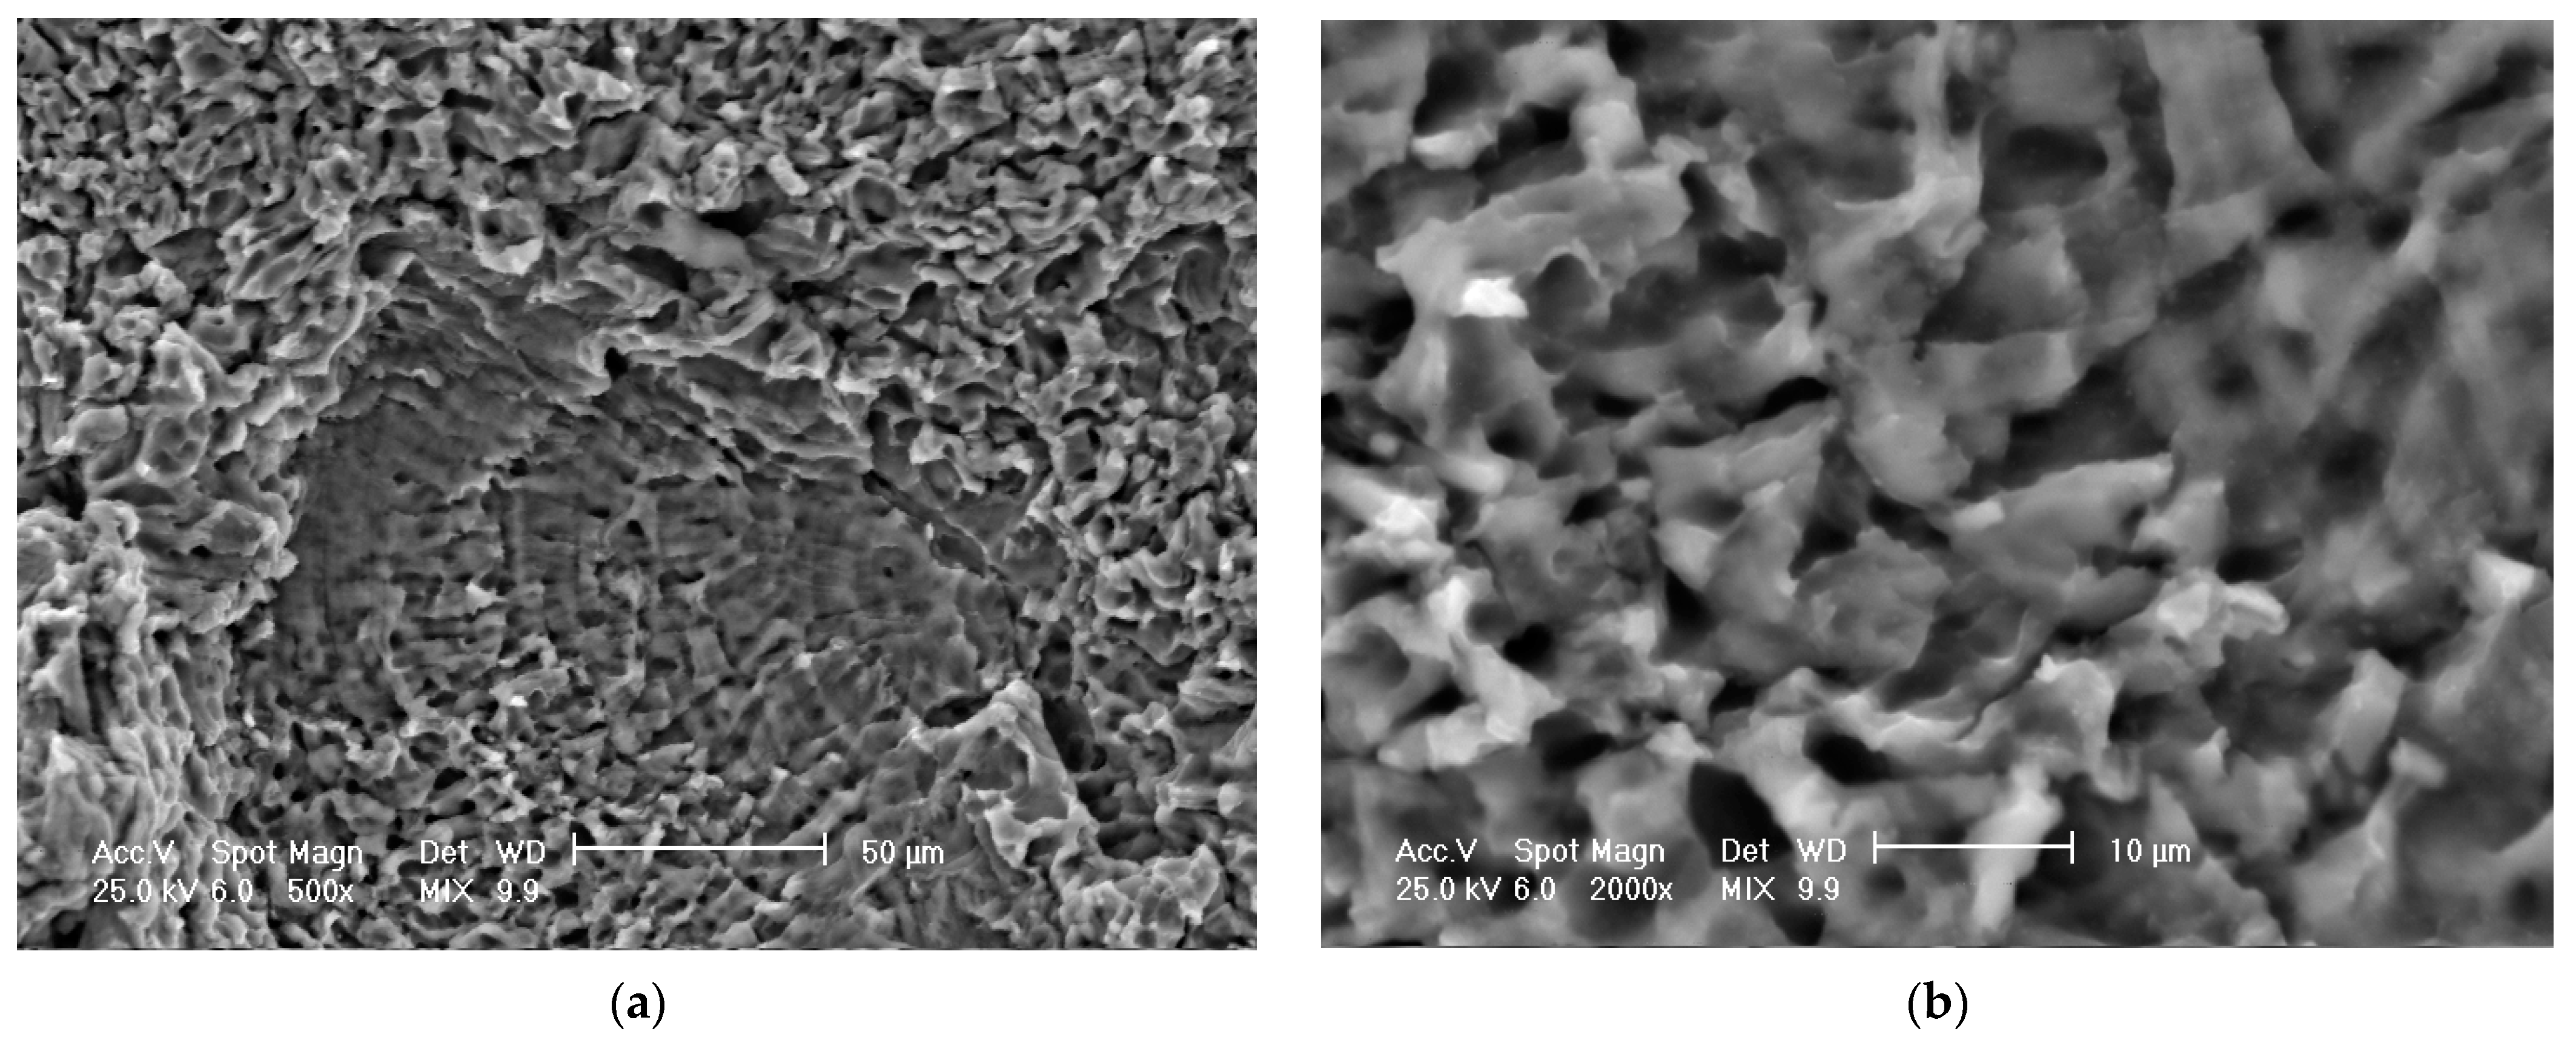
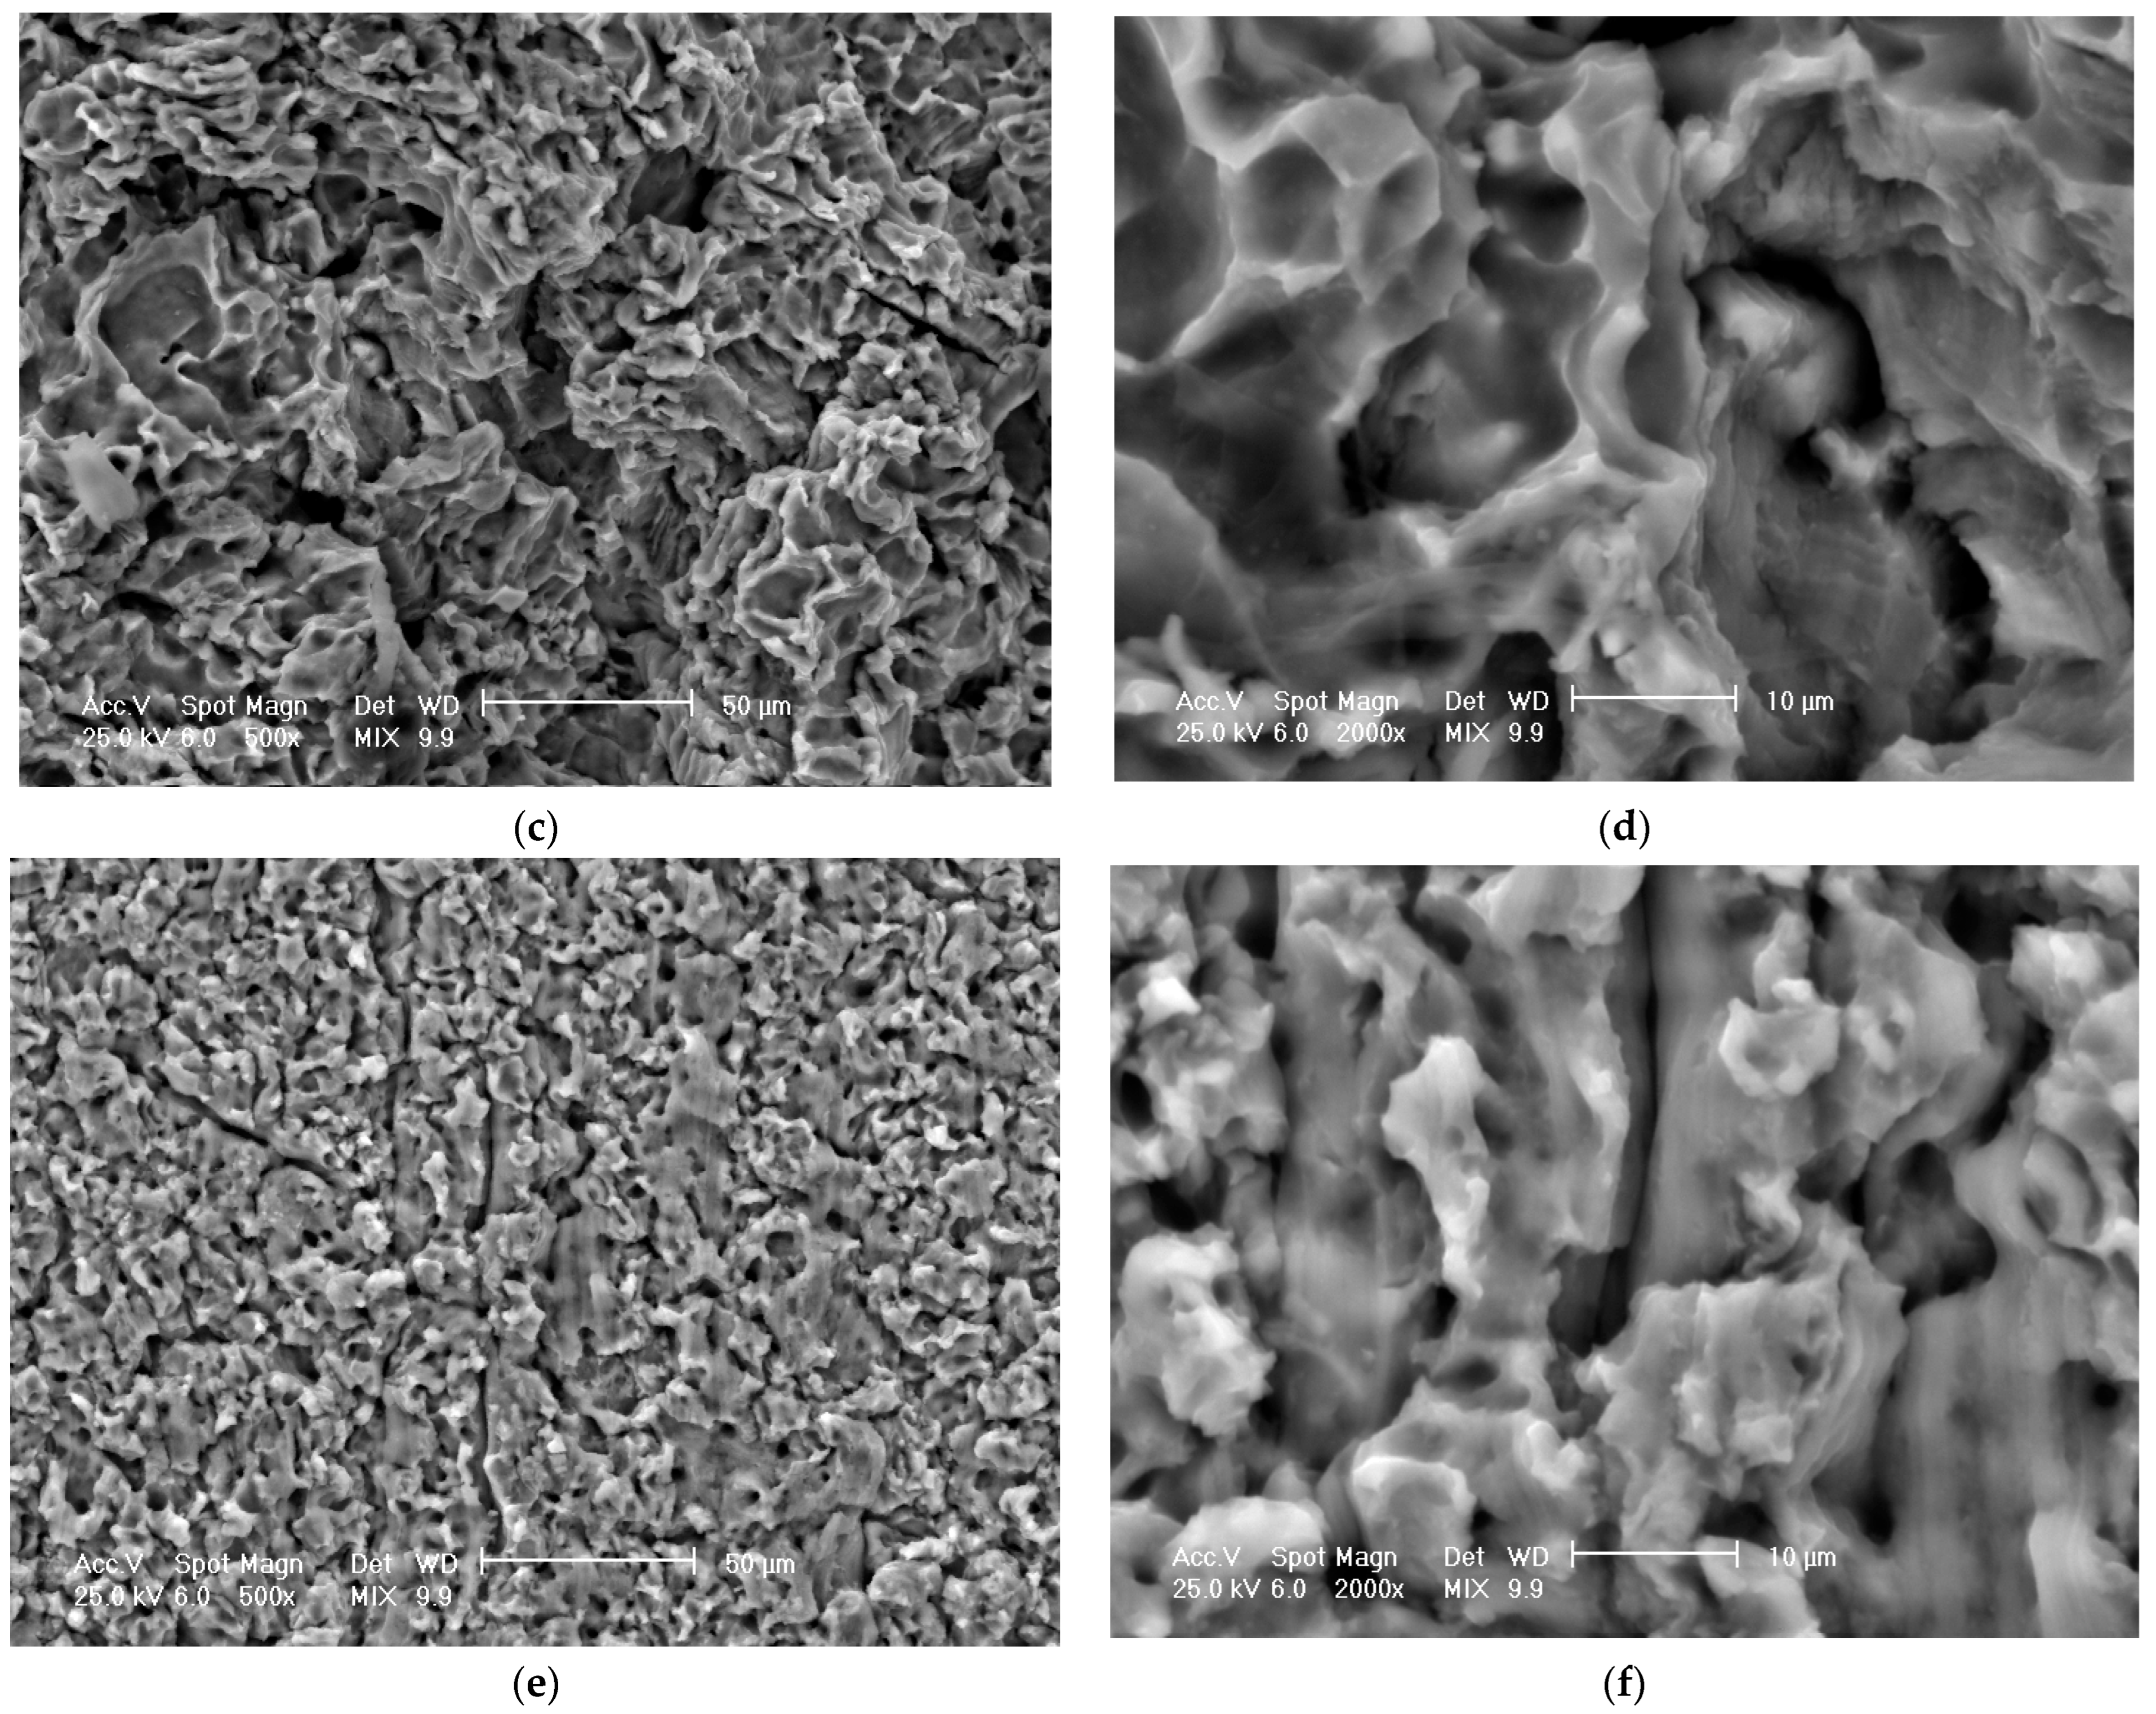
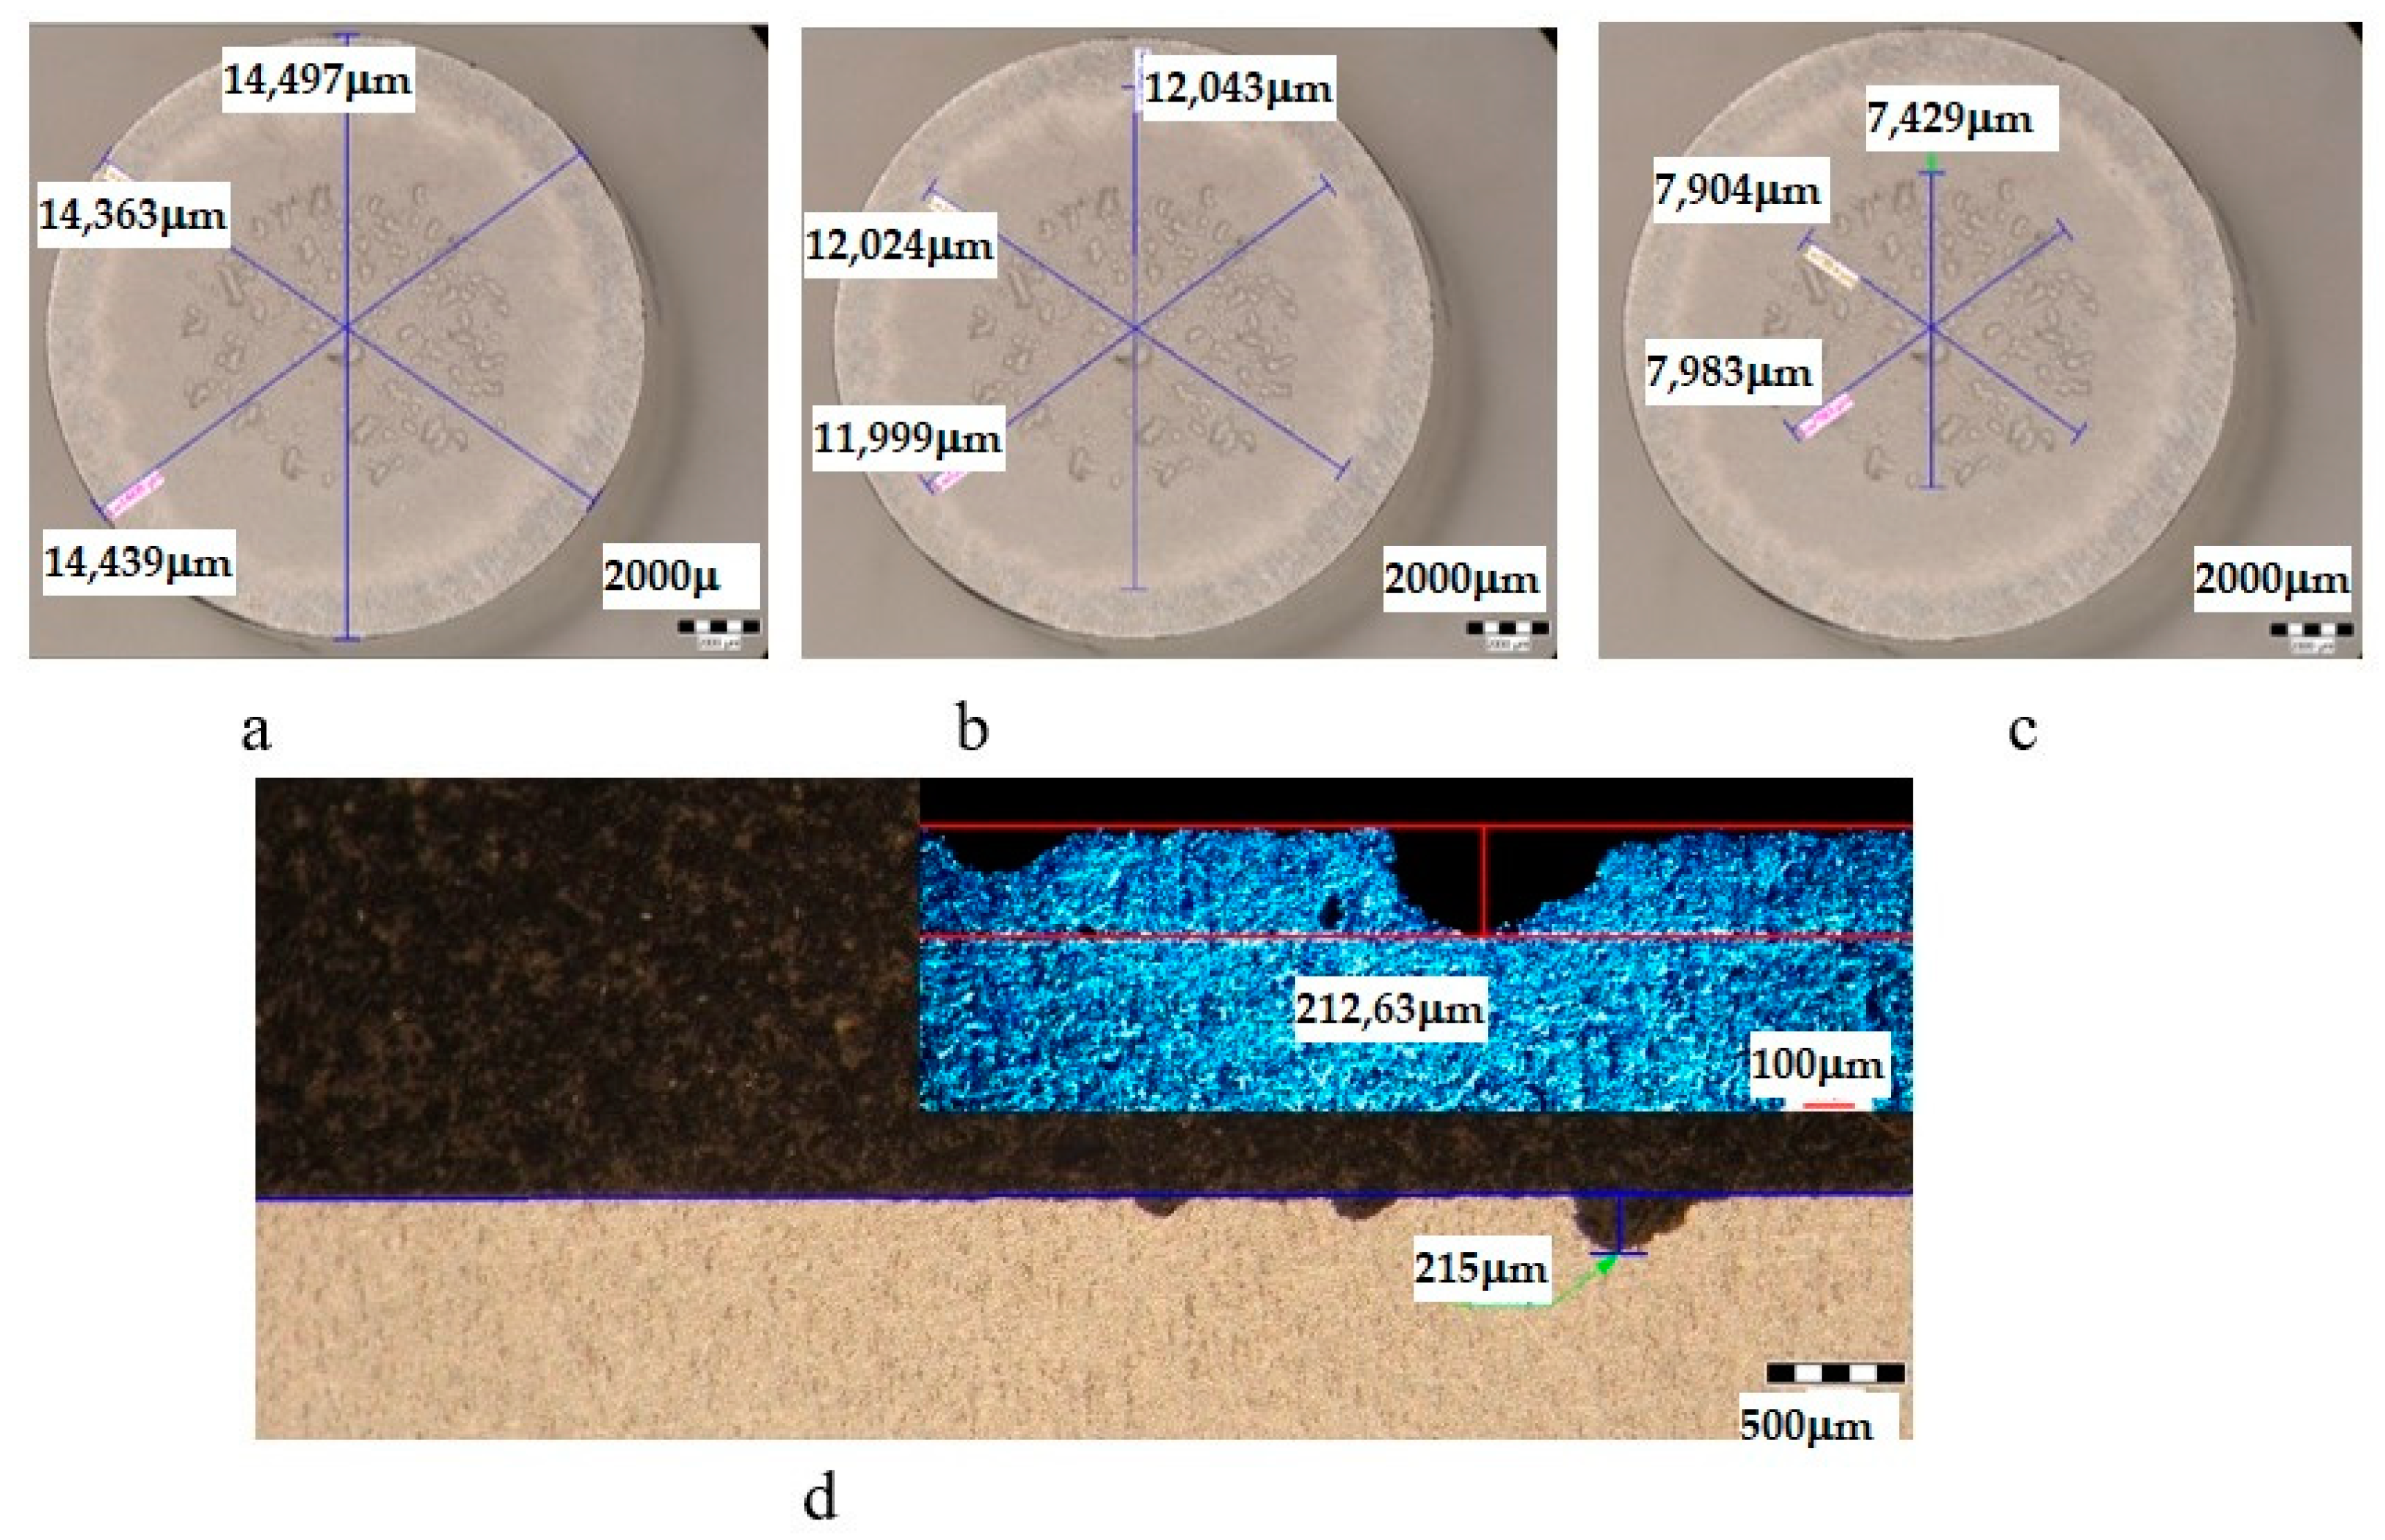
3.3. Scanning Electron Microscope Analysis of Cavitationally Eroded Samples
4. Discussion—Discussions and Interpretations of the Experimental Results Regarding the Behavior and Resistance to Cavitation
- -
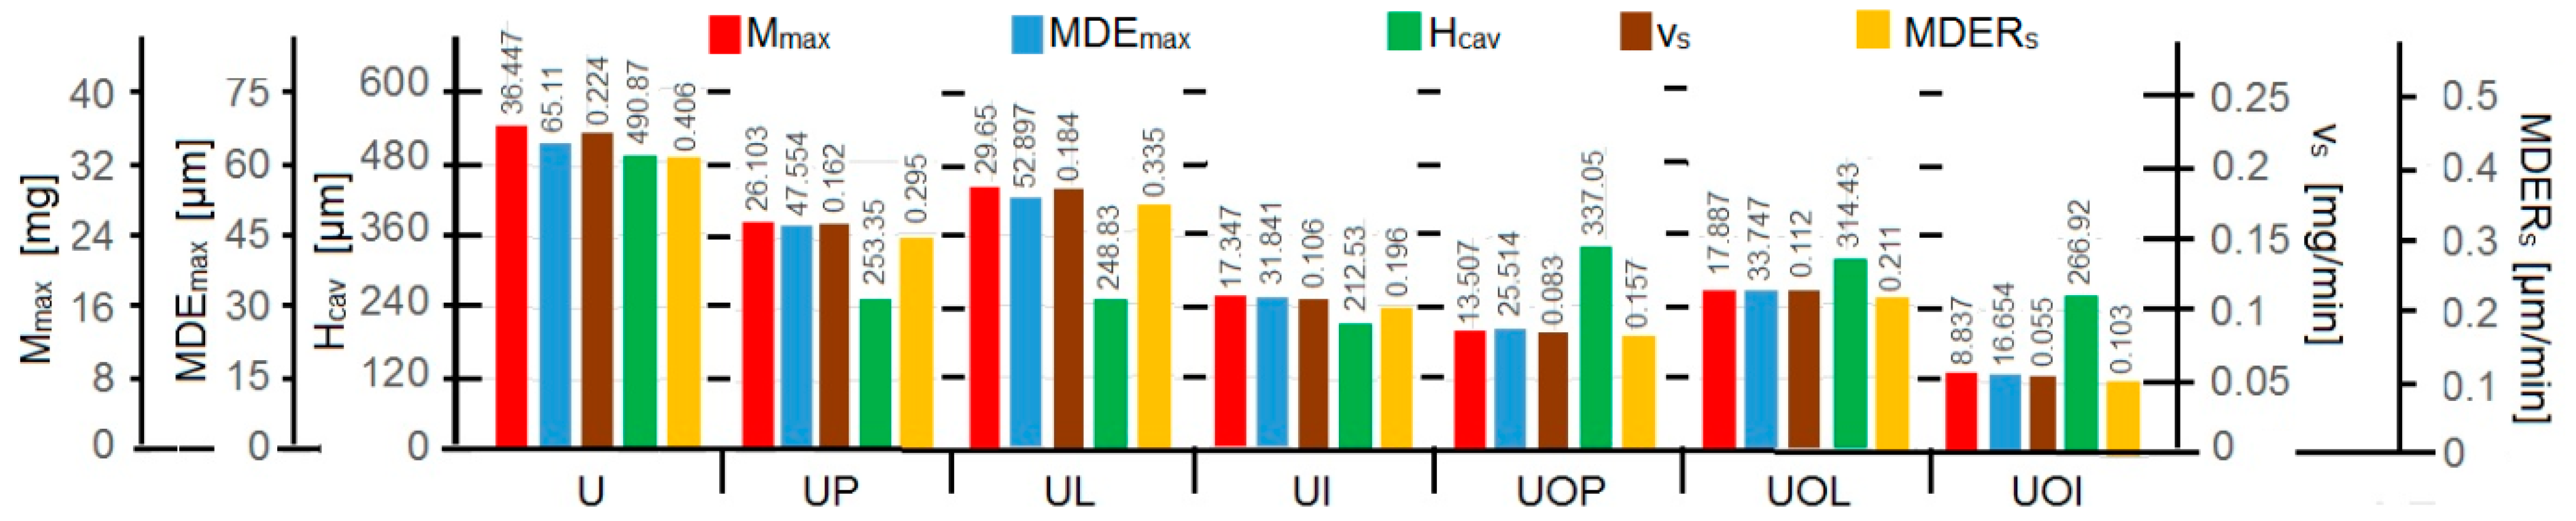
- The values of the tolerance fields (between 97% and 99%), related to the dispersion bands, justify the accuracy of the test program, through the rigorous control of the parameters of the vibrator that dictate the intensity of the destruction by cavitation, regardless of the state (semi-finished or with heat treatment); the structures of the three samples, during exposure to cavitation, have a similar behavior, the values of the standard error σ tending to decrease from 4.197 (for the U-state of the semi-finished product, for which the average algebraic cumulative mass loss is 36.447 mg) to 0.486 (for the UOI condition, for which the cumulative algebraic average mass loss is 8.837 mg), with increased resistance to cyclic cavitation stresses.
- -
- A time interval exists between 0 and 30 min, depending on the state of the sample, in which the mass losses are reduced, following that from here until the end (165 min), the cumulative mass loss is, as is natural, continuously increasing. The small losses in the first part show the dependence of the surface resistance, at the impact pressures with the microjets of the structure, on the grain sizes and on the number and sizes of intermetallic compounds.
- -
- The decrease in the slopes of the M(t) curves, after 30 (60) min, shows the beneficial effect of the heat treatment regime on the resistance of the structure to the stresses of cavitational microjets, the highest slope being for the state of delivery (sample U), and the lowest for the UOI sample (heat treatment carried out at 140 °C lasting 24 h).
- -
- At certain stress durations, the differences between the experimental values of the three tested samples are small, at certain times even insignificant (for sample U 45: 120 min, 135 min, 165 min; for sample UP: 30 min, 75 min, 90 min, 105 min, 135 min; for the UL test: 45 min, 75 min, 120 min, 165 min; for the UI test: 30 min, 45 min, 75 min; for the UOP test: 15 min, 75 min, 105 min; for the UOL sample: 15 min, 60 min, 120 min; for the UOI sample: 15 min, 60 min, 105 min, 135 min), which shows the effect of the heat treatment, from the point of view of structural homogeneity and dispersion of mechanical property values in the structure of the required surfaces, but also in the volume of samples.
- -
- Similar conclusions can be reached as the analysis carried out on the diagrams that showed the variation of mass losses with the duration of cavitation, that is, small, natural differences between the experimental values of the three samples, from each state.
- -
- The dispersion of the experimental values, at various attack times, shows that there are some differences between the surface structures of the three samples, caused, in particular, by the structural defects, by the intermetallic compounds and the sizes of the ejected grains. Overall, the tendency of the behavior of the structures of the three samples to the vibratory cavitation stresses is close, a fact confirmed by the evolution of the v(t) curve.
- -
- After 45 (60) min, the averaging/approximation curves v(t) decrease asymptotically towards the value vs. This evolution is determined by the decrease in mass losses (see the related diagrams) as a result of the reduction in the energy absorbed to break the bonds between the grains and the expulsion.
- -
- The evolution of the curve v(t), from the maximum value to the minimum value, is slower for structures with high resistance (see UOI sample, Figure 18).
- dp = 15.8 mm represents the diameter of the surface exposed to cavitation.
5. Conclusions
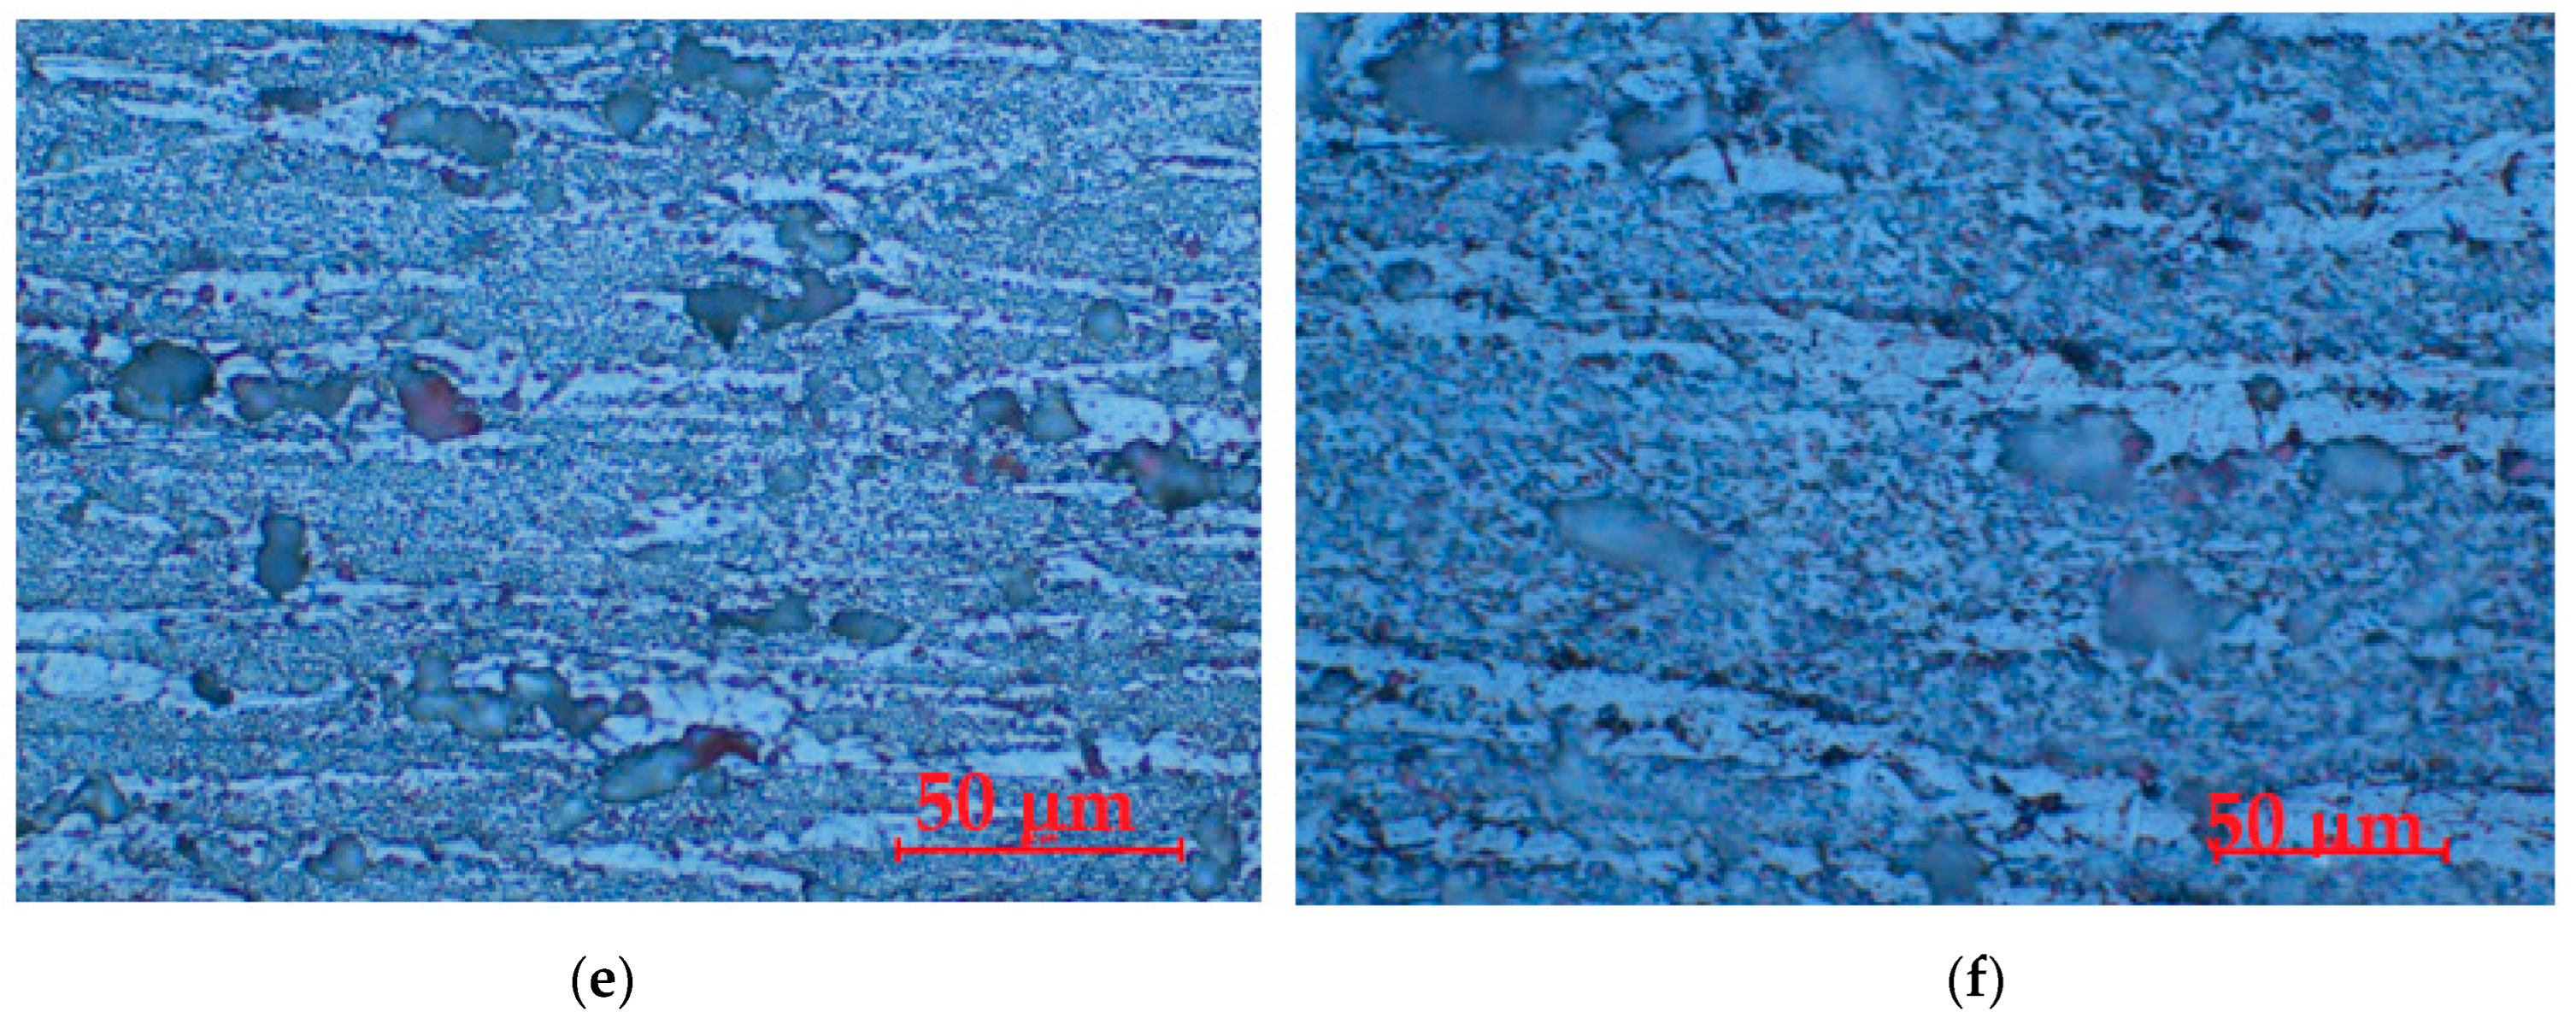
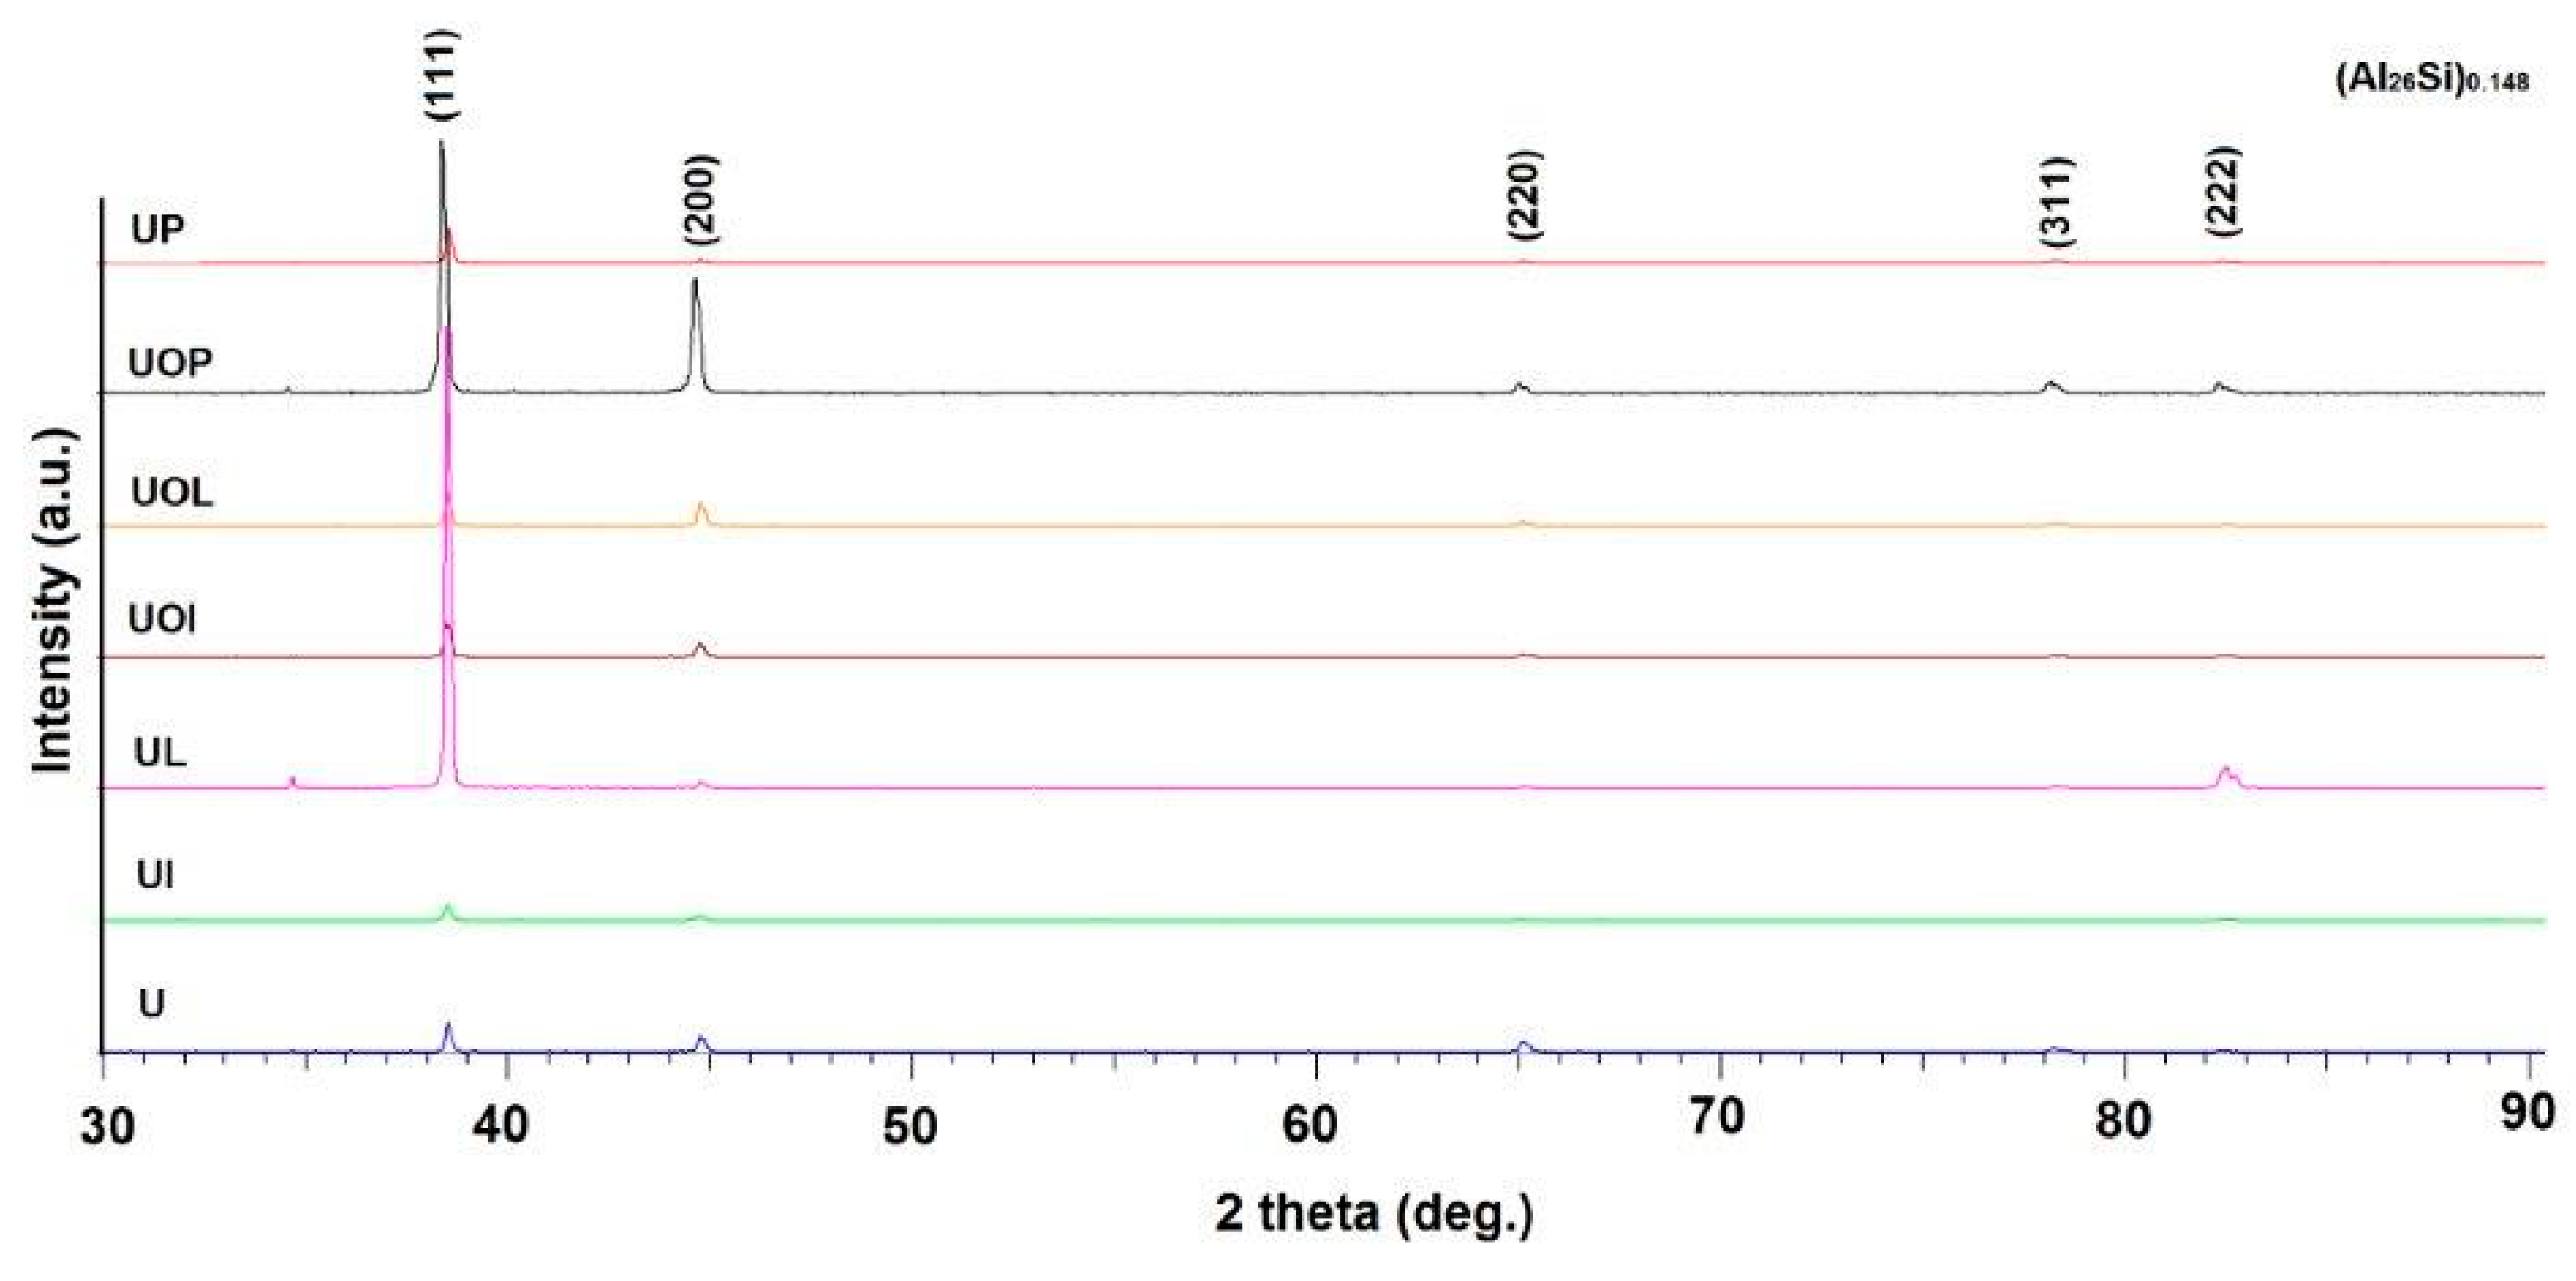
- The structure of the alloy in the T651 state is constituted by solid solution α in which fine compounds of Mg5Si6 dispersed in the matrix are evident. By applying heat aging treatments, the structural aspect does not change much, the amount of compounds increasing considerably.
- Applying heat aging treatments to aluminum alloy type 6082 products can lead to an increase in mechanical strength, yield strength, and a decrease in necking and resilience, as follows. When aging at 140 °C, the breaking strength can increase by 7–13% (differentiated according to the duration of holding at the temperature), the yield strength increases by 18–34%, the necking increases by 17–77% and the resilience decreases by about 18–36%; when applying an aging at 180 °C, the fracture resistance can increase by 18–94% (differentiated according to the duration of holding at the temperature), the yield strength increases by 39–186%, and the resilience decreases by about 4–43%.
- The dispersion mode of the experimental values compared to the averaging curves M(t) and v(t), as well as the evolutions of the two curves, show similar and distinct/specific elements of the behavior of the surface structure to the erosion created by the cyclic stresses of the microjets produced by vibratory cavitation. Basically, these diagrams show the effect of the volumetric heat treatment regime (temperature and holding time) on the mechanical response to cyclic fatigue stresses, through the structures and values of the mechanical properties obtained.
- The cavitation resistance of the structures resulting from artificial aging heat treatments, regardless of the parameters of the heat treatment regime, is superior to the structure of the control sample, cast (sample U) from 30% to more than 4 times according to the values of the Mmax and MDEma parameters and from 21% to more than 4 times according to the values of the parameters vs and MDERs.
- For all samples, regardless of whether it is blank or thermally treated, in the first 15 (30) min of vibratory cavitation, material losses are reduced due to compliance with the specific erosive mechanism, through which, in the attacked surface, more elasto-plastic deformations and networks are produced of cracks and the tips of roughnesses and abrasive dust are removed. Material ejections, with the creation of pittings, are significantly reduced in the mass values recorded by weighing.
- In all samples, starting from minute 30 (45) and until the end of the test, the losses are of close order, which is why the curve M(t) becomes linear, the differences between the experimental values of the speeds are small, and the curve v(t) decreases asymptotically towards the stabilization value vs.
- In all samples, the evolutions of the v(t) averaging curves have an asymptotic tendency towards stabilization at the maximum value (vs). Based on previous experiences, we believe that this mode of evolution is the effect of the mechanical properties, of the hardening over time, of the applied layer and of the reduction in the stress/impact force, as a result of the cushioning effect of the air penetrating into the formed caverns.
- The thermal treatment regime by artificial aging that gives the best resistance to vibrating cavitation erosion is the one with a temperature of 140 °C and a holding time of 24 h.
- The thermal treatment regime that led to the structure with the lowest resistance to cavitation is the one with a temperature of 180 °C and a holding time of 12 h.
- The differences between the experimental values and their dispersions in front of the averaging curves are expressions of the influence of the structure on the resistance to cavitation by the regime parameters of the heat treatment, by the microstructural changes, and by the values of the mechanical properties, a fact confirmed by the microscopic and photographic images from the significant times.
- The increase in resistance to cavitation, conferred by heat treatment regimes, justifies the possible use of aluminum alloy type 6082 in order to expand applications to parts that work in cavitation regimes, such as pump rotors and boat propellers.
Author Contributions
Funding
Institutional Review Board Statement
Informed Consent Statement
Data Availability Statement
Conflicts of Interest
References
- Bordeasu, D.; Prostean, O.; Hatiegan, C. Contributions to Modeling, Simulation and Controlling of a Pumping System Powered by aWind Energy Conversion System. Energies 2021, 14, 7696. [Google Scholar] [CrossRef]
- Istrate, I.; Sarcea, B.G.; Demian, A.M.; Buzatu, A.D.; Salcianu, L.; Bordeasu, I.; Micu, L.M.; Chera, C.; Florea, B.; Ghiban, B. Correlation between Mechanical Properties—Structural Characteristics and Cavitation Resistance of Cast Aluminum Alloy type 5083. Crystals 2022, 12, 1538. [Google Scholar] [CrossRef]
- Bordeasu, D. Study on the implementation of an alternative solution to the current irrigation system. Acta Tech. Napoc. Ser.-Appl. Math. Mech. Eng. 2022, 65, 593–602. [Google Scholar]
- Tian, N.; Wang, G.; Zhou, Y.; Liu, K.; Zhao, G.; Zuo, L. Study of the Portevin-Le Chatelier (PLC) Characteristics of a 5083 Aluminum Alloy Sheet in Two Heat Treatment States. States Mater. 2018, 11, 1533. [Google Scholar] [CrossRef] [PubMed]
- Anton, L.E.; Bordeasu, I.; Tabara, I. Considerations regarding the use of EPO 99 B resin in manufacturing AXIAL hydraulic machinery runners. Mat. Plast. 2008, 45, 190–192. [Google Scholar]
- Bordeasu, I. Monografia Laboratorului de Cercetare a Eroziunii Prin Cavitatie al Universitatii Politehnica Timisoara (1960–2020); Editura Politehnica Timisoara: Timișoara, Romania, 2020. (In Romanian) [Google Scholar]
- Bordeasu, I.; Popoviciu, M.O.; Mitelea, I.; Balasoiu, V.; Ghiban, B.; Tucu, D. Chemical and mechanical aspects of the cavitation phenomena. Rev. Chim. 2007, 58, 1300–1304. [Google Scholar]
- Man, H.C.; Kwok, C.T.; Yue, T.M. Cavitation erosion and corrosion behaviour of laser surface alloyed MMC of SiC and Si3N4 on Al alloy AA6061. Surf. Coat. Technol. 2000, 132, 11–20. [Google Scholar] [CrossRef]
- Bordeasu, I.; Popoviciu, M.O.; Micu, L.M.; Oanca, O.V.; Bordeasu, D.; Pugna, A.; Bordeasu, C. Laser beam treatment effect on AMPCO M4 bronze cavitation erosion resistance. IOP Conf. Ser. Mater. Sci. Eng. 2015, 85, 012005. [Google Scholar] [CrossRef]
- Garcia, R. Comprehensive Cavitation Damage Data for Water and Various Liquid Metals Including Correlation with Material and Fluid Properties; Technical Report No. 6; University of Michigan: Ann Arbor, MI, USA, 1966. [Google Scholar]
- Bordeasu, D.; Prostean, O.; Filip, I.; Dragan, F.; Vasar, C. Modelling, Simulation and Controlling of a Multi-Pump System with Water Storage Powered by a Fluctuating and Intermittent Power Source. Mathematics 2022, 10, 4019. [Google Scholar] [CrossRef]
- Frank, J.-P.; Jean-Louis, K.; Karimi, A.; Fruman, D.-H.; Fréchou, D.; Briançon-Marjollet, L.; Billard, J.-Y.; Belahadji, B.; Avellan, F.; Michel, J.M. Physical Mechanisms and Industrial Aspects; Presses Universitaires de Grenoble: Grenoble, France, 1995. [Google Scholar]
- Tomlinson, W.J.; Matthews, S.J. Cavitation erosion of aluminium alloys. J. Mater. Sci. 1994, 29, 1101–1108. [Google Scholar] [CrossRef]
- Varshney, D.; Kumar, K. Application and use of different aluminium alloys with respect to workability, strength and welding parameter optimization. Ain Shams Eng. J. 2021, 12, 1143–1152. [Google Scholar] [CrossRef]
- Cui, L.; Guo, M.; Peng, X.; Zhang, Y.; Zhang, J.; Zhuang, L. Influence of pre-deformation on the precipitation behaviors of Al-Mg-Si-Cu alloy for automotive application. Acta Metall. Sin. 2015, 51, 289–297. [Google Scholar]
- Hui, Z.; XianKun, J.; Song, L.; Fulin, I.; Dingfa, F. Microstructures and properties of Al–Mg–Si alloy overhead conductor by horizontal continuous casting and continuous extrusion forming process. Mater. Sci. Eng. A 2016, 649, 128–134. [Google Scholar]
- Pogatscher, S.; Antrekowitsch, H.; Werinos, M.; Gerstl, S.; Francis, M.F.; Curtin, W.A. Diffusion on demand to control precipitation aging: Application to Al-Mg-Si alloys. Phys. Rev. Lett. 2014, 112, 225701. [Google Scholar] [CrossRef] [PubMed]
- Kolobnev, N.I.; Khokhlatova, L.B.; Ryabov, D.K. Structure, properties and application of alloys of the Al-Mg-Si-(Cu) system. Met. Sci. Heat. Treat. 2012, 53, 440–444. [Google Scholar] [CrossRef]
- Xinkai, M.; Jinghui, L.; Fuguo, L.; Jiang, L.; Shan, L. Effect of grain boundary characteristic on intergranular corrosion and mechanical properties of severely sheared Al-Zn-Mg-Cu alloy. Mater. Sci. Eng. A 2018, 732, 53–62. [Google Scholar]
- Robinson, D.L.; Hunter, M.S. Interrelation of TEM microstructure, composition, tensile properties, and corrosion resistance of Al-Cu-Mg-Mn alloys. Metall. Trans. 1972, 3, 1147–1155. [Google Scholar] [CrossRef]
- Dif, R.; Bes, B.; Ehrstrom, J.C.; Sigli, C.; Warner, J.T.; Lassince, P. Understanding and modelling the mechanical and corrosion properties of 6056 for aerospace applications. Mater. Sci. Forum 2000, 1613, 331–337. [Google Scholar] [CrossRef]
- Fei, G.; Xiaoyan, L.; Mengjie, L.; Shunxing, L.; Xiliang, Z.; Haoxuan, C. Effects of aging treatment on the intergranular corrosion behavior of Al–Cu–Mg–Ag alloy. J. Alloys Compd. 2015, 639, 263–267. [Google Scholar]
- Ying, D.; Zhimin, Y.; Kai, Z.; Jiaqi, D.; Jian, H.; Zhenbo, H. Effects of Sc and Zr microalloying additions and aging time at 120 °C on the corrosion behavior of an Al–Zn–Mg alloy. Corros. Sci. 2012, 65, 288–298. [Google Scholar]
- Svenningsen, G.; Larsen, M.H.; Nordlien, J.H.; Nisanciogle, G. Effect of high temperature heat treatment on intergranular corrosion of AlMgSi(Cu) model alloy. Corros. Sci. 2006, 48, 258–272. [Google Scholar] [CrossRef]
- Svenningsen, G.; Larsen, M.H.; Walmsley, J.C.; Nordlien, J.H. Effect of artificial aging on intergranular corrosion of extruded AlMgSi alloy with small Cu content. Corros. Sci. 2006, 48, 1528–1543. [Google Scholar] [CrossRef]
- Xigang, F.; Damin, J.; Li, Z.; Tao, W.; Shiyu, R. Influence of microstructure on the crack propagation and corrosion resistance of Al–Zn–Mg–Cu alloy 7150. Mater. Charact. 2007, 58, 24–28. [Google Scholar]
- Shi, A.; Shaw, B.A.; Sikora, E. The role of grain boundary regions in the localized corrosion of a copper-free 6111-like aluminum alloy. Corrosion 2005, 6196, 534–547. [Google Scholar] [CrossRef]
- Zeng, F.L.; Wei, Z.L.; Li, J.F.; Li, C.X.; Tan, X.; Zhang, Z. Corrosion mechanism associated with Mg2Si and Si particles in Al-Mg-Si alloys. Trans. Nonferrous Met. Soc. 2011, 21, 2559–2567. [Google Scholar] [CrossRef]
- Larsen, M.H.; Walmsley, J.C.; Lunder, O.; Mathiesen, R.H.; Nisancioglu, K. Intergranular corrosion of copper-containing AA6xxx AlMgSi aluminum alloys. J. Electrochem. Soc. 2008, 155, C550–C556. [Google Scholar] [CrossRef]
- Liang, W.J.; Rometsch, P.; Cao, L.F.; Birbilis, N. General aspects related to the corrosion of 6xxx series aluminium alloys: Exploring the influence of Mg/Si ratio and Cu. Corros. Sci. 2013, 76, 119–128. [Google Scholar] [CrossRef]
- Zhang, L.; He, H.; Li, S.; Wu, X.; Li, L. Dynamic compression behavior of 6005 aluminum alloy aged at elevated temperatures. Vacuum 2018, 155, 604–611. [Google Scholar] [CrossRef]
- Yu, W.; He, H.; Zhang, W.; Li, L.; Sun, C. Modulation of the natural aging effect on subsequent artificial aging in Al-Mg-Si aluminum alloys with alloying content ∼1 wt% through temperature tuning. J. Alloys Compd. 2020, 814, 152277. [Google Scholar] [CrossRef]
- Moradi, M.; Shirazi, B.G.; Sadeghi, A.; Seidi, S. Electroless plating of Sn/Cu/Zn triple layer on AA6082 aluminum alloy. Int. J. Lightweight Mater. Manuf. 2022, 5, 1–10. [Google Scholar] [CrossRef]
- Michailidou, E.; Visser, P.; Mol, J.M.C.; Kosari, A.; Terryn, H. The effect of pH on the corrosion protection of aluminum alloys in lithium-carbonate-containing NaCl solutions. Corros. Sci. 2023, 210 Pt 2, 110851. [Google Scholar] [CrossRef]
- Zaid, B.; Saidi, D.; Benzaid, A.; Hadji, S. Effects of pH and chloride concentration on pitting corrosion of AA6061 aluminum alloy. Corros. Sci. 2008, 50, 1841–1847. [Google Scholar] [CrossRef]
- Chen, M.; Deng, Y.; Tang, J.; Fan, S.; Zhang, X. A study of the crystallographic pitting behavior of Al-0.54Mg-0.66Si aluminum alloy in acidic chloride solutions. Mater. Charact. 2019, 148, 259–265. [Google Scholar] [CrossRef]
- ASTM, Standard G32; Standard Method of Vibratory Cavitation Erosion Test. ASTM: West Conshohocken, PE, USA, 2016.
- Bordeasu, I.; Popoviciu, M.O.; Patrascoiu, C.; Bălăsoiu, V. An Analytical Model for the Cavitation Erosion Characteristic Curves. Sci. Bul. Politeh. Univ. Timis. Trans. Mech. 2004, 49, 253–258. [Google Scholar]
- Oanca, O. Tehnici de Optimizare a Rezistenţei la Eroziunea Prin Cavitaţie a Unor Aliaje CuAlNiFeMn Destinate Execuţiei Elicelor Navale; Teza de Doctorat: Timișoara, Romania, 2014. (In Romanian) [Google Scholar]
- ASTM, STP 408; Garcia, R.; Hammitt, F.G.; Nystrom, R.E. Correlation of Cavitation Damage with Other Material and Fluid Properties, Erosion by Cavitation or Impingement. ASTM: Atlantic City, NJ, USA, 1960.


| Alloy | Chemical Composition, %wt. | ||||||||
|---|---|---|---|---|---|---|---|---|---|
| Si | Fe | Cu | Mn | Mg | Cr | Zn | Ti | Al | |
| Experimental | 1.25 | 0.31 | 0.09 | 0.62 | 0.86 | 0.17 | 0.088 | - | rest |
| EN AW-AlSi1MgMn | 0.7–1.3 | Max. 0.5 | Max. 0.1 | 0.40–1.0 | 0.6–1.2 | Max. 0.25 | Max. 0.2 | Max. 0.1 | rest |
| Sample | State | Mechanical Characteristics | |||
|---|---|---|---|---|---|
| Fracture Strength, MPa | Yield Strength, MPa | Necking, % | Resilience, KCV, KJ | ||
| U- | control-T651 | 210 | 116 | 11.6 | 25.0 |
| UOP | T651 + 140 °C/1 h | 225 | 137 | 20.5 | 34.7 |
| UOL | T651 + 140 °C/12 h | 236 | 141 | 18.5 | 30.7 |
| UOI | T651 + 140 °C/24 h | 236 | 155 | 13.6 | 29.7 |
| UP | T651 + 180 °C/1 h | 250 | 162 | 20.0 | 24.0 |
| UL | T651 + 180 °C/12 h | 329 | 182 | 16.0 | 16.3 |
| UI | T651 + 180 °C/24 h | 407 | 332 | 12.0 | 14.2 |
| Sample | State | Diameters of Surfaces Subject to Cavitational Erosion | Maximum Penetration Depth of Cavitational Erosion | |||||
|---|---|---|---|---|---|---|---|---|
| Outer Diameter | Intermediate Diameter | Inner Diameter | Stereo Measured | Optically Measured | ||||
| μm | μm | % | μm | % | μm | μm | ||
| U | T651 | 14,359 | 12,213 | 85 | 10,593 | 74 | 490.87 | 490 |
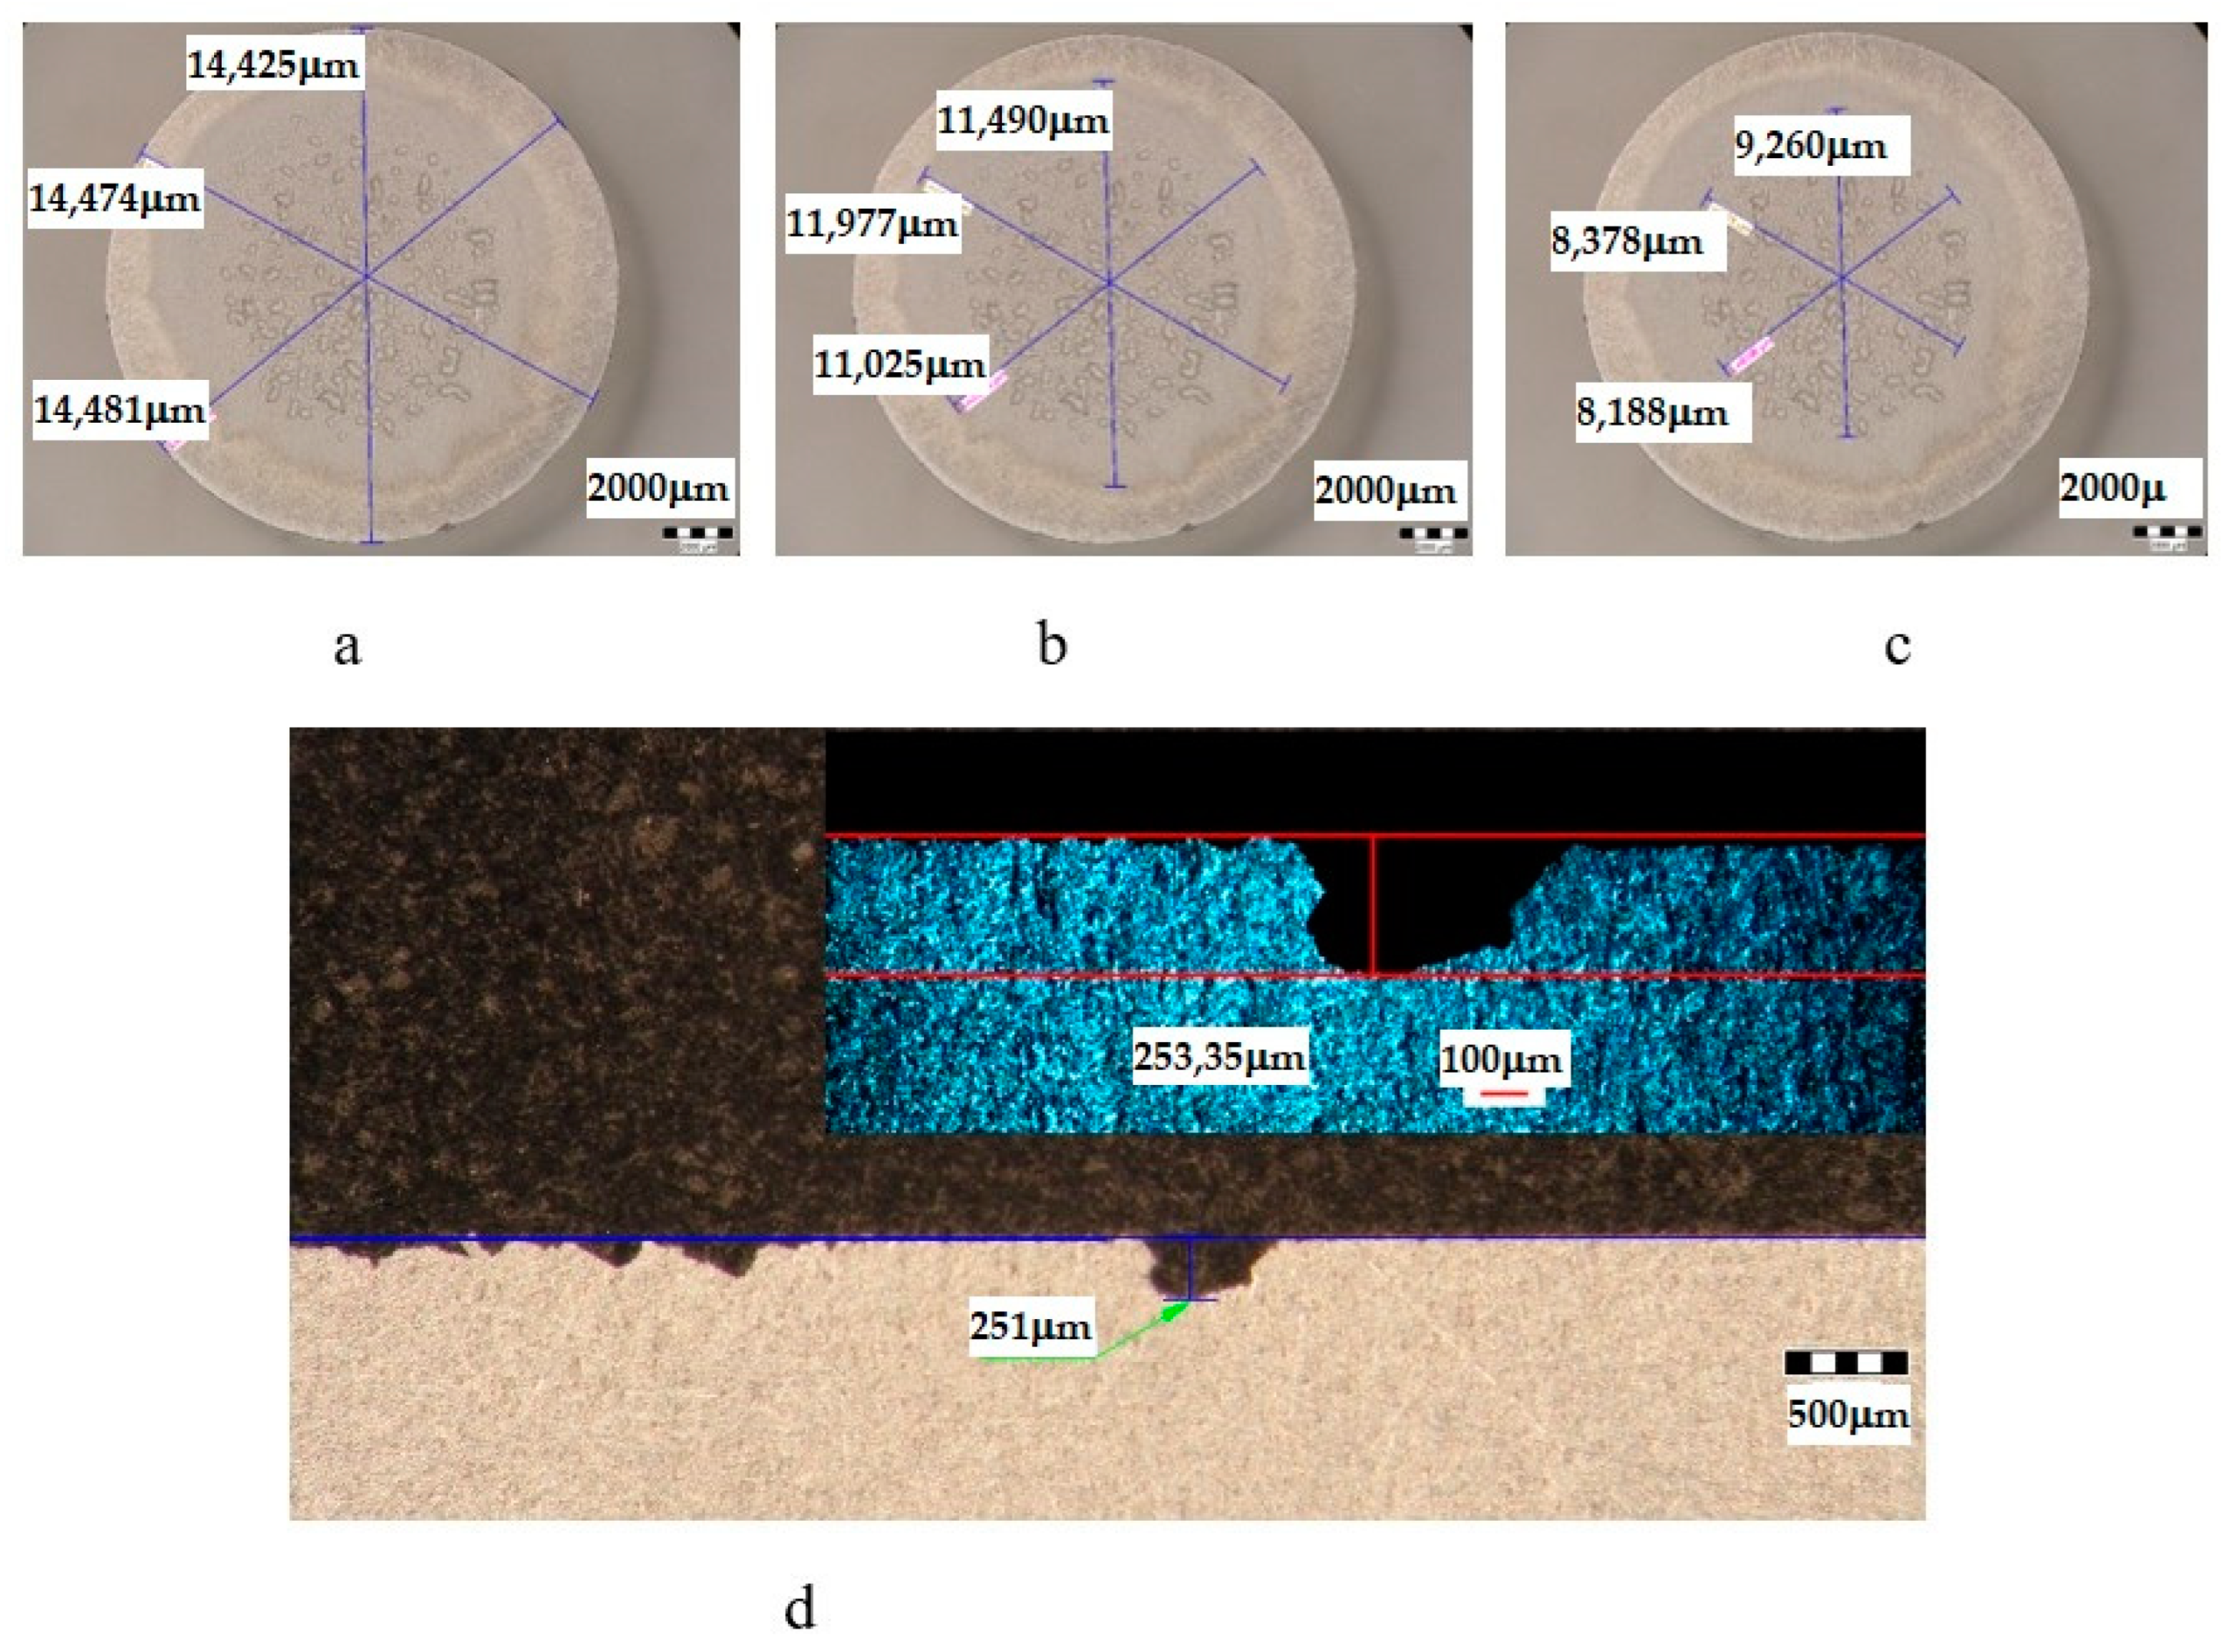
| UOP | T651 + 140 °C/1 h | 14,439 | 11,496 | 80 | 8609 | 60 | 251 | 253.35 |
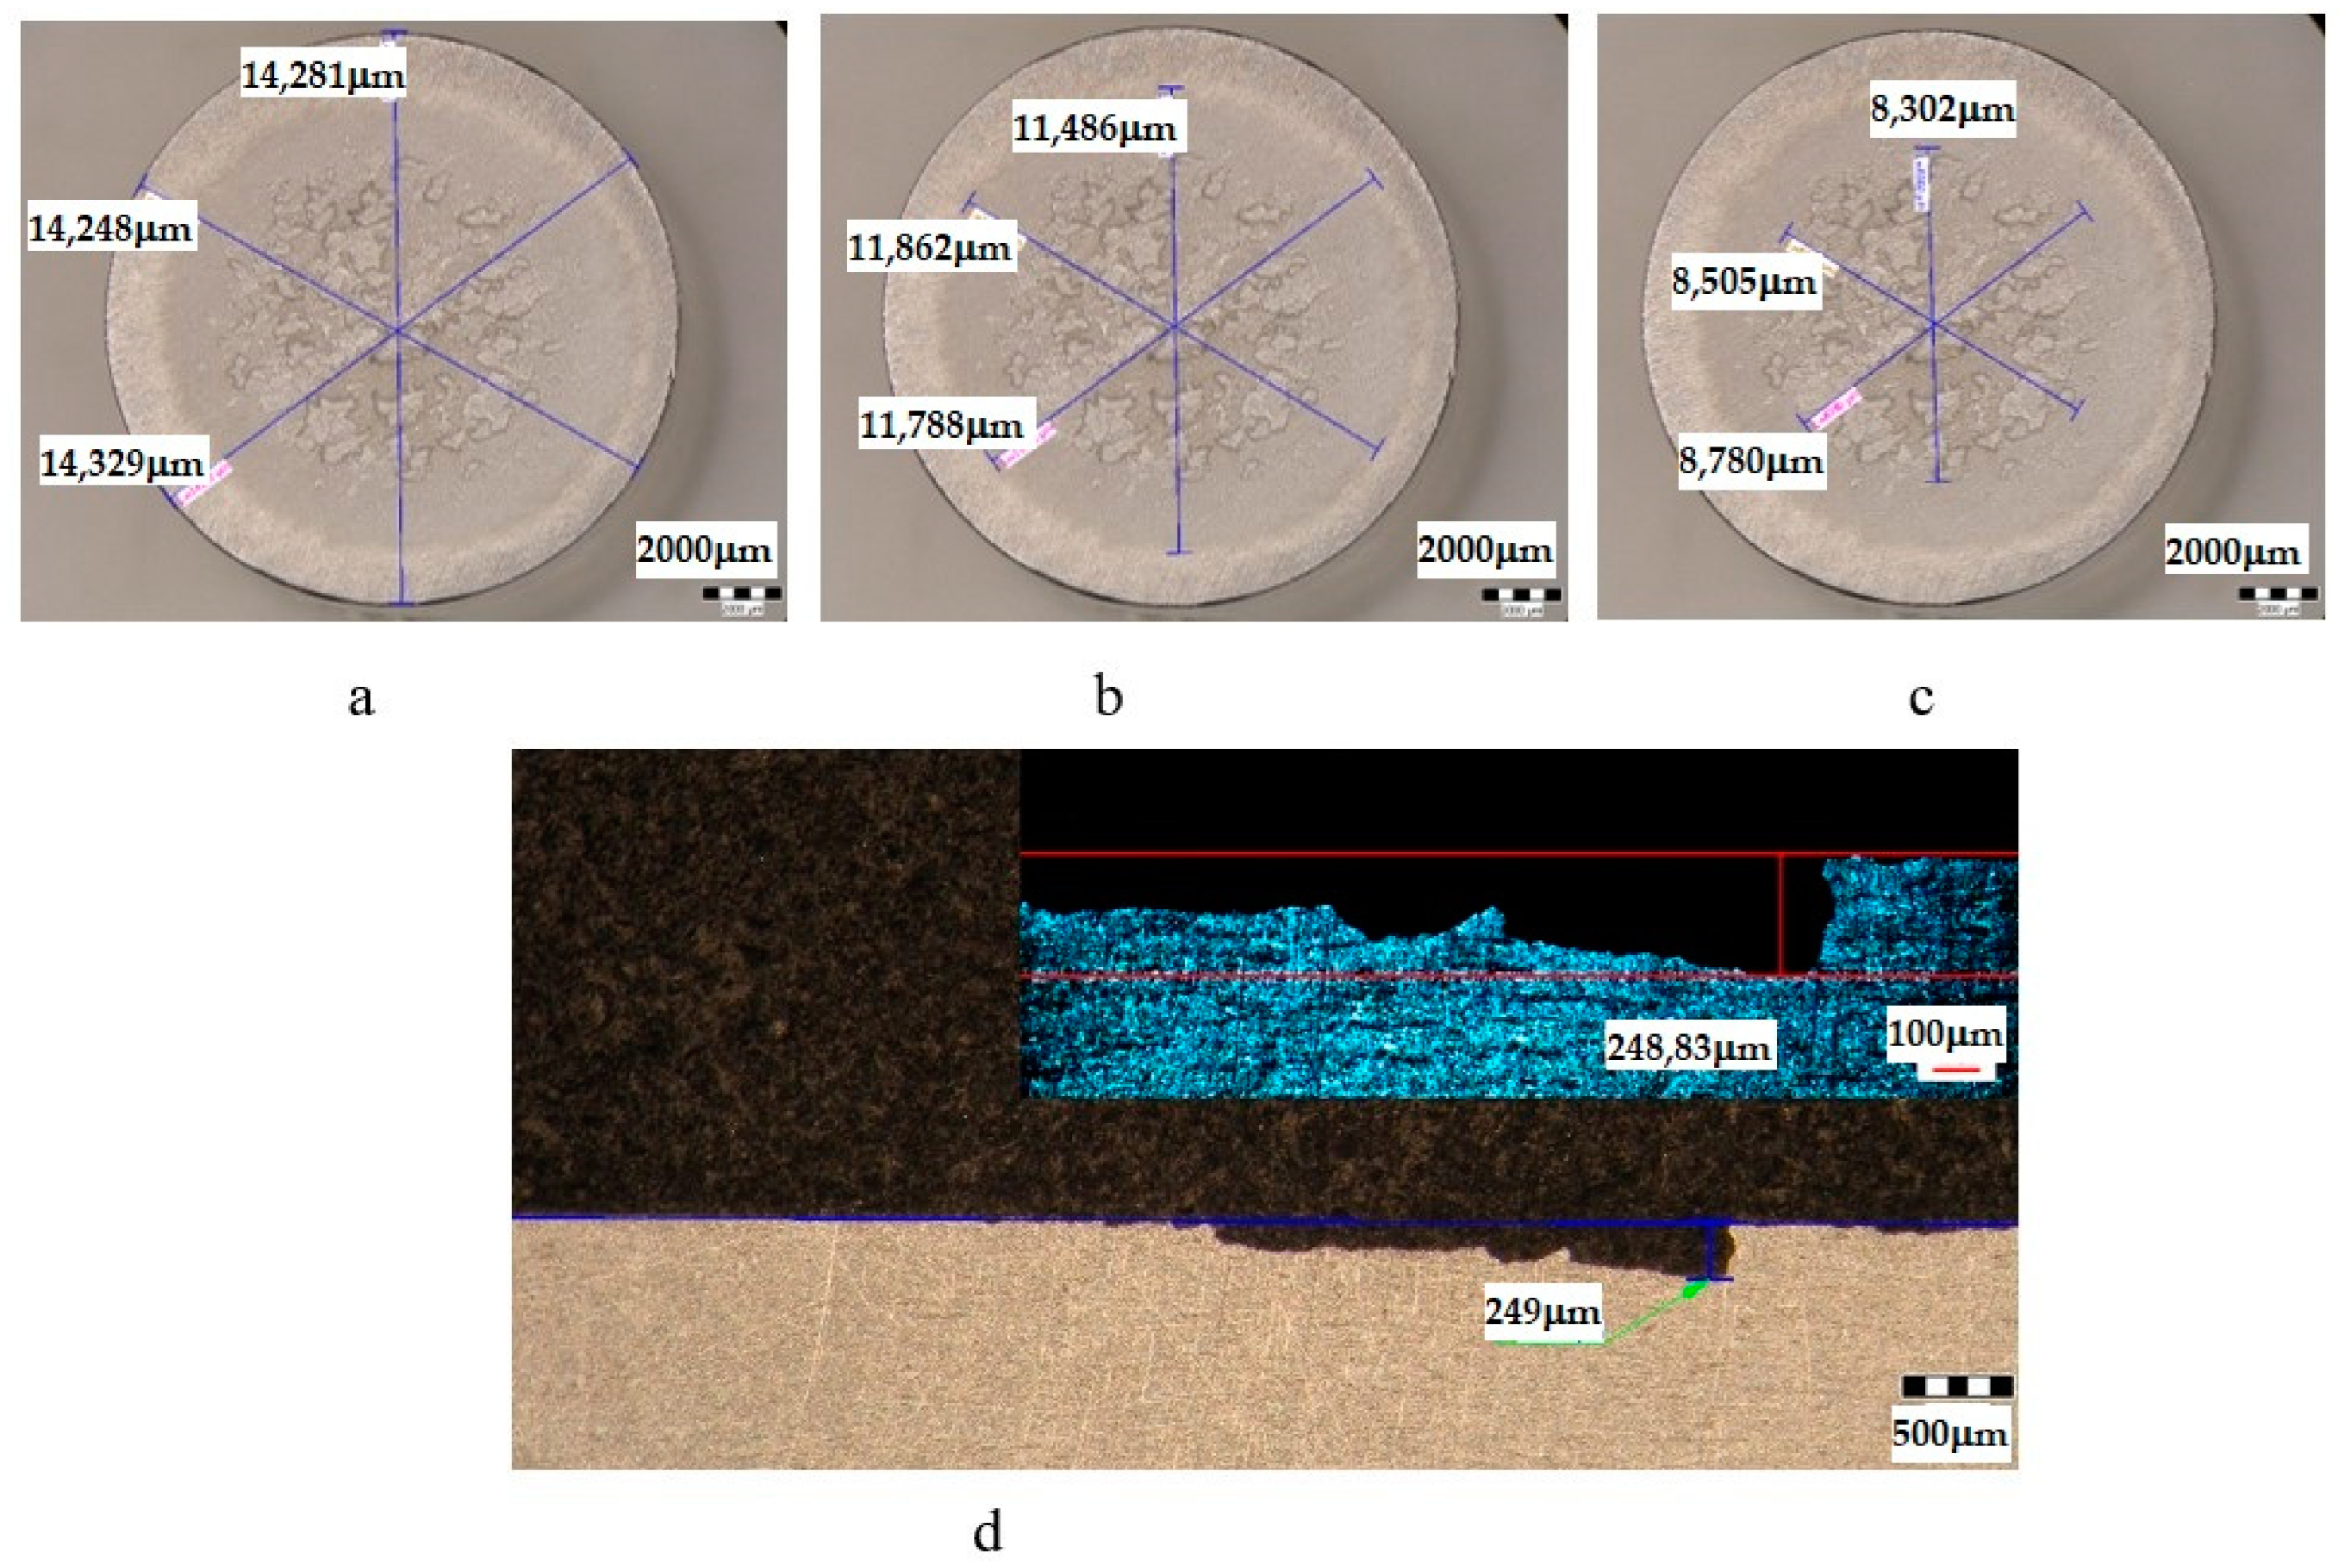
| UOL | T651 + 140 °C/12 h | 14,286 | 11,712 | 82 | 8529 | 60 | 249 | 248.83 |
| UOI | T651 + 140 °C/24 h | 14,433 | 12,022 | 83 | 7765 | 54 | 215 | 212.63 |
| UP | T651 + 180 °C/1 h | 15,661 | 12,847 | 82 | 11,161 | 71 | 341 | 337.25 |
| UL | T651 + 180 °C/12 h | 14,373 | 11,672 | 81 | 9988 | 69 | 335 | 314.63 |
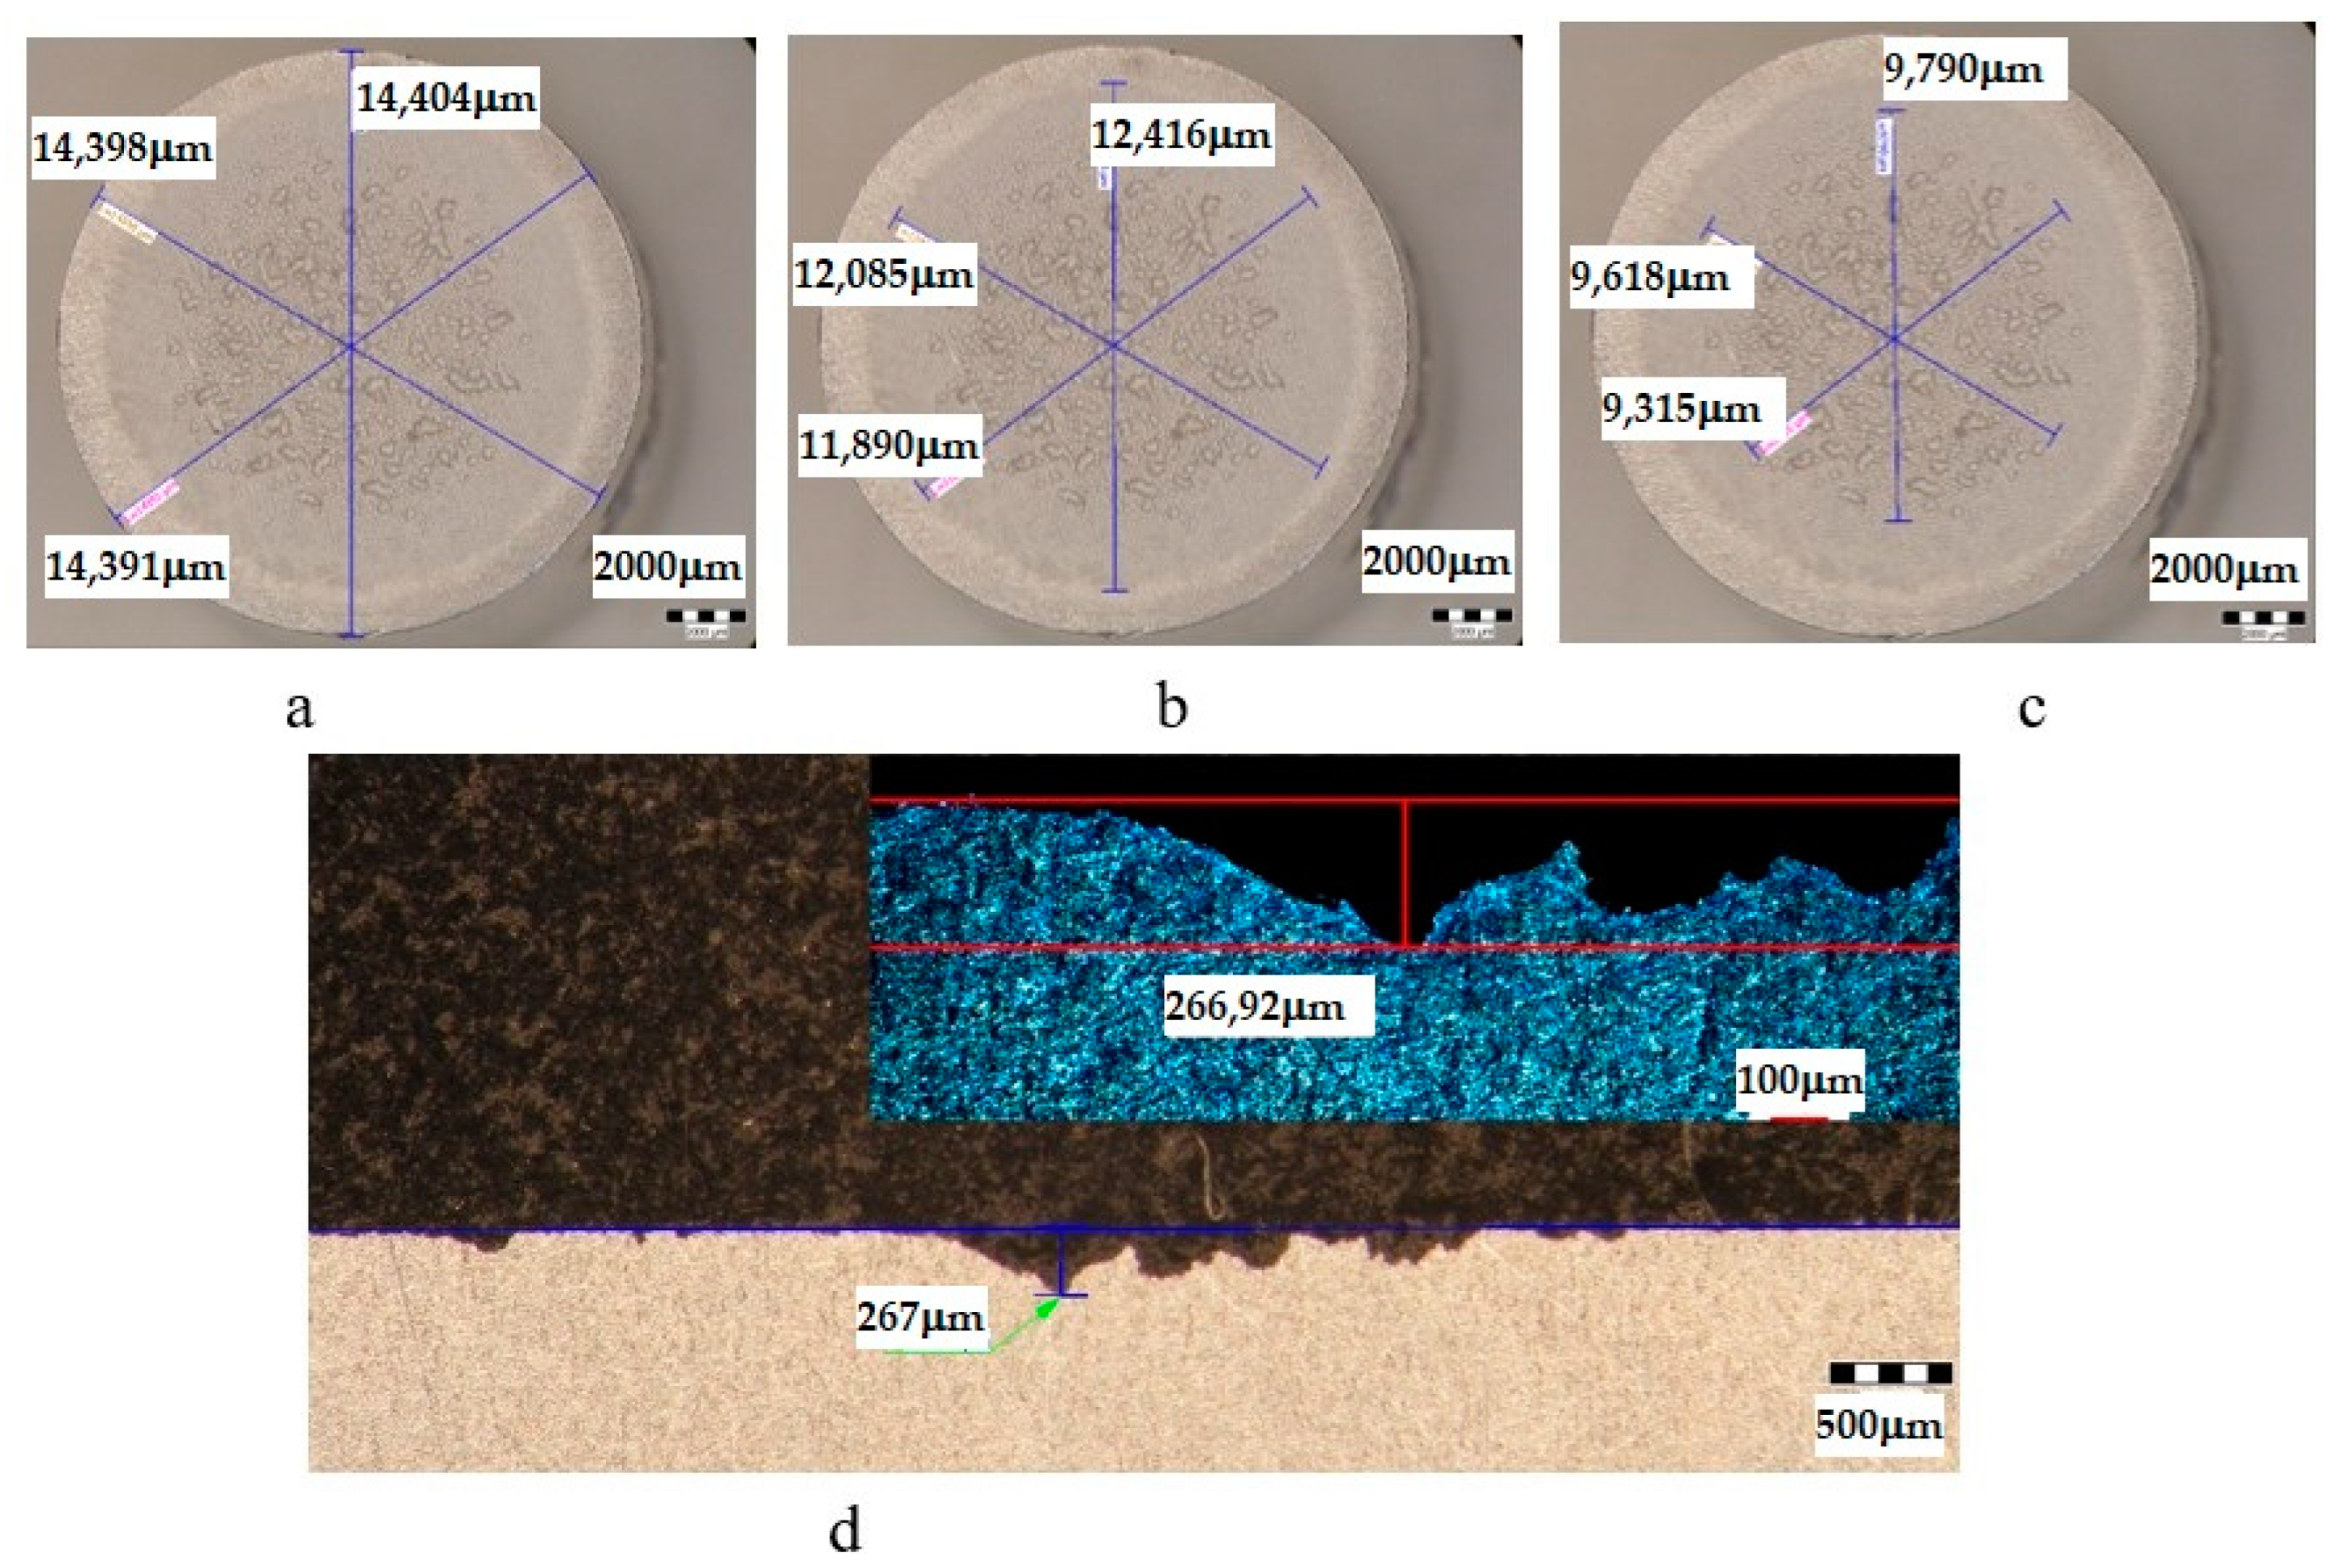
| UI | T651 + 190 °C/24 h | 14,398 | 12,130 | 84 | 9574 | 66 | 267 | 266.92 |
Disclaimer/Publisher’s Note: The statements, opinions and data contained in all publications are solely those of the individual author(s) and contributor(s) and not of MDPI and/or the editor(s). MDPI and/or the editor(s) disclaim responsibility for any injury to people or property resulting from any ideas, methods, instructions or products referred to in the content. |
© 2023 by the authors. Licensee MDPI, Basel, Switzerland. This article is an open access article distributed under the terms and conditions of the Creative Commons Attribution (CC BY) license (https://creativecommons.org/licenses/by/4.0/).
Share and Cite
Bordeasu, I.; Ghiban, B.; Micu, L.M.; Luca, A.N.; Demian, A.M.; Istrate, D. The Influence of Heat Aging Treatments on the Cavitation Erosion Behavior of a Type 6082 Aluminum Alloy. Materials 2023, 16, 5875. https://doi.org/10.3390/ma16175875
Bordeasu I, Ghiban B, Micu LM, Luca AN, Demian AM, Istrate D. The Influence of Heat Aging Treatments on the Cavitation Erosion Behavior of a Type 6082 Aluminum Alloy. Materials. 2023; 16(17):5875. https://doi.org/10.3390/ma16175875
Chicago/Turabian StyleBordeasu, Ilare, Brândușa Ghiban, Lavinia Madalina Micu, Alexandru Nicolae Luca, Alin Mihai Demian, and Dionisie Istrate. 2023. "The Influence of Heat Aging Treatments on the Cavitation Erosion Behavior of a Type 6082 Aluminum Alloy" Materials 16, no. 17: 5875. https://doi.org/10.3390/ma16175875
APA StyleBordeasu, I., Ghiban, B., Micu, L. M., Luca, A. N., Demian, A. M., & Istrate, D. (2023). The Influence of Heat Aging Treatments on the Cavitation Erosion Behavior of a Type 6082 Aluminum Alloy. Materials, 16(17), 5875. https://doi.org/10.3390/ma16175875